Container Ship Rou nd Trip Performance Analysis - A Case ...
15
See discussions, stats, and author profiles for this publication at: https://www.researchgate.net/publication/345385816 Container Ship Round Trip Performance Analysis - A Case of Study Between East South America and Europe Conference Paper · November 2020 DOI: 10.17648/sobena-2020-122860 CITATIONS 0 READS 21 5 authors, including: Some of the authors of this publication are also working on these related projects: Inventory of shipping emissions and emissions abatement technologies in view of IMO 2050 targets View project Simulation and optimisation on marine electric propulsion systems View project Joao Henrique Vieira Federal University of Rio de Janeiro 1 PUBLICATION 0 CITATIONS SEE PROFILE Fabio Macedo Rossi Federal University of Rio de Janeiro 2 PUBLICATIONS 0 CITATIONS SEE PROFILE Ramiro Fernandes Ramos Federal University of Rio de Janeiro 6 PUBLICATIONS 0 CITATIONS SEE PROFILE Sarah Menezes Alves Federal University of Rio de Janeiro 5 PUBLICATIONS 0 CITATIONS SEE PROFILE All content following this page was uploaded by Jean David Caprace on 06 November 2020. The user has requested enhancement of the downloaded file.
Transcript of Container Ship Rou nd Trip Performance Analysis - A Case ...
See discussions, stats, and author profiles for this publication at: https://www.researchgate.net/publication/345385816
Container Ship Round Trip Performance Analysis - A Case of Study Between
East South America and Europe
Conference Paper · November 2020
DOI: 10.17648/sobena-2020-122860
CITATIONS
0READS
21
5 authors, including:
Some of the authors of this publication are also working on these related projects:
Inventory of shipping emissions and emissions abatement technologies in view of IMO 2050 targets View project
Simulation and optimisation on marine electric propulsion systems View project
Joao Henrique Vieira
Federal University of Rio de Janeiro
1 PUBLICATION 0 CITATIONS
SEE PROFILE
Fabio Macedo Rossi
Federal University of Rio de Janeiro
2 PUBLICATIONS 0 CITATIONS
SEE PROFILE
Ramiro Fernandes Ramos
Federal University of Rio de Janeiro
6 PUBLICATIONS 0 CITATIONS
SEE PROFILE
Sarah Menezes Alves
Federal University of Rio de Janeiro
5 PUBLICATIONS 0 CITATIONS
SEE PROFILE
All content following this page was uploaded by Jean David Caprace on 06 November 2020.
The user has requested enhancement of the downloaded file.
1
28th International Congress on Waterborne Transportation,
Shipbuilding and Offshore Constructions
October 26th -29th 2020, Rio de Janeiro – Brazil
Container Ship Round Trip Performance Analysis - A Case of Study Between East South America and Europe
João H. Vieira, UFRJ/COPPE, Rio de Janeiro/Brasil, [email protected]
Fábio M. Rossi, UFRJ/POLI, Rio de Janeiro/Brasil, [email protected]
Ramiro F. Ramos, UFRJ/COPPE, Rio de Janeiro/Brasil, [email protected]
Sarah M. Alves, UFRJ/COPPE, Rio de Janeiro/Brasil, [email protected]
Jean-David Caprace, UFRJ/COPPE, Rio de Janeiro/Brasil, [email protected]
Abstract
In recent years, the shipping of containers has grown worldwide, as well as the size container vessels,
following the globalization process. According to UNCTAD Statistics (2019), the global container
shipping throughput increased from 45 Million TEUs handled in 1996 to 150 Million TEUs handled in
2018. Although, the seaport operational performance measurement is still restrictive to data
providers and conservative on refining KPIs from different operational perspectives. The purpose of
this article is to develop an analytical process approach of operational indicators of container
throughputs and handling performance, deployed by a shipping line service at an Eastern South
America and European round trip voyage. The math model applied in this paper pursues key features
and metrics that influence the container liner services scheduling. Accordingly, the methodology
framework was designed to explore critical berth productivity factors and to correlate capacity
efficiency variables. Furthermore, this research explored process benchmarking analysis on berth
productivity from terminals and vessel operators' perspectives. It was clarified by KPIs analog to the
line service attendance, such as the aggregated quay cranes handling a throughput of 600,722 TEUs
in 2018 in contrast to vessel shipping throughput of 525,840 TEUs for the same period. Also, this
research played attention to the optimization of port calls and data standardization.
1. Introduction The Maritime Transportation is an important
gateway for the global container trading of goods,
among overseas countries and continents. At the
end-to-end logistics journey, large-scale
transportation is important to minimize the unit
freight cost for costumers. Also, the efficiency of the
container transshipment is essential to keep up the
economic benefits of multimodality at logistics
nodes, such as in port terminals and inland
terminals. Understanding the global container fleet
organization, the container vessel operation is
known as the Liner Shipping Service. According to
the United Nations Conference on Trade and
Development (UNCTAD), the connectivity of a port
in the global container shipping network is an
important competitive factor for terminals, as the
Liner Shipping Connectivity Index is a proxy for
accessibility to the Maritime Freight Transport
Systems. To clarify the understanding of the nature
and scale of shipping and port industry metric
concerns, key analytical tools are characterized on
Performance Indicators (KPIs), that guide decision
making on impacts assessment, on best choice
target KPIs comparison, and drives sustainable
development goals. (UNCTAD, 2019).
2
Concerning the Maritime Transport Performance
Measurement, the bottom-up selection approach
and aggregation of KPIs are highly engaged in data
providers and linked to policymakers, authorities,
and business agreements. According to the UNCTAD
(2018; 2019) Statistics publication until June 2018,
around 62.1 % of the world deep-sea container fleet
market share on deployed capacity was operated by
seven larger maritime shipping companies and has
increased to 82,3% until February 2019. Those cited
liner companies are respectively, MAERSK,
Mediterranean Shipping Company (MSC), CMA-
CMG, COSCO Shipping, Happag-Lloyd, Ocean
Network Express, and Evergreen.
In contrast to the high competitiveness of the liner
services business environment, over 2018 and 2019
considerable ongoing vertical integration at
container shipping and port operational
performance reinforced alliances and joint ventures
between terminal operators and liner companies,
urging dedicated berths to liner services operations,
(UNCTAD 2018 & 2019). Besides that, the maritime
sector is highly based on economic indicators and
statistical analysis, such as independent maritime
researches and consulting that records global
logistic industry data, providing information reports
and advisory guidelines. According to Drewry
Statistics (2017), the average container handling
throughput per quay crane (TEUs/QC) and the
average container handling throughput per meter
of quay (TEUs/m) recorded in 2016 was
respectively: 127,167 TEUs/QC and 1,154 TEUs/m of
around the world; 110,307 TEUS /QC and 849 TEUs
/m in Latin America; and Asia recorded the best
metrics performance of 162,000 TEUs/QC and 1,627
TEUS/m.
The improvement of container ports and terminals'
productivity is a systematic challenge of port
management. To enhance port competitiveness,
technological improvements in operation efficiency
had been designed to attend Shipping Line Services
requirements (Rodrigue and Notteboom, 2010).
Based on an existing example of liner services
operation, to perform a factual case of study in this
paper, it was selected a robust Shipping Line that
attends East South America linking to Europe,
abbreviated as ESAm - EU Line Service; as shown by
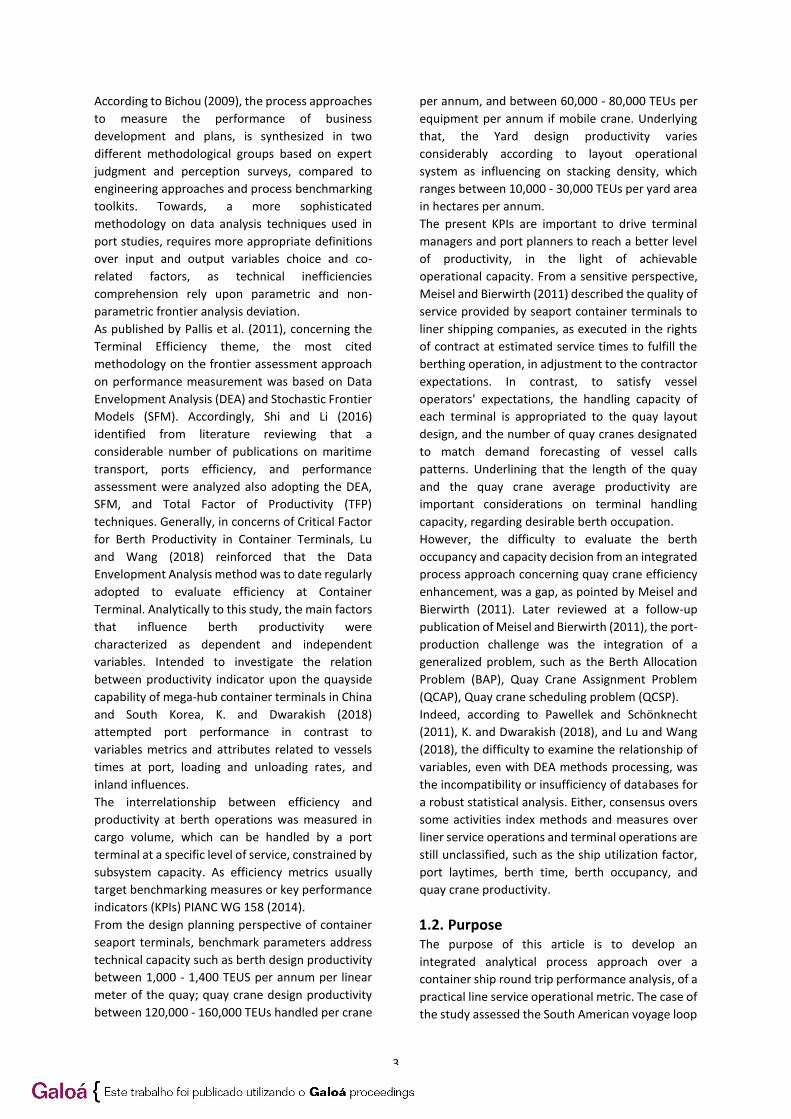
Figure 1; SAEC1 – Aliança Line Service Route.
According to the Brazilian National Agency of
Waterway Transportation (ANTAQ, 2020) on the
annual 2018 statistics of port terminals
throughputs, the referred line service registered a
total of 228 calls at Brazilian Ports. Meanwhile, the
ESAm-EU voyage round trip was scheduled to call
twice in some ports; one call at Southbound and
another in Northbound directions, as following: 2
calls at Port of Santos - Santos Brazil S/A Terminal; 2
calls at Port of Paranaguá - TCP. But only one call per
round trip at Port of Itapoá TECON; one call at Port
of Buenos Aires - Rio de La Plata Terminal (TRP); and
one call at Port of Montevideo - Katoen Natie TCP.
Figure 1: Aliança Line Service Route (SAEC1)
operated by eight same class Post-Panamax vessels
within up to 9814 TEUs of Nominal Capacity, calling
weekly at 14 ports in 56 days round trip on
average, on Northbound and Southbound
directions.
According to IAPH (ITPCO, 2019), as a port is a
crucial node in the supply chain, it should connect
and deliver clear visibility of cargo and vessel data
to stakeholders. Beyond the efforts on Sustainable
Port Programs, the Port Call Optimization is an
emerging trend on safe operational management,
improving data sharing quality, nautical
communication, and terminal efficiency. Moreover,
such as developing the “Just in Time Arrival” (JIT) of
ships, with more accurate steaming, hinterland
connectivity, and facilitate emission reduction (GIA,
2020).
1.1. Literature review To find out critical factors and research trends on
port economics and maritime logistics studies,
focusing on Container Terminal (CT) berth
productivity concerning liner shipping schedule, it
was accomplished by different process approaches,
assessing business and operational planning
research methods and metrics.
3
According to Bichou (2009), the process approaches
to measure the performance of business
development and plans, is synthesized in two
different methodological groups based on expert
judgment and perception surveys, compared to
engineering approaches and process benchmarking
toolkits. Towards, a more sophisticated
methodology on data analysis techniques used in
port studies, requires more appropriate definitions
over input and output variables choice and co-
related factors, as technical inefficiencies
comprehension rely upon parametric and non-
parametric frontier analysis deviation.
As published by Pallis et al. (2011), concerning the
Terminal Efficiency theme, the most cited
methodology on the frontier assessment approach
on performance measurement was based on Data
Envelopment Analysis (DEA) and Stochastic Frontier
Models (SFM). Accordingly, Shi and Li (2016)
identified from literature reviewing that a
considerable number of publications on maritime
transport, ports efficiency, and performance
assessment were analyzed also adopting the DEA,
SFM, and Total Factor of Productivity (TFP)
techniques. Generally, in concerns of Critical Factor
for Berth Productivity in Container Terminals, Lu
and Wang (2018) reinforced that the Data
Envelopment Analysis method was to date regularly
adopted to evaluate efficiency at Container
Terminal. Analytically to this study, the main factors
that influence berth productivity were
characterized as dependent and independent
variables. Intended to investigate the relation
between productivity indicator upon the quayside
capability of mega-hub container terminals in China
and South Korea, K. and Dwarakish (2018)
attempted port performance in contrast to
variables metrics and attributes related to vessels
times at port, loading and unloading rates, and
inland influences.
The interrelationship between efficiency and
productivity at berth operations was measured in
cargo volume, which can be handled by a port
terminal at a specific level of service, constrained by
subsystem capacity. As efficiency metrics usually
target benchmarking measures or key performance
indicators (KPIs) PIANC WG 158 (2014).
From the design planning perspective of container
seaport terminals, benchmark parameters address
technical capacity such as berth design productivity
between 1,000 - 1,400 TEUS per annum per linear
meter of the quay; quay crane design productivity
between 120,000 - 160,000 TEUs handled per crane
per annum, and between 60,000 - 80,000 TEUs per
equipment per annum if mobile crane. Underlying
that, the Yard design productivity varies
considerably according to layout operational
system as influencing on stacking density, which
ranges between 10,000 - 30,000 TEUs per yard area
in hectares per annum.
The present KPIs are important to drive terminal
managers and port planners to reach a better level
of productivity, in the light of achievable
operational capacity. From a sensitive perspective,
Meisel and Bierwirth (2011) described the quality of
service provided by seaport container terminals to
liner shipping companies, as executed in the rights
of contract at estimated service times to fulfill the
berthing operation, in adjustment to the contractor
expectations. In contrast, to satisfy vessel
operators' expectations, the handling capacity of
each terminal is appropriated to the quay layout
design, and the number of quay cranes designated
to match demand forecasting of vessel calls
patterns. Underlining that the length of the quay
and the quay crane average productivity are
important considerations on terminal handling
capacity, regarding desirable berth occupation.
However, the difficulty to evaluate the berth
occupancy and capacity decision from an integrated
process approach concerning quay crane efficiency
enhancement, was a gap, as pointed by Meisel and
Bierwirth (2011). Later reviewed at a follow-up
publication of Meisel and Bierwirth (2011), the port-
production challenge was the integration of a
generalized problem, such as the Berth Allocation
Problem (BAP), Quay Crane Assignment Problem
(QCAP), Quay crane scheduling problem (QCSP).
Indeed, according to Pawellek and Schönknecht
(2011), K. and Dwarakish (2018), and Lu and Wang
(2018), the difficulty to examine the relationship of
variables, even with DEA methods processing, was
the incompatibility or insufficiency of databases for
a robust statistical analysis. Either, consensus overs
some activities index methods and measures over
liner service operations and terminal operations are
still unclassified, such as the ship utilization factor,
port laytimes, berth time, berth occupancy, and
quay crane productivity.
1.2. Purpose The purpose of this article is to develop an
integrated analytical process approach over a
container ship round trip performance analysis, of a
practical line service operational metric. The case of
the study assessed the South American voyage loop

4
of interest, among East South America and Europe
(ESAm-EU) round trip voyage. The performance
method reviewed was adapted from the Round-Trip
transport Modelling Capacity, undertaking the Liner
vessel operation from the shipping company
operator and terminal operator perspectives.
Moreover, performance indexes were addressed
concerning with benchmarking process approach.
Accordingly, it was reviewed the berth productivity
attending the Liners full-container vessels,
comparing to the optimal berth capacities, quay
crane handling performance, requested port-
laytime, and optimal service time at berth, from
different perspectives. As pointed before, this study
will contribute to the advance liner services on the
East Coast of South America, especially in Brazil,
over the perception of container vessel round trip
performance surveying. From the perspective of
vessel operators, it was possible to explore the
transportation capacity idleness per ship. From the
perspective of terminal operators; it was possible to
explore port call optimization over handling
productivity maximization and port laytime
reduction, as it is one the most influential
parameters of profitability of a round trip (BÖSE,
2011).
2. Methodology Based on the literature review and maritime
statistics databases, the mathematical model
procedures applied in this paper pursues key
features that influence the container liner services'
operational schedule as stated by the shipping
companies within commercial portfolios. Also,
concerning Port Call Optimization, as port logistics
industry digitalization advances and international
taskforces are supporting marine cross-industry
data standardization. In terms of terminal
performance statistics metrics, such as berth length
utilization rate (TEU/berth/meter), quay crane
utilization rate (TEU/QC), quay crane productivity
(TEU/QC-hour), and the average number of quay
cranes per berth, they were surveyed to be used on
the process approach comparison of vessels´ Liner
service efficiency along calling terminals.
The available container throughput data were
collected mainly from governmental agencies, such
as ANTAQ (2020), and contrasted with terminals’
databases to assess the data quality and the port
sharing information outlooks. By definition, the TEU
factor (fTEU) represents the ratio of 1 TEU volume
or 20ft size container in a unit box (NC_20ft)
compared to 2 TEUs volume or 40ft size in a unit box
(NC_40ft), that differs from terminal to terminal at
each discharging and loading operations (PIANC,
2014). In other words, According to Pawellek and
Schönknecht (2011) the fTEU - Eq. 3 - represents the
relation between container quantity in units (NC)
and volume (NTEU) in TEUs, as 1≤fTEU≤2. From this
perspective, the number of containers carried
between ports in unit boxes (NCS_Port i) – Eq. 1 -
must be lower than the net loading capacity of the
ship in units (NC_Ship) multiplied by its utilization
factor (α), as 0≤α≤1. The container split annual
throughput of 20ft and 40ft boxes at discharging
and loading operations were also calculated for
each port operation, to find the respective TEU
factors.
𝑁𝐶𝑆_𝑃𝑜𝑟𝑡𝑖= 𝑁𝐶𝑆_𝑃𝑜𝑟𝑡 𝑖−1
− (𝑁𝐶_𝑖𝑚𝑝𝑃𝑜𝑟𝑡−𝑖
− 𝑁𝐶_𝑒𝑥𝑝𝑃𝑜𝑟𝑡−𝑖)
(1)
𝑁𝐶𝑆_𝑃𝑜𝑟𝑡𝑖≤ 𝑁𝐶 𝑆ℎ𝑖𝑝 ∙ 𝛼
(2)
𝐹𝑇𝐸𝑈 =𝑁𝑇𝐸𝑈
𝑁𝐶
=𝑁𝐶20𝑓𝑡
+ 2 ∙ 𝑁𝐶40𝑓𝑡
𝑁𝐶
(3)
1 ≤ 𝐹𝑇𝐸𝑈 ≤ 2 (4)
From these outputs, it was possible to estimate the
overall throughput of containers handled and
carried by (SAEC1) ESAm-EU liner vessels per voyage
between the South American Ports round trip, and
the average containers traded from European ports
round trip. Noticing that, the interest of this study is
narrowed among South America East Coast. In the
sequence, the container ship’s laytime in hours
(TL_Port-i) as shown by Eq. 5 - defined as the
rational time of arrival after tendering the Notice of
Readiness (NOR) agreed in contract terms, known
as time allowed to start and complete the cargo
handling services (ITPCO, 2019).
The laytime in port (i) can be expressed from the
aggregation of the berth clearance total time
(TH_Port-i) and the total handling time. To calculate
the total handling time, it must be estimated the
overall number of lifts and the specific time to
complete a single loading or unloading shift action
(TUMH_Port-i) in hours – Eq. 6 - as it was specified
the average number of quay cranes per operation.
The productivity of a berth operation is directly
influenced by the number of quay cranes
(NCBH_Port-i) – Eq. 7 - designated to complete the
handling operation of container boxes break-in;
discharging at importation (NC_imp_Port-i) in units
and loading at exportation (NC_exp_Port-i) in units.
It is also important to note that the rearrangement
5
of containers are directly influenced by the stowage
plan accuracy (PAWELLEK & SCHÖNKNECHT, 2011).
𝑇𝐿𝑝𝑜𝑟𝑡−𝑖= 𝑇𝐻𝑝𝑜𝑟𝑡−𝑖
+ (𝑁𝐶𝑖𝑚𝑝𝑝𝑜𝑟𝑡−𝑖 + 𝑁𝐶_exp _𝑝𝑜𝑟𝑡−𝑖)
∙𝑇𝑈𝑀𝐻𝑝𝑜𝑟𝑡−𝑖
𝑁𝐶𝐵𝐻𝑝𝑜𝑟𝑡−𝑖
(5)
𝑇𝑈𝑀𝐻𝑝𝑜𝑟𝑡−𝑖=
(𝑇𝐿𝑝𝑜𝑟𝑡−𝑖− 𝑇𝐻𝑝𝑜𝑟𝑡−𝑖
) ∙ 𝑁𝐶𝐵𝐻𝑝𝑜𝑟𝑡−𝑖
(𝑁𝐶_𝑖𝑚𝑝_𝑝𝑜𝑟𝑡−𝑖 + 𝑁𝐶_𝑒𝑥𝑝_𝑝𝑜𝑟𝑡−𝑖)
(6)
𝑁𝐶𝐵𝐻𝑝𝑜𝑟𝑡−𝑖=
(𝑁𝐶𝑖𝑚𝑝𝑝𝑜𝑟𝑡−𝑖 + 𝑁𝐶_exp _𝑝𝑜𝑟𝑡−𝑖)
(𝑇𝐿𝑝𝑜𝑟𝑡−𝑖− 𝑇𝐻𝑝𝑜𝑟𝑡−𝑖
)∙ 𝑇𝑈𝑀𝐻𝑝𝑜𝑟𝑡−𝑖
(7)
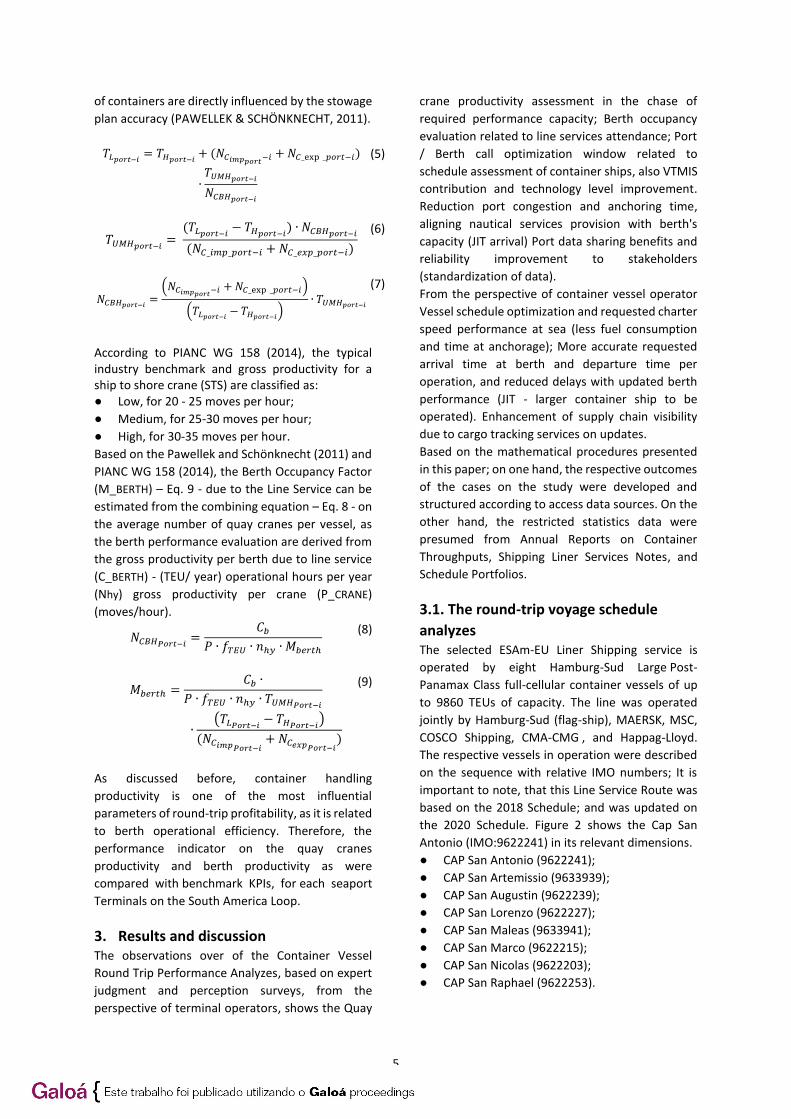
According to PIANC WG 158 (2014), the typical industry benchmark and gross productivity for a ship to shore crane (STS) are classified as: ● Low, for 20 - 25 moves per hour;
● Medium, for 25-30 moves per hour;
● High, for 30-35 moves per hour.
Based on the Pawellek and Schönknecht (2011) and
PIANC WG 158 (2014), the Berth Occupancy Factor
(M_BERTH) – Eq. 9 - due to the Line Service can be
estimated from the combining equation – Eq. 8 - on
the average number of quay cranes per vessel, as
the berth performance evaluation are derived from
the gross productivity per berth due to line service
(C_BERTH) - (TEU/ year) operational hours per year
(Nhy) gross productivity per crane (P_CRANE)
(moves/hour).
𝑁𝐶𝐵𝐻𝑃𝑜𝑟𝑡−𝑖=
𝐶𝑏
𝑃 ∙ 𝑓𝑇𝐸𝑈 ∙ 𝑛ℎ𝑦 ∙ 𝑀𝑏𝑒𝑟𝑡ℎ
(8)
𝑀𝑏𝑒𝑟𝑡ℎ =𝐶𝑏 ∙
𝑃 ∙ 𝑓𝑇𝐸𝑈 ∙ 𝑛ℎ𝑦 ∙ 𝑇𝑈𝑀𝐻𝑃𝑜𝑟𝑡−𝑖
∙(𝑇𝐿𝑃𝑜𝑟𝑡−𝑖
− 𝑇𝐻𝑃𝑜𝑟𝑡−𝑖)
(𝑁𝐶𝑖𝑚𝑝𝑃𝑜𝑟𝑡−𝑖+ 𝑁𝐶𝑒𝑥𝑝𝑃𝑜𝑟𝑡−𝑖
)
(9)
As discussed before, container handling
productivity is one of the most influential
parameters of round-trip profitability, as it is related
to berth operational efficiency. Therefore, the
performance indicator on the quay cranes
productivity and berth productivity as were
compared with benchmark KPIs, for each seaport
Terminals on the South America Loop.
3. Results and discussion The observations over of the Container Vessel
Round Trip Performance Analyzes, based on expert
judgment and perception surveys, from the
perspective of terminal operators, shows the Quay
crane productivity assessment in the chase of
required performance capacity; Berth occupancy
evaluation related to line services attendance; Port
/ Berth call optimization window related to
schedule assessment of container ships, also VTMIS
contribution and technology level improvement.
Reduction port congestion and anchoring time,
aligning nautical services provision with berth's
capacity (JIT arrival) Port data sharing benefits and
reliability improvement to stakeholders
(standardization of data).
From the perspective of container vessel operator
Vessel schedule optimization and requested charter
speed performance at sea (less fuel consumption
and time at anchorage); More accurate requested
arrival time at berth and departure time per
operation, and reduced delays with updated berth
performance (JIT - larger container ship to be
operated). Enhancement of supply chain visibility
due to cargo tracking services on updates.
Based on the mathematical procedures presented
in this paper; on one hand, the respective outcomes
of the cases on the study were developed and
structured according to access data sources. On the
other hand, the restricted statistics data were
presumed from Annual Reports on Container
Throughputs, Shipping Liner Services Notes, and
Schedule Portfolios.
3.1. The round-trip voyage schedule
analyzes The selected ESAm-EU Liner Shipping service is
operated by eight Hamburg-Sud Large Post-
Panamax Class full-cellular container vessels of up
to 9860 TEUs of capacity. The line was operated
jointly by Hamburg-Sud (flag-ship), MAERSK, MSC,
COSCO Shipping, CMA-CMG , and Happag-Lloyd.
The respective vessels in operation were described
on the sequence with relative IMO numbers; It is
important to note, that this Line Service Route was
based on the 2018 Schedule; and was updated on
the 2020 Schedule. Figure 2 shows the Cap San
Antonio (IMO:9622241) in its relevant dimensions.
● CAP San Antonio (9622241);
● CAP San Artemissio (9633939);
● CAP San Augustin (9622239);
● CAP San Lorenzo (9622227);
● CAP San Maleas (9633941);
● CAP San Marco (9622215);
● CAP San Nicolas (9622203);
● CAP San Raphael (9622253).
6
Based on the service line operator commercial
schedule, each vessel calls weekly 14 ports in 54
days of a round trip on average, estimating a total
of 280 calls at Brazilian ports; taking in each round
trip 2 calls at Santos S/A, 2 calls at Paranaguá TCP
and 1 call at Itapoá Container Terminal. However, it
was recorded in 2018 a total of 228 calls at Brazilan
ports from this line service, according to the ANTAQ
database. As a fraction of it, the Santos Brasil S/A
Terminal has recorded in 2018, the total of 95 calls,
with an average of 47 days vessel return on the
same round trip direction, counting by the
difference of the last Actual Time of Departure
(ATD) and the first Actual Time of Berth (ATB) after
the voyage loop, with a weekly frequency of around
7,76 days. Figure 2 shows the line service about
COSCO Shipping.
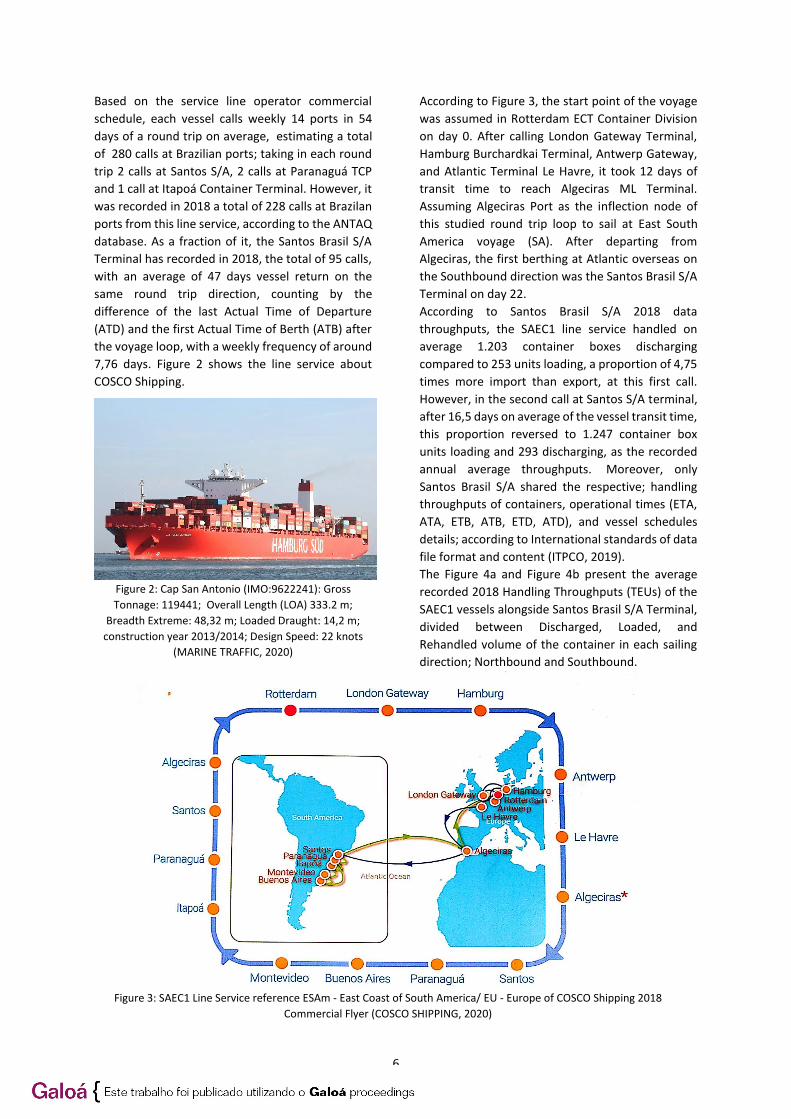
Figure 2: Cap San Antonio (IMO:9622241): Gross
Tonnage: 119441; Overall Length (LOA) 333.2 m;
Breadth Extreme: 48,32 m; Loaded Draught: 14,2 m;
construction year 2013/2014; Design Speed: 22 knots
(MARINE TRAFFIC, 2020)
According to Figure 3, the start point of the voyage
was assumed in Rotterdam ECT Container Division
on day 0. After calling London Gateway Terminal,
Hamburg Burchardkai Terminal, Antwerp Gateway,
and Atlantic Terminal Le Havre, it took 12 days of
transit time to reach Algeciras ML Terminal.
Assuming Algeciras Port as the inflection node of
this studied round trip loop to sail at East South
America voyage (SA). After departing from
Algeciras, the first berthing at Atlantic overseas on
the Southbound direction was the Santos Brasil S/A
Terminal on day 22.
According to Santos Brasil S/A 2018 data
throughputs, the SAEC1 line service handled on
average 1.203 container boxes discharging
compared to 253 units loading, a proportion of 4,75
times more import than export, at this first call.
However, in the second call at Santos S/A terminal,
after 16,5 days on average of the vessel transit time,
this proportion reversed to 1.247 container box
units loading and 293 discharging, as the recorded
annual average throughputs. Moreover, only
Santos Brasil S/A shared the respective; handling
throughputs of containers, operational times (ETA,
ATA, ETB, ATB, ETD, ATD), and vessel schedules
details; according to International standards of data
file format and content (ITPCO, 2019).
The Figure 4a and Figure 4b present the average
recorded 2018 Handling Throughputs (TEUs) of the
SAEC1 vessels alongside Santos Brasil S/A Terminal,
divided between Discharged, Loaded, and
Rehandled volume of the container in each sailing
direction; Northbound and Southbound.
Figure 3: SAEC1 Line Service reference ESAm - East Coast of South America/ EU - Europe of COSCO Shipping 2018
Commercial Flyer (COSCO SHIPPING, 2020)

7
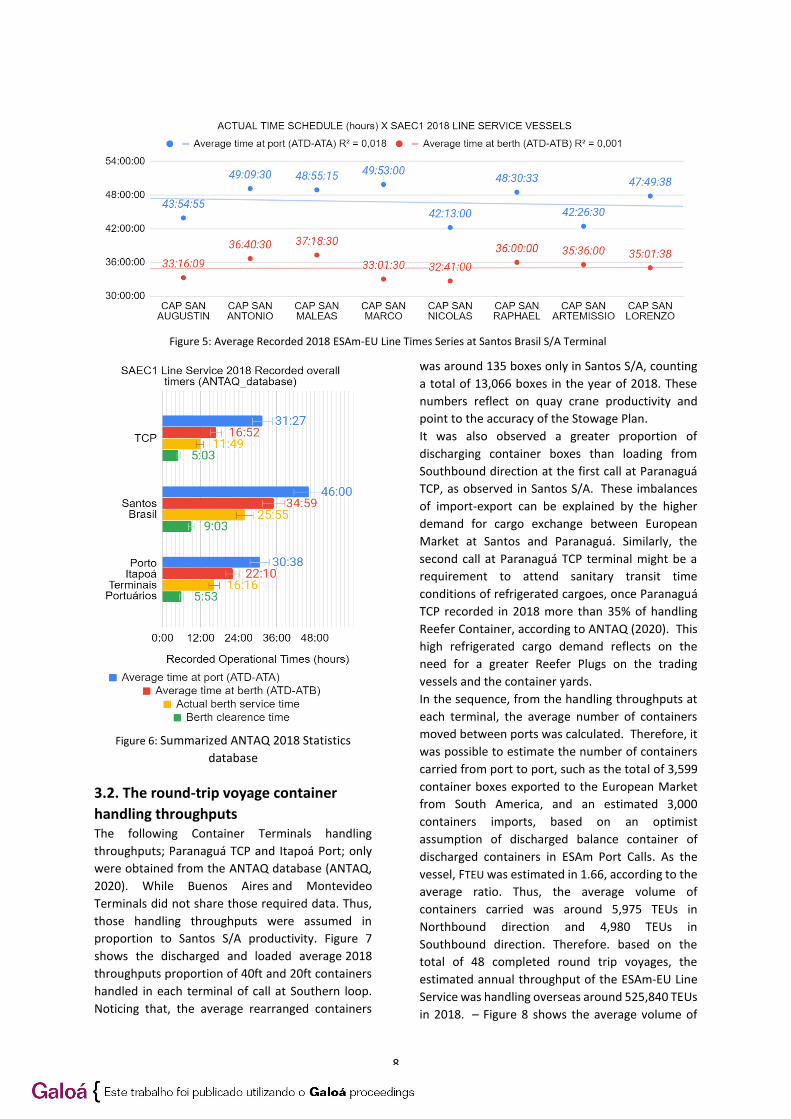
Moreover, Figure 5 presents the Average 2018
SAEC1 Vessels’ Recorded Timeline at Santos S/A
Terminal based on the Time at Port (ATD-ATA) and
the Time at Berth (ATD-ATB). Reminding from the
first call at Santo S/A terminal, according to the
Service 2018 schedule, the next stop was at
Paranaguá TCP on day 24, later the last call in
Southbound direction was Buenos Aires Río de La
Plata Terminal (RTP) at day 27 of transit time. After
sailing from Buenos Aires, the next call was in the
Northbound direction at Montevideo Katoen Natie
Terminal TCP on day 30 of transit time. However, as
pointed out before, the actual 2020 schedule
shifted Buenos Aires and Montevideo calling
sequences, but it was not noted a significant transit
time reduction after these calling shifts.
In the sequence, the next call was at Itapoá Port
Container Terminal on day 33; then the second call
at Paranaguá TCP was on day 34 and the next call
was the second visit at Santos S/A Terminal at day
36. After the last sailing from Brazil, the next stop
was the second visit to Algeciras on day 49, then the
last vessel call was at the starting point at
Rotterdam ECT Container Division on day 54.
Figure 6 presents the summarized ANTAQ 2018
Statistics database, obtained from the recorded
time series of the SAEC1 Line Service for each
respective Brazilian Terminals, as Paranaguá TCP;
Santos Brasil S/A, and Itapoá Port Terminals.
Noticing that the average time at berth from ANTAQ
2018 database must be loyal to Santos S/A terminal
database (SANTOS BRASIL, 2020). Thus, on one
hand, it was observed an average Time at Berth
(ATD-ATB) of around 35 hours, which is similar to
both sources. On the other hand, it was observed a
clearance average time or dwell time at the berth of
respectively; 5 hours to Paranaguá TCP; 9 hours to
Santos Brasil S/A, and 6 hours to Itapoá Port
Terminal.
Figure 4a: Volume of the container in each sailing direction; Northbound and Southbound.
Figure 4b: Volume of the container in each sailing direction; Northbound and Southbound.
8
Figure 5: Average Recorded 2018 ESAm-EU Line Times Series at Santos Brasil S/A Terminal
Figure 6: Summarized ANTAQ 2018 Statistics
database
3.2. The round-trip voyage container
handling throughputs The following Container Terminals handling
throughputs; Paranaguá TCP and Itapoá Port; only
were obtained from the ANTAQ database (ANTAQ,
2020). While Buenos Aires and Montevideo
Terminals did not share those required data. Thus,
those handling throughputs were assumed in
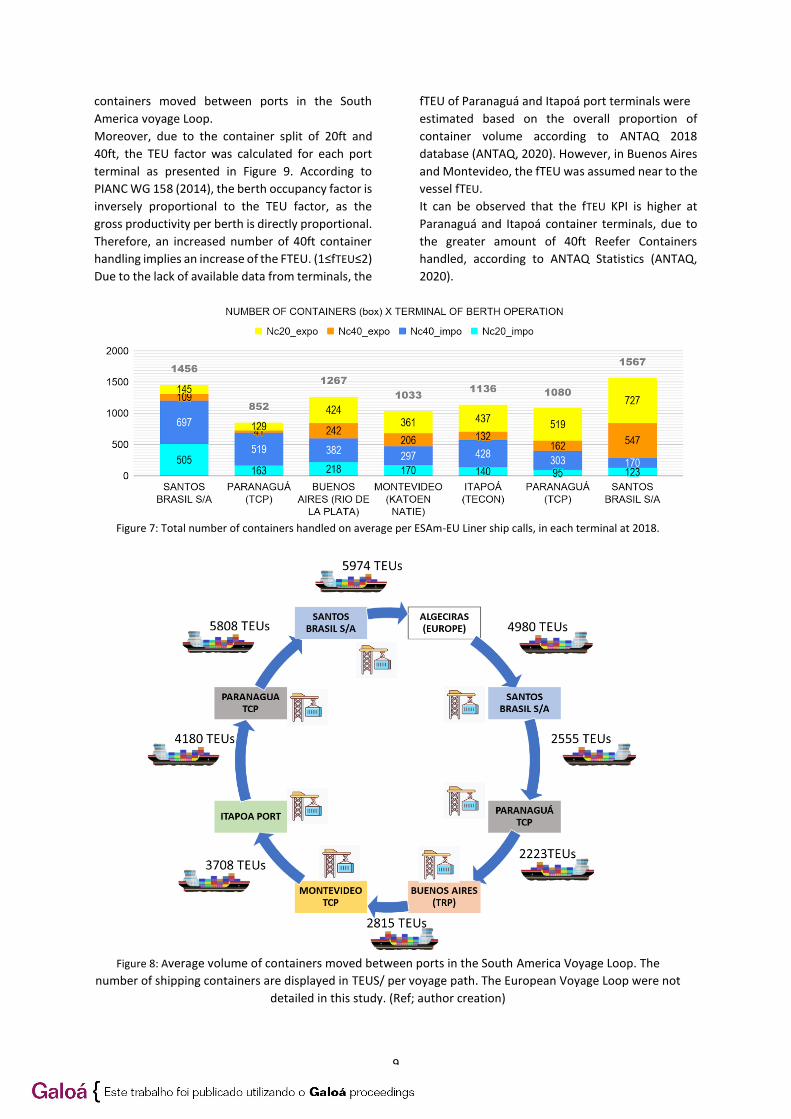
proportion to Santos S/A productivity. Figure 7
shows the discharged and loaded average 2018
throughputs proportion of 40ft and 20ft containers
handled in each terminal of call at Southern loop.
Noticing that, the average rearranged containers
was around 135 boxes only in Santos S/A, counting
a total of 13,066 boxes in the year of 2018. These
numbers reflect on quay crane productivity and
point to the accuracy of the Stowage Plan.
It was also observed a greater proportion of
discharging container boxes than loading from
Southbound direction at the first call at Paranaguá
TCP, as observed in Santos S/A. These imbalances
of import-export can be explained by the higher
demand for cargo exchange between European
Market at Santos and Paranaguá. Similarly, the
second call at Paranaguá TCP terminal might be a
requirement to attend sanitary transit time
conditions of refrigerated cargoes, once Paranaguá
TCP recorded in 2018 more than 35% of handling
Reefer Container, according to ANTAQ (2020). This
high refrigerated cargo demand reflects on the
need for a greater Reefer Plugs on the trading
vessels and the container yards.
In the sequence, from the handling throughputs at
each terminal, the average number of containers
moved between ports was calculated. Therefore, it
was possible to estimate the number of containers
carried from port to port, such as the total of 3,599
container boxes exported to the European Market
from South America, and an estimated 3,000
containers imports, based on an optimist
assumption of discharged balance container of
discharged containers in ESAm Port Calls. As the
vessel, FTEU was estimated in 1.66, according to the
average ratio. Thus, the average volume of
containers carried was around 5,975 TEUs in
Northbound direction and 4,980 TEUs in
Southbound direction. Therefore. based on the
total of 48 completed round trip voyages, the
estimated annual throughput of the ESAm-EU Line
Service was handling overseas around 525,840 TEUs
in 2018. – Figure 8 shows the average volume of
9
containers moved between ports in the South
America voyage Loop.
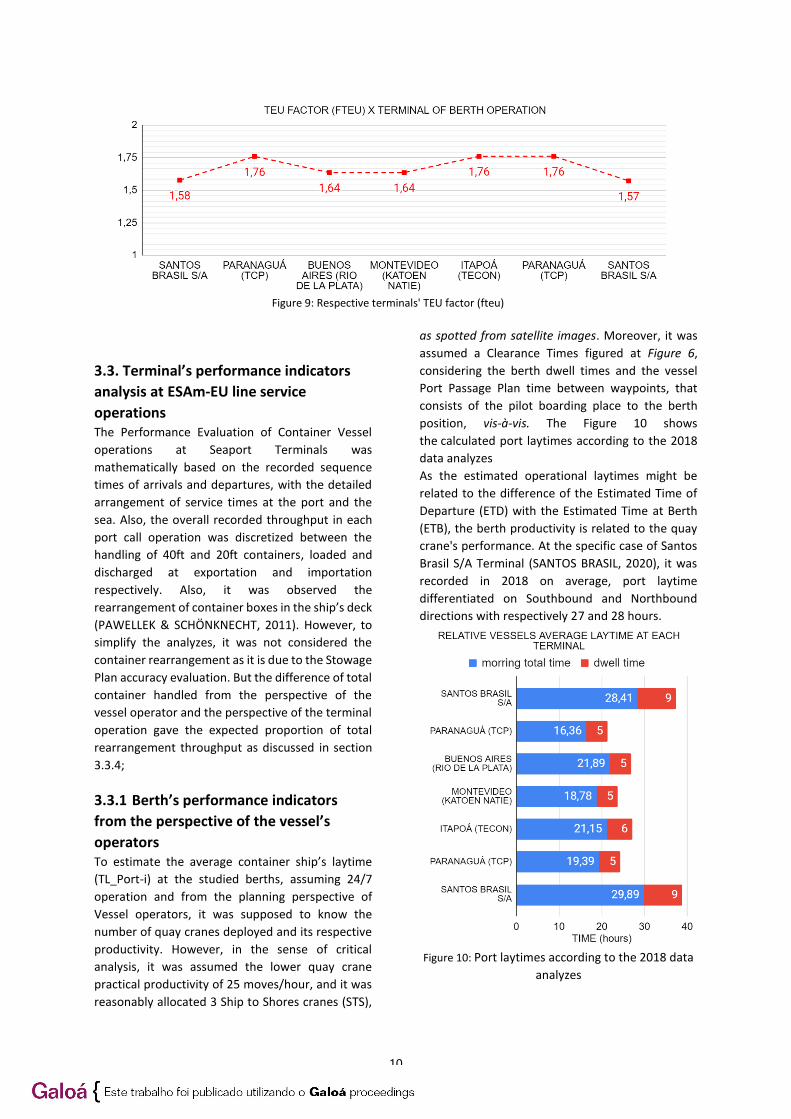
Moreover, due to the container split of 20ft and
40ft, the TEU factor was calculated for each port
terminal as presented in Figure 9. According to
PIANC WG 158 (2014), the berth occupancy factor is
inversely proportional to the TEU factor, as the
gross productivity per berth is directly proportional.
Therefore, an increased number of 40ft container
handling implies an increase of the FTEU. (1≤fTEU≤2)
Due to the lack of available data from terminals, the
fTEU of Paranaguá and Itapoá port terminals were
estimated based on the overall proportion of
container volume according to ANTAQ 2018
database (ANTAQ, 2020). However, in Buenos Aires
and Montevideo, the fTEU was assumed near to the
vessel fTEU.
It can be observed that the fTEU KPI is higher at
Paranaguá and Itapoá container terminals, due to
the greater amount of 40ft Reefer Containers
handled, according to ANTAQ Statistics (ANTAQ,
2020).
Figure 7: Total number of containers handled on average per ESAm-EU Liner ship calls, in each terminal at 2018.
Figure 8: Average volume of containers moved between ports in the South America Voyage Loop. The
number of shipping containers are displayed in TEUS/ per voyage path. The European Voyage Loop were not
detailed in this study. (Ref; author creation)
10
Figure 9: Respective terminals' TEU factor (fteu)
3.3. Terminal’s performance indicators
analysis at ESAm-EU line service
operations The Performance Evaluation of Container Vessel
operations at Seaport Terminals was
mathematically based on the recorded sequence
times of arrivals and departures, with the detailed
arrangement of service times at the port and the
sea. Also, the overall recorded throughput in each
port call operation was discretized between the
handling of 40ft and 20ft containers, loaded and
discharged at exportation and importation
respectively. Also, it was observed the
rearrangement of container boxes in the ship’s deck
(PAWELLEK & SCHÖNKNECHT, 2011). However, to
simplify the analyzes, it was not considered the
container rearrangement as it is due to the Stowage
Plan accuracy evaluation. But the difference of total
container handled from the perspective of the
vessel operator and the perspective of the terminal
operation gave the expected proportion of total
rearrangement throughput as discussed in section
3.3.4;
3.3.1 Berth’s performance indicators
from the perspective of the vessel’s
operators To estimate the average container ship’s laytime
(TL_Port-i) at the studied berths, assuming 24/7
operation and from the planning perspective of
Vessel operators, it was supposed to know the
number of quay cranes deployed and its respective
productivity. However, in the sense of critical
analysis, it was assumed the lower quay crane
practical productivity of 25 moves/hour, and it was
reasonably allocated 3 Ship to Shores cranes (STS),
as spotted from satellite images. Moreover, it was
assumed a Clearance Times figured at Figure 6,
considering the berth dwell times and the vessel
Port Passage Plan time between waypoints, that
consists of the pilot boarding place to the berth
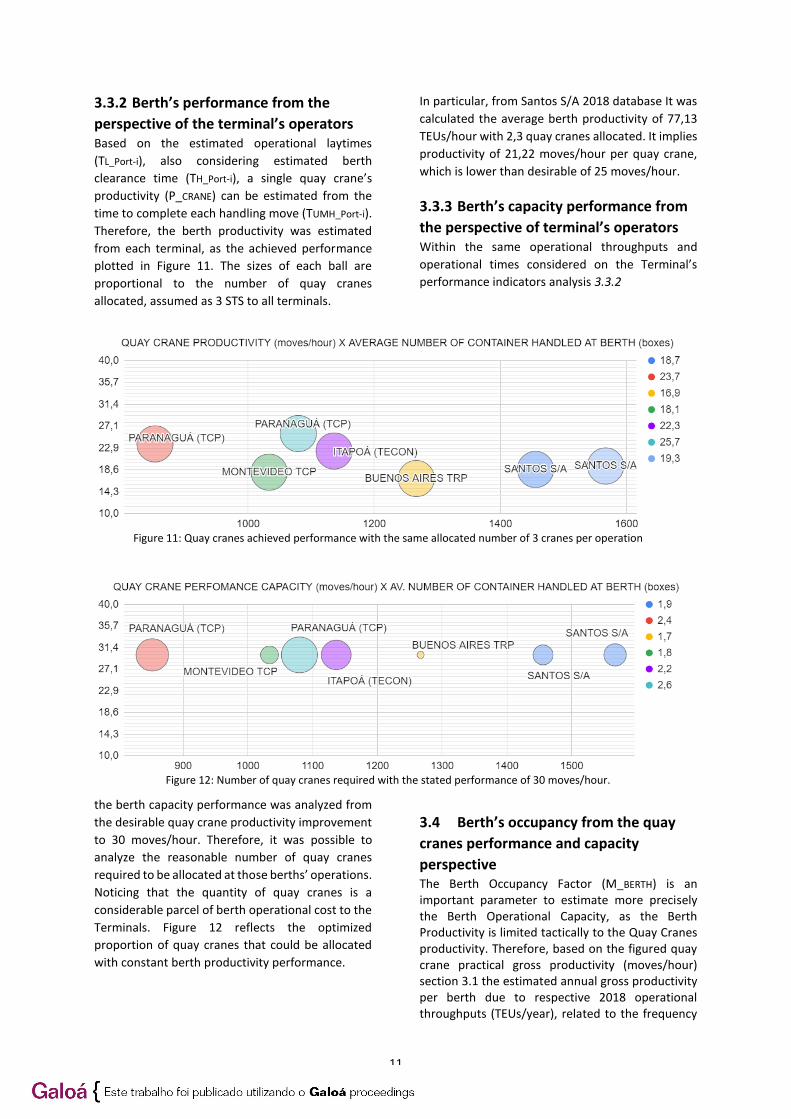
position, vis-à-vis. The Figure 10 shows
the calculated port laytimes according to the 2018
data analyzes
As the estimated operational laytimes might be
related to the difference of the Estimated Time of
Departure (ETD) with the Estimated Time at Berth
(ETB), the berth productivity is related to the quay
crane's performance. At the specific case of Santos
Brasil S/A Terminal (SANTOS BRASIL, 2020), it was
recorded in 2018 on average, port laytime
differentiated on Southbound and Northbound
directions with respectively 27 and 28 hours.
Figure 10: Port laytimes according to the 2018 data
analyzes
11
3.3.2 Berth’s performance from the
perspective of the terminal’s operators Based on the estimated operational laytimes
(TL_Port-i), also considering estimated berth
clearance time (TH_Port-i), a single quay crane’s
productivity (P_CRANE) can be estimated from the
time to complete each handling move (TUMH_Port-i).
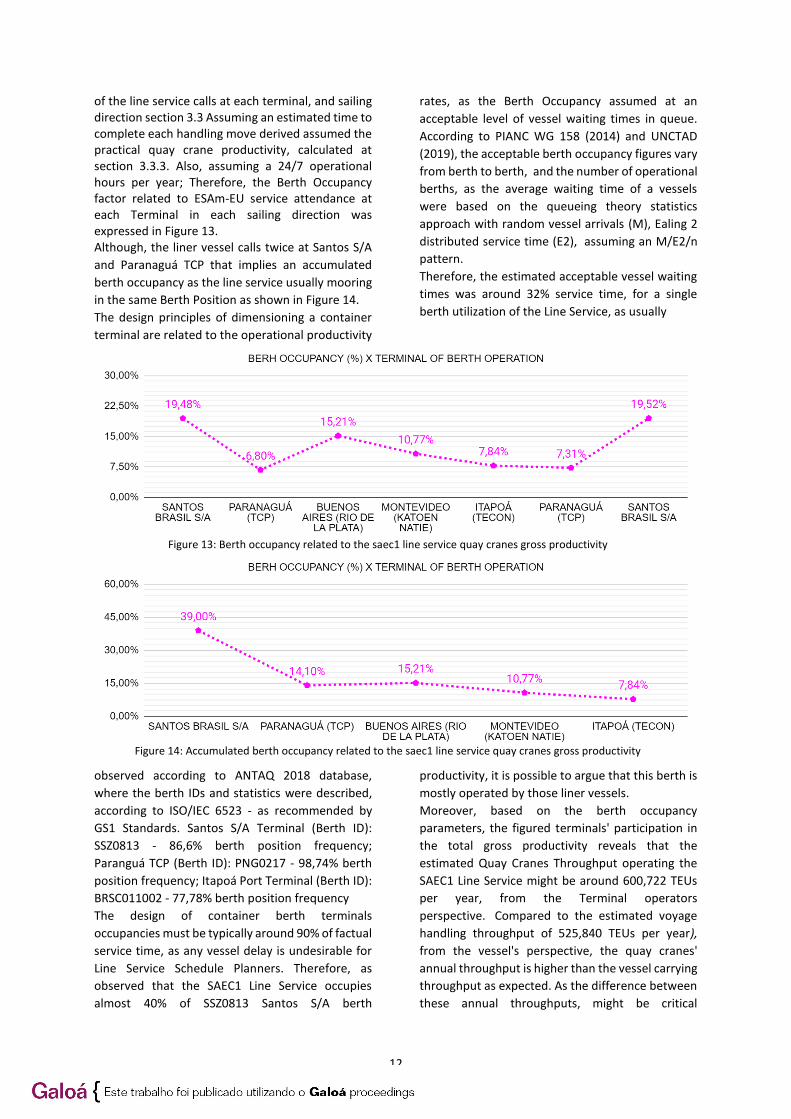
Therefore, the berth productivity was estimated
from each terminal, as the achieved performance
plotted in Figure 11. The sizes of each ball are
proportional to the number of quay cranes
allocated, assumed as 3 STS to all terminals.
In particular, from Santos S/A 2018 database It was
calculated the average berth productivity of 77,13
TEUs/hour with 2,3 quay cranes allocated. It implies
productivity of 21,22 moves/hour per quay crane,
which is lower than desirable of 25 moves/hour.
3.3.3 Berth’s capacity performance from
the perspective of terminal’s operators Within the same operational throughputs and
operational times considered on the Terminal’s
performance indicators analysis 3.3.2
Figure 11: Quay cranes achieved performance with the same allocated number of 3 cranes per operation
Figure 12: Number of quay cranes required with the stated performance of 30 moves/hour.
the berth capacity performance was analyzed from
the desirable quay crane productivity improvement
to 30 moves/hour. Therefore, it was possible to
analyze the reasonable number of quay cranes
required to be allocated at those berths’ operations.
Noticing that the quantity of quay cranes is a
considerable parcel of berth operational cost to the
Terminals. Figure 12 reflects the optimized
proportion of quay cranes that could be allocated
with constant berth productivity performance.
3.4 Berth’s occupancy from the quay
cranes performance and capacity
perspective The Berth Occupancy Factor (M_BERTH) is an important parameter to estimate more precisely the Berth Operational Capacity, as the Berth Productivity is limited tactically to the Quay Cranes productivity. Therefore, based on the figured quay crane practical gross productivity (moves/hour) section 3.1 the estimated annual gross productivity per berth due to respective 2018 operational throughputs (TEUs/year), related to the frequency
12
of the line service calls at each terminal, and sailing direction section 3.3 Assuming an estimated time to complete each handling move derived assumed the practical quay crane productivity, calculated at section 3.3.3. Also, assuming a 24/7 operational hours per year; Therefore, the Berth Occupancy factor related to ESAm-EU service attendance at each Terminal in each sailing direction was expressed in Figure 13. Although, the liner vessel calls twice at Santos S/A
and Paranaguá TCP that implies an accumulated
berth occupancy as the line service usually mooring
in the same Berth Position as shown in Figure 14. The design principles of dimensioning a container
terminal are related to the operational productivity
rates, as the Berth Occupancy assumed at an
acceptable level of vessel waiting times in queue.
According to PIANC WG 158 (2014) and UNCTAD
(2019), the acceptable berth occupancy figures vary
from berth to berth, and the number of operational
berths, as the average waiting time of a vessels
were based on the queueing theory statistics
approach with random vessel arrivals (M), Ealing 2
distributed service time (E2), assuming an M/E2/n
pattern.
Therefore, the estimated acceptable vessel waiting
times was around 32% service time, for a single
berth utilization of the Line Service, as usually
Figure 13: Berth occupancy related to the saec1 line service quay cranes gross productivity
Figure 14: Accumulated berth occupancy related to the saec1 line service quay cranes gross productivity
observed according to ANTAQ 2018 database,
where the berth IDs and statistics were described,
according to ISO/IEC 6523 - as recommended by
GS1 Standards. Santos S/A Terminal (Berth ID):
SSZ0813 - 86,6% berth position frequency;
Paranguá TCP (Berth ID): PNG0217 - 98,74% berth
position frequency; Itapoá Port Terminal (Berth ID):
BRSC011002 - 77,78% berth position frequency
The design of container berth terminals
occupancies must be typically around 90% of factual
service time, as any vessel delay is undesirable for
Line Service Schedule Planners. Therefore, as
observed that the SAEC1 Line Service occupies
almost 40% of SSZ0813 Santos S/A berth
productivity, it is possible to argue that this berth is
mostly operated by those liner vessels.
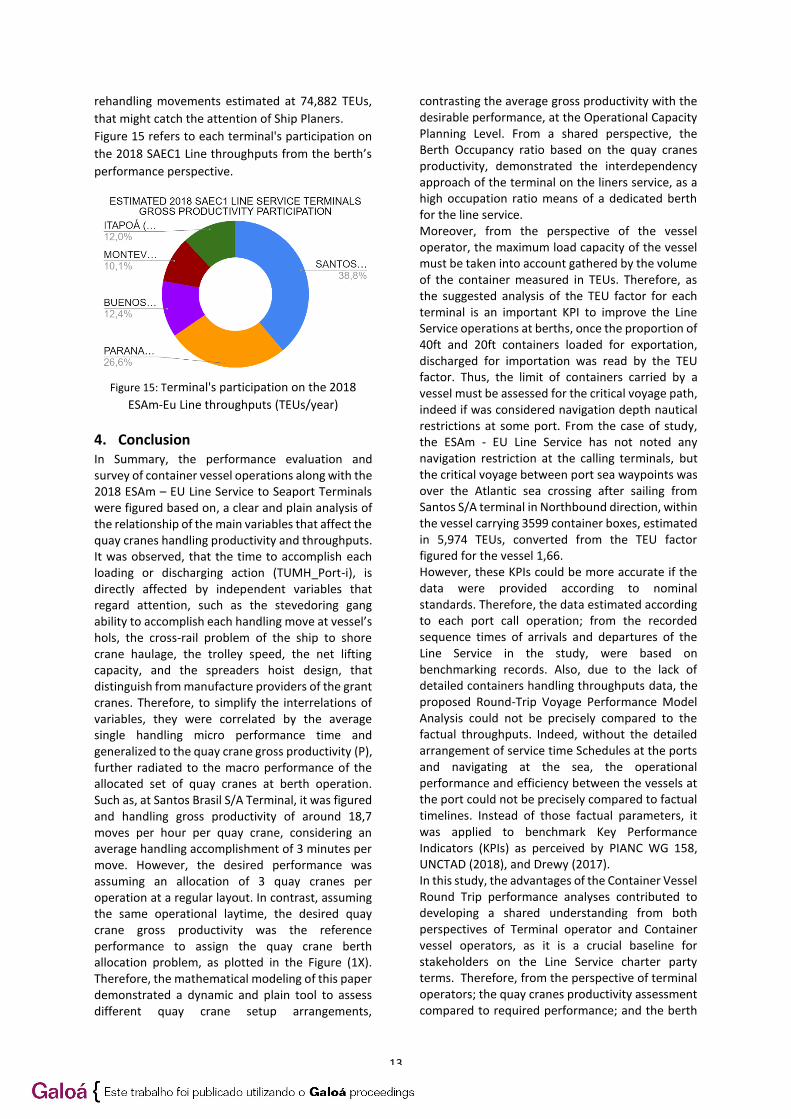
Moreover, based on the berth occupancy
parameters, the figured terminals' participation in
the total gross productivity reveals that the
estimated Quay Cranes Throughput operating the
SAEC1 Line Service might be around 600,722 TEUs
per year, from the Terminal operators
perspective. Compared to the estimated voyage
handling throughput of 525,840 TEUs per year),
from the vessel's perspective, the quay cranes'
annual throughput is higher than the vessel carrying
throughput as expected. As the difference between
these annual throughputs, might be critical
13
rehandling movements estimated at 74,882 TEUs,
that might catch the attention of Ship Planers.
Figure 15 refers to each terminal's participation on
the 2018 SAEC1 Line throughputs from the berth’s
performance perspective.
Figure 15: Terminal's participation on the 2018
ESAm-Eu Line throughputs (TEUs/year)
4. Conclusion In Summary, the performance evaluation and survey of container vessel operations along with the 2018 ESAm – EU Line Service to Seaport Terminals were figured based on, a clear and plain analysis of the relationship of the main variables that affect the quay cranes handling productivity and throughputs. It was observed, that the time to accomplish each loading or discharging action (TUMH_Port-i), is directly affected by independent variables that regard attention, such as the stevedoring gang ability to accomplish each handling move at vessel’s hols, the cross-rail problem of the ship to shore crane haulage, the trolley speed, the net lifting capacity, and the spreaders hoist design, that distinguish from manufacture providers of the grant cranes. Therefore, to simplify the interrelations of variables, they were correlated by the average single handling micro performance time and generalized to the quay crane gross productivity (P), further radiated to the macro performance of the allocated set of quay cranes at berth operation. Such as, at Santos Brasil S/A Terminal, it was figured and handling gross productivity of around 18,7 moves per hour per quay crane, considering an average handling accomplishment of 3 minutes per move. However, the desired performance was assuming an allocation of 3 quay cranes per operation at a regular layout. In contrast, assuming the same operational laytime, the desired quay crane gross productivity was the reference performance to assign the quay crane berth allocation problem, as plotted in the Figure (1X). Therefore, the mathematical modeling of this paper demonstrated a dynamic and plain tool to assess different quay crane setup arrangements,
contrasting the average gross productivity with the desirable performance, at the Operational Capacity Planning Level. From a shared perspective, the Berth Occupancy ratio based on the quay cranes productivity, demonstrated the interdependency approach of the terminal on the liners service, as a high occupation ratio means of a dedicated berth for the line service. Moreover, from the perspective of the vessel operator, the maximum load capacity of the vessel must be taken into account gathered by the volume of the container measured in TEUs. Therefore, as the suggested analysis of the TEU factor for each terminal is an important KPI to improve the Line Service operations at berths, once the proportion of 40ft and 20ft containers loaded for exportation, discharged for importation was read by the TEU factor. Thus, the limit of containers carried by a vessel must be assessed for the critical voyage path, indeed if was considered navigation depth nautical restrictions at some port. From the case of study, the ESAm - EU Line Service has not noted any navigation restriction at the calling terminals, but the critical voyage between port sea waypoints was over the Atlantic sea crossing after sailing from Santos S/A terminal in Northbound direction, within the vessel carrying 3599 container boxes, estimated in 5,974 TEUs, converted from the TEU factor figured for the vessel 1,66. However, these KPIs could be more accurate if the data were provided according to nominal standards. Therefore, the data estimated according to each port call operation; from the recorded sequence times of arrivals and departures of the Line Service in the study, were based on benchmarking records. Also, due to the lack of detailed containers handling throughputs data, the proposed Round-Trip Voyage Performance Model Analysis could not be precisely compared to the factual throughputs. Indeed, without the detailed arrangement of service time Schedules at the ports and navigating at the sea, the operational performance and efficiency between the vessels at the port could not be precisely compared to factual timelines. Instead of those factual parameters, it was applied to benchmark Key Performance Indicators (KPIs) as perceived by PIANC WG 158, UNCTAD (2018), and Drewy (2017). In this study, the advantages of the Container Vessel Round Trip performance analyses contributed to developing a shared understanding from both perspectives of Terminal operator and Container vessel operators, as it is a crucial baseline for stakeholders on the Line Service charter party terms. Therefore, from the perspective of terminal operators; the quay cranes productivity assessment compared to required performance; and the berth
14
occupancy evaluation, are important decision-making analyses before any Terminal investment on capacity enhancement at a Hub-and-Spoke System. Besides, in the light of the state-of-art, as it could be seen accelerating of the digitization process on global leaders container industry, the Port’s Berth call Optimization process, might be a successful key strategic practice to reduce the port congestion and anchoring times, as well as emission reduction of Green House Gases (GHG); as it follows the Just-in-Time Arrival Guide arrangement, in accordance to the International Maritime Organization (IMO) best practices for the sector. Also, the data sharing and standardization is an enormous benefit to stakeholders' reliability, academy scientific disclosures, and governmental statistics forecasting on infrastructure improvement. Moreover, from the perspective of container vessel operators, the shipping schedule optimization might be rearranged as a need for speed performance improvement at sea, regarding upcoming restrictive regulations of less fuel consumption and GHG emissions. Also, the volume of container handled per operation can be more precisely assed, as the economy of scale of - larger container ships are a goal for any Shipping company.
5. BIBLIOGRAPHY REVIEW ANTAQ. Anuário. Available in:
<http://web.antaq.gov.br/ANUARIO/>. Access in:
may 2020.
BICHOU, K. Port Operations, Planning and Logistics. Lloyd’s Pr ed. London: Informa Law from Routledge, 2009.
BÖSE, J. W. Handbook of Terminal Planning.
Hamburg University of Technology, Germany, v. 49,
2011.
COSCO SHIPPING. Service ESE/ESE Line. Available
in:<https://world.lines.coscoshipping.com/statics/s
ites/main/local/brazil/en/PublishingImages/Pages/
services/ESE_Lines_Presentation.pdf>. Access in:
jun 2020.
DREWRY. Ports & Terminals Insight: Quarterly
Analysis of the Ports and Terminals Market. 2017.
Available in: <https://www.drewry.co.uk/maritime-
research-products/ports-and-terminals-insight-
annual-subscription>. Acess in may 2020.
GIA. Just In Time Arrival Guide - Barriers and
Potential Solutions. GEF-UNDP-IMO GIoMEEP,
2020.
ITPCO. Port Information Manual. International
Taskforce Port Call Optimization, version 1.4.5,
2019.
K. D. S., DWARAKISH, G. S. Measuring port
performance and productivity. ISH Journal of
Hydraulic Engineering, pp. 1-7, 2018.
LU, B., WANG, S. Critical Factors for Berth
Productivity in Container Terminal. Singapore:
Springer, pp. 1-63, 2017.
MARINE TRAFFIC. Cap San Antonio. Available in:
<https://www.marinetraffic.com/en/ais/details/shi
ps/shipid:758946/mmsi:219095000/imo:9622241/
vessel:CAP_SAN_ANTONIO/_:2319a35bdc4e5d68e
d633299bbd34e6f>. Access in: jun 2020.
MEISEL, F., BIERWIRTH, C. Handbook of Terminal
Planning. Hamburg University of Technology,
Germany, v. 49, chapter 9, pp. 155-178, 2011.
PALLIS, A. A., VITSOUNIS, T. K., DE LANGEN, P. W.,
NOTTEBOOM, T. E. Port Economics, Policy and
Management – Content Classification and Survey
Transport Reviews, v. 31(4), pp. 445-471, 2011.
PAWELLEK, G., SCHÖNKNECHT, A. Handbook of
Terminal Planning. Hamburg University of
Technology, Germany, v. 49, chapter 11, pp. 195-
215, 2011.
PIANC WG 158. Masterplans for the development of
existing ports. Maritime Navigation Commission,
2014.
RODRIGUE, J-P, NOTTEBOOM, T. Foreland-based
regionalization: Integrating intermediate hubs with
port hinterlands. Research in Transportation
Economics, pp. 19-29, 2010.
SANTOS BRASIL. Lista de Atracação. Available in:
<https://www.santosbrasil.com.br/tecon-santos-
sistemas/atracacao.asp>. Access in: jul 2020.
SHI, W., LI, K. X. Themes and tools of maritime
transport research during 2000-2014. Maritime
Policy & Management. 2016.
UNCTAD. Review of maritime transport 2018.
United Nations, 2018.
UNCTAD. Review of maritime transport 2019.
United Nations, 2019.
Powered by TCPDF (www.tcpdf.org)
View publication statsView publication stats