Container Grown Plant Production - SNAsna.org/Resources/Documents/11resprocsec09.pdfIndex Words:...
68
SNA Research Conference Vol. 56 2011 Container Grown Plants 235 Container Grown Plant Production Derald Harp Section Editor and Moderator
Transcript of Container Grown Plant Production - SNAsna.org/Resources/Documents/11resprocsec09.pdfIndex Words:...
SNA Research Conference Vol. 56 2011
Container Grown Plants
235
Container Grown Plant Production
Derald Harp Section Editor and Moderator

SNA Research Conference Vol. 56 2011
Container Grown Plants
236
Cedar Substrate Particle Size Affects Growth of Container-Grown Rudbekia
Zachariah Starr, Cheryl Boyer, Jason Griffin
Kansas State University, Department of Horticulture, Forestry and Recreation Resources, Manhattan, KS 66506
Index Words: alternative substrates, container media, eastern redcedar, nursery crops, pine bark, Rudbeckia fulgida Significance to Industry: This study evaluated the growth of a perennial crop, Rudbeckia fulgida var. fulgida (L.) (black-eyed susan), in five substrates consisting of either pine bark (PB) or cedar (Juniperus virginiana L.) chips ground to pass a 3/16-, 3/8-, 1/2-, or 3/4-inch screen. As substrate particle size increased shoot dry weight decreased though plant growth indices was generally similar and most plants were marketable. Substrate EC did not vary between treatments at any rating date while pH varied at each rating date until termination at which time pH of all treatments pHs had reached a similar level. These results indicate that J. virginiana chips can be used as a substrate for container-grown Rubeckia when processed at all 4 screen sizes, but performed best at 3/16-inch screen size. Nature of Work: Pine bark is the typical material used for nursery production of container-grown plants throughout the much of U.S. (11). With the closing and relocation of timber mills and use of PB as an alternative energy source for those mills, PB is becoming less available and more costly to purchase (4, 6). Regions without large pine forests, such as the Great Plains, experience a compounded price increase due to transportation costs for nursery substrates. This has lead to a demand for alternative substrates to supplement or replace PB supplies. Eastern redcedar (J. virginiana) is endemic to the Great Plains and has spread rapidly due to reduced natural controls (community development resulting in less natural fires). In addition, its use in windbreaks and for wildlife cover has resulted in an increased seed population which has lead to an eastern redcedar population boom (2, 8). This large eastern redcedar population has negative affects on the native grasslands of the Great Plains by altering species composition (species richness, forb cover, and grass cover), soil moisture, blocking incoming solar radiation, decreasing soil temperature and alterations to litter dynamics (5, 3). As loss of native grasslands increases, less forage area for livestock is available which increases handling costs for the livestock industry (7). Utilization of eastern redcedar whole tree chips as a substrate component could alleviate PB demand in the Great Plains with a sustainable, local resource that improves the grassland ecosystem by reducing unwanted eastern redcedar populations. Previous work showed that eastern redcedar chips milled to pass a 3/4-inch screen can function as a substrate for Taxodium distichum (L.) Rich. (baldcypress) but worked best as an amendment to a PB mix (9). Plants grown in substrates that contained 80% eastern redcedar chips and 20% sand had reduced container capacity due to elevated air-space when compared to other mixes containing both PB, cedar, and sand or PB and sand (9). The purpose of
SNA Research Conference Vol. 56 2011
Container Grown Plants
237
this investigation was to determine at what particle size, if any, cedar can be used to produce a container-grown perennial crop, Rudbeckia fulgida var. fulgida (L.), comparable to plants grown in PB. Juniperus virginiana chips (cedar) (Queal Enterprises. Pratt, KS) from whole trees harvested in Barber County, KS (aged for six months) were ground in a hammer mill (C.S. Bell Co., Tiffin, OH, Model 30HMBL) to pass a 3/16-, 3/8-, 1/2-,or 3/4-inch (4.76 mm, 9.53 mm, 12.70 mm, 19.05 mm) screen on April 28th 2010. The cedar and a PB (SunGro, Bellevue, WA) control were then blended with sand to make a series of five 80% wood : 20% sand (by vol.) substrate mixes. Substrates were pre-plant incorporated with 2 lbs/yd3 (1.17 kg/m2) micronutrient package (Scotts, Micromax, Marysville, OH) and controlled release fertilizer at a medium rate of 14.5 lbs/yd3 (8.60 kg/m2) (Scott’s, Osmocote Classic , 18-6-12, 8 to 9 month release, Marysville, OH). Two-gallon (8.7 L) containers were then filled and planted with liners (one per container from a 72 cell pack) of Rudbeckia fulgida var. fulgida L (Creek Hill Nursery, Leola, PA.). Containers were placed on an outdoor gravel container pad and irrigated daily via overhead sprinklers supplying approx. 1-in. of precipitation daily. Data collection began on May 13th, 16 days after planting (DAP), and continued once every 4 weeks (43 DAP, 71 DAP) until termination on August 11 (106 DAP). Data collected included pH and electrical conductivity (EC) using the PourThru technique (10), leaf greenness as measured with a SPAD meter, and growth indices [(widest width + perpendicular width + height) ÷ 3] at 16, 43, 71, and 106 DAP. Shoot dry weight was recorded at the conclusion of the study (106 DAP) by drying in a forced air oven (The Grieve Co. Model SC-400, Round Lake, IL) at 160oF (71.11 °C) for 7 days. Substrate physical properties were determined using North Carolina State University porometers (Raleigh, NC) which measured substrate air space, water holding capacity, substrate bulk density, and total porosity (1). Data were analyzed using SAS (Version 9.1 SAS Institute Inc. Cary, NC) The experimental design was a randomized complete block with a factorial arrangement of treatments and eight single plant replications. Results: All cedar-based substrate pH were similar to each other at 16 and 43 DAP, and higher than the PB substrate (Table 1). Greater variation occurred at 71 DAP with pH of PB remaining low compared to cedar substrates, while 3/4-inch cedar had the highest pH. There were no significant differences in pH between treatments at the conclusion of the study106 DAP. Irrigation water pH averaged 7.52. There were no significant differences between substrate EC in any treatment at all measurement dates (Table 1). Growth indices of Rudbeckia fulgida var. fulgida at 106 DAP varied by substrate with plants growing in PB and 3/16-inch cedar producing the largest plants and 1/2-inch cedar producing the smallest plants (Table 2). Growth of plants in substrates containing 3/4-and 3/8-inch cedar were similar to all other treatments. Dry weight of the shoot tissues varied greatly between treatments. Plants grown in PB had the greatest shoot dry weight with 3/16 and 3/8-inch cedar producing similar mass to PB. Substrates containing 1/2- and 3/4-inch cedar produced less mass but were statistically similar to
SNA Research Conference Vol. 56 2011
Container Grown Plants
238
3/16 and 3/8-inch cedar (Table 2). Leaf greenness, measured with a SPAD meter on four recently matured leaves, initially varied at 16 DAP but there were no significant differences between substrates thereafter (data not shown). Generally, as cedar particle size increased container capacity decreased with increasing air space as shown in the previous study (11). Correspondingly, shoot dry weight and growth indices decreased in a similar manner. Pine bark, which had the greatest container capacity and least air space produced plants with the greatest shoot dry weight and growth indices. Container capacity of both 1/2- and 3/4- inch cedar was outside the recommended range of 45% to 65%. Similarly, airspace of 1/2- and 3/4- inch cedar was also outside the recommended range of 10 – 30%. However, container capacity and air space of 3/8-inch cedar was close to the recommended ranges. Interestingly, PB also fell outside of the recommended ranges for container capacity and air space. However, 3/16-inch cedar substrate was within recommended ranges for both container capacity and air space and had the second greatest growth and shoot dry weight after plants grown in PB. Pine bark had greater bulk density and total porosity than all cedar treatments, which were similar regardless of processed screen size (11) (Table 3). Despite not performing quite as well as PB, 3/16 and 3/8-cedar could be a viable substrate for Rudbeckia fulgida var. fulgida. The savings on substrate materials could make up for slightly less plant growth. Additionally, the decreased bulk density of cedar could decrease the cost of shipping finished products while smaller plant size might also allow for more plants to be shipped per load. Despite less growth, most plants were in marketable condition at the conclusion of the study (3 months). All cedar treatment plants were root bound to the container and plants grown in PB had the upper half of the container densely populated with roots (data not shown). Future studies could involve evaluating root growth of perennial crops grown in cedar-based substrates, alterations to cedar substrate pH, and mixing substrate particle sizes. This is encouraging for Plains states growers as they look for new sources of nursery substrate materials. Additionally property owners with large cedar populations could earn income from harvest and sale of eastern redcedar trees to horticultural industries. Literature cited:
1. Fonteno, W.C. and T.E. Bilderback. 1993. Impact of hydrogel on physical properties of coarse-structured horticultural substrates. J. Amer. Soc. Hort Sci. 118: 217-222.
2. Ganguli, A.C., D.M. Engle, P.M. Mayer, and E.C. Hellgren. 2008. Plant community diversity and composition provide little resistance to Juniperus encroachment. Botany 86: 1416-1426.
3. Gehring, J.L. and Bragg, T.B. 1992. Changes in prairie vegetation under eastern red cedar (Juniperus virginiana L.) in an eastern Nebraska Bluestem prairie. The American Midland Naturalist. 128(2): 209-217.
4. Griffin, J.J. 2009. Eastern red-cedar (Juniperus virginiana) as a substrate component for container production of woody plants. HortSci. 44:1131.
SNA Research Conference Vol. 56 2011
Container Grown Plants
239
5. Linneman J.S. and M.W. Palmer. 2006. The effect of Juniperus virginiana on plant species composition in an Oklahoma grassland. Community Ecology 7(2): 235-244.
6. Lu, W., J.L. Sibley, G.H. Gilliam, J.S. Bannon, and Y. Zhang. 2006. Estimation of U.S. bark generation and implications for horticulture industries. J. Environ. Hort. 24: 29-34.
7. Ortmann, J., J. Stubbendieck, R.A. Masters, G.H. Pfeiffer, and T.B. Bragg. 1998. Efficacy and costs of controlling eastern redcedar. J. of Range Mgmt. 51: 158-162.
8. Owensby C.E., K.R. Blan, B.J. Eaton, and O.G. Russ. 1973. Evaluation of Eastern redcedar infestations in the Northern Kansas Flint Hills. J. of Range Mgmt. 26: 256-259.
9. Starr, Z., C. Boyer, and J. Griffin. 2010. Growth of containerized Taxodium distichum in a cedar-amended substrate. Proc. Southern Nurs. Assoc. Res. Conf. (In Press)
10. Wright, R.D. 1986. The pour-thru nutrient extraction procedure. HortSci. 21: 227-229.
11. Yeager T. (editor). 2007. Best management practices: Guide for producing nursery crops. 2nd ed. The Southern Nursery Association, Atlanta, GA.
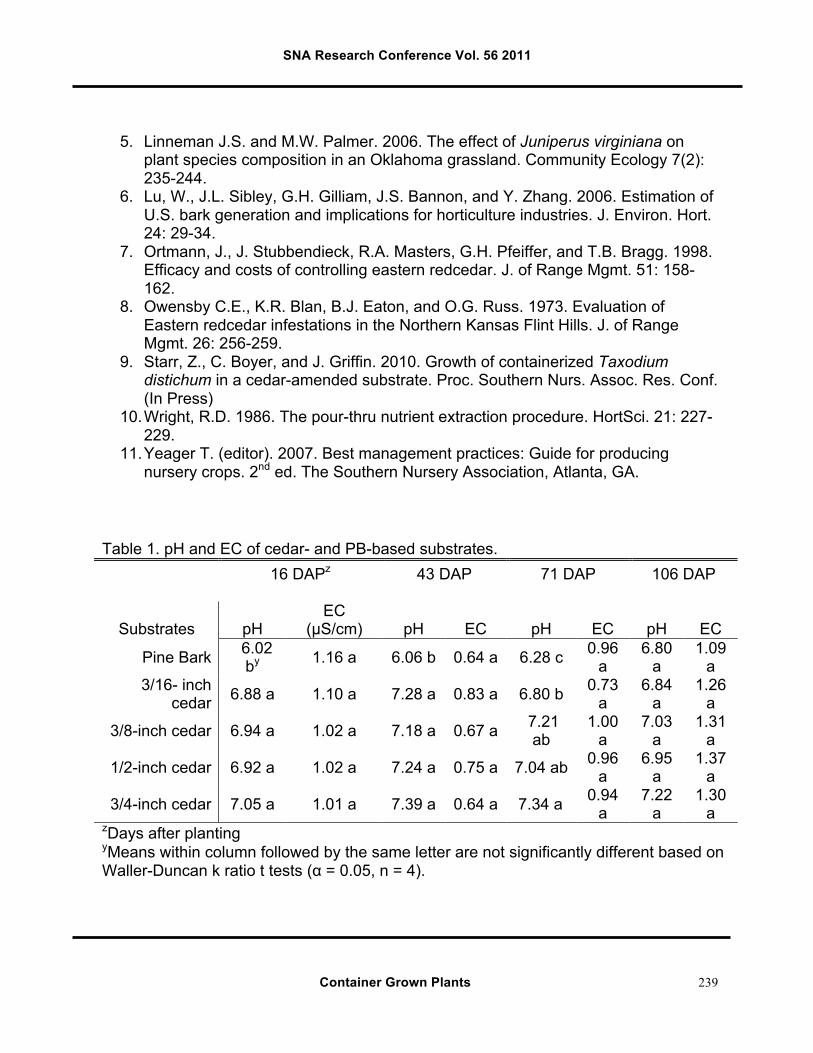
Table 1. pH and EC of cedar- and PB-based substrates. 16 DAPz 43 DAP 71 DAP 106 DAP
Substrates pH EC
(µS/cm) pH EC pH EC pH EC
Pine Bark 6.02 by 1.16 a 6.06 b 0.64 a 6.28 c 0.96
a 6.80
a 1.09
a 3/16- inch
cedar 6.88 a 1.10 a 7.28 a 0.83 a 6.80 b 0.73 a
6.84 a
1.26 a
3/8-inch cedar 6.94 a 1.02 a 7.18 a 0.67 a 7.21 ab
1.00 a
7.03 a
1.31 a
1/2-inch cedar 6.92 a 1.02 a 7.24 a 0.75 a 7.04 ab 0.96 a
6.95 a
1.37 a
3/4-inch cedar 7.05 a 1.01 a 7.39 a 0.64 a 7.34 a 0.94 a
7.22 a
1.30 a
zDays after planting yMeans within column followed by the same letter are not significantly different based on Waller-Duncan k ratio t tests (α = 0.05, n = 4).
SNA Research Conference Vol. 56 2011
Container Grown Plants
240
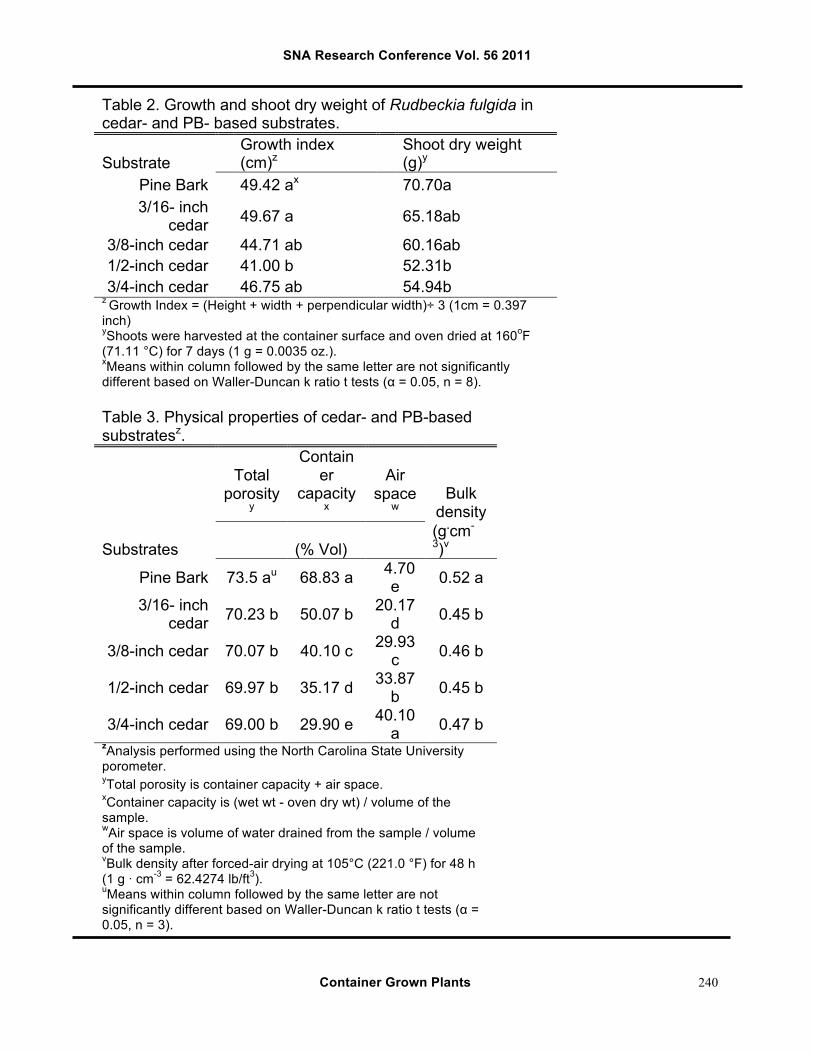
Table 2. Growth and shoot dry weight of Rudbeckia fulgida in cedar- and PB- based substrates.
Substrate Growth index
(cm)z Shoot dry weight (g)y
Pine Bark 49.42 ax 70.70a 3/16- inch
cedar 49.67 a 65.18ab
3/8-inch cedar 44.71 ab 60.16ab 1/2-inch cedar 41.00 b 52.31b 3/4-inch cedar 46.75 ab 54.94b
z Growth Index = (Height + width + perpendicular width)÷ 3 (1cm = 0.397 inch) yShoots were harvested at the container surface and oven dried at 160oF (71.11 °C) for 7 days (1 g = 0.0035 oz.). xMeans within column followed by the same letter are not significantly different based on Waller-Duncan k ratio t tests (α = 0.05, n = 8).
Table 3. Physical properties of cedar- and PB-based substratesz.
Total porosity
y
Container
capacityx
Air space
w Bulk
density
Substrates (% Vol) (g.cm-
3)v
Pine Bark 73.5 au 68.83 a 4.70 e 0.52 a
3/16- inch cedar 70.23 b 50.07 b 20.17
d 0.45 b
3/8-inch cedar 70.07 b 40.10 c 29.93 c 0.46 b
1/2-inch cedar 69.97 b 35.17 d 33.87 b 0.45 b
3/4-inch cedar 69.00 b 29.90 e 40.10 a 0.47 b
zAnalysis performed using the North Carolina State University porometer. yTotal porosity is container capacity + air space. xContainer capacity is (wet wt - oven dry wt) / volume of the sample. wAir space is volume of water drained from the sample / volume of the sample. vBulk density after forced-air drying at 105°C (221.0 °F) for 48 h (1 g · cm-3 = 62.4274 lb/ft3). uMeans within column followed by the same letter are not significantly different based on Waller-Duncan k ratio t tests (α = 0.05, n = 3).
SNA Research Conference Vol. 56 2011
Container Grown Plants
241
Cotton Amended Substrates: Wrinkle Free?
Elizabeth D. Bridges, Helen T. Kraus, Brian E. Jackson, and Ted E. Bilderback
Department of Horticultural Science North Carolina State University, Raleigh, NC 27695-7609
Index Words: substrate, cotton stalks, cotton gin, azalea, juniper Significance to Industry: Alternative substrates that replace pine bark (PB) completely or partially are needed as (PB) supplies are running short in some areas of the country and prices are increasing. Cotton stalks (CS) and cotton gin trash (CGT) are plentiful waste products of the cotton industry and have shown promise as substrate amendments. Substrates constructed from whole pine trees (PTS) have also shown promise as substrates. However, these cotton wastes have not been evaluated when mixed with pine tree based substrates. Shoot and root growth of azalea and juniper were greatest with PB amended with CGT and smallest with PTS amended with CGT. Substrate bases of PB and PTS blended with composted CS either with or without an additional Nitrogen (N) source produced similar shoot and root growth in both azalea and juniper. Nature of Work: The nursery industry in the southeast relies very heavily on PB as a substrate. PB is desirable because it is light in weight, well-drained, pathogen-free and disease suppressive. PB has been available as a waste product of the lumber industry; however, current forestry harvesting practices now recommend shredding the bark and small branches of pine trees after harvest and spreading these organic resources on the soil of the land where the trees were harvested. The 2008 Farm Bill included a component known as Biomass Crop Assistance Program (BCAP). This bill assists agricultural and forest land owners and operators in beginning an establishment and producing eligible crops that can be utilized as alternative fuel sources (1). The changes in the forestry industry and BCAP have led to a reduction in the availability of PB and an increase in price and now threaten the availability of the southeastern nursery industry’s growing substrate. The need for alternative substrates is becoming critical. Composted CS and composted CGT mixed with PB have shown promise as alternative substrates (2, 3). Cotton is very abundant in the southeast, comprising 2% of NC’s 9.7 billion dollar farm cash receipts and could be easily accessible to containerized plant growers (5). The objective of this experiment was to evaluate the growth of two woody plant species that have susceptibility to Phytophthora in six compost amended, PB based or PT based substrates grown under drip irrigation. This project is part of a larger goal to provide the nursery industry in the southeast with regionally available alternative potting substrates that will keep the industry competitive and continue demand for their products in the competitive nursery industry.
SNA Research Conference Vol. 56 2011
Container Grown Plants
242
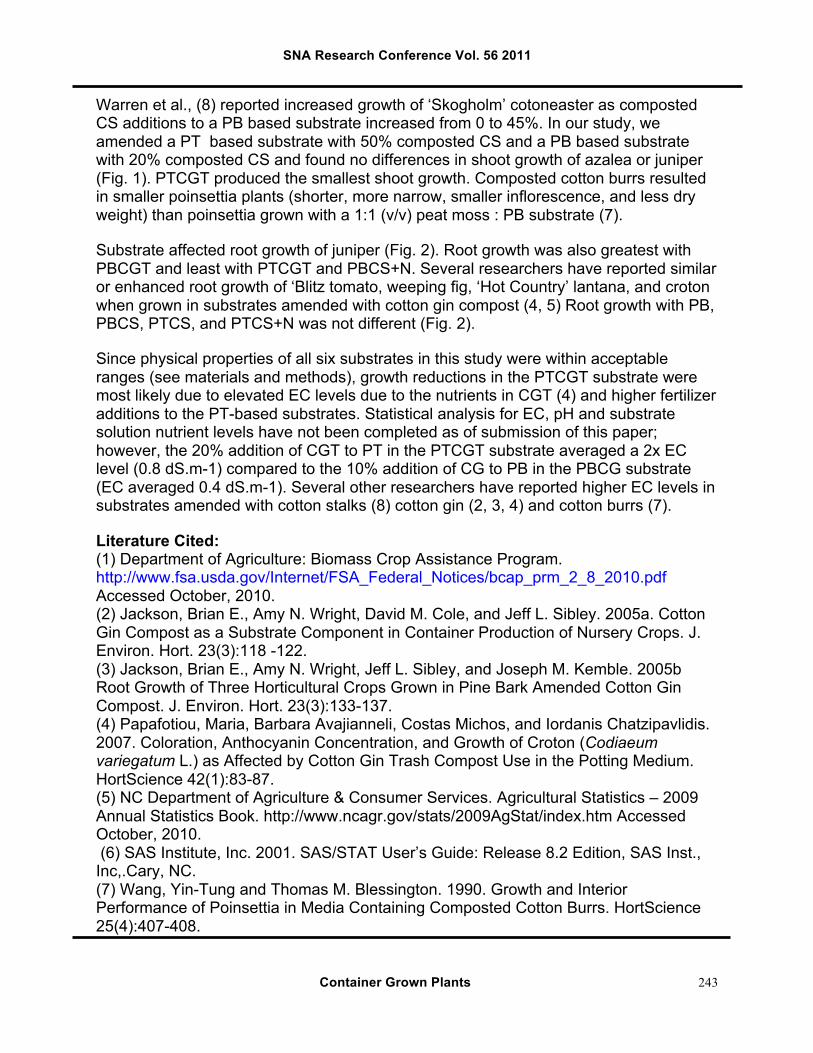
Rhododendron obtusum ‘Sunglow’ and Juniperus conferta ‘Blue Pacific’ were potted on May 7th, 2010 into 3 quart (2.8 L) black plastic containers filled with either PB or PT based substrates that had been amended (v/v) with cotton stalks composted without a N source (CS), cotton stalks composted with a N source (Daddy Pete’s Plant Pleaser, 0.5-0.5-0.5, Stony Point, NC) (CS+N), or cotton gin trash (CGT). The pine tree substrate base was produced from freshly harvested loblolly pine trees (Pinus taeda) that were delimbed, chipped, and ground in a hammer mill through a ¾ inch screen. A factorial treatment arrangement of these substrate bases (PB and PT) and amendments (CS, CS+N, and CGT) resulted in six substrates: 4:1 PB : CS (PBCS), 4:1 PB : CS+N (PBCS+N), 9:1PB : CGT (PBCGT), 1:1 PT : CS (PTCS), 1:1 PT : CS+N (PTCS+N), and 1:1 PT : CGT (PTCGT) arranged in a RCBD. Additions of CS, CS+N, and CGT were made to PB or PT to achieve similar water holding capacities. Total porosity (TP) (93-86%), airspace (AS) (39-26%), container capacity (CC) (61-54%), available water (AW) (25-21%), unavailable water (UW) (39-27%) and bulk density (BD) (0.26-0.12 g/cc3) of all six substrates were all within acceptable ranges for nursery crop production (10). An industry control of 100 % PB substrate (TP = 88%, AS = 32%, CC = 56%, AW = 16%, UW = 39%, BD = 0.23 g/cc3) was included in the experimental design for comparisons. All substrates were amended with 3.0 lbs/yd3 (1.4 kg.m3) dolomitic lime at mixing. On May 17th, PB-based substrates and the 100% PB control were topdressed with 2.6 g N [15 g (0.52 oz) fertilizer] and PT-based substrates were topdressed with 3.4 g N [20 g ( 0.71 oz) fertilizer] supplied by a polymer-coated, slow release fertilizer, 17-5-10 (17N-2.2P-0.83K) (Harrell’s, Sylacauga, AL). Higher fertilizer rates were used in the PT treatments based on previously published work indicating the fertilizer rates needed to be increased for PT-grown plants (1). Irrigation was applied by a low volume spray stake (PC Spray Stake, Netafim, Ltd., Tel Aviv, Israel) that delivered 3.2 GPH. Irrigation volume was managed to maintain a 0.2 leaching fraction (volume of leached / volume of applied) for each of the six substrates and the 100% PB control. Leaching fractions were measured from each substrate every two weeks and irrigation volume was adjusted accordingly. Additionally, substrate solution was collected every two weeks using the pour-through nutrient extraction method (9) and used to determine electrical conductivity (EC) and pH using a Hanna pH/EC meter (HI 8424, Hannah Instruments, Ann Arbor, MI). On August 26, plants were separated into shoots and roots. Roots of juniper only were washed to remove substrate. All plant parts were dried to a constant weight at 62°C. All variables were tested for differences using analysis of variance procedures and lsd means separation procedures (p >0.05) where appropriate (SAS, 2001). Results and Discussion: The species by substrate interaction was insignificant for shoot growth so the main effects of substrate and species will be discussed (data not presented). Shoot growth was not different between species (data not presented) while substrate did affect shoot growth (Fig. 1). Shoot growth was greatest with PBCGT (Fig. 1). Jackson (2) also reported similar or greater growth indices for ‘Winter Gem’ boxwood, ‘Firepower’ dwarf nandina, ‘Midnight Flare’ azalea, and ‘Renee Mitchell’ azalea grown in CGT amended substrates. There were no differences between shoot growth with PBCS+N, PB, PTCS, and PTCS+N (Fig. 1).
SNA Research Conference Vol. 56 2011
Container Grown Plants
243
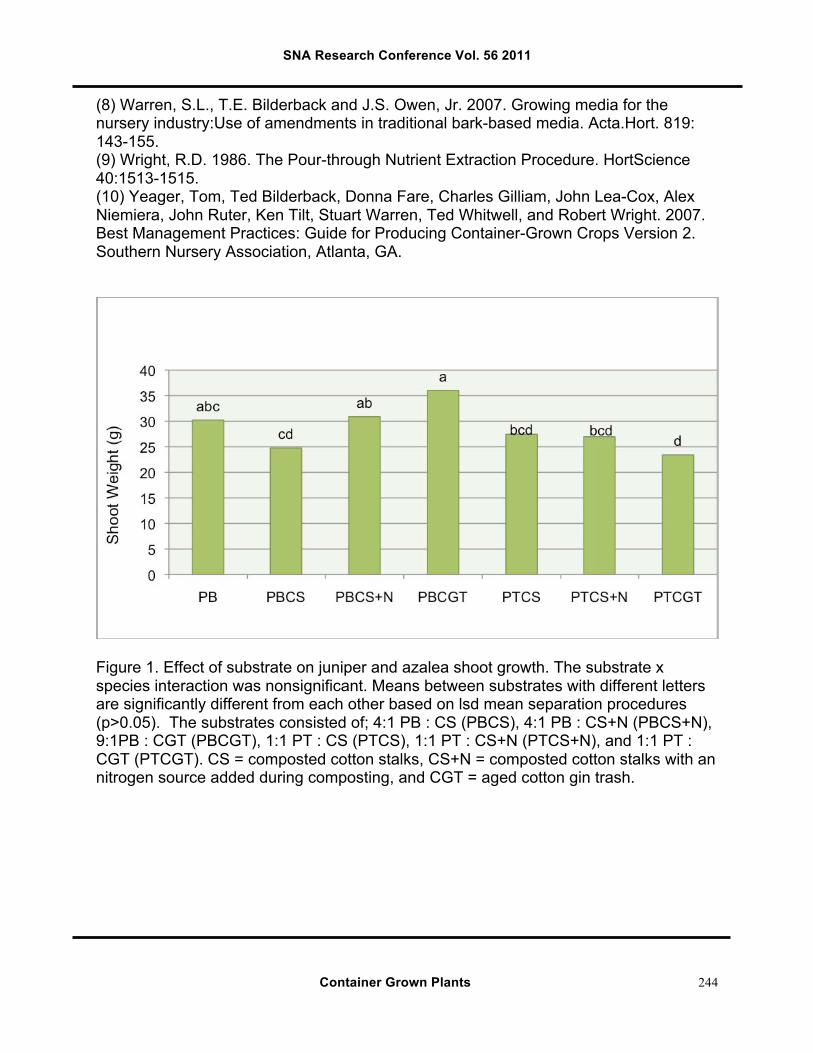
Warren et al., (8) reported increased growth of ‘Skogholm’ cotoneaster as composted CS additions to a PB based substrate increased from 0 to 45%. In our study, we amended a PT based substrate with 50% composted CS and a PB based substrate with 20% composted CS and found no differences in shoot growth of azalea or juniper (Fig. 1). PTCGT produced the smallest shoot growth. Composted cotton burrs resulted in smaller poinsettia plants (shorter, more narrow, smaller inflorescence, and less dry weight) than poinsettia grown with a 1:1 (v/v) peat moss : PB substrate (7). Substrate affected root growth of juniper (Fig. 2). Root growth was also greatest with PBCGT and least with PTCGT and PBCS+N. Several researchers have reported similar or enhanced root growth of ‘Blitz tomato, weeping fig, ‘Hot Country’ lantana, and croton when grown in substrates amended with cotton gin compost (4, 5) Root growth with PB, PBCS, PTCS, and PTCS+N was not different (Fig. 2). Since physical properties of all six substrates in this study were within acceptable ranges (see materials and methods), growth reductions in the PTCGT substrate were most likely due to elevated EC levels due to the nutrients in CGT (4) and higher fertilizer additions to the PT-based substrates. Statistical analysis for EC, pH and substrate solution nutrient levels have not been completed as of submission of this paper; however, the 20% addition of CGT to PT in the PTCGT substrate averaged a 2x EC level (0.8 dS.m-1) compared to the 10% addition of CG to PB in the PBCG substrate (EC averaged 0.4 dS.m-1). Several other researchers have reported higher EC levels in substrates amended with cotton stalks (8) cotton gin (2, 3, 4) and cotton burrs (7). Literature Cited: (1) Department of Agriculture: Biomass Crop Assistance Program. http://www.fsa.usda.gov/Internet/FSA_Federal_Notices/bcap_prm_2_8_2010.pdf Accessed October, 2010. (2) Jackson, Brian E., Amy N. Wright, David M. Cole, and Jeff L. Sibley. 2005a. Cotton Gin Compost as a Substrate Component in Container Production of Nursery Crops. J. Environ. Hort. 23(3):118 -122. (3) Jackson, Brian E., Amy N. Wright, Jeff L. Sibley, and Joseph M. Kemble. 2005b Root Growth of Three Horticultural Crops Grown in Pine Bark Amended Cotton Gin Compost. J. Environ. Hort. 23(3):133-137. (4) Papafotiou, Maria, Barbara Avajianneli, Costas Michos, and Iordanis Chatzipavlidis. 2007. Coloration, Anthocyanin Concentration, and Growth of Croton (Codiaeum variegatum L.) as Affected by Cotton Gin Trash Compost Use in the Potting Medium. HortScience 42(1):83-87. (5) NC Department of Agriculture & Consumer Services. Agricultural Statistics – 2009 Annual Statistics Book. http://www.ncagr.gov/stats/2009AgStat/index.htm Accessed October, 2010. (6) SAS Institute, Inc. 2001. SAS/STAT User’s Guide: Release 8.2 Edition, SAS Inst., Inc,.Cary, NC. (7) Wang, Yin-Tung and Thomas M. Blessington. 1990. Growth and Interior Performance of Poinsettia in Media Containing Composted Cotton Burrs. HortScience 25(4):407-408.
SNA Research Conference Vol. 56 2011
Container Grown Plants
244
(8) Warren, S.L., T.E. Bilderback and J.S. Owen, Jr. 2007. Growing media for the nursery industry:Use of amendments in traditional bark-based media. Acta.Hort. 819: 143-155. (9) Wright, R.D. 1986. The Pour-through Nutrient Extraction Procedure. HortScience 40:1513-1515. (10) Yeager, Tom, Ted Bilderback, Donna Fare, Charles Gilliam, John Lea-Cox, Alex Niemiera, John Ruter, Ken Tilt, Stuart Warren, Ted Whitwell, and Robert Wright. 2007. Best Management Practices: Guide for Producing Container-Grown Crops Version 2. Southern Nursery Association, Atlanta, GA.
Figure 1. Effect of substrate on juniper and azalea shoot growth. The substrate x species interaction was nonsignificant. Means between substrates with different letters are significantly different from each other based on lsd mean separation procedures (p>0.05). The substrates consisted of; 4:1 PB : CS (PBCS), 4:1 PB : CS+N (PBCS+N), 9:1PB : CGT (PBCGT), 1:1 PT : CS (PTCS), 1:1 PT : CS+N (PTCS+N), and 1:1 PT : CGT (PTCGT). CS = composted cotton stalks, CS+N = composted cotton stalks with an nitrogen source added during composting, and CGT = aged cotton gin trash.
SNA Research Conference Vol. 56 2011
Container Grown Plants
245
Figure 2. Effect of substrate on juniper root growth. Root dry weight was not determined for azalea. Means between substrates with different letters are significantly different from each other based on lsd mean separation procedures (p>0.05). The substrates consisted of: 4:1 PB : CS (PBCS), 4:1 PB : CS+N (PBCS+N), 9:1PB : CGT (PBCGT), 1:1 PT : CS (PTCS), 1:1 PT : CS+N (PTCS+N), and 1:1 PT : CGT (PTCGT). CS = composted cotton stalks, CS+N = composted cotton stalks with an nitrogen source added during composting, and CGT = aged cotton gin trash.
SNA Research Conference Vol. 56 2011
Container Grown Plants
246
Differences in Pour-through Results from Two Plant Species and a No-plant Control
Winston Dunwell, Carey Grable, Dwight Wolfe, and Dewayne Ingram1
University of Kentucky Research and Education Center, 1205 Hopkinsville St, Princeton, KY 42445
1University of Kentucky, N-308F Agri. Science Center, Lexington KY 40546-0091
[email protected] Index Words: PourThru, Pour-through, Pterostyrax hispida, Indigofera heterantha, Fertilization, Nursery
Significance to Industry: This research was performed to determine if mid-season low pour-through (PT) soluble salt readings are an indication that plant growth is a factor or that the fertilizer has all been released. The plant root system may expand to fill the pot and lead to higher fertilizer utilization efficiency. The data show that the soluble salt level of the leachate from the No-plant container followed the same pattern as the leachate from containers with plants. The 5-6 month controlled release fertilizer (CRT) no longer provided adequate levels of fertilizer after 13 weeks in western Kentucky. If additional growth is desirable additional fertilizer would need to be applied. Indigofera heterantha is in a genus recognized for drought tolerance (2,4) but observations indicate that in a container production system it is a heavy water user. Nature of Work: In western Kentucky, regardless of the longevity stated for a slow release fertilizer, we find that there is little or no soluble salt readings from PT taken in mid-summer following spring application. Dan Struve (5) stated that the plant root system would be filling the pot by that time and would be more efficient at removing fertilizer from the soil solution. Previous work attempting to retrieve all fertilizer prills to test for fertilizer remaining in mid-summer when the low soluble salts PT results occurred has not been successful. Including a container with no plant might give us an indication of whether there was still fertilizer being released to the soil solution. April 23, 2010, fifteen plants each of Pterostyrax hispida and Indigofera heterantha were transplanted from 3-gallon containers (Nursery Supplies, C300) to 7 gallon containers (WhiteRidge, LLC, 2358 l). The media was aged pine bark with no amendments. Fifteen 7-gallon containers filled with media without a plant were used as the No-plant control. Containers were set in TopHat™ Container Stabilizers to avoid blow over and fertilizer loss. Irrigation was provided via a single Agridor 4463 sprayer per container. Water was applied at 0900 and 1400 for 20 minutes each. Osmocote Plus 15-9-12 5-6 month was applied at 3.5 ounces per pot on June 9, 2010. The three treatments were allocated to the 45 containers in a generalized randomized block design with three treatments per row and three rows (blocks).
SNA Research Conference Vol. 56 2011
Container Grown Plants
247
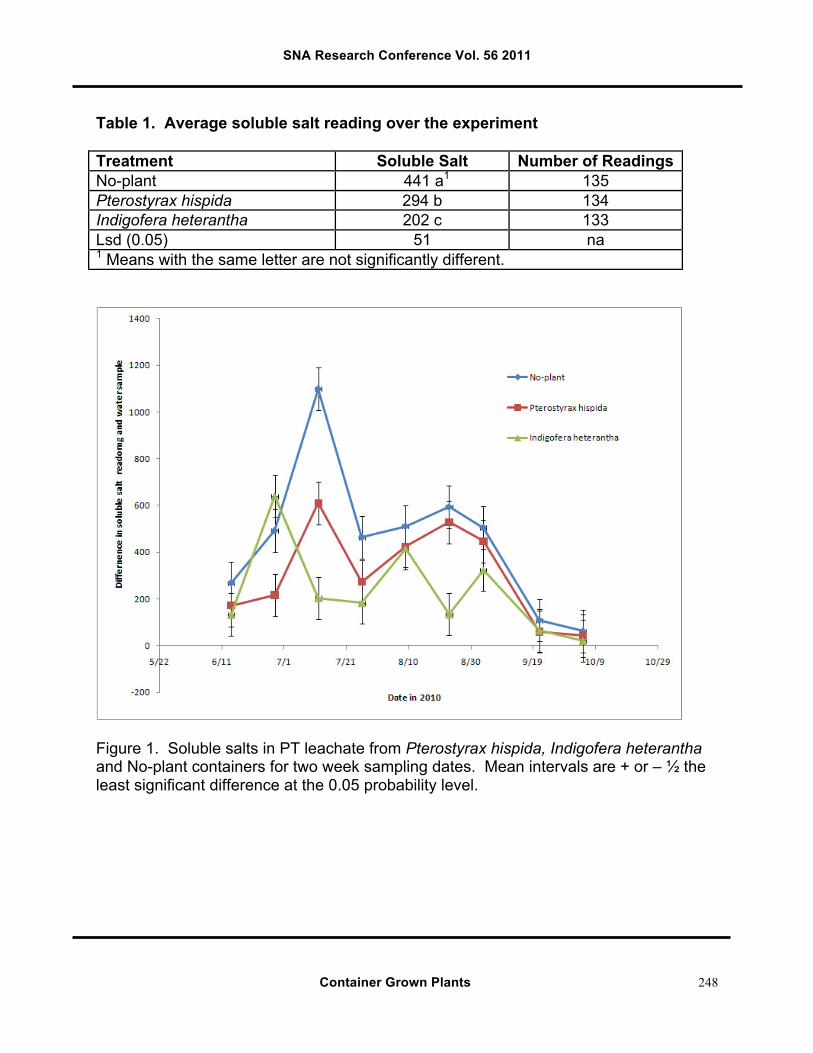
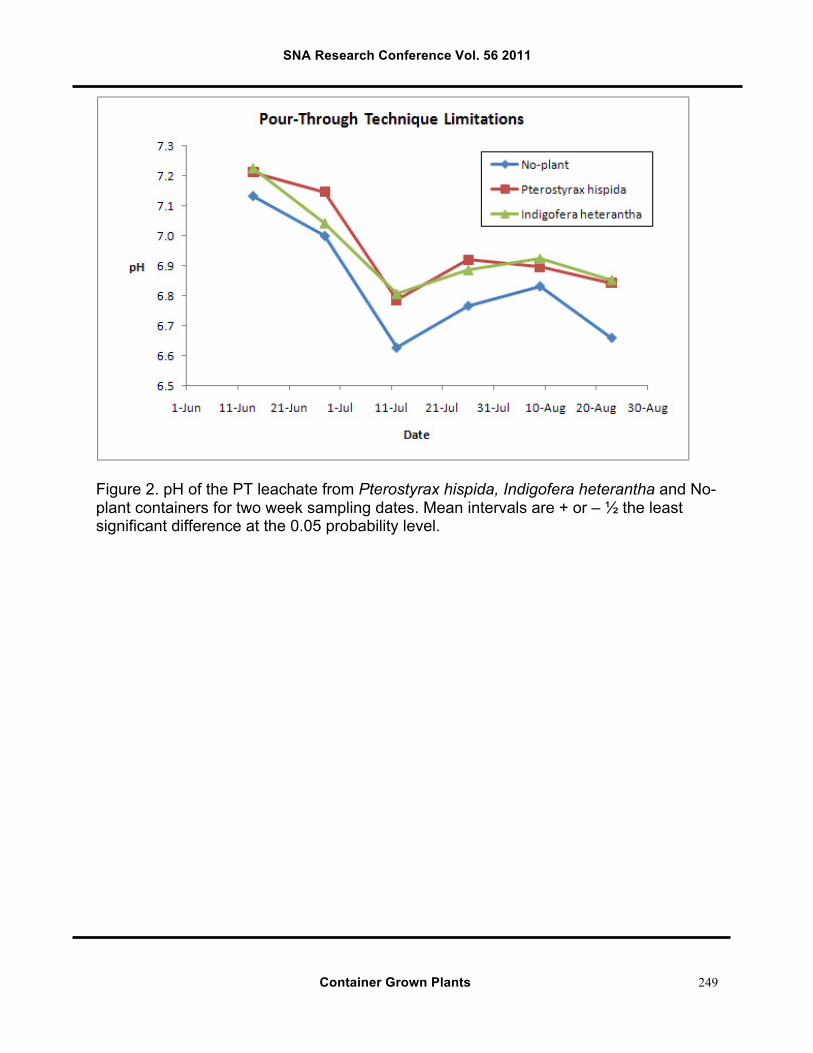
PT soluble salt reading and pH was recorded every two weeks from June 14, 2010 to October 4, 2010 by the Pour-Through-Extraction method (3). An additional irrigation emitter was added to the Indigofera heterantha, July 2, 2010, to ensure the amount of water leaching from a 500 ml application 30 minutes following an irrigation event was the equivalent to that of the No-plant and Pterostyrax hispida (1). Results and Discussion: Leachate salts averaged 441 µS/m for the no-plant control, 294 µS/m for the Pterostyrax hispida and 202 µS/m for Indigofera heterantha over the duration of the experiment and were significantly different from each other (Table 1). The peak level of soluble salts in the leachate for all treatments was one month after application, July 12, 2010. At that time the salt levels averaged 1099 µS/m for the No-plant control, 610 µS/m for the Pterostyrax hispida and 204 µS/m for the Indigofera heterantha. At the September 21, 2010 extraction the readings indicated that the fertilizer was less than the range, 200 to 500 µS/m (7), considered adequate for growth. Over the course of the study the pH of the leachate initially declined before leveling out in the range of 6.5 – 6.9 (Figure 2.). The pH levels inversely reflected the level of soluble salts in the leachate. The No-plant treatment pH was significantly lower that the Pterostyrax hispida and Indigofera heterantha for the duration. Measuring leachate pH was discontinued following the September 3 readings. Literature Cited
1. Ariana P. Torres, Michael V. Mickelbart, and Roberto G. Lopez. 2010. Leachate Volume Effects on pH and Electrical Conductivity Measurements in Containers Obtained Using the Pour- through Method.
2. Cecil, Ben. 2010. Personal Communication. 3. Dunwell, Win and Amy Fulcher. 2005. PourThru Extraction. 18 Nov. 2010
http://www.ca.uky.edu/HLA/Dunwell/PourThruExtract.html 4. Evans, Erv. 2010. Drought Tolerant Shrubs. 18 Nov. 2010.
http://www.ces.ncsu.edu/depts/hort/consumer/quickref/shrubs/shrubs-drought.html
5. Struve, Dan. 2010. Personal communication. 6. Wright, Robert D. 1986. The Pour-through nutrient Extraction Procedure.
HortScience 21(2):227-229. 7. Yeager, Tom, et.al. 2007. Best Management Practices: Guide for Producing
Nursery Crops, 2nd ed. Southern Nursery Assoc., Atlanta, GA.
SNA Research Conference Vol. 56 2011
Container Grown Plants
248
Table 1. Average soluble salt reading over the experiment Treatment Soluble Salt Number of Readings No-plant 441 a1 135 Pterostyrax hispida 294 b 134 Indigofera heterantha 202 c 133 Lsd (0.05) 51 na 1 Means with the same letter are not significantly different.
Figure 1. Soluble salts in PT leachate from Pterostyrax hispida, Indigofera heterantha and No-plant containers for two week sampling dates. Mean intervals are + or – ½ the least significant difference at the 0.05 probability level.
SNA Research Conference Vol. 56 2011
Container Grown Plants
249
Figure 2. pH of the PT leachate from Pterostyrax hispida, Indigofera heterantha and No-plant containers for two week sampling dates. Mean intervals are + or – ½ the least significant difference at the 0.05 probability level.
SNA Research Conference Vol. 56 2011
Container Grown Plants
250
Allelopathic Influences of Fresh and Aged Pine Needle Leachate on Germination of Lactuca sativa
Whitney G. Gaches, Glenn B. Fain, Donald J. Eakes, Charles H. Gilliam,
and Jeff L. Sibley
Department of Horticulture, Auburn University, 101 Funchess Hall, Auburn University, Alabama 36849
Significance to Industry: Previous work by the authors demonstrates increased plant growth response in aged WholeTree (WT) substrate as compared to fresh WT. The differences in the previous studies may be attributed to differences in substrate physical or chemical properties, day length, or temperature; however, another explanation could be a plant produced chemical present in the fresh WT, resulting in an allelopathic relationship between the substrate solution and the plant. Knowing the cause of the differences in plant growth in aged and fresh WT could provide insight to superior storage and handling requirements of the material. This study indicates that the plant-substrate interaction may be the result of pine-related chemicals still present in fresh WT. Nature of Work: The discoveries of plant – plant interactions are becoming more frequent as scientific technology improves. Scientists currently acknowledge inhibitory relationships between black walnut (Juglans nigra) and turf species (17); crabgrass (Digitaria sanguinalis) and agronomic crops such as cotton and peanuts (14); and apple (Malus spp.) and turf species (11), to name a few. Reduced plant growth in fresh WT substrate may be due to some type of chemical interaction between the milled pine tissues and young plants grown in such materials. Hans Molisch is considered the modern Father of Allelopathy, having coined the term in 1937 to refer to biochemical interactions between all types of plants including microorganisms (9). A more modern definition defines allelopathy as any direct or indirect harmful effect by one plant on another through production of chemical compounds that escape into the environment (12); however, in the more recent edition of his book, Rice refers back to Molisch’s original definition to allow the term allelopathy to include both harmful and beneficial interactions between plants and microorganisms (13). Several investigators have reported allelopathic effects of Pinus spp. on other plants. Nektarios et al. (10) reported the allelopathic potential of Pinus halepensis Mill. needles is greatest with fresh needles, moderate in senesced needles, and low in decaying needles in a bioassay using fresh, senesced, and decaying pine needle leachate with Avena sativa as the biosensor plant.
SNA Research Conference Vol. 56 2011
Container Grown Plants
251
The dynamics of ponderosa pine stands in North Dakota were studied to determine the influence of plant-produced chemicals on nitrification (8). Low levels of nitrate-nitrogen relative to ammonium-nitrogen and low numbers of Nitrosomas and Nitrobacter in the soils suggested that nitrification rates were low. This could not have been pH related as the soils were alkaline. Evidence in the study suggested that the reduction in nitrate synthesis was due to the production and subsequent transfer of allelochemicals to the soil. Several compounds inhibitory to nitrification were found in extracts from ponderosa pine needles, bark, and A-horizon soils (8). Work at the USDA Bureau of Soil demonstrated that various leachates of oak, pine, chestnut, tuliptree, dogwood, maple, and cherry were inhibitory to wheat seedling transpiration or growth (7, 16), but this work was never followed up. Whittaker and Feeny (19) identified five major categories of plant-produced chemical inhibitors: phenylpropanes, acetogenins, terpenoids, steroids, and alkaloids. Terpenoids, or terpenes, consist of five-carbon isoprene units linked together in various ways and with different types of ring closures, functional groups, and degrees of saturation (15). Monoterpenes consist of C10 hydrocarbons and are the major constituents of many pine resin oils (21). Potential sources of monoterpenes include leaf litter, canopy, and roots exudates. Leachate from pine leaf litter is thought to be the largest source of monoterpenes. As allelopathic agents, they are thought to inhibit plant growth and germination in several plant communities (21). In 1986, research was initiated on monoterpene inhibition of the nitrogen cycle (18). It was hypothesized that vegetation in ponderosa pine forests inhibited nitrification by releasing volatile terpenes that retarded the oxidation of ammonium. White used ‘trapped vapor’ experiments to assay the effects of vapors on nitrification in soils from burned plots. Soil from non-burned plots placed in sealed jars containing soil from burned plots reduced nitrification by 87%. A single water extraction of non-burned forest floor reduced nitrification by 17%. Vapors from a mixture of five major monoterpenes found in the pine resin completely inhibited nitrification (18). With new pine wood fiber alternative substrates (3, 4, 20, 22) becoming more available to growers, concern for potential growth inhibition due to phytotoxins and nitrogen tie-up is rising. A study by Gaches et al. (5) comparing two different wood fiber substrates demonstrated increased plant growth after substrates were stored for a period of time. A resulting study later reported increased plant growth response with greater growth indices, more blooms, and greater dry weights for greenhouse grown annuals when grown in aged WT as compared to fresh WT (6). Because WT composition is approximately 80% wood, 15% bark, and 5% needles (3), needles in the fresh WT could be releasing terpenes or other chemical compounds into the substrate solution, potentially inhibiting the nitrogen cycle and negatively affecting plant growth. A research proposal for a bioassay of fresh and aged pine needles was developed.
SNA Research Conference Vol. 56 2011
Container Grown Plants
252
A study was initiated on March 18, 2010. Fresh pine needles were collected directly from 12 year old loblolly pine trees (Pinus taeda L.) at the Mary Olive Thomas Forestry Research Plot in Auburn, Alabama. Aged pine needles were collected from the ground under the same pine trees. Procedures used in this bioassay followed the procedures outlined by Al Hamdi, et al. (1) and Nektarios et al. (10). Needles were immediately rinsed with distilled water. Two hundred needles each of fresh and aged were crushed with mortar and pestle and soaked in 600 mL of distilled water for 24 hours. On March 19, 2010 the samples were drained to obtain full-strength aged and fresh leachate, respectively. One germination sheet (Anchor Paper Company St. Paul, Minnesota) was placed in the bottom of a glass Petri dish. Five Lectuca sativa L. seeds were placed on each germination sheet, and another sheet placed on top of the seeds. Five mL of the appropriate solution was poured into each Petri dish. Each dish counted as one experimental unit. With two treatments and thirteen replications per treatment, there were a total of 26 experimental units. The Petri dishes were completely randomized, and placed in plastic zip bags and sealed to retain moisture, then placed in an incubator in the dark at 26°C for five days. After the incubation period, average germination percentage and average radicle length for seedlings in each Petri dish were calculated. All data were analyzed as a binomial in SAS 9.1 (SAS Institute Cary, North Carolina). Results and Discussion: There was no difference (P=1.00) in germination percentage for lettuce (Lactuca sativa L.) seeds between treatments; however, the radicle length of seeds germinated in aged needle leachate was greater (P=0.0062) than the radicle length of seeds germinated in fresh needle leachate. While seed germination was not inhibited by fresh pine needle leachate, post-germination growth of the seedlings was negatively affected in the presence of the fresh needle leachate. Results indicate that some chemical present in fresh pine needles may negatively affect radicle growth in fresh WT substrate. A comprehensive chemical analysis of fresh and aged pine needles should be executed in order to identify the types and concentrations of compounds present in pine needles. Once specific compounds (such as terpenes, alkaloids, etc.) are confirmed to be present in fresh loblolly pine needles, protocol can be developed to manipulate WT in order to obtain the best possible plant growth, possibly by storing fresh WT in order to allow the substrate to go through an initial heat, as described by Gaches et al. (6). For example, terpenes are volatile and heat has been shown to affect the loss of monoterpenes from pine leaf litter (21). Further investigation is necessary to understand plant – plant interactions associated with wood fiber substrates and develop protocol accordingly. Literature Cited
1. Al Hamdi, B., J., Inderjit, M. Olofsdotter J.C. Streibig. 2001. Laboratory bioassay for phytotoxicity: an example from wheat straw. Agron. J. 93:43-48.
2. Boyer, C.R. 2008. Evaluation of clean chip residual as an alternative substrate for container grown plants. Auburn University Dissertation. 204 Pages.
3. Boyer, C.R., G.B. Fain, C.H. Gilliam, T.V. Gallagher, H.A. Torbert, and J.L. Sibley. 2008. Clean chip residual: a substrate component for growing annuals. HortTechnology 18:423-43.
SNA Research Conference Vol. 56 2011
Container Grown Plants
253
4. Fain, G.B., C.H. Gilliam, and J.L. Sibley. 2006. Processed whole pine trees as a substrate for container-grown plants. SNA Res. Conf. Proc. 51:59-61.
5. Gaches, W.G., G.B. Fain, D.J. Eakes, C.H. Gilliam, and J.L. Sibley. 2010. A comparison of WholeTree and Chipped Pine Log substrate components in the production of greenhouse grown annuals. J. of Environ. Hort. 28:173-178.
6. Gaches, W.G., G.B. Fain, D.J. Eakes, C.H. Gilliam, and J.L. Sibley. 2010b. Comparison of aged and fresh WholeTree as a substrate component for production of greenhouse-grown annuals. J. of Environ. Hort. 29:39-44.
7. Livingston, B.C., C.A. Jensen, J.F. Breazeale, F.R. Pember, and J.J. Skinner. 1907. Further studies on the properties of unproductive soils. U.S. Department of Agriculture, Bureau of Soils Bulletin 36:1-71.
8. Lodhi, M.A.K. and K.T. Killingbeck. 1980. Allelopathic inhibition of nitrification and nitrifying bacteria in a ponderosa pine (Pinus ponderosa Dougl.) community. Amer. J. Bot. 67:1423-1429.
9. Molisch, H. 1937. “Der Einfluss einer Pflanze auf die andere-Allelopathie.” Fischer, Jena.
10. Nektarios, P.A., G. Economou, and C. Avgoulas. 2005. Allelopathic effects of Pinus halepensis needles on turfgrasses and biosensor plants. HortScience 40:246-250.
11. Pickering, S.V. 1919. The action of one crop on another. J. R. Hort. Soc. 43:372-380.
12. Rice, E.L. 1974. Allelopathy. Academic Press, New York. 13. Rice, E.L. 1984. Allelopathy: 2nd ed. Academic Press, New York. 14. Robinson, E.L. 1976. Effect of weed species and placement on seed cotton
yields. Weed Sci. 24:353-355. 15. Robinson, T. 1983. The organic constituents of higher plants. 5th Ed. Cordus -
ress, North Amherst, Massachusetts. 16. Schreiner, O. and J.J. Skinner. 1911. Lawn soils. U.S. Department of Agriculture,
Bureau of Soils Bulletin 75:1-55. 17. Stickney, J.S., and P.R. Hoy. 1881. Toxic action of black walnut. Trans. Wis.
State Hort. Soc. 11:166-167. 18. White, C.S. 1986. Volatile and water-soluble inhibitors of nitrogen mineralization
and nitrification in a ponderosa pine ecosystem. Biology and Fertility of Soils. 2:97-104.
19. Whittaker, R.H. and P.P. Feeney. 1971. Allelochemics: chemical interactions between species. Science 171:757-770.
20. Witcher, A.L., G.B. Fain, E.K. Blythe, and J.M. Spiers. 2009. The effect of nitrogen form on pH and petunia growth in a WholeTree substrate. Proc. Southern Nursery Assn. Res. Conf. 54:428-233.
21. Wood, S.E. 1996. Loss of foliar monoterpenes from Umbellularia californica leaf litter and their influence on nitrification potential in soil beneath the trees. University of California, Davis. 151 pages.
22. Wright, R.D. and J.F. Browder. 2005. Chipped pine logs: a potential substrate for greenhouse and nursery crops. HortScience 40:1513-1515.
SNA Research Conference Vol. 56 2011
Container Grown Plants
254
Parboiled Rice Hulls Effect on Physical Properties of Amended Pine Bark
Substrates During Long-term Nursery Crop Production
Celina Gómez and James Robbins University of Arkansas, Department of Horticulture, Fayetteville, AR 72701
Additional Index words: Container substrates, soilless medium, spirea Significance to the Industry: Parboiled rice hulls (PBH), which have not previously been investigated as an amendment for bark-based container media in long-term nursery crop production, appear to be an amendment for pine bark (PB). Based on our results, bark-based substrates in which up to 60% of the PB was replaced with PBH had physical properties that were generally within current guidelines for nursery container substrates after two growing seasons (67 weeks). Nature of work: The decline in the availability of PB supplies and increasing prices has caused concerns in the nursery industry. A greater shortage and inferior quality of PB are expected due to the increasing demand for wood-based materials to be used as biofuel (2). Research was conducted to evaluate the changes in physical properties of PB-based container substrates amended with PBH during long-term production cycles under outdoor nursery conditions. Six media substrates were formulated by blending PBH with pH-adjusted PB. Individual blends with 0%, 20%, 40%, 60%, 80%, or 100% PBH (by volume) were mixed in a Mitchell Ellis 1-cubic yard soil mixer (Mitchell Ellis, Semmes, AL) on 14 April 2009. Osmocote Plus (15N-3.9P-10K; 8-9 month, O.M. Scotts Horticulture Products, Marysville, OH) was pre-plant incorporated at rate of 12 lbs·yd-3 and added towards the end of the blending process. On 14 April, spirea (Spiraea × bumalda L. ‘Anthony Waterer’) liners (average 16-cm tall) were potted in # 5 plastic containers [(Classic 2000, Nursery Supplies Inc., Chambersburg, PA; 28.2-cm (h) × 29.2-cm (TD) × 24.5-cm (BD)]. Additional containers were filled with similar substrates but were left unplanted (fallow containers) to compare changes in physical properties with and without plants. Fallow containers were managed similarly as the containers with plants for the duration of the study. Containers were placed in two locations: gravel container beds at University of Arkansas Horticulture Research Farm in Fayetteville, AR (36°06'N,94°10'W) and Southwest Research and Extension Center at Hope, AR (33°42'N, 93°33'W). One week after planting all containers were treated with Pendulum® 2G herbicide (pendimethalin; BASF Corp., Research Triangle Park, NC) at a rate of 200 lbs·acre-1. During the growing season, containers were moved as needed so that the canopies did not overlap. Containers were placed pot-to-pot during the winter. On 13 April 2010, plants were re-fertilized (top-dressed) at a rate of 8.9 lbs·yd-3 with the same fertilizers as initially applied. Containers were overhead irrigated as needed depending on the
SNA Research Conference Vol. 56 2011
Container Grown Plants
255
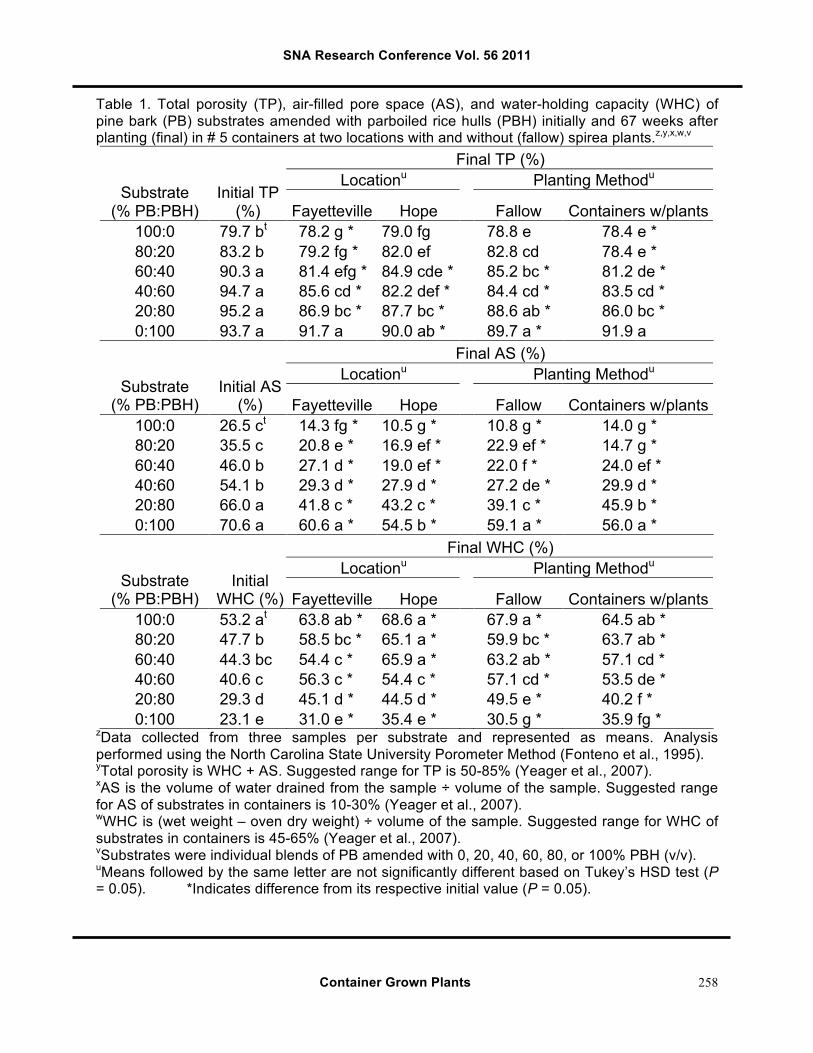
weather conditions for the length of the experiment. Sufficient water was applied for each substrate to return containers to CC providing a 20% LF. Physical Properties: initial. Immediately following the blending process, three random samples of each substrate were collected for further analysis. Air-filled pore space (AS; v/v), water-holding capacity (WHC; v/v), total porosity (TP; v/v), and dry bulk density (DBD; w/v), were determined by using air-dried substrate samples. Samples were rewetted to a moisture level of 50% (w/w) and allowed to equilibrate to attain moisture uniformity. Physical properties were determined on three replicate samples following the NCSU Porometer methods (4). Initial physical properties were subject to mean separation among substrates. Results were subjected to ANOVA and means were separated using Tukey’s HSD. Physical Properties: final. Root medium samples were collected from each container by manually separating the roots from the substrate. Three replicate samples of each substrate were obtained by mixing two containers together. Each replicate sample was used for physical properties analyses following the same procedures used for initial measurements. It is important to note that the final physical properties presented in this study are not representative of the physical conditions in the containers after 67 weeks under production conditions. Final physical properties were analyzed as a 6 × 2 × 2 factorial with six substrates, two planting methods (with plants or from fallow containers), and two locations (Fayetteville and Hope) arranged in a completely randomized design. Data were subjected to ANOVA and means were separated by Tukey’s HSD. Because initial data was not specific for a given location and/or planting method, significance for the change in physical properties over time was based on a 95% confidence interval (CI). The change over time was obtained by subtracting the final value from its respective initial value. If a CI did not overlap with zero, then a significant change over time (67 weeks) was considered. All data were analyzed with JMP 8 (SAS Institute, Inc., Cary, NC). Although final plant data were collected, only physical property data will be presented in this paper. Results and Discussion: Initial TP was highest in substrates with 40% to 100% PBH and all of these blends were above the recommended range (50-85%; 6) (Table 1). In most cases, TP significantly decreased during the experiment at both locations and regardless of the planting method. For each substrate, final TP over the 67 week of the experiment was not affected by location. In general, the presence of plants did not alter the TP of the substrates. At 67 WAP substrates with up to 60% PBH fell within the suggested range for container production (6). Initial AS increased as the percentage of PBH increased in the blends (Table 1). Overall, results suggested a significant decrease in AS over time. The suggested range for AS in container substrates is 10-30% (6). Initially, all substrates that contained PBH in the blend had AS percentages above the acceptable range. However, at 67 WAP substrates that contained up to 60% PBH fell within recommendations regardless of location and planting method.
SNA Research Conference Vol. 56 2011
Container Grown Plants
256
In the initial blends, WHC decreased as the percentage of PBH increased (Table 2); that trend was generally not affected over the 67 week period regardless of location and planting method. Overall, WHC significantly increased over time. Substrates with 40% and 80% PBH resulted in greater WHC in fallow containers than when plants were present; otherwise, the presence of plants did not alter final WHC for the different substrates. The suggested range for WHC of substrates used in containers is 45-65% (6). Initially, substrates with 60% or more PBH had WHC percentages below that range; however, at 67 WAP substrates that contained up to 80% PBH fell within or above the recommended range, suggesting an improvement in WHC over time with the addition of PBH to the blend. Initial DBD decreased as the percentage of PBH increase in the blend (Table 2). Dry bulk density significantly decreased over time for substrates with 0% and 20% PBH regardless of the location and planting method. In general, DBD in the different substrates was not affected by location nor planting method. The ideal DBD range is thought to be 0.19-0.70 g·cm-3 (6). By this standard, initial substrates with 40% or more PBH had a DBD below the ideal range. At 67 WAP only substrate with no addition of PBH from the Fayetteville location fell within the lower margin of the range. Initial results for the physical properties of the substrates suggested that in general, as PBH increased in the blends, TP and AS increased and consequently, WHC and DBD decreased. Similar results had already been reported for sphagnum peat-based substrates amended with PBH by Evans and Gachukia (3). They suggested that substrates containing up to 30% PBH had physical properties within the recommended ranges of container substrates, which is close to our results for the initial physical properties of the substrates. When looking at the final physical properties (at 67 WAP), results suggested a general decrease in TP and AS, and consequently, an increase in WHC over time. These results have been previously reported in pine tree substrates after 70 weeks of growing Contoneaster horizontalis perpusillis under nursery growing conditions (5). Changes in physical properties over time are related to the breakdown of the particles that reduces the AS within the substrate and increases its WHC. It is important to note that in contrast to what is expected to happen to the standard PB-substrate, physical properties of substrates amended with PBH seemed to improve over time. After 67 weeks, substrates with up to 60% PBH had physical properties that were generally within the sufficiency ranges used in container production (6). Similar to our results, previous work (1) had already suggested that the changes in physical properties of peat substrates that best related to the plant growth of Prunus × cistena sp. did not necessarily deteriorate over the 14 months of their study, but rather maintained or even improved.
SNA Research Conference Vol. 56 2011
Container Grown Plants
257
Literature Cited
1. Allaire-Leung, S.E., Caron, J. and L.E, Parent. 1999. Changes in physical properties of peat substrates during plant growth. Canadian J. of Soil Science. 79:137-139.
2. Day, M. 2009. Mulch producers tune into biofuel boom. Soil Mulch Producers News 3:1-3,16. Accesed on September 2, 2010. http://soilandmulchproducernews.com/archives/50-januaryfebruary-2009/117-mulch- producers-tune-into-biofuel-boom
3. Evans, M.R. and M.M. Gachukia. 2007. Physical properties of sphagnum peat-based root substrates amended with perlite or parboiled fresh rice hulls. HortTechnology 17:312-315.
4. Fonteno, W.C., C.T. Hardin, and J.P. Brewster. 1995. Procedures for determining physical properties of horticultural substrates using the NCSU Porometer. Horticultural Substrates Laboratory. North Carolina State University.
5. Jackson, B.E., R.D. Wright and J.R. Seiler. 2009. Changes in chemical and physical properties of pine tree substrate and pine bark during long-term nursery crop production. HortScience 44:791-799.
6. Yeager, T.H., D.C. Fare, J. Lea-Cox, J. Ruter, T.E. Bilderback, C.H. Gilliam, A.X. Niemiera, S.L. Warren, T.E. Whitwell, R.D. Wright, and K.M. Tilt. 2007. Best management practices: Guide for producing nursery crops. 2nd Ed. Southern Nurserymen’s Assoc., Marietta, GA.
SNA Research Conference Vol. 56 2011
Container Grown Plants
258
Table 1. Total porosity (TP), air-filled pore space (AS), and water-holding capacity (WHC) of pine bark (PB) substrates amended with parboiled rice hulls (PBH) initially and 67 weeks after planting (final) in # 5 containers at two locations with and without (fallow) spirea plants.z,y,x,w,v
Final TP (%) Locationu Planting Methodu
Substrate (% PB:PBH)
Initial TP (%) Fayetteville Hope Fallow Containers w/plants
100:0 79.7 bt 78.2 g * 79.0 fg 78.8 e 78.4 e * 80:20 83.2 b 79.2 fg * 82.0 ef 82.8 cd 78.4 e * 60:40 90.3 a 81.4 efg * 84.9 cde * 85.2 bc * 81.2 de * 40:60 94.7 a 85.6 cd * 82.2 def * 84.4 cd * 83.5 cd * 20:80 95.2 a 86.9 bc * 87.7 bc * 88.6 ab * 86.0 bc * 0:100 93.7 a 91.7 a 90.0 ab * 89.7 a * 91.9 a
Final AS (%) Locationu Planting Methodu
Substrate (% PB:PBH)
Initial AS (%) Fayetteville Hope Fallow Containers w/plants
100:0 26.5 ct 14.3 fg * 10.5 g * 10.8 g * 14.0 g * 80:20 35.5 c 20.8 e * 16.9 ef * 22.9 ef * 14.7 g * 60:40 46.0 b 27.1 d * 19.0 ef * 22.0 f * 24.0 ef * 40:60 54.1 b 29.3 d * 27.9 d * 27.2 de * 29.9 d * 20:80 66.0 a 41.8 c * 43.2 c * 39.1 c * 45.9 b * 0:100 70.6 a 60.6 a * 54.5 b * 59.1 a * 56.0 a *
Final WHC (%) Locationu Planting Methodu
Substrate (% PB:PBH)
Initial WHC (%) Fayetteville Hope Fallow Containers w/plants
100:0 53.2 at 63.8 ab * 68.6 a * 67.9 a * 64.5 ab * 80:20 47.7 b 58.5 bc * 65.1 a * 59.9 bc * 63.7 ab * 60:40 44.3 bc 54.4 c * 65.9 a * 63.2 ab * 57.1 cd * 40:60 40.6 c 56.3 c * 54.4 c * 57.1 cd * 53.5 de * 20:80 29.3 d 45.1 d * 44.5 d * 49.5 e * 40.2 f * 0:100 23.1 e 31.0 e * 35.4 e * 30.5 g * 35.9 fg *
zData collected from three samples per substrate and represented as means. Analysis performed using the North Carolina State University Porometer Method (Fonteno et al., 1995). yTotal porosity is WHC + AS. Suggested range for TP is 50-85% (Yeager et al., 2007). xAS is the volume of water drained from the sample ÷ volume of the sample. Suggested range for AS of substrates in containers is 10-30% (Yeager et al., 2007). wWHC is (wet weight – oven dry weight) ÷ volume of the sample. Suggested range for WHC of substrates in containers is 45-65% (Yeager et al., 2007). vSubstrates were individual blends of PB amended with 0, 20, 40, 60, 80, or 100% PBH (v/v). uMeans followed by the same letter are not significantly different based on Tukey’s HSD test (P = 0.05). *Indicates difference from its respective initial value (P = 0.05).
SNA Research Conference Vol. 56 2011
Container Grown Plants
259
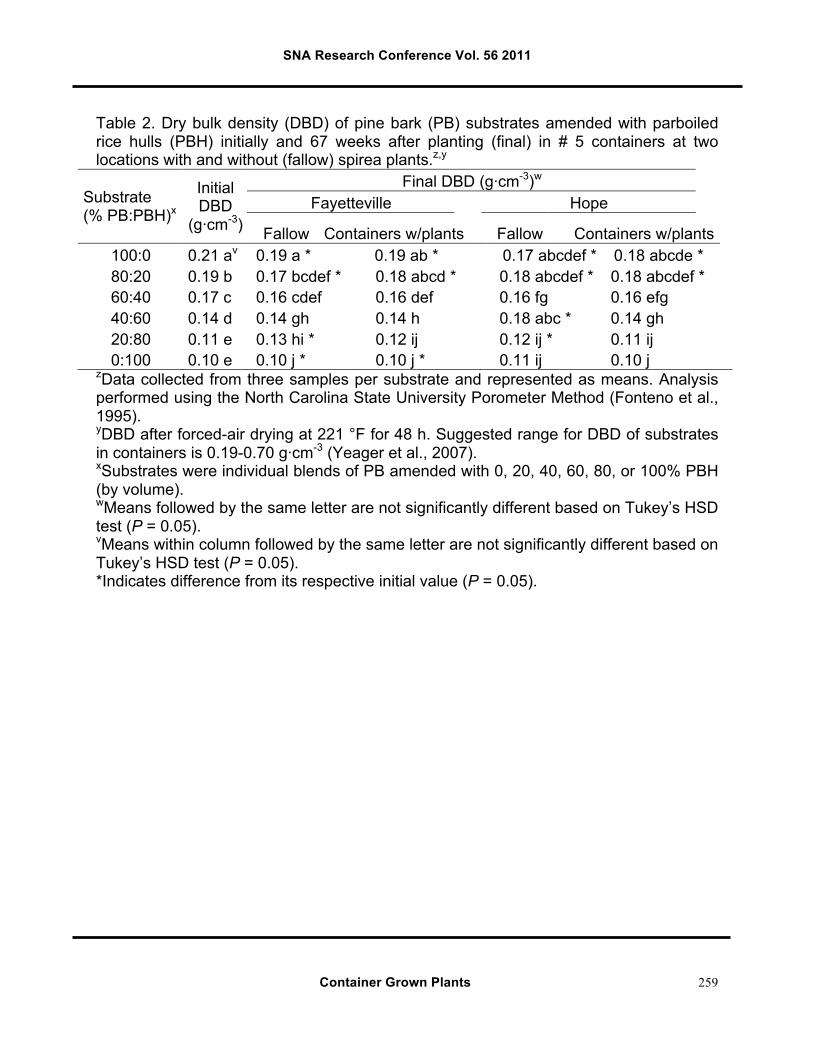
Table 2. Dry bulk density (DBD) of pine bark (PB) substrates amended with parboiled rice hulls (PBH) initially and 67 weeks after planting (final) in # 5 containers at two locations with and without (fallow) spirea plants.z,y
Final DBD (g·cm-3)w
Fayetteville Hope Substrate
(% PB:PBH)x
Initial DBD
(g·cm-3) Fallow Containers w/plants Fallow Containers w/plants 100:0 0.21 av 0.19 a * 0.19 ab * 0.17 abcdef * 0.18 abcde * 80:20 0.19 b 0.17 bcdef * 0.18 abcd * 0.18 abcdef * 0.18 abcdef * 60:40 0.17 c 0.16 cdef 0.16 def 0.16 fg 0.16 efg 40:60 0.14 d 0.14 gh 0.14 h 0.18 abc * 0.14 gh 20:80 0.11 e 0.13 hi * 0.12 ij 0.12 ij * 0.11 ij 0:100 0.10 e 0.10 j * 0.10 j * 0.11 ij 0.10 j
zData collected from three samples per substrate and represented as means. Analysis performed using the North Carolina State University Porometer Method (Fonteno et al., 1995). yDBD after forced-air drying at 221 °F for 48 h. Suggested range for DBD of substrates in containers is 0.19-0.70 g·cm-3 (Yeager et al., 2007). xSubstrates were individual blends of PB amended with 0, 20, 40, 60, 80, or 100% PBH (by volume). wMeans followed by the same letter are not significantly different based on Tukey’s HSD test (P = 0.05). vMeans within column followed by the same letter are not significantly different based on Tukey’s HSD test (P = 0.05). *Indicates difference from its respective initial value (P = 0.05).
SNA Research Conference Vol. 56 2011
Container Grown Plants
260
Response of Containerized Hydrangea macrophylla 'Endless Summer' to a Mineral-polyacrylate Substrate Amendment and Reduced
Overhead Water Application
Michael T. Kapsimalis, James S. Owen, Jr. and Heather M. Stoven Oregon State University, North Willamette Research and Extension Center
15210 NE Miley Rd. Aurora, OR 97002
James E. Altland USDA-Agricultural Research Service, Application Technology Research Unit
Wooster, OH 44691
Index Words: Water absorbent polymer, overhead irrigation, soilless substrate, Douglas fir bark Significance to Industry: Sphagnum peat prices are increasing and availability has been sporadic in recent years. Concurrently, fresh water for urban and agricultural use continues to become more limiting. The addition of polyacrylate is a potential alternative to peat that has been reported to increase crop water use efficiency. Four rates of a polyacrylate and 20% (by vol.) sphagnum peat were added to Douglas fir bark substrate to produce containerized Endless Summer hydrangea under normal and deficit irrigation. Decreased irrigation application rate linearly reduced hydrangea shoot growth 56% when the water applied to maintain a 0.50 leaching fraction (water leached from the container ÷ water applied to the container) was decreased by half. Both root and shoot dry weight responded curvilinearly to the addition of polyacrylate with maximum growth calculated at 3.9 and 4.0 kg⋅m-3, respectively. Hydrangea grown in fir bark amended with 4.7 kg⋅m-3 polyacrylate had the greatest root and shoot dry weight, which was comparable to hydrangea grown in the peat based substrate for both shoot and total dry weight. Nature of Work: Water absorbent polymer additives are used in soil, sand, compost and soilless substrate to increase water buffering capacity (time to wilt) and increase dry mass of vegetables, floriculture, woody ornamental and forestry crops (2,6). The increase in crop growth and yield has been attributed to the alteration of the physiochemical properties, specifically increased water and nutrient holding capacity (4). Conversely, plant availability of polyacrylate stored water, detrimental increase in field or container capacity, and alteration of salt concentration or nutrient availability have remained concerns for growers when using a water absorbent polymer (5). Sphagnum peat is readily utilized in greenhouse and nursery soilless substrates for production of woody ornamental and floriculture crops. The sustainability of peat remains in question, which has resulted in petitions for countries such as the United
SNA Research Conference Vol. 56 2011
Container Grown Plants
261
Kingdom to completely ban the extraction and sale of peat and replace it with cost effective alternatives (3). The similar properties, water holding capacity and nutrient retention of polyacrylate make it a potential replacement for peat. Furthermore, the addition of a polyacrylate to the substrate has the potential to conserve water because of reported increases in water buffering capacity allowing extended time between applications or reducing application volume (2). The objective of this study is to investigate hydrangea crop response to varying incorporation rates of polyacrylate under conventional and defecit irrigation. Hydrangea macrophylla (Thunb.) Ser. 'Endless Summer' was planted in a 6 L (GL600, #2, Nursery Supplies Inc., Chambersburg, PA) container in a Douglas fir bark [Pseudotsuga menziesii (Mirbel) Franco] based substrate on May 25, 2010. The experiment was arranged into a split-plot experiment with irrigation application rate as the main plot factor and mineral-polyacrylate water absorbent (Geohumus®, Geohumus North America LLC, San Francisco, CA) rate as the subplot factor. Irrigation application rates (1.0x, 0.75x, and 0.5x) were based on a bi-monthly maintenance of a 0.5 leaching fraction for hydrangea grown in the industry representative substrate containing 20% peat by vol. (control). Plants received daily overhead irrigation at 83 L•hr-1 and 163 L•hr-
1 (22 gph and 43 gph) (Matched Precipitation Rate Spray Nozzles, 10Q/10H, Rain Bird Corporation, Azusa, CA). Each irrigation rate was replicated three times and arranged in a completely randomized block design. The polyacrylate was incorporated in Douglas fir bark <10mm (<3/8 inch) at 0, 2.4, 4.7 and 7.1 kg•m-3 (0, 4, 8, 12 lb•yd-3). Each polyacrylate rate was replicated with five individual containers per irrigation plot and arranged in randomized block design within each irrigation plot. Substrate was amended with 0.9 kg•m-3 Nitroform® (Agrium, Loveland, CO), 0.9 kg•m-3 (1.5 lbs•yd-1) #10 Ag dolomite, 0.9 kg•m-3 (1.5 lbs•yd-1) 1.5 lbs/yd #65 Ag dolomite, and 0.9 kg•m-3 (1.5 lbs•yd-1) lbs gypsum. An 18-6-11 (18N-2.6P-9.1K) 9-month heterogeneous controlled release fertilizer (J.R. Simplot, Boise, ID) was incorporated at 5.9 kg•m-3 (10 lbs•yd-1) into the soilless substrate before planting. Monthly pour-throughs were conducted to monitor substrate pH and electrical conductivity (EC) as described by Wright (7). To determine substrate physical properties the following procedure was followed: soilless substrates were adjusted to approximately1.5 g•g-1 mass wetness, mixed with polyacrylate, and packed in aluminum cylinders 3.8 cm tall with 7.6 cm inside diameter (1). Aluminum cores were overhead irrigated for 4 days before being attached to North Carolina State University Porometers™ for determination of air space (AS). Cores were oven dried at 110°C (230°F) to determine container capacity (CC). Total porosity (TP) was calculated from the sum of AS and CC. All physical properties (TP, AS, CC) were calculated for the algebraic mean of the column. Bark bulk density (Db) was calculated as g•cm-3 on both a dry and wet basis. Hydrangea were harvested on September 22, 2010. Shoot dry weight was obtained for three replicates of each polyacrylate rate within each irrigation rate. Shoot dry weight was analyzed with SAS 9.2 (Cary, NC) using PROC MIXED. Three replicates of roots were washed, dried, and weighed for each polyacrylate rate within the 0.75x irrigated
SNA Research Conference Vol. 56 2011
Container Grown Plants
262
blocks. Root and shoot data within 0.75x irrigation rate was subjected to univariate analysis of variance (ANOVA) to investigate the impact of water absorbent on plant carbon allocation. Substrate physical properties were analyzed with multivariate analysis of variance (MANOVA) using Wilk’s lambda for the test statistic to determine the influence of main effects on composite substrate physical properties. ANOVA was used to determine influence of main effects on individual parameters. Linear and curvilinear trends of plant dry mass were analyzed using contrast statements. Means separation with Fisher’s protected least significant difference test (α = 0.05) were used where appropriate. Results and Discussion: The mixed model analysis used to analyze the main effects of irrigation application rate and polyacrylate water absorbent amendment rate on crop shoot growth revealed significant main effects, however there was no significant interaction. The mean pH and electrical conductivity across all treatments was 5.3 and 1.72 d•Sm-1, respectively. Over the period of one growing season, reduced or deficit water application on hydrangea was not overcome by the addition of polyacrylate. Hydrangea shoot dry mass linearly increased (p=0.036) from 33, 50, to 53 g with increasing irrigation applicate rate of 0.5x, 0.75x and 1.0x, respectively. At the 0.75x irrigation rate both root and shoot dry weight responded curvilinearly to the addition of the polyacrylate to the substrate. Maximum hydrangea root and shoot growth was calculated at incorporation of 3.9 and 4.0 kg⋅m-3, respectively, of the polyacrylate into the substrate. Hydrangea grown in substrate amended with 4.7 kg⋅m-3 of the polyacrylate had the greatest root, shoot and total dry weight, which was comparable to peat for both shoot and total dry weight (Table 1). Root to shoot ratio was comparable across polyacrylate substrate treatments, however plants grown in peat amended substrate had a reduced root to shoot ratio. Johnson and Piper (4) also found that water absorbent polymers increased shoot weight as well as fruit yields. In tomato, shoot dry weight increased in response to polyacrylate additions and fruit yield also increased ≈50% when grown in sand. The addition of a polyacrylate increased the ability of the bark substrate to hold water and inversely decreased air space. Polyacrylate incorporated in the substrate at a rate of 7.1 kg⋅m-3 had 54% CC and 32% AS, whereas bark alone (no polyacrylate) resulted in 20% decreased container capacity and 46% air space (Table 2). An addition of peat (20% by vol) to bark substrate resulted in equal CC, AS and bulk density (wet or dry basis) as bark amended with 7.1 kg•m-3 polyacrylate. The dry bulk density was unaffected by substrate treatment, however wet bulk density linearly increased with the addition of polyacrylate. Although the addition of polyacrylates showed an increase in CC, plant water availability of the water held within the matrix of the polyacrylate is unknown. Continued research is needed to investigate alternatives to peat and methods to reduce water in both nursery and greenhouse industry. Although the addition of a polyacrylate did not increase plant growth in reduced water situations,
SNA Research Conference Vol. 56 2011
Container Grown Plants
263
under conventional irrigation application rates, the polyacrylate increased shoot growth when compared to Douglas fir bark alone and was comparable to peat when incorporated at a rate of 4.7 kg⋅m-3. Further investigation is needed to examine the effect of a polyacrylate on crop water availability as well as their effect on plants with varying levels of water tolerance. Acknowledgements: Geohumus® and Oregon Department of Agriculture provided funding for this research. We would like to thank Bailey Nurseries Inc. for donating materials and Sarah Sydow for providing technical assistance. Literature Cited 1. Fonteno, W.C. and T.E. Bilderback. 1993. Impact of hydrogel on physical properties of coarse structured horticultural substrates. J. Amer. Soc. Hort. Sci. 118: 217-222. 2. Gehring, J.M. and Lewis, A.J. III. 1980. Effect of Hydrogel on Wilting and Moisture Stress of Bedding Plants. J. Amer. Soc. Hort. Sci. 105:511-513. 3. GoPetition. July 2, 2007. Total ban on peat extraction in the UK. James, Nathan. http://www.gopetition.com/petitions/total-ban-on-peat-extraction-in-the-uk.html 4. Johnson, M.S. and Piper C.D. 1997. Cross-linked, Water-Storing Polymers as Aids to Drought Tolerance of Tomatoes in Growing Media. J. Agron. Crop Sci. 178:23-27. 5. Wang, Yin-Tung and Gregg, Lori L. 1990. Hydrophilic Polymers – Their Response to Soil Amendments and Effect on Properties of a Soilless Potting Mix. J. Amer. Soc. Hort. Sci. 115(6): 943-948. 6. Woodhouse, J. and Johnson, M.S. 1991. Effect of super absorbent polymers on survival and growth of crop seedlings. Agric. Water Manage. 20:63-70. 7. Wright, R.D. 1986. The pour-through nutrient extraction procedure. HortScience 21:227-229.
SNA Research Conference Vol. 56 2011
Container Grown Plants
264
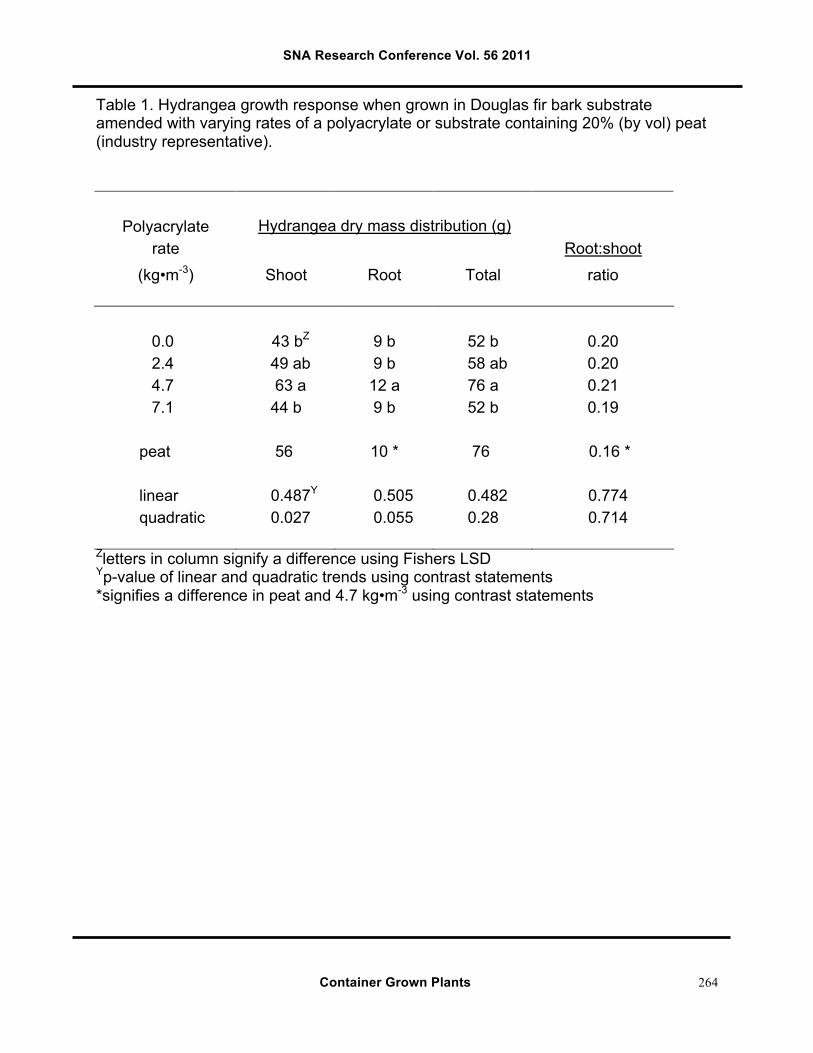
Table 1. Hydrangea growth response when grown in Douglas fir bark substrate amended with varying rates of a polyacrylate or substrate containing 20% (by vol) peat (industry representative).
Polyacrylate Hydrangea dry mass distribution (g) rate Root:shoot
(kg•m-3) Shoot Root Total ratio
0.0 43 bZ 9 b 52 b 0.20 2.4 49 ab 9 b 58 ab 0.20 4.7 63 a 12 a 76 a 0.21 7.1 44 b 9 b 52 b 0.19
peat 56 10 * 76 0.16 * linear 0.487Y 0.505 0.482 0.774 quadratic 0.027 0.055 0.28 0.714
Zletters in column signify a difference using Fishers LSD Yp-value of linear and quadratic trends using contrast statements *signifies a difference in peat and 4.7 kg•m-3 using contrast statements
SNA Research Conference Vol. 56 2011
Container Grown Plants
265
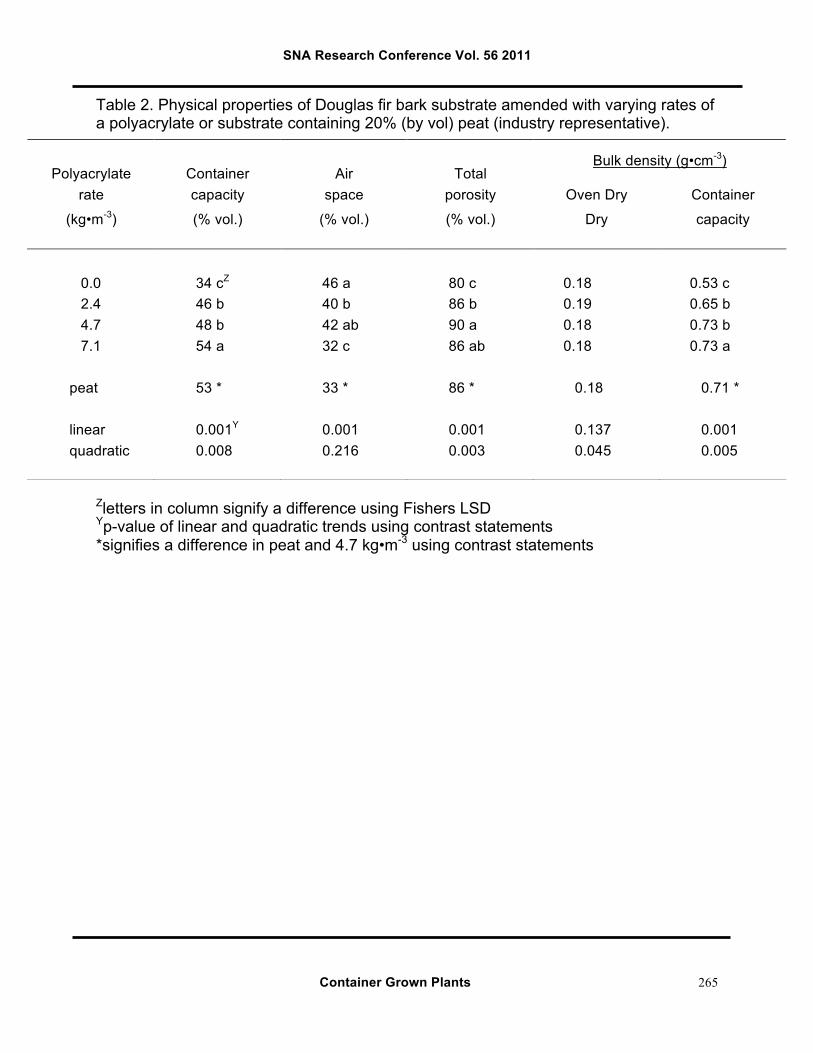
Table 2. Physical properties of Douglas fir bark substrate amended with varying rates of a polyacrylate or substrate containing 20% (by vol) peat (industry representative).
Zletters in column signify a difference using Fishers LSD Yp-value of linear and quadratic trends using contrast statements *signifies a difference in peat and 4.7 kg•m-3 using contrast statements
Polyacrylate Container Air Total
Bulk density (g•cm-3)
rate capacity space porosity Oven Dry Container
(kg•m-3) (% vol.) (% vol.) (% vol.) Dry capacity
0.0 34 cZ 46 a 80 c 0.18 0.53 c 2.4 46 b 40 b 86 b 0.19 0.65 b 4.7 48 b 42 ab 90 a 0.18 0.73 b 7.1 54 a 32 c 86 ab 0.18 0.73 a
peat 53 * 33 * 86 * 0.18 0.71 * linear 0.001Y 0.001 0.001 0.137 0.001 quadratic 0.008 0.216 0.003 0.045 0.005
SNA Research Conference Vol. 56 2011
Container Grown Plants
266
Use of Neem Cake as an Organic Substrate Component
Cody W. Kiefer, Jeff L. Sibley, Dexter B. Watts, H. Allen Torbert, Glenn B. Fain, Charles H. Gilliam
Auburn University Department of Horticulture
101 Funchess Hall, Auburn University, AL 36849
Index Words: neem, urease, nitrification Significance to Industry: Nursery and greenhouse growers continue to seek materials to decrease costs of plant production while maintaining environmental stewardship. Incorporation of neem cake as a substrate component could potentially impact nitrogen release as a result of altering substrate bacterial activity. This preliminary study investigates the impact of neem on substrate gas release and provides a starting point to further investigation regarding neem use as a substrate component. Nature of Work: Fertilizer is an expensive part of any nursery’s program and environmental safety is becoming an increasingly important subject. Therefore, any cost-effective method that can reduce the volume of fertilizer needed is a valuable product. Now the question arises: How is fertilizer lost? Nitrogen is often viewed as the “limiting factor” in plant nutrition, and while there are many forms or sources of nitrogen, our study focused specifically on urea. Urea breaks down into ammonium with the aid of an enzyme known as urease. Ammonium then further breaks down into ammonia, which then undergoes volatilization. Therefore, slowing down this catalysis of urea could, in theory, prolong substrate nitrogen supplies. Since urease in soil is a byproduct of bacteria, limiting urease production by affecting the enzyme itself or its bacterial producers could inhibit the breakdown of urea. Neem cake (neem) is a product derived from Azadirachta indica (the neem tree). With over 140 chemical compounds isolated from the neem tree, uses for neem have been numerous (everything from an analgesic to an anti-fungal and insecticidal agent) (1). One chemical in particular is azadirachtin, a compound found in many insecticides used in the United States. Only a few studies have evaluated neem products’ effect on nitrification within mineral soils. Mohanty et al (5) reported on the potential inhibitory effects of neem seed kernel powder on urease in three mineral soils native to India, showing slight suppression of urease activity when applied to acidic soils. Méndez-Bautista et al (4) studied the effects of neem leaf extracts on greenhouse gas emissions and inorganic nitrogen in urea-amended soil and reported that the leaf extract had no significant effect on urease, but may limit nitrification. Majumdar et al (3) coated urea with neem before adding to rice fields in North India, resulting in slight nitrification inhibition. Kumar et al (2) used neem oils to coat urea and added it to sandy-loam soils resulting in some nitrification inhibition as well.
SNA Research Conference Vol. 56 2011
Container Grown Plants
267
Mineral soils and soilless potting media, though, are two different worlds. Therefore, we tested neem’s effect on urea within a standard pine bark mix. The study consisted of three groups of treatments: pine bark (PB) + neem, PB + poultry compost (PC) + neem and PB + PC + urea + neem. Within each of these groups are several treatments with varying concentrations of neem and/or fertilizer. Within the PB + neem group are four pine bark treatments containing 0, 1, 2 and 3 percent neem. The second group also contains four treatments, but also included 20 percent poultry compost in the pine bark media and the same percentages of neem (0, 1, 2 and 3 percent). Group three contained the same pine bark and poultry compost stock mix as in group two, with the addition of Scott’s Osmocote Classic 19-6-12 at nine pounds per cubic yard. Each of the twelve treatments contained four replicates for a total of 48 experimental units. The substrate was placed in trade-gallon containers without plants and placed in a glass greenhouse at the USDA Soil Dynamics Laboratory, Auburn University, Alabama. The substrates were watered as needed, but without leaching. Moist conditions were necessary to mimic rhizosphere microenvironments in order to facilitate microbial growth. Data were taken at regular intervals beginning in May 2010 and ended in August 2010. Data was collected for 3 days per week for the first two weeks and then once per week for the next 7 weeks. After that, data was collected once every two weeks. In order to determine substrate microbial activity, we relied on a secondary factor, gas emissions. Data collection consisted of an airtight gas chamber large enough to accommodate one pot each. The top of the gas chamber was outfitted with a rubber septum through which a needle could penetrate. Four evacuated collection vials were needed for each experimental unit, each one representing a time within the 15 minutes of collection (times 0, 1, 2 and 3 represent initial time and 5, 10 and 15 minutes, respectively). Gas samples were pulled for each experimental unit for each of the aforementioned times and results were analyzed using a gas chromatograph. Constituents of the gas samples tested for were: carbon dioxide (CO2), methane (CH4) and nitrous oxide (N2O), which will be representative of microbial respiration. Acid-coated glass tubes were also placed in hangers inside of each gas chamber to absorb any volatilized ammonia released from the substrate. Volatized ammonia, though, will not be presented in this paper. CO2, CH4 and N2O data were analyzed using Tukey’s Studentized Range Test in SAS Statistical Software (P = 0.05). Results and Discussion: Overall: Notation for reporting data will adhere to the following guidelines: PB is pine bark; PC is poultry compost; fertilizer will refer to the Osmocote 19-6-12 urea; and when entire groups of treatments are referenced, the values that follow are given chronologically within the group’s treatments. The unit for gas emission values is µmol trace gas m-2 min-1. All data is presented in Table 1. Carbon Dioxide (CO2): Increasing neem percentage (by volume) as a potting media component appeared to increase CO2 production. However, in the PB + neem treatments, there is no statistical difference among treatments. Within the PB + PC + neem group, the 3% neem treatment (247.27) is statistically larger than the 0% neem treatment (125.94). However, there is no statistical difference among treatments in the PB + PC + fertilizer + neem group.
SNA Research Conference Vol. 56 2011
Container Grown Plants
268
Across all groups, PB + PC +3% neem (247.27) has the highest value for CO2 production, though it is not statistically different than: PB + PC + 1 and 2% neem (172.01 and 198.01, respectively). The PB + 0% neem treatment had the lowest value for carbon dioxide (53.61), but was not statistically different than: any of the PB + neem treatments (85.39, 97.51 and 126.86), PB + PC + 0% neem (125.94), or PB + PC + fertilizer + 0% neem (142.82). Methane (CH4): Methane’s relation to neem percentage does not seem to be as clear-cut as with carbon dioxide. Three percent neem used in conjunction with PB + PC is significantly higher than no neem in the same mixture (0.04150 and -0.00494, respectively). There was no significant difference in methane levels among treatments within the other two groups tested. Again, among all groups PB + PC + 3% neem had the highest methane value (0.04150), but is not significantly different than: PB + 0 and 2% neem (0.01768 and 0.00279, respectively), PB + PC + 1 and 2 % neem (0.01426 and 0.02995, respectively) or PB + PC + fertilizer + 1, 2 and 3 % neem (0.01013, 0.00687 and 0.01235, respectively). The PB + PC + 0% neem had the lowest value for methane across all treatments (-0.00494), but was not statistically different from any treatment other than PB + PC + 3% neem (0.04150). Nitrous Oxide (N2O): Nitrous oxide results yield that there are no statistical differences among treatments within the PB + neem group (0.0008, 0.0013, 0.0003 and 0.0006) or the PB + PC + neem group (0.0394, 0.0442, 0.1299 and 0.0993). The PB + PC + fertilizer + neem group, though, shows that 3% neem (1.7349) is significantly higher than 0 and 1% neem (1.0294 and 1.0998, respectively). Across all treatments, 3% neem in PB + PC + fertilizer (1.7349) is significantly higher than all other treatments, other than 2% neem in PB + PC + fertilizer (1.1539). PB + PC + fertilizer + 2% neem is higher than all treatments from the PB + neem and PB + PC + neem groups. The 0 and 1% neem treatments within the PB + PB + fertilizer group (1.0294 and 1.0998, respectively) are also statistically higher than all treatments within the PB + neem and PB + PB + neem groups. In summary, that data presented in this paper do not arrive to a clear conclusion. Studies to determine the fate of urease when neem is added are ongoing, with some supplemental data not having been analyzed yet. It seems reasonable to conclude that based on the presented data, neem does have an effect on soil respiration, though more testing to prove the extent to which this occurs is currently underway. Current testing includes the aforementioned acid-coated tubes for ammonia volatilization, pH and EC, as well as nutrient composition of the different treatments.
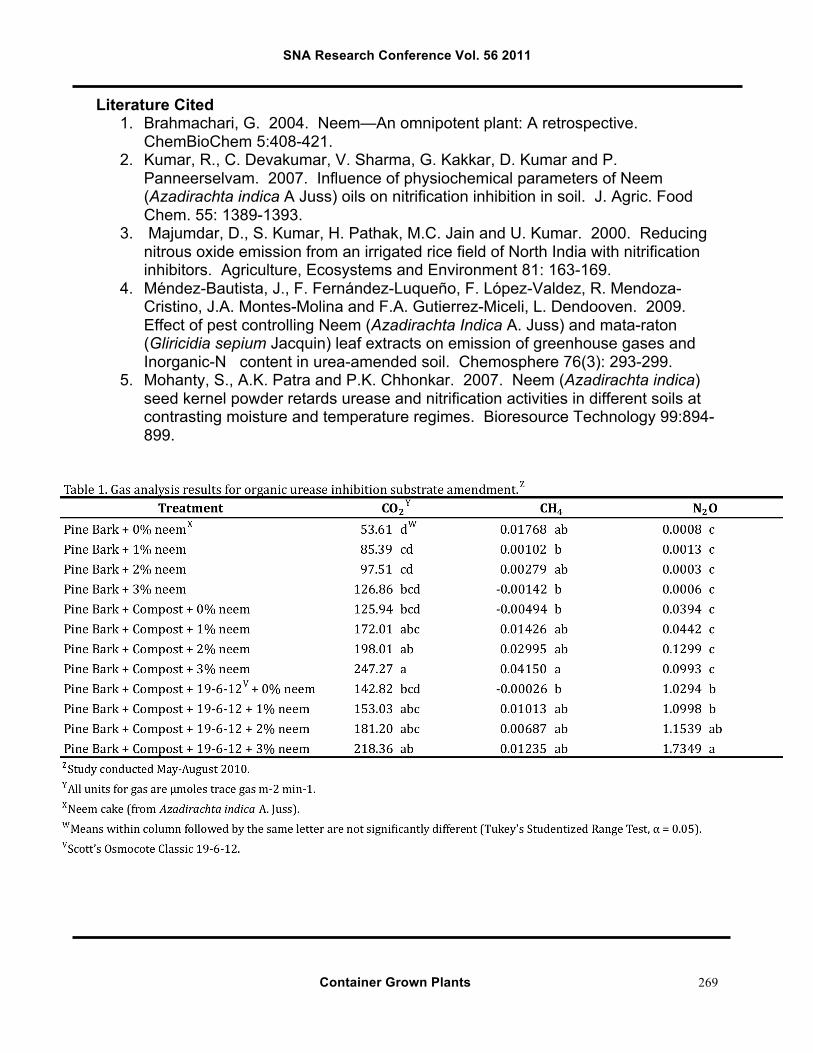
SNA Research Conference Vol. 56 2011
Container Grown Plants
269
Literature Cited 1. Brahmachari, G. 2004. Neem—An omnipotent plant: A retrospective.
ChemBioChem 5:408-421. 2. Kumar, R., C. Devakumar, V. Sharma, G. Kakkar, D. Kumar and P.
Panneerselvam. 2007. Influence of physiochemical parameters of Neem (Azadirachta indica A Juss) oils on nitrification inhibition in soil. J. Agric. Food Chem. 55: 1389-1393.
3. Majumdar, D., S. Kumar, H. Pathak, M.C. Jain and U. Kumar. 2000. Reducing nitrous oxide emission from an irrigated rice field of North India with nitrification inhibitors. Agriculture, Ecosystems and Environment 81: 163-169.
4. Méndez-Bautista, J., F. Fernández-Luqueño, F. López-Valdez, R. Mendoza-Cristino, J.A. Montes-Molina and F.A. Gutierrez-Miceli, L. Dendooven. 2009. Effect of pest controlling Neem (Azadirachta Indica A. Juss) and mata-raton (Gliricidia sepium Jacquin) leaf extracts on emission of greenhouse gases and Inorganic-N content in urea-amended soil. Chemosphere 76(3): 293-299.
5. Mohanty, S., A.K. Patra and P.K. Chhonkar. 2007. Neem (Azadirachta indica) seed kernel powder retards urease and nitrification activities in different soils at contrasting moisture and temperature regimes. Bioresource Technology 99:894-899.
SNA Research Conference Vol. 56 2011
Container Grown Plants
270
Non-Chemical Solutions To Reduce Root Escape In Pot-In-Pot Nursery Production
Jimmy Klick, James S. Owen, Jr. and Heather M. Stoven
Oregon State University, North Willamette Research and Extension Center
15210 NE Miley Road, Aurora, OR 97002
[email protected] Index Words: pot-in-pot production, root escape, non-conventional containers, Salix Significance to industry: One major disadvantage of pot-in-pot production (PIP) is that aggressively rooting crops will root out of the plant pot drain holes and into the surrounding soil. The rooting of the plant into the surrounding soil decreases efficiency of harvesting and results in broken containers, damaged crops and possible increased plant stress due to root severance. To address this issue, five container production systems were compared. Results indicated that the water reservoir container and fabric liner systems had less root escape than conventional PIP containers. Nature of work: Aggressively rooting plants grown in pot-in-pot production (PIP) often root out into the surrounding soil. To address this issue, growers often employ methods to increase air space between the socket and growing pot, use physical barriers such as geotextiles, and apply volatile chemical containing products that form a gaseous barrier between the pots. It has also been suggested that regular pot disturbance will prevent the crop from rooting into the surrounding soil and that biweekly 180 degree rotations of a plant pot could reduce rooting-out, however, labor costs render it prohibitive (5). Chemical control methods to date include copper coated containers, copper impregnated fabric liners and trifluoralin injected nodules. Geotextiles impregnated with trifluoralin nodules (Biobarrier�, and SpinOut™) applied to container interiors have shown to control root escape in PIP (5, 6). SpinOut™ may also be incorporated in a fabric liner to prevent rooting out (1). Biobarrier� comes in different sets of nodules, with the efficacy of nodule number variable by species. Harris et al (3), successfully controlled root escape in PIP in river birch and Yoshino cherry using 8 and 40 nodule Biobarrier�, respectively. However, Ruter (7) found that 128 nodules were not enough to prevent root-out in crape myrtle. The nursery where this study was conducted uses 64 nodules on willow, arborvitae and falsecypress without success (Craig Hopkins, Woodburn Nursery and Azlaeas, personal communication). Experiments were conducted at Woodburn Nursery & Azaleas Inc. (Woodburn, OR, 45º6’39.95”N 122º48’37.63”W) using Salix integra ‘Hakuro-Nishiki’. The five container production systems included Anovapot�-in-Anovapot� (AA; Anova Solutions, Chapel Hill, Australia), Anovapot�-in-conventional pot (AC; conventional pot was produced by ProCal Inc., Middlefield, OH), rotated conventional pot-in-conventional pot (RC), un-rotated conventional pot-in-conventional pot (UC) and fabric lining in conventional-in-conventional pot (FC; High Caliper Growing Systems, Oklahoma City, OK). Woodburn
SNA Research Conference Vol. 56 2011
Container Grown Plants
271
Nursery & Azaleas use 22.7 liters (6 gallon) (#6 ProCal Inc., Middlefield, OH) conventional PIP containers with spacer (ProCal Inc., Middlefield, OH) and Biobarrier™ (BBA Nonwovens, Reemay, Inc., Old Hickory, TN) geotextiles with nodules that are treated with trifluoralin. The research experiment began September 25, 2009. Willow roots completely filled the root ball. Several roots were observed growing out of planted pots and into surrounding soil. These roots were long and coarsely rooted. Every plant had roots growing out of drainage holes, which were pruned off prior to transplanting. Anovapots� were installed by following manufacturer instructions. In AA treatment, an existing plant was removed from the conventional system and planted into an Anovapot� that contained fresh substrate (using identical media as conventional system) from the base of the container to the top of the raised drainage hole, filling the water reservoir. The media used in all treatments was 86% Douglas fir bark and 14% pumice with 10.7 kg•m-3 (18 lb•yd-3) of 10-12 month 17-6-12 (Apex� Woody Plant 17N-2.1P-9.1K, J.R. Simplot Company, CA) incorporated. The planted Anovapot� was placed inside an Anovapot� holder pot. The holder pot had a wick attached to an impermeable layer (corrugated plastic) placed over the centrally raised drainage hole. The planted pot, with three spacers (5 cm x 2.5 cm PVC) spaced evenly underneath the rim, was placed inside the holder pot. In AC treatment, the existing plant was removed from the conventional system and planted into an Anovapot� containing fresh substrate from the base of the container to the top of the raised drainage hole. The planted Anovapot� was placed inside a conventional holder pot without Biobarrier™ and spacer. In RC treatment, Biobarrier™ was removed from the conventional system. Planted pots were rotated 180 degrees every month. In UC treatment, Biobarrier™ was removed from the conventional system. In FC treatment, a fabric liner (Pot Pruner™, High Caliper Growing Systems, Oklahoma City, OK) was placed inside the conventional Woodburn Nursery PIP system, without the Biobarrier™. The experimental design was a CRBD with four blocks of two repetitions per treatment in each block. All plants were irrigated with spray stakes (5 GPH, Netafim Irrigation Inc., Fresno, CA). In February 2010, pour-thrus were conducted by collecting leachate from each plant and measuring pH and EC (2). Woodburn Nursery and Azaleas produced Salix integra ‘Hakuro-Nishiki’ that were grafted onto 48 inch whips of Salix x smithiana one month after being planted in 3.8 liters (1 gallon) container in February, 2009. They were transplanted into 22.7 liters (6 gallon) containers four months later and put in PIP. Salix was sheared into a ball form shortly before experiment initiation. Biobarrier™ was removed from existing system. In July, 2010, plants were harvested. Variables recorded included length of roots rooting out from container drainage hole to the end of the root, dry mass of roots outside containers, a rating of root escape severity, root dry weight, shoot dry weight, and root to shoot ratio. Data were analyzed using ANOVA LSD (α = 0.05) and a priori contrasts to compare selected treatments for effectiveness. Results and Discussion: Dry weight of roots escaped out of containers was greatest in UC. RC, AA and FC had the lowest root dry weights (Table 1). All dry weight contrasts
SNA Research Conference Vol. 56 2011
Container Grown Plants
272
showed differences between treatments. Root length was lowest in FC (Table 1). AC, AA, UC and RC had higher root lengths and were not different from each other. Only AC, FC and RC were different in root length from UC. All treatments had a lower root escape severity rating than UC (Table 1). AA willow roots grew into the water reservoir but not into the surrounding soil. Ruter (8) used a similar container called the “moat pot”, which also has a centrally raised drainage hole in the bottom of the pot, creating a water reservoir that reduces rooting-out via water root pruning. The moat pot successfully controlled root escape in Kanzan cherry and Chanticleer pear. Additionally, growth and color advantages for plants in moat pots were reported due to trapping of leached nutrients. Similarly, the AA treatment had a two-fold increase (0.2 dS•m-1) in EC over RC treatment, respectively. However, due to large root mass rooting out of the moat pot, postproduction handling difficulty and stressing plants by severing roots the moat pot was not recommended for production of the two species (8). However, stress severity is largely dependent on amount of roots removed. Visual differences in root structure were observed between willows grown in AA, conventional and fabric containers: Anovapot� roots were coarse, conventional roots were less coarse and fabric roots were fibrous. Root and shoot dry weights and root to shoot ratio were unaffected by treatment (Data not presented). AA treatment samples produced roots that escaped the plant pot, but further escape was prevented by the water reservoir. In FC treatment, only fine roots escaped. Finding an economically sound solution to root escape will be difficult. Incorporating an alternative container type or fabric liner that may increase material costs will be challenging to introduce to PIP nursery production; however, these initial costs may be able to offset increased labor needed to harvest plants that are rooted into the surrounding soil. Additional issues observed with the Anovapot� include rooting into the wicking system, stress from root pruning, and the habitat for pests such as mosquitoes and slugs provided by the water reservoir. However, the severity of Anovapot� issues is likely less than conventional system issues. In conclusion, RC, AA and FC reduced root escape and had little effect on crop quality. Additionally, these systems improve worker satisfaction by facilitating ease of harvest. However, each of these systems has its advantages and disadvantages. Further research is warranted to understand economic impacts, field performance and stress effects of each possible system. Literature Cited 1. Beeson Jr, R.C. and K. Keller. Effect of cyclic irrigation on growth of magnolias produced using five in-ground systems. J. Environ. Hort. 21:148-152. 2. Bilderback, T.E. 2001. Using the PourThru procedure for checking the EC and pH for nursery crops. Horticulture Information Leaflet-401, North Carolina State University, North Carolina Cooperative Extension Service.

SNA Research Conference Vol. 56 2011
Container Grown Plants
273
3. Harris, J.R., A.X. Niemiera, R.D. Wright and C.H. Parkerson. 1996. Chemically controlling root escape in pot-in-pot production of river birch and Yoshino cherry. HortTech. 6:30-34. 4. Mathers, H. 2000. Pot-in-pot container culture. The Nursery Papers: 2:1. 5. Newman, S.E. and J.R. Quarrels. 1994. Chemical root pruning of container-grown trees using trifluralin and copper impregnated fabric. Proc. SNA Res. Conf. 39:75-76. 6. Ruter, J.M. 1994. Evaluation of control strategies for reducing rooting-out problems in pot-in-pot production systems. J. Environ. Hort. 12:51-54. 7. Ruter, J.M. 1996. Biobarrier rate influences rooting-out of five tree species produced pot-in-pot. Proc. SNA Res. Conf. 41:104-106. 8. Ruter, J.M. 1999. Production system influences growth of ‘Kanzan’ Cherry and ‘Chanticleer’ Pear. Proc. SNA Res. Conf. 44:34-36. Table 1. Dry weight, length, and severity rating of escaped roots of Salix integra ‘Hakuro-Nishiki’. 0 rating = no root escape, 5 rating = high root escape. Container Type Dry weight (g) Length (cm) Rating ______________________________________________________________________ Unrotated Convential (UC) 19 az 56 a 5.0 Rotated Conventional (RC) 5 c 38 ab 3.8 Anovapot-in-Anovapot (AA) 2 c 57 a 3.3 Anovapot-in-Conventional (AC) 12 b 58 a 3.3 Fabric-n-Conventional (FC) 1 c 31 b 3.3
Contrasts AA vs AC **W NSy NS AA vs UC ** NS *x AC vs UC ** ** ** FC vs UC ** ** ** RC vs UC ** ** ** ______________________________________________________________________ zMeans followed by different letters within a column are significantly different based on Fishers LSD means separation procedure (α = 0.05). yNS, Not significant xSignificant at P ≤ 0.01 wSignificant at P ≤ 0.05
SNA Research Conference Vol. 56 2011
Container Grown Plants
274
Pine Tree Substrate Properties: Before and After Production
Emily Lumpkin, Brian Jackson, Helen Kraus, Bill Fonteno, and Ted Bilderback
Department of Horticultural Science North Carolina State University, Raleigh, NC 27695-7609
Index Words: substrate, amendment, composted cotton stalks, cotton gin trash Significance to Industry: Both pine bark (PB) based and whole pine tree (PT) based substrates amended with composted cotton stalks (CT), cotton stalks composted with a nitrogen source (CT+N), and cotton gin trash (CGT) maintained acceptable physical properties throughout a 22 simulated production period. Additionally, all PB-based and PT-based substrates amended with CT, CT+N, and CGT maintain physical properties over time that were more favorable, and potentially would support plant growth better, than PB alone. Nature of Work: A survey by Lu, et al. (3) found a decline in pine bark availability across the southeast with associated increased cost due to less domestic forestry production, imported logs without adhering bark, increase rate of ‘in-forest’ wood harvesting that leaves bark behind on the forest floor, and increase use of pine bark as a fuel source. Consequently, less than 5% of the forest product inventory of pine bark is available for horticultural use. Pine bark is desirable as a nursery substrate for growing plants in containers because it is light in weight, well-drained, well-aerated, pathogen-free, disease suppressive, and relatively stable over time in production. The possibility of losing pine bark as a substrate has stimulated much research investigating alternatives to pine bark-based substrates. Many alternative substrate components and substrate bases show promise in that they are non-toxic to plants and can be successfully used as an amendment with pine bark stretching our pine bark supplies and creating acceptable growing substrates. However, cost, regional availability, insufficient research and production guidelines for their use reduce their widespread adoption. Additionally, stability of substrate components over time must be evaluated to assess changes in air space and water hold capacity. Time in production (68 weeks) did not alter the total porosity (TP), plant unavailable water content (UW), or bulk density (BD) of pine bark amended with builders sand, expanded slate, or calcined attapulgite clay; however TP of granite and mortar sand amended pine bark substrates increased with time in production due decomposition of the larger faction of pine bark particles while BD of these substrates decreased (2). Air space (AS) and plant available water (AW) did not change over time with the granite and mortar sand amended pine bark substrates (2). Jackson, et al., (1) found that whole pine tree substrate (PTS) had greater AS than PB and that AS decreased in both substrates over time in production with AS remaining greater in the whole pine tree
SNA Research Conference Vol. 56 2011
Container Grown Plants
275
substrate than the aged pine bark. Decomposition of organic components in substrates may not remain stable and may decompose at different rates depending on the physical integrity of the organic constituent. The goal of this project was to evaluate organic, alternative substrate components for their stability over time during production of nursery crops. This project is part of a larger goal to provide the nursery industry in the southeast with regionally available alternative potting substrates that will keep the industry competitive and continue demand for their products in the competitive nursery industry. Fallow three quart (2.8 L) containers were filled with either pine bark-based (PB) or whole pine tree-based (PT) substrates that had been amended (v/v) with cotton stalks composted without a nitrogen (N) source (CS), cotton stalks composted with a N source (CS+N), or cotton gin trash (CGT). A factorial treatment arrangement of these substrate bases (PB and PT) and amendments (CS, CS+N, and CGT) resulted in six substrates: 4:1 PB : CS (PBCS), 4:1 PB : CS (PBCS+N), 9:1PB : CGT (PBCGT), 1:1 PT : CS (PTCS), 1:1 PT : CS+N (PTCS+N), and 1:1 (v/v) PT : CGT (PTCGT) arranged in a RCBD. An industry control 100% PB substrate was included in the experimental design for comparisons. Fallow containers were irrigated as if in production. Irrigation was applied by a low volume spray stake (PC Spray Stake, Netafim, Ltd., Tel Aviv, Israel) that delivered 3.2 GPH. Leaching fractions were measured from each substrate every two weeks and irrigation volume was adjusted accordingly. Physical properties [total porosity (TP), air space (AS), container capacity (CC), available water (AW), unavailable water (UW), and bulk density (BD) were determined from substrate in these fallow containers 4 weeks and 22 weeks after potting. Fallow containers were arranged in a RCBD with 2 sample times, 7 substrates, and 3 replications. All variables were tested for differences using analysis of variance procedures and lsd means separation procedures where appropriate. When a non-significant sample time x substrate interaction was in effect, only main effects of sample time and substrate were presented. Results and Discussion: The sample time x substrate was significant for all the physical properties measured; therefore, the data were reanalyzed by sample time and substrate. TP, AS, CC, and UW decreased for most of the substrates over time (Table 1). However, AW increased for PBCS, PTCS, and PB while AW decreased for PBCS+N, PTCS+N, and PBCGT with time. TP and AS for all PT-based substrate was greater than the PB-based counterpart for both samples times (Table 1). Jackson et al., (1) also found that AS decreased with time in PT-based substrates and remained higher than PB-based substrates. However Jackson et al. (1) found that CC for PT-based and PB-based substrates were not different, while in our study CC was lower for all PT-based substrates than the PB-based counterpart at each sample time except PBCGT and PTCGT which were not different from each other (Table 1). At four weeks, AW was highest in the PTCGT
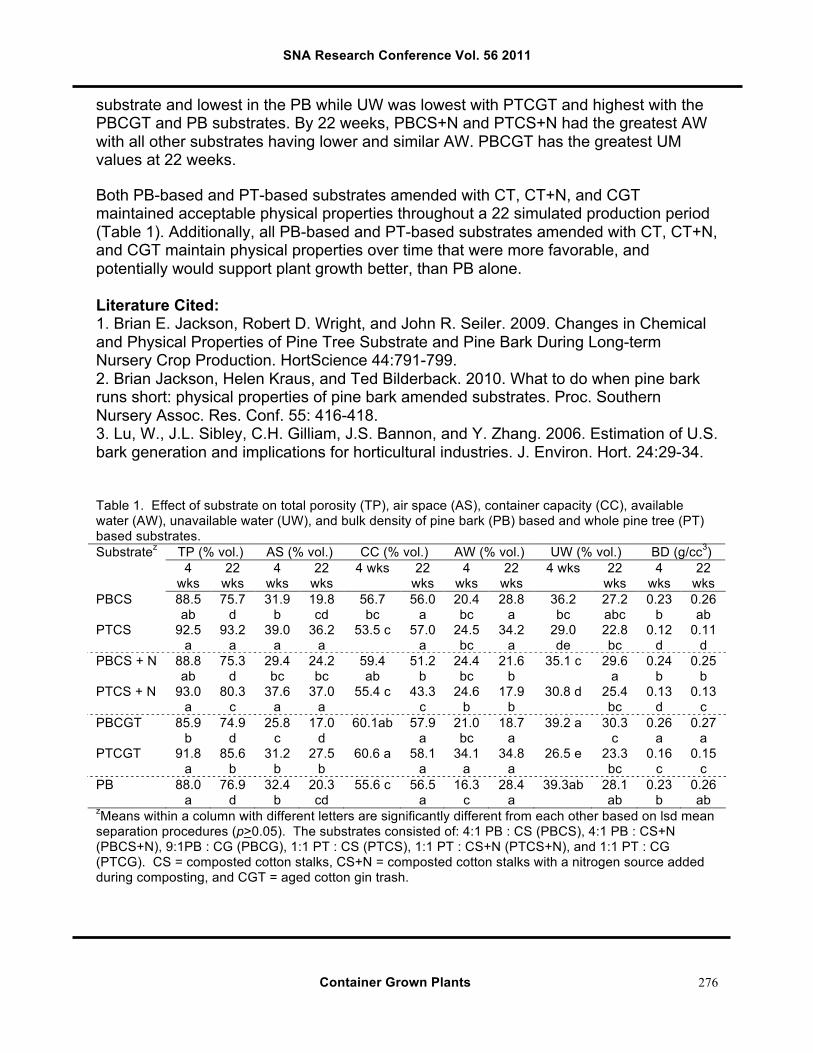
SNA Research Conference Vol. 56 2011
Container Grown Plants
276
substrate and lowest in the PB while UW was lowest with PTCGT and highest with the PBCGT and PB substrates. By 22 weeks, PBCS+N and PTCS+N had the greatest AW with all other substrates having lower and similar AW. PBCGT has the greatest UM values at 22 weeks. Both PB-based and PT-based substrates amended with CT, CT+N, and CGT maintained acceptable physical properties throughout a 22 simulated production period (Table 1). Additionally, all PB-based and PT-based substrates amended with CT, CT+N, and CGT maintain physical properties over time that were more favorable, and potentially would support plant growth better, than PB alone. Literature Cited: 1. Brian E. Jackson, Robert D. Wright, and John R. Seiler. 2009. Changes in Chemical and Physical Properties of Pine Tree Substrate and Pine Bark During Long-term Nursery Crop Production. HortScience 44:791-799. 2. Brian Jackson, Helen Kraus, and Ted Bilderback. 2010. What to do when pine bark runs short: physical properties of pine bark amended substrates. Proc. Southern Nursery Assoc. Res. Conf. 55: 416-418. 3. Lu, W., J.L. Sibley, C.H. Gilliam, J.S. Bannon, and Y. Zhang. 2006. Estimation of U.S. bark generation and implications for horticultural industries. J. Environ. Hort. 24:29-34. Table 1. Effect of substrate on total porosity (TP), air space (AS), container capacity (CC), available water (AW), unavailable water (UW), and bulk density of pine bark (PB) based and whole pine tree (PT) based substrates.
TP (% vol.) AS (% vol.) CC (% vol.) AW (% vol.) UW (% vol.) BD (g/cc3) Substratez
4 wks
22 wks
4 wks
22 wks
4 wks 22 wks
4 wks
22 wks
4 wks 22 wks
4 wks
22 wks
PBCS 88.5 ab
75.7 d
31.9 b
19.8 cd
56.7 bc
56.0 a
20.4 bc
28.8 a
36.2 bc
27.2 abc
0.23 b
0.26 ab
PTCS 92.5 a
93.2 a
39.0 a
36.2 a
53.5 c 57.0 a
24.5 bc
34.2 a
29.0 de
22.8 bc
0.12 d
0.11 d
PBCS + N 88.8 ab
75.3 d
29.4 bc
24.2 bc
59.4 ab
51.2 b
24.4 bc
21.6 b
35.1 c 29.6 a
0.24 b
0.25 b
PTCS + N 93.0 a
80.3 c
37.6 a
37.0 a
55.4 c 43.3 c
24.6 b
17.9 b
30.8 d 25.4 bc
0.13 d
0.13 c
PBCGT 85.9 b
74.9 d
25.8 c
17.0 d
60.1ab 57.9 a
21.0 bc
18.7 a
39.2 a 30.3 c
0.26 a
0.27 a
PTCGT 91.8 a
85.6 b
31.2 b
27.5 b
60.6 a 58.1 a
34.1 a
34.8 a
26.5 e 23.3 bc
0.16 c
0.15 c
PB 88.0 a
76.9 d
32.4 b
20.3 cd
55.6 c 56.5 a
16.3 c
28.4 a
39.3ab 28.1 ab
0.23 b
0.26 ab
zMeans within a column with different letters are significantly different from each other based on lsd mean separation procedures (p>0.05). The substrates consisted of: 4:1 PB : CS (PBCS), 4:1 PB : CS+N (PBCS+N), 9:1PB : CG (PBCG), 1:1 PT : CS (PTCS), 1:1 PT : CS+N (PTCS+N), and 1:1 PT : CG (PTCG). CS = composted cotton stalks, CS+N = composted cotton stalks with a nitrogen source added during composting, and CGT = aged cotton gin trash.
SNA Research Conference Vol. 56 2011
Container Grown Plants
277
Pruning Effects on Trade #3 Viburnum odoratissimum Growth and Leaf Area
Jeff Million1, Tom Yeager1 and Joseph Albano2
1Dept. of Environmental Horticulture, Univ. of Florida, IFAS, Gainesville, FL
2U.S. Horticultural Research Laboratory, USDA-ARS, Ft. Pierce, FL
[email protected] Index words. biomass, root, shoot, size index, sweet viburnum Significance to the Industry. The effects of several pruning schedules on subsequent growth of an ornamental shrub were determined. Results showed that delaying first prune from 9 to 16 weeks after planting improved subsequent plant growth. When pruned 9 weeks after planting, using a sickle bar cutter to make a horizontal prune of the plant canopy gave similar results to hand tip-pruning of main branches which may have labor implications. Pruning at 16 weeks after planting did not reduce growth compared to unpruned plants which indicated that properly-timed pruning can improve quality without negatively affecting crop time. Nature of Work. Pruning of ornamental shrubs is practiced to create well-branched plants which will meet quality standards of the marketable product. Previously reported research with sweet viburnum grown in trade #1 containers (1) found that early pruning six weeks after transplanting severely reduced the growth of or killed young plants while pruning nine weeks after transplanting resulted in high quality plants. Unpruned plants required 15 weeks to achieve the same marketable height that pruned plants achieved in 21 weeks. The purpose of this study was to compare several pruning practices on subsequent growth of sweet viburnum grown in trade #3 containers. Results will be used in a systems model which simulates production based upon selected management practices such as pruning. On 9 April 2008, sweet viburnum [Viburnum odoratissimum (L.) Ker Gawl.] liners were planted one per trade #3 container [28-cm (11 inch) top diameter and fill volume of 10 L; C1200, Nursery Supply Inc.; Kissimmee, FL] filled with a substrate composed (by volume) of 2 pine bark:1 sphagnum peatmoss:1 coarse sand. An 18N-2.6P-10K controlled-release fertilizer (Osmocote Classic 18-6-12, 8-9 month release at 75oF; Scotts Co.; Marysville, OH) was incorporated into the substrate at 90 g/container (3 lb N/yd3). Shoot height and plant width were measured at planting and two months later on June 10. Size on June 10 was used to distribute 96 plants into 12 pruning-harvest treatments (3 pruning schedules x 4 destructive harvests x 8 replications). Containers were placed in a pot-to-pot (784 cm2/container) arrangement for the first 16 weeks. Containers were spaced 15 cm (6 inch) apart (1620 cm2/container) on 1 August 2010 until 1 Oct 2010 at which time they were spaced 23 cm (9 inch) apart (2240 cm2/container) until the end of the experiment. Four pruning schedules were evaluated
SNA Research Conference Vol. 56 2011
Container Grown Plants
278
(Table 1). Mechanical pruning entailed using an electric hedge trimmer with a sickle bar cutting mechanism to make a horizontal cut at a height pre-determined to result in the removal of 1-2 of the uppermost nodes from main stems of most plants in the treatment group. Tip pruning entailed using hand shears to remove 1-2 terminal nodes from main branches. Destructive harvests were made at each prune date (Table 1) and on 20 Nov 2010 when the experiment was terminated (32 weeks after planting). Shoot height and width, shoot and root biomass, and leaf area (LA) were determined at each harvest. If pruned, size was measured before and after pruning and biomass and leaf area of pruned plant tissue determined. An ANOVA was conducted for each harvest using a RCBD with four pruning schedules and eight blocks (one replication per treatment-block). For the two early pruning schedules, mechanical pruning reduced plant height 13% (24 vs. 21 cm) and width 8% (23 vs. 21 cm) while tip pruning reduced plant height 15% (27 vs. 23 cm) but width was unaffected (23 cm). Early mechanical pruning reduced shoot weight 22% (6.4 vs. 8.2 g/plant) and leaf area 27% (460 vs. 620 cm2/plant). Tip pruning resulted in less removal of biomass and LA than mechanical pruning, removing 14% of shoot weight and 20% of LA. Waiting until week 15 for first prune (midseason mechanical pruning treatment) resulted in lower percent reductions in height, biomass and leaf area than first prune for early pruning treatments. The first midseason mechanical pruning reduced plant height 5% (41 vs. 43 cm) and width 6% (47 vs. 50 cm) removing 7% shoot weight (39 vs. 42 g/plant) and 7% LA (3460 vs. 3720 cm2/plant). The effect of pruning schedules on overall growth is depicted in Figs. 1-3. Subsequent growth of early pruned plants was not different for mechanical vs. tip treatments so only results for early tip pruning are given in these figures and discussed now. By the third harvest (week 23) height and width of unpruned plants averaged 61 and 76 cm, respectively. Pruned treatments resulted in plants at week 23 with heights of 53 to 55 cm and widths of 58 to 62 cm so that pruning, regardless of schedule, reduced plant height approximately 10% and width approximately 20%. While plant height and width at week 23 were unaffected by pruning method, early pruning resulted in lower shoot weight (93 vs. 112 g/plant), and LA (6710 vs. 7910 cm2/plant) than midseason pruning; unpruned plants had an average shoot weight of 131 g/plant and LA of 9860. During the last 9 weeks of growth, midseason-pruned plants continued to produce more biomass and leaf area than early pruned plants so that at the end of the experiment midseason-pruned plants had 21% greater shoot weight (271 vs. 225 g/plant) and 19% more LA (17210 vs. 14400 cm2/plant) than early-pruned plants. Final biomass and LA of unpruned plants were 277 g/plant and 17950 cm2/plant, respectively, which were not significantly different than respective values observed for midseason-pruned plants. Final root weight for early pruned plants (74 g/plant) was less than for unpruned plants (114 g/plant) but not significantly different than midseason pruned plants (90 g/plant). Pruning treatments had no effect on root weights determined for the earlier three harvests.
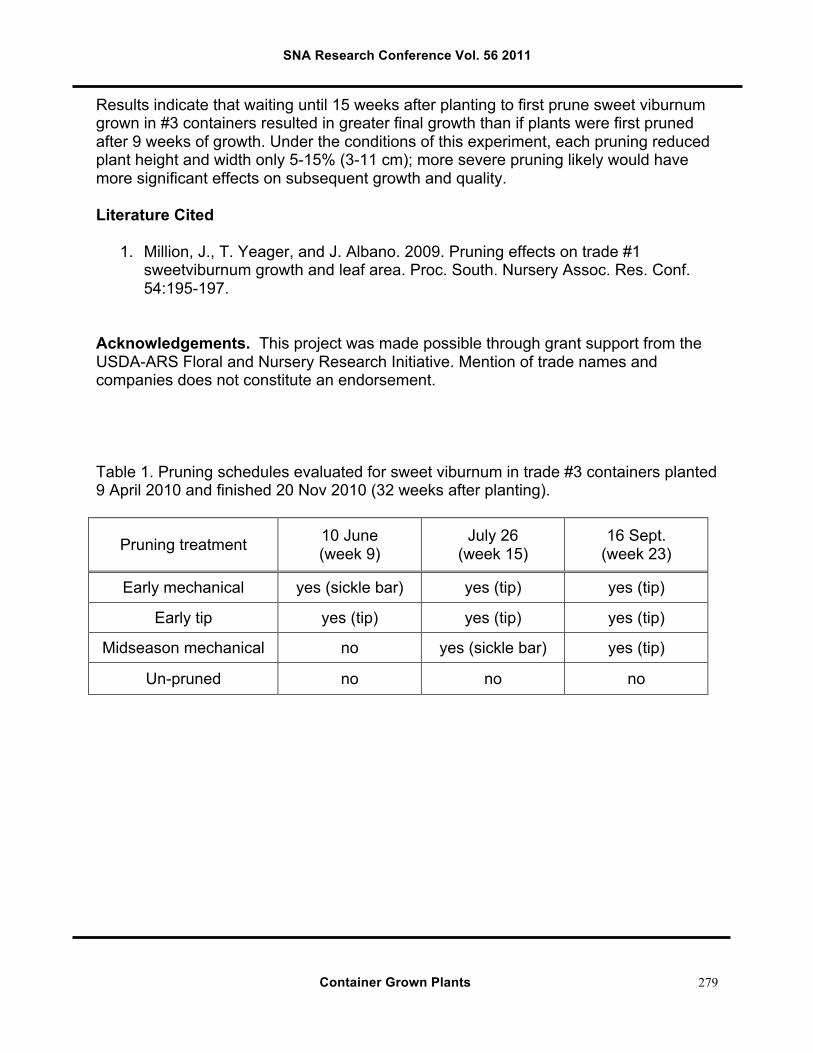
SNA Research Conference Vol. 56 2011
Container Grown Plants
279
Results indicate that waiting until 15 weeks after planting to first prune sweet viburnum grown in #3 containers resulted in greater final growth than if plants were first pruned after 9 weeks of growth. Under the conditions of this experiment, each pruning reduced plant height and width only 5-15% (3-11 cm); more severe pruning likely would have more significant effects on subsequent growth and quality. Literature Cited
1. Million, J., T. Yeager, and J. Albano. 2009. Pruning effects on trade #1 sweetviburnum growth and leaf area. Proc. South. Nursery Assoc. Res. Conf. 54:195-197.
Acknowledgements. This project was made possible through grant support from the USDA-ARS Floral and Nursery Research Initiative. Mention of trade names and companies does not constitute an endorsement. Table 1. Pruning schedules evaluated for sweet viburnum in trade #3 containers planted 9 April 2010 and finished 20 Nov 2010 (32 weeks after planting).
Pruning treatment 10 June (week 9)
July 26 (week 15)
16 Sept. (week 23)
Early mechanical yes (sickle bar) yes (tip) yes (tip)
Early tip yes (tip) yes (tip) yes (tip)
Midseason mechanical no yes (sickle bar) yes (tip)
Un-pruned no no no
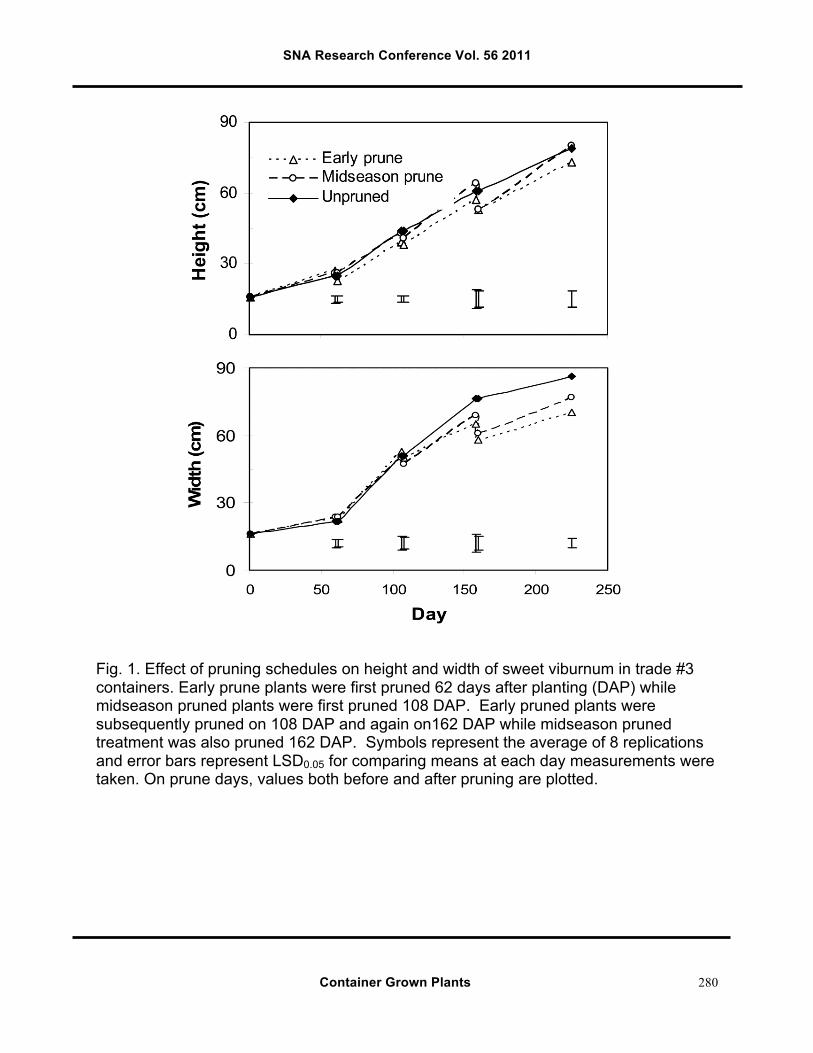
SNA Research Conference Vol. 56 2011
Container Grown Plants
280
Fig. 1. Effect of pruning schedules on height and width of sweet viburnum in trade #3 containers. Early prune plants were first pruned 62 days after planting (DAP) while midseason pruned plants were first pruned 108 DAP. Early pruned plants were subsequently pruned on 108 DAP and again on162 DAP while midseason pruned treatment was also pruned 162 DAP. Symbols represent the average of 8 replications and error bars represent LSD0.05 for comparing means at each day measurements were taken. On prune days, values both before and after pruning are plotted.
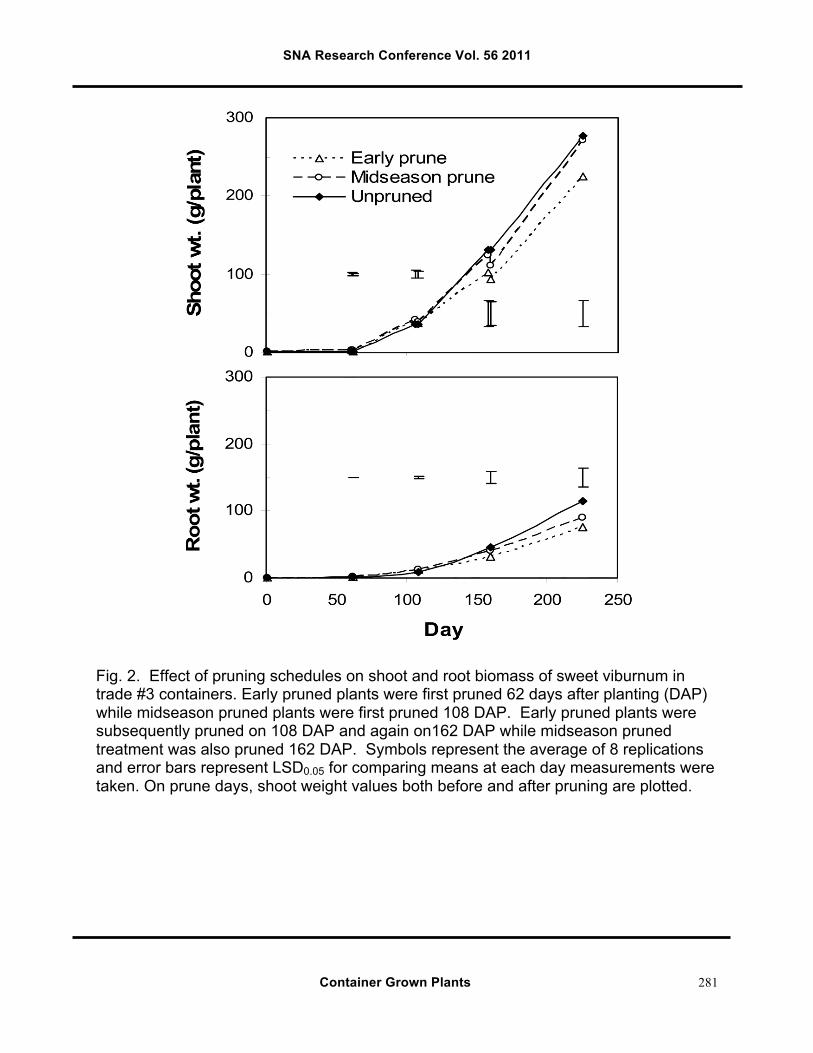
SNA Research Conference Vol. 56 2011
Container Grown Plants
281
Fig. 2. Effect of pruning schedules on shoot and root biomass of sweet viburnum in trade #3 containers. Early pruned plants were first pruned 62 days after planting (DAP) while midseason pruned plants were first pruned 108 DAP. Early pruned plants were subsequently pruned on 108 DAP and again on162 DAP while midseason pruned treatment was also pruned 162 DAP. Symbols represent the average of 8 replications and error bars represent LSD0.05 for comparing means at each day measurements were taken. On prune days, shoot weight values both before and after pruning are plotted.
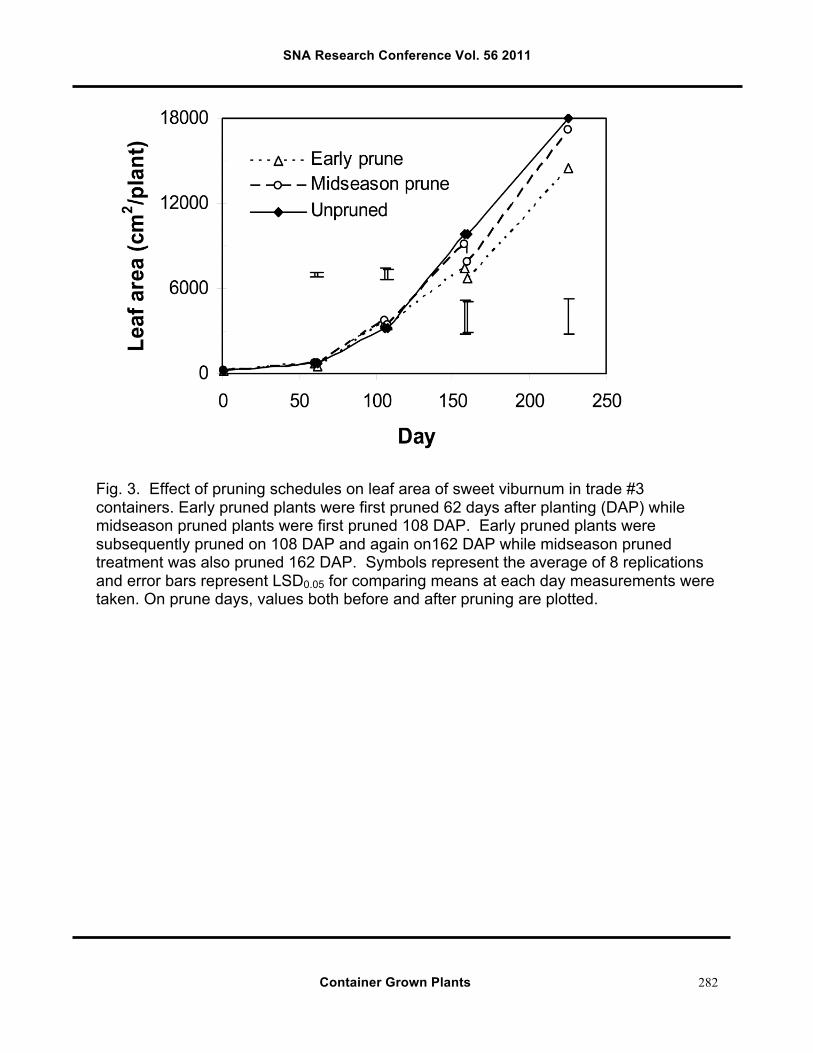
SNA Research Conference Vol. 56 2011
Container Grown Plants
282
Fig. 3. Effect of pruning schedules on leaf area of sweet viburnum in trade #3 containers. Early pruned plants were first pruned 62 days after planting (DAP) while midseason pruned plants were first pruned 108 DAP. Early pruned plants were subsequently pruned on 108 DAP and again on162 DAP while midseason pruned treatment was also pruned 162 DAP. Symbols represent the average of 8 replications and error bars represent LSD0.05 for comparing means at each day measurements were taken. On prune days, values both before and after pruning are plotted.
SNA Research Conference Vol. 56 2011
Container Grown Plants
283
Fertilizer Effects on Annual Growth in Sweetgum, Hickory, and Cedar Substrates
Anna-Marie Murphy1, Charles H. Gilliam1, Glenn B. Fain1, Tom V. Gallagher2,
H. Allen Torbert3,and Jeff L. Sibley1
1Department of Horticulture, 101 Funchess Hall, Auburn University, AL 36849 2Dept. of Forestry/Wildlife Sciences, 602 Duncan Drive, Auburn University, AL 36849
3USDA-ARS National Soil Dynamics Laboratory, 411 S. Donahue Drive Auburn, AL 36832
Index Words: perlite, peat, container media, alternative substrates, WholeTree Significance to Industry: Expanded perlite has long been used as an amendment in container mediums because of its ability to add air space to container substrates without adding to bulk density or affecting substrate pH and EC. Although products such as perlite are thought to be beneficial for plant growth, perlite itself has long been identified as a lung and eye irritant by growers across the country. Recent research has focused on identifying and evaluating potential alternatives to perlite for use in the greenhouse production of annual crops. Data from this study shows that petunias and vinca grown in a 75:25 peat:redcedar substrate are comparable to plants grown in a traditional 75:25 peat:perlite substrate. Additionally, data indicate that an increase in liquid fertilizer rate from 100 ppm N to 300 ppm N had no effect on flower count, growth indices or plant dry weight of petunias in sweetgum, hickory or cedar-amended substrates, and no effects on vinca growth indices in the same alternatives. Nature of Work: For years, growers have voiced complaints about the hassle associated with amending their container substrate mixes with perlite. Up until now, perlite has simply been considered a general nuisance due to its dusty nature. However, recent literature has made possible associations between heavy exposure to perlite, persistent reactive airway disfunctive syndrome (1), and a decrease in the lung transfer factor, or carbon monoxide (CO) diffusing capacity (4). These findings have caused growers to seek alternative greenhouse substrate amendments with equivalent characteristics to perlite. Previous work from these authors has identified several promising alternatives to perlite and peat, including sweetgum (SG) (Liquidambar styraciflua), hickory (H) (Carya spp.) and eastern redcedar (RC) (Juniperus virginiana) (3). Preliminary research has shown that substrates amended with up to 50% RC produce plants similar to plants grown in a traditional 75:25 peat:perlite substrate, and that SG and H could potentially be suitable alternatives with changes in standard greenhouse practices such as watering and fertilization regimes. The objective of the current study was to evaluate the performance of SG, H and RC-amended substrates with three different liquid fertilizer (LF) formulations (100, 200 and 300 ppm N).
SNA Research Conference Vol. 56 2011
Container Grown Plants
284
This study was conducted at the Paterson Greenhouse Complex on the campus of Auburn University. SG and H were harvested from the forest on February 16, 2009 and RC was cut on February 17, 2009. All trees were de-limbed at the time of cutting, and chipped through a Vermeer BC1400XL chipper on February 19, 2009. SG, H and RC were then stored in 55-gallon waterproof bins until milling date. Fresh WholeTree (WT) chips were obtained from Young’s Plant Farm (Auburn, AL) on August 4, 2009. All wood was then ground further through a ¼” screen in a swinging hammer-mill (No. 30; C.S. Bell, Tifton, OH) on August 4, 2009. Each wood material was combined with 75% (by volume) Canadian sphagnum peatmoss and compared with an industry standard mix of 75:25 peat:perlite (by volume). A 75:25 peat:WT blend was also used as a secondary standard. Substrate treatments were mixed on August 5, 2009, and were initially amended with 5 lb/yd3 dolomitic limestone. AquaGro-L® wetting agent was incorporated at mixing at a rate of 4 oz/yd3. Pots were filled with substrates level to the top of the container and two plugs from 288-cell flats of either petunia (Petunia hybrida ‘Celebrity Blue’) or vinca (Catharanthus roseus ‘Cooler Rose’). On August 7, 2009 [2 days after planting (DAP)], 100 ml of one of three LF formulations was applied to each experimental unit each Monday and Friday. A total of thirteen LF applications occurred (Aug. 7, 10, 14, 17, 21, 24, 28, and 31; Sept. 4, 7, 11, 14, 18). The three LF formulations applied were either 100 ppm N 20-10-20, 200 ppm N (100 ppm N 20-10-20 + 100 ppm N 34-0-0), or 300 ppm N (100 ppm N 20-10-20 + 200 ppm N 34-0-0). Data collected included pour-thru leachates on vinca to determine pH and electrical conductivity (EC) at 0, 7, 14, 30 and 45 DAP (n=4). In addition, flower count (number of open blooms or blooms showing color) and growth indices (GI) [(height + width1 + width2)/3] were determined at study termination (45 DAP) (n=8). Plant dry weights (PDW) were also determined from the above-ground shoot portion at 46 DAP (n=4). Containers were arranged in a randomized complete block design (RCBD) with eight single-plant replications per treatment. Each plant species tested was treated as separate experiments. Data were subjected to analysis of variance using the general linear models procedure and multiple comparison of means was conducted using Tukey’s honest significant difference test at α=0.05. LF rates were tested for a linear and quadratic response using single degree of freedom orthogonal contrasts (Version 9.1.3; SAS Institute, Inc., Cary, NC). Results and Discussion: The recommended range for initial pH of a growing medium containing vinca is between 5.5 and 6.0 (2). As the plant grows, the pH may climb higher, but is not recommended to climb over 6.5, due to potential iron deficiencies in vinca. Before planting, pH was highest in the 75:25 peat:SG substrate (5.4), although it was similar to the traditional 75:25 peat:perlite substrate (5.3) (Table 1). Neither substrate nor liquid fertilizer rate had any effect on pH at both 7 and 14 DAP. By 30 DAP, pH values in the 75:25 peat:WT substrate increased with increasing fertilizer rate, but no other substrates were affected. LF rate had no affect on pH of any substrate treatment by 45 DAP, although substrate alone did have some affect; 75:25 peat:SG
SNA Research Conference Vol. 56 2011
Container Grown Plants
285
substrates had the highest pH values of any reported [6.9 at 100 and 300 ppm N and 7.0 at 200 ppm N). Previous research on the use of SG as a substrate amendment did not reflect these high pH values by 45 DAP (3). EC values are not recommended to rise above 1.0 dS/m for substrates containing vinca (2). At no point throughout the study did any EC value from any treatment reach 1.0 dS/m (Table 1). At planting, the 75:25 peat:RC treatment had the highest EC value of any substrate (0.93 dS/m). The 75:25 peat:WT treatment had the lowest EC value (0.58 dS/m). At 7 DAP, EC values in the traditional 75:25 peat:perlite, 75:25 peat:SG and 75:25 peat:H substrates increased with increasing LF rates. Both 75:25 peat:RC and 75:25 peat:WT substrates were unaffected by LF rate at 7 DAP. By the end of the study (45 DAP), no substrates were linearly affected concerning EC by an increase in LF rate. In general, petunia flower number was greatest in the traditional 75:25 peat:perlite substrate, although flower numbers for both the 75:25 peat:RC and 75:25 peat:WT substrates were comparable (Table 2). Petunias in the 75:25 peat:perlite substrate were the only ones affected by LF rate, as flower count generally increased with an increase in LF rate. Vinca flower number was also greatest in the 75:25 peat:perlite substrate. However, in addition to the 75:25 peat:perlite substrate, both the 75:25 peat:H and 75:25 peat:WT substrates were positively affected by an increase in LF rate. For both petunia and vinca in the study, GI was not affected by substrate or LF rate (Table 2). Petunia and vinca PDW were generally greatest in the 75:25 peat:perlite treatments, although with both species the 75:25 peat:RC and 75:25 peat:WT treatments were similar (Table 2). Petunia PDW increased in the 75:25 peat:perlite treatment with an increase in LF rate, although no other substrates were affected. Alternatively, vinca PDW increased with an increase in LF rate in every substrate with the exception of 75:25 peat:SG. Combined, this data shows that petunias and vinca grown in a 75:25 peat:RC substrate are comparable to plants grown in a 75:25 peat:perlite substrate. Additionally, data indicate that an increase in LF rate from 100 ppm N to 300 ppm N had no effect on flower count, GI or PDW of petunias in SG, H or RC-amended substrates, and no effects on vinca GI in these same alternatives. Literature Cited 1. Du, C., J. Wang, P. Chu, and Y. Guo. 2010. Acute Expanded Perlite Exposure with Persistent Reactive Airway Dysfuntion Syndrome. Industrial Health 48:119-122. 2. Kessler, J.R., Jr. 1998. Greenhouse Production of Annual Vinca. Alabama Coop. Ext. Sys. ANR-1119. 3. Murphy, A.M., C.H. Gilliam, G.B. Fain, T.V. Gallagher, H.A. Torbert, and J.L. Sibley. 2010. Hardwood Amended Substrates for Annual Plant Production. Proc. Southern Nursery Assn. Res. Conf. 55:385-388. 4. Polatli, M., M. Erdinç, E. E Erdinç, and E. Okyay. 2001. Perlite Exposure and 4-Year Change in Lung Function. Environ. Res. 86:238-243.
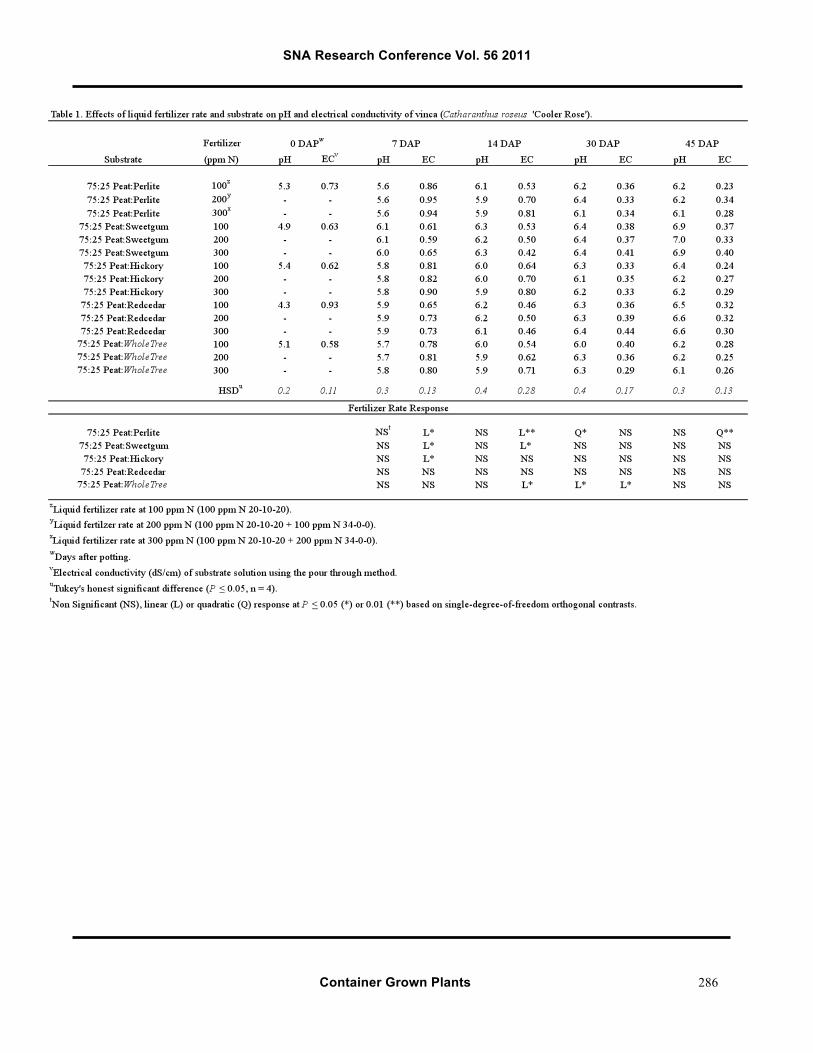
SNA Research Conference Vol. 56 2011
Container Grown Plants
286
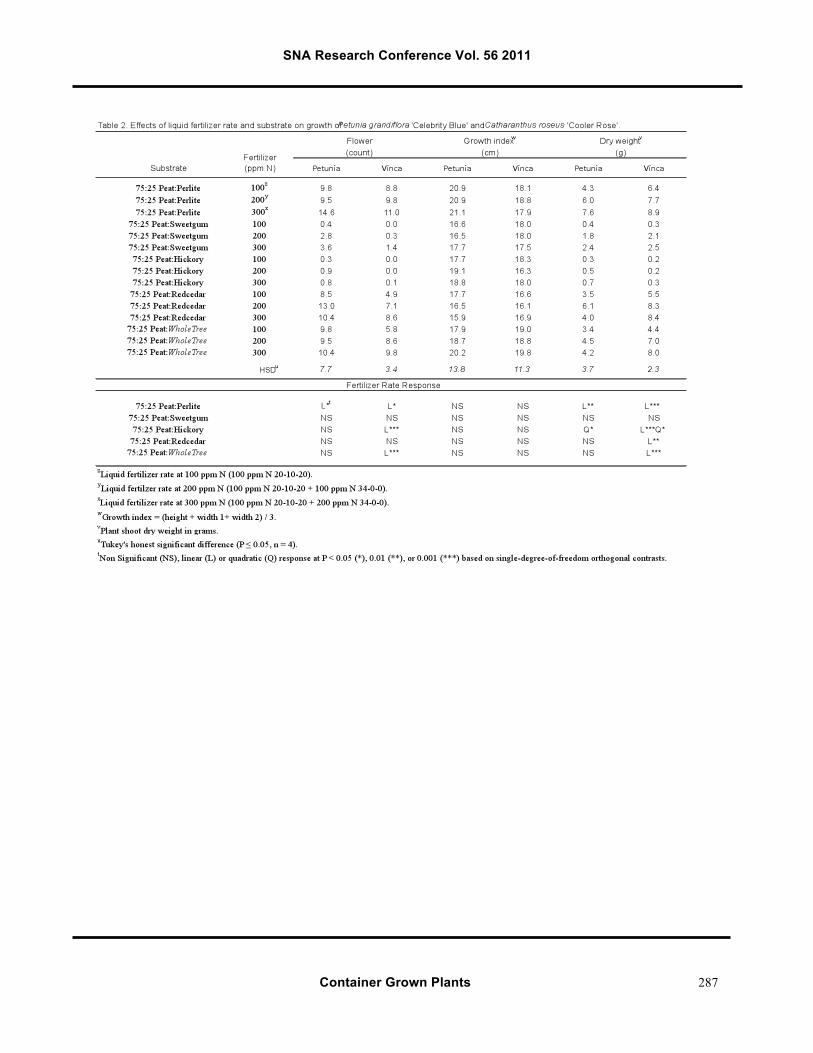
SNA Research Conference Vol. 56 2011
Container Grown Plants
287
SNA Research Conference Vol. 56 2011
Container Grown Plants
288
Evaluation of Eight Slow-release Fertilizers on the Growth of Container-grown
Spiraea x bumalda L. ‘Anthony Waterer’
James Robbins and Celina Gomez
Univ. of Ark. CES, 2301 S. Univ. Ave, Little Rock, AR 72204
Index Words: nutrition, nursery Significance to Industry: Based on the visual quality rating and the growth data, it would appear that container growers have several new slow-release fertilizer options. This project illustrates the value to growers in establishing small scale fertilizer trials to evaluate appropriate products under their growing conditions. Nature of Work: Slow-release fertilizers are the primary product used in the container nursery industry today. These technologies offer advantages to growers when compared to soluble granular fertilizer sources in that they offer the potential to reduce the amount of leachate loss of nutrients and decrease the number of applications required (1,2,3,4,5,6). The primary purpose of this research was to evaluate some of the newer slow-release fertilizers available to container growers. The experiment was conducted on an outdoor gravel container bed gravel area at the University of Arkansas Horticulture Research Farm (UAHRF) in Fayetteville, AR. On 6 May 2010, spirea (Spiraea x bumalda L. ‘Anthony Waterer’) liners were potted in # 2 plastic containers (Classic 600, Nursery Supplies Inc., Chambersburg, PA) using composted pine bark (SunGro, Pinebluff, AR) amended with pelletized dolomitic lime (M.K. Minerals, Manhattan, KS) at a rate of 15 lb·yd-3. Fertilizer products (Table 1) were applied at planting. The incorporation of fertilizer into the media was done by hand. Irrigation was applied as needed by hand watering. Treatments consisted of 8 single plant reps. The design was a completely randomized design. Containers were initially spaced can-tight, but spread to a 1X spacing after mid-July. Total soluble salts were measured 12 times over the 130 days of the study using the Virginia Tech pour-through method. Plants were harvested on 13 September 2010. Final plant width and height was recorded and a growth index (π x r2 x height) calculated. Shoots were dried in a forced-air oven (40 °C) for 48 hr and recorded as dry weight data. Results and Discussion: In general, leachate ECs for incorporation treatments were higher than for topdress (Table 2). All EC values tended to be the highest within the first 3 DAT but fell to acceptable levels by the end of the first week. For fertilizers that were incorporated, EC’s for Crystal Green 17-5-9 (P) were higher during the period 28
SNA Research Conference Vol. 56 2011
Container Grown Plants
289
DAT to 56 DAT than both Osmocote fertilizers (L & M), however, the Crystal Green was lower than both Osmocote products at day 98. Although a subjective measure, all spirea were of a saleable quality at harvest except for the unfertilized plants (F). In general, the trends for the final growth index and the shoot dry weight (SDW) were quite similar (Table 3). Shoot dry weight for all fertilizer treatments was significantly greater than for unfertilized plants (F). Incorporation of Osmocote Plus Hi-start 16-9-12 (L) resulted in the greatest SDW, however, this was statistically similar to results for Osmocote 16-9-11 topdress (A ), Osmocote 17-5-11 topdress (C), and Plantacote 14-8-15 (K). It is worth noting that in mid-July plants fertilized with the Crystal Green 17-5-9 fertilizer displayed a striking ‘bleaching’ of the new foliage, however, this symptom was totally absent at the final harvest. The 4-5 month Crystal Green 15-5-12 fertilizer performed well against the other 8-9 month longevity fertilizers especially considering how atypically hot the Fayetteville summer was. Literature Cited
1. Cabrera, R. I. 1997. Let the Nutrients Flow….Slowly. American Nurseryman 185(5): 32-35
2. Hulme, F. 2008. Controlled-release Fertilizers Give Growers Results. Nursery Management & Production. 24(3): 51-53
3. Landis, T.D. and R.K. Dumroese. 2009. Using Polymer-coated Controlled-release Fertilizers in the Nursery and After Outplanting. Forest Nursery Notes 29(1): 5-12
4. Ruter, J.M. 1992. Leachate Nutrient Content and Growth of Two Hollies as Influenced by controlled Release Fertilizers. J. Environ. Hort. 10(3): 162-166.
5. Worrall, R.J., G.P. Lamont, M.A. O’connell, and P.J. Nicholls. 1987. The Growth Response of Container-grown Woody Ornamentals to Controlled-release Fertilizers. Scientia Hortic. 32:275-286
6. Zinati, G. 2005. Nutrients and Nutrient Management of Containerized Nursery Crops. Rutgers Coop. Ext. Serv. Bulletin E303
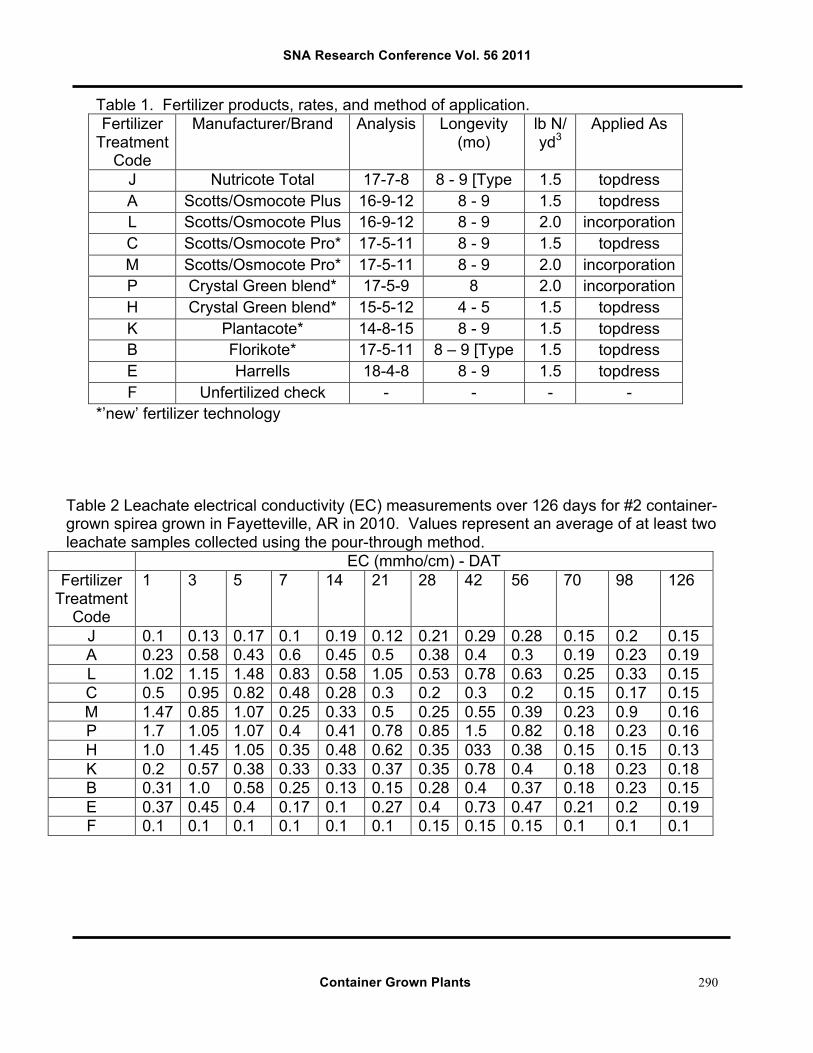
SNA Research Conference Vol. 56 2011
Container Grown Plants
290
Table 1. Fertilizer products, rates, and method of application. Fertilizer
Treatment Code
Manufacturer/Brand Analysis Longevity (mo)
lb N/ yd3
Applied As
J Nutricote Total 17-7-8 8 - 9 [Type 270]
1.5 topdress A Scotts/Osmocote Plus
Hi-start* 16-9-12 8 - 9 1.5 topdress
L Scotts/Osmocote Plus Hi-start*
16-9-12 8 - 9 2.0 incorporation C Scotts/Osmocote Pro* 17-5-11 8 - 9 1.5 topdress M Scotts/Osmocote Pro* 17-5-11 8 - 9 2.0 incorporation P Crystal Green blend* 17-5-9 8 2.0 incorporation H Crystal Green blend* 15-5-12 4 - 5 1.5 topdress K Plantacote* 14-8-15 8 - 9 1.5 topdress B Florikote* 17-5-11 8 – 9 [Type
270] 1.5 topdress
E Harrells 18-4-8 8 - 9 1.5 topdress F Unfertilized check - - - -
*’new’ fertilizer technology
Table 2 Leachate electrical conductivity (EC) measurements over 126 days for #2 container-grown spirea grown in Fayetteville, AR in 2010. Values represent an average of at least two leachate samples collected using the pour-through method.
EC (mmho/cm) - DAT Fertilizer
Treatment Code
1 3 5 7 14 21 28 42 56 70 98 126
J 0.1 0.13 0.17 0.1 0.19 0.12 0.21 0.29 0.28 0.15 0.2 0.15 A 0.23 0.58 0.43 0.6 0.45 0.5 0.38 0.4 0.3 0.19 0.23 0.19 L 1.02 1.15 1.48 0.83 0.58 1.05 0.53 0.78 0.63 0.25 0.33 0.15 C 0.5 0.95 0.82 0.48 0.28 0.3 0.2 0.3 0.2 0.15 0.17 0.15 M 1.47 0.85 1.07 0.25 0.33 0.5 0.25 0.55 0.39 0.23 0.9 0.16 P 1.7 1.05 1.07 0.4 0.41 0.78 0.85 1.5 0.82 0.18 0.23 0.16 H 1.0 1.45 1.05 0.35 0.48 0.62 0.35 033 0.38 0.15 0.15 0.13 K 0.2 0.57 0.38 0.33 0.33 0.37 0.35 0.78 0.4 0.18 0.23 0.18 B 0.31 1.0 0.58 0.25 0.13 0.15 0.28 0.4 0.37 0.18 0.23 0.15 E 0.37 0.45 0.4 0.17 0.1 0.27 0.4 0.73 0.47 0.21 0.2 0.19 F 0.1 0.1 0.1 0.1 0.1 0.1 0.15 0.15 0.15 0.1 0.1 0.1
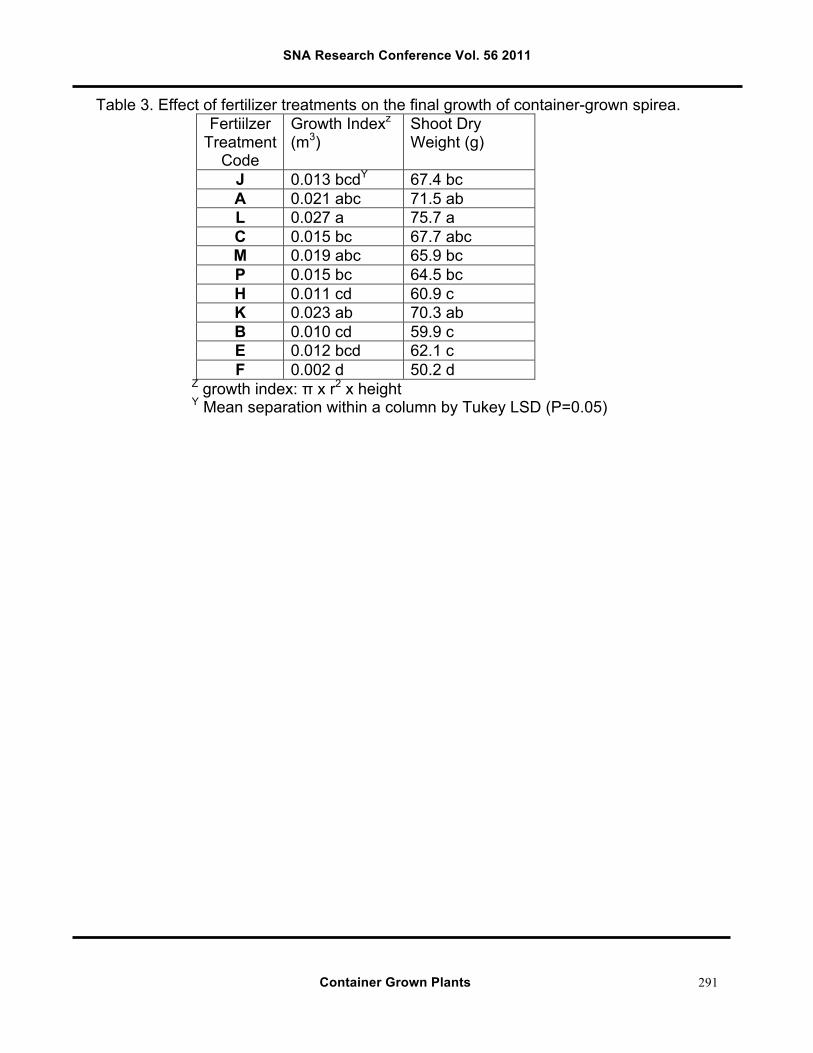
SNA Research Conference Vol. 56 2011
Container Grown Plants
291
Table 3. Effect of fertilizer treatments on the final growth of container-grown spirea. Fertiilzer
Treatment Code
Growth Indexz (m3)
Shoot Dry Weight (g)
J 0.013 bcdY 67.4 bc A 0.021 abc 71.5 ab L 0.027 a 75.7 a C 0.015 bc 67.7 abc M 0.019 abc 65.9 bc P 0.015 bc 64.5 bc H 0.011 cd 60.9 c K 0.023 ab 70.3 ab B 0.010 cd 59.9 c E 0.012 bcd 62.1 c F 0.002 d 50.2 d
Z growth index: π x r2 x height Y Mean separation within a column by Tukey LSD (P=0.05)
SNA Research Conference Vol. 56 2011
Container Grown Plants
292
Cedar Substrate Particle Size Affects Growth of Container-Grown Rudbekia
Zachariah Starr, Cheryl Boyer, Jason Griffin
Kansas State University
Department of Horticulture, Forestry and Recreation Resources, Manhattan, KS 66506
[email protected] Index Words: alternative substrates, container media, eastern redcedar, nursery crops, pine bark, Rudbeckia fulgida Significance to Industry: This study evaluated the growth of a perennial crop, Rudbeckia fulgida var. fulgida (black-eyed susan), in five substrates consisting of either pine bark (PB) or cedar (Juniperus virginiana L.) chips ground to pass a 3/16-, 3/8-, 1/2-or 3/4-inch screen. As substrate particle size increased shoot dry weight decreased though plant growth indices was generally similar and most plants were marketable. Substrate EC did not vary between treatments at any rating date while pH varied at each rating date until termination at which time pH of all treatments pHs had reached a similar level. These results indicate that J. virginiana chips can be used as a substrate for container-grown Rubeckia when processed at all 4 screen sizes, but performed best at 3/16-inch screen size. Nature of Work: Pine bark is the typical material used for nursery production of container grown plants throughout the much of U.S. (11). With the closing and relocation of timber mills and use of PB as an alternative energy source for those mills, PB is becoming less available and more costly to purchase (4, 6). Regions without large pine forests, such as the Great Plains, experience a compounded price increase due to transportation costs for nursery substrates. This has lead to a demand for alternative substrates to supplement or replace PB supplies. Eastern red cedar is endemic to the Great Plains and has spread rapidly due to reduced natural controls (community development resulting in less natural fires). In addition, its use in wind breaks and for wildlife cover has resulted in an increased seed population which has lead to an eastern red cedar population boom (2, 8). This large eastern red cedar population has negative effects on the native grasslands of the Great Plains by altering species composition (species richness, forb cover, and grass cover), soil moisture, blocking incoming solar radiation, decreasing soil temperature and alterations to litter dynamics (5, 3). As loss of native grasslands increases, less forage area for livestock is available which increases handling costs for the livestock industry (7). Utilization of eastern redcedar whole tree chips as a substrate component could alleviate PB demand in the Great Plains with a sustainable, local resource that improves the grassland ecosystem by reducing unwanted eastern redcedar populations. Previous work showed that eastern redcedar chips milled to pass a 3/4-inch screen can function as a substrate for Taxodium distichum (Bald Cypress) but worked best as an amendment to a PB mix (9). Plants
SNA Research Conference Vol. 56 2011
Container Grown Plants
293
grown in substrates that contained 80% eastern redcedar chips and 20% sand had reduced container capacity due to elevated air-space when compared to other mixes containing both PB, cedar, and sand or PB and sand (9). The purpose of this investigation was to determine at what particle size, if any, cedar can be used to produce a container-grown perennial crop, Rudbeckia fulgida var. fulgida, comparable to plants grown in PB. Juniperus virginiana chips (cedar) (Queal Enterprises. Pratt, KS) from whole trees harvested in Barber County, KS (aged for six months) were ground in a hammer mill (C.S. Bell Co., Tiffin, OH, Model 30HMBL) to pass a 3/16-, 3/8-, 1/2-,or 3/4-inch (4.76 mm, 9.53 mm, 12.70 mm, 19.05 mm) screen on April 28th 2010. The cedar and a PB (SunGro, Bellevue, WA) control were then blended with sand to make a series of five 80% wood : 20% sand (by vol.) substrate mixes. Substrates were pre-plant incorporated with 2 lbs/yd3 (1.17 kg/m2) micronutrient package (Scotts, Micromax, Marysville, OH) and controlled release fertilizer at a medium rate of 14.5 lbs/yd3 (8.60 kg/m2) (Scott’s, Osmocote Classic , 18-6-12, 8 to 9 month release, Marysville,OH). Two-gallon (8.7 L) containers were then filled and planted with liners (one per container from a 72 cell pack) of Rudbeckia fulgida var. fulgida L (Creek Hill Nursery, Leola, PA.). Containers were placed on an outdoor gravel container pad and irrigated daily via overhead sprinklers supplying approx. 1-in. of precipitation daily. Data collection began on May 13th, 16 days after planting (DAP), and continued once every 4 weeks (43 DAP, 71 DAP) until termination on August 11 (106 DAP). Data collected included pH and electrical conductivity (EC) using the PourThru technique (10), leaf greenness as measured with a SPAD meter, and growth indices [(widest width + perpendicular width + height) ÷ 3] at 16, 43, 71, and 106 DAP. Shoot dry weight was recorded at the conclusion of the study (106 DAP) by drying in a forced air oven (The Grieve Co. Model SC-400, Round Lake, IL) at 160oF (71.11 °C) for 7 days. Substrate physical properties were determined using North Carolina State University porometers (Raleigh, NC), which measured substrate air space, water holding capacity, substrate bulk density, and total porosity (1). Data were analyzed using SAS (Version 9.1 SAS Institute Inc. (Cary, NC) The experimental design was a randomized complete block with a factorial arrangement of treatments and eight single plant replications. Results: All cedar-based substrate had pH reading that were similar to each other at 16 and 43 DAP, and higher than the PB substrate (Table 1). Greater variation occurred at 71 DAP with pH of PB remaining low compared to cedar substrates, while 3/4-inch cedar had the highest pH. There were no significant differences in pH between treatments at the conclusion of the study106 DAP. Irrigation water pH averaged 7.52. There were no significant differences between substrate EC in any treatment at all measurement dates (Table 1). Growth indices of Rudbeckia fulgida var. fulgida at 106 DAP varied by substrate with plants growing in PB and 3/16-inch cedar producing the largest plants and 1/2-inch cedar producing the smallest plants (Table 2). Plants grown in substrates containing 3/4-and 3/8-inch cedar were similar to all other treatments. Dry weight of the shoot
SNA Research Conference Vol. 56 2011
Container Grown Plants
294
tissues varied greatly between treatments. Plants grown in PB had the greatest shoot dry weight with 3/16-inch cedar producing the greatest mass of the cedar substrates. Substrates of 1/2- and 3/4-inch cedar were similar and had the least mass while plants grown in 3/16-inch cedar had the greatest mass of the cedar treatments (Table 2). Leaf greenness, measured with a SPAD meter on four recently matured leaves, initially varied at 16 DAP but there were no significant differences between substrates thereafter (data not shown). Generally, as cedar particle size increased container capacity decreased with increasing air space as shown in the previous study (11). Correspondingly, shoot dry weight and growth indices decreased in a similar manner. Pine bark had the greatest container capacity and least air space produced plants with the greatest shoot dry weight and growth indices. Container capacity of both 1/2- and 3/4- inch cedar was outside the recommended range of 45% to 65%. Similarly, airspace of 1/2- and 3/4- inch cedar was also outside the recommended range of 10 – 30%. However, container capacity and air space of 3/8-inch cedar was close to the recommended ranges. Interestingly, PB also fell outside of the recommended ranges for container capacity and air space. However, 3/16-inch cedar substrate was within recommended ranges for both container capacity and air space and had the second greatest growth and shoot dry weight after plants grown in PB. Pine bark had greater bulk density and total porosity than all cedar treatments, which were similar regardless of processed screen size (11) (Table 3). Despite not performing quite as well as PB, 3/16-cedar could be a viable substrate for Rudbeckia fulgida var. fulgida. The savings on substrate materials could make up for slightly less plant growth. Additionally, the decreased bulk density of cedar could decrease the cost of shipping finished products while smaller plant size might also allow for more plants to be shipped per load. Despite less growth, most plants were in marketable condition at the conclusion of the study (3 months). All cedar treatment plants were root bound to the container and plants grown in PB had the upper half of the container densely populated with roots (data not shown). Future studies could involve evaluating root growth of perennial crops grown in cedar based substrates, alterations to cedar substrate pH, and mixing substrate particle sizes. This is encouraging for Plains states growers as they look for new sources of nursery substrate materials. Additionally property owners with large cedar populations could earn income from harvest and sale of eastern red cedar trees to horticultural industries. Literature cited: 1. Fonteno, W.C. and T.E. Bilderback. 1993. Impact of hydrogel on physical properties of coarse-structured horticultural substrates. J. Amer. Soc. Hort Sci. 118: 217-222. 2. Ganguli, A.C., D.M. Engle, P.M. Mayer, and E.C. Hellgren. 2008. Plant community diversity and composition provide little resistance to Juniperus encroachment. Botany 86:1416-1426.
SNA Research Conference Vol. 56 2011
Container Grown Plants
295
3. Gehring, J.L. and Bragg, T.B. 1992. Changes in prairie vegetation under eastern red cedar (Juniperus virginiana L.) in an eastern Nebraska Bluestem prairie. The American Midland Naturalist. 128(2): 209-217. 4. Griffin, J.J. 2009. Eastern red-cedar (Juniperus virginiana) as a substrate component for container production of woody plants. HortSci. 44:1131. 5. Linneman J.S. and M.W. Palmer. 2006. The effect of Juniperus virginiana on plant species composition in an Oklahoma grassland. Community Ecology 7(2): 235-244. 6. Lu, W., J.L. Sibley, G.H. Gilliam, J.S. Bannon, and Y. Zhang. 2006. Estimation of U.S. bark generation and implications for horticulture industries. J. Environ. Hort. 24: 29-34. 7. Ortmann, J., J. Stubbendieck, R.A. Masters, G.H. Pfeiffer, and T.B. Bragg. 1998. Efficacy and costs of controlling eastern redcedar. J. of Range Mgmt. 51: 158-162. 8. Owensby C.E., K.R. Blan, B.J. Eaton, and O.G. Russ. 1973. Evaluation of Eastern redcedar infestations in the Northern Kansas Flint Hills. J. of Range Mgmt. 26: 256-259. 9. Starr, Z., C. Boyer, and J. Griffin. 2010. Growth of containerized Taxodium distichum in a cedar-amended substrate. Proc. Southern Nurs. Assoc. Res. Conf. (In Press) 10. Wright, R.D. 1986. The pour-thru nutrient extraction procedure. HortSci. 21: 227-229. 11. Yeager T. (editor). 2007. Best management practices: Guide for producing nursery crops. 2nd ed. The Southern Nursery Association, Atlanta, GA. Table 1. pH and EC of cedar- and PB-based substrates. 16 DAPz 43 DAP 71 DAP 106 DAP
Substrates pH EC
(µS/cm) pH EC pH EC pH EC
Pine Bark 6.02 by 1.16 a 6.06 b 0.64 a 6.28 c 0.96
a 6.80
a 1.09
a 3/16- inch
cedar 6.88 a 1.10 a 7.28 a 0.83 a 6.80 b 0.73 a
6.84 a
1.26 a
3/8-inch cedar 6.94 a 1.02 a 7.18 a 0.67 a 7.21 ab
1.00 a
7.03 a
1.31 a
1/2-inch cedar 6.92 a 1.02 a 7.24 a 0.75 a 7.04 ab 0.96 a
6.95 a
1.37 a
3/4-inch cedar 7.05 a 1.01 a 7.39 a 0.64 a 7.34 a 0.94 a
7.22 a
1.30 a
zDays after planting yMeans within column followed by the same letter are not significantly different based on Waller-Duncan k ratio t tests (α = 0.05, n = 4).
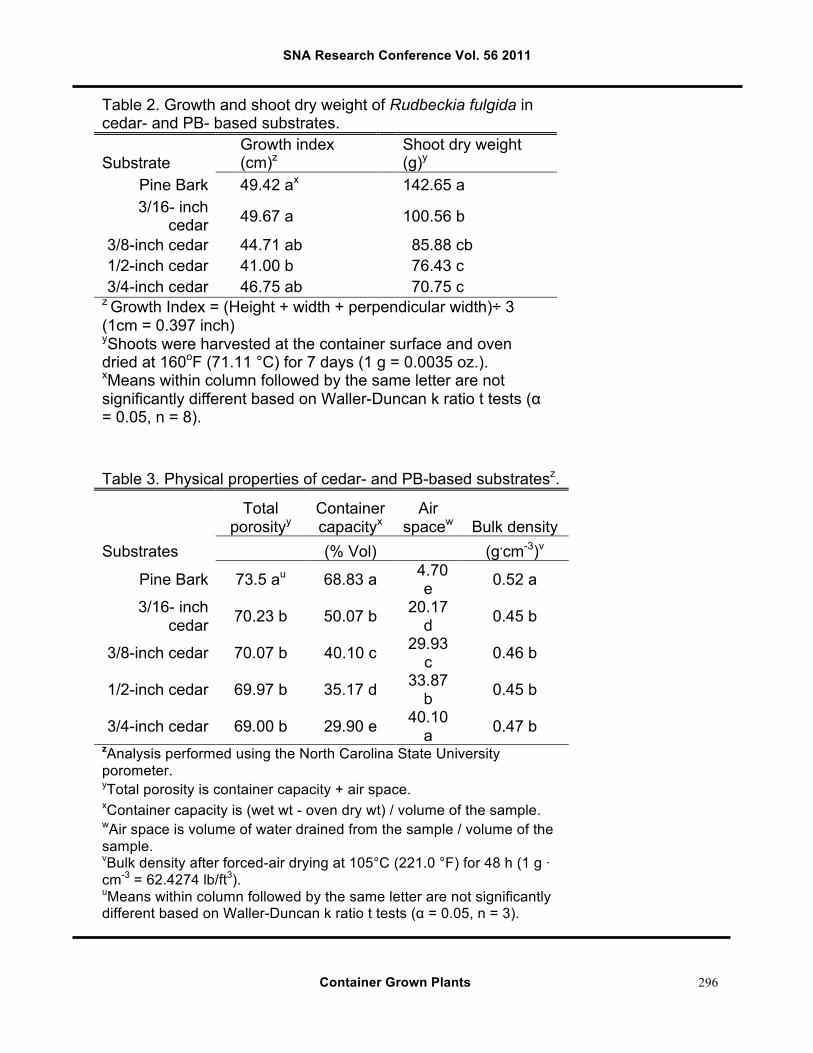
SNA Research Conference Vol. 56 2011
Container Grown Plants
296
Table 2. Growth and shoot dry weight of Rudbeckia fulgida in cedar- and PB- based substrates.
Substrate Growth index
(cm)z Shoot dry weight (g)y
Pine Bark 49.42 ax 142.65 a 3/16- inch
cedar 49.67 a 100.56 b
3/8-inch cedar 44.71 ab 85.88 cb 1/2-inch cedar 41.00 b 76.43 c 3/4-inch cedar 46.75 ab 70.75 c
z Growth Index = (Height + width + perpendicular width)÷ 3 (1cm = 0.397 inch) yShoots were harvested at the container surface and oven dried at 160oF (71.11 °C) for 7 days (1 g = 0.0035 oz.). xMeans within column followed by the same letter are not significantly different based on Waller-Duncan k ratio t tests (α = 0.05, n = 8).
Table 3. Physical properties of cedar- and PB-based substratesz.
Total
porosityy Container capacityx
Air spacew Bulk density
Substrates (% Vol) (g.cm-3)v
Pine Bark 73.5 au 68.83 a 4.70 e 0.52 a
3/16- inch cedar 70.23 b 50.07 b 20.17
d 0.45 b
3/8-inch cedar 70.07 b 40.10 c 29.93 c 0.46 b
1/2-inch cedar 69.97 b 35.17 d 33.87 b 0.45 b
3/4-inch cedar 69.00 b 29.90 e 40.10 a 0.47 b
zAnalysis performed using the North Carolina State University porometer. yTotal porosity is container capacity + air space. xContainer capacity is (wet wt - oven dry wt) / volume of the sample. wAir space is volume of water drained from the sample / volume of the sample. vBulk density after forced-air drying at 105°C (221.0 °F) for 48 h (1 g · cm-3 = 62.4274 lb/ft3). uMeans within column followed by the same letter are not significantly different based on Waller-Duncan k ratio t tests (α = 0.05, n = 3).
SNA Research Conference Vol. 56 2011
Container Grown Plants
297
Pine Tree Substrate pH as Affected by Storage Time and Lime and Peat Moss Amendments
Linda L. Taylor, Alex X. Niemiera, and Robert D. Wright
Department of Horticulture, Virginia Tech, Blacksburg, VA 24061
Index Words: Container crop production, Pinus taeda L. Significance to Industry: Pine tree substrate (PTS), one of the newly emerging substrates for container crop production (1), is manufactured by chipping and then milling pine (Pinus taeda L.) logs to a desired particle size. The pH of freshly manufactured PTS is generally within the 5.6 to 6.2 range recommended for soilless substrates (2), but with storage, PTS pH has been observed to decrease to values below those recommended (unpublished data). Further, PTS is often amended with peat moss, and this has been shown to decrease substrate pH compared to 100% PTS (3). In this work, we found that a lime rate of 1 kg·m-3 (1.7 lbs·yd-3) was sufficient to keep PTS pH values at 5.8 or higher when stored for up to 1 year, whereas a lime rate of 4 kg·m-3 (6.7 lbs·yd-3) was necessary to maintain pH values of PTS amended with 25% peat moss (v:v) at 5.8 or higher. Thus growers need to be aware that lime may be needed in instances where PTS is stored or amended with peat moss to maintain substrate pH values at or above the desired minimum value. Nature of Work: Pine bark and peat moss are the major substrates used for container crop production in the greenhouse and nursery industries. However, more affordable, sustainable, and available alternatives are being developed; pine tree substrate (PTS) is one such alternative. PTS is manufactured by chipping and then milling pine (Pinus taeda L.) logs. Whereas pine bark and peat moss are both composted materials with established liming rates, PTS is not composted and therefore its chemical parameters, such as pH, may change over time. The objective of this study was to determine how PTS pH is affected by storage time and lime and peat moss amendments. There were 10 substrate treatments. Five treatments were 100% PTS, passed through a 4.76 mm (3/16 inch) screen and amended with pulverized dolomitic limestone at rates of 0, 1, 2, 4, or 6 kg·m-3 (0, 1.7, 3.4, 6.7, and 10.1 lbs·yd-3), and five treatments consisted of PTS passed through a 15.88 mm (5/8 inch) screen, amended with peat moss in a ratio (vol:vol) of 3PTS:1 peat moss (PTSP), and with pulverized dolomitic limestone at the rates of 0, 1, 2, 4, or 6 kg·m-3. All substrate treatments received 0.59 kg·m-3 (1 lb·yd-3) of calcium sulfate (Espoma Organic Traditions). Substrates were placed in 0.08 m3 (2 cubic foot) perforated plastic storage bags (April 2009) and stored on shelves in an open shed in Blacksburg, Virginia. Substrates were subsampled at 1, 42, 84, 168, 270, and 365 days. At the time of subsampling, each substrate treatment was mixed to ensure uniformity, a subsample was taken, and six 1-Liter containers were filled. Each
SNA Research Conference Vol. 56 2011
Container Grown Plants
298
container then received 500 ml of tapwater. The following day, substrate solutions were extracted using the Virginia Tech Extraction Method (VTEM) and solution pH was measured. Results and Discussion: For all days and all lime rates, PTS had higher pH values than the corresponding PTSP treatments, except the 6 kg·m-3 lime rate on day 1 where values were equal, due to the acidifying effect of peat moss (Table 1). For PTS, the increase in pH between the 0 and 1 kg·m-3 lime rates was greater than the increases between the higher lime rates for all subsampling times. In general, there were relatively large pH increases with the incremental additions of lime for PTSP throughout the 365 days except between 4 and 6 kg·m-3. From the first subsampling day to day 42, pH values decreased in all substrate and lime treatments. However, by day 84, pH values for all limed PTS treatments had increased to values higher than those found at the first subsampling date. For PTSP, day 84 pH values were as high, or higher than first subsampling day values in only the 4 and 6 kg·m-3 lime rates. From days 84 to 168, pH values for all treatments remained relatively stable. By day 270, pH in PTS had decreased by 0.2 units in both the 0 and 1 kg·m-3 lime rate treatments, while remaining stable in the 2, 4, and 6 kg·m-3 lime rate treatments. In contrast, pH in PTSP had decreased in all lime rate treatments with larger decreases in the lower lime rate treatments. By the end of the experiment, day 365 (April 2010), pH values of all the limed PTS treatments were as high, or higher, than day 1 values, while the pH of unlimed PTS decreased from 5.8 to 5.0. For PTSP, pH values of all treatments, unlimed and limed, were lower than day 1 values, with the pH of the unlimed treatment decreasing from 5.2 to 4.1. In this study the acidifying effect of both storage time and peat moss amendment on PTS was clearly evident. A lime rate of 1 kg·m-3 was sufficient to maintain PTS pH at or above 5.6 (the lower limit of the recommended range for soilless substrates) under storage conditions for at least 365 days. A lime rate of 4 kg·m-3 was required in this study to maintain a pH value of at least 5.6 in PTSP under storage conditions for 365 days. Literature Cited:
1. Wright, R.D. and J.F. Browder, 2005. Chipped pine logs: a potential substrate for greenhouse and nursery crops. HortScience 40: 1513-1515.
2. Bailey, D.A., 1996. Alkalinity, pH, and acidification. In: Water, media and nutrition for greenhouse crops. D.W. Reed, ed., Batavia, Ill., Ball Publishing.
3. Jackson, B.E., R.D. Wright, and N. Gruda, 2009. Container medium pH in a pine tree substrate amended with peatmoss and dolomitic limestone affects plant growth. HortScience 44: 1983-1987.
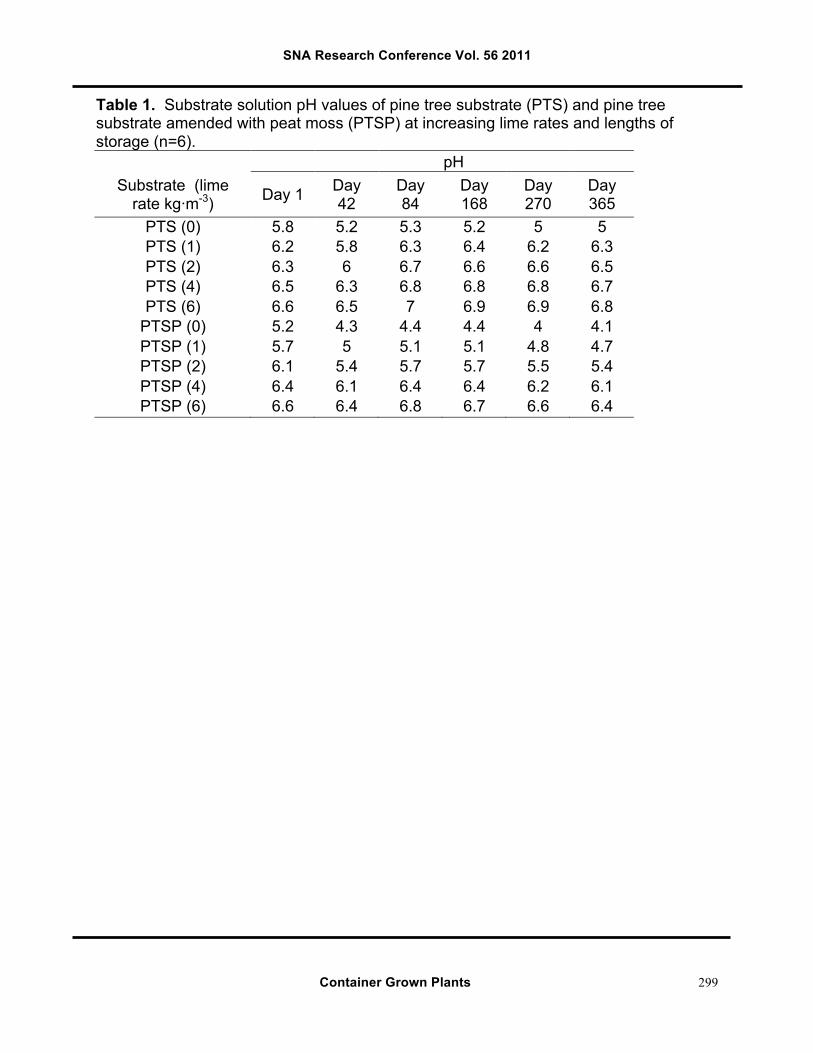
SNA Research Conference Vol. 56 2011
Container Grown Plants
299
Table 1. Substrate solution pH values of pine tree substrate (PTS) and pine tree substrate amended with peat moss (PTSP) at increasing lime rates and lengths of storage (n=6).
pH Substrate (lime
rate kg·m-3) Day 1 Day 42
Day 84
Day 168
Day 270
Day 365
PTS (0) 5.8 5.2 5.3 5.2 5 5 PTS (1) 6.2 5.8 6.3 6.4 6.2 6.3 PTS (2) 6.3 6 6.7 6.6 6.6 6.5 PTS (4) 6.5 6.3 6.8 6.8 6.8 6.7 PTS (6) 6.6 6.5 7 6.9 6.9 6.8
PTSP (0) 5.2 4.3 4.4 4.4 4 4.1 PTSP (1) 5.7 5 5.1 5.1 4.8 4.7 PTSP (2) 6.1 5.4 5.7 5.7 5.5 5.4 PTSP (4) 6.4 6.1 6.4 6.4 6.2 6.1 PTSP (6) 6.6 6.4 6.8 6.7 6.6 6.4
SNA Research Conference Vol. 56 2011
Container Grown Plants
300
Utilization of Potato Sludge Waste as a Substrate Amendment in Horticulture Crop Production
Matthew S. Wilson and Jeff L. Sibley
Auburn University Department of Horticulture
101 Funchess Hall Auburn University, AL 36849-5408
Index Words: tomato, petunia, herbaceous ornamentals, alternative media Significance to Industry: ‘Dreams Burgundy’ petunia and ‘Champion II’ tomato were grown in soilless substrates containing various percentages of dried potato sludge waste. Preliminary results indicate dried potato sludge used in small proportions may be used to grow plants in a pine bark: sand media. Nature of Work: Businesses are facing increasingly stringent regulation of waste and manufacturing by-products from government agencies and environmental protection groups. To meet new regulations and increase marketability among environmentally conscious customers, businesses need to find environmentally appropriate solutions to re-use and dispose of current waste products. Additionally, many in the horticulture industry are finding the traditional soilless substrates such as pine bark (PB) and peat (P) are in short supply and increased demand and pricing due to recovery of PB by pulp mills to offset energy costs, increased shipping/fuel costs to transport P from Canada and the northern U.S., and decrease of domestically grown lumber due to cheaper imports (1). By deploying and integrating various waste materials within horticultural production substrates, both businesses and nursery producers may find environmentally and economically favorable benefits in working together. Potato sludge waste (PSW) is a by-product of the potato chip manufacturing process. PSW consists of soil residue, potato peels, water used to clean potatoes and equipment, some starch, and polymers used to bring solids out of suspension. PSW (minus polymers) is the solid portion of the effluent normally discharged to sewer systems, requiring expense for the manufacturer and extensive cleanup by municipal sewage treatment facilities. With increasing regulation and costs associated with treatment of the effluent, many potato chip manufacturers are incorporating on-site treatment facilities to collect the solids (PSW) and clean and treat the water for storm water and industrial stream discharge. Depending on scale of the operation and volume of production, potato chip manufacturers may be left with large amounts of PSW to dispose into landfills. In 2010, a preliminary trial was conducted to evaluate PSW as a potential substrate amendment for the growth of two herbaceous plants. In June of 2010, petunia (Petunia x hybrida ‘Dreams Burgundy’) and tomato (Lycopersicon lycopersicum ‘Champion II’) #512 size plugs were planted into 3 in. diameter pots for petunia and 3.5 in diameter, tall (5 in.) pots for tomato containing one of four prescribed substrate treatments using various percentages of pine bark (PB), sand (S), and dried potato sludge waste (PSW). The four substrates were 85:15 PB:S;
SNA Research Conference Vol. 56 2011
Container Grown Plants
301
77:13:10 PB:S:PSW; 68:12:20 PB:S:PSW; and 59:11:30 PB:S:PSW. All substrates contained pre-plant incorporations of 1 lb/yd3 Micromax™ (Scotts Company, Marysville, Ohio), 10 lbs/yd3 dolomitic limestone, and 5.5 lbs/yd3 Osmocote™ (19-6-12, 3-4 mo.) (Scotts Company). Each species was arranged in a randomized complete block design (RCBD) inside a greenhouse at the Paterson Greenhouse Complex in Auburn, Alabama. Each species contained twelve blocks with four plants per block. All plants were hand watered as necessary. One week after planting, all plants were irrigated with a 75 ppm fertilizer solution alternating (20-10-20) and (14-4-14) for petunia and (14-4-14) only for tomato. Three to eight weeks after planting, all plants were fertilized at 100 ppm alternating (20-10-20) and (14-4-14) for petunia and every three days with (14-4-14) for tomato. Plants were irrigated with clear water on weekends (petunias) and between fertilizations (tomatoes). Fertilization rates were 50% of the recommended rate (Ball Horticultural Company, West Chicago, Illinois) (2) due to incorporation of slow release fertilizer. The experiment was terminated eight weeks after planting. Growth indices, root ratings, flower counts (petunia), and foliar chlorophyll content were collected. Growth indices were measured and calculated by averaging one width, the width perpendicular to width 1, and the height in centimeters. Root ratings were assessed and assigned using a 1 - 4 numeric scale based on the estimated percent root coverage of the root ball (1 = 0-25%, 4 = 75-100%). Average foliar chlorophyll content of three leaves per plant was collected using the SPAD-502 Chlorophyll Meter (Konica Minolta, Tokyo). Data was analyzed using Fisher’s Least Significance Difference (LSD) (α = 0.05). Results and Discussion: Analysis of the data for both petunia and tomato revealed that 85:15 PB:S and 77:13:10 PB:S:PSW performed similarly in growth indices and foliar greenness (Table 1). 85:15 PB:S had the highest root rating for tomato and had a similarly high root rating as 77:13:10 PB:S:PSW in petunia (Table 1). Treatments 68:12:20 PB:S:PSW and 59:11:30 PB:S:PSW performed below treatments containing 10 percent or less PSW in regard to growth indices and root rating for both species. Additionally, substrates containing 30 percent PSW performed significantly less than substrates containing 0 or 10 percent PSW (Table 1) for both petunia and tomato. Fewer differences were seen with petunia, based on visual observation and root ratings, which indicated that petunias had a better tolerance for the increased percentages of PSW than tomato (Table 1). Visual observations during root rating suggests that water holding capacity may have the most significant role in determining the suitability of potato sludge waste as a soilless media amendment. Media containing more than 20 percent PSW were soaked at the bottom of the container and had a malodorous scent, suggesting anaerobic conditions brought on by increased water holding capacity of the substrate. A replication study examining the nutrient effects of the substrates amended with PSW through maintaining equal substrate moisture content across substrates is currently in progress. Results suggest ‘Dreams Burgundy’ petunias and ‘Champion II’ tomatoes can be grown in PB:S substrates containing 10 percent or less PSW.
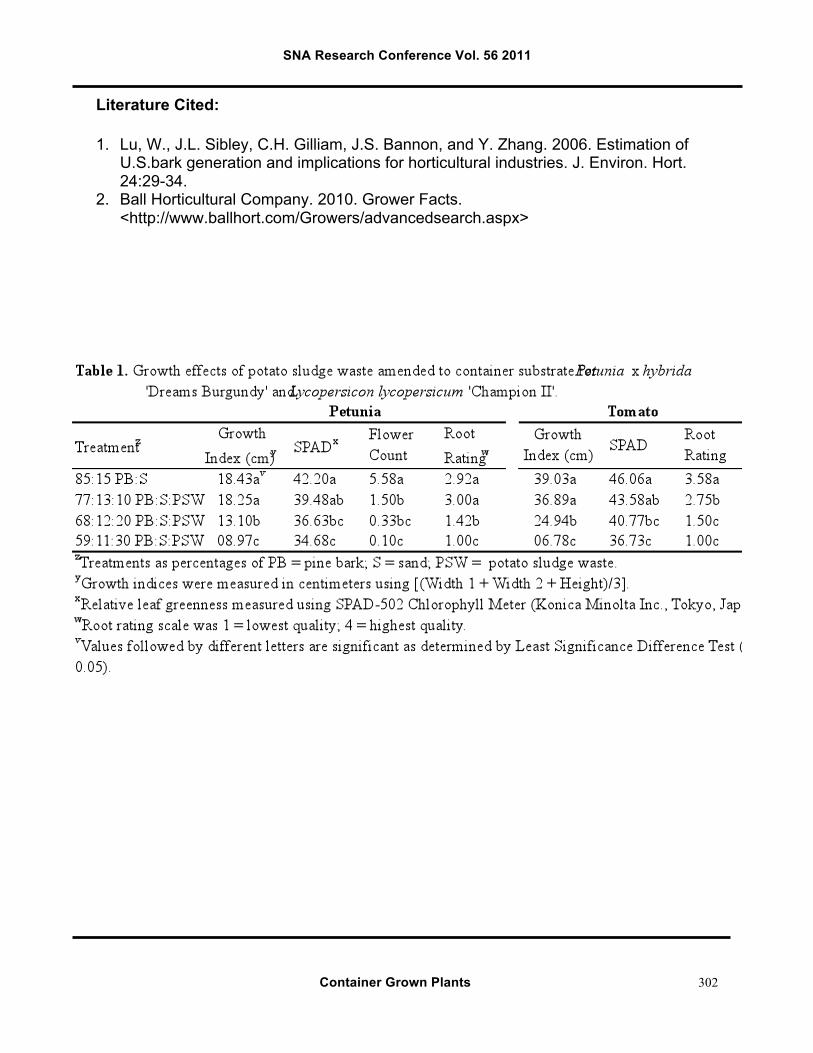
SNA Research Conference Vol. 56 2011
Container Grown Plants
302
Literature Cited:
1. Lu, W., J.L. Sibley, C.H. Gilliam, J.S. Bannon, and Y. Zhang. 2006. Estimation of U.S.bark generation and implications for horticultural industries. J. Environ. Hort. 24:29-34.
2. Ball Horticultural Company. 2010. Grower Facts. <http://www.ballhort.com/Growers/advancedsearch.aspx>