Contact information: [email protected]€¦ · · 2017-08-27Tell Me still shows you the...
140
Transcript of Contact information: [email protected]€¦ · · 2017-08-27Tell Me still shows you the...

What You Will Be Learning
Sort data by single or multiple columns
Filter data by single or multiple criteria
Manage a multi-sheet workbooks
Learn to select the appropriate formula or function for the task at hand
Create formulas that include absolute references and named ranges
Create custom page headers and footers
Apply styles and conditional formatting2


New FeaturesNew features
Number of rows on a worksheet has gone from 65,536 to 1,048,576
Number of columns has increased from 256 to 16,384
You can write longer formulas in the new resizable Formula Bar
Improved ability to open corrupt files and recover some of your files
Workbooks are more compressed; file size is approximately 50 percent to 75 percent smaller than in previous versions of Excel
4

The Excel Interface When you open Excel 2013 or 16 for the first time, the
Excel Start Screen will appear. This is where can create:
New workbooks
Choose a template
Access your recently edited workbooks

What are Templates Templates are workbook you create to
automate common tasks like:
Filling in invoices
Expense statements
Purchase orders
Inventory Reports

Where to Locate Templates Click the Office Button
Select New then click Installed Templates
All the templates currently installed on your computer will be listed
Highlight the template you want to use and click Create
A new file will open in the template you’ve selected
7

8
Locating a Previously Used Template
Click Office Button then My templates

Exploring the Excel 2016 Program Window
9

Working with Tabs and the Ribbon There are 3 basic components to the Ribbon:
Tabs – There are 8 located across the top each representing a core tasks
Groups - Each tab has groups that show related items together
Commands - Is a button which enters information, or a menu
10

More about Tabs and Ribbon The principal commands in Excel are gathered on the Home tab
Clipboard Group Pasting/Cutting/Copy
Font Group Font formatting
Alignment Group Aligning text
Cells Group Inserting/deleting cells, rows, columns, & worksheets
Groups - pull together all the commands needed for a particular task Remain on display throughout the task they remain on display
11

Contextual Tabs
12
Are specialized, temporary ribbon tabs
Display commands for working with a particular type of worksheet content
Appear when you select the associated content type
Can contain one or multiple other tabs that contain command groups

Contextual Tabs
13
You can make Contextual Ribbon Commands available by selecting relevant objects in your workbook
Chart Tools tabs

Quick Access Toolbar
Click the arrow next to the Quick Access Toolbar
Then click each of the commands you want to add
Don’t add too many that it overtakes the
title bar

Adding Commands
If you often use commands that are not easily found - add them to the Quick Access Toolbar
For example, if you use AutoFilter every day, and you don't want to have to click the Data tab to access the Filter command
Right-click Filter on the Data tab > then click Add to Quick Access Toolbar
15
Remove a button > right-click the button on the toolbar > then click Remove from Quick Access Toolbar

Dialog Box Launcher
16
When you click the Dialog Box Launcher in the Font group, the Format Cells dialog box will open with the Font tab displayed
When you see this arrow in the lower-right corner of a group, there are more options available for the group.

Hide the Ribbon
Create more room on the screen to work
17
Expanded view
Collapsed view
Click any Tab 3Xs

What About Your Favorite Keyboard Shortcuts? The Ribbon design comes with 2 new shortcuts
advantages: 1. Shortcuts for every single button on the Ribbon
2. Shortcuts that often require fewer keys
Centering Text Press ALT to make the Key Tips appear
Then press H to select the Home tab
Press A, then C in the Alignment group to center the selected text
18

A New View We now have a variety of viewing options
These views can be useful for various tasks like printing
Locate the commands in the bottom-right corner of the Excel window
The views are:
Normal view
Page Layout view
Page Break view
19

Headers and Footers 1st change to Page Layout view
Then click in the area that says Click to add header
Immediately the Header & Footer Tools and the Design tab appear
20

New “Tell Me” Is there to help you find the command you need fast
By allowing you to access all the command buttons that an app has to offer in one place
Even if your current context is not the right one for a specific command
Tell Me still shows you the command

Backstage View Backstage view gives you
various options for:
Saving
Opening a file
Printing
Sharing your document
On the Ribbon, click the File tab

Using Worksheets and Workbooks When Excel is opened a blank workbook is created
(called Book1) containing 1 worksheet
A workbook can be made up of many worksheets
23
Click the plus sign to add a new worksheet
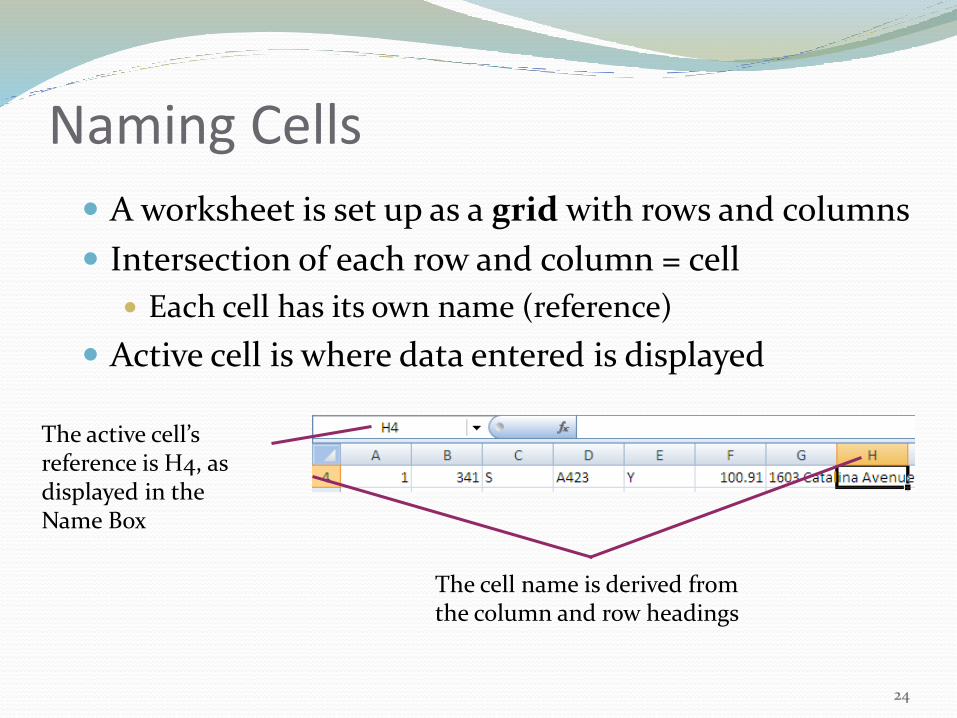
Naming Cells
A worksheet is set up as a grid with rows and columns
Intersection of each row and column = cell
Each cell has its own name (reference)
Active cell is where data entered is displayed
24
The active cell’s reference is H4, as displayed in the Name Box
The cell name is derived from the column and row headings
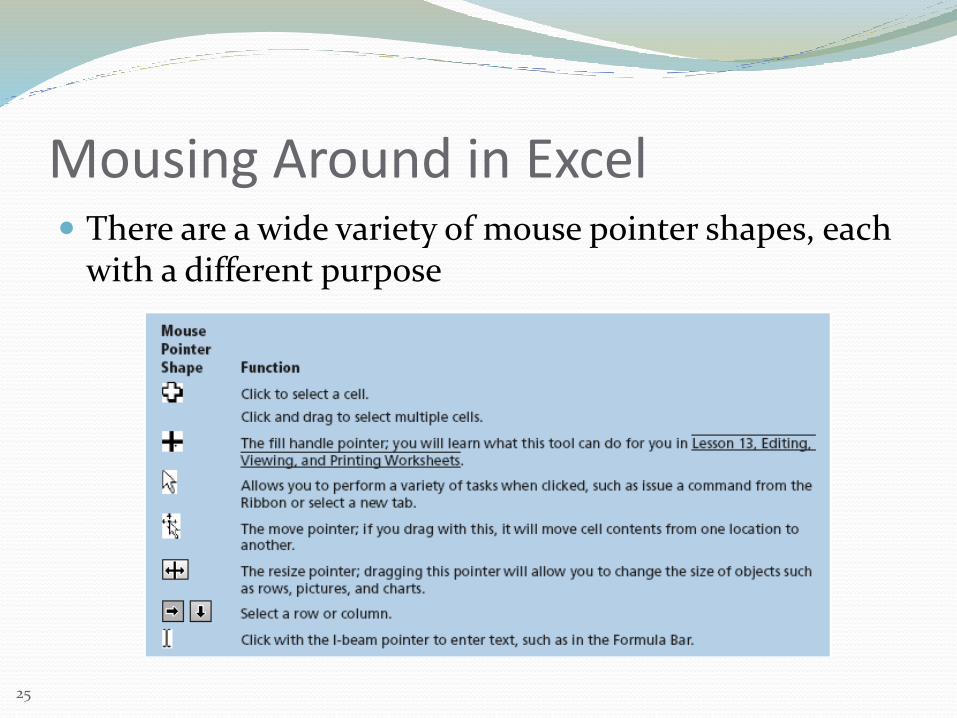
Mousing Around in Excel There are a wide variety of mouse pointer shapes, each
with a different purpose
25

Formulas
26

Constant ValuesThere are two types of constant values:
numbers and text.
Numbers: which are right-aligned, and include digits between 0 and 9
Text: contains any other character, and is usually left-aligned
27

Working with Numbers
Numbers can be used in formulas and functions
Number entries can include the digits 0-9 and + - ( ) , / $ % *
28

Working with Numbers Enter numbers without formatting and apply the
formatting later, except…
You must enter a decimal or indicate a negative number with a minus sign or parentheses
To format the Number group on the Home tab allows you to choose how numbers in selected cells will appear
29
General
Dollar
Percentage
Comma
More decimals
Fewer decimals
Quick #-Formatting Commands

AutoComplete If the first few characters you type match another
entry in the column—
AutoComplete will offer to complete the entry for you
Accept by tapping [Enter]
Reject by typing the remainder of the entry yourself
30

AutoFill
Quickly extend a series, copy data, or copy a formula into adjacent cells with the fill handle
Copy an entry
Expand a repeating series of numbers
AutoFill of date entries
31

Fill data into adjacent cells Using Auto Fill
Select the cells that contain the data that you want to fill into adjacent cells
Drag the fill handle across the cells that you want to fill
Small black square in the lower-right corner of the selection
When you point to the fill handle, the pointer changes to a black cross
32

The Fill HandleUse the Fill Handle to:
Copy text or numbers into adjacent cells
Expand a repeating number series
Automatically fill a date series
Copy formulas
33
Fill Handle
33

Editing the Active Cell To change the contents of a cell completely ~ select the
cell and type
Single-click: edit in formula bar
Double-click: edit inside the cell
Select the cell and tap the F2 button
34
Insertion point
Reposition the insertion point in the Formula Bar to edit the contents of the active cell

Inserting Rows and Columns
Highlight what and where you wish the new row or column to appear
From the Home tab > Cells group
Choose Insert command button
If you have a row selected the Insert Sheet Rows can be selected
If you have a column selected the Insert Sheet Columns can be selected
The old data will move down or right depending upon what you inserted
35
Excel automatically adjusts all of your formulas to take account of the new row or column

Changing Column Width or Row Height Select the Column(s) or Row(s) that you
want to change
From the Home Tab
In the Cells group
Choose Format command button
Autofit Row Height or AutoFit Column Width
Or set Row Height and Column Width
36
Note: Also try double-clicking between the column/row

Excel Ranges
Range
Named by taking the top-left cell and the bottom-right cell
Cell references separated by a colon (:)
Range A1:A2
Range A6:D10
Range A4:E4
37

Selecting Cells and Ranges
You must select a cell or range before you can edit it!
There are many selection techniques; use the one that works best for your situation
38

Formulas Can ContainNumbers 1234567
Text ABCDEF
Operations + - * / %
Range Names 3rd Quarter Revenue
Range Addresses $A$1,Data!B:3
39

Order of Operations
Excel uses the following Order of Operations when evaluating a formulas
40
41
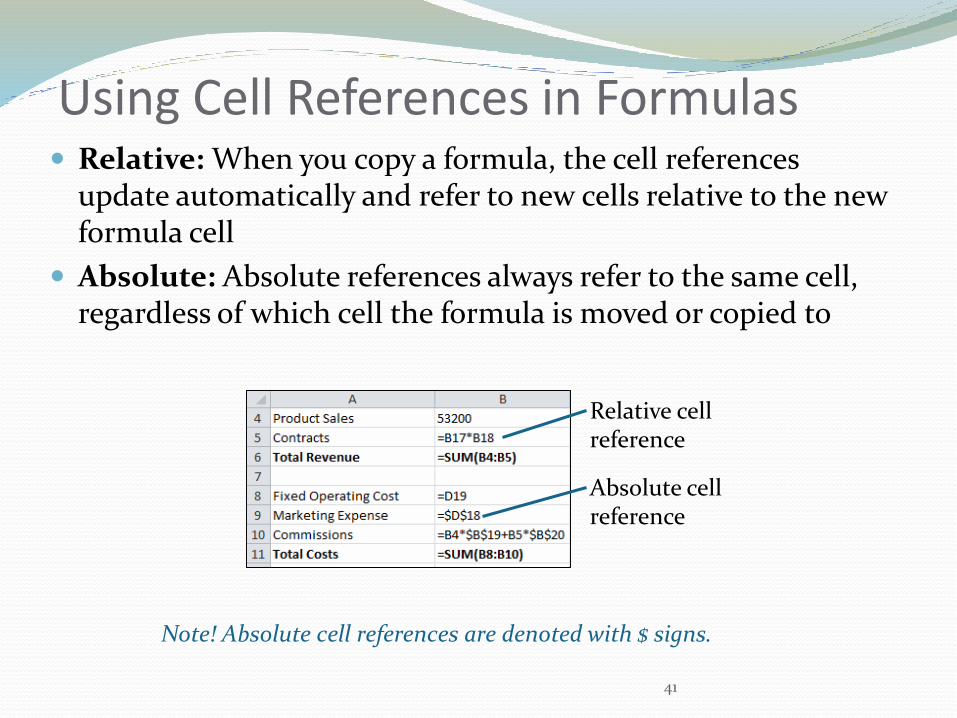
Using Cell References in Formulas Relative: When you copy a formula, the cell references
update automatically and refer to new cells relative to the new formula cell
Absolute: Absolute references always refer to the same cell, regardless of which cell the formula is moved or copied to
Note! Absolute cell references are denoted with $ signs.
Relative cell reference
Absolute cell reference

Maneuvering Around SheetsFrom the Tab Section
Add/Delete Sheets
Moving Sheets
Color Code
Copy
Select All Sheets
42

Managing Workbooks
New workbooks open with three worksheets
Can hold up to the available amount of computer memory
Add, move, copy, and delete worksheets
Change worksheet names
43
Worksheet tab

Copying Worksheets: A Quick Copying Technique
Create an exact duplicate of the original sheet
Check this box to copy—leave it blank to move
44

Moving a Worksheet
Click the worksheet you want to move
The mouse will change to show a small worksheet icon
Drag the worksheet icon until a small black arrow appears where you want the worksheet to be moved
Release your mouse, and the worksheet will be moved

To Color Code Worksheet Tabs
You can color worksheet tabs to help organize your worksheets
Right-click the worksheet tab you want to color The worksheet menu
appears
Select Tab Color & the color menu appears
Select the color you want to change your tab

View multiple sheets or workbooks at the same time
To view multiple sheets in the active workbook
On the View tab, in the Window group
Click New Window or
Click View Side by Side
In the workbook window, click the worksheets that you want to compare.
To scroll both worksheets at the same time, click Synchronous Scrolling in the Window group on the View tab
Don’t forget to use Arrange
All command
47

Managing Large Amounts of Data
To keep an area of a worksheet visible while you scroll to another area of the worksheet
Locks specific rows or columns in one area by freezing or splitting panes
On the worksheet, do one of the following: To lock rows, select the row below the row or rows that you
want to keep visible when you scroll
To lock columns, select the column to the right of the column or columns that you want to keep visible when you scroll
To lock both rows and columns, click the cell below and to the right of the rows and columns that you want to keep visible when you scroll
48

How to Freeze Panes On the View tab, in the Window group, click the arrow
below Freeze Panes
Then do one of the following:
To lock one row only, click Freeze Top Row
To lock one column only, click Freeze First Column
To lock more than one row or column, or to lock both rows and columns at the same time, click Freeze Panes
49

Working with Excel Tables New feature of Excel Tables are used to make
managing and analyzing a group of related data easier
A table typically contains related data in a series of worksheet
Using the table features, you can then manage the data in the table rows and columns independently from the data in other rows and columns on the worksheet
50

Auto FormatBuilt-in collection of cell formats that can be applied to a range of data.
Select the cells that you want to format.
On the Home tab, in the Styles group, do any of the following: Click Format as Table, and then pause on the various styles to
see the styles
Click Cell Styles, and then pause on the various styles to see the styles
When you finish previewing the formatting choices, do one of the following: To apply the previewed formatting, click the selected style in the
list.
To cancel live previewing without applying any changes, press ESC
51

Elements of the Excel Table Header row - a table has a header row
Every table column has filtering enabled in the header row so that you can filter or sort your table data quickly
Banded rows - alternate shading or banding has been applied to the rows in a table to better distinguish the data
Calculated columns - entering a formula in one cell in a table column, you can create a calculated column in which that formula is instantly applied to all other cells in that table column
52

More Elements Total row - You can add a total row to your table that
provides access to summary functions A drop-down list appears in each total row cell so that you can
quickly calculate the totals that you want
Sizing handle - A sizing handle in the lower-right corner of the table allows you to drag the table to the size that you want
Inserting rows/columns - Because table data ranges often change, the cell references for structured references adjust automatically
Converting Table When you convert a table to a range, all cell references change to their equivalent A1 style references (cannot automatically return)
53

Understanding Styles
Cell Style is a defined set of formatting characteristics
Cell styles are based on the document Theme It is s a combination of
colors, fonts, and effects
A Theme may be applied to a file as a single selection or the entire workbook
54

How to Apply a Style1. Select the cells that you
want to format
2. On the Home tab, in the Styles group, click Cell Styles
3. Click the cell style that you want to apply
55

Selecting a StyleWhen you finish previewing the formatting
choices, do one of the following:
To apply the previewed formatting, click the selected style in the list
To cancel live previewing without applying any changes, press ESC
56

Understanding Theme
Once you have chosen a Style additional chances can be made by changing the Theme
A Theme is a different way to specify the fonts, colors, and graphic effects that appear in a workbook
Office Excel 2007 comes with many themes installed
On the Page Layout tab, in the Themesgroup select any of those available
57

Conditional Formatting Automatically adjusts how the spreadsheet looks,
depending on the contents of the cells
Used to highlight important trends in the data
58

Sparklines A Sparkline is basically a little chart displayed in a cell
representing your selected data set
They allow you to quickly and easily spot trends at a glance
59

How to Insert SparklinesYou follow 3 very simple steps to get beautiful Sparklines in an instant.
Select the data from which you want to make a Sparkline
Go to Insert > Sparkline and select the type of sparkline
3 options – Line, Column And Win-loss Chart
Specify a target cell where you want the Sparkline to be placed
60

Types of Sparklines There are 3 basic types of Sparklines they are:
Line chart
Column chart
Win-loss chart (useful for showing a bunch of wins & losses denoted by 1s and -1s)
61

Sparkline Formatting and Options Once created a new ribbon called as “Sparklines –
Design” ribbon for all the formatting options
Some of the key formatting/customizations you can do are: Change the type
Change the source data / target cells
Set different colors for first point, last point, highest & lowest points , etc.
62


Sorting Databases Databases consists of:
Several rows
Each row is a record
1st row consist of headings
Each record must be written using the same type of abbreviations or “look”
Do not leave spaces before the text or at the end
Columns of data
Each column is a field
64

Instructions for Sorting
On the Home tab, in the Editing group, and then click Sort & Filter.
Do one of the following:
To sort in ascending alphanumeric order, click Sort A to Z.
To sort in descending alphanumeric order, click Sort Z to A.
65

Custom Sorting
On the Home tab, in the Editing group, click Sort & Filter, and then click Custom Sort
The Sort dialog box is displayed
Under Column, in the Sort by or Then by box, select the column that you want to sort by a custom list
Under Order, select Custom List
In the Custom Lists dialog box, select the list that you want.
Click OK
66

AutoFiltering a List on a Worksheet AutoFilter is used to:
Display only those rows containing desired values
Helps you to isolate a subset of data in a range of cells or table
Once you have filtered the data it allows you to either:
Reapply a filter to get up-to-date results
Clear a filter to redisplay all of the data
67

Custom Filtering Text or Numbers
How to apply a AutoFilter
Select a range of cells containing alphanumeric data
On the Home tab > Editing group > Sort & Filterbutton > click Filter
Click the arrow in the column header and choose what you want to filter that meets the criteria
68

69
Using Custom Filters Create a filter to select values not
available from the drop-down list
Then point to Text Filters and then
Click one of the comparison operator
Or click Custom Filter
Custom Filter example


Working with FunctionsMakeMoney Stock Club
Stock Symbol
Date
Acquired Shares
Initial
Price
Per Share
Initial
Cost
Current
Price
Per Share
Current
Value Gain/loss
Percent
Gain/Loss
Alcoa AA 1/3/2000 750 40.125$ 30093.75 28.750$ 21,562.50 (8,531.25) 0.283489097
Boeing BA 9/2/1998 975 33.000 32175 65.625 63,984.38 31,809.38 -0.98863636
Citigroup C 10/11/1996 850 12.250 10412.5 48.875 41,543.75 31,131.25 -2.98979592
Exxon MobilXOM 3/3/1997 925 52.000 48100 78.500 72,612.50 24,512.50 -0.50961538
Intl Paper IP 11/17/1999 300 48.375 14512.5 26.500 7,950.00 (6,562.50) 0.452196382
Merck MRK 12/23/1996 875 37.250 32593.75 89.750 78,531.25 45,937.50 -1.40939597
Wal-Mart WMT 12/21/1998 157 151.375 23765.875 44.250 6,947.25 (16,818.63) 0.707679604
Walt DisneyDIS 7/12/1996 600 17.500 10500 34.875 20,925.00 10,425.00 -0.99285714
Total
Average 679 48.98438 25269.17188 52.14063 39257.07813 13987.90625
Highest 975 151.375 48100 89.75 78531.25 45937.5 0.707679604
Lowest 157 12.25 10412.5 26.5 6947.25 -16818.625 -2.9897959271

Function
Is a small program which you can ‘call up’ to perform more complicated mathematical operations
They are ‘called up’ like formulas, start with an equal sign, then the function call
Useful when dealing with large numbers of cells where a formula would be unmanageable
72

Categories of the Different Functions
Database
Date & time
Engineering
Financial
Information
Logical
Lookup
Math
Statistical
Text & Data
73

Using Statistical Functions
Functions: formulas used over and over, so they’ve been built into the program
400+ included with Excel
Functions use their own syntax =SUM(A1:IV224)
=MIN(B17:Q29)
=AVERAGE(D54:G27)
=COUNT(B5:B9)
Get help with functions by clicking the Insert Function
button
74

Understanding “IF” Formulas
Returns one value IF a condition you specify evaluates to TRUE and another value IF it evaluates to FALSE
Up to 7 IF functions can be nested as value_if_true and value_if_false arguments
75

Creating a Formula with the IF Function Display predetermined text based on logical tests
A logical test can be evaluated as “True” or “False”
76

Subtotaling Spreadsheet
In a workbook which is set to automatically calculate formulas, the Subtotal command recalculates subtotal and grand total values automatically as you edit the detail data
Important part of this command: Make sure that each column has a label in the 1st row
Contains similar facts in each column
The range has no blank rows or columns
77

78
Displaying Automatic Subtotals The Subtotal dialog box
Outline bar
Functions include Sum, Average, Min, Max, and others
Field on which to base subtotal
Field on which to calculate subtotal
Always sort the list by the field on which you want to base the subtotal first

How to Insert Subtotals
Select cells in the range and Sort the column that forms the group
On the Data tab, in the Outline group, click Subtotal.
Select desired options:
At each change in, click heading
Use Function, click the operation
To Hide/Show Detail:Click on the (-) and (=) buttons just to the left of the row numbers
79

Making Comments in Excel
Comments are text notes embedded in a workbook cell
Comment author
Comment
80

81
When to Use a Comment
Make notes about specific cells
Document cell contents
Record a question to be followed up later
As a question of an online collaborator

How to Make Comments
How to Insert a Comment
Select the cell that you want to add a comment to
On the Review tab, in the Comments group, click New Comment
In the Text box type your comment
Once finished, click outside the comment box
To view a comment, click the small red triangle in the top right corner
82

Charts are used to make your information more visually appealing
Make it easy for users to see comparisons, patterns, and trends in data
Microsoft makes charting your data a breeze by using the Chart Templates
83

New Chart Types Visualizations are critical to
effective data analysis
6 new charts
Hierarchy Chart
Treemap or Sunburst chart
Waterfall or Stock Chart
Statistical Chart for Histogram, Pareto, or Box and Whisker

Elements of a Chart1. Chart area of the chart2. Plot area of the chart3. Data points of the data series that are
plotted in the chart4. Horizontal (category) and vertical
(value) axis along which the data is plotted in the chart
5. Legend of the chart6. Chart and axis title that you can use in
the chart7. Data label that you can use to identify
the details of a data point in a data series
85

Column Charts and Bar ChartsCompare values using bars, either horizontally or vertically
Value axis – for quantities, amounts
Category axis – often measures time
0
1
2
3
4
5
6
1 2 3
Category Axis
Va
lue
Ax
is
Apples
Oranges
Banana
86

Line ChartsCompare trends over time using horizontal lines
Value axis – The x-axis
Category axis – The y-axis
x-axis
y-axis87

Pie ChartsCompare parts of a whole
Contains only one data series and label
Apples
Oranges
Banana
2-D pie 3-D exploded pie
88

How to make a chart
Select the information you want to chart,
then click on the Insert tab, in the Chartsgroup
Click the arrows to scroll through all available chart types and chart subtypes
Then click the ones that you want to use
89

Modifying a Chart
Modifying a chart helps clarify the information presented
Some of the ways you can modify a chart are to:
Add titles and data labels to a chart
Change the display of chart axes
Add a legend or data table
Apply special options for each chart type
90

How to Modify a Chart
Clicking anywhere in a chart and the Chart Tools are available
Then use the Design, Layout, and Format tabs
91
92
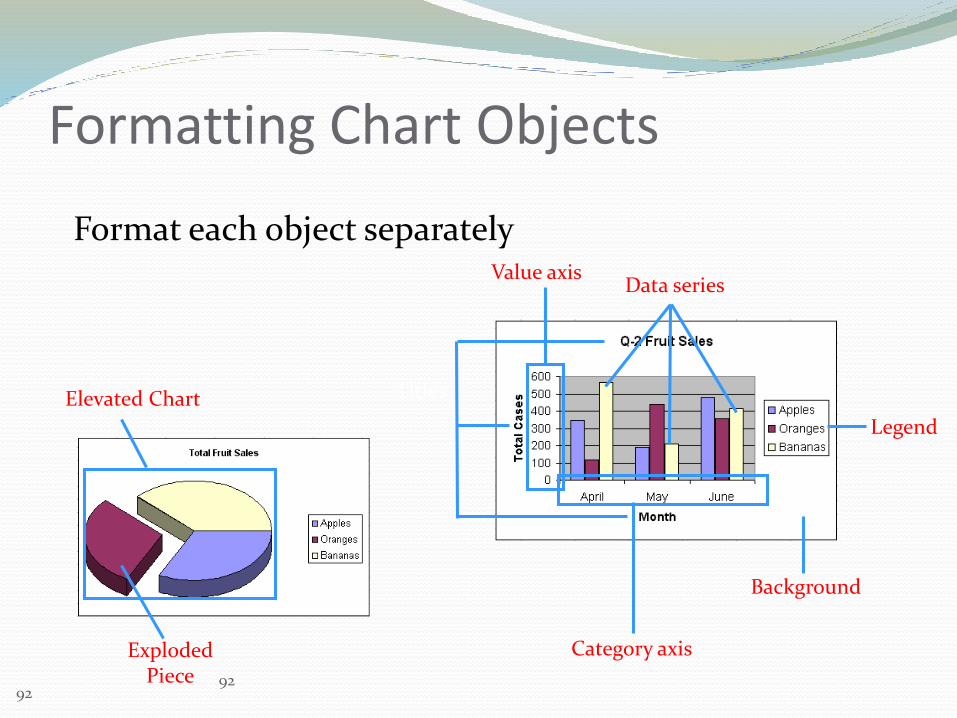
Formatting Chart Objects
Format each object separately
Titles
Legend
Data series
Exploded Piece
Background
Elevated Chart
Value axis
Category axis
92
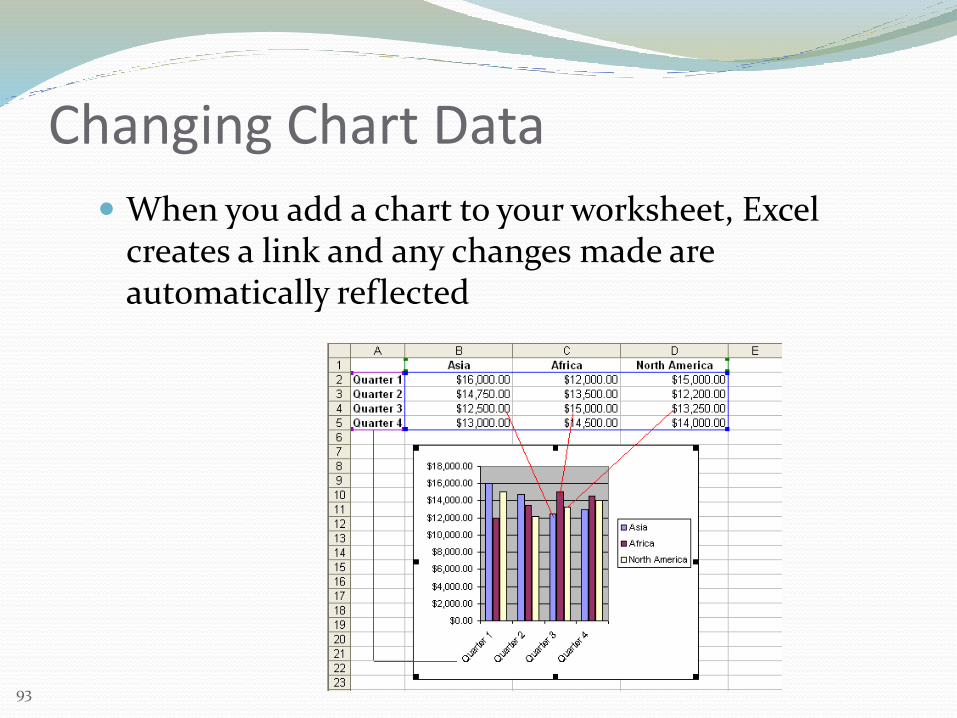
Changing Chart Data
When you add a chart to your worksheet, Excel creates a link and any changes made are automatically reflected
93

To Change Chart Values
Open the worksheet that contains the chart to be changed
Click in the cell whose value will change and type the new value
Press Enter to accept the new value
94

To Add Data to an Existing Chart
Rows or columns of data can be added to an existing chart by selecting the Select Data option on the Chart Menu
Input any new Source Data into the worksheet
95

Moving and Sizing Embedded Charts
Diagonal double arrow: resizes proportionally Compass arrow: moves
Vertical or horizontal double arrow: stretches
Select chart to display handles
Mouse pointer changes to show moving and sizing options
96

Enable quick “what if ’ calculations
Create a multitude of different reports from a single set of source data without:
Subtotals
Sorting
Manual Organization
Are interactive that combines and compares large amounts of data
Displays the details for areas of interest
97
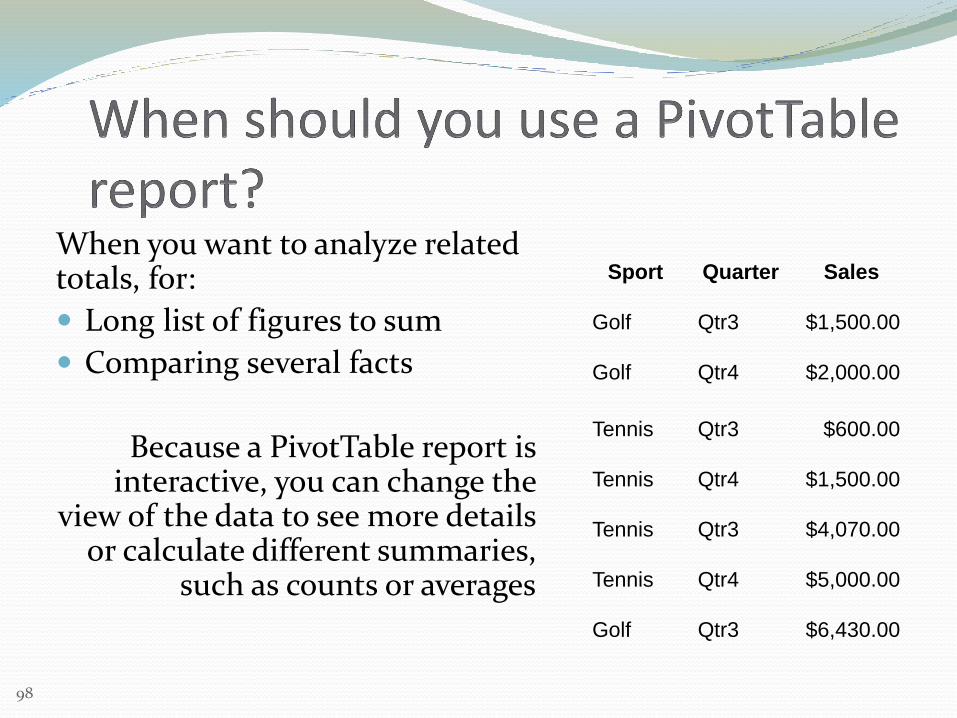
When you want to analyze related totals, for:
Long list of figures to sum
Comparing several facts
Because a PivotTable report is interactive, you can change the
view of the data to see more details or calculate different summaries,
such as counts or averages
Sport Quarter Sales
Golf Qtr3 $1,500.00
Golf Qtr4 $2,000.00
Tennis Qtr3 $600.00
Tennis Qtr4 $1,500.00
Tennis Qtr3 $4,070.00
Tennis Qtr4 $5,000.00
Golf Qtr3 $6,430.00
98
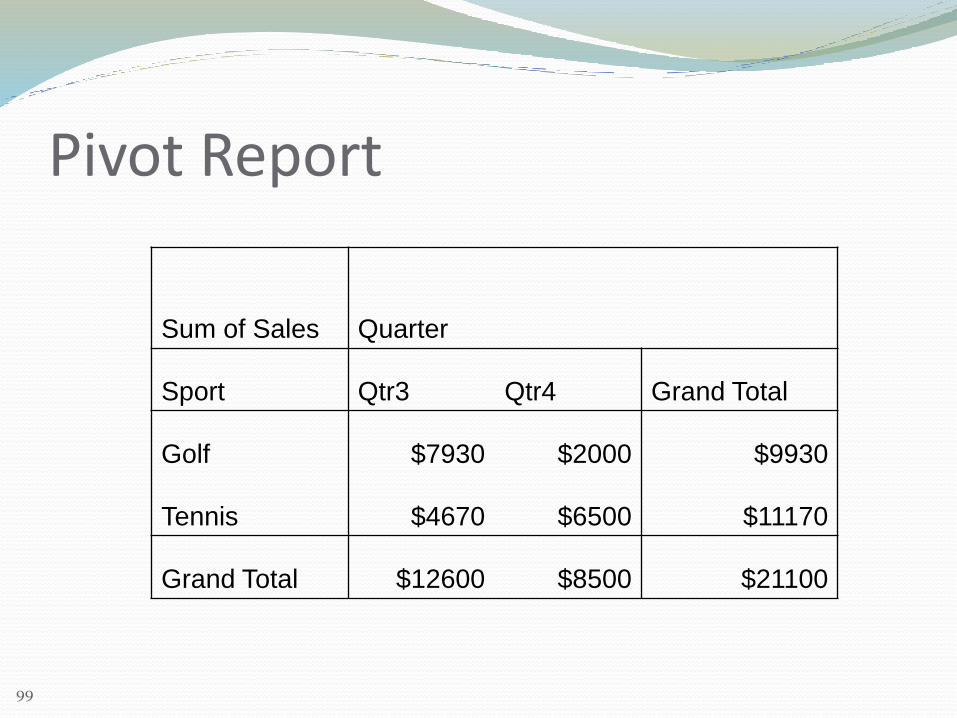
Sum of Sales Quarter
Sport Qtr3 Qtr4 Grand Total
Golf $7930 $2000 $9930
Tennis $4670 $6500 $11170
Grand Total $12600 $8500 $21100
Pivot Report
99

How to Create a Pivot Table:
Select the source data
On the Insert tab, in the Table group, click Pivot Table
You will then choose the Column Headers from the PivotTable Field List to the correct Field Area
This worksheet can now be summarized and calculated to your specifications
100

Working with PivotTables: How PivotTables Work
Region field will be the row headings
SW Sales is the first data item
HW Sales is the second data item
101

102
Working with PivotTables: Manipulating Fields on a PivotTable
Pivoting is the process of dragging a field from a row to a column, and vice versa
Pivot a field
Notice the new position of the Data field in this example

103
Working with PivotTables: Manipulating Fields on a PivotTable
Add fields
Delete fields
Suppress display of a field

104
Working with PivotTables Filters
Choose (All) from the drop-down list to display all items in the field

Modifying the Pivot Table
Clicking anywhere in the Pivot table and the PivotTable Tools are available
Then use the Options and Design tabs
105

Lookup and Reference Option
Lookup creates a formula which compares to worksheets
Takes missing information from one worksheet and links it to another worksheet
There must be one linking ID number assigned in each worksheet
=VLOOKUP(A:A,'Complete Address'!1:65536,7,FALSE)
106

Information Needed3 Pieces of information you need:1. Lookup-value – value you have asked the
function to locate2. Table-array – cell address of entire table to be
searched3. Column number – number of the column the
function should move into before extracting dataRange Lookup Set to TRUE if you don’t want to require the function to find
an exact match Set approximate-value – to FALSE if you need to match
lookup-value exactly (i.e., zip code)
107

Create a lookup formula with the Lookup Wizard
Click a cell in the range
On the Formulas tab, in the Solutions group, click Lookup program
Follow the instructions in the wizard
108

Create a 3-D Reference Workbook 3-D Reference is useful and convenient way to
reference several worksheets
How to Create a 3-D reference
Click the cell where you want to enter the function
Type = (equal sign), enter the name of the function, and then type an opening parenthesis
You can use several functions in a 3-D reference
The examples use the formula =SUM(Sheet2:Sheet6!A2:A5)

Split /Dividing Cell Contents Across Multiple Cells
Storing certain types of information, such as an address, in one cell might limit what you can do with that information
To split the address so that the different parts — street address, city, region, postal code — are in their own columns
Gives you many more options
110

Dividing Text Across Cells
Select the range of cells Can be any # rows One column wide
On the Data tab, click Text to Columns
Follow along with the Columns Wizard
Note: There must be as many columns to the right that match the text.
111

Using the Text to Columns Feature Select the range of data that you want to convert
On the Data tab, in the Data Tools group, click Text to Columns
NOTE: You must insert additional columns prior to starting the Wizard because the new
columns will replace the other data
112

Step #1In Step 1 of the Convert Text to
Columns Wizard, click Delimited or Fixed Width
Then click Next
For this example choose
Delimited
113

Convert Text continued
In Step 2, click on the Delimiters such as:
Tabs
Semicolon
Space
Comma
Other
Then click Next
NOTE: You can have multiple Delimitations
114

Last Step in the Conversion
Keep the Column Data Format set to General
If you want the data being separated in a new location, click the Destination box, and then select the beginning cell
The select Next
Click Finish
Destination is:
=$F$1
115

Concatenate Function Argument
This function joins up to 255 text strings into one text string
In other words, it is used to joined multiple cells into a single cell
Joined items can be:
Text
Numbers
Cell References
Combination of those items
116

Example If your worksheet contains a person’s 1st name in cell A1
& their last name in cell B1, you combine the 2 values into another cell
=CONCATENATE(A1,” “,B1)
You must specify any spaces or punctuation that you want to
appear in the results
117

How to Perform
Instructions:
Select empty cell where you want to join the other cells
Click Formula Tab
Then in the Function Librarygroup choose Text button, the Concatenate option
Finally, create the following formula =CONCATENATE(A2," ",B2) by clicking in the desired cells
118

Page Layout Tab
119

Set page margins
By setting the margins, you can specify:
How worksheets appear on a printed page
Go to Page Layout Tab
In the Page Setup Group
Click on Margins command button
Select one of the preset margins
120

Center the Page Centering the page can be done both horizontally or
vertically
Be careful though, if the information is too small do not center vertically
Under Custom Margins found in the Margins command button choose Center on page, select the Horizontally or Vertically check box
121

Orientation Indicates the direction of printing
Portrait is the default.
➢Prints across the narrow edge of the paper
Landscape prints across the wide edge of the paper.
122

Scaling Options
Shrink data to fit on fewer printed pages.
➢Change width and height in proportion
➢Change just the height when the worksheet is very wide
123

Protecting Workbooks & Worksheets Three levels:
1. Workbook level
2. Worksheet level
3. Cell level
124

Protecting at Workbooks Level
125
Protects the structure of the entire workbook:
Moving a worksheet
Adding/deleting worksheets
Renaming a worksheet
Changing the window size and position

Protecting Workbook
Windows: Prevents Window resize or moving
Structure: Prevents the user from changing sheet order
Password: Only those with the password to turn
protection off

Protecting Formulas
Protect Worksheet
Select Options
Format Cells > Protection Tab
Uncheck “Locked”
Select Cells with Inputs
To “Unlock”

Worksheet Structure All cells by default are Locked
Uncheck the “locked cells”

Protecting Worksheet Elements (Formulas) Select the Worksheet you want to protect
Select each cell or range you want to unlock
On the Home Tab, Cells group, click Format, then Protection
On the Protect sheet, clear the Locked check box then click OK

Recording a MacroMacros store information about each step
you take as you perform a series of commands
Then, run the macro to repeat, or “play back” the commands

Steps to Recording a Macro Before you can start, you have to enable the
Developer tab, do the following to display it:
Click the File Tab, and then click Excel Options
In the Popular category, under Top options for working with Excel
Select the Show Developer tab in the Ribbon check box, and then click OK

Printing Worksheets
There is no longer a Print dialog box; in Excel 2010/2016 it is a tab in Backstage view
You can change your print options on the Print tab of Backstage view
132

Print Preview
The print preview displays one page at a time.
133

Saving Workbooks
Save: Used for files that have already been saved, replaces a copy in the same place with the same name
Save As: Used to save a file for the first time, save a file with a new name or in a new location
These commands are accessed via the File tab of the Ribbon.
134

Closing Documents The File Tab menu contains the Close command
Close command closes a workbook window but leaves Excel open.
Note! If changes were made since the last Save, Excel asks to save before closing.
135

How To Work with people who don't have Excel yet? Saving ‘older” files the computer set to
use the Save As dialog box (stays in its original format)
If you use any of the new features to update this file a Compatibility Checker warns you if these features are not compatible
To keep the features just use Save As and tell Excel you want an Excel Workbook
136

New 2007-2016 File Types
Excel Workbook (*.xlsx) – used to save a workbook without macros
Excel Macro-Enabled Workbook (*.xlsm) – is used for workbooks with macros
Excel Template (*.xltx) – is used for templates
Excel Macro-Enabled Template (*.xltm) – is used for templates with macros
Excel Binary Workbook (*.xlsb) – is used for especially large workbooks
137

How To Work with people who don't have Excel’s new Versions Saving ‘older” files the computer set to
use the Save As dialog box (stays in its original format)
If you use any of the new features to update this file a Compatibility Checker warns you if these features are not compatible
To keep a 2007/16 features just use Save As and tell Excel you want an Excel Workbook
138

Converting a Workbook
Click the File tab to access Backstage view
Locate and select the Convert command
The Save As dialog box will appear
Select the location/file name and click Save

Sharing Documents Between Versions You can share documents between versions by using a
converter
If you create a file in 2007-16, others who have Excel versions 1997-2003 cannot work in your files
If they have Excel 97-2003 files must be saved as this file type in these versions
140