CONSWTIOB OF MADE FIBilES A DETdILEC … those used in spinning cotton. Thesc fibros can be spun se-...
42
Working Paper No.l% CONSWTIOB OF MAN MADE FIBilES : A DETdILEC ANALYSIS MIiIDUL EAPEH Centre for. Developnent Studies Trivandrun Januazy 1983
-
Upload
truongkhanh -
Category
Documents
-
view
217 -
download
1
Transcript of CONSWTIOB OF MADE FIBilES A DETdILEC … those used in spinning cotton. Thesc fibros can be spun se-...

Working Paper No.l%
C O N S W T I O B OF MAN MADE FIBilES :
A DETdILEC ANALYSIS
MIiIDUL EAPEH
Centre for. Developnent Studies Trivandrun
Januazy 1983

.y Consumption of Nan inade F ib re s : A d e t a i l e d Analysis
In t roduc t ion
The BICP has undertaken a s tudy on the economics of man
made f i b r e s i n I n d i a and t h e i r l i k e l y demand i n t h e near fu ture .
This e s s e n t i a l l y involves an ana lys i s of t h e consumption of such
f i b r e s , t h e i r r e l a t i v e cos t s and production p o s s i b i l i t i e s based
on pas t t r ends , which would i n d i c a t e t h e i r p o t e n t i a l f o r t he
fi l ture. The presen t Report which examines t h e p a t t e r n of con-
surr;~tion of man made f i b r e s and the chsnges brought about i n
o v e r a l l t e x t i l e s consumption i s one p a r t of t he l a r g e r . study.
I?: i s wel l known t h a t per c a p i t a consumption of c lo th ing of a l l
f i b r e s - co t ton and man made - has rem-lined s luggish i n t he l a s t
few years . P a s t t rends i n co t ton f i b r e production and i t s l i k e l y
i nc reases i n t h e f u t u r e i n d i c a t e a l i m i t t o which we can r a i s e
co t ton output. Man made f i b r e s t he re fo re , i n p a r t i c u l a r po lyes te r ,
should be viewed pr imar i ly as a means of supplementing t o t a l
a v a i l a b i l i t y of t e x t i l e s e s p e c i a l l y through t h e p o s s i b i l i t i e s
of blencling.
The ana lys i s f a l l s broadly i n t o t h r e e s e c t i o w :
e c t i o n I d i scusses b r i e f l y , the growth of t h e man made f i b r e
i n d u s t r y i n I n d i a ; Sec t ion I1 analysas t he p a t t e r n of consm-
p t ion of t e x t i l e s . I t i s argued he re t h a t t h e p a t t e r n of demznd
-3 This r epo r t h:%s beer, preil-red f o r t!k Bureau of Industr i - . l Costs nnrl P r i c e s (BIC? ) a s n p a r t af t h e i r s tudy on t h e ~ C O ~ O -
mics of Ma-mde r'i'ores. I t i s based e n t i r e l y on published rn2terial.

h a s been changing i n f a v o w o f man made f i b r e s . P r o j e c t i o n s
o f demand f o r t h o d i f f e r e n t man made f i b r e s o v e r the next
f i v e y e a r s based on income e l a s t i c i t i e s e s t i m a t e d from t h e
consumj-. t i o n 3 a t a a r e a a d e i n S e c t i o n 111.
S e c t i o n I
Nan made f i b r e s nay be b r o e d l y d i v i d e d i n t o two
groups : f i b r e s produced f r o n n a t u r a l polymers, u s u a l l y c c l l u -
l o s e and p r o t e i n m a t e r i a l s ; m d s y n t h e t i c f i b r e s produczd from
s y n t h e t i c polymers d e r i v e d c h i e f l y f r c ~ o i l . These two c a t e g o r i e s
arc! ccmaonlg r e f e r r e d t o a3 cellulosic cmd non-ce l lu lo3 ic ( o r
synJ iho t i c ) f i b r e s . The c ; - l i u i o s i c g o u p i n c l u d e d p r i m a r i l y vis-
* c0s.c (known as Rayon ) and a c e t a t e f i . b r e s , w h i l e p o l y e s t e r a n i
riylnn z.re t h e n;.jor components of t h e s y n t h e t i c group. C e l l u l o s i c
f i b r e s a r e t h e o l d e s t of nan made f i b r e s ; s y n t h e t i c f i b r e s cane
mzch 1r . tcr bu t t h e i r growth was piisnoocnal. I n t h e world m ~ r k c t
t h e ~ r o c l u c t i o n of m n - c e l l u l o s i c f i b r s s h c s outpaced t n a t of
c e l l u l o s i c s ; however i n I n d i a c e l 1 . a l o s i c f i b r e s , prirmri1:r v i s -
c o s e , s t i l l predominate.
Another i n p o r t n n t d i s t i n c t i o n from t h e p o i n t of vioii
of end---se w i t h i n t h e man made f i b r e i n d u s t r y i s bptween f i l m o n t
8 'I:ayon' was adopted i n 1924 t o r c p l s c e ' m t i f i c i a l s i l k ' f o r bo th v i s c o s e and a c e t a t e f i b r e s b u t i n 1951 t h e US F e d a r a l Trade Commission e s t a b l i s h s d t h e t ' r a y o n ' s h o u l d be used only f o r ' v i s c o s e ' .

yarn and s t a p l e f i b r e which i s spun i.ato yarn by processes s i m i l a r
t o those used i n sp inning co t ton . Thesc f i b r o s can be spun se-
para te ly , a s blends toge ther o r w i th cotton. I t i s t h e possibi-
l i t y of blending which holds out a l n rge p o t e n t i a l f o r i nc reas ing
fu tu re sonsumption of t e x t i l e s , s i n c e i t not on ly enhances t h e
q u a l i t y of t h e f a b r i c s produced b u t can a l so be uoeC f o r reducing
t h e i r c o s t s and t h e r e f o r e pr ices .
Growth. of the Man made F ib re I n d u s t r y i n I n d i a
Rayon 5 l n n e n t yarn was t h e f i rs t t o be produced i n
Indin i n 1950; by 1954, the of rayon s t a p l e f i b r e
was d s o s t m t e d . TJol~e36.2 stap3.e f i b r e w a s first produced
i n 1365 and p o l y s s t e r f i l m e n t yarn i n 1969. Product ion of: nylon.
f i l a n e n t yarn was undertaken i n 1963. I n very r e c e n t yess, X
H i . $ i c t Modulus Rayon and polynosic f i b r e product ion has a l s o
s t a r t e d i n a saa11 way.
D e t a i l s of production and the changes t h a t have taken
place i11 r c s p c c t of man nnde f ibres/ f i lnmont yarn are exanincd
i n Table I. Product ion of m m mads f i b r e s ( t h a t i s both ce l lu -
l o s i c znc? non-cel lulosic) incrcasod from about 4200 tonnes i n
1954 t o over 105,000 tonnes i n 1980, an inc rease o f a lnos t 2500
percent o r m annual average r a t e of growth of 12.2 pcrccnt.
* These a r e improvcimcnts i n ce l lu l .os ics , and a r e gene ra l ly r e f e r r ed t o an model viscose s t a p l e f i b r e .

rn Table . 1
Product ion of Man-nade ~ i b r e s / ~ i l e n e n t Yarn (tonnos)
S t a p l e T ib re ........... Po lyes t e r ...........
4 ........... . . . . . . . . . . . . . i . . . . . . . . . . . . . .
1385
2547
...........
T o t a l .........
5 ......... . . . . . . 4224
5705
7903 8007
14007
20345
21 779
26061
23382
32146
36819 38538
45767
.........
'I-'
........... Viscose
........... 6 ...........
2461
3669
4475 5019
5823 ' i j 67
9702 13386
14993
19193
21 436
29237 31221
3 2 9 4 3521 3
3731 1
...........
Filament Yarn ,..........,
Po lyes t e r ....-......
9 ...........,
. .
. .
. . . . . . .
. .
. .
. . . . . .
. .
. .
. .
. .
. . ...........
....-.. Tota l ........
10 ......-
2461
3669
4475
5405
6979
9004
11334 15240
15430
21118
23738
30801
53917
38305
38726
36566
......-

T a b l e s f Contd.
Source: Indian Tex t i l e B u l l e t i n , Various I ssues .

s i n c e then. Most of t h c i i l c r ~ a s e ii? :xolluction i n t h e period
1555-20 I?-:; i n rospac t o r t h o aoncsll~;lo>:ic yol-pst: ;r s t zy l a
El:J:e, p~oduc t io r ! of which i n c r e a c d Iznm zrounc? l!,00 tomes
i n l:!65, t o 23,000 tonne?; i n 1980 - cm clniiunl average growth
r a t e of 15.7 percent. Growth i n production of c e l l i ~ l o s i c otiiiple
fibr3:: Gurillg; t h i s period Elppeur; -to be very s l ~ j g g i s h , rocister-
ing ~?.n avoyago annual r a t e of gcouth of only 4 ?ercent. Vi~coso
zccounts f o r nlmont t he e n t i r e production of c e l l u l o s i c Pibrns;
L, ., e ~ h ? r f of acet:%te bein,: ha rd ly 1 ;?ci-cent. Th;. sha re of t~olye-
a t u r i n totr.1 s t , ~ p l e f i b r e production increased scbst:ntial ly
fro]: >.bout 7 ycrccnt i n t h e l a t t e r h a l f of t he siXties t o over
21 ->crcent by th;: end of t he period. rlence of the- two m a n xade
f i b r e groupo, a l though tho cc!l lulo3ic f i b r e group i s tha more
in:!%-tmk i n terms of v o l m e of procluction (79 p c r c e x t ) , thc
gm:r;rth in 2oljres;rtcr f i b r e ha8 bccn nore r c p i d .
Product ion of f i l m e n t yarn has increased f r o n Z:61
J. t,oilnes ic 1951 t o over 70,000 tonnes i n 1980, growins 6.t' ,-a
a x w . 1 average r a t e of 10 pzxcent. Ia :;he cz se of f i l ~ n q n t
yarn too, growth i n c e l l u l o s i c s T J ~ S vv;.r;r h igh upto 1 9 6 5 ; si:ice
Llr.2;. p-oduction of v i scose f i l m - t n t y - r ~ rcnni!:acl r t lnost
: t I n t he poriod afti;r t h e slid s i x t i s , nylon rad nolye-
st;. f i l m e n : yarn s3ow r c l a t i v e l j ~ very high r a t e s of gzowth,

i n p e r t i c u l a r po lyes t e r f i l m e n t yazn - 24 percznt $1 3er-
cent r e s p e c t i ~ c l y . Tnli?,:e i n th? case o i sta:?le,
f i b r e , t h e non-cel lulosics account f o r a r e l a + < . - ~ e l y hignsr *here
i n f i l m e n t ya rn production - 57 ?erc,snt cur ren tQ?. Of t1.e
c e l l u l o s i c s , v i s cose f i l m a n t yarn f o r m almost 95 percent ; cnc!
with in the non-cel lulosic gl-,>i nylon f i l ament yarn accou?lLs
f o r over 65 percent of the product ion; however the r a t e cf growth
o f :polyester f i l ament . yarn is h i g h e r .
I n terms of t h e form of production, s t z p l e f i b r e . accounts
f a r 59 gercent , whi le f i lament yzrn accounts f o r t h e r e s t . The
r a t e of growth of s t a p l e f i b r e has been h igher , which is r e f l e -
cted aloo i n t he f a s t e r r a t e of g rowthof blended vis-;&a pure
man n,sde f i b r e f a b r i c s (as we s h z l l s e e l a t e r ) . Xi th SLC growth
of indigenous product ion of nan made f i b r e s / f i l m s n t yarn, t h e i r
imports. have shown a s i g n i f i c a t decl ine. W h i h donec t ic pro-
duct ion i;; almost 190 percent i n r e spec t of c e l l u l o s i c s t a p l e
f i b r e s and f i l m e n t yarn, non-cel lulosic imports rangad between
10-15 gercent of t o t a l a v a i l e b i l t t y of such f i b l e s by 1976
(3ee Table 2) . IIowever s i n c e 1977 with t he 1iberal i : ;a t ion of
ia i -or ts under t he n u l t i f i b r e po i i cy t h e r e w a s a ver;r shar;3
i nc rease i n imports of both c e l l u l o s i c non-cel lulosic f i b r e s /
f i lament yarn. While, wi th in sts:>ie f i b r e , a l i los t E3 percent
of t h e import was cf c e l l u l o s i c f i b r e s , i n r e spec t of f i l m e n t
yarn a h o s t 78 percent of t he import was of synthetLc f i l ~ m e ~ t
yarn.

T a b l e 2
*. dlnost 100$ i n p o r t s ; :>reduction 3 t r ~ t c d o n l y i n 1565.
0 Fi .;!we:: no t a -va i l&le i n con-pcxrable form. ' That i n po lycs tc r and ny lon f i l a n s n t yarn.

On t h e d i w ~ . , h s n d , growth i n co t ton ~ r o r i u c t i o n has
been much lower; it w a s 1.07 gercent per annun i n t h e s i x t i e s
but rose t o about 2 percent ,Jer annum i n the seventiieo mainly on
account of a shar :~ increane i n t h e production of iong and s u p e r i o r
long v a r i e t i e s of cot ton. The d e c l i n e i n t he h t a l acreaye
under co t ton s i n c e the mid s i x t i e s has been a m a t t e r of some
concern. Although i n abso lu te quantum, co t ton i s s t i l l the pre-
dominant f i b r e , i ts r e l a t i v e con t r ibu t ion t o t o t a l f i b r e ava i l -
a b i l i t y has decl ined. True, t h i s dec l ine i s not as d i s t i n c t i n
I n d i a as i n o t h e r coun t r i e s and it f l u c t u a t e s ; never the less t h e
lon:: term tendency does exhib i t a f a l l i n t h e s h a r e of cot ton.
This i s evident from the s h a r e of c o t t o . and non-cotton f i b r e s
used on the c o t t o n s>inning system (See Table 3 ) . O f t h e t o t a l
yarn iroven f;.oni cottoi! ah,.; z!ai-. n&c ii:--. ,dLes - 687 thousand tonnes
i n the e a r l y f i f t i e s - the s h a r e of the l a t t e r which cons t i t u t ed
a mere t w o percent increased t o almost 20 percent by 1980; pro-
duct ion grew from 11,000 tonnes t o 242,000 tonnes. f u r e viscose
s t a p l e f i b r e yarn accounts for almost 95 perc=nt of the produ-
c t i o n of pure man made f i b r e yarn ; t he share of non-viscose spun
yarn i s very small . Most of t h e po lyes t e r s t a p l e f i b r e i s used
i n the product ion of blended yaPn. The s h a r e o f blended yarn
i n t o t a l yarn production has a l s o increased s i g n i f i s a n t l y ,
from l e s s t h a n one percent between 1966-70 t o 13 i n
t h e last f i v e year period. There W-as a sharp i n c r e a s e i n t h e

v- Table 2
P;.oduct.ion of V,riow T.ypes of Yarn i'lnnufactures by Nills i n 1_000' tonncs .-- Vorlring on Cotton Spinning S y s t e ~
?o lyes tc r / ~ o l ~ c s t e r / Cotton Viscose
no t a v a i l ab le
I 1
9 I 5
Source: S a c as T'zbles 1 and 2. t. Inc lud ing ~ o t t o r . / n o d i f i e d Viscose Yarn * The year chenges t a f i n a n c i a l year from 1977.
,--------.
cot ton / Viscose
. .
. .
2
13
101
.--------. 43
135
153
l04*
68
Note: F igures i n brackets a r e percentages t o t o t a l yarn produced.

Swjlmir,Z up Cron tho n:)07,-6, we obsorv? t h a t :.?Zn n?.di! ?ii.lris
haw grown xuch more r q i d l y thzn co t ton f i ' r ~ r z ;rrod::c.2ion
i n I:.ldin. Viti l in t he m,\n rn:.,.de f i b r e s / f i l a n e n t yarn, rLlthough
ce l l l~ t los ics grew t :: high r a t s upto 'tbo;rt t he middle o'? tho
o i x t i m t h e i r groath fins slowed down conside:nbly r r i th the ei:-hi.>-
of tho non-cellulosicS, i l l pcrticu1;:r -?olyester . Ho:.ior;er, i n ::
a o m t r y l i k e ours , w i th low 1.evels O F f i r c s p i t income, vioc.znc
st,-:*lz f i b r e ( :md :low polynoaic s t i=ple f i b r e ) and yarn w i l l con-
tii~::: t o donicn-tc t he t o t z l consrmption of man ncdo fibros/y;zrn,
(Woagh d t h a d f c l i n i n g : r l a t i v a ?ro;>ortio:lj a t l u a s t i n
' t h a m a r future . Nevc r tho le~o tha long-.:ern poken t i c~ l agpe2.w
t o l i e ir i th t h e non-czllulosLc f i b r e s ; however t l ; o i r g ~ o w t h is
c1or;r:ly l inked t o t he C O U ~ ~ T J ~ S o i l r e f i n i n g and. p e . l - r o c k r a i c d
P T I . , ~ U L T ~ iil t he fu ture .
S e c t i o n II
Although a nmber of s t u d i e s l xve been unc?c?3rtckan i n rcs-
poct of consumptioin of t e x t i l e s si'?. i t s pq,l;tern, zlmost a l l hrvo
f o o ~ ~ x i 3 d p r imar i ly on cot ton. Bo dot;:ilud 2 l 1 ~ l g s i s hes i:ceri

done on consumption of miin mad;: f i b r e . Icx t i lcs , although grorith
i n t h e i r a v a i l a b i l i t y , as we saw i n ; ~ e c t i o n I , has h?en quite
s u b s t a n t i a l . The major cons t r a in t till very r e c e c t l y , has been
ti.e c lva i l ab i l i t y of d e t a i l c d inforailation on the cornurn]-:tion of
such f i ~ r e / ~ a r n f a b r i c s .
Sources of Data
rT i h e r e a r e t h roc mzjor sources of d & c f o r estimating con-
suription o f t e x t i l e s . Tho f i r a t , thou($ not s t r i c t l y referring
t o consumption s t r . t i s t i c s , i s t ime s e r i a s 6-tz ct the .zggregnte
n:.tiond l e v e l ds r ivcd from m?.rket s t z t i s t i c s . Appr~rent con-
n u n ~ ~ t i o i ~ - p r o d u c t i x - imports - expor t s ; ~ d j u s t n e n t for
s t ocks i s a150 made wherewr p o s s i b i ~ . These e s t i x a t o s would beim
?AWL from the d z t c given i n Sec t ion I.
The o the r two sources ,we 5:ised oil household expenditure
s ;~pvcys f o r some t i n e J>oints 2nd a r e :-nor6 det:-.ileJ. The NctioncJ.
:;,xm.~~la :~urvey Rounds on Consmcr Expcncliture a r e t h e oldest ,
,?v::il.?ble i n camp,-.r,?ble form s i n c e the l a t e f i f - t i e s ; however i n
rospoc t of inm m.?de f i b r e t e x t i l e s t h e d.?.ta published by tha
iiSSO CIZC very Scmtjr . Although informztion i s co l lec ted on
consumption of v x i o a s t y l e a of t e x t i l e s - co t ton 2nd man made - i n q w n t i t y and va lue t a r n s by v-.rious sxpenditure groups, only
t h ~ 17th Round ( 1961-62) published th s sc dat:: f o r cot ton rrnd
n l l non co t ton c lo th ing . None of t he l n t c r Eounds published even
this information. ii!c h,me tne ro fo re r o l i e d exc lus ive ly on the

second s o u r c e of s u r v e y dnta, Consumer 2urchase of T e x t i l c n ( C i T ) ,
p u b l i s h e d by t h e T e x t i l a Zommittec, M i n i s i r y of Conmerce. These
s u r v e y s howelrer were s t z r t e d o n l y i n 11!70 and infora ,? . t ion i n t h c
form :re r e q u i r e i s avnil ,? ' j le o n l y from 1974; + h e i r l a t e s t r e y r t
r e f e r - t o t h e ye:>r 1979. The i n i t i r k 1 sml ; l e s i z e was onl;r about
5000 households s 2 r e a d ou t i n u r b m and r u r d a r e a s ; k t e r it w-s
e x ~ m d e d t o nround 7000 households. Zxcept f o r t h e f a c t t h a t t h e
s a n p l e i s no t s u f f i c i e n t l y l z r g e ( t h e 15; consumer e x p c n c i t u r c
su rveys on avecage i n c l u d e .~.bove 18,000 h o u s e h o l d s ) , and t h o poss i - e x i s t s
b i l i t y / o f n i s r e p o r t i n g t h e t y l e of t e x t i l e s consumed, t h e s e d l t - n re
e x t r o n e l y comprehensive 2nd i n f o r m a t i v e . 'dc f irst d i s c u s s trcn$.s
i n coi~eumption of t e x t i l e s s , t h e 3 g ~ r o g a t 0 l < v c l , o u r focus d d a y s
bc ing on nLul mado f i b r e t e x t i l e s , m d t - o n a n c l y s e t h e i r consu7-
p t i o n i n g r e a t e r d e t a i l .
The i n c r e a s i n g p r o d u c t i o n of m ? n mndc f i b r e ~ / ~ r r n is r c f l e -
c t c d in. t h e growth i n t o t a l e v a i l a ' s i l i - b y of such t e x - t i l e s s i n c e
1351. T o t a l domes t i c a v a i l a b i l i t y of man made f i b r e f a h r i c s , r u r e
and blended i n c r e a s e d from 299 m i l l i o n n e t r e s i n 1951, th,-.t i s
7 p e r c e n t of a l l t e x t i l e s , t o a lmos t 27,30 m i l l i o n n e t r e s o r 25.2
p e r c e n t of a l l t e x t i l e s i n 1980. The a v e r z g e annuc l growth r ~ t e ~ 2 s
10.3 ,mrcent i n t h e f i f t i e s ; it f e l l t o 6.Q p e r c e n t i n t h e s i x t i e s
and r o s a a g a i n s h a r p l y t o 14.2 p e r c e n t p e r nnnun i n t h e s e v e n t i e s .
K s t r i k i n g f e a t u r e of t h e s e v e n t i e s i s t h e m p i d grcwth i n a v a i l -
a b i l i t y of mixzd/blended f n h r i c s . Although t h e r e rras some !,i-odu-
c t i o n of such f a b r i c s p r i o r t o 1970, sep,axcte f i g u r e s a r c a v ~ l r . ! ~ l c
o n l y lrom t h e e a r l y seven ti^ !. From ,?bout 201 m i l l i o n me t res ,

in ,1970, c3n0~23r ) t i o~ .~i ::vi.h ." i-ic; :.ncr~L?Seu t o about 1400 milliog
- n e t r c s , t h c t is n growth r a t e of almost ,2 ~ e r c e n t per annun, md
they a re now rc!lr,tivcly nor* i n p o r t p a t -than pure man made f ib re fab&-
O n the o t h e r l??nd, a v c i l 4 , i l i t y of co t ton t e x t i l e s increased
by ::bout ~1.5 percent per m u m i n t!lc first deczda; 3 mere 1.25
pcrcont per ;umm i n tho second deeds ;nd wzs l e s s than one per-
cen t i n the sevent ies . ':Tithin t o t 3 1 dznes t i c av?..ilzbility of
t c x t i l c s t he re fo re , man made f i b r e f a b r i c s now account f o r about
12.2 l ~ e r c e n t and blended f a b r i c s f o r 13.6 percent , t h z t is, about
26 pcrcent a l toge ther .
IIovever, i f w e t2ke i n t o a c c o u ~ t t h e t o t n l population and
i t s avcrage annual r x t e of growth, the :ler c n p i t a c o n s u p t i o n of
man nnde f i b r e f a b r i c s i s s t i l l very s m ? l l ( s e e Table 4). I t w a S
only +out 1/2 metre i n t he n v l y f i f t i e s and it increased t o &b&
3 1 metres by t h e g i d s i x t i e s . However, s i n c e then, per ca7 i t a con- 4
sun;)tion of i n n nnde f i b r e f e b r i c s s t q n n t e d mound 1.75 - 1.80
metres md only i n t h e l2st t~%ro yea r s , i t i n c r e s e d t o a l i t t l e
over 2 metres. Consunption of blended f a b r i c s which wns only
s!mut 0.3 metrcs i n 1970 incrcnsed t o d m o s t 21/2 n e t r c s by 1980.
I:,?nco o v e r a l l zverage consumption 2c r c a ; > i t ~ uf n3n mzde f ib re /
!>lenc?sd f z b r i c s i s about 4 n e t r e s . S incc per c a p i t a consun$icln
of c o t t o n t c x t i l c s not only s tagnntcd ? ~ u t i n f a c t d ' x l i n e d x f t e r
t he mid s i x t i e s , the s h a r e 3f nnn made f i b r o f a b r i c s increased
dur ing t h i s ; ~ c r i o d , nltiiough i t a zbso lc to consunqtion, as we saw
d i d iiot i nc rease very much except i n t h e last two ycars . W ~ I
mado i i b r e f a b r i c s havo s u - , t i t u t e d f o r c:>tb>n t o some extent
and t h i s a 9 ~ e a r s t o be the g~enara l t m d m c y .

Table - 4
P e r (!,?pita A v a i l n b i l i t g o f T e x t i l e s
( i n metres) ----- -----. Man- inaae
F.aSrics --------.
0.54- 0.52 0.65
0.82 0.86
1 .O9 1.04 0.92 :.I5 1.20
1.15 1 . I 7 1.24 ' 6.i. , v
1.73
1.65 1.74 1.90 1.79 1.71
I .72 1.59 1.46 1.36 1.37
1 .?-0 1.86 2.05 2.02 1.97
---------
T o t a l
------ 10.99 13.46 14.03 13.83 14.35
14.71 lflr.50 15.20 14.87 15.00
Source: I n d i a n T e x t i l e B u l l e t i n , Variolus I s s u e s .

!!e now .use t h o CPT d a t c t o 2::-udy i :~ g r e a t e r d e t ' a i l
* t h e p a t t e r n o f c o n s m p t i m of nail nqde f i b r e f a b r i c s by
( a ) r e g i o n ; ('3) i t e m o f c l o t h i n g ; ( c ) household incono ;
m d ( d ) r e l c - t i v o p r i c o s n t ,a p a i n t o f . t ime and s v s r t h e
17criod of t ime 1974-79.
( a ) By Region
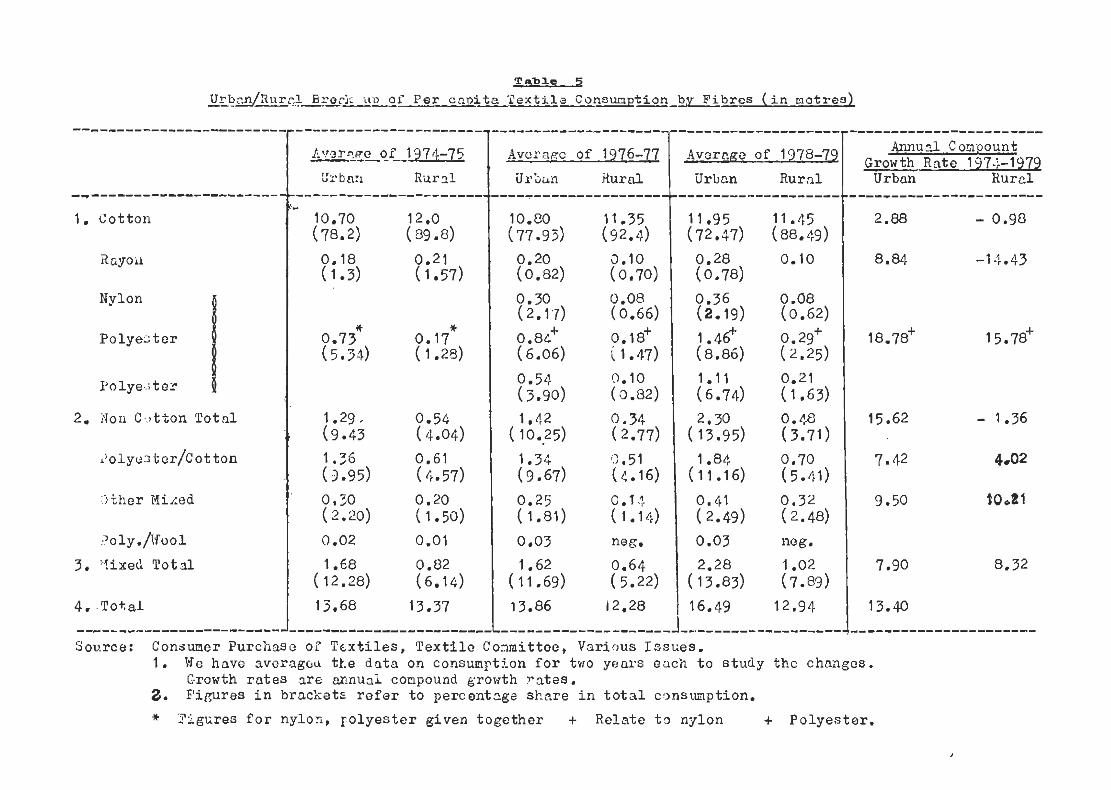
From T a b l e 5 we can s e e t h a t t h e urbr ;n / rura l d i i f e r -
erice i n p o r cap i t ? . consumption o f a l l t s x t i l c s which w m l e s s
th.:n 1/2 met ro i n 197$-75s i n c r c l s e d s u b s t . ? n t i ? l l y t o ?.bout
71/2 metros by 1 9 7 9 . Th i s i s ma in ly on account of P. more rc.pid
z r o v t h i n t h c c o i ~ s - x ~ ~ t i o n of man nade f i b r e s i n u r b a n axes
a!.? a d e c l i n e i n t h e cor. m p t i o n o f c o t t o n t e x t i l e s i n r u z a l
nrens . P e r c ~ p i t : ~ c o n s m p t i o n i n r u r a l n r e z s h a s dcclinci!
f r o ~ l about 13.37 n c t r e s t o 12.9/, m e t r e s ; w h i l ~ i n u r b a n area::
i t i n c r e a s e d from 13.68 n c t r c s i n 1')7~\-'75 t o 16.49 metros i n
ove a l l c o n s m p t i o n t h i s cou ld bc m e of th,: r e a s o n s f o r t l ic
d o c l i n e i n pei. e n p i t - consurzption uf t cxki l ; . s a t t h o ~ll-1::din
l e v o l a s we s-.w from ll:.ible Jr. E'ibi-e-xise we f i n d t h a t a l a rg i .
p a r t of t h c dec l in , ? i n r'51.31 :irer.C i s on ~ c c m n t of c o t t o n
-- 9
I t may be notiid t h a t p e r c a p i t a c o n s m , s t i o n of t e x t i 1 i . s as e s t i m a t e d by CPT a r c abou t ont-- n e t r e less t h a n t h e i ?s t in i~ t~s from aggrcg - t e p r o d u c t i o n d-i tn; n o s t o f i t i s o n account of %an-made f i b r e f a b r i c s .
T a b l e 5
U~'b~.n/Xurr^.l Breeel: LID Or.' P e r capita Textile C o n S m p t a by Fibres ( i n n c t r e s )
Nylon
Po lyes t e r I B
Polye..;ter #
2. Non C..,tton Tota l
Other Mimd
?01~./ t r00i
3. Yixed To ta l
l- Averago of 1976-77 Average of 1978-79
Ur'san Rural
11.35 (92.4)
5.10 (0.70)
0.08 (0.66)
0.18' ( 1.47)
!>.lo (0.82)
0.34 (2.77)
1.1 .5 I (4.16)
D.14 ( 1 . 1 4
neg.
0.64 (5.22)
i2.28
Urban Rural
...................... Annual. C ompount
Growth Rate 197:-1979 Urban H u r d
Soumce: Consumer Purchase of Textiles, T e x t i l e Conmittee, Various I s sues . 1. We have averageu tk.e da t a on consumption f o r two years each t o study tho changes.
C-rowth r a t e s a r e a rnua l conpound growth r a t e s . 3. P i m r e s i n brackets r e f e r t o percentage sh8re i n t o t a l cmswnption.
* Yigrires f o r nylon, po lyes t e r given toge ther + Relate t o nylon + Polyes te r .

t e x t i l e s . FIowever, t h e most s t r i k in r ; d i f f c r enc - between the
urban and r u r a l a reas i s i n t h e consumption of man made fi5re:;
and i t s growth. While almost 2:. percent of consumption is
accounted f o r by non-cotton and mixed f a b r i c s i n urban areas
and i t increased t o almost 23 percent i n 1 9 7 8 3 9 , t h i s propor-
L . ~ l o n is only 10 percent i n r u r a l arezs . I t may be noted however
t h a t i n r u r a l a r eas a l so , the tendency i s to;iards increas ing use
o i m.7.n made f ih re /n ixed f a b r i c s whose share increased t o about
17 percent by 1978-79. If we f u r t h e r disaggregate t he f i b rc s ,
N C f ind t h a t t h e urban/ rura l d i f f e r e n c e is more in
r e s p c c t of nylon and po lyes t e r vis-a-vis rayon, per c a p i t a con-
sua2 t ion of which was i n f a c t h igher i;: r u r a l a r e a s i n i t i a l l y .
Yhi la t he d i f f e r e n c e i n favour of urhan a reas is about 0.20 netres
i n r ~ ? s p e c t of rayon i t i;: i.17 metres with r e spec t t o synthet ics .
'The r a t e of growth i n per c a p i t a consu;;.jtion of s y n t h e t i c s i s
almost 13 percent i n urban a r e a s ; i n r u r a l a reas i t i s r e l a t i v e l y
lowcr - 16 percent per ann& - but much h igher t han t h e annual
g m x t h r a t e of rayon o r co t tdn . IIence i n r u r a l a r eas a l so , polye-
s t e r now appears t o have a l a r g e r sha re i n consumption of non-
c o t t o n t e x t i l e s . With r e spzc t t o nixe"labr ics , po lyes te r /
co t ton blends predominate i n bgth urhain and r u r a l a r e a s ; howeoor
/ t h e i r c o n ~ ~ i p t i o n i s almost t v i c e as high i n urban areas . Sztween
mixed f a b r i c s and pure man made f i b r e f a b r i c s t he urban/rural
d i f f e r e n t i a l i s much higher i n t h e case of the l a t t e r being
almost f i v e t imes higher . The u rbnn / r i~ ra l d i f f e r e n t i a l i n

r e sgec t of consunption of t e x t i l e s by u i f f e r e n t f i b r e a bas ixpor t - f i b r e
nut i n 7 l i c a t i o n a f o r t he l i k e l y denend of mnn nada/fabr ics i n
(i) Tho o v e r d l 5cc i ino . in ?or c d p i t s 'con3u;lption of
c o t t o n c l o t h i n g is t o s o m o x t c a t on account of t h faJ.1. of p s r
c a p i t a consm:,tion i n r w a l a r eas , where the propor t ion o f co t ton
t cu ' c i l o s c o n s m ~ d is nuch highor than i n urban a r e a s ,as a l so on
nccount of t he i nc reas ing sha re of m a n made f i b r e f a b r i c s i n t o t d l
t . ? x t i l a consmption.
( i i ) 'i'he i n c r e a s e i n t he r z t c or̂ u rbanisa t ion aS revealed
hY' tho 1971 Census ha6 lxen f u r t h k r j s t ab l i shod by t h ? 1981 Consus.
. . .;lnc.: -:ti.. tl:2:7<. t~? :c , r%i increased urbznisa t ion may bc cxpectcd t o
con h n a i n t h e subsequan', decedcs, tlw 2 o t c n t i s l rr.arl;et f o r nnn
m;de f i&ricS nay b-: e x ~ a c t ~ d t o j.ncreasa correspondingly.
( b) mr;! of Uso
11% Tcble 6 , pcr c a ~ i t a consum$don of t e x t i l e s is given
by na jo r items ( i n porcontago terms) nnd wc subncquentlg d i scuss
thi! f i b m composition of each. The i t m wise d i s t r i b u t i o n WJ
n o t bc very accurz t* 3ecnwo of tho d i f f i c u l t y of assess ing
notc;':?.go e s p e c i n l l y of r s d y made g,vnollts, h o i s e r y e t c . a d we
"cleat it as broadly i n d i c z t i v e . Tho c o s t importeat itein i s t h e
s a r i , accounting f o r almost 30 percent of the p e r c a p i t a con-
s u p t i o n ; s h i r t i n g accounts f o r 13 ~ e r c e n t followed by dhoti-


10 percent. Ladies d r e s s ma te r i a l s , reacy m,z?i. g3rnonts m d
coating/suit im&(arG a l s o or some importmce. From the t a b l e
we c,m a l s o se.0 the urban/rural v a r i a t i o n i n apparel - r a l a -
t i v e l y l a r g e r sh&e of- dho t i v is-svis coa t ing /su i t ing i:1 r u r a l
arGas; h o w e v ~ r r e , d y nade garix:nts a r e d n o s t oqunl ly i npor t an t
i n both areas. The i tem wise p a t t e r n has changed snmcwhat between
1 974-79.
The percentage s h m e of dho't i has dccl ined e s p e c i a l l y i n
urban a reas , whi le t h a t of s h i r t i n g , su i t ing /coa t ing otc. has
incrccrscd. Thero has bean -I dec l ine i n the r e l a t i v e (nnd nbso-
l u t e ) consunption of long c l o t h and shi-eting; the shnrc of l a d i e s
d r e s s rnctcr ia l and ra:~dy m.?de emmonts i n c r e s s d . I t may bc noted
t h a t both t h e i tems - dhot i .?.nd l o q ? c l a t h - whose sha re d ~ c l i ~ i e d
fzom 19 percent of per c a p i t a , consumption i n 1974-75, t o 13 percent
by 1978-79, a r e almost e n t i r e l y made i i i tk zotton. I n t he case .of
o t h e r i tems thc s h a r e of zlan made f i b r z s vr.r ias, which we d iscuss
b e l m ( s e e Table 7).
Pcrhaps t h e u se 03 nan nade f i b r m p r i ~ i a r i l y polycstcr /
c o t t o n blends ib t h e l a r g e s t i n t h i s item. The slicre of puro polge-
s t e r and polyester /cot tor! blcnds has increased from 52 pcrcont
i n 1974 t o 64 percent by 1979; t h e i n c r e a s e wzs sha rpe r i n urbm
areas .


mtd..... Table 7
2
1 3 6 10 11 12 13
Ready M r.de NGGP 5.4 0;9 1.7 6;2 1.8 2.5
OM Tot9.1
)Tote: C = Cotton; K = layon; N = Nylon; P = P o l y e s t e r ; P/C = P o l y e s t e r / ~ c t t o n ; OM = Other Mixed
'.'here nay not add upto 1CO because of o the r f i b r e s l i k e s i l k , woollen and poly/wool.
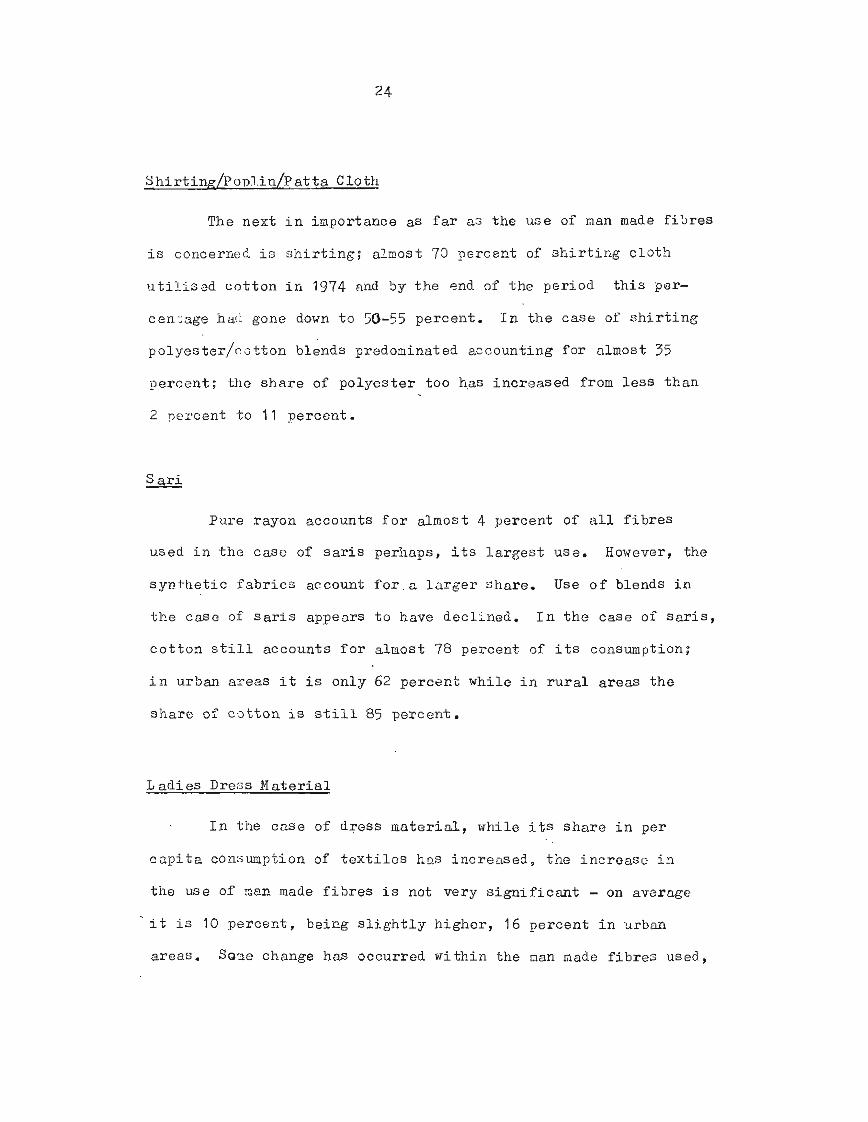
~ h i r t i n g / ~ o n l . i & t a Cloth
The next i n inpor tance as f a r a s t he use of man made f i 5 r e s
i s concerned i s s h i r t i n g ; almost 70 percent of s h i r t i n g c l o t h
~ l t i l i s e d c o t t o n i n 1974 and by t h e end gr" t he per iod t h i s per-
c e n x g e had gone down t o 50-55 percent . I n t h e case of s h i r t i n g
po lyes t e r / co t ton blends predominated accounting f o r almost 35
pe rcen t ; tho s h a r e of po lyes t e r too has increased from l e s s t han
2 percent t o 11 percent .
S ari - Pure rayon accounts f o r almost 4 percent of a l l f i b r e s
used i n t h e case of s a r i s perhaps, i t s l a r g e s t use. However, the
s y n t h e t i c f a b r i c s accoun* f o r a l a r g e r share . Use o f blends i n
t h e case of s a r i s appears t o have decl ined. I n t h e czse of s a r i s ,
c o t t o n s t i l l accounts f o r almost 78 percent of i t s consumption;
i n urban a r ea s i t i s on ly 62 percen t whi le i n r u r a l a r ea s t h e
s h a r e of c o t t o n i s s t i l l 85 percen t .
L a d i e s Dress Material
I n t he ca se of d r e s s m a t e r i a l , while i t s s h a r e i n pe r
c a p i t a con:junption of t o x t i l c s hns increased , t he i nc rea se i n
tile use of -an made f i 3 r e s i s not very s i g n i f i c a n t - on average
i t i s 10 percen t , b e i r g s l i g h t l y h igher , 16 percen t i n urban
areas . S a x change has occurred w i t h i n the man nade f i b r e s used,

t h e s h a r e of rayon has decl ined an4 t h a t 3f syn the t i c s increased
from about 2 percent t o 5.3 percent i n 1979. ~ o l y e s t e r / c o t t o n
blands t33 a r e important.
Ready made garments
I n case of t h i s i tem, t h e r e has n.at been much changc i n
t he use of t h e d i f f e r e n t f i b r e s . C o t t o ~ i s t i l l accounts for al-
most 33 percent as it d i d i n 1974, .and some marginal change
occurrea i n t h e u se of m a n made fibres,// From t h e above analysis
we 11.-.ve been able t o i d e n t i f y t h e lnnjor i tems i n which tlie use
:>f man nade f i b r e s has increased s i g n i f i c a n t l y and which w i l l
c .>ntinue t o grow i n t h e fu tu re . Although i n t he case of smi,
t h e :in,;le l a r g e s t i t em ~f J r e s s , t h e overcall i nc rease has not
beell very l a r g e , i n urban a reas alm,~st 4D percent of s a r i s use . .
man nade f ibres/blends. I n t h e case of sui t in , - /coat ing the sub-
s t i t u t i o n f o r c o t t a n has been the highont. I n add i t i on the change
i n s t y l e of d r e s s - t h e d e c l i n i n g use of d h o t i , increas ing use
of s h i r t i n g e t c . appears t o have f u r t h e r reduced the requirement.
o f c a t t o n f i b r e and t h i s would c e r t a i n l y i n c r e a s e i n t h e future
with i nc reas ing urbanisa t ion .
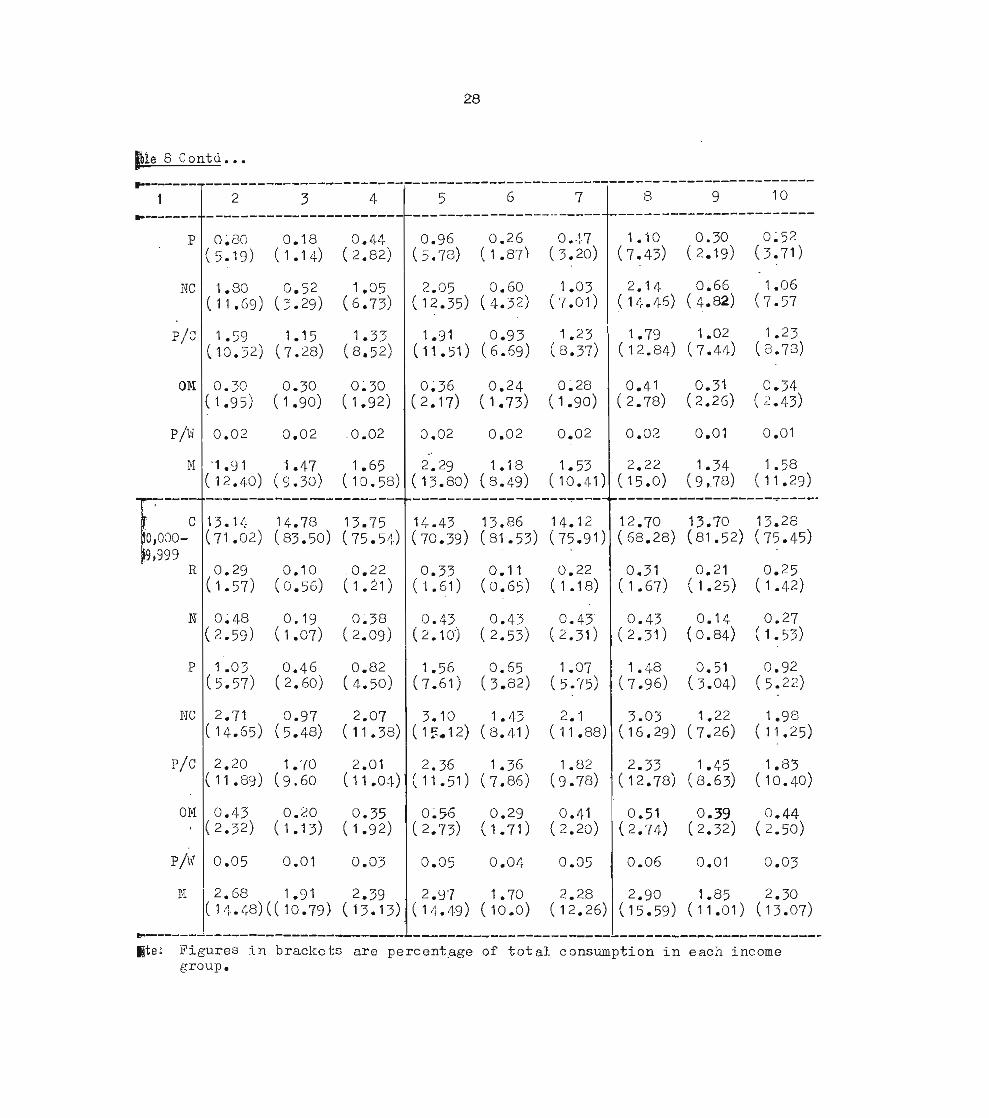
( c) - 11,ils~&eld-b-r ~ e r c a o i t a ) Income
~~t~ e e given i n terms of s i x iacome groups ( s e e Table 8).
Although per c'@pita cz~nsumpti3n i n q u a n t i t a t i v e t e n s Yar these

r Capita C o n s u ~ n t i o n of T e z t i l c s - F i b r e wise - B y Income Grgups ( i n n e t r u s j
..................... 1977 1 1978 1979 ---------------------+---------------
U R A-I I U R :I-I R
1 0.01 I I neg. nee.
rote: Figures i n b racke ts a r e percentage of t o t a l consumption i n each income group.

ple 8 Contd...
Mte: F i g u r e s i n b r a c k e t s a r e p e r c e n t a g e of t o t a l consumption i n e a c h income group.

Table 8 Contd ..... ... -
C l(.hi.2G) 12.39 ( 8 9 . 2 3 ) ( 6 4 - 0 7 ) / ( 0 0 . ~ , 7 ) ( 8 $ . 6 ) 5.78 11,27 13.91 11-62 13.09 (61.1)(!.62.)8)(83.94) 12.85 7 . 9 ( 6 7 lad
Rs.20,000 . .
IJote; F'igursc. i n brackets a r e percentage of t o t a l consumption i n each incom group.
N
g r o u p s i s ava i l ab l - from 1974, d e t a i l e d f ibre-wise information
i s t h e r e only f o r t h e ~ l a s t t h r e e gears 1977 t o 1979 ( s e e Table 8
I t may be noted t h a t t h c es t imates of per c a p i t a consum~>tion of
t e x t i l e s i n the 1-Zghest income group ~ s y i e c i a l l g i n r u r a l areas il
0.47 0.32 0.45 (2;36) (4.92) (2;56)
var iance wi th t h e r e s t of t h e d a t a which map be on account of th
smallness of t h e s m p l e i n t h a t income group.
0.76 0.01 0.49 (3.32) (0.07) (2.51)
0.41 neg. 0. (1.99) - ( 1 .
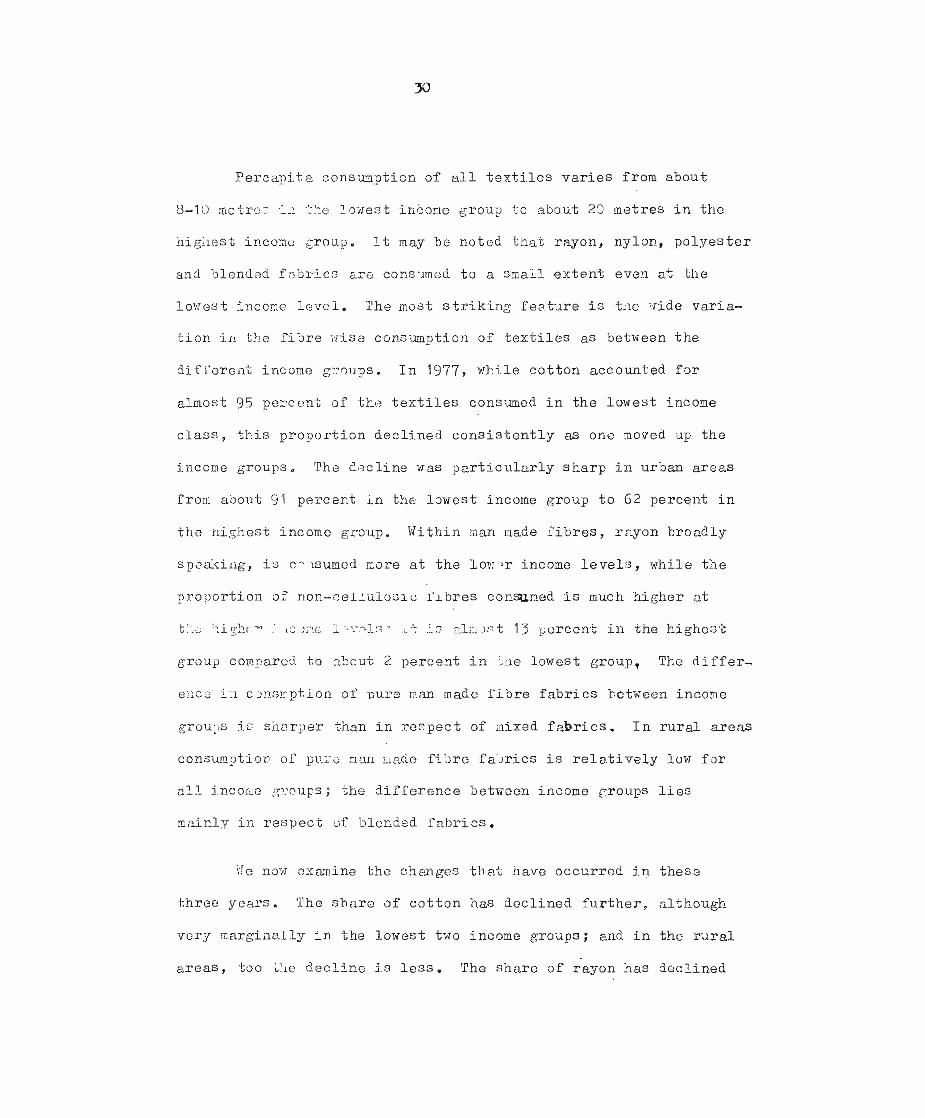
Pel-capi.ta cons .mpt ion of a l l t e x t i l e s v a r i e s from abou t
8-10 metrcz l.: <Ye lowes t income g roup t o abou t 20 m e t r e s i n t h e
h i g h e s t income group. I t may be n o t e d t h a t rayon, n y l o r , p o l y e s t e r
and 11lendsd f a b r i c s a r s c o n s m e d t o a srnall e x t e n t even a t t h e
l o t r e s t inccme l e v e l . The most s t r i k i n g f e a t u r e i s t h e v i d e v a r i a -
t i o n i n t h e f i b r e : r i se c o n s i m p t i c ~ l of t e x t i l e s es between t h e
d i f i ' e re i l t income g::oups. I n 1977, w h i l e c o t t o n accounted f o r
a lmost 35 p e l c e n t of t h e t e x t i l e s consumed i n t h e l o w e s t income
c l a s s , t h i s p r o p o r t i o n d e c l i n e d c o n s i s t e n t l y as one moved up t h e
income groups . The l i ? c l i n e was p a r t i c u l a r l y s h a r p i n u r b a n a r e a s
from about 91 perter-t i n t h e l o w e s t income group t o 6 2 p e r c e n t i n
t h e h i ~ h e s t income group. W i t h i n man made i i b r e s , r a y o n b r o a d l y
s ~ i . a ? c i n & , i s c - . .~suned more a t t h e los: , r income l e v e l s , wh i l e t h e
proi 'or-tion of non-cellulosic f l b r e s c o n a n e d i s much h i g h e r a t
! ' i r : . - I . i 5 s ,:.11:!3::t 13 i;ercent i n t h e h igh2s . t
g roup compared t o n5cut 2 p e r c e n t i n '.he lowes t group, The d i f f e r -
exc.: i:i c ' ~ n r ; r p t i o n of pu re man nade f i b r e f a b r i c s k,etween income
g r o u l s i s s i l a r ;~e r than i n r e s p e c t of mixed f a b r i c s . I n r u r a l a r e a s
c o n s u ~ p t i o ~ o r l;u-e r n l i l :.lade f i13re f a :> r i c s i s r e l a t i v e l y low f o r
311 i ~ c o n c g?:cups; ~khe d i f f e r e n c e between income groups l i e s
ma in ly i i n r e s p e c t uf blcnded f a b r i c s .
lire now c x m i n e t h e c h a l g e s t h a t have o c c u r r e d i n t h e s o
t h r e e y e a r s . The s h a r e o f c o t t o n has d e c l i n e d f u r t h e r , a l t h o u g h
v e r y m a r g i n a l l y i n t h e l o w e s t two income g roups ; and i n t h e r u r a l
a r c a s , t o o tlie d e c l i n e i s l e s s . The s h a r e o f r'ayon h a s d e c l i n e d

s l i g h t l r ; -:rithi.-. the non-cel1u:;sic f? ' :res, while t h e ehsre of
ny:a2 i ~ c r ? a s e d oniy a-t tho 11ighez.t i n c o ~ i e l a v c l , polyec.ter con-
s u ~ ~ ~ t i o n has increasad. f o r a l n o s t dl irrcone groups i c ?ma1 and
xr;,n aroz;? i%rn so i n .the la t ter . I n r e s p e c t nf blcn3od f ab r i c s ,
~.hc. 2har.c of a l l hiends has i nc reased ; however con.~umption/of
D o l y e s t e r / c ~ ~ t o n blended f a!,rics has grown t h e f a s t e s t . I n rwal
arean .the j.ncrr:ase i n consumption of blended f a 3 r i c s i s more sig-
niEicnnt than cf 2ure nul mad.e f i h r e f ab r i c s .
I+; is c l e a r from t h e a ' L o ~ e t h a t ( a ) a l a r g e r proportton
or' %an aade fibre/hlenr?ed f a b r i c s is consumed .a t h ighe r income
l ex -1s; a d (b ) t h e share ~f non-cellulooic f i b r e s a ~ d
c o t t o n bldilds i 3 l a r g e r as we move up the income groups.
'i '1:~e 3atn i n j i c a t e s s t r o n g p o s i t i v e r e l a t i m s h i p between
( 7 . gu;tr!.E.itj 0::. eex t i i u s co;lsumei: ad income; a d ( 3) fibre-wise
c r isur~,ti.ol~ of t e x t i l e s a d income. This re1ation:;hip i s equally
711111 f o r mzzl znd urban areas. From t h i s r e l a t i a n s h i p one can
Ts timc.tc ths ,.liar-,go i~ t o t a l w e l l a s fibre-wise per c a p i t a
;ano!m::tinn of c l s t h f o r any given change i n per c a p i t a income.
I,:cono ~I. : i~t . i :f .~ic-s f o r aach v s r i e t y ol' t e x t i l e s as we l l a s the
e l a s t i c i t y f o r all .:exti.les f o r t he pear 1978 arc given below?.See Table 3).
1 t o he c x p c t e d f o r man-made f i b r e f a l r 5 . c ~ income ' e l a s t i -
c i t i e s a r c relatively higher . I J i th in t h e l a t t e r , t h e e l a s t i c i t y of
d+~!i.nr~d F o r nure non-cotton f a b r i c s i s s l i g h t l y h igher , and noro

r-----
B India
T o t d
kburce: Estima-bed from C o n s a ~ e r Purchase of T o s t i l e s , 1978.
lhte : Thcse elasticities have been e s t i m s t e d by f i t t i n g a semi l o n g f u n c t i o n of t!,c form l o g y I.: a + b x -0~hcre Y = p c r c a p i t a consumption and x i s .* p e r c a p i t a income
s o i.1 u rhan u r c a s . Eowarcr , t h e s l a s t i c i t y f o r c o t t o n i s ve ry low.
t i les , e1as l ;c i l ; ics i.:.;e -s;.L ~ i ~ o i ;or i ~ r o j e c t i n g darfiand f o r tex-
t i l e a i n S e c t i o n 111.
( 3 ) I ' = l a t i v e P r i c e s
P z i c e s c a n a f f e c t t h e p a t t e r n of consumption of t e x t i l e s
~i v~i i - ious t y p e s e i t h e r t h o u g h oown i > n c e movements o r through
d i i f c r e n t i a l movement i n r e l n t i v s p r i c e s . T a k i n ~ t h e average of
t l a s t two y e a r s o f o c r s t u d y we f i n d t h e f o l l o w i n g s t r u c t u r c .. .
of ~ r i c e s o f man-made f i > r e / b l e n d e d f a b r i c s .
P e r c a p i t a income i s d e r i v e d b y d i v i i i n g househo ld income by avorage f a m i l y s i z e f o r each income group.

1. Cotton 5.5
2. Rayon 12.0
3. Nylon 15.4 4. P o l y e s t e r 25.8
5. laolyester / . Cot ton 29.6
. . 6. 0 t h e r Mixed 1 2 3
~ a u r c e : Consumer Purchase of Textiles, 1978 and 1979.
I t is w e l l icn~wn tEi..t t h e h ign u n i t p r i c e of po lyes t e r fabr ics /
blerids is p a r t l y on account of h igh ~ x c i s e d u t i e 3 , which r e s t r i c t
t h o i r consunption i n t h e lower income groups.' I f p r i c e were brought
dowr. with changes ii; :.he 3xc ise str~.ic.ture, dez~imd f o r s y n t h e t i c
f ' l ' sr ics w i l l c e r t a i n l y go up. Howevc? s i n c e e x i s t i n g p r i c e of
sy~rk!ietic f i b r e f a b r i c s , as a l s o blends a r e s o much h igher , u n i t
p r i c e s would have t o f a l l vcry subs t , ?n t i a l l y t o enable n l a r g e
i nc rdese i n consumption.
It m a y be nated that t h i s r e l a t i o n s h i p between p r i c e nncl
qunn t i t y consumed o t non-cal luloaic f i ' J r e f a : ~ r i c s is d i f f i c u l t
t o establish; g iven t h e i r un rea l i sC ic p r i c e s t r u c t u r e t o s t a r t
w i th , consumption of such f i b r e f a b r i c s i s much no re s e n s i t i v c t o
inco:~~cs than t o p r i c e s $ e w ' a-bmr5t ; : .? . i n p r i c e of such .fn':ricS
waul;. t o a c e r t a i n e x t a n t i n c r e a s e t h o i r consumption; nevcrrthe-
loss . this should no t be i&en t o zoan t h a t a f a l l i n thei ' r p r ices

o r a r e l a t i v e l y lr~-:er ins-:e~ss i n nri 2s of o t h e r f i b r e fc l i r ics
would not 1.ezd t o .z su5st .ul t inl i nc rezse i n t h e i r consun:~tion.
He have Rftcmptc:! t o e s t a S i i s h tl1.e r e l a t i o n s l ~ i p h-.twean t h e
per c i ~ p i t n ccnsmi>kion of diff o r e z t ncn nade f i 3 r e f a ? ~ r i c s m d
r i c e i n t e r n s of i t s .jwn p r i c e cs riel1 as t h e weighted average
p r i c e of o the r f i b r e f a b r i c s , t h a t i s r e l a t i v e p r i c e s ( s e e Table 10).
Table 10
P r i c e E l a s t i c i t i e s a t All- .Iadiz l e v e l f o r D i f f e r e n t
-Wan4Iade .. ~ FiSro Tex t i l e s
----------.---------..-----------------_------------
O w n p-Lce c.rns3 p i c e E l a s t i c i t y
! E l m t i c i t y
----------------------+----------- --------------
Source: Consmer Purchase of T e x t i l e s , 1974 t o 1979.
The d a t a used a r e t h e estimated average p r i c e s f o r each f i b r e
f n ~ - ' . c from 1974..79 cad t!ll carresponding p e r c a p i t a consumption,

f o r -11-India ( ~ u r a l - UrSan break ~p a t t h i s d e t d l e d l e v e l i s
no t ava i l ab l e ) . The existence o f 9osit . i-~e own p r i c e e l a s t i c i t y
f o r I~lended man rtad,? f i i j r e i c b r i c n is 3orne ou t 'sy t h e Tzble.
I iegat ive c ros s p r i c e e l a s t i c i t y f o r rayon, ind ica ta i : i t s rc?lc t ive
i n f e r i o r i t y ts o t h e r f i h r e f ab r i c s . The cnsc of p o ~ r e s t e r / c o < t o n
b lends i s i n t e r e s t i n g . Although i t s own p r i c e e l a s t i c i t y i s
p o s i t i v e i t s c r o s s p r i c e e l a s t i c i t y i s very high. This i nd i ca t e s
i t s consumption i n c r e a s e s by a l a r g e magnitude if r e l a t i v e p r i c e
of o t h e r f i b r e f n b r i c s r i s e s . I n a l l c a se s , except rayon, ?I..- f ind
kh2t c ro s s p r i c o e l a s t i c i t i e s a r e q u i t e high.
I t may be noted t h a t t h i s p a t t e r n of co nsumption o;)tains
a t t h e e x i s t i n g l e v e l of exc i se du t ib s c t c . There i s no doubt
t h z t consumption of mzn made f i b r e s i n p a r t i c u l a r , non-cellulosiU,
woi~ld hnve ',ioen h i g h e r if s x c i s o & % t i c s were lower
I t should a l s o be rememb5rcd
t h a t ol?.e of t h e reasons f o r t h e i n c r e a s e i n p e r c a p i t a consumption
of non mcde f ibre/blended f a b r i c s n u s t hnve been t h e augmented
a v a i l a b i l i t y of both c e l l u l o s i c and non-cel lulosic fil ,res/filament
ya rn through 1 i l ) e rn l i od imports s i n c e 1977. . Imported f i l l . re accord-
iilg t o the l a t e s t p r i c e s even a f t e r a l l d u t i e s c o s t s l e s o than
t b c indigenous f i b r e - f o r i n s t a n c e , whi le 1andt.d c o s t of polye-
n t c r s t a p l e f i b r e i nc lud ing a l l d u t i e s W w Rs.79 pe r kg., s e l l i n g
r a t e of domestic nanufac ture rs rangad between b.85 - 89 per lg.
i n t h e l a s t s i x months. S i r r i i l x - i j t i n t h e case o f v i scose s t a p l e
f i 5 r e . Tho ques t i on a r i s e s : would t he se imports continue: Nhat

i s t n e i r impact on i n i i g e n o u s groCuct ion? Eould t h e l a t t e r 'se
mado t o expand s u i f i c i e n t l y i n t h e f a c e of t h e l i l ~ e r a l i s e d i n p o r t
p o l i :y?
S e c t i o n I11
Demand p r o j e c t i o n s f o r man ~ a d e f i b r e f a b r i c s a r e made
f o r t h e g e a r 1985.
?Torn t h e d o v e s e c t i o n we s e e t h a t t h e f o l l o w i n g f a c t o r s
shoul . . bc k e p t i n mind when rejecting t h e l l ' c e ly demand f o r man
na30 f i b r e t c x t i l z ? s i n the f u t u r e .
(i) r a t e of growth of 7irban popu la t ion ;
( i i ) t h e i n c r e a s i n g u s e of man made f i b r e s / b l e n d s i n
i t e m s o f c l o t h i n g l i k e s h i r t i n g , c o a t i n g , s u i t i n g ,
n o p l i n and d r e s s m a t e r i a l t o g e t h e r w i t h t h e change
a l b c i t z a r g i ~ 3 n l i n d r e s s s t y l e s ;
( i i i ) The l e v e l of income and i+ s d i s t r i b u t i o n .
Our e s t i m a t e s of income e l a s t i c i t y t a k e i n t o account
income d i s t r i b u t i o n at a p o i n t of t i n e , ? ju t i t is
assuued t h a t t h i s d i s t r i b u t i o n rernains unchanged
o v e r thi- p r o j e c t e d p e r i o d ; and
( i v ) abso l i l t e as w e l l as r e l a t i v e p r i c e s . of t e x t i l e s o f
d i f f e r e n t f i b r e s / y a r n . However, g e n e r a l l y f o r t h e
purpose 3f ;>rejection ~ r i c e s a r e assumed t o be
constcant.
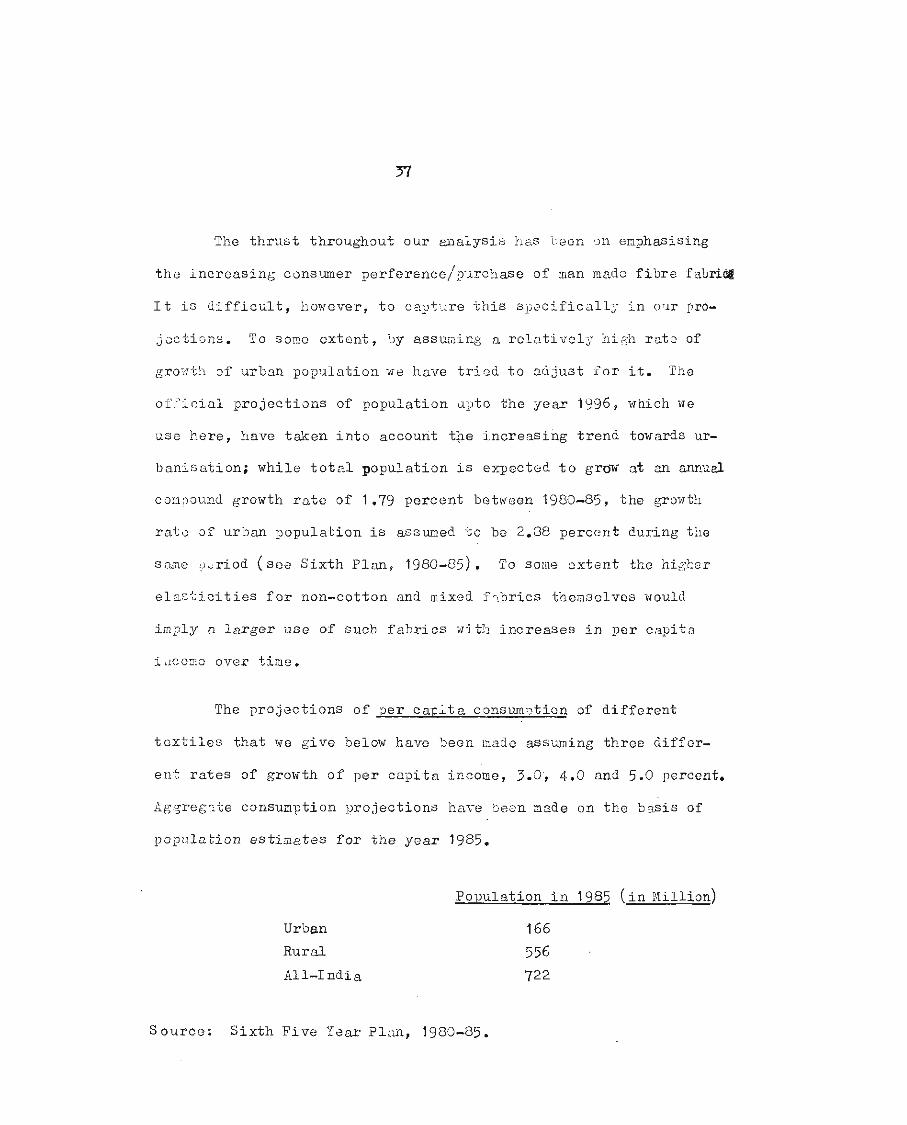
The t h r u s t throughout our ana iys i s h2.s -reen I n enphasising
t h e i nc reas ing consumer p e r f e r ~ n c e / ~ ~ ~ ~ r c h a s e of Inan mado f i b r e fabrim
I t i s d i f f i c u l t , however, t o cspt-.:re t h i s s ~ ; e c i . f i c a l l y i n our pro-
j ~ c t i ~ n c . . T O some ex tcn t , '~y a s s m i n g a re ls t ivel ; : hi511 rat . of
gro?~i;!-t 3f urban populat ion we have t r i z d t o a d j u s t f o r it. 'Tke
ofi':icial p ro j ec t ions of popnlation upto t h e year 1936, which we
usc here , have taken i n t o account t l ~ e increas ing t r end towards ur-
ban isa t ion ; whi le t o t a l populat ion i s expected t o grow a t an =ual
comoound growth r a t e of 1.79 percent between 1980-85, t he growth
r a t e of urban populat ion i s assuned t o be 2.88 percent during the
m sane ir;riod ( s e a S i x t h P len , 1980-05). L O so!:le ex t en t tkc higker
e l a ~ ~ i c i t i e s f o r non-cotton and mixed f ~ b r i c s theaselves would
i,?l:~ly n l a r g e r use of such f a b r i c s w i t ? ? i nc reases i n per cap i t a
i ~1coz.o over timn.
The p ro j ec t ions of Fer c a ~ i t a consum.,tion of d i f f e r e n t
t e x t i l e s t h a t we g ive beiow have 'been eadc assuming th ree d i f for -
en-: r a t e s of growth of per c q i t n income, 3.0, 4.0 and 5.0 percent.
G g ~ r e g ? t e consumption pro jec t ions have becn nade on t h e basis of
popula t ion esti l i lates f o r t h e year 1985.
Urban
Rural
All-I ndi a
Population i n 1985 ( i n l l i l l i on )
166
556
722
Source : S i x t h F ive Year Plriil, 1980-85.

As pointed ou t e a r l i e r , t he p e r c a p i t a consumption of
t e x t i l e s , est imated by t h e T e x t i l e Conmittee i s lower than t h e
es t imates der ived f r o n aggregate ? reduc t ion es t imates , especicJly
i n r e s p e c t of nan nade fibre/mixed f a b r i c s . Ue have t h e r e f o r e
';lased our p ro j ec t i ons on t he 1ztt;:r. iiowever, aggreyate production
s t n t i s t i c s a r e no t a v a i l a b l e according t o reg ion , urban and r u r a l ;
nor ib a d e t a i l e d f i b r e wise Srenk u:) 2va i lab le . Our pro jec t ions
are t k c r e l o r e given z t the 'dl I n d i a l cve l . We have attempted t o
c l a s s i f y t h e 'por c a p i t a consum:~tion of t e x t i l e s - ?ure m c m made,
and l>lended - as given, i n t o d i f f e r e a t f i b r e s by us ing t he propor-
L' ~ z o n o r such f i b r e s i n 2 e r cr.-lita conzr-~nption d a t a a v a i l a b l e :Yon
the Zonsumer Purchase of Tex t i l e s . These f i g u r e s have then 3een
us c~ ;:s jCLsa J,22 ,i ...-, -. ,- :.c .- . 3r. !:?Icing p ro j ec t i ons - pe r c a p i t a , and
ag::?e; i t e - f o r t he yea r 1% . ( s e e Table 11).
Prom t h e p ro j ec t i ons we c u l s e e thctt ( t a k i n g 5 percent r a t e
of growtll of income) whi le per c a p i t a consumi>tion of co t ton is
est imated t o i n c r e a s e by about 6 percen t , s a r c a p i t a consumption
o f ;lure man node f i b r e and blended f a b r i c s i s expected t o r i s e by
about 25 t o 30 percen t over t h o base period.
Mm made f i b r e s t h e r e f o r e w i l l l a F an i n c r e a s i n g l y import-
an t ?ole i n t h e c l o t h i n g requirements of t he economy.

?ro&ct ions of Tex t i l e s C g n s u n j t i o ~ f 3 r the year 1925 -
Base year P e r c ~ p i t n Consunption i n 1985 i iiggregnte Consun~ t ion i n 1985 Assumed Income Growth Rates Assumed Income Growth Rates 1 1980-81 3.0% 4.0% 5.0% i 3.0% 4.0% 5.0%
---------------------.-i---------------------------------------------------'
I p---------------------------------
Po lyes t e r 1 1 .O1 1.18 1.24 1.31 I 853 89 8 945
'1 Pure M a made 1.68 i 1.37 2.57 2.18 1,494 1 ,571
i I
A l l Tax t i l c s 14.56 , 15.28 15.54 15.81 ' 11,031 11,218 11,412 ,
-----,---------------l---------------------------------------------------------------------------------------
1. llase year fi,mres a r e t h ree year averages f o r 1978-79, 1979-80 and 1980-81 and taken from t o t a l ' a v a i l a b i l i t 3 P i y r e s given i n , Ind ian Tex t i l e 3 u l l e t i n .
2. Propor t ion f o r i nd iv idua l f i b r e s i s taken f r o n t he 1979. Consumer Purchase of Tex t i l e s d a t a on P a r o z p i t a consumption of vm5,ous Text i les .

(I u2iild I.-:-<: t o kr.2.a; ix;;:lr,x, > x s ~ I J . ~ ~ T . Mur-leedharan N - i r
f o r tile co"i-,:utxi;ion..! z.sc~.ct.?nce g i v e n 3s n l s o R.Nagraj f o r
?uggo:;i;i.rls a r c l c ,"i::zi;ri,s .in :~n e n r l i e r drr.Ct. B e s i d e s -the:;@
::ol.?~e:..~ucs ai; t he Cari t re , I ~.:ould l i k e t o ccknowledge t h e h e l p
rendc:rod b;r ?~mg o t l : ? ~ . : i n -the t e x t i l e i n d u s t r y i t s e l f - i n
' i l c i n :J~ut:! I n d i a Viscose , L,&shini I * l i l l s nnd
Pn~llr?.j.? l ' .lill.? ir. Coimbs;;ore; as a l s o i n Sou th India T e x t i l e
\ E.:nc.?rcki Assi:cia';ior?, Coi;b:-~-i.crc, 1

This work is licensed under a Creative Commons Attribution – NonCommercial - NoDerivs 3.0 Licence. To view a copy of the licence please see: http://creativecommons.org/licenses/by-nc-nd/3.0/