Consumo Licor WHO
2
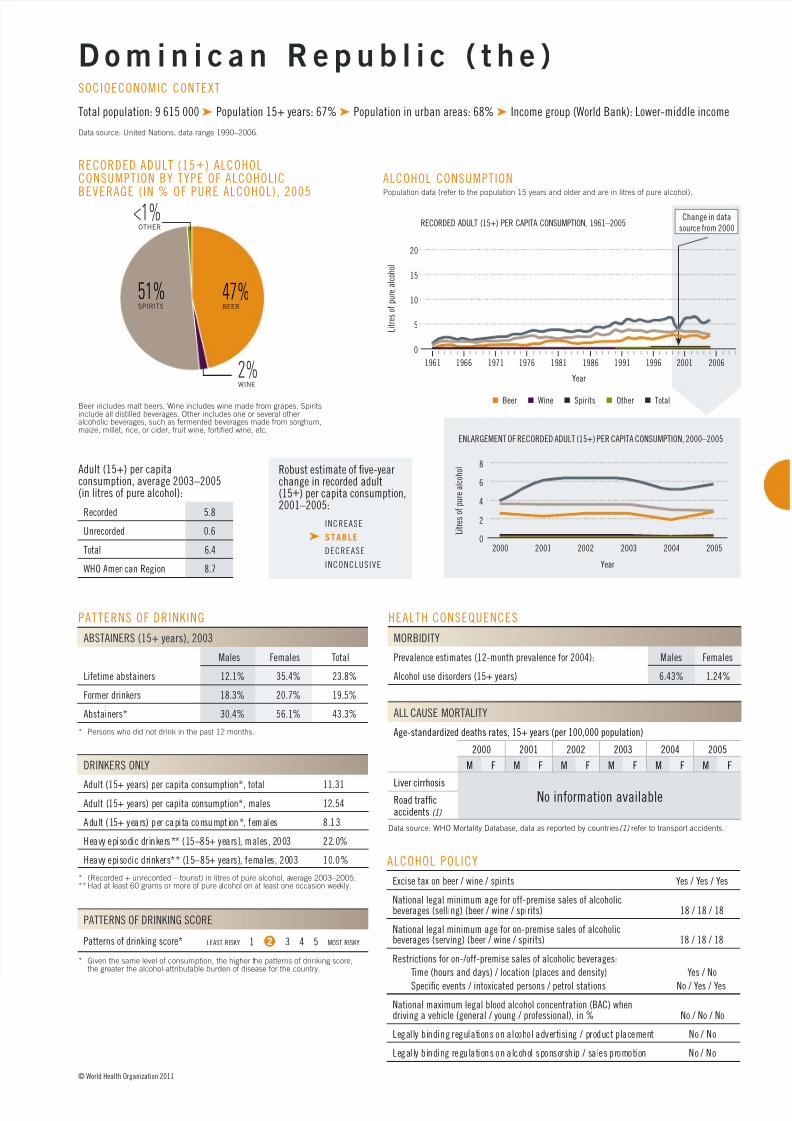
© World Health Organization 2011 PATTERNS OF DRINKING ABSTAINERS (15+ years), 2003 Males Females Total Lifetime abstainers 12.1% 35.4% 23.8% Former drinkers 18.3% 20.7% 19.5% Abstainers* 30.4% 56.1% 43.3% * Personswhodidnotdrinkinthepast12months. DRINKERS ONL Y Adult (15+ years) per capita consumption*, total 11.31 Adult (15+ years) per capita consumption*, males 12.54 Ad u lt (1 5+ ye ar s) pe r cap it a con sumpti on* , fe m al e s 8 .1 3 Heav y ep is od ic drinkers* * (15–85+ ye ar s) , males, 2003 22.0% Heavy episod ic dr inke rs** ( 15 –85 + year s) , female s, 20 03 10.0% * (Recorded+unrecorded–tourist)inlitresofpurealcohol,a verage2003–2005. ** Hadatleast60gramsormoreofpurea lcoholonatleastoneoccasionwee kly. PATTERNS OF DRINKING SCORE Patterns of drinking score* least risky 1 2 3 4 5 most risky * Giventhesamelevelofconsumption,thehigherthepatternsofdrinkingscore, thegreaterthealcohol-attributableburdenofdiseaseforthecountry. ALCOHOL POLICY Excise tax on beer / wine / spirits Yes / Yes / Yes National legal minimum age for off-premise sales of alcoholic beverages (selling) (beer / wine / spirits) 18 / 18 / 18 National legal minimum age for on-premise sales of alcoholic beverages (serving) (beer / wine / spirits) 18 / 18 / 18 Restrictions for on-/off-premise sales of alcoholic beverages: Time (hours and days) / location (places and density) Y es / No Specic events / intoxicated persons / petrol stations No / Yes / Y es National maximum legal blood alcohol concentration (BAC) when driving a vehicle (general / young / professional), in % No / No / No Le gall y bi nding regulat ions on alc ohol adve rt ising / p ro duct pl acemen t No / No Le ga ll y bi nd ing reg ul at io ns on al co ho l sp onsors hi p / s al es pr omot io n No / No HEALTH CONSEQUENCES MORBIDITY Prevalence estimates (12-month prevalence for 2004): Males Females Alcohol use disorders (15+ years) 6.43% 1.24% ALL CAUSE MORTALITY Age-standardized deaths rates, 15+ years (per 100,000 population) 2000 2001 2002 2003 2004 2005 M F M F M F M F M F M F Liver cirrhosis No information available Road trafc accidents (1) Datasource:WHOMortalityDatabase,dataasreportedbycountries (1) refertotransportaccidents. 47% BEER 51% SPIRITS RECORDED ADULT (15 + ) ALCOHOL CONSUMPTION BY TYPE OF ALCOHOLIC BEVERAGE (IN % OF PURE ALCOHOL), 2005 Beerincludesmaltbeers.Wineincludeswinemadefromgrapes.Spirits includealldistilledbeverages.Otherincludesoneorseveralother alcoholicbeverages,suchasfermentedbeveragesmadefromsorghum, maize,millet,rice,orcider,fruitwine,fortiedwine,etc. Adult (15+) per capita consumption, average 2003–2005 (in litres of pure alcohol): Recorded 5.8 Unrecorded 0.6 Total 6.4 WHO American Region 8.7 Dominican Republic (the) Total population: 9 615 000 ➤Population 15+ years: 67% ➤Population in urban areas: 68% ➤Income group (World Bank): Lower-middle income Datasource:UnitedNations,datarange1990–2006. SOCIOECONOMIC CONTEXT Robust estimate of ve-year change in recorded adult (15+) per capita consumption, 2001–2005: increase ➤ stable decrease inconclusive 2% WINE <1% OTHER 8 2000 2002 L i t r e s o f p u r e a l c o h o l ENLARGEMENT OF RECORDED ADULT (15+) PER CAPITA CONSUMPTION, 2000–2005 Year 2003 2005 2001 ALCOHOL CONSUMPTION Populationdata(refertothepopulation15yearsandolderandareinlitresofpurealcohol). 1961 1966 1976 L i t r e s o f p u r e a l c o h o l 1991 RECORDED ADULT (15+) PER CAPITA CONSUMPTION, 1961–2005 Year 1971 1981 2001 1996 1986 2006 Change in data source from 2000 Beer Wine Spirits Other Total 15 5 10 20 2004 2 4 6 0 0
Transcript of Consumo Licor WHO
8/6/2019 Consumo Licor WHO
http://slidepdf.com/reader/full/consumo-licor-who 1/1