CONSUMERS’ PERCEPTION OF LOCAL FOOD: A STUDY OF …
131
1 CONSUMERS’ PERCEPTION OF LOCAL FOOD: A STUDY OF STUDENTS OF THE UNIVERSITY OF FLORIDA IN THE UNITED STATES By DIANE-ISIS NYOB A THESIS PRESENTED TO THE GRADUATE SCHOOL OF THE UNIVERSITY OF FLORIDA IN PARTIAL FULFILLMENT OF THE REQUIREMENTS FOR THE DEGREE OF MASTER OF SCIENCE UNIVERSITY OF FLORIDA 2012
Transcript of CONSUMERS’ PERCEPTION OF LOCAL FOOD: A STUDY OF …

1
CONSUMERS’ PERCEPTION OF LOCAL FOOD: A STUDY OF STUDENTS OF THE UNIVERSITY OF FLORIDA IN THE UNITED STATES
By
DIANE-ISIS NYOB
A THESIS PRESENTED TO THE GRADUATE SCHOOL OF THE UNIVERSITY OF FLORIDA IN PARTIAL FULFILLMENT
OF THE REQUIREMENTS FOR THE DEGREE OF MASTER OF SCIENCE
UNIVERSITY OF FLORIDA
2012

2
© 2012 Diane-Isis Nyob

3
ACKNOWLEDGMENTS
I would like to thank the European Union, which gave me the opportunity to study
abroad through the Atlantis Erasmus Mundus program; it has been a very constructive
experience. I thank Agrocampus Ouest my Engineering School in Rennes, France,
because it allowed me to participate in the program.
I am also grateful to my advisors who always gave me useful insights. The team
was constituted by Dr Rainer Haas (Professor at the University of Natural Resources
and Life Sciences in Vienna, Austria), Dr James Sterns (Professor at the University of
Florida), Dr Jeffrey Burkhardt (Professor at the University of Florida) and Dr Gianluca
Brunori (Professor at Pisa University, Italy). Their comments and criticisms were a great
contribution to the shaping and perfecting of this thesis. I do not forget the
administration staff in Europe and in the USA because I think they helped me a lot to
understand how to succeed in the Atlantis program.
I thank my family and my friends who have been of a great support during my
dissertation work. Their love, care, patience and understanding gave me the courage to
go on even when it was tough.

4
TABLE OF CONTENTS page
ACKNOWLEDGMENTS .................................................................................................. 3
LIST OF TABLES ............................................................................................................ 6
LIST OF FIGURES .......................................................................................................... 7
LIST OF ABBREVIATIONS ............................................................................................. 9
ABSTRACT ................................................................................................................... 10
CHAPTER
1 INTRODUCTION .................................................................................................... 12
Problem Statement ................................................................................................. 13 Study Objectives and Research Questions ............................................................. 14
Anticipated Benefits ................................................................................................ 15
2 LITERATURE REVIEW .......................................................................................... 16
Definition of Local Food .......................................................................................... 16 Geographical Vision ......................................................................................... 16
Supply Chain Vision ......................................................................................... 23 Social Vision ..................................................................................................... 28 The Underlying Definition ................................................................................. 32
Local Food Markets .............................................................................................. 323
Local Food Markets in Florida .......................................................................... 33 Local Food Markets in Europe .......................................................................... 40
Consumers’ Studies and Local Food ...................................................................... 46 Demographics .................................................................................................. 47
Grocery Shopping ............................................................................................ 47 Perceptions ...................................................................................................... 48
Food Marketing Channels ................................................................................ 48 In Europe .......................................................................................................... 49
Summary ................................................................................................................ 50
3 RESEARCH METHODS ......................................................................................... 56
Introductory Remarks.............................................................................................. 56 Word Association .................................................................................................... 56
Means-End Chain Theory ....................................................................................... 58 Laddering Interviews ............................................................................................... 60
Questionnaire Design ............................................................................................. 63 Data Collection ....................................................................................................... 65

5
Sample ............................................................................................................. 65 Context of Interview .......................................................................................... 66
4 DESCRIPTIVE ANALYSIS OF CONSUMERS’ HABITS AND KNOWLEDGE ABOUT FOOD ........................................................................................................ 68
Background Information .......................................................................................... 68 Demographics ......................................................................................................... 68
5 CONSUMERS’ MOTIVES, BARRIERS AND PERCEPTION OF LOCAL FOOD .... 95
Introductory Remarks.............................................................................................. 95
Motives and Barriers ............................................................................................... 95 Word Association .................................................................................................... 98
Differentiation of the Local Food from Other Foods. ............................................... 99 Means-End Chain Analysis ..................................................................................... 99
Methodology ................................................................................................... 100 Hierarchical Value Maps (HVM) ..................................................................... 101
6 CONCLUSIONS ................................................................................................. 1111
Keynote ................................................................................................................. 112 Key Findings and Discussion of the Results ....................................................... 1122
How Well Informed Are the Consumers Regarding Local Food? ................ 1122 How Can We Define Local Food? ............................................................... 1123 What Are the Motives and Barriers to Buy Local Food? .............................. 1124 What Are the Consumer’s Values Concerning Local Food and Does Local Food Encompass the Same Values for Different Categories of Consumers? 1126 What are the Attributes Associated with Local Food? ................................. 1127
Limits of the Method............................................................................................ 1188
APPENDIX: QUESTIONNAIRE OF THE STUDY ..................................................... 1211
LIST OF REFERENCES ........................................................................................... 1266
BIOGRAPHICAL SKETCH ........................................................................................ 1311

6
LIST OF TABLES
Table page 2-1 Correlation between population-level health outcomes and measures of local
food marketing and production. .......................................................................... 52
4-1 Summary of conducted interviews .................................................................... 844
4-2 Race and ethnicity repartition in Gainesville, within the general users and within the self-selected users............................................................................ 844
4-3 Most important criteria when buying food by rank of importance for the self-selected users .................................................................................................. 855
4-4 Most important criteria when buying food by rank of importance for the general users. ................................................................................................... 866
4-5 Table of contingency for the type of population versus the quality criterion. ..... 866
4-6 Table of contingency for the type of population versus the freshness criterion. 866
4-7 Table of contingency for the type of population versus the price criterion. ......... 87
4-8 Table of contingency for the type of population versus the health and nutritional value criterion. .................................................................................. 877
4-9 Table of contingency for the type of population versus the taste criterion. ....... 877
4-10 Table of contingency of the proportion of the weekly shopping that has been produced locally versus the type of population. ................................................ 877
4-11 Table of contingency of the answered geographical boundaries for local food and the types of population............................................................................... 877
4-12 Frequency of shopping at different local food venues for the self-selected users (numbers rounded) ................................................................................... 88
4-13 Frequency of shopping at different local food venues for the general users (numbers rounded) ........................................................................................... 888
5-1 Word association test results for the self-selected users ................................ 1055
5-2 Word association test results for the general users ........................................ 1055
5-3 Participation with the laddering exercise. ....................................................... 1066

7
LIST OF FIGURES
Figure page 2-1 Map displaying the direct sales to consumers by county in the USA in 2007. .... 53
2-2 Map displaying the percent of farms with sales less than $250,000 in the USA in 2007.. ..................................................................................................... 54
2-3 Motivating factors for shopping at farmers’ markets according to markets’ managers, in percentage of answers .................................................................. 55
3-1 Consumer’s product related knowledge in Means-End Chain theory. ................ 67
3-2 Example of a set of questions in laddering interviews.. ...................................... 67
4-1 Pie-chart of the most relevant themes that self-selected users find important when buying food. .............................................................................................. 88
4-2 Pie-chart of the most relevant themes that general users find important when buying food. ........................................................................................................ 89
4-3 Pie-chart representing the use of the country-of-origin indications by the self-selected users. ................................................................................................... 89
4-4 Pie-chart representing the use of the country-of-origin indications by general users. .................................................................................................................. 90
4-5 Pie-charts representing the respondents’ knowledge of any label for local food, A) Self-selected users, B) General users................................................... 90
4-6 Pie-chart displaying the proportion of weekly food shopping that is local food, as reported by the self-selected users. ............................................................... 91
4-7 Pie-chart displaying the proportion of weekly food shopping that is local food, as reported by the general users. ....................................................................... 91
4-8 Definition of “local” in terms of geographical boundaries for the self-selected users. .................................................................................................................. 92
4-9 Definition of “local” in terms of geographical boundaries for the general users. . 92
4-10 Categorization of the shopping frequencies at different local food venues for the self-selected users. ....................................................................................... 93
4-11 Categorization of the shopping frequencies at different local food venues for the general users. ............................................................................................... 93

8
4-12 Proportion of self-selected users who buy local food sometimes, often or very often through the different channels. .................................................................. 94
4-13 Proportion of general users who buy local food sometimes, often or very often through the different channels. .................................................................. 94
5-1 HVM for the general users (cut-off level=4) ...................................................... 107
5-2 HVM for the self-selected users (cut-off level=4). ............................................. 108
5-3 Implication matrix for the general users’ HVM. ................................................. 109
5-4 Implication matrix for the self-selected users’ HVM. ......................................... 110

9
LIST OF ABBREVIATIONS
AMS Agricultural Marketing Service
CSA Community Supported Agriculture
ERS Economic Research Service
EU-25 The 25 countries of the European Union after the 2004 enlargement (Austria, Belgium, Cyprus, Czech Republic, Denmark, Estonia, Finland, France, Germany, Greece, Hungary, Ireland, Italy, Latvia, Lithuania, Luxembourg, Malta, Netherlands, Poland, Portugal, Slovakia, Slovenia, Spain, Sweden and the United Kingdom)
FAPC Florida Agricultural Promotional Campaign
GHG Greenhouse gases
HVM Hierarchical Value Map
LF Local food
SFSC Short food supply chain
USA United States of America
USDA United States Department of Agriculture
WTO World Trade Organization

10
Abstract of Thesis Presented to the Graduate School of the University of Florida in Partial Fulfillment of the
Requirements for the Degree of Master of Science
CONSUMERS’ PERCEPTION OF LOCAL FOOD: A STUDY OF STUDENTS OF THE UNIVERSITY OF FLORIDA IN THE UNITED STATES
By
Diane-Isis Nyob
December 2012
Chair: James Sterns Major: Food and Resource Economics
“Local food” is a vague term that has not been precisely defined. However, several
trends show a growing interest in developing local consumption. This thesis investigates
the different meanings that can be given to the concept of local food. It will look at the
views and behavior of consumers towards this non-conventional food-marketing
channel with a particular focus on assessing their individual representations and
associated cognitive structures. Using qualitative interview techniques and unstructured
tasks allows generating more personal consumers’ insights. This thesis is an
exploratory work aiming at describing a trend in a Floridian university city. Two
populations have been separately described: 42 general users of local food and 37 self-
selected users, the latter sampled at different university locations. Using the two
different samples, demographics, knowledge, habits, motives, barriers and finally the
consumer’s perception of local food can be compared. This study finds evidence of
behavioral differences between both of the groups and surprisingly shed light on
common features such as the low level of knowledge for the label “Fresh from Florida”.
The projective technique called Means-End Chains Analysis is employed in order to
generate the two maps of the cognitive structures for each group of respondents about

11
local food. Self-selected users pursue three values when consuming local food:
longevity, good quality of life and patriotism. For general users it is good quality of life,
the fact of being part of a community and human accomplishment. As a final outcome of
the analyses, a consensus definition of local food is obtained.

12
CHAPTER 1 INTRODUCTION
The expression “local food” stresses the geographical proximity of what we eat.
Nowadays, it is becoming more and more common to hear about this notion. For
instance, in 2009 USDA launched the “Know Your Farmer, Know Your Food” initiative,
an effort to create new economic opportunities by better connecting consumers with
local producers. But when we think about this concept, we must remember that not that
long ago, all food was produced locally. When we think about the beginning of the 20th
century, people were eating mainly products coming from their region just because it
was more convenient. But technological improvements changed this practice.
Infrastructures, modern storage methods and new fruit and vegetable varieties have
developed and food has become able to travel over longer distances.
Food from overseas is available in any supermarket. Trade liberalization that
primarily aims to “help prosperity, greater productivity, higher wages, and more choices
at lower prices for families and businesses” (Robert B. Zoellick, World Bank), creates
new food flows around the world. As a result, a Florida consumer will find in his
supermarket strawberries from Canadian greenhouses in October, because the
strawberry availability begins in November in the “Sunshine State.” US consumers
demand variety, quality, and convenience in the foods they consume. As Americans
have become wealthier and more ethnically diverse, the American food basket reflects a
growing share of tropical products, spices, and imported gourmet products
(ERS/USDA).
Free trade now involves a global scale point of view. But we may also be
concerned with a smaller scale, the regional scale. Agricultural industrialization has

13
shaped the modern agricultural landscape in the USA. It is a term used to reflect several
varieties of changing conditions in agriculture and the food system. It includes the
prominence of large-scale agribusiness firms: the continued integration of functions
through ownership, acquisitions, and contracts; the decline of farm-level cash markets;
the increased importance of supply chain management; and the persistent technological
advances (Knutson, Penn, Flinchbaugh, & Outlaw, 2007).
Problem Statement
For a few decades, more and more alternative markets have emerged.
Consumers seek more organic food, food traded in fairer conditions, quality food and
more recently they seek for local food. Niche markets are a way of marketing a product
for its specificity and allow the non-conventional sellers to add value to their food.
Indeed, the mainstream sector is very competitive and the products are standardized.
Rural development strategies frequently emphasize the creation of new marketing
channels aiming to reconnect the countryside with the evolving consumer demand. The
consumer’s life is busier, and as a result, consumers have been looking for more
convenient foods. However, nowadays, on top of being convenient and nutritious, food
also serves other needs. Some consumers are looking for ethical (fair trade) or
environmental (organic) benefits. It is one important feature of consumers’ demand in
Europe and more and more in the USA. And specifying a product’s characteristic that
makes it unique is an intelligent answer that a marketer can give.
In developed countries people are increasingly surrounded by new ideas and
debates; a well-known example is sustainability. Sustainable development means
“development that meets the needs of the present without compromising the ability of
future generations to meet their own needs” (Brundtland commission of the United

14
Nations, 1987). It comprises a triple bottom line of economic sustainability,
environmental protection and social equity. Any area can be analyzed through the lens
of sustainability. Agriculture is no exception. Producing and consuming food are now
linked to a variety of values. New concerns have emerged in the public agora and even
eating can reveal different kinds of values. The consumer is looking for more meaning
from his food because he sees food as part of his self-fulfillment.
There is no single definition of “local” and we may wonder what the consumer
understands “local” to mean. The situation is favorable to this marketing channel
development since the USDA has launched initiatives promoting local food, since an
increasing number of local food networks have been created, and in Europe this
concept has also gained in importance. The growing popularity of “local food” attests to
the fact that it is of interest to assess the consumer’s vision of this subjective concept.
More precisely, this thesis aims at identifying the motives and values of consumers
buying local food. Furthermore, the aim is to identify relevant product attributes of local
food and how they are connected with specific motives and values.
Study Objectives and Research Questions
The objective of this paper is to gain insights into the image of local food for
selected consumer groups and into buying motives for local food. Therefore this study
aims to clarify the following research questions:
How well informed are the consumers regarding local food?
How can we define “local food”?
What are the motives and barriers to buy local food?
What are the attributes associated with local food?
What are the consumer’s values concerning local food?

15
Does local food encompass the same values for different categories of consumers?
Anticipated Benefits
Assessing the perception of local food means also evaluating consumers’
perceived needs. To explore further potentials for local food marketing, it is important to
know the meaning of local products or local farming for consumers. Improving the ability
of developing efficient policies begins with a good knowledge about consumers’ beliefs
and attitudes towards local products. Thereby, farmers who are involved in direct
selling as well as food retailers will be able to better understand what the demand for
local products really means. It will help them to make better business decisions such as
local market promotions, product development and other marketing strategies.
The expected answers from this thesis could be of different kinds since the
method that will be used focuses on what the individual thinks when letting him express
his ideas freely and in depth. This research intends to be as open-minded as possible in
the hope that the intimate perception of local food would be revealed.

16
CHAPTER 2 LITERATURE REVIEW
Definition of Local Food
When trying to define local food, we have to deal with three main overlapping
concepts. We will discuss three views which help to define the term “local food”: the
geographical, supply chain and social views.
Geographical Vision
The US Congress states in the 2008 Farm Bill that the total distance that a product
can be transported and considered as “locally or regionally produced agricultural food
product” is less than 400 miles from its origin, or within the State in which it is produced
(Martinez et al., 2010). However, according to the USDA there is no real definition of
what “local” is, and more specifically, there is no well-defined distance between the
production and the consumption sites. Different visions exist and some notions might
help to determine it. For instance, the New Oxford American Dictionary defines a
“locavore,” as a local resident who tries to eat only food grown or produced within a
100-mile radius” (Martinez et al., 2010). In this view, local food just means a way to
decrease the distance between the producer and the consumer.
In the literature, the scientific community is puzzled. In the focus groups led by
Zepeda and Leviten-Reid (2004) in Wisconsin, local food was defined as being within 6-
7 hours of driving distance, as produced in the State, in surrounding States or in the
USA. In a study conducted in Ohio about strawberries, Darby et al. showed that the
state boundaries serve to define the geographic definition of “local”. According to Brown
(2003), the southeast Missouri consumers defined local as coming from the southeast
of Missouri and not to a broader region as the whole state of Missouri, for instance. This

17
citation from Ibery and Maye (2005) in United Kingdom illustrates the complexity of the
definition:
“For a number of surveyed retailers, ‘local food’ equates to the county level, while others use descriptors such as “Scottish” or “British” produce. Respondents also use distances such as “within 20miles”, “within 30 miles”, “within 50 miles” and “within 100 miles”, and often use the words local and regional interchangeably. It is, in short, an elastic concept. Indeed, population density is important […] because what counts as ‘local’ in [some] very sparsely populated areas […] may be very different from what is considered ‘local’ in a less sparsely populated county […]. Elsewhere, Morris and Buller (2003, p. 565) refer to this as ‘flexible localism’, with retailers using ‘local’ in very fluid terms, determined by the need to source supplies from ‘local enterprises’ that may be 25 miles away or somewhere in Britain.”
Is an administrative or political border a good geographic boundary to define what
local is? Or should we explore more the subjectivity of this term to find a consensual
definition? Borders can be set up by natural barriers (rivers, mountains, etc…) but also
by the feeling of sharing a same history (e.g. the Basque Country that extends over
France and Spain, although these two countries are separated by a mountain).
Local products and locality products. Thompson et al. (2008) draw an
interesting link between the world of fine art and the world of agriculture. The word
“provenance” is often used to describe the history of a painting or other art object that
attests to its authenticity. This word is French, meaning “the place where a thing comes
from, its origin, its source”. More than the traceability, provenance becomes part of the
art object itself. According to this study, as applied to food, this concept of provenance
captures the essence of what consumers are looking for when they decide to eat locally.
This assertion is interesting when trying to define the local character of a product.
It allows us to introduce the difference in meaning of two words that sound similar,
namely the distinction between a “local product” and a “locality product”. Both derived

18
from the Latin root locus meaning “place,” and are attempts to link foods with their place
of production. However, “local product” refers to products produced and consumed
within a certain distance (e.g. 30 miles). And “locality product” refers to products from
further afield, but with an identifiable geographical provenance (Ilbery & Maye, 2006).
For instance, a bottle of champagne is a locality product. It is produced exclusively in
the region of Champagne in France and it carries a label indicating this restricted
geographical provenance. Yet, this bottle of champagne can be purchased in the USA,
that is to say very far away from its production site, and in this case cannot be a local
product. This example indicates the semantic limits of what we call local food in this
research.
The European Union has put in place quality schemes for certain locality food
products. Those products are labeled as Protected Designation of Origin (PDO) and
Protected Geographical Indication (PGI). To obtain such a label, the producers must
comply with strict rules defining their production location. However, more than only
indicating a geographical region, this label attests a specific production process that
gives the food a noticeable quality that differs from any other similar food. A PDO
covers “agricultural products and foodstuffs which are produced, processed and
prepared in a given geographical area using recognized know-how”; a PGI covers
“agricultural products and foodstuffs closely linked to the geographical area. At least
one of the stages of production, processing or preparation takes place in the area”
(European Commission, 2012). PDO is thus more specific and the higher
distinctiveness provides a higher level of protection to the product.

19
In the Marrakech Agreement (final act of the Uruguay Round in 1994) of the WTO,
article 22 of the Agreement on Trade-Related Aspects of Intellectual Property Rights
(TRIPs) states: “Geographical indications are […] indications which identify a good as
originating in the territory of a Member, or a region or locality in that territory, where a
given quality, reputation or other characteristic of the good is essentially attributable to
its geographical origin.” According to the USDA, such geographical indication is “a type
of intellectual property associated with goods that originate in a specific place and
possess qualities, a reputation, or other characteristics that are due to that place of
origin”. In the US, there are "Washington State" apples, “Idaho" potatoes, "Florida"
oranges, and "Vidalia" onions which are grown in the region around Vidalia in Southern
Georgia. The American vision is based on the definition of a trademark. According to
United States Patent and Trademark Office: “Geographical indications serve the same
functions as trademarks, because like trademarks they are: 1) source-identifiers, 2)
guarantees of quality, and 3) valuable business interests”.
Food deserts. The 2008 US Farm Bill defines a “food desert” as an area in the
United States with limited access to affordable and nutritious food, particularly such an
area composed of predominantly lower-income neighborhoods and communities (AMS,
2012). Nutritious food means mainly fruits and vegetables. US First Lady Michelle
Obama has started a movement to eradicate the food deserts in the aim of reducing
obesity through the campaign “Let’s move.” This campaign is looking for ways “to attract
grocery stores and other businesses selling fresh produce to their communities” (Let’s
Move, 2012). The problem is thus the non-availability of nutritious food nearby. An
interesting aspect of defining local food can be to explain what happens when there is

20
actually no food nearby. In this case, the problem does not seem to be related to the
production location but to the availability of a healthy source of food close to a
community, wherever it comes from. “Food desert” is a concept popular because it
illustrates well the consequence of a change impacting the food market structure in
certain areas. Indeed, according to Wright Morton and Blanchard (2007), “food deserts
are the collective result of several forces, including the growth in more populated areas
of superstores (with a large variety of food products), an insufficient population base to
support a wide array of local supermarkets (resulting in the loss or consolidation of
these stores), and changes in food distribution channels, shifts that tend to favor larger
food retailers at the expense of smaller food stores in rural areas.” The community was
less dependent on exterior sources of food because it used to privilege local small food
stores. Usually local small stores source their products more locally than large grocery
stores.
The USDA explains in 2009 that “of all households in the United States, 2.3
million, or 2.2 percent, live more than a mile from a supermarket and do not have
access to a vehicle. An additional 3.4 million households, or 3.2 percent of all
households, live between one-half to 1 mile and do not have access to a vehicle”
(Ploeg, Breneman, Farrigan, & Hamrick, 2009). Food deserts affect mostly the lowest-
income populations who do not have a car and who cannot go easily to grocery stores.
The described situation is thus a situation in which being poor means also not being
able to shop for food easily due not only to direct budgetary restrictions but also to
logistic reasons. And not being able to shop for food as often as what is needed is a fact

21
that logically limits fresh produce intake. Shortening the distances to get food would be
a way of overcoming this and perhaps many effects of poverty.
National and local studies across the U.S. suggest that residents of low-income,
minority, and rural neighborhoods are most often affected by poor access to
supermarkets and healthful food (Larson, Story, & Nelson, 2009). Moreover, higher
access to convenience stores increases the risk of obesity while better access to
supermarkets diminishes this risk (Ploeg et al., 2009) (USDA, 2009). According to
Thilmany Mc Fadden and Low (2012), local food positively influences American health
outcomes, as shown in Table 2-1.
COOL: country scale. In September 2008, the USDA implemented compulsory
Country of Origin Labeling (COOL) on certain foods that are not processed. According
to the USDA’s Agricultural Marketing Service (AMS), COOL “is a labeling law that
requires retailers, such as full-line grocery stores, supermarkets, and club warehouse
stores, to notify their customers with information regarding the source of certain foods.
Food products, (covered commodities) contained in the law include muscle cut and
ground meats: beef, veal, pork, lamb, goat, and chicken; wild and farm-raised fish and
shellfish; fresh and frozen fruits and vegetables; peanuts, pecans, and macadamia nuts;
and ginseng” (AMS, 2012).
This action created a dispute within the World trade Organization (WTO). The
WTO deals with the global rules of trade between nations. Its main function is to ensure
that trade flows as smoothly, predictably and freely as possible. WTO is the main organ
that aims to liberalize the trade amongst its 150 members worldwide. The dispute was
led by Canada and Mexico, who claim that the USA violates its WTO obligations by

22
according “less favorable treatment to imported cattle and hogs than to like domestic
products” (WTO, 2012). However, in April 2012, the USDA Agricultural Marketing
Service (AMS) released a letter to industry representatives stating that COOL
regulations will remain in force, and it reaffirmed its strong support for existing COOL
regulations within the WTO discussions (AMS, 2012).
This shows the difficulties that emerge when trying to differentiate a product in a
market. Adding a new attribute such as a branding strategy generates new competition
that is not based on price or quantity.
It is significant that the State of Florida was a forerunner in requiring country of
origin labeling, mandating it for fruits, vegetables and honey since 1979, and for
aquaculture products since 1996 (Florida Department of Agriculture and Consumer
Services, 2012). One would thus expect that the Florida consumer would be better
informed about the origin of his food.
Foodsheds. This word is derived from the hydrologic term “watershed,” that
defines a functional unit of territory that is drained by a single natural drainage system.
The watershed is the geographical unit on which is based the analysis of the
hydrological cycle and its effects. More precisely, the watershed is a closed entity in a
hydrological point of view: there is no incoming flow and all outgoing flows are either
evaporated either leaving by a single exit. This definition brings to light the scope of the
concept of foodshed. Foodshed is a way of defining a food system. According to
Thompson et al. (2008), Arthur Getz popularized this expression in order to explain
where our food is coming from and how it is getting to us. Given that a foodshed
actually points to the food supply chain or network, nowadays we can observe that our

23
foodshed is global. A person in the USA can get food from Europe since food flows are
mainly driven by the international trade. However, the word has been mainly used by
activists who favor of a reduction of our foodshed size. In their research, Thompson et
al. (2008) held that the San Francisco foodshed for local food was an area of a 100
mile-radius around the Golden Gate Bridge. This area encompasses both the
agricultural land and the retail systems.
Supply Chain Vision
A supply chain is the set of processes, trading partner relationships, and
transactions that delivers a product from the producer to the consumer (King et al.,
2010). The concept of Short Food Supply Chain (SFSC) implies a reduction in the
number of intermediaries between the primary food producer and the final consumer.
According to Ploeg et al. (2009), in the past century three major causes have led
to the change of the food retails environments in the U.S.A: “. . . the rise of chain
grocery stores over independently owned stores, the rise of supermarkets that offered
an increased number and variety of products; and the rise of supercenters that
continued the trend to even larger stores offering more and more products.” The
average supermarket product is handled thirty-three times on its way to the shelf and
many food products travel thousands of miles before reaching stores (Guptill & Wilkins,
2002). According to the Worldwatch Institute, in 2008, fruits and vegetables in the USA
traveled between 2,500 and 4,000 kilometers from farm to market, (~1550 and ~2500
miles) on average.
According to Ibery and Maye (2005), there are three kinds of SFSCs:
- Face-to-face: “producers sell their produce through direct marketing channels such as farmers’ markets or their own farm shop. Here the focus

24
is on local foods, although it is possible for locality foods to also be sold in outlets such as a farm shop.”
- Spatially proximate: “producers sell their products to local retailers in the region. This may include other farm shops, village shops, specialist food outlets, tourist sites, local hotels and restaurants, independent butchers or local supermarket stores. While local foods will nearly always be sold through such retail outlets, it is likely that locality foods will also be sold.”
- Spatially extended: “producers sell products to consumers that are located outside the region. Products may be distinguished using labeling schemes, such as Protected Designations of Origin, with an emphasis on ‘quality’ food products. The focus is therefore on selling local foods as locality products.”
The dominant sources of local food in the USA are via Community Supported
Agriculture (CSA), farmers’ markets, farm stands, and local food co-operatives (Nie &
Zepeda, 2011). There are also private gardening, “pick your own” operations, hunting,
farm-to-school programs, food banks and community gardening. Community Gardens
are places where people in a neighborhood have green spaces set aside for local
residents to grow their own fresh vegetables, herbs, fruits, and flowers (Slow Food,
2012).
This study largely confines itself to the most important sources of local food
previously cited (CSAs, farmers’ markets, farm and roadside stands, cooperatives)
since they involve the delivery of food from producers to consumers.
Transparency and clearer signals of origin. In a study conducted in 2008
aiming to assess the local food system in the San Francisco area, Thompson et al.
explain that despite the elaborate food distribution system that is in place between
producers and consumers, the evolution is now in the direction of delivering the “story
behind the food.” Indeed, the current food distribution system is oriented towards
delivering inexpensive, standardized food products. However, consumer demand is

25
shifting towards a need for more transparency and clearer signals concerning origins of
food. In this sense, SFSCs are an answer to this growing demand. In comparison to
mainstream supply chains, direct marketing of local food provides consumers with
information about where and by whom the food was produced (King et al., 2010). In the
literature from the UK, there is a popular notion of “reconnection” in the sense that a
reconnected food chain would allow a reconnection between the consumer and what he
eats and how it has been produced (Ilbery, Morris, Buller, Maye, & Kneafsey, 2005).
Local food is often promoted as an alternative model to the conventional agro-food
system. But as Ilbery and Maye explain “Binary opposites such as ‘local/global’ and
‘conventional/alternative’ are difficult to maintain because both global (conventional) and
local (alternative) are linked together in an overall agro-food system” (Ilbery & Maye,
2006). Indeed, producers can be part of both systems by selling some products locally
and some others in more distant supermarkets. An example is a tomato producer who
sets aside the best quality tomatoes for the supermarkets because they have strict
requirements, and sells the rest in a local market. The local market is for him a way of
getting rid of the products that do not meet the food retailers’ requirements.
A greener strategy? The burning of fossil fuels (as motor gasoline and diesel)
releases carbon dioxide (CO2) and other gases, which are called greenhouse gases.
They contribute to the global warming of the planet and to the environment degradation.
An indicator called “Average Weighted Source Distance” (or “food miles” for short)
has been created, and it represents the distance food travels from where it is grown or
raised to where it is ultimately purchased by the consumer or other end-user (Pirog, Van
Pelt, Enshayan, & Cook, 2001). The Worldwatch Institute indicated in 2008 that fruits

26
and vegetables travelling from farm to market generate five to seventeen times more
CO2 emissions than the equivalent amount of local food. Worldwatch claimed that
eating locally produced food can reduce an individual’s carbon footprint by about 2,000
kg/year.
In most of the literature, short food chains are a greener strategy than the current
extended supply chains (Pirog et al., 2001; Thompson, Harper, & Kraus, 2008;
Worldwatch Institute, 2008). According to this literature, growing food locally reduces
the amount of fuel used to ship goods long distances.
Pirog et al. (2001) push the argument further by appealing to the idea of
internalization of the external environmental and social costs related to the food chain
(from production to distribution). Indeed, they argue that the so-called “comparative
advantage” that some regions have in producing some goods as cheaply as possible
hides some externalities that should be internalized. If the externalities were
internalized, this would jeopardize and even undermine their claimed comparative
advantage.
The USA is a major greenhouse gas emitter and a growing concern is to reduce
this impact on the environment. It is undeniably true that more and more businesses (in
all fields combined) are interested in reducing their environmental impact for many
reasons. Gil Friend writes in his book The Truth about Green Business (2009) that
green strategies have a broader impact than just reducing the harm caused to the
environment. Greener practices are also a communication strategy for businesses. The
consulting company KPMG found that the value of a company’s brand is often greater
than the value of its tangible assets since more than 55% of a company’s share value is

27
a function of intangibles, such as brand and reputation. It is reasonable to assume that
even in the agricultural sector, there is such a thing as an improved reputation
correlated to more sustainable practices.
However, the entire literature does not necessarily agree that the short food supply
chains are more efficient in term of greenhouse gas emission. As Friend notices, less
shipping often reduces the supply chain carbon impact, but only if the local producer is
energy efficient in both production and transportation.
If in some aspects short food chains can be more sustainable (increase in
cultivated biodiversity, “ecologization” of the practices), they do not have the only
advantages in terms of environmental impacts. New studies comparing energy
consumption between short and conventional supply chains show that with an optimized
logistic in the conventional sector (sea transport for instance), the energy impact can be
lower than in short food supply chain. But short food supply chains’ logistical
organization can be improved, since they are just beginning (Aubry, Traversac, 2010,
INRA).
According to Schönart et al. (2009), the economies of scale in the mainstream
food system allows more technological investment and better resource management
than in a local food system. In the end, the gain in efficiency during the various stages
of a food chain can offset the environmental pollution caused by the longer transport
distances. Small farmers may use “inefficient means of transportation and a lower
utilization of loading capacity.” One example of this is the consumer going to a farmers’
market by car on top of his regular shopping trips (Schonhart, Penker, & Schmid, 2009).

28
For Pirog et al. (2001), the problem is not the energy efficiency of the transport but
rather of the agricultural production system. Indeed, based on life cycle assessments for
tomatoes consumed in Sweden, the least fossil fuel-demanding alternative is to import
from Spain and not to consume tomatoes produced in Sweden. More precisely, the
Spanish tomatoes are not cultivated in heated greenhouses (as are the Swedish ones)
and this energy saving outweighs the energy costs of transportation from Spain.
To conclude this discussion of greenhouse gas emissions, suffice it to say that
there is no agreed framework for calculating these emissions (Edwards-Jones et al.
2008).
Social Vision
According to the Worldwatch Institute (2008), to build a more sustainable
environment, national- and global-level initiatives are essential, but community-level
programs are also important in order to provide new models for change. The word
community comes from the latin “cum” which means “with,” and “munus” which means
“duties.” It “suggests a group of geographically rooted people engaged in relationships
with each other”(Worldwatch, 2008). Further, according to the Worldwatch Institute
(2008), “Social capital” is an intangible asset that arises from the interaction of the
individuals and expresses the level of networking, trust and reciprocity between people.
Social capital allows for empowerment in communities. Building community ties offers a
new perspective of cooperation and is generally opposed to “conspicuous consumption
and competition.” Localizing economic activity through the community “provide[s] a
more stable source of jobs and income, a reduction in use of fuel of transportation,
businesses more willing to adapt to stricter environmental regulations (as opposed to
closing and rebuilding elsewhere), and a larger percentage of profits circulating within

29
the community instead of being concentrated in the hands of far-off investors”
(Worldwatch Institute, 2008).
According to Hendrickson and Heffernan (2002), global corporations dominate the
agriculture system and this leads to a disconnection between time and space. In its
more authentic definition, food is subject to natural constraints such as perishability,
seasonality, and availability of resources. However, the mainstream system is subject to
“a speed-up of time and a compression of space” due to the fact that food should be
available easily, at any time and in any location, whatever the season or what the
variety of food is. In the optimizing process, globalized firms have developed several
strengths such as the “mass production for mass consumption” and the “growing
concentration of power.” However, they are also more vulnerable because they are only
exchange-oriented and thus face difficulties in developing “trusting” relationships with
consumers (hence the high investments in brands and advertising). According to Winter
(2003), there is a growing interest in alternative food systems because consumers are
more concerned about “human health and food safety, the environmental
consequences of globalised and industrialized agriculture, farm animal welfare and fair
trade.” According to the USDA (2010), “consumers who value high-quality foods
produced with low environmental impact are willing to pay more for locally produced
food.” According to Hendrickson and Heffernan (2002), globalized firms also have
difficulties to “react quickly to niche markets.”
Social embeddedness. According to the rural sociology literature, social
embeddedness is a concept that illustrates the fact that there is an inclusion of non-
economic networks in human economies (Hinrichs, 2000). Social embeddedness is the

30
social ties surrounding the economic institutions. It encompasses the personal
connections, the reciprocity and trust that emanates from human transactions. What
should be noted at the outset is that there can be different degrees of social
embeddedness. As Hinrichs writes in 2000 in her analysis of direct agricultural markets
in local food systems, “if relations between producers and consumers are distant and
anonymous in more global food systems, in local, direct markets, they are immediate,
personal and enacted in shared space” (Hinrichs, 2000). For instance, there are
activities for children, educational operations, on-farm work and festivals organized by
CSAs. Farmers’ markets enable farmers to develop personal relationships with their
customers, and to create a loyalty relationship between each other (USDA website).
According to Hinrichs (2000), the concept of “marketness” concerns the fact that
price enters in consideration in an economic transaction. The concept of
instrumentalism concerns the fact that the individual prioritizes economic goals, has an
opportunistic behavior and favors himself. There is always a mix of those three
concepts in any market; the concept of social embeddedness becomes more relevant
when it is nuanced by the concepts of marketness and instrumentalism. However,
according to Hinrichs, “embeddedness rarely stands in diametric opposition to
marketness and instrumentalism . . . embeddedness should not be seen simply as the
friendly antithesis to the market” (pp296-297).
Ripening effect. According to the 2007 U.S. Census of Agriculture, most farms
that sell directly to consumers are small farms with less than $50,000 in total farm sales,
located in urban corridors of the Northeast and the West Coast. These small structures
cannot take advantage of economies of scale, they cannot overcome unpleasant

31
constraints, and they are more sensitive to natural barriers in production. They are less
optimized. Nevertheless, these structures can have a ripening effect on the society.
A National Farmers Market Week was established in August 2011. In his official
proclamation, US Secretary of Agriculture Tom Vilsack states that farmers’ markets:
Increase consumer access to fresh fruits and vegetables and thus promote child health and potentially reduce childhood obesity
Support the sustainability of family farms, revitalize community and provide opportunities for farmers and consumers to interact
Support local anti-hunger initiatives through donations of unsold food to feeding programs
“Local food system works for America: when we create opportunities for farmers and
ranchers, our entire nation reaps the benefits” (Barack Obama). In this statement, the
US President aims to show that it is not only the agricultural sector that can benefit from
shorter food chains. Indeed, farmers who tap into new markets and local food chains
entails many more players in the regional agricultural economy.
The USDA’s Community Food Projects Competitive Grant Program funds projects
tackling food insecurity in low-income families that are initiated by local communities.
Those projects can help eliminating the food deserts; according to the Ploeg et al.
(2009), “this strategy encourages a greater role for the entire food system, including
local agriculture, and represents a proactive approach to fighting hunger, economic and
social justice, and environmental stewardship.” By making structural changes, the
community is less dependent on exterior aid. As a result, the community is more
resilient. Local food system awareness that aims at developing “greater awareness and
appreciation among residents of the value of local foods and food heritages to

32
encourage more locally based eating” (Ploeg et al., 2009), and is one of the issues
addressed in Community Food Projects.
The Underlying Definition
As we have seen previously, the word “local” can refer either to a specific
geographic area, either to an increased degree of trust and co-operation or to a
decentralized model of governance (in opposition to the global food system) (FAAN,
2010). An absolute distance is not a good indicator to define what “local” means, since
the same geographical distance can be perceived differently depending on the area. For
instance, 20 miles in an American rural area is very small in comparison to 20 miles in
an urban area. Population density is one important criterion. More important is the
feeling of belonging to a same geographical area, the feeling of being part of a same
community by sharing some values, sharing a past or sharing a culture. It is logical to
think that the people from the same community are interested in promoting their
common local products. Thus defining the community is the first step before evaluating
what local food actually is for those people. Local food should reflect a part of their
identity. It allows revitalizing a local heritage or/and to keep the dynamism in the area
thanks to the ripening effects. This ethnocentrism reflects the incentive to be proud of
one’s origin. A local product can shed light on who is part of the community and who is
not.
Consuming local food is a way of diminishing the size of the foodshed, that is to
say, localizing the food flows. In this sense, one would try to consume as much as
possible what is produced, processed and retailed close to home. The SFSCs should
then be face-to-face or spatially proximate at least. However, a local consumer is not
just a locavore but also an expenditure minimize, a person looking for a certain level of

33
commercial and nutritional quality, and also a certain level of convenience. If local food
does not full fill those needs as well as the mainstream sector does, local food should
have other supplementary attributes in order to compensate. The social function of local
food is an answer. Indeed, local food can also allow building trusting relationships
between producers and consumers. Actually, knowing where the food comes from is
related to consumers’ perceptions regarding such things as food safety, animal welfare,
and the environmental impacts of farming.
Local Food Markets
Local Food Markets in Florida
General situation in the USA. The national USDA’s initiative “Know your farmer
know your food” aims to:
Stimulate food- and agriculturally-based community economic development;
Foster new opportunities for farmers and ranchers;
Promote locally and regionally produced and processed foods;
Cultivate healthy eating habits and educated, empowered consumers;
Expand access to affordable fresh and local food; and
Demonstrate the connection between food, agriculture, community and the environment.
The “Know your farmer, know your food” campaign has no dedicated fund, no office and
no staff. It is simply dedicated to synergize the existing resources in order to develop
local food systems.
In 2008, local food sales were worth $4.8 billion, and they are increasing. The local
food system is divided into two branches. First, there are the direct-to-consumer outlets,
and second, there are the intermediated marketing channels. The intermediated

34
channels include grocers, restaurants and regional distributors. The direct sales venues
include farmers’ markets, roadside stands, farm stores and the CSAs. 43% of the local
food farms produce vegetables, fruits or nuts (Low & Vogel, 2011).
Agriculture in Florida. The state of Florida is located in the South East of the
USA. It comprises 58,560 square miles (~152000 km²). It is boardere by the Atlantic
Ocean and by the Gulf of Mexico. Tourism is the state’s greatest source of income ($40
billion each year). It is important to mention this fact as it could be a potential threat to
agriculture because of the competition for resources. The second largest industry is
agriculture. The average Florida farm size is 244 acres while the U.S. average is 446
acres. This size is rather small for a southern State (e.g. for Texas it is 564 acres) but
this is a big size for an eastern State (e.g. for North Carolina it is 183 acres)
Florida’s climate is mild and allows the cultivation of many specialty fruits,
vegetables, and ornamentals. Those products are very suitable for direct sale since they
do not require any processing by the farmers. In Florida, 8% of the land is used for
growing crops, 30% for pasture and range, and 35% for forestry. Citrus production is
important for the economy of Florida and the orange blossom is the State Flower since
1909. According to the Florida Department of Agriculture and Consumer Services:
Florida has 47,500 commercial farms, using a total of 9.25 million acres; Florida ranks 2nd in the nation in the value of vegetable production;
Florida ranks 1st in cash receipts for oranges, grapefruit, fresh snap beans, sweet corn, watermelons, fresh cucumbers, squash and sugarcane;
Florida ranks 2nd in the production of greenhouse and nursery products;
Florida accounts for 65% of total U.S. citrus production;
Nationally, Florida ranks 11th in beef cows;
Florida ranks seventh in agricultural exports with $3.1 billion

35
For Florida the 5 major agricultural commodities in 2008 were greenhouse and nursery
products, oranges, tomatoes, dairy products and sugarcane; Florida is also in the top 12
states in fresh seafood production.
According to Darby et al. (2008), 44 State Departments of Agriculture in the USA
support programs that label and promote their state locally produced food. “Fresh from
Florida” is the Florida Agricultural Promotional Campaign (FAPC) that began in 1990
and it is organized by the Florida Department of Agriculture and Consumer Services
(DACS). Farmers who are members of the FAPC can use the “Fresh from Florida” logo
for packaging and advertising, which “associates the member’s products with Florida
agriculture’s worldwide image of excellence,” and one of their other slogans is: “good for
the environment, good for the economy, good for you” (FDA, 2012).
Direct Sales. There are about 2 million farms in total in the USA in 2009 (EPA
website). The direct sale is the shortest food supply chain. Between 1992 and 2007, the
number of farms selling directly to the consumer increased by 58% reaching 136,000
farms (6.8% of US farms). In 2007 direct sales represented $1.2 billion (Low & Vogel,
2011). In Figure 2-1, we see that direct sales are most important in the Northeast and
on the West Coast of the USA more especially in urban areas.
The majority (57%) of direct to consumer sales is from small farms. The National
Commission on Small Farms selected $250,000 in gross yearly sales as the cutoff point
between small and large-scale farms. Small farms account for 91% of all farms in the
United States (USDA. Census 2007).
In Figure 2-2, we see that all the counties in Florida are classified as counties with
more than 71% of small farms. There is a north-south division, however. In the north,

36
most counties are classified as having 96% to 100% of small farms, as it the case for
Alachua county, site of the University of Florida.
Farmers’ Markets. According to the USDA, a farmers’ market is a common area
where several farmers gather on a recurrent basis to sell a variety of fresh fruits,
vegetables, and other farm products directly to consumers. In 2010, there were 6,132
farmers markets in the USA, which represents 3.5 times as many as in 1994 (Nie &
Zepeda, 2011). In 2011, there were 7,175 farmers markets throughout the U.S. and this
represents a 17% increase from 2010 (USDA website).
According to the 2006 National farmers’ markets survey led by the USDA
(Ragland & Tropp, 2009), the Southeast accounts for 12.5% of the total number of the
farmers’ markets in the USA. It is ranked in fourth position after the North Central
region which accounts for 26.9%, the Far West region which accounts for 20.6% and
the Northeast which accounts for 16.5%. The Mid-Atlantic region accounts for 11.9%,
the Rocky Mountain region accounts for 6.6% and the Southwest accounts for 5.1%.
The average annual sales per market in the Southeast are $220k, which ranks this
region in third position after the Far West ($477k) and the Mid-Atlantic ($306k). In the
USA the average annual sales for farmers’ markets is $243k. The top sold products in
the USA are fresh fruits and vegetables (91.8%), herbs and flowers ((81.4%), honey,
nuts and preserves (77.7%) and baked goods (72.9%). In the Southeast, 35.5% of the
farmers’ markets sell organically labeled products while the national average is 47.0%.
In general, those products are fresh fruits and vegetables (91.4%). About the other
labels, the Southeast farmers’ markets selling “chemical-free/pesticide-free” represent
45.9%, those that sell “natural” represent also 45.9%, those selling “hormone or

37
antibiotic free” represent 20.3%, those selling “pasture-raise/free range” represent
21.6% and those claiming “locally grown” represent 90.5% of the total.
In the city of Gainesville, Alachua county, there are several farmers’ markets:
Alachua County farmers’ market (or 441 farmers’ market) on Saturdays
Haile Village farmers’ market on Saturdays
Union Street farmers’ market (or Downtown farmers’ market) on Wednesdays
Thornebrook farmers’ market on Fridays
Green Market (formerly the Greenery Square Market) that is an “all organic and all local establishment” on Sundays
Tioga Monday Market on Mondays
Sunday Tailgate Market on Sundays
By shopping at these venues, the inhabitants can enjoy seasonal produce and
baked goods that are produced within a drivable distance from their homes. Moreover, a
consumer can speak with a producer and this is an important advantage. In general, the
seller’s attitude determines a significant part of the advertising strategy. However, when
the climate is not friendly, shopping in an outdoor farmers’ market is inconvenient. This
is one drawback of this marketing channel.
Community-Supported Agriculture (CSA). In a CSA enterprise, consumers pay
a given amount to a farmer or group of farmers before the start of the growing season.
Paying the farmer(s) up front allows sharing some of the risk of producing. At harvest,
the food is then delivered directly to the consumer or is picked up at a designated
location. It establishes a partnership between farmers and consumers (Pirog et al.,
2001). The consumers purchase what is called a “membership,” “subscription,” or
“share.” The share usually consists of a box of vegetables but other farm products can

38
be included. The box will be available each week (or less frequently) during the harvest
season and the products are often qualified as “ultra-fresh” by the farmers. Due to the
financial commitment of members, the farmer’s risk is spread across the community.
Members are more aware that farming is a risky activity linked to the uncertainty of
Nature. For instance, if there is a negative climatic event, the quality of the produce will
be different and the consumer will be directly impacted because he would have already
paid for his basket and will be supplied with the seasonal produce. But in general, the
CSA farmers make sure that their members are fully rewarded for their joining, and in
case this season’s produce would occasionally be of bad quality, the member would
receive a better deal in the future or a refund.
The website “Local Harvest” aims to link the consumer to US farmers who are
involved in direct marketing and to alternative food retailers and restaurants that sell
“sustainably grown food.” This website openly advocates its support for small farmers,
organic food, farmers’ markets and retailers selling more natural products (free-range
poultry, grass-fed beef, etc). It is a food locator that displays the seller’s address and a
map to access the location. It is also possible to buy online a considerable variety of
products from the family farms. In this website, not only food is available, there are also
fibers (e.g. cashmere, mohair), specialty products (e.g. tobacco, soap), and flowers. The
consumer can find the seller the closest to him or can decide to buy online from a family
farm. He can also be notified about the events occurring in the region.
In 1986 there were two community supported agriculture operations; today there
are over 4,000 throughout the USA (USDA, 2012). The Florida Department of
Agriculture and Consumer Services lists 21 CSAs in Florida but it is not a

39
comprehensive list. The website Local Harvest lists 106 CSAs in Florida. The Florida
Department of Agriculture and Consumer Services locates two CSAs in the city of
Gainesville, while Local Harvest reports three. In actuality, there are four CSAs in the
Gainesville area: Nix Beef Cattle farm, Plowshares CSA (single organic farm), Siembra
Farm (single organic farm), Sasabrill Farms (organic farm and nursery). Looking at
some CSA’s farmers’ websites, we may notice that some of them propose that
members volunteer during the harvest, on market days or any time to help at the farm.
The consumer can then be actor in food production and learn about the farming activity
in the fields. The advantage of the CSA’s system for the consumer is to develop a face-
to-face relationship with the farmer, to be able to visit the farm once a year and to cook
with seasonal products. According to Zepeda and Leviten-Reid (2004), the drawbacks
of being member of a CSA are the inconvenience of the pick-up time or place, and
fewer choices in comparison to the mainstream sector and the quantity.
Food Cooperatives. In comparison to a CSA, a food cooperative is a shop where
people can go and purchase foods with the same convenience as shopping at regular
food market. A food cooperative is an entity owned and governed by its customers and
workers. The membership or share entitles to a voting right. The membership can be for
the workers, the producers or even the consumers. By supporting the shop and being
involved in its management, the member will receive a portion of the dividends.
In the city of Gainesville, Florida, there is a cooperative called Citizens Co-Op,
which defines itself as a community-owned market. The Citizens Co-Op’s procurement
policy gives the priority to local products that are “grown or processed within 150 miles
of Gainesville” and then to regional products (“the borders of Mississippi, Tennessee

40
and North Carolina”). During the transitions between growing seasons, the shop
extends its radius statewide. In addition, they focus on more natural farming practices:
no GMOs, no harmful chemicals, no harmful labor practices and no concentrated animal
feeding operations.
Slow Food movement. The Slow Food movement is recognizable by its logo in
the shape of a snail. As its name suggests, this grass-roots organization positions itself
against the fast food concept. It is a non-profit organization. The Slow Food movement
is international (150 countries) and was founded in 1989 in order “to counter the rise of
fast food and fast life, the disappearance of local food traditions and people’s dwindling
interest in the food they eat, where it comes from, how it tastes and how our food
choices affect the rest of the world” (Slow Food website). The Slow food’s motto is
“supporting good, clean, and fair food.” Slow Food USA is the American branch. It has
several programs and campaigns in order to promote local consumption, to protect
traditional and endangered food, to save regional biodiversity, to promote gastronomic
traditions, and to educate children and students about farming and cooking. Slow Food
USA is divided in regional communities called chapters. There are 10 chapters in
Florida that are equally distributed geographically. There is one chapter in the city of
Gainesville.
Local Food Markets in Europe
There is a vast literature dealing with European local food marketing and
sociology. Europeans do not have the same perception of food as do US citizens,
whereas from a global point of view, they have a similar way of living and a similar level
of agriculture efficiency. In the following part we discuss local food markets in Europe.

41
This part of the thesis will use significantly the outcomes of the FAAN’s
(Facilitating Alternative Agro-food Networks) case study about Local Food Systems in
Europe which ran from 2008 to 2010. First of all, according to this study, the local food
system in Europe is an alternative network that is emerging. This is a similar
observation regarding the local food market in the USA. The main focus of this system
is to shorten food chains in order to “reconnect consumers with producers, bring the
producers a larger share of the ultimate market value, reduce ‘food miles,’ and promote
a greater focus on food quality” (FAAN, 2010). The concept of increased quality in local
food system is a recurring theme in FAAN’s report. The different types of marketing
channels operating with local food in Europe are: open-air markets, annual events, farm
shops, co-operatives, box schemes, specialty retailers, catering services, community
gardens, CSAs, and public procurement for schools or institutions. The overall picture
shows that the possible channels are the same in Europe and in the USA, except
perhaps for the box scheme system that is a European particularity. The structure of
this organization is that the consumer makes an arrangement with the farmer in order to
receive a box of farm products. Often it is composed of vegetables, but it can also
contain eggs for example. The box will be delivered at a convenient place or even at the
consumer’s home in some cases. The system is similar to the CSA system except that
the consumer does not purchase boxes for the whole season by paying up front. To
better understand the local food systems in Europe, let us review those of several
European countries.
In Austria, the development of local food systems is mainly a rural development
tool. Indeed, Austria includes large remote Alpine areas with small-scale farms that

42
were not able to overcome the specialization of the production in the 1970’s, and thus
suffered from rural exodus and a weak economic base. Thanks to federal and European
supports, many regional initiatives for rural re-development have been established.
However, direct sales and farmers’ markets have declined in recent years. This might
be due to hygiene regulations that are often a burden for small farms. Also, there is a
tendency for supermarkets to offer more and more organic and local product brands.
For example, Rewe, Spar and Hofer (Aldi), three large food retailers which represent
86% of market share in the retail sector, sell organic food as well as conventional
products. The comparative advantage of short supply chain initiatives is that they have
a positive impact on small and medium scale farmers, on sustainable production
methods and emphasize that they sell products from the region. Fairness in price
negotiations, local empowerment, and engagement of consumers are the drivers of the
short food chains. Moreover, the regional initiatives highlight the quality of regional
products (locality products). It allows reaching niche markets and at the same time it is a
way of remobilizing the local market of consumers who live in the area and who can find
pride in the new breath given to their traditions. For instance, the cooperative ALMO
markets its beef from the Almenland region as a high quality product tightly anchored in
the Alpine tradition. Another example is the direct selling farms of the association
Almenland Bauernspezialitäten, which work closely with the tourism enterprises. Thus
those initiatives promote the local culture (FAAN, 2010).
In the United Kingdom, mad cow disease, the uncertainty about genetically
modified organisms and the foot-and-mouth disease have made the consumer worried
about the origin of his food. Food “re-localization” is a tool to reconnect the different

43
actors. Alongside with the increase of farmers’ markets, some supermarkets also offer
local food and box schemes. Because of this competition, small farmers have found a
new strategy. An idea is to promote the intergenerational transmission of traditional
knowledge. For this purpose schools can visit some farms. However, some farmers
prefer avoiding marketing tasks and prefer to focus on production, thus it should not be
forgotten that the direct sales option is not for everybody. In Manchester, a project on
sustainability called Manchester Food Future pushes the local food movement. Local
initiatives are more expensive because they are labor-intensive. When this is the case,
local food initiatives can only expand if the consumer is willing to pay more for his food
(FAAN, 2010).
France is the leading farming country in Europe with agricultural production at a
baseline price of €61.6 billion in 2005 (or 20% for EU-25) (Guyomard, Le Mouël, Jez,
Forslund, & Fournel, 2008). France is also competitive in the global market. Describing
the situation in France is consistent with the idea of giving an overview of the situation in
the USA versus in Europe. In France, the Ministry of Agriculture defines short food
chains since 2009 as a distribution chain implying 0 or 1 middleman between the
producer and the consumer. The spatial distance, which is the distance from the fork to
the farm, can be set up to 50, 100 or 150 km. There are about 326,000 farms in France,
and 80,000 farms were involved in short food supply chain in 2010. Direct sales is
engaged in by 67% of horticulture producers, 50% of quality wine producers, less than
half of the vegetable producers, and 42% of fruit producers. Meat and crop producers
are rarely involved in direct sales. Farms involved in short food chains are generally
small in comparison to the regional average, and the workforce is more important. For

44
instance, in Ile de France (the extended region around Paris), diversified-production
farms average 76 Ha and 4.4 employees, whereas in the traditional sector they are
approximately 136 Ha and 1.2 employees. In France, CSAs are literally called an
“Association for the preservation of family farming.”
The consumer is asking for fewer standardized products. Farmers begin cultivating
forgotten species or varieties, fruits and vegetables whose visual aspects and caliber
were not appropriate for the mass distribution. As a consequence of new requirements,
farmers use fewer inputs (especially pesticides and fertilizers). As a result, many
farmers involved in short food chains say that their agricultural practices are close to
organic farming (Aubry and Traversac, 2010, INRA).
In France, the alternative food sector began in the 1980’s as an answer to the
intensification and the specialization that occurred in the 1960’s. The city of Rennes and
its suburbs (Rennes Métropole) located in Brittany (the most western part of France) is
a territory strongly linked to its tradition and proud of its history. As a matter of fact,
many initiatives to reconnect the city and the agricultural countryside have occurred.
The number of CSAs, farmers’ markets, cooperatives shops and box schemes are
sharply increasing. The area has even created a formal planning document called the
“local plan for agriculture” in order to preserve land for farming and to develop short
food chains. Rennes Métropole has funded the main cooperative shop and has
provided for instance places to distribute the boxes and advertisement campaigns. As a
result, jobs have been created and a more sustainable agriculture has been promoted.
Also, regarding convenience, one of the farmers’ markets stays open later in the
evening to reach consumers on their way home from work (FAAN, 2010).

45
In Hungary, the food system is mostly centralized, characterized by multinational
food processors and retailers. The country was under the communist regime until 1989.
The farmers suffer from fragmented land ownership, lack of capital, and lack of
marketing skills. The local food initiatives are mainly festivals of traditional food, agro-
tourism and farmers’ markets. CSAs are new in this area of Europe and are not well
developed. Food processing and direct marketing by small farmers is hindered by high
quantitative and hygienic restrictions. In Budapest, the capital city, a downtown farmers’
market has suffered from problems of transparency related to an urban plan. To
safeguard the farmers’ market against the municipal plan of building a parking lot at this
location, a local group of inhabitants launched several initiatives. Farmers started an
organized opposition because they were used to the former socialist decision system. In
the end, local authorities have undertaken a consultation with the local community. In
this situation local inhabitants led the initiative of preserving their farmers’ market. The
local food system in Hungary is only in its first steps. This story shows that an
alternative initiative against the corporate system, such as local food marketing
channels, cannot be viable without the support of the local consumers. Usually, change
in a micro-scale occurs thanks to local cooperation.
The European Common Agricultural Policy (CAP) funds such participatory
initiatives under its Second Pillar dedicated to rural development. The European Union
is not only a common market but also a mosaic of local identities that European citizens
are keen on conserving. To do so, the countryside plays an important role and
agriculture is a means to highlight the value of the countryside as an alternative to the
corporate model. Practicing another type of agriculture reconnected to people and

46
linked to the specificity of a location is the solution that has been shared in all the
examples introduced previously. This leads to the conclusion that in Europe, the notion
of local product is mainly promoted through locality products.
Fostering local networks aims at reinvigorating agriculture as an employment
provider and economic engine. Let us consider some demographic figures in EU and in
the USA. In the EU, 4.7% of the workforce is employed in agriculture (farming, fishing
and forestry) versus 1.7% in the USA in 2010 (CIA website, 2012). There are 500
millions inhabitants in Europe, and 60% of them live in rural areas in 2011 (EU website).
In comparison, there are 310 million inhabitants in the USA, while only 16.4% of them
live in rural areas (Economic Research Service, 2012). Assuring the economic viability
of rural areas in Europe is assuring the livelihood of almost 300 million citizens.
Dacian Ciolos, the Agriculture Commissioner of the EU since 2010, stated in his
speech “A Dynamic Agriculture is Made by Dynamic Territories,” that employment is
threatened in rural areas and that remote areas must be supported. New regulations of
liberalization of trade have weakened the smallest farms and one of the innovative tools
to maintain the activity there is to develop local food systems. They are strongly
promoted has being more sustainable because this new organizational vision
encompasses society, culture, economy and the environment.
Consumers’ Studies and Local Food
The primary goal of consumer research is to produce knowledge about the
acquisition, consumption and disposal of products, services and idea by decision-
making units, which define the consumer behavior (Steinman, 2009). Consumer
behavior is function of the quantity of information reaching the consumer, the attitudes,
perceptions and other physical factors because they shape preferences (Stewart,

47
Blisard, & Jolliffe, 2006). In this part we will review the different themes linked to
consumer behavior towards local food.
Demographics
Thompson et al. (2008), in the San Francisco Foodshed assessment, state that
farmers’ markets, CSAs and other self-consciously local food outlets seem to appeal
mainly to consumers with more disposable income. However, in a national study
dedicated to fresh produce direct marketing, Keeling-Bond et al. (2009) show that
income variables are not significant factors for determining purchase location
preferences. Moreover, age, gender, weekly grocery expenditures (in dollars), market
size (in numbers of persons), ethnicity (e.g., Caucasian, Asian, etc.), household size
and the life stage (couple/single and number of children) are also weak predictors of
preferences to purchase fresh produce at farmers’ markets, CSAs and roadside stands.
In general, demographics seem to be weak predictors (Keeling Bond, Thilmany, &
Bond, 2009; Martinez et al., 2010; Zepeda & Li, 2006). However, Brown (2003) states
that having a farm background (raised or have parents in this area) has a positive
impact on the purchasing behavior for locally grown products. Also being pro-
environmentalist increases the probability of buying organic local products.
Grocery Shopping
In a study from Missouri (US), Brown (2003) found that when shopping for
produce, 82% of the consumers look for quality and freshness in the first place, and
only 8% for price. Most of the consumers perceived that local fresh fruits and
vegetables were of higher quality (45%) and sold for a lower price (43%). Yet, two-thirds
of the respondents did not know about the state promotion program “AgriMissouri” for
local food although it was 15 years old at this time.

48
According to Thilmany Mc Fadden and Low (2012), “in 2009, 26.3% of U.S. adults
consumed vegetables three or more times per day and 32.5% of adults consumed fruit
two or more times per day […]. Rates were the highest in Florida, Colorado and the
Northeast and West of the continental United States.” Our study of Florida consumers
will allow us to capture more detailed information about Florida demand for fruits and
vegetables, and perhaps answer why rates of consumption are higher than the US
average.
Perceptions
According to Keeling-Bond et al. (2009), people who occasionally buy fresh
produce in direct marketing channels care the most about supporting the local
economy. And for those who shop direct marketing channels more frequently, they also
care about the superiority of the produce. Organic practices are not a driver for
purchasing at direct markets; this can be attributed to the fact that more and more
conventional stores sell organic product. Self-selected users place a greater
importance on the freshness, the locally-grown attribute, the unprocessed characteristic
of the produce, and to a lesser extent vitamin content.
According to a focus group study led by Zepeda and Leviten-Reid (2004), organic
food shoppers have the perception that buying local benefits the environment, the local
community, farmers, and is also healthier. In comparison, consumers of organic foods
from conventional markets only share one perception with the organic food shoppers,
which is the support to the local economy.
Food Marketing Channels
According to Zepeda and Leviten-Reid (2004), while using labels is a good way of
promoting local food among organic food shoppers, conventional shoppers are more

49
sensitive to the idea of going to farmers’ markets and farms stands because they are
very attached to the benefit the purchase could create for the community. Also, it has
been claimed that farmer’s markets are a form of entertainment and that they are a
place for personal interactions. In contrast, conventional shoppers identified the lack of
choice and the inconvenience in pick-up place or time as a barrier to participate in a
CSA or purchase at farmers’ markets.
The 2006 National farmers’ markets survey (Ragland & Tropp, 2009) displays the
motivating factors for consumers to shop at farmers’ market. For the factors classified
as either important, very important, or extremely important, in the Southeast US the
results were by order of importance, freshness, taste, access to local food, support for
the local economy, variety, knowing how the food was produced, and price (Figure 2-3).
In Europe
In focus groups organized in an area around London, England, Chambers et al.
(2007) found that the participants defined local food as food produced and sold within a
20-50 mile radius. The frequency of purchasing was less than 1 product per month.
Local food was perceived as more expensive than other foods. Socio-economic
backgrounds were not influential on consumers’ perception of local food, even for the
price attribute. The participants found it inconvenient to buy local food; however, the
eldest participants emphasized the fact that in the past it was more convenient and
even a pleasure to shop for local food. According to the respondents, local food is of
higher quality because it is fresher and it is tastier because it is more seasonal. Also
local food has in common with organic food the quality, safety and the price. However,
the sample found that some barriers to the consumption are the lack of choice and the
lack of availability when it is not the season. The individuals agreed that buying local

50
supports the farmer, but this was not always seen as doing a good deed because some
of the respondents said that farmers are already rich.
According to a study in United Kingdom led by Weatherell et al. (2003) on urban
and rural groups, the most important criteria when buying food are: first, taste,
freshness and appearance, then price and convenience, and then packaging and brand.
Nutritional content was also important for the urban group. For the rural groups, the
origin of food freshness, animal welfare and environmental protection were more
important than for the urban groups. Local food is perceived as of better quality but
people do not go often to farmers’ markets. Rural groups affirmed that local food
marketing could help support local businesses recovering after the foot and mouth
disease outbreak, but urban groups disagreed with such initiatives. Supermarkets
appeared to be the most appropriate way of selling local foods.
According to a study in Finland by Paloviita (2010), in rural areas, consumer
perception of local food is that it has a superior taste, a lower price and local food is
fresher. For the urban population, local food is related to the values of animal welfare
and respect of the nature. Also, in general, consumers expressed the non-
environmental sustainability of international and national long-distance transportation of
food, but at the same time they agree about the better efficiency of the mainstream
sector.
Summary
A prerequisite to this work was to capture the existing forms of local food’s
definition in the literature. It is important to know why one definition would be preferable
to another, what are the different contexts where we may use it and what are the
stakeholders involved in its use.

51
Then, the scope and situation of local food markets have been described. In other
words, marketing channels of local food products, their disadvantages and advantages
have been analyzed. Focusing on the State of Florida is interesting since agriculture is
the second economic sector and that a large variety of agricultural products are
generated by this State.

52
Table 2-1. Correlation between population-level health outcomes and measures of local food marketing and production.
Pearson correlation coefficient
Obesity, % of adults Cardiovascular disease mortality rate
US Country Totals: Direct Sales* -0.21 -0.15
Number of CSA -0.19 -0.16 Number of Farmers’
Markets -0.27 -0.14
Fruit and vegetables sales over total farm sales*
-0.18 -0.09
Source: Thilmany McFadden, D., & Low, S. A. (2012). Will local foods influence American diets? Choices, 27(1). Available at http://www.choicesmagazine.org/choices-magazine/theme-articles/potential-impacts-of-2010-dietary-guidelines-for-americans-/will-local-foods-influence-american-diets. Last accessed: August 2012.
Caption: * data from Census of Agriculture (2007) Number of farmers’ markets from USDA-ERS Food Environment Atlas (2010) Cardiovascular mortality calculated using CDC Mortality Tape (98-00 and 03-05) (Note: Correlations for 2990 U.S. counties for which data were available, all correlations are statistically significant (p<0.001)).

53
Figure 2-1. Map displaying the direct sales to consumers by county in the USA in 2007. (Source: “Urban areas prove profitable for farmers selling directly to consumers”, ERS/USDA, September 2010. Available at http://www.ers.usda.gov/AmberWaves/September10/Findings/Charts/findings4_fig01.gif. Last accessed June, 2012).

54
Figure 2-2. Map displaying the percent of farms with sales less than $250,000 in the USA in 2007. (Source: 2007 census of Agriculture: Small Farms, USDA. Available at: http://www.agcensus.usda.gov/Publications/2007/Online_Highlights/Facts_Sheets/Farm_Numbers/small_farms.pdf. Last accessed June, 2012).

55
Figure 2-3. Motivating factors for shopping at farmers’ markets according to markets’ managers, in percentage of answers. (source: 2006 National farmers” markets survey, USDA, Agricultural Marketing Service. 2009)

56
CHAPTER 3 RESEARCH METHODS
Introductory Remarks
In order to better understand and predict the impact of different innovations in local
foods, it is important to know the meaning that the word “local” has in consumers’ mind
and what values they associate to this concept. This allows consumer segmentation by
understanding the attitudes and motivations of specific consumer groups rather than
learning how an “average” consumer thinks and behaves (Nie & Zepeda, 2011).
To understand complex behaviors such as food choice, we encouraged
participants to explain themselves through a qualitative approach. We used two
qualitative methods in this research: the word association technique and the laddering
interviews technique.
Word Association
The technique of word association is a projective technique. Consumer
researchers have suggested that non-conscious processes may operate on consumer
behavior; the projective technique has been used to help reveal consumer attitudes and
feelings that would not be necessarily discovered by more straightforward questioning
(Steinman, 2009). Projective techniques are based on the use of vague, ambiguous,
unstructured stimulus objects or situations in which the subject projects its personality,
attitude, opinions and self-concept to give the situation some structure (Donorgue, 2000
cited in Guerrero et al., 2010).
In the word association technique, the respondent is given a word of interest (e.g.
“local food”) and asked to respond to the first thing that comes to mind. The association
can be a picture, a thought or a word. The word of interest can generate many

57
interpretations and this list is the valuable information regarding the consumer’ attitudes
and beliefs. The frequency with which any word is given is important for the researcher.
According to Guerrero et al.’s study on the consumers’ perception of traditional food, the
word association technique was primarily used in psychology and sociology, but it is
also suitable for food science in order to elicit the affective element behind the concept
involved.
It does not require necessarily a big sample. Analyzing a small number of answers
is possible, as did Roininen et al. in their research about consumers’ perception of local
food in Finland with samples of only 25 and 30 persons. According to Guerrero et al.,
this technique is useful and simple for obtaining information, but a significant complexity
comes from the interpretation of the results. It requires a lot of time because the
answers present a high degree of subjectivity and the researcher has to perform a
careful evaluation of the answers. However, according to Roininen et al., word
association is less laborious than many other qualitative techniques such as personal
interviews.
In this study, the word association technique was used to clarify the definition of
local food. The list of words will be divided in different groups of relevant themes. To do
so, the researcher created categories of words expressing the same idea, trying to stay
as close as possible to the respondents’ answers. The analysis must follow five rules:
homogeneity, completeness, exclusiveness, objectivity and relevance (Berson, 1952
cited in Andreani & Conchon, 2005). Homogeneity means a group of words that have a
similar meaning and one dimension of understanding. Completeness expresses that no
information should be lost, the consumers’ thought must be completely coded.

58
Exclusiveness restrains each word to be classified in only one category so that the
coding is clear and all themes are mutually exclusive. Objectivity ensure that the
classification is not researcher-dependent and there is no personal feeling involved in
the coding. Objectivity guarantees the replicability of the research. Relevance means
that the coding makes sense and answers to the research goals. These five definitions
are provided by Andreani et al. for the data coding in qualitative analysis.
Means-End Chain Theory
Another method used in this thesis is the Laddering interview. It is based on the
Means-End Chains theory, which assumes that there is a relationship between specific
product attributes, which offer specific benefits that are seen as means to pursue
important values such as health or peace of mind (i.e. ends). As the explanation of this
theory is very abstract, we will first of all consider defining the marketing terms that will
be used. Indeed each term as a precise meaning that helps shed light on the relevance
of the use of this methodology. We base ourselves on short definitions as proposed by
Lendrevie et al. in their book Mercator (a French best seller amongst the marketing
books).
First of all, this study aims to define the consumer’s perception of local food.
According to them, “the perception is a process whereby sensations are selected,
filtered and interpreted”. What is to be noticed in this definition is that perception is a
complex series of subjective actions. Accessing the consumer’s perception is a difficult
task requiring gathering affective answers from the consumer. Besides, one of the
research questions is evaluating the consumer’s motives to buy local food products.
According to Lendrevie et al., “motivation is a state of psychological tension that leads
to act in order to remove or alleviate this tension; needs and desires are an important

59
source of tension”(Lendrevie, Lévy, & Lindon, 2009). Those definitions bring out once
again a psychological facet of the marketing research.
Furthermore, in the literature dealing with consumer behavior, it is a commonplace
to evoke consumer’s attitudes. Again, this term has a precise definition:
“Attitudes are predispositions of the individual to evaluate in some way messages, objects or people and to respond to them. These are all more or less coherent beliefs, feelings, predispositions that individuals have acquired or transmitted to them. (…) the components of attitudes are:
- Knowledge and beliefs called 'cognitive elements'
- Feelings called 'emotional elements'
- Acting trends called 'conative factors'”
To make it clearer, conation is an instinct, a drive, a wish or a craving that leads to act
purposefully (Merriam-Webster Dictionary 2008). The key components of the
consumers’ attitudes are the drivers of decision-making. According to Reynolds and
Olson (2001), the first assumption of the Means-end chain theory is that consumers
decide which products and services to buy based on the anticipated consequences
associated with each possible choice. As a result, consequences (and not attributes)
are the consumers’ focal concern (Reynolds, Olson. 2001).
A product’s attribute is one of its properties or characteristics. It can be, for
instance, its price or its composition. Marketing research, in order to understand the
consumer, is usually targeted at understanding the most significant and powerful
product attributes, which are often also called the most “salient” product attributes.
According to Reynolds and Olson (2001), the product attribute is one of the three levels
of the product-related knowledge, along with the outcomes of using the product
(consequences) and the personal values that may be satisfied by the use. The bottom

60
line in Means-end chain theory is that the consumer sees the product attributes as a
means to an end (Figure 3-1). There is a network of consequences, which represent
benefits or disadvantages. The aim of this research, then, was to reach the consumer’s
values related the product.
Values are subjective and vary according to the individual. Also, it is important to
keep in mind that values are strongly correlated to the culture. For instance, values can
be moral, ethical or ideological. Values reflect what the individual thinks to be ideals and
this thought stays in his mind in a long run. This is the reason why trying to find which
values are attributed to local food can lead to relevant marketing strategies.
According to Grunert and Grunert (1995), a hierarchical relation can be used to
describe how consumers apply and connect important values and motives to specific
product attributes. Identifying this model has a predictive validity for new product
development or for communication strategies. They also explain that the cognitive
categories have different levels of abstraction. For instance, a low abstraction category
is the concrete product attributes such as taste or price. A higher abstraction concept is
the “value” of a product, which is intimately linked to each individual. The cognitive
categories of different levels of abstraction are linked to each other in ways comparable
to chains and networks.
Laddering Interviews
The laddering technique is a way of gathering the information defining the
cognitive categories. Laddering is a set of questions that aims to know the causes of
each statement a respondent gives. For instance, in the research lead by Ares et al.
(2008) about the consumers’ perception’ of different yogurts, the respondents were
asked to answer the statements displayed in Figure 3-2.

61
Basically, open-ended questions are used in order to let the individual imagination
express itself. The outcomes are then classified in different categories in order to
generate clusters of ideas. The ideas are then classified in term of product attributes, in
term of consequences of those attributes and in term of values that are important for the
consumer.
The succession of answers leads to an “aggregate map of cognitive structure”, the
Hierarchical Value Map. A cognitive structure is the organization of experience and
other types of information in human memory. A Hierarchical Value Map, derived from
laddering data, is an aggregate map of cognitive structures (Grunert and Grunert,
1995).
For this study, the first step was the data collection during the interviews. The
second step was coding of those answers by performing a content analysis, grouping
the answers that have the same meaning, coding attributes, consequences and values.
This process is called “data reduction” or aggregation. An example of attribute,
consequence and value extracted from Ares et al. (2008) is:
Attribute: “Contains antioxidants”
Consequence: “Improves body functions”
Value: “Better quality of life” The third step was building an implication matrix that displays the number of times
each elements (idea) leads to each other element. It is a square matrix of the size of the
number of elements. The fourth step was to create the hierarchical value map that is a
visual illustration of the implication matrix. The hierarchical value map estimates the
cognitive structure of a group of respondents. It is actually for a group of respondents,
since building the implication matrix has aggregated the data from all the interviews

62
(Ares et al., 2008; Grunert & Grunert, 1995; Pieters, Baumgartner, & Allen, 1995). The
cut-off point used to build the hierarchical value map is the level from which a link will
appear on the map. It is chosen as 10% of the size of each cluster, as suggested in a
study by Ares et al. (2008).
The hierarchical value map has a predictive value. However, the predictive value
can be affected by several problems which arise during the research process. They are
described by Grunert and Grunert (1995) as being in one (or more) of three categories.
First, the target situation (buying/consuming local food) is different from the data
collection situation. The cognitive processes are “the processes by which the cognitive
structures are changed due to new information from the environment, and by which
information is retrieved from the cognitive structures and used to direct behaviour”.
When an unfamiliar stimulus occurs, the person is trying to find new meanings and
recombines the information. And this conscious cognitive process leads to bias during a
laddering interview. What is looked for is the unconscious (automatic) cognitive process.
It gives access to the real cognitive structure of the respondent. To overcome the
problem of creation of new meanings, it is important to ask questions that activates the
respondent’s own cognitive categories. Asking “why do you” and “why is that important
to you” allows to make conscious the respondent’s own cognitive categories.
Second, the researcher’s cognitive structures and processes can affect the
predictive value of the method. To overcome this problem, we used interview methods
in which the respondent built his own argumentation by relating his own impressions in
the order he found most natural. Moreover, to overcome the bias due to the researcher,
during the data reduction, the group of answers should be based on cognitive

63
categories widely shared amongst stakeholders (consumers, researchers, users of the
results). The algorithm used for data reduction should be based on the literature in order
to avoid arbitrary cut-off levels, and preferences for direct rather than indirect links in the
network of ideas.
Questionnaire Design
In this part, we review the different topics evoked in the questionnaire and the way
the questions are organized and were administered in order to meet the goals of the
study. The first thing that needs to be said is that the questionnaire is anonymous.
Besides, it is important to underline the fact that the major focus of this research is the
laddering interview in order to build a hierarchical value map. However, additional
questions are useful to understand and interpret the population’s answers in laddering
and the population’s perception of local food.
First, the respondent was asked about food in general, then about his knowledge
about any labels of origin and then about “local food” shopping in particular. This is an
incremental method that allows gathering information more and more specific at each
step. At this point, the questionnaire is precisely dedicated to local food. The
interviewee was then asked about his consumption frequency in order to determine his
profile, asked to name any label of local food, and then asked to define what “local”
meant to him. It was an open-ended question first in order to capture all the dimensions
that the respondents spontaneously had in mind; then, a multiple-choice question
proposing different geographical distances was posed. Next, he explained his motives
for purchasing local food. The next question was a word association test where he had
to answer “When you think about local food, what comes spontaneously into your mind
(words, pictures, situations)?”.

64
Once the respondent had given his own conceptions without having any clue from
the interviewer, the questionnaire was more direct and focused on the local food
institutions as determined in the literature. The individual was asked to indicate his
shopping habits regarding the marketing channels cited in the literature on a frequency
scale. The interviewee was then shown the label “Fresh from Florida” and asked to tell
whether or not he knows it. This question is actually a complement of a previous
question that was asking if the respondent knew any label for local food in general.
Once those tasks accomplished, the respondent participated in the laddering
interview. With this method, only strong associations to local food will be activated. This
is the reason why it is useful for analyzing purchasing behavior. Afterwards, the
respondent was asked to name barriers for buying local food. Then, a question that
intervenes as a conclusion after a deep reflection is to give the characteristics that
differentiate local food from other foods. The following socio-demographic information
was then gathered:
Sex
Age
Race and ethnicity
Presence or not of an agricultural background
Perception of their local food expenditure
For the latter, as asking for the income and the willingness to pay is a touchy topic,
interviewees were asked to answer an indirect question: “In your opinion, do think you
spend more, less or about the same as other students on your weekly expenses for
local food?” In case he answered that he buys more or less than the average, he had
have the opportunity to explain the reasons why.

65
The Institutional Review Board of the University of Florida approved the
questionnaire on April 4th 2012. It certified that the survey complied with federal, state
and university regulations concerning activities and protections of human subjects in
research.
Data Collection
Sample
Processing qualitative information is a difficult task that requires patience and
precaution. The answers are analyzed and compared to each other to understand their
deep meaning. In this research small-size samples were used; and this is consistent
with the literature. For instance, Ares et al. used a 50-individual sample in order to
conduct their research on the perception of conventional and functional yogurts using
word association and laddering. Two samples were chosen in order to compare them.
General users of local food composed the first sample and self-selected users the
second. College students were the targets for the general users’ sample, and they were
interviewed in three different locations: at the entrance of a recreation center, at a library
and at a recreational lake. Self-selected users were interviewed at the local downtown
farmers’ market. They were not necessarily all students but they all purchase local food.
In both groups the age was between 18 and 25 years old. We expected that these two
populations would have a different local usage rate of local food, different personality
traits or lifestyle. Splitting into general and self-selected users aimed to reveal two
different maps of cognitive structures. Indeed, it seemed plausible that self-selected and
general users would have different motives to buy local food, and their comparison
would be informative.

66
Context of Interview
The research was carried out in Gainesville, Florida, a college city. It is home to
the University of Florida and to Santa Fe College. The University of Florida is the 6th
largest university campus by enrollment in the USA.
The environment for conducting laddering interviews must be calm because the
respondents have to talk about their personal views as freely as possible. Before the
interviews, they were informed that there are no right or wrong answers and that they
should answer as much as they can. Pre-testing interviews were performed before the
actual data collection. This was done in order to train the interviewer in the laddering
process. The preliminary laddering interviews showed that the respondents had the
feeling that they repeated the same things, but this is actually due to the fact that the
laddering questions are redundant. The respondents should not feel that their answers
are not precise enough, or useless because already stated.
Let us now consider the interviewer’s attitude during the laddering. When there are
noticeable breaks or unfinished sentences, it is the sign that the respondent is creating
new meanings instead of issuing his own unconscious processes. The interviewer
should then stop this line of questioning and foster the natural flow of speaking. When
people start to “lose” themselves by “story telling” -- jumping back and forth between
different levels -- the interviewer needs to intervene slightly (without influencing the
answers) to help the interviewee continue his explanations (Grunert & Grunert, 1995).

67
Attributes Consequences Values
Figure 3-1. Consumer’s product related knowledge in Means-End Chain theory. Source: Reynolds and Olson. 2001
If you were to choose to buy one of these yogurts, which one would you buy?
Why?
And why is that important to you?
And why is the latter important to you?
Figure 3-2. Example of a set of questions in laddering interviews. Source: Ares, Giménez, & Gámbaro, 2008.

68
CHAPTER 4 DESCRIPTIVE ANALYSIS OF CONSUMERS’ HABITS AND KNOWLEDGE ABOUT
FOOD
Background Information
The interviews were conducted in April 2012 in the city of Gainesville, Florida. Two
different groups were set up. A general users group was composed of undergraduate
students interviewed on campus in front of a recreation center, at one of the university
libraries, and at a university recreation area (Lake Wauburg). A second group of self-
selected users was interviewed at the downtown farmers’ market on Wednesday
afternoons (Union Street Farmers’ market). Table 4-1 summarizes the data collection
efforts.
Demographics
Age and Gender: The mean age of the survey participants was 19.8 years among
the 37 individuals in the general users’ sample and 21.7 among the 42 individuals for
the self-selected users’ sample. Individuals that fell in the general users’ category were
41% male and 59% female whereas the ones categorized as self-selected users were
36% male and 64% female. Due to the nature of the study it was not possible to get a
1:1 gender ratio. Indeed, many of the males initially contacted during the interview
process were not able to answer the questionnaire. This is consistent with the fact that
females are usually more involved in the food purchasing procedure than males.
According to the information and measurement company Nielsen, women have a share
of retail channel shopping trip 62% while men have a share of 38% in 2010 (Nielsen
company’s website, 2012 - http://blog.nielsen.com/nielsenwire/consumer/in-u-s-men-
are-shopping-more-than-ever-while-women-are-watching-more-tv/ ). This difference in
involvement explains why they could better answer the questionnaire. For this reason,

69
even with the increased number of respondents at the farmer’s market which aimed to
attract a higher number of males, female respondents outnumbered males.
Ethnicity: For purposes of simplicity, when people selected two or more races in
their answers, they were classified as “other race” in order to be comparable with the
data available for the population of Gainesville given by the US Census Bureau (Table
4-2).
In both categorizations, the majority of the participants identified themselves as
White persons not Hispanic or not Latino. No “American Indian” or “Alaska Natives”
persons were classified as general users.
From the data described in Table 4-2, there is a higher percentage of Asian, Black
or African American, and persons reporting either 2 or more races or as some other
race among the self-selected users than among the general users. The category
“American Indian or Alaska Natives” was represented in the self-selected user sample
whereas this category was absent from the general user group. The data from the
Gainesville 2010 census are given for informational purposes; this research is not
intended to be statistically representative of the Gainesville population.
Respondents’ Background: On the question whether or not the participants have
an agricultural background, only 16% of the general users responded positively,
compared to 31% of the self-selected users. A test of independence between the type
of population and the answer to this question (i.e., the Chi-square Test) has shown that
the repartition of the answers between both of the groups are similar (p-value=0.13
>5%, indicating there is independence). These findings raise the possibility that people
with some sort of agricultural field of education or families with strong agricultural ties

70
are more prone to use local food compared to the people who do not have such
connections. More research would be needed to confirm this insight, however.
Most important criteria for buying food. The respondents were asked in an
open-ended question: “What are the three most important criteria for you when you buy
food, by rank of importance?” In general, respondents named the three most important
criteria, and once the interviews were completed, all answers were coded with distinct
labels or attributes, which are representative of the whole group of respondents (i.e.,
responses from both self-selected and general users).
For the self-selected users, 3 individuals could only give 2 criteria. From a total of
123 words, an analysis of the responses given by members of the self-selected group
identifies the themes displayed in Table 4-3.
The most relevant themes, combining all three ranks of importance, are from the
most frequent to the least frequent: price, health and nutritional value, taste, quality,
freshness, appearance, and origin. These findings are summarized in Figure 4-1, in
which the “other” category represents all other themes/responses not included in those
listed.
Of the 42 respondents in the self-selected group, only 2 participants listed “origin”
as the most important criteria when buying food, while only 5 additional respondents
listed “origin” as the second or third most important criteria. In other words, 35 of the
respondents interviewed at the farmers’ market did not list “origin” as one of the top
three criteria that they consider when purchasing food. As noted in Table 4-3, these
respondents listed other criteria as being the most important, as follows:
Health and Nutritional value (it composes 26% of the 1st rank)
Taste (12% of the 1st rank)

71
Price (12% of the 1st rank)
Quality (12% of the 1st rank)
Freshness (10% of the 1st rank) Also, of those respondents who listed “quality” as an important criterion, 63%
ranked it first. Similarly, of those who ranked “health and nutritional value” in their top
three criteria, half ranked it first. This outcome was also true for respondents listing
freshness, listing ethics or listing convenience in their top three (i.e., if the theme was
listed in the top three, half of the respondents listed it first). We found as well that 43%
of those who talked about origin listed origin first, while 38% of those who talked about
appearance listed it first.
In 2nd position, 45% of the self-selected users named price as the second most
important criteria; 12% identified health and nutritional value; 10% named taste; 10%
indicated freshness and 7% reported that they looked for healthy food. Also, 54% of the
self-selected users who talked about the price as an important criterion said it was in
their 2nd rank of importance.
In the 3rd rank, price was the most common response (28%) followed by taste
(21%), appearance (10%), and health and nutritional value (10%). Freshness never
appeared in the 3rd rank even though others included it in the 1st and 2nd rankings.
For the general users, only 2 individuals could not give an answer for the 3rd rank.
Of a total of 109 words, the themes are displayed in the Table 4-4. From the most
frequent to the least frequent, combining all three ranks of importance, the most
relevant themes are: price, health and nutritional value, taste, quality, aspect and
convenience, as summarized in Figure 4-2.

72
Overall insights about the general user respondents include the following
implications drawn from the results presented in Table 4-4. Forty-one percent of the
general users who talked about the criterion health and nutritional value ranked this
criterion as of 1st importance and 37% of them ranked this criterion as of 2nd
importance. Only 23% of the general users who talked about the price as an important
criterion for buying food placed this criterion in the 1st rank. Indeed, price appears in the
2nd and 3rd rank (respectively 45% and 32% of the general users who elicited this
criterion). As for the criterion taste, it was mainly cited as a criterion of 2nd importance
since 50% of the general users who identified it placed it in the 2nd rank.
For the criterion “origin” of their food, one of the three general users actually talked
explicitly about the importance of local origin, which he ranked 1st in importance. As
noted in Table 4-4, in the 1st ranking, the general users mainly talked about:
Health and nutritional value (30% of the 1st rank)
Price (it composes 19% of the 1st rank)
Taste (14% of the 1st rank) Those three themes are in common with the main themes that appeared in first rankings
reported by the self-selected users. However, we did not find for general users any
substantial importance for quality or for freshness (less than 10% each in first rank for
the general users). As summarized in Table 4-5, a test of independence (Chi-squared
test) was used to assess whether the quality criterion had been answered differently by
the two populations (Note: responses were merged for the three ranks of importance in
which the respondents could classify their attributes). The test results suggest that the
null hypothesis should not be rejected (p-value=0.78>5%), as the answer to this
question was not different between the two populations. Hence, based on this data,

73
whether or not a respondent cited the quality attribute was independent of his being a
self-selected user or a general user.
Regarding freshness, no test of independence was conducted since one of the
categories (general users that cite freshness in 1st, 2nd or 3rd position) was indicated by
fewer than 5 individuals (Table 4-6).
The three following tables (Table 4-7, Table 4-8 and Table 4-9) display the repartition of
the sample population by category of respondent (either “self-selected” or “general”
population), and by whether or not the attribute has been cited during the interviews.
The tests of independence (Chi-square tests) show that:
Regarding the price attribute, both of the populations have a similar repartition towards the fact of citing it or not citing it as one of the three important criteria when buying food (p-value=0.96>5%).
Regarding the health and nutritional value attribute, the self-selected users relate this criterion differently than the general users (p-value=0.02<5%); they actually cite less often this criterion as one of the three most important when buying food.
Regarding the taste attribute, both of the groups have the same repartition for citing or not citing this attribute as one of the three most important criteria when shopping for food (p-value=0.23>5%).
When we merge all the ranks of importance, the frequency of the relevant criteria
(frequency>=5%) shows that for both the self-selected users and the general users, the
main preoccupation when shopping for food is price, as noted in Figure 4-1 and Figure
4-2. Indeed, this can be explained, in part, by the fact that students constitute the entire
“general user” sample and thus they tend to have small budgets. The second most
important criterion was the health and nutritional value (16% for the self-selected users
and 25% for the general users). The third criterion was taste (14% for the self-selected
users and 18% for the general users). It is undeniably true that people want to enjoy the

74
“flavors” and “aromas” of their food and that we all look for “good” food. In the same
way, the quality accounted for 7% in both groups. Appearance is also a common
criterion and it represented 6% of the answers for the general users and 7% for the self-
selected users. What is to be noticed is that the general users cited the “texture” of the
product whereas the self-selected users talked only about “color”, “smell” and
“appearance.” Thus, the price, health and nutritional value, the taste, the appearance
and quality are the common important characteristics for both groups.
However, there are some differences. First, the general users mentioned more
often the health and nutritional value (25%) in comparison to self-selected users (16%).
And actually, if we look at which words compose the nutritional aspect of this criterion,
the words that were used by the general users were mostly essential nutrients (protein,
fat, sugars, etc…) and biologically active compounds (vitamins, etc…). In comparison,
the self-selected users were less specific and referred mostly to the word “nutrition”
itself. This criterion, which is the second answer for both groups, was more frequent for
general users. So it seems that there is a strong need for healthy and nutritional
products for this group. That the general users mentioned health and nutritional value
much more often than the self-selected users probably lies in the sample differences.
The general users were sampled from students and many of them were strongly
oriented towards sports, and therefore keen to supplement their diets with proteins,
minerals and multi-vitamins.
Second, the general users, when compared to the self-selected users, were less
likely to take into account the origin of their food when shopping for food (3% versus
6%). Also, while the freshness accounts for 7% for the self-selected users, it accounts

75
only for 1% for the general users. And as a sort of exchange, while convenience
accounts for 5% for the general users, it accounts for only 2% for the self-selected
users. Thus, the origin, freshness and the convenience of the food are the relevant
characteristics that differ from both groups. What is to be added is that self-selected
users paid attention to a number of quality attributes like organic (3%), unprocessed
foods (2%), ethically produced (2%), or vegetarian food (3%); these are specific themes
that are not found in the general users’ content analysis. In the literature, local food is
often associated with more organic, more ethical and less processed food. This
research’s observation is thus consistent with the literature.
Weekly expenses for local food. When they were asked to compare their weekly
expenses for local food compared to other students, a slight majority of 38% of the
general users replied that they spent the same amount of money followed by 32% that
spend less and 30% that spend more money on local food purchases. The three main
reasons to spend less are:
they have already purchased up front a meal plan with the university or a sorority house,
they report that they are not aware of or that they lack exposure to local food marketing channels,
local food is more expensive, therefore they do not buy it
With the self-selected users, 40% replied that they spent more money for local
food compared to general shoppers, 36% about the same and 24% less. We can
conclude from the above that self-selected users were more willing to spend a higher
amount of money towards local food purchases. The main reasons to spend less are:
they have a limited budget and/or manage it better (eg. find better deals)
going to the farmers’ market takes time and effort

76
From both of the groups, the reasons why they spend more on local food are:
they have more knowledge about the farmers’ market and as a result go there (more often)
the quality is better and it is worth to spend more on it
they eat more fresh produce than others
local food is healthier than cheap fast food
Origin indications and labels. The majority of the individuals who were classified
as general users (54%) replied that they never pay attention to the country of origin
indications or they only pay attention very few times (Figure 4-4). On the other hand,
43% of the self-selected users said they never pay attention or they pay attention very
few times (Figure 4-3). Thus it represents a difference of 11% between the two user
groups.
In addition, only 3% of the general users pay attention to the labels very often
whereas self-selected users check the indications at this frequency 3 times more than
general users. Thirteen percent of the general users replied that they look at the labels
often and 30% stated sometimes. For the self-selected users those categories are
respectively estimated at 17% for often, and 31% for sometimes; these are about the
same percentages as those in the general user category. Given the results of this
question, we can say that the majority of both user groups use the country of origin
indications. An absolute majority is obtained by merging two categories that are
contiguous in terms of intensity. We can say that the majority (54%) of the general users
don’t pay attention to the labels of the products they buy or pay attention very few times.
In comparison, the majority of the self-selected users (57%) pay attention to the labels
at least a very few times or sometimes.

77
Finally, a test of independence (i.e., the Chi-square test) between the type of population
and the frequency of each answer was performed and the results show that with an
error level of 5%, the repartition of the frequencies is similar (p-value=0.16>5%)
between both of the groups.
In order to test another origin indication but from a smaller geographical scale,
respondents were asked whether they knew any label for local food. The answers were
50% yes and 50% no for the self-selected users and 54% no for the general users. A
Chi-square test shows that the results obtained in each population are similar (p-
value=0.40>5%).
Further, a picture of the logo “Fresh from Florida” was presented to them in order
to test their knowledge. The Fresh from Florida label awareness was low both for
general (41%) and for self-selected (36%) users (Figure 4-5). Taking in account that
the survey was conducted in Florida, the a priori assumption was that there would be a
better rate of knowledge of this logo proved to be wrong.
Analyzing the labels for local food that the interviewees cited, the general users cited
the following:
“Florida’s Natural” juice (a brand of orange juice that is sold by a Florida citrus
agricultural cooperative)
a local shop that serves home made ice-cream in Gainesville (Sweet Dreams ice
creams)
an association serving vegetarian lunch on-campus (Krishna), a local brewery of
Gainesville (Swamp Head brewery)

78
farms involved in short food chain marketing (eg Kurtz & Son’s or Wainright dairy
farms).
What is interesting is that 5% of the general users cited the name of an importing
company as a label for local food (Vigo). It sells basmati rice from Thailand and
couscous from Morocco. It means that the perception of local food here is mixed with
the perception of locality products from overseas. Thus, if corrections are made for this
misperception, the adjusted figures indicate that only 42% of the general users were
able to cite a label for local food.
The self-selected users cited mainly the name of farms involved in local food
marketing, as well as the name of cooks making tempeh (a vegetarian dish) in
Gainesville. One of the respondents cited the product line “Greenwise” available at the
Publix supermarkets, which is a selection of organic and less-processed products sold
with this store-owned brand. They also cited Sweetwater Organic Coffee Roasters,
which is located in Gainesville and imports fair trade and organic coffee that is
subsequently roasted in Gainesville. They cited the farmers’ market, Florida’s Natural
juice, and the locally-owned and operated grocery store, Ward’s, which is committed to
purchasing local produce.
Local food purchasing. On the definitive “yes/no?” question about whether they
purchase local food, all the self-selected users and the majority of the general users
(59%) replied positively. In the follow-up question of whether people that said that they
didn’t buy local food would do so in the future, 14 out of 15 general users replied
positively.

79
When asked, “How much of your weekly shopping has been produced locally?”
the answers of the respondents seem to have been influenced by their implicit definition
of what local food is. The categories that are most represented (except for the
noteworthy 41% of general users who do not buy at all) are the category 10-19% for the
general users (1/3rd of the total general users who actually buy) and the category 1-9%
for the self-selected users (1/3rd also). These results are summarized in Figure 4-6 and
Figure 4-7. However, for the general users who actually buy, an absolute majority (51%)
spends less than 20% on local food (which also means around 92% of the total general
users of the sample); while the majority of self-selected users (53%) spend at least
20%. An interesting result for the self-selected users is that the four categories going
from the 10-19% to the 40-49% categories are nearly equally distributed.
When looking at all possible categories of local food quantity, general users spend
always less than 40% of their weekly shopping on local food. In comparison, 1/5th of the
self-selected users spend more than 40% of their food purchasing on local food. Indeed,
the category “40-49%” accounts for 14% of the self-selected users and on top of that
1/20th of the self-selected users spend more than 50%.
It should be noted that in Figure 4-7, there are no categories 40-49% and >50%
displayed in this chart since no general users indicated those proportions of local food in
their weekly grocery shopping.
Table 4-10 displays the number of persons that declared having in their weekly
shopping an amount of local food for either more or less than 10% of the total weekly
shopping, by the type of population (i.e., general or self-selected users). A test of
independence (Chi-squared test) showed that the proportion of weekly shopping that

80
has been produced locally depends on the type of population interviewed (p-
value=0.011<5%). General users spend less than 10% and self-selected users spend
more than 10% on local food products each week.
Results from the question regarding the geographical distance where something
had to be produced in order for it to be considered local, are summarized in Figure 4-8
and Figure 4-9. The majority of the self-selected users (1/3rd) said it should be
produced in the State of Florida while the general users stated a smaller area, for
example Alachua County (where the University of Florida is located) and bordering
counties. For the second answer, both groups indicated the scale just below the
majority one. The second answer was that the product has to be produced within 100
miles of Gainesville for the self-selected users (26%), and produced in Alachua County
for the general users (27%).
Table 4-11 displays the repartition of the respondents by population and by
definition of the geographical boundaries. The highest boundaries (Produced in the
USA, in the southeast USA or in Florida) have been merged. A test of independence
(Chi-square test) suggested that when merging the highest boundaries, self-selected
and general users have the same repartition within the different classes of definition (p-
value=0.18).
Local food venues. When asked how often they buy food through certain
alternative sources, survey participants gave a range of responses, summarized in
Table 4-12, Table 4-13, Figure 4-10 and Figure 4-11.

81
The majority of the general users never buy food through the market alternatives that
were listed to them during the interviews, except for the farmers’ market. The farmers’
market is also the only marketing channel where some general users affirmed going
often (5% of them). Also, all the general users replied that they do not go to any of the
suggested venues at a very often frequency. Basically, 35% of them sometimes go to
the farmers’ market, 30% to a farm stand, and 19% to a roadside stand. Those three
venues are the most popular among the general users. The less preferred marketing
channels are: first, the Slow Food network because 92% of the general users say they
never go, and second, the local farmers’ websites because 97% of them state they
never buy through this marketing channel.
Amongst the self-selected users, the farmers’ market is also the most popular
marketing channel for local food, as noted in Figure 4-10. However, this result may be
biased due to the sampling method for self-selected users. Actually, it appears that 14%
of self-selected users shop very often at a farmers’ market, compared to 5% shopping
at CSA and 2% at farm stands. Also, 24% of the self-selected users said that they shop
often at a farmers’ market, which is 3 times the frequency of purchasing local food
through a CSA and 12 times the frequency of shopping via the Slow food network, farm
stands, roadside stands and local farmers’ websites.
As it is the case for the general users, the less popular venues for the self-selected
users are the Slow Food network and local farmers’ websites because respectively 88%
and 79% of the self-selected users said they never shop at one or both. However, the
structure of the self-selected users’ shopping frequency is not the same. Indeed, while
the general users were shopping sometimes only at farmers’ markets, farm stands and

82
roadside stands, the self-selected users shop sometimes at all venues except for local
farmers’ websites.
A clearer picture of buying local is possible by merging the highest frequencies,
i.e., the items “sometimes”, “often” and “very often”. These results are displayed in
Figure 4-12 and Figure 4-13. The main channels for the general users who shop at
least sometimes are the farmers’ markets (41%), the farm stands (30%) and the
roadside stands (19%). The main channels for the self-selected users are the farmers’
market (76%), which is the most popular one by far, the farm stand (40%), the CSA
network (36%), the roadside stand (31%), and the cooperative (24%).
The self-selected users indeed shop more at alternative food marketing channels.
The general users are not familiar with any of them except for farmers’ markets, and
farm and roadside stands. For both of the groups, the farmers’ market is the one that
gathers the most regular customers (often or very often). Local farmers’ websites are
the least frequented venues for both of the groups (non-existent for general users); and
the Slow Food network, the CSA network, and the cooperative are negligible for general
users. What cannot be determined from the survey results is whether these market
alternatives are unknown by the population or rather just not preferred for food
purchasing. The most notable difference between the Figure 4-12 and Figure 4-13 is the
fact that there are more than 7 times more self-selected users shopping “sometimes,
often or very often” through the CSA network. This can be partly explained by the fact
that this is a rather new food-marketing channel. In 1986 there were two community
supported agriculture operations in the US, but 25 years later, at the time of the survey,
there are over 4,000 throughout the USA (USDA, 2012). And it can be also partly

83
explained by the fact that this system is pretty revolutionary for food consumption since
it requires a financial commitment of the consumers, who pay a share of the future
production up-front. Again, further research is required for the CSA case in order to
assess whether this small attendance frequency is due to a lack of knowledge or to a
stronger preference for the convenience of the mainstream distribution sector.

84
Table 4-1. Summary of conducted interviews
Interview Location Date Number of respondents
UF Library West From 04-18-2012 until 04-26-2012
11
UF Southwest Recreation Center
From 04-04-12 until 04-26-12
16
UF Lake Wauburg Recreational Facility
04-15-2012 10
Gainesville Union Street Farmers’ Market
04-18-2012 until 05-02-2012
42
Source: Author’s field notes.
Table 4-2. Race and ethnicity repartition in Gainesville, within the general users and within the self-selected users
Race and Ethnicity US Census data for Gainesville
General users
Self-selected users
Black or African American persons
23.0% 3% 10%
American Indian and Alaska Native persons
0.3% 0% 2%
Asian persons 6.9% 2% 7% Native Hawaiian and other Pacific Islander
0.1% 0% 2%
Persons reporting 2 or more races or some other race
2.9% 3% 17%
White persons Hispanic or Latino 7.1% 27% 21% White persons not Hispanic or not Latino
57.8% 65% 41%
Source: US Census Bureau for Gainesville figures

85
Table 4-3. Most important criteria when buying food by rank of importance for the self-selected users
Criteria Number of occurrences Composition
of the 1st rank
Composition of the 2nd
rank
Composition of the 3rd
rank
Price 35 28% 5 19 11
Health and nutritional value
20 16% 11 5 4
Taste 17 14% 5 4 8
Appearance 8 7% 3 1 4
Quality 8 7% 5 1 2
Freshness 8 7% 4 4 0
Origin 7 6% 3 2 2
Vegetarian 4 3% 1 2 1
Organic 4 3% 1 1 2
Craving 3 2% 1 1 1
Ethics 2 2% 1 1 0
Processing 2 2% 0 0 2
Convenience 2 2% 1 0 1
Due date 1 1% 1 0 0
Quantity 1 1% 0 0 1
Brand 1 1% 0 1 0
TOTAL 123 100% 42 42 39

86
Table 4-4. Most important criteria when buying food by rank of importance for the general users.
Criteria Number of occurrences Composition
of the 1st rank
Composition of the 2nd
rank
Composition of the 3rd
rank
Price 31 28% 7 14 10
Health and nutritional value
27 25% 11 10 6
Taste 20 18% 5 10 5
Quality 8 7% 3 1 4
Aspect 6 6% 3 1 2
Convenience 5 5% 3 0 2
Craving 3 3% 2 0 1
Origin 3 3% 1 0 2
Brand 2 2% 0 1 1
Due date 1 1% 0 0 1
Quantity 1 1% 1 0 0
Freshness 1 1% 1 0 0
Information 1 1% 0 0 1
TOTAL 109 100% 37 37 35
Table 4-5. Table of contingency for the type of population versus the quality criterion.
Quality listed in the 1st, 2nd or 3rd ranking of most important buying criteria
Did not put quality in the top three rankings
Self-selected population 8 34 General population 8 29
Table 4-6. Table of contingency for the type of population versus the freshness criterion.
Freshness listed in the 1st, 2nd or 3rd rankings of most important buying criteria
Did not put freshness in the top three rankings
Self-selected population 8 34 General population 1 36

87
Table 4-7. Table of contingency for the type of population versus the price criterion.
Price listed in the 1st, 2nd or 3rd rankings of most important buying criteria
Did not put price in the top three rankings
Self-selected population 31 6 General population 35 7
Table 4-8. Table of contingency for the type of population versus the health and nutritional value criterion.
Health & nutritional value in the 1st, 2nd or 3rd rankings of most important buying criteria
Did not put health & nutritional value in the top three rankings
Self-selected population 20 22 General population 27 10
Table 4-9. Table of contingency for the type of population versus the taste criterion.
Taste in the 1st, 2nd or 3rd rankings of most important buying criteria
Did not put taste in the top three rankings
Self-selected population 17 25 General population 20 17
Table 4-10. Table of contingency of the proportion of the weekly shopping that has been produced locally versus the type of population.
Self-selected users General users
0-9% 13 22 10-100% 29 15
Table 4-11. Table of contingency of the answered geographical boundaries for local food and the types of population.
Self-selected users General users
Produced in the USA, in the southeast of the USA or in Florida
17 9
Produced within 100 miles of Gainesville
11 7
Produced in Alachua or bordering counties
9 11
Produced in the Alachua County
5 10

88
Table 4-12. Frequency of shopping at different local food venues for the self-selected users (numbers rounded)
Never A very few
times Sometimes Often Very often Cooperative 55% 21% 24% 0% 0% Slow Food network 79% 10% 10% 2% 0% CSA 57% 7% 26% 5% 5% Farmers’ market 0% 24% 38% 24% 14% Farm stand 40% 19% 36% 2% 2% Roadside stand 43% 26% 29% 2% 0% Local farmer’s website 88% 5% 5% 2% 0%
Table 4-13. Frequency of shopping at different local food venues for the general users (numbers rounded)
Never A very few
times Sometimes Often Very often
Cooperative 84% 11% 5% 0% 0% Slow Food network 92% 3% 5% 0% 0% CSA 86% 8% 5% 0% 0% Farmers’ market 30% 30% 35% 5% 0% Farm stand 51% 19% 30% 0% 0% Roadside stand 51% 30% 19% 0% 0% Local farmer’s website 97% 3% 0% 0% 0%
Figure 4-1. Pie-chart of the most relevant themes that self-selected users find important when buying food.

89
Figure 4-2. Pie-chart of the most relevant themes that general users find important when buying food.
Note: “Others”= other themes mentioned less frequently and the non-answered questions
Figure 4-3. Pie-chart representing the use of the country-of-origin indications by the self-selected users.

90
Figure 4-4. Pie-chart representing the use of the country-of-origin indications by general users.
A B
Figure 4-5. Pie-charts representing the respondents’ knowledge of any label for local food, A) Self-selected users, B) General users (Note: the “Yes” proportion for the General users does not take into account the correction of the “wrong” answers they actually gave in this category, that is, when they listed a product that they perceived to be local, even though the product was not from the region).

91
Figure 4-6. Pie-chart displaying the proportion of weekly food shopping that is local food, as reported by the self-selected users.
Figure 4-7. Pie-chart displaying the proportion of weekly food shopping that is local food, as reported by the general users.
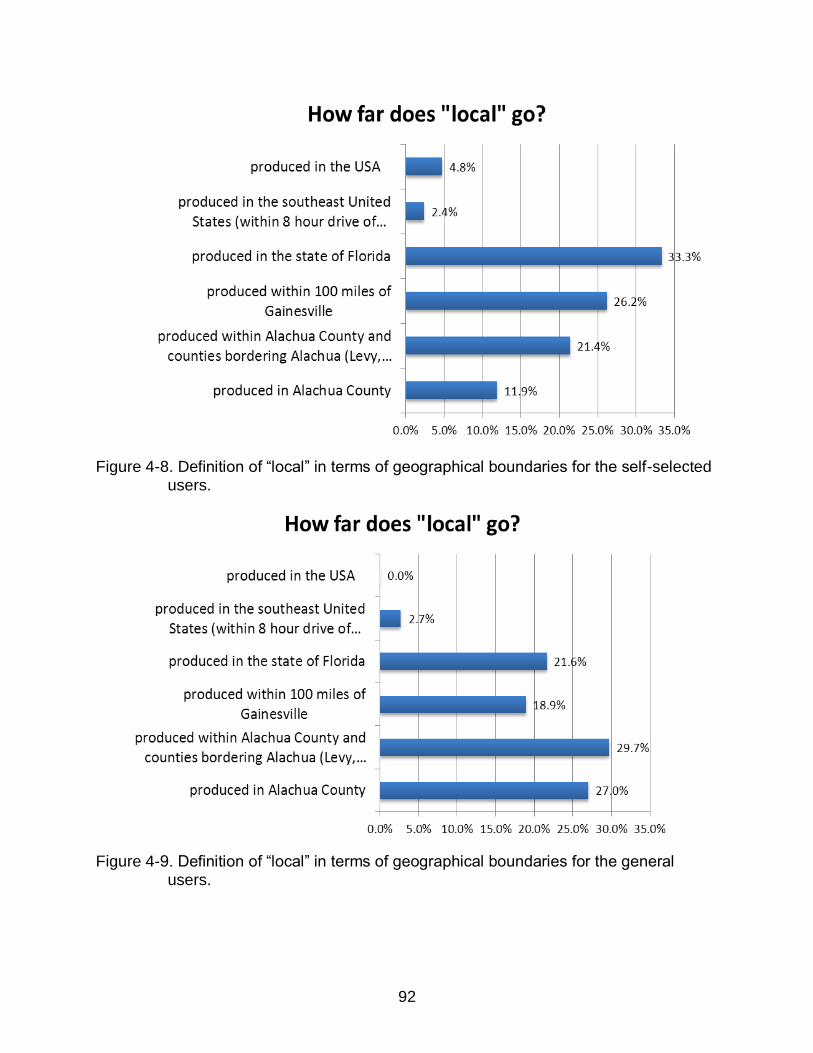
92
Figure 4-8. Definition of “local” in terms of geographical boundaries for the self-selected users.
Figure 4-9. Definition of “local” in terms of geographical boundaries for the general users.

93
Figure 4-10. Categorization of the shopping frequencies at different local food venues for the self-selected users.
Figure 4-11. Categorization of the shopping frequencies at different local food venues for the general users.

94
Figure 4-12. Proportion of self-selected users who buy local food sometimes, often or very often through the different channels.
Figure 4-13. Proportion of general users who buy local food sometimes, often or very often through the different channels.

95
CHAPTER 5 CONSUMERS’MOTIVES, BARRIERS AND PERCEPTION OF LOCAL FOOD
Introductory Remarks
To understand complex behaviors such as food choice, we encouraged
participants to explain themselves through a qualitative approach. We used two
qualitative methods in this research: the word association technique and the laddering
interviews technique. In this chapter, we analyze what the barriers and motives for
purchasing local food are. Then we discuss the answers obtained during the interviews
when the respondents were asked: “when you think about local food, what comes
spontaneously into your mind?” We will summarize the differences between local food
and other foods before analyzing the cognitive structures associated with local food due
to the laddering interview method. The laddering interviews allow shedding light on
consumer motives to buy local food. This analysis allows to shed light on the
consumer’s subjective definition of local food.
Motives and Barriers
To evaluate the motives and barriers of the respondents, the words that they used
when discussing local food purchasing habits were grouped into consistent categories
of expressions that captured as best as possible, each group’s way of thinking.
Similarly, in order to identify “triggers” that resulted in altered/changed behavioral
choices, the respondents were asked: “Was there a reason that led you to start buying
local food?”
For the self-selected users group, the motives that led them to buy food were
mainly ethical. Indeed, 30.2% of the answers were “to support the local economy” and
5.7% of the answers were “to find a socio-economic alternative to agribusiness.” The

96
latter includes perceptions about the abuse to migrant workers, and other injustices, and
a desire to reject a dependence on large industries. The “overall product quality”
accounts for 18.8%. Within this category, 7.5% is freshness and 7.5% is simply
“quality.” The rest is the taste and the characteristic “less processed” associated with
local foods. The willingness for a “greener agriculture” accounts for 11.3% of the
answers. This environmental motive can be completed by the word “sustainability” that
accounts for 3.8% of the answers, although sustainability is not only an environmental
value. Also, other self-selected users’ motives are “health concerns” (9.4%) and
traceability (3.8%), which is likely a safety motive. “Lower price” accounts for 3.8%. Less
than 2% of the answers indicated that some product are not available in supermarkets,
while another 1.9% expressed that local food allowed the respondent to “get into the
local culture.” The role of information was one of the drivers to start buying local food.
Actually, triggers within the environment of Gainesville (e.g., a class at the university
about social farming, a grocery store selling local products) account for 7.6%. Fewer
than 2% explained that having one’s family involved in farming was a trigger for buying
local food.
For the general users group, the main motive is the “overall product quality”
(41.7%). It includes “freshness” (22.2%) “quality” (13.9%), and also taste and the
characteristic that local food is “less processed”. The “overall product quality” represents
thus more than twice the answers than self-selected users gave; more particularly, the
attribute “freshness” much more frequently affected the general users’ motives. 8.3% of
the answers relate to the motive for “organic” foods. There are also 5.6% of answers
each for “healthier” and “more nutritious” foods. At a much lower rate compared to the

97
self-selected users, the general users cite “support of the local economy” (11.1%). Local
food is “cheaper” and this motive appears more than twice as often, on a percentage
basis, than for self-selected users. An interesting result is the fact that 5.6% of the
motives were the “personal atmosphere” that emanates within local food venues. The
role of information is also one of the drivers to start buying local food. 5.6% of the
answers were related to reading a book about this topic and another 5.6% were due to
the family habits to buy such products. The accessibility of local food venues in
Gainesville accounts for 2.8% of the motives.
The respondents were also asked about personal reasons they may think for not
buying local food. 41.3% of the self-selected users’ stated that there is no barrier to
buying local food, which is the answer for the majority of the respondents in this group.
Other responses included price (28.3%), inconvenience in comparison to shopping at
grocery stores (19.6%), and availability of local foods (4.3%). For 2.2% each, three
possible barriers are safety concerns, the negative personality of the seller and if the
vegetables look unappealing.
For general users, far fewer, compared to the self-selected users, indicated that
there are no barriers for buying local foods (22.2% compared to 41.3%). The main
barrier is the price (31.1%), which is a similar result to the self-selected users group.
The second most important barrier is the inconvenience (15.6%), and again it is the
same result as for the self-selected users. Moreover, many respondents said they prefer
shopping at Publix (8.9% of the answers), and 8.9% of the barriers are the lack of
availability (e.g., for food out of season). Lack of knowledge plays a role (6.7%) because

98
some respondents say that they do not know about the venues’ locations and that the
products are less advertised.
Word Association
On average, the self-selected users expressed themselves more than the general
users when they were asked: “when you think about local food, what comes
spontaneously into your mind?” Indeed, on average there were 1.9 words per self-
selected user and 1.5 words per general user (Table 5-1 and Table 5-2). In general, the
meaning is positive, especially for the self-selected users group (“happy cows,” “smiles,”
“genuine love,” etc…).
Fresh produce and flowers account for the majority of themes in both groups.
However, it is more important for general users since they evoke this theme along with
the theme “oranges, orange juice and groves.” If we combine both of those categories
this makes 31.5% of the answers related to fruit and vegetables in contrast to 16.3% for
the self-selected users. It is important to note that in the general users’ minds, oranges
are a famous agricultural product of Florida and hence is strongly associated with the
idea of local food. The semantic net related to “farm, farmers and animals” was
mentioned two times more often by the self-selected users (15%) than for the general
users. Also, for the self-selected users, there are 8.6% of references to “the landscape”
whereas there is nothing similar to this for general users. In the same way, the
association with happiness is specific for self-selected users (5%).
“Fresh products” is an important characteristic for general users since it accounts
for more than one fifth of the answers. However, freshness accounts for only 8.6% for
self-selected users. Another difference between groups is that the self-selected users
see the community in a social network perspective (“community building”), while the

99
general users tend to see the need to support the local economy. Another important
difference between both of the groups is that the general users link local food with
healthiness and in a significant proportion (9.3%). This does not appear in the self-
selected users’ statements. 5% of the self-selected users’ thoughts are about ethical
values (“environmental awareness” and “good cause, integrity”), while 3.8% of the
general users indicated these ideas (“fairness” and “sustainable agriculture”). An
important result is the fact that organic agriculture is associated with local food whereas
it is not a requirement for a local farmer to be certified organic. It would be interesting to
research in greater depth to learn more about the local farmers’ involvement in organic
practices and how consumers link local and organic in their perceptions.
Differentiation of the Local Food from Other Foods
When asked, “What are the main characteristics that differentiate local food from
other foods?” 32% of the self-selected users stated that it is the overall product quality,
31% indicated production methods, 13% mentioned the social aspect (local economy
and community), and 4% stated the price. Among the general users, 29% identified
production method, 20% indicated overall product quality, 14% noted location, 12%
stated price and 8% mentioned the social aspect (helping the local economy).
Means-End Chain Analysis
The laddering interviews shed light on consumer’ motives to buy local food, or
more precisely, on the mental network of associations that the consumer does in his
mind when thinking about buying local food. Once again, the theory underpinning this
approach is the Means-Ends Chain (MEC) Theory (Reynolds and Gutman, 1988;
Grunert and Grunert, 1995).

100
Methodology
The first step of the methodology was to transfer the raw data into an Excel
spreadsheet in order to associate each individual and his discourse on a same line, and
to begin determining his reasoning. Actually, the first data reduction is to code the
answers into key expressions.
Within the self-selected user group, 5 individuals could not answer the laddering
follow-up questions at all because they do not purchase local food. Those individuals
were not removed from the research samples because they are part of the general user
group and bring information even if it is incomplete relative to the laddering approach.
Table 5-3 displays the participation at each question of the laddering interviews.
The list of the key expressions of a group of respondents (general or self-selected
users) illustrates on the main ideas that the group had expressed. At this point, the
second data reduction is to group the pieces of answers in different semantic categories
that make sense in the context of the literature, are inspired from the group itself, and
are not redundant. Then each ladder can be determined by coding the individual’s
logical reasoning with the categories previously determined. Each category has a
hierarchical order and is an attribute, a consequence or a value. Indeed, this is what
creates the hierarchical value map. Each ladder is supposed to be a set of three
components -- attribute, consequence and value. Several ladders can be obtained for
one respondent if he was inspired enough. The tricky part is to code the categories in
attribute, consequence and values because it requires a thorough analysis of the whole
dataset in order to find similarities between respondents of the same group (self-
selected or general users) and to apply the same code to the whole group. The most
important thing is to keep close to the sample’s perception in order to minimize

101
deviations from the reported reality. However, this task is very subjective and we may
also find that the interview process (“what are the most important reasons or product
characteristics for you?”, “what does this latter mean to you?”, “and why is that
important to you”, “and why is the latter important to you?”) generates links and not
always real hierarchical ladders in the shape of “attribute-consequence-value”. For
some people a category is a cause and has different consequences. But for some
others, the logic is reversed and what appeared as a consequence is actually a cause
for them. Some previous research points out the limits of the concept of linear
hierarchical structures (Baggozi and Dolakhia, 1999; Van Rekom and Wieranda, 2002).
The aim of the coding in terms of attribute-consequence-value is to build an implication
matrix. The implication matrix is an aggregate of the information, and thus choices have
to be made during the coding phase in order to represent the average.
Hierarchical Value Maps (HVM)
The software LadderUX was used to design the HVMs from the 60 general users’
ladders and the 69 self-selected users’ ones. This software allows one to eliminate
doing algorithmic work by hand, but it does generate the implication matrix which is
transformed in a hierarchical tree. It allows for optimally positioning the elements, and a
repositioning by the researcher is still possible if necessary. The cut-off level is 4, that is
to say only the links (direct and indirect) between categories that are at least listed four
times are taken into account.
According to the results summarized in Figure 5-2, by consuming local foods, the
main ends for the self-selected users are: having a “good quality of life”, “belonging to a
local community” and reaching a “human accomplishment.” For the general users, the

102
ends are “live longer”, having a “good quality of life” and showing “patriotism” (Figure 5-
1).
First, self-selected users chose to consume local food based on their need to
purchase products that have the characteristic to be “alternative to mass consumption.”
This is the main attribute that they give to local food and the base of the hierarchical
tree. Linked to this attribute is their idea that food produced locally has two other
attributes: it is more “natural” on the one hand and it is also “fresher” on the other.
The fact that the food is more natural is important to them because it means
having a healthier diet. According to the responses to the questionnaire, self-selected
users are health conscious persons and thus this result is coherent. The link between
the attribute “natural” and the consequence “healthier” is very strong, which means that
this logical reasoning has been evoked many times during the interviews (8 times this
attribute led to this consequence directly, and 2 times indirectly) (Figure 5-4).
A “fresher” food also leads to a “healthier” diet. And even more important for the
self-selected users is the fact that “fresher” food results “tastier” food. The means-end
chain analysis has proven that there are 5 direct links between both of those ideas and
2 indirect ones. A very important logical structure for the self-selected users is to
consider that “healthier” and “tastier” food is important to determine a “good quality
food.”
Food of “good quality” according to this class of people has strong ties to the
attributes “tastier” food, “healthier” food and “better visual aspect.” It is a trivial result
that is nevertheless not exactly verified for the general users. Indeed, for general users,
a “good quality food” is mainly the consequence of “tastier” food and to a lesser extent

103
of “healthier” food. For the general users, “healthier” food is much more important to
“benefit the body” (11 direct links) and thus “live longer” (Figure 5-3). And indeed, during
the interviews the perception of the body was essentially its physical state for the
general users, whereas for the self-selected users, the “body” encompasses also the
psychological equilibrium between the mind and the physical corpus.
In the self-selected users’ reasoning, there is the perception that local food, by
being of better quality, is also beneficial to the body and that leads to a “good quality of
life.” Living a “good quality of life” is a terminal value for self-selected users.
Self-selected users think that by buying food that has been produced locally they
support the local economy, which makes them members of the local community. By
supporting the local economy, they also feel that it is a way of reaching the value of
“human accomplishment.”
Regarding the general users, when describing the reasons to purchase local food,
they count as attributes the non-existence of “chemicals” (“no pesticides”, “no/less
preservatives”) in these foods as well as the attribute “more affordable” than
conventional products. The latter is directly linked to their goal of saving money, and it is
coherent with what was found when interpreting the questionnaires. It should not be
omitted that the sample population of general users are undergraduate students and
thus their financial resources are limited.
The non-existence of chemicals in local food, which is in the minds of general
users, has a direct connection with the freshness of the products. This hierarchical link
means that since the local foods are freer of chemicals it has a higher level of freshness
because they cannot be sold a long time after their harvest or production. It illustrates

104
the fact that several general users have cited the absence of preservatives in local
foods.
The “freshness” attribute of local foods makes them at the same time healthier and
above all tastier, as it has been previously described. By consuming food that benefits
your body, general users think that they will “live longer,” which is one of their values.
Also, consuming food of good quality leads to a “good quality of life.” Last but not least,
a consequence of purchasing local food is to “support the local economy.” We interpret
is as “patriotism.” The expressions that helped to build this category were for instance:
“to be proud of where I am from,” “it is where I live,” “nationalism.” In comparison, the
self-selected users employed the expression “caring/supporting/improving the local
community,” “unity,” and “community interaction.” This is probably due to the fact that
they are more involved in this alternative food shopping – it is also a frequent farmers’
market advertisement to highlight community engagement.

105
Table 5-1. Word association test results for the self-selected users
Themes Some constitutive words Proportion of the answers
Fruits, vegetables, flowers Produce, tomato, strawberries 16.3% Farm, farmers, animals Farmers in hats, happy cows 15% Organic Organic 13.8% Landscape Rows of crop, pasture 8.6% Fresh Freshness, fresh 8.6% Local food venues Farmers’ market, coop, stands 7.5% Community Community, friends 7.5% Happiness Smiles, happiness 5% Hard working Hard working, have to be cautious 3.8% Green, colors Green, colors 3.8% Animal productions Meat, fish, honey 2.5% Environmental awareness Environmental awareness, hippie 2.5% Good cause, integrity Good cause, integrity 2.5% Ward’s Ward’s 1.3% Crisp Crisp 1.3%
Table 5-2. Word association test results for the general users
Themes Some constitutive words Proportion of the answers
Fresh products Fresh produce, fresh bread 22.2% Fruits and vegetables Strawberries, salad of greens 20.4% Orange, orange juice or groves
Orange, orange groves 11.1%
Supporting local economy Help the local economy 9.3% Healthier Healthy, healthier 9.3% Farm, farmers Farm, farmers 7.4% Organic Organic, more natural 7.4% Animal production Meat, egg, raw dairy 5.6% Farmers’ market Farmers’ market 3.7% Happy animals Happier animals 3.7% Higher quality Very high quality 3.7% Florida Florida 1.9% Smaller companies Smaller companies 1.9% Green Green 1.9% Mom & Pop restaurant Mom & Pop restaurant 1.9% Expensive Expensive 1.9% Energy efficient Energy efficient 1.9% Fairness Fairness 1.9% Sustainable agriculture Sustainable agriculture 1.9%

106
Table 5-3. Participation with the laddering exercise.
General users
Self-selected users
Sample size 37 42
# Respondents 1st question 32 42
# Respondents 2nd question 32 42
# Respondents 3rd question 29 40
# Respondents 4th question 27 34
Total generated ladders 60 69
Source: Author’s field notes

107
Figure 5-1. HVM for the general users (cut-off level=4)

108
Figure 5-2. HVM for the self-selected users (cut-off level=4).

109
Figure 5-3. Implication matrix for the general users’ HVM.
Caption: in each cell “x/y” displays the number of direct links x and the number of indirect links y between the element in row and the element in column.

110
Figure 5-4. Implication matrix for the self-selected users’ HVM.
Caption: in each cell “x/y” displays the number of direct links x and the number of indirect links y between the element in row and the element in column.

111
CHAPTER 6 CONCLUSIONS
Keynote
This thesis sought to define the consumers’ perception of local food in Gainesville.
The City of Gainesville is situated in Alachua County in the state of Florida, in the
Southeastern United States. The main goal was to evaluate consumers’ perceived
needs in order to explore further potential for local food marketing. The objective was to
gain insights into the image of local food for selected consumer groups and into buying
motives for local food. Therefore this study aimed to clarify the following research
questions:
How well informed are the consumers regarding local food?
How can we define “local food”?
What are the motives and barriers to buy local food?
What are the attributes associated with local food?
What are the consumer’s values concerning local food?
Does local food encompass the same values for different categories of consumers?
Two samples were used to answer those questions: general users who were
chosen as being students of the University of Florida and self-selected users who were
sampled at the downtown farmers’ market. The research was conducted during April
and May 2012. While self-selected users were only sampled at the Gainesville Union
Street Farmers’ Market, the general users were sampled in 3 different locations of the
University of Florida (UF) Campus: the UF Library West, the UF Southwest Recreation
center and the UF lake Wauburg Recreational Facility. In this research it is documented
that females are more involved in the food purchasing procedure than males. The

112
descriptive analysis of the consumers’ habits and knowledge about food (Chapter 4)
served as primary information in order to analyze then the consumers’ behavior through
qualitative analyses (Chapter 5). The qualitative analyses used were the word
association and the laddering interviews. Additionally, the motives and barriers for
purchasing local food were explained.
The first part of the interview was to evaluate the consumers habits related to
grocery shopping in general, local food purchasing and knowledge about food origin
labels. Then, each respondent had to give his own definition of local food in terms of
“boundaries” when answering “how far does ‘local’ go?” and when answering in a more
personal manner “what is local food for you?” and “in your opinion what are the main
characteristics that differentiate local food from other foods?” The respondents were
asked about their motives, barriers and perception of local food. For the latter, first an
association test was employed, which is often applied in marketing to identify the image
of a specific brand or product. Then, the interviewees went through the laddering
questionnaire.
Key Findings and Discussion of the Results
How Well Informed Are the Consumers Regarding Local Food?
In this research people who have an agricultural background (education, family,
job, etc…) are more prone to consume local food. This study was conducted in Florida,
where the label “Fresh from Florida” aims at differentiating products produced within the
State. Surprisingly, the awareness of the label was low in both of the groups (41% for
the general users and 36% for the self-selected users). However, it is comparable to the
results obtained by Brown (2003) about the knowledge of the Missouri State promotion

113
program. The label is a marketing asset. This research suggests it should be better
promoted in order to increase consumers’ understanding of the differentiated product.
This research shows that self-selected users are more informed and really more
committed to local food than general users. First, with the labels of origin, while 54% of
the general users do not pay attention or do very few times, 57% of the self-selected
users pay attention at least sometimes. While no general user spends more than 40%
of his grocery shopping on local food, 1/5th of the self-selected users do. Moreover,
when provided a list of alternative market venues, the majority of the general users
indicated that they never buy local food through any of the suggested venues except for
farmers’ markets, whereas the self-selected users do (except for “local farmers’
websites”). The farmers’ market is also the most popular venue amongst self-selected
users. A question for future research would be to determine if alternative marketing
venues are unknown by the general users and need more advertisement, or if general
users simply prefer not to buy local food through these other alternatives.
How Can We Define Local Food?
For the question, “How far does local go?” 1/3rd of the self-selected users stated
the state of Florida and almost the same proportion of general users chose a smaller
scale by citing Alachua County and its bordering counties. The second most common
response was “produced within 100 miles of Gainesville” for the self-selected users
(26.2%) while it was “Alachua County” for the general users (27.0%). The third most
common answer was “Alachua County and its bordering counties” for the self-selected
users (21.4%), and the state of Florida for the general users (21.6%). Given that the US
Congress defined “local food” in the 2008 Farm Bill as a total distance of less than 400
miles from its origin, or within a state’s borders (USDA, 2010), the results obtained for

114
the self-selected users in this research are consistent with the “official” categories. It is
also consistent with the study conducted in Ohio about strawberries by Darby et al.
(2008), which found that state boundaries serve to define the term. The results we
obtain for the general users are closer to the European vision that Chambers et al.
(2007) developed using a focus group organized in the London area and where
participants defined local food as food produced and sold in a 20-50 mile radius. In our
study, the main characteristics that differentiate local food from other foods are the
production methods and the overall product quality; both groups agreed. These are the
elements of definition associated with local food. To summarize, self-selected users
define local food as “food produced in my state or geographically closer to my home”
and general users define it as “food produced in my county or in its bordering counties
or in a smaller distance.”
In the definition of local food based upon the literature review (as detailed in
Chapter 2), it was concluded that defining the community is the first step before trying to
assess what local food means for the particular community. Indeed, there will be
different definitions for different communities. The empirical results show that self-
selected and general users differ slightly in their choice of geographic boundaries, which
means that even for two groups living in the same city and of a same age group, one
can find different answers.
What Are the Motives and Barriers to Buy Local Food?
An incremental method of interviewing was employed in order to check whether
some of the respondents would cite spontaneously “local” as one of the most important
criteria for buying food. Less than 5% of the self-selected users cited this attribute as
being important and for those who considered it important, it was not of first importance.
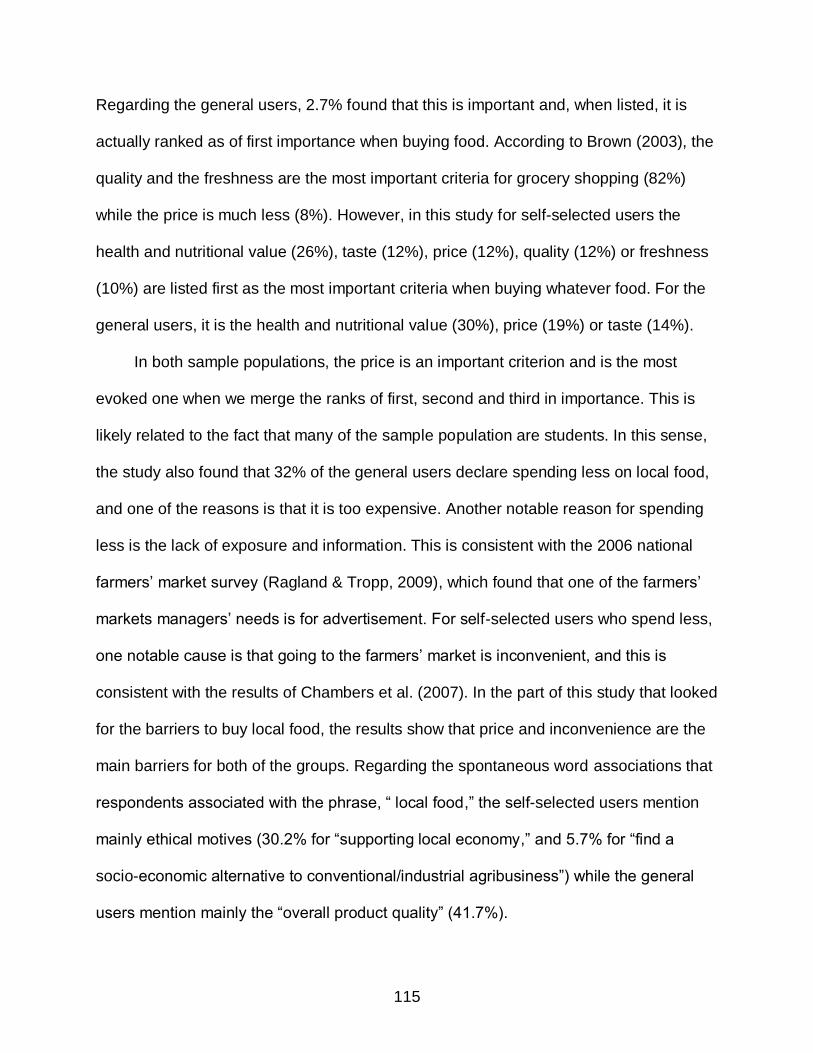
115
Regarding the general users, 2.7% found that this is important and, when listed, it is
actually ranked as of first importance when buying food. According to Brown (2003), the
quality and the freshness are the most important criteria for grocery shopping (82%)
while the price is much less (8%). However, in this study for self-selected users the
health and nutritional value (26%), taste (12%), price (12%), quality (12%) or freshness
(10%) are listed first as the most important criteria when buying whatever food. For the
general users, it is the health and nutritional value (30%), price (19%) or taste (14%).
In both sample populations, the price is an important criterion and is the most
evoked one when we merge the ranks of first, second and third in importance. This is
likely related to the fact that many of the sample population are students. In this sense,
the study also found that 32% of the general users declare spending less on local food,
and one of the reasons is that it is too expensive. Another notable reason for spending
less is the lack of exposure and information. This is consistent with the 2006 national
farmers’ market survey (Ragland & Tropp, 2009), which found that one of the farmers’
markets managers’ needs is for advertisement. For self-selected users who spend less,
one notable cause is that going to the farmers’ market is inconvenient, and this is
consistent with the results of Chambers et al. (2007). In the part of this study that looked
for the barriers to buy local food, the results show that price and inconvenience are the
main barriers for both of the groups. Regarding the spontaneous word associations that
respondents associated with the phrase, “ local food,” the self-selected users mention
mainly ethical motives (30.2% for “supporting local economy,” and 5.7% for “find a
socio-economic alternative to conventional/industrial agribusiness”) while the general
users mention mainly the “overall product quality” (41.7%).

116
What Are the Consumer’s Values Concerning Local Food and Does Local Food Encompass the Same Values for Different Categories of Consumers?
The self-selected users have a deeper appreciation and specific perception of
local food. These respondents were more expressive with their word associations than
the general users, and the meanings were very positive (much more than for the
general users). They used more “romanticism” when expressing what came
spontaneously to their minds when thinking about local food. And self-selected users
seemed to capture the notion of social embeddedness in their ideas about local
shopping.
Still, both groups associated fresh produce and flowers with local food. General
users emphasized orange production, which likely is due to the fact that oranges are a
symbol of Florida (e.g., a picture of an orange is on the state-issued automobile license
plate, and images of oranges are often used in promotional materials about the state).
Both the self-selected users and the general users cited the importance of supporting
the local economy. However, the self-selected users tended to create more social ties
and tended to be part of a community through their shopping behavior, while general
users’ explanations were more narrowly focused on economic support for local
businesses.
Framing the general users in the Means-end chain analysis, we can see that
consuming local food actualizes three values: the longevity of one’s life, a good quality
of life for oneself, and patriotism. The underlying values for the self-selected users are
slightly different: the good quality of one’s life (just as it is for the general users), being
part of a community and human accomplishment. This shows that local food does not
encompass exactly the same values for the two different categories of consumers. The

117
terminal values for both groupls, however, are mostly related to health and well-being,
which is a similar result as what is found in Zanoli and Naspetti (2002) about organic
consumption, as well as in Ares et al. (2008) and Krystallis et al. (2008) about functional
food. The motivating value that is specific to local food versus functional and organic
foods is the fact that buying local is a way of supporting the local economy and/or
community.
What Are the Attributes Associated with Local Food?
The main attributes associated with local food are “fresher,” “no chemicals,” and
“more affordable” for general users. The latter is surprising since the price of local food
is also a barrier for 28.3% of the general users. The main attributes associated of local
food for self-selected users are “alternative to mass consumption,” “better visual
aspect,” “natural production” and “fresher.” As already noted, general and self-selected
users differ regarding their level of information about local food. However, when looking
at the attributes they associated with local foods, both groups identified attributes similar
to those associated with organic foods. There are therefore some similarities with the
current MEC analysis and the MEC analysis conducted by Zanoli and Naspetti (2002)
about the organic food consumption. The self-selected users in this study noted the
attribute “better visual aspect,” while the regular consumers of organic products in the
Zanoli and Naspetti study noted the attribute “taste, texture and odour.” Both
populations also noted the attribute “natural production.” Similarly, the general users
share the attributes “no chemicals” with the occasional organic consumers of the cited
research. However, the attributes “fresher” and “alternative to mass consumption” that
are in this study’s results for self-selected users are not part of the reported attributes
that organic consumers stated in the previous research. Also, the general users’

118
attribute “fresher” is not displayed in the occasional consumers’ HVM in the research
about organic consumption. Lastly, high price was a barrier for the occasional organic
consumers, and hence, there is not an attribute “more affordable” for them, while it is an
attribute expressed in the general users’ HVM for this study.
To conclude, the empirical research and analysis of this study suggest that in
order to meet consumers’ expectations and demand for local food products, producers
and marketers need to consider the following:
Local food should be produced in the State or closer in order to provide both fresher products and meet consumer expectations about the phrase, “local food.”
Local food should be produced using techniques that are perceived as being more respectful of the environment than practices associated with the industrial/conventional production and mass consumption sector.
Local food should be produced with more ethical practices in order to answer the interest in alternative ways of sourcing food.
Local food should be marketed as a means for supporting local social ties.
Local food should be marketed as a way of reducing middlemen in order to develop more transparent and credible communication about the provenance and production practices used to produce and deliver products to the consumer.
Limits of the method
The goal of this research was to evaluate consumers’ perception of local food. By
choosing a qualitative approach, obtained results have meanings that are directly
extracted from the consumers’ mind. Due to the qualitative nature of the research
method the results represents hypotheses, which could be tested in subsequent
quantitative studies. Also, the sample population (a mix of university students and
shoppers at a local farmers’ market) and sample size (n= 79) do not permit
generalizations about all consumers.

119
The small samples permit conducting in-depth interviews and analyzing responses
qualitatively (e.g., word associations and evaluation of motives and values underlying
perceptions). Yet, the data reduction was very time consuming since the goal was to
summarize the answers without depicting a biased impression. And one of the important
steps was to try to not use the same descriptive terms for self-selected and general
users, but rather to extract from the raw data the most suitable terms for each group. In
this sense, the nuances and the difference of semantic use can be highlighted. For
instance, the self-selected users use more romantic explanations during the word
association test. It seems that this exercise was very appreciated by the interviewees. In
this unstructured task, they can express more ideas than if the answers are pre-
determined and provided by the researcher.
The laddering interviews were conducted successfully in an atmosphere allowing
for ample time for respondents to answer fully. The respondents were informed that
there is no right or wrong answer so that they could feel free to answer what they found
the most important for them. As a result, several ladders have been constructed.
Nevertheless, when using the mean-ends chain theory, the important assumption is that
consumers’ knowledge is hierarchically organized, through different levels of
abstraction. But in reality, many respondents gave linked ideas rather than ideas
hierarchically organized. The most tricky part of the means-ends chain analysis was
thus to find a consensus in the coding of the different elements into attributes, values
and consequences.
Also, there is not a lot of literature explaining how to design the HVM from the
laddering interviews. Decoding the implication matrix to draw a logic tree is laborious

120
and nearly impossible when the ladders do not always follow the scheme “attribute-
consequence-value” as it is the case in this research. This is the reason why the
software LadderUX was of great help in order to simplify the optimization process.
In sum, even if the data was qualitative and analysis was challenging, the results
are suitable and substantial. Moreover, the Hierarchical Value Map visually illustrates
the cognitive structures of the interviewed consumers in respect to buying local food,
suggesting that the limitations of the methods are balanced with the benefits of the
approach.
To conclude, the following “next steps” are offered as possible extensions of the
research presented in this thesis:
What really matters within the several identified dimensions composing the definition of local food?
What would be the results if we used a larger sample size in order to quantify our qualitative outcomes?
We have seen that the label ‘Fresh from Florida” is not well-known. Are the results we observe attesting real preferences or rather a general lack of information about local food labels and venues?

121
APPENDIX QUESTIONNAIRE OF THE STUDY
Q1. What are the three most important criteria for you when you buy food, by rank of importance?
1.
2.
3.
Q2. Do you pay attention to the country of origin indications about your food products? (Put an “X” in the appropriate box)
Never A very few times
Sometimes Often Very often
Q3. Do you purchase local food?
Yes No Q4. If you do not purchase local food, will you do it in the future?
Yes No Q5. Can you name any label for local food?
Q6. How much of your weekly food shopping has been produced locally?
◯ 1-9%
◯ 10-19%
◯ 20-29%
◯ 30-39%
◯ 40-49%
◯ >50%
Q7. What is “local food” for you?

122
Q8. How far does “local” go?
◯ produced in Alachua County
◯ produced within Alachua County and counties bordering Alachua (Levy, Gilchrist,
Columbia, Union, Bradford, Putnam, Marion)
◯ produced within 100 miles of Gainesville
◯ produced in the state of Florida
◯ produced in the southeast United States (within 8 hour drive of Gainesville)
◯ produced in the USA
Q9. Was there a reason that led you to start buying local food?
Q10. When you think about local food what comes spontaneously into your mind? (words, pictures, situations)

123
Q11. Do you know this label “Fresh from Florida”, implemented by the Florida Department of Agriculture and Consumer Services? (circle the right answer)
Yes No Q12. How often do you buy food through (Put an “X” in the appropriate box):
Never A very few times
Sometimes Often Very often
A Co op?
The Slow Food network?
A Community-Supported Agriculture (CSA) network?
A Farmers market?
A farm stand?
A roadside stand?
A local farmer’s website?

124
Laddering: Q13. When you buy local food what are the most important reasons or product characteristics for you?
Q14. What does … mean to you? Why did you choose it? (refers to the previous answer)
Q15. And why is that important to you? (refers to the previous answer)
Q16. And why is the latter important to you? (refers to the previous answer)
Q17. Are there also any personal reasons you may think of for not buying local food?
Q18. In your opinion, what are the main characteristics that differentiate local food from other foods?

125
Q19. Socio-demographic information
Sex: ◯ Male
◯ Female
Age: ………. Race and Ethnicity:
◯ American Indian or Alaska Native
◯ Asian
◯ Black or African American
◯ Native Hawaiian or other Pacific Islander
◯ White hispanic or latino
◯ White non-hispanic or non-latino
◯ Some Other Race
Do you have an agricultural background (family, education, job, etc…)?
Yes No
In your opinion, do you think you spend <more>, <less> or < about the same > as other students on your weekly expenses for local food?
◯ More
◯ Less
◯ About the same
If <more>---- Why do you spend more? …………………………………………………………………………………………………………………………………… If <less>---- Why do you spend less? ……………………………………………………………………………………………………………………………………

126
LIST OF REFERENCES
Agricultural Marketing Service of the USDA. (n.d.). Country of origin labeling. Retrieved from http://www.ams.usda.gov/AMSv1.0/cool
Agricultural Marketing Service of the USDA. (n.d.). Farmers Market and Local Food Marketing. Retrieved from http://www.ams.usda.gov/AMSv1.0/FARMERSMARKETS
Agricultural Marketing Service of the USDA. (n.d.). Food deserts. Retrieved from http://apps.ams.usda.gov/fooddeserts/FAQ.aspx
Agricultural Marketing Service of the USDA. (2012). Letter to the industry representatives stating that COOL regulations remain in force. Retrieved from http://www.ams.usda.gov/AMSv1.0/getfile?dDocName=STELPRDC5097737
Allen, P. (1999). Reweaving the food security safety net: Mediating entitlement and entrepreneurship. Agriculture and human values, 117–129. Retrieved from http://www.springerlink.com/index/p03ug46667u82471.pdf
Amani, P., & Schiefer, G. (2011). Data Availability for Carbon Calculators in Measuring GHG Emissions Produced by the Food Sector. International Journal on Food System Dynamics, 2(4), 392–407.
Andreani, J.-C. (Institut I., & Conchon, F. (Institut I. (2005). Méthodes d’analyse et d'interprétation des études qualitatives : Etat de l'art en marketing. Paris, France: Congrès des Tendances du Marketing. Retrieved from http://www.escp-eap.net/conferences/marketing/2005_cp/Materiali/Paper/Fr/ANDREANI_CONCHON.pdf
Ares, G., Giménez, A., & Gámbaro, A. (2008). Understanding consumers’ perception of conventional and functional yogurts using word association and hard laddering. Food Quality and Preference, 19(7), 636–643. doi:10.1016/j.foodqual.2008.05.005
The Central Intelligence Agency. (2009). The World Factbook: labor force by occupation. Retrieved from https://www.cia.gov/library/publications/the-world-factbook/fields/2048.html
Economic Research Service of the USDA. (2012). State Fact Sheets: United States. Retrieved from http://www.ers.usda.gov/data-products/state-fact-sheets/state-data.aspx?StateFIPS=00

127
Europa (the official EU website). (n.d.). Assister les communautés rurales (Assisting the Rural Communities). Retrieved from http://ec.europa.eu/agriculture/capexplained/assistance/index_fr.htm
Europa (the official EU website). (2010). Dacian Dolos’ speech on April 14th, 2010: “une agriculture dynamique, ce sont des territoires dynamiques” (A dynamic agriculture means dynamic territories). Retrieved from http://europa.eu/rapid/pressReleasesAction.do?reference=SPEECH/10/159&format=HTML&aged=0&language=FR&guiLanguage=en
Europa (the official EU website). (2005). The features of European agriculture. Retrieved from http://ec.europa.eu/agriculture/capexplained/index_en.htm
FAAN. (2010). Local Food Systems in Europe: Case studies from five countries and what they imply for policy and practice (p. 52 p.). Retrieved from http://www.faanweb.eu
Florida Center for Instructional Technology (FCIT). (n.d.). Exploring Florida: Florida then and now. Retrieved from http://fcit.usf.edu/florida/lessons/lessons.htm
Florida Department of Agriculture and Consumer Services. (n.d.). Florida crops and products: overview of Florida agriculture. Retrieved from http://www.florida-agriculture.com/consumers/crops/agoverview/
Grunert, K. G., & Grunert, S. C. (1995). Measuring subjective meaning structures by the laddering method: Theoretical considerations and methodological problems. International Journal of Research in Marketing, 12(3), 209–225. doi:10.1016/0167-8116(95)00022-T
Guerrero, L., Claret, A., Verbeke, W., Enderli, G., Zakowska-Biemans, S., Vanhonacker, F., Issanchou, S., et al. (2010). Perception of traditional food products in six European regions using free word association. Food Quality and Preference, 21(2), 225–233. doi:10.1016/j.foodqual.2009.06.003
Guptill, A., & Wilkins, J. L. (2002). Buying into the food system: Trends in food retailing in the US and implications for local foods. Agriculture and Human Values, 39–51. Retrieved from http://www.springerlink.com/index/6NDAHAG49H17FW1W.pdf
Guyomard, H., Le Mouël, C., Jez, C., Forslund, A., & Fournel, E. (2008). Results of the agriculture 2013 foresight study - results and important lessons by theme (p. 88pp).
Hinrichs, C. (2000). Embeddedness and local food systems : notes on two types of direct agricultural market. Journal of rural studies, 16, 295–303. Retrieved from http://www.sciencedirect.com/science/article/pii/S0743016799000637

128
Ilbery, B., & Maye, D. (2006). Retailing local food in the Scottish–English borders: A supply chain perspective. Geoforum, 37(3), 352–367. doi:10.1016/j.geoforum.2005.09.003
Ilbery, B., Morris, C., Buller, H., Maye, D., & Kneafsey, M. (2005). Product, Process and Place: An Examination of Food Marketing and Labelling Schemes in Europe and North America. European Urban and Regional Studies, 12(2), 116–132. doi:10.1177/0969776405048499
Keeling Bond, J., Thilmany, D., & Bond, C. (2009). What Influences Consumer Choice of Fresh Produce Purchase Location? Journal of Agricultural, 1(April), 61–74. Retrieved from http://ageconsearch.umn.edu/bitstream/48755/2/jaae162.pdf
King, R. P., Hand, M. S., Digiacomo, G., Clancy, K., Gómez, M. I., Hardesty, S. D., Lev, L., et al. (2010). Comparing the Structure , Size , and Performance of Local and Mainstream Food Supply Chains. Retrieved from http://www.ers.usda.gov/publications/err-economic-research-report/err99.aspx
Knutson, R., Penn, J., Flinchbaugh, B., & Outlaw, J. (2007). Agricultural and Food Policy. (Uppon Saddle River, Ed.) (6th ed.). Prentice Hall.
Larson, N. I., Story, M. T., & Nelson, M. C. (2009). Neighborhood environments: disparities in access to healthy foods in the U.S. American journal of preventive medicine, 36(1), 74–81. doi:10.1016/j.amepre.2008.09.025
Lendrevie, J., Lévy, J., & Lindon, D. (2009). Mercator: Théories et nouvelles pratiques du marketing. (Dunod, Ed.) (9th ed., p. 1200 pages). France: Hachette.
Low, S. A. (USDA/ERS), & Vogel, S. (USDA/ERS). (2011). Direct and Intermediated Marketing of Local Foods in the United States. Economic Research Report, (128), 38 p.
Martinez, S., Hand, M., Pra, M. D., Pollack, S., Ralston, K., Smith, T., Vogel, S., et al. (2010). Local Food Systems: Concepts, Impacts , and Issues. Economic Research Report.
Nie, C., & Zepeda, L. (2011). Lifestyle segmentation of US food shoppers to examine organic and local food consumption. Appetite, 57(1), 28–37. doi:10.1016/j.appet.2011.03.012
Pieters, R., Baumgartner, H., & Allen, D. (1995). A means-end chain approach to consumer goal structures. International Journal of Research in, 12, 227–244. Retrieved from http://www.sciencedirect.com/science/article/pii/016781169500023U

129
Pirog, R. (Leopold C. for S. A., Van Pelt, T. (Iowa S. U., Enshayan, K. (University of N. I., & Cook, E. (Leopold C. for S. A. (2001). Food, Fuel and Freeways: An Iowa perspective on how far food travels, fuel usage, and greenhouse gas emissions (p. 37 p.). Ames, IA. Retrieved from http://www.nationalgoodfoodnetwork.com/resources/ngfn-database/knowledge/food_mil.pdf
Ploeg, M., Breneman, V., Farrigan, T., & Hamrick, K. (2009). Access to affordable and nutritious food: measuring and understanding food deserts and their consequences. Report to Congress. … consequences. Report … (p. 160 pp). Retrieved from http://www.ers.usda.gov/publications/ap-administrative-publication/ap-036.aspx
Ragland, E. (USDA/AMS), & Tropp, D. (USDA/AMS). (2009). USDA national farmers market manager survey 2006. (p. 112 p.). Retrieved from http://ddr.nal.usda.gov/handle/10113/42000
Schonhart, M., Penker, M., & Schmid, E. (2009). Sustainable local food production and consumption: challenges for implementation and research. Outlook on agriculture, 38(2), 175–182. Retrieved from http://www.ingentaconnect.com/content/ip/ooa/2009/00000038/00000002/art00009
Steinman, R. B. (2009). Projective techniques in consumer research. International Bulletin of Business Administration, (5), 37–45.
Stewart, H. (USDA/ERS), Blisard, N. (USDA/ERS), & Jolliffe, D. (USDA/ERS). (2006). Let’ s Eat Out Americans Weigh Taste, Convenience, and Nutrition. Economic Information Bulletin (p. 16 p.). Retrieved from http://ageconsearch.umn.edu/bitstream/59411/2/eib19.pdf
Thompson, E. J. (American F. T., Harper, A. M. (Sustainable A. E., & Kraus, S. (Sustainable A. E. (2008). Think Globally - Eat Locally: San francisco Foodshed Assessment. Pulse (p. 48 p.). Retrieved from http://www.farmland.org/programs/states/ca/Feature Stories/San-Francisco-Foodshed-Report.asp
U.S. Environmental Protection Agency (EPA). (2012). Agriculture: demographics. Retrieved from http://www.epa.gov/agriculture/ag101/demographics.html
The Worldwatch Institute. (2008). State of the world: Innovations for a sustainable economy. (L. Starke, Ed.) (25th ed., p. 269). Washington DC: W. W. Norton & Company. Retrieved from http://www.worldwatch.org/files/pdf/State of the World 2008.pdf

130
Zepeda, L., & Li, J. (2006). Who Buys Local Food? Journal of Food Distribution Research, 5–15. Retrieved from http://ageconsearch.umn.edu/bitstream/7064/2/37030001.pdf

131
BIOGRAPHICAL SKETCH
Diane-Isis Nyob is a French engineering student participating in a dual-degree
program called “Atlantis”, which is a multi-disciplinary and mobile training in Europe and
in the USA. This program is funded by the European Union and offers the opportunity to
study the European and U.S. vision on rural development and its diversity of
approaches and applications. She has studied for one year International Rural
Development in Europe at Ghent University (Belgium) and at Agrocampus Ouest
(Rennes, France). She has spent one month in Tuscany in order to participate in a case
study about rural transitions organized by the University of Pisa. Then she has studied
Food and Resource Economics at the University of Florida and she has defended her
thesis in Marketing at this institution. She is interested in Innovation Management and
the various opportunities linking business and science.