Consumers of U.S. Commercial Electro-Optical ... - BIS Website
162
Source: U.S. Department of Commerce, Bureau of Industry and Security, Consumers of U.S. Commercial Electro-Optical Satellite Imagery, August 2013 Consumers of U.S. Commercial Electro-Optical (EO) Satellite Imagery August 2013
Transcript of Consumers of U.S. Commercial Electro-Optical ... - BIS Website

Source: U.S. Department of Commerce, Bureau of Industry and Security,
Consumers of U.S. Commercial Electro-Optical Satellite Imagery, August 2013
Consumers of U.S. Commercial
Electro-Optical (EO) Satellite Imagery
August 2013

Source: U.S. Department of Commerce, Bureau of Industry and Security,
Consumers of U.S. Commercial Electro-Optical Satellite Imagery, August 2013
Consumers of U.S. Commercial
Electro-Optical (EO) Satellite Imagery
U.S. Department of Commerce
Bureau of Industry and Security
Office of Technology Evaluation
August 2013
For further information about this report, contact:
David Boylan-Kolchin, Project Lead, Trade & Industry Analyst, (202) 482-7816
Anna Bruse, Trade & Industry Analyst, (202) 482-7418
Erika Maynard, Trade & Industry Analyst, (202) 482-5572
Matthew Sigmund, Trade & Industry Analyst, (202) 482-0634
Brad Botwin
Director, Industrial Base Studies
Phone: (202) 482-4060
Email: [email protected]
Fax: (202) 482-5361
http://www.bis.doc.gov/

Source: U.S. Department of Commerce, Bureau of Industry and Security,
Consumers of U.S. Commercial Electro-Optical Satellite Imagery, August 2013
Table of Contents
Chapter 1: Project Overview and Select Findings 2
Chapter 2: Survey Design and Respondent Profile 8
Chapter 3: Product & Service Areas 16
Chapter 4: Purchases of Imagery and Related Products and Services 28
Chapter 5: Net and Imagery-Related Sales 43
Chapter 6: Research & Development 56
Chapter 7: Capital Expenditures 68
Chapter 8: Employment 73
Chapter 9: Respondent Operations and Reactions to Industry Changes 79
Chapter 10: Additional Industry Comments 103
Chapter 11: Report Findings 107
Appendix A: BIS Survey Instrument 119
Appendix B: Full Scenario Impact Tables 142
Appendix C: U.S. Commercial EO Satellite Imagery Market Size Calculations 154
Appendix D: BIS Publications List 158
1

Source: U.S. Department of Commerce, Bureau of Industry and Security,
Consumers of U.S. Commercial Electro-Optical Satellite Imagery, August 2013
CHAPTER 1:
PROJECT OVERVIEW • PROJECT PARTNERS, GOALS, AND OBJECTIVES
• SELECT FINDINGS
2

Source: U.S. Department of Commerce, Bureau of Industry and Security,
Consumers of U.S. Commercial Electro-Optical Satellite Imagery, August 2013
Project Background
• The Bureau of Industry and Security’s (BIS) Office of Technology Evaluation (OTE)
partnered with the National Geospatial-Intelligence Agency (NGA) and the National
Oceanic and Atmospheric Administration (NOAA) to conduct an assessment of the
consumers of U.S. commercial electro-optical (EO) satellite imagery.
• The principal goal of this data collection and assessment was to evaluate the current
market behavior of these imagery consumers as well as providers of products,
technologies, and services facilitating the usage of that imagery based on a
constrained U.S. Defense Department budgetary environment.
• For purposes of this survey U.S. commercial EO satellite imagery was defined as:
• The portion of imagery collected by NOAA-licensed private remote sensing satellite
operators that is universally available to commercial customers with few or no
restrictions. This definition applies to "unenhanced data" as defined by statutory law, as
well as to products derived from unenhanced data that are intended for unrestricted
commercial sale.
3Chapter 1

Source: U.S. Department of Commerce, Bureau of Industry and Security,
Consumers of U.S. Commercial Electro-Optical Satellite Imagery, August 2013
Assessment Objectives
• Develop an understanding of the consumer organizations that participate in the U.S.
commercial EO satellite imagery industry.
• Document the characteristics, uses of imagery, and practices of users of commercial
satellite imagery, as well as of providers of enabling products and services.
• Benchmark trends in business practices and reliance on imagery by type of
organization.
• Analyze the impact of proposed Defense Department budget cutbacks and the
consolidation of U.S. EO satellite imagery providers on consumers of this imagery
and providers of enabling products, technologies, and services.
4Chapter 1

Source: U.S. Department of Commerce, Bureau of Industry and Security,
Consumers of U.S. Commercial Electro-Optical Satellite Imagery, August 2013
Select Findings
• The 98 BIS survey respondents represent a broad array of consumers of commercial EO satellite imagery and providers of enabling products, technologies and services. Respondents were grouped into four categories based on their primary area of business in the imagery industry: Imagery Resellers/Providers (14 organizations); Analysis and Related Tools (49); Engineering/Support Services (20); and Universities/Non-Profits (15).
• The majority of respondents did not purchase imagery themselves, but are nonetheless a significant part of the commercial EO satellite imagery industry, using imagery provided by clients or customers, or providing vital support services such as data management and engineering.
• Between 2008 and 2012, respondents reported having purchased $193.1 million worth of EO satellite imagery, a figure that BIS estimates represents up to one-third of the U.S. commercial EO satellite imagery market.
• Satellites being launched by other countries provide a new challenge to U.S. leadership in the commercial EO satellite imagery industry. The recently launched French-based Pléiades satellites, for example, provide imagery with resolutions that approach the current U.S. commercial limits of 0.5 meters.
• Respondents reported their imagery-related sales grew at a rapid pace between 2008 and 2012, rising 74%, to $1.2 billion annually. Total sales reported by respondents in 2012 were $15.9 billion.
5Chapter 1

Source: U.S. Department of Commerce, Bureau of Industry and Security,
Consumers of U.S. Commercial Electro-Optical Satellite Imagery, August 2013
Select Findings (continued)
• Imagery-related employment also expanded rapidly, from roughly 4,300 employees in 2008 to
7,600 in 2012, a 76% increase. Even the 23% of respondents reducing their overall employee
headcount over the period reported having increased imagery-related employment by 22%.
• When asked about the impact of the 2006 U.S. industry consolidation (from three to two EO
satellite operators), 18 respondents provided feedback, many of whom reported a positive effect in
areas such as sales revenue and participation in contracts, though often combined with increased
costs.
• Respondents were also asked to assess the potential impacts of two possible future scenarios.
The first of these—a sudden decrease in the number of U.S.-based commercial EO satellite
operators—has since come to pass with DigitalGlobe’s purchase of GeoEye.
• Many of the 69 respondents providing feedback were pessimistic about this scenario, predicting
decreases in revenue, number of product lines, and contract participation, and increases in costs
and lead times.
• Respondents expected even greater impacts from the second scenario, in which they would only
be able to purchase imagery from non-U.S.-based providers. 44% of these 67 respondents
expected a decrease in Quality of Imagery, and 47% predicted Decreased Sales Revenue.
6Chapter 1

Source: U.S. Department of Commerce, Bureau of Industry and Security,
Consumers of U.S. Commercial Electro-Optical Satellite Imagery, August 2013
Select Findings (continued)
• Imagery Resellers/Providers were most pessimistic of the four business categories on the
expected impacts of Scenario 2: 78% expected increased Lead Times, 70% expected decreased
Sales Revenue, and 67% expected decreased Quality of Imagery.
• Many respondents provided written feedback on the challenges facing consumers of commercial
EO satellite imagery, with the bulk of these comments focusing on three areas: a (then potential)
DigitalGlobe-GeoEye merger, U.S. government (USG) restrictions on sales, and uncertainty on
the role the USG would play in the industry’s future.
• Comments on the potential of a DigitalGlobe-GeoEye merger were almost universally negative.
Respondents noted such a merger would restrict the supply of imagery, result in decreased R&D
investments, and reduce the opportunities for sales.
• Several respondents commented that USG restrictions on sales of high resolution imagery and
satellites resulted in significant losses of sales and potential sales.
• Many respondents also expressed concern about the role of the USG in the EO satellite industry,
with uncertainty about the future of government financial support being a primary concern.
7Chapter 1

Source: U.S. Department of Commerce, Bureau of Industry and Security,
Consumers of U.S. Commercial Electro-Optical Satellite Imagery, August 2013
CHAPTER 2:
SURVEY DESIGN AND
RESPONDENT PROFILE • SURVEY AUTHORITY, DEVELOPMENT, AND DESIGN
• CATEGORIZATION OF RESPONDENTS
• PRIMARY METHODS OF ACQUIRING COMMERCIAL SATELLITE IMAGERY
8

Source: U.S. Department of Commerce, Bureau of Industry and Security,
Consumers of U.S. Commercial Electro-Optical Satellite Imagery, August 2013
Department of Commerce Survey and Assessment Authority
Defense Production Act of 1950, as amended (DPA) and Executive Order
13603 provide broad authority to analyze:
Economic health and competitiveness
Defense capabilities and readiness
Conduct surveys and assessments of industry and organizations
• Data Collection Authority under Section 705 of the DPA
• Surveys cleared by Office of Management and Budget under the Paperwork
Reduction Act
• Data is exempt from Freedom of Information Act (FOIA) requests
Enable industry and government agencies to:
Monitor trends and benchmark industry performance
Raise awareness of diminishing manufacturing and technological capabilities
• Assessments initiated for the Military Services, other Government Agencies,
Industry Associations, Congress, and other interested parties.
9Chapter 2

Source: U.S. Department of Commerce, Bureau of Industry and Security,
Consumers of U.S. Commercial Electro-Optical Satellite Imagery, August 2013
Survey Development Process
• Upon initiation of the assessment, the Bureau of Industry and Security (BIS)
undertook a number of steps to better understand the industry:
• Held discussions with industry groups—most notably the United States Geospatial
Intelligence Foundation (USGIF)—and government organizations (NOAA and NGA) that
are familiar with the industry.
• Conducted field visits with organizations that create and utilize commercial EO satellite
imagery. These organizations provided background support and technical guidance to
BIS.
• Additional information to support survey design, including development of an industry
mailing list and resolution of technical issues, was garnered from contact with commercial
imagery experts via telephone and email.
10Chapter 2

Source: U.S. Department of Commerce, Bureau of Industry and Security,
Consumers of U.S. Commercial Electro-Optical Satellite Imagery, August 2013
Survey Design and Data Collection
• Survey questions were designed to capture a snapshot in time of trends in sales, research and
development, capital expenditures, and employment for the 2008-2012 period.
• The survey also addressed broader topics such as commercial EO satellite imagery procurement
and applications, and the implications of USG programmatic budget scenarios on organizational
operations.
• BIS field tested the draft survey for accuracy and usability with a number of USG organizations
and commercial imagery users and providers of enabling products, technologies, and services.
• The aggregate data provides an effective tool for performing trend analyses necessary to inform
stakeholders on how U.S. commercial EO satellite imagery is being supported and utilized.
• In addition, the data assists our partner agencies in evaluating the size and market behavior of the
organizations that consume and enable the use of U.S. commercial EO satellite imagery.
• Data collected through the survey was supplemented with information gathered from site visits,
discussions with industry and government experts, participation in related conferences and
technical sessions, and analysis of publicly available data.
11Chapter 2

Source: U.S. Department of Commerce, Bureau of Industry and Security,
Consumers of U.S. Commercial Electro-Optical Satellite Imagery, August 2013
Consumers of U.S. Commercial Electro-Optical (EO) Satellite Imagery
• Stakeholders in the U.S. commercial EO satellite imagery market were contacted via
BIS survey for their input on the state of the industry and their perspective on the
impact of potential changes in the structure of the EO satellite imagery industry.
• Ninety-eight organizations responded, representing a broad array of imagery resellers
and users, and of providers of enabling products, technologies, and support services.
• Among the products, services, and technologies provided by consumers of EO
satellite imagery were:
• 3D Modeling
• Analytics Software
• Cameras
• Cloud Computing Services & Support
• Cyber Security/Encryption
• Data Storage
• Geographic Information Systems
• Light Detection and Ranging (LiDAR)
• Mission Ground Systems
• Mobile Wireless Networking
• Network Implementation & Infrastructure
• Optics
• Remote Sensing
• Unmanned Vehicles
• Visualization Software
• Many Others
12Chapter 2

Source: U.S. Department of Commerce, Bureau of Industry and Security,
Consumers of U.S. Commercial Electro-Optical Satellite Imagery, August 2013
Consumers of U.S. Commercial Electro-Optical (EO) Satellite
Imagery: Respondent Categorization
• The 98 survey respondents were classified
into four business categories based on
their primary business in the imagery
industry:
• Imagery Reseller/Provider
• Operators of EO satellites as well as organizations
that purchase imagery from these operators and
resell it.
• Analysis & Related Tools
• Organizations providing analysis, modeling, and
interpretation of imagery and related data, or software
for enabling these services.
• Engineering/Support Services
• Providers of satellite or ground system components
or technical services in support of these operations.
• University/Non-Profit
• Universities, Government Agencies, and
Organizations operating on a not-for-profit basis.
Imagery Reseller/
Provider, 14
Analysis & Related
Tools, 49
Engineering/Support
Services, 20
University/ Non-Profit,
15
Survey Respondents’ Primary Business Categories
98 respondents
13Chapter 2
Source: U.S. Department of Commerce, Bureau of Industry and Security,
Consumers of U.S. Commercial Electro-Optical Satellite Imagery, August 2013
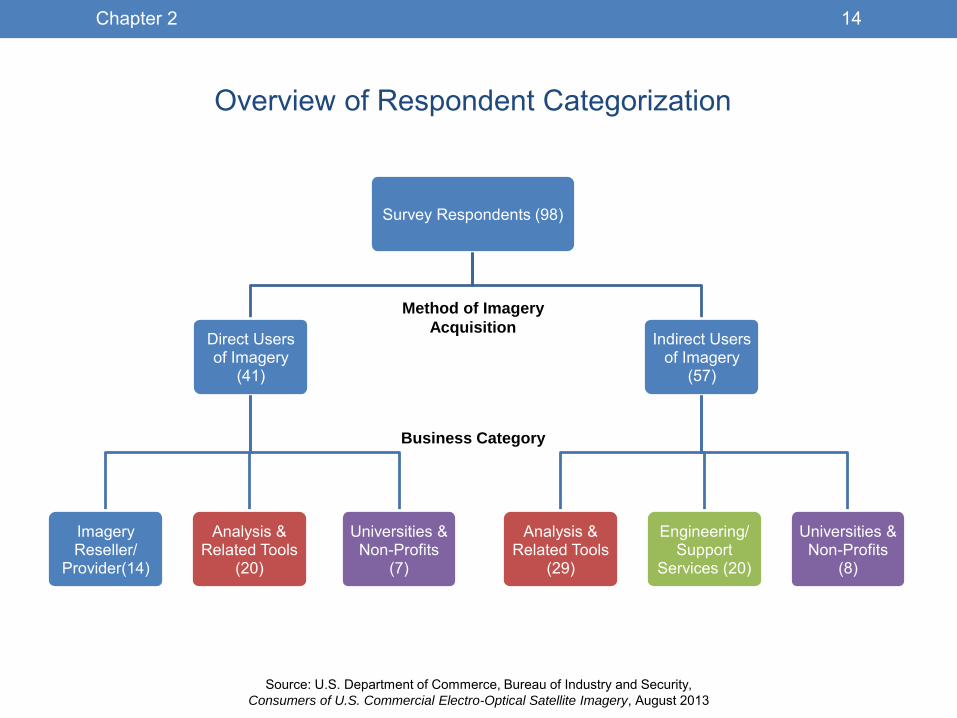
Overview of Respondent Categorization
Survey Respondents (98)
Direct Users of Imagery
(41)
Imagery Reseller/
Provider(14)
Analysis & Related Tools
(20)
Universities & Non-Profits
(7)
Indirect Users of Imagery
(57)
Analysis & Related Tools
(29)
Engineering/ Support
Services (20)
Universities & Non-Profits
(8)
Method of Imagery
Acquisition
Business Category
14Chapter 2

Source: U.S. Department of Commerce, Bureau of Industry and Security,
Consumers of U.S. Commercial Electro-Optical Satellite Imagery, August 2013
Primary Acquisition Method of Commercial EO Satellite Imagery
2008-2012
Respondents were also categorized
based on their primary relationship with
commercial satellite imagery:
• Primary Provider: Commercial EO satellite
operators.
• Direct: Respondents who generally receive
imagery directly from a primary provider.
• Indirect: Respondents who generally receive
imagery from a reseller of imagery.
• Provided by Client: Respondents who do not
purchase imagery, but instead use imagery
that is provided by their customers as part of
their contract.
• None: Over a quarter of the respondents do
not use imagery themselves, but provide
products, technologies, or services that are
used in the commercial EO imagery industry.
Primary Provider, 2
Direct Purchase/
Donation, 29
Indirect Purchase/
Donation, 13
Imagery Provided By
Client, 21
None; Industry
Support, 28
Respondents’ Primary Imagery Acquisition Method
98 respondents; 5 respondents did not identify their method of imagery
acquisition.
15Chapter 2
Source: U.S. Department of Commerce, Bureau of Industry and Security,
Consumers of U.S. Commercial Electro-Optical Satellite Imagery, August 2013
CHAPTER 3:
PRODUCT & SERVICE AREAS • TYPES OF PRODUCTS AND SERVICES PROVIDED
• BREAKDOWNS OF TOP AREAS PROVIDED, BY BUSINESS CATEGORY AND
CUSTOMER TYPE
16

Source: U.S. Department of Commerce, Bureau of Industry and Security,
Consumers of U.S. Commercial Electro-Optical Satellite Imagery, August 2013
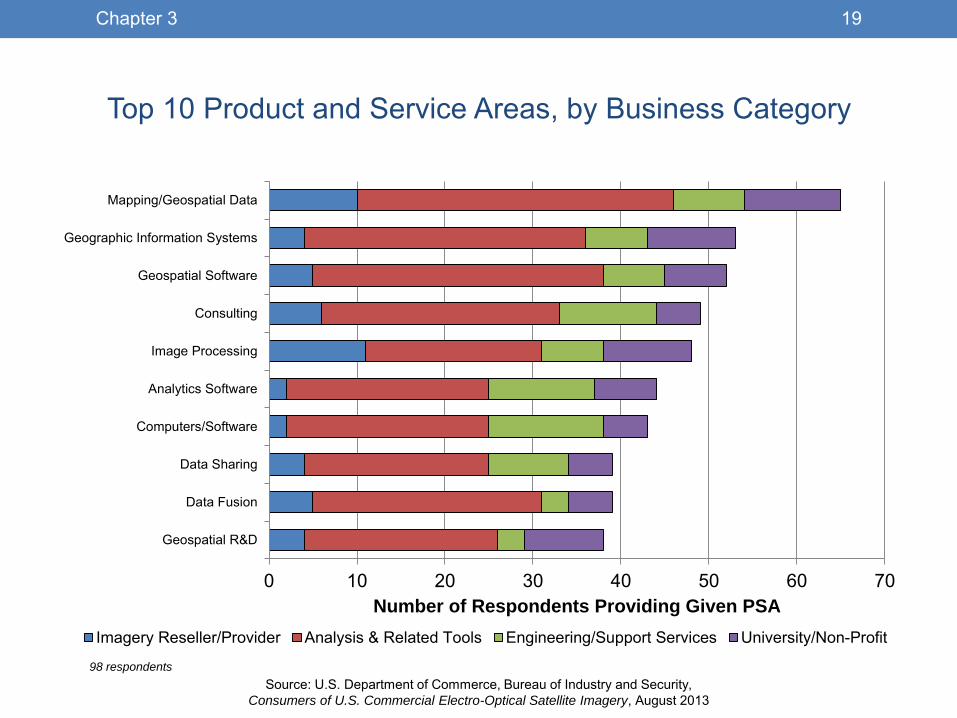
Product and Service Areas
• Respondents were provided with a list of 47 Product and Service Areas (PSAs) related
to commercial EO satellite imagery, and asked to select any PSAs in which they
participated between 2008 and 2012.
• The list of PSAs included areas directly related to commercial EO satellite imagery,
such as Geospatial Software and Image Processing, as well as supporting PSAs, like
Cloud Computing Services and Information Management.
• For each PSA, respondents could also indicate the type of customer they served: U.S.
Defense, U.S. Non-Defense Government, U.S. Commercial, Foreign
Government/Commercial, and Other.
• A full list of the 47 PSAs is provided in Section 3 of the BIS Survey Instrument, found in
Appendix A.
17Chapter 3

Source: U.S. Department of Commerce, Bureau of Industry and Security,
Consumers of U.S. Commercial Electro-Optical Satellite Imagery, August 2013
Product and Service Areas (continued)
• Respondents participated in an average of 13 PSAs, with some respondents
participating in as many as 40.
• Each PSA was identified by at least four respondents, with all but three PSAs having 10
or more respondents indicating participation.
• The PSAs provided by the greatest number of respondents were related to imagery
data and analysis, with the top three being:
• Mapping/Geospatial Data
• Geographic Information Systems
• Geospatial Software
• The PSAs provided by the fewest respondents tended to be related to manufactured
products:
• Display Hardware
• Optics
• Cameras
18Chapter 3
Source: U.S. Department of Commerce, Bureau of Industry and Security,
Consumers of U.S. Commercial Electro-Optical Satellite Imagery, August 2013
Top 10 Product and Service Areas, by Business Category
0 10 20 30 40 50 60 70
Geospatial R&D
Data Fusion
Data Sharing
Computers/Software
Analytics Software
Image Processing
Consulting
Geospatial Software
Geographic Information Systems
Mapping/Geospatial Data
Number of Respondents Providing Given PSA
Imagery Reseller/Provider Analysis & Related Tools Engineering/Support Services University/Non-Profit
98 respondents
19Chapter 3

Source: U.S. Department of Commerce, Bureau of Industry and Security,
Consumers of U.S. Commercial Electro-Optical Satellite Imagery, August 2013
Top 10 PSAs Provided by Imagery Reseller/Provider Respondents
0 5 10 15
Data Fusion
Simulation
Consulting
Remote Sensing
3D Modeling
Multi-Sensor Data Collection
Mapping/Geospatial Data
Aerial Imaging
Image Processing
Imagery Provider
Number of Imagery Resellers/Providers
14 respondents
20Chapter 3

Source: U.S. Department of Commerce, Bureau of Industry and Security,
Consumers of U.S. Commercial Electro-Optical Satellite Imagery, August 2013
Top 10 PSAs Provided by Analysis & Related Tools Respondents
0 10 20 30 40 50
Visualization Software
Data Sharing
Geospatial R&D
Computers/Software
Analytics Software
Data Fusion
Consulting
Geographic Information Systems
Geospatial Software
Mapping/Geospatial Data
Number of Analysis & Related Tools Providers
49 respondents
21Chapter 3
Source: U.S. Department of Commerce, Bureau of Industry and Security,
Consumers of U.S. Commercial Electro-Optical Satellite Imagery, August 2013
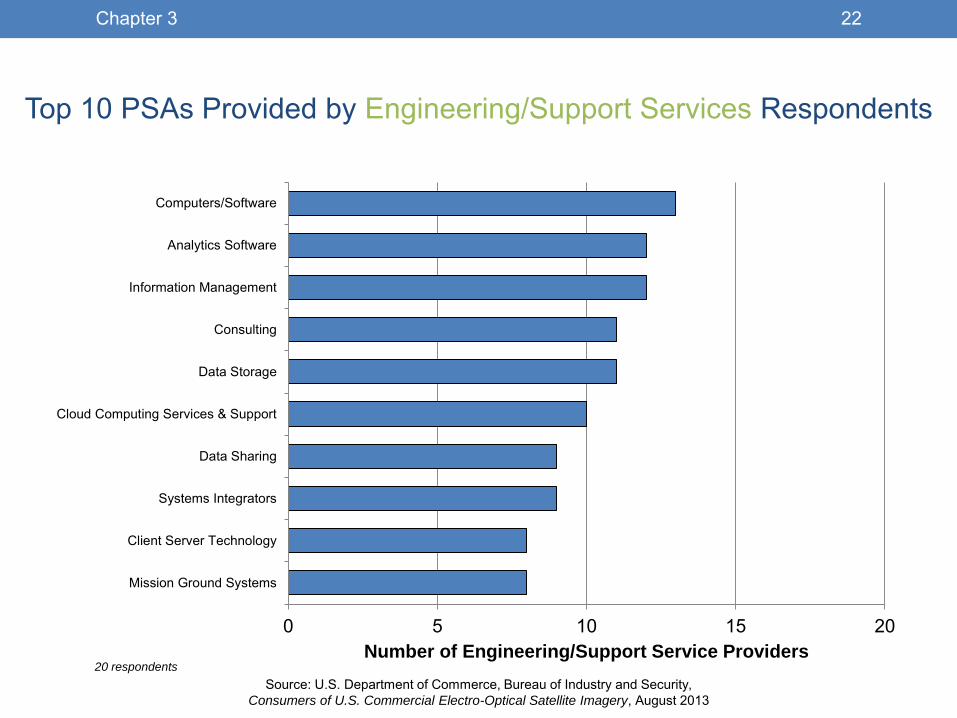
Top 10 PSAs Provided by Engineering/Support Services Respondents
0 5 10 15 20
Mission Ground Systems
Client Server Technology
Systems Integrators
Data Sharing
Cloud Computing Services & Support
Data Storage
Consulting
Information Management
Analytics Software
Computers/Software
Number of Engineering/Support Service Providers 20 respondents
22Chapter 3

Source: U.S. Department of Commerce, Bureau of Industry and Security,
Consumers of U.S. Commercial Electro-Optical Satellite Imagery, August 2013
Top 10 PSAs Provided by University/Non-Profit Respondents
0 5 10 15
Application Delivery
Modeling
Geospatial Software
Analytics Software
Remote Sensing
Geospatial R&D
Geographic Information Systems
Image Processing
Education & Training
Mapping/Geospatial Data
Number of University/Non-Profit Providers 15 respondents
23Chapter 3

Source: U.S. Department of Commerce, Bureau of Industry and Security,
Consumers of U.S. Commercial Electro-Optical Satellite Imagery, August 2013
Top PSAs Provided to U.S. Government Defense Customers*
0% 20% 40% 60% 80% 100%
Geospatial R&D (38)
Data Sharing (39)
Storage & Server Technology (33)
Video Analysis (11)
Open Source Intelligence (20)
Synthetic Aperture Radar (16)
Intelligence Support Systems (28)
Systems Integrators (28)
Storage Optimization (15)
Unmanned Vehicles (12)
Percent of Respondents with U.S. Defense Customer(s)
*minimum 10 participants, total respondents participating in each PSA in parentheses
98 respondents
24Chapter 3

Source: U.S. Department of Commerce, Bureau of Industry and Security,
Consumers of U.S. Commercial Electro-Optical Satellite Imagery, August 2013
Top PSAs Provided to U.S. Government Non-Defense Customers*
0% 20% 40% 60% 80% 100%
Geospatial Software (52)
Geographic Information Systems (53)
Remote Sensing (37)
Mapping/Geospatial Data (65)
Collaborative Tools (30)
Visualization Software (33)
Client Server Technology (31)
Mobile Wireless Networking (10)
Imagery Provider (29)
Location Based Services (21)
Percent of Respondents with U.S. Government Non-Defense Customers
98 respondents
*minimum 10 participants, total respondents participating in each PSA in parentheses
25Chapter 3

Source: U.S. Department of Commerce, Bureau of Industry and Security,
Consumers of U.S. Commercial Electro-Optical Satellite Imagery, August 2013
Top PSAs Provided to U.S. Non-Government Commercial Customers*
0% 20% 40% 60% 80% 100%
Geospatial Software (33)
Visualization Software (21)
Mapping/Geospatial Data (42)
Modeling (19)
3D Modeling (21)
Geospatial R&D (25)
Location Based Services (14)
Simulation (17)
Remote Sensing (27)
Imagery Provider (24)
Percent of Respondents with U.S. Commercial Customers
98 respondents
*minimum 10 participants, total respondents participating in each PSA in parentheses
26Chapter 3

Source: U.S. Department of Commerce, Bureau of Industry and Security,
Consumers of U.S. Commercial Electro-Optical Satellite Imagery, August 2013
Top PSAs Provided to Foreign Customers*
0% 20% 40% 60% 80% 100%
Consulting (49)
Image Processing (48)
Geographic Information Systems (53)
Remote Sensing (37)
Location Based Services (21)
3D Modeling (32)
Computers/Hardware (11)
Media (10)
Mobile Wireless Networking (10)
Imagery Provider (29)
Percent of Respondents with Foreign Customers
98 respondents
*minimum 10 participants, total respondents participating in each PSA in parentheses
27Chapter 3

Source: U.S. Department of Commerce, Bureau of Industry and Security,
Consumers of U.S. Commercial Electro-Optical Satellite Imagery, August 2013
CHAPTER 4:
PURCHASES OF IMAGERY
AND RELATED PRODUCTS
AND SERVICES • PURCHASES OF COMMERCIAL EO SATELLITE IMAGERY BY VALUE
AND BY AREA
• PURCHASES OF PRODUCTS, TECHNOLOGIES, AND SERVICES RELATED
TO SATELLITE IMAGERY
• DONATIONS OF IMAGERY
28

Source: U.S. Department of Commerce, Bureau of Industry and Security,
Consumers of U.S. Commercial Electro-Optical Satellite Imagery, August 2013
Commercial Imagery Purchases
• Respondents were asked to identify the value of commercial EO satellite imagery they
purchased in each year, both directly and indirectly.
• Thirty-eight respondents identified the value of imagery purchased between 2008 and
2012, 32 of whom purchased imagery directly.
• The remaining 60 indicated that their organization had not purchased satellite imagery
during the five year period, or were unable to provide a value.
• Based on publicly available data, respondents to this survey represent an estimated
33% of the commercial EO satellite imagery market.*
*See Appendix C for details
29Chapter 4

Source: U.S. Department of Commerce, Bureau of Industry and Security,
Consumers of U.S. Commercial Electro-Optical Satellite Imagery, August 2013
Commercial Imagery Purchases
• Respondents not purchasing imagery were still participants in the industry, either through their
provision of services to others or the use of imagery provided at no direct cost to their
organization. Several of these respondents provided comments on their interactions with imagery:
• “[Imagery] is Government Furnished Information to complete contractual engineering and analysis services.” –
Engineering/Support Services, imagery-related products account for 9% of sales
• “Imagery … is provided [to us] by NGA under contract to produce products for them.” – Engineering/Support
Services, imagery-related products account for 4% of sales
• “We provide engineering services … to assist in the development and integration of … satellite ground
systems.” – Engineering/Support Services, imagery-related products account for 15% of sales
• “[We use] existing imagery and GIS resources our customers acquire to support enhanced visualization and
collaboration capabilities.” – Engineering/Support Services, imagery-related products account for 95% of sales
• “All our activity using commercial imagery is performed by personnel working at U.S. Government worksites …
All of our materials are sourced through the normal U.S. Government process. Therefore our company makes
no acquisitions – directly or indirectly – of commercial imagery.” – University/Non-Profit
• “DigitalGlobe and GeoEye are primary suppliers to NGA, which in turn utilizes [our] services. [We do not]
directly utilize this imagery.” – Analysis & Related Tools, imagery-related products account for 2% of sales
30Chapter 4

Source: U.S. Department of Commerce, Bureau of Industry and Security,
Consumers of U.S. Commercial Electro-Optical Satellite Imagery, August 2013
Respondent Purchases of Imagery by Business Category
2008-2012
3
29
20
8
11
20
0
7
3020100102030
Number of Respondents
Did Not Purchase Imagery Purchased Imagery98 respondents
Imagery Reseller/Provider
Analysis & Related Tools
Engineering/Support Services
University/Non-Profit
31Chapter 4

Source: U.S. Department of Commerce, Bureau of Industry and Security,
Consumers of U.S. Commercial Electro-Optical Satellite Imagery, August 2013
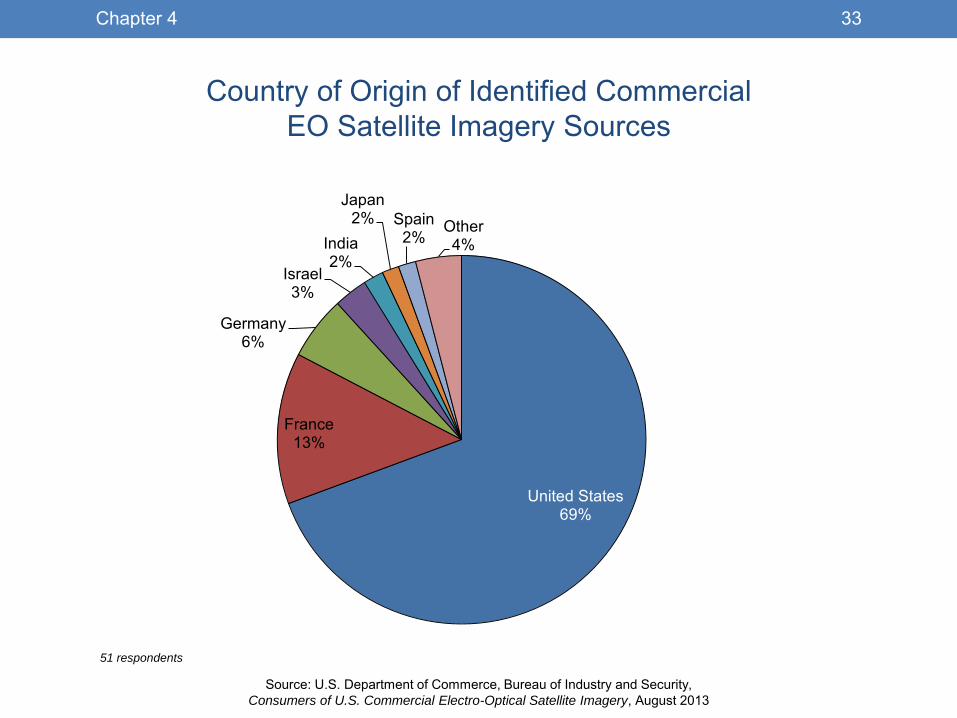
Origins of Commercial EO Satellite Imagery, 2008-2012
• Roughly half (51) of the respondents were able to identify the names of the satellites or
family of satellites from which they received imagery.
• Among those who were able to name satellites, the average number of satellites from
which they received imagery was approximately six.
• Respondents identified 25 families of satellites from which they received imagery, several
of which were non-commercial and non-optical.
• Imagery from DigitalGlobe and GeoEye accounted for over half of all identifications,
followed by Spot Image, a subsidiary of EADS-Astrium and the distributor for imagery from
a number of European satellites.
• Fourteen countries of origin were identified, with the U.S., France, and Germany
accounting for 88% of identifications.
32Chapter 4
Source: U.S. Department of Commerce, Bureau of Industry and Security,
Consumers of U.S. Commercial Electro-Optical Satellite Imagery, August 2013
Country of Origin of Identified Commercial
EO Satellite Imagery Sources
United States 69%
France 13%
Germany 6%
Israel 3%
India 2%
Japan 2% Spain
2% Other 4%
51 respondents
33Chapter 4

Source: U.S. Department of Commerce, Bureau of Industry and Security,
Consumers of U.S. Commercial Electro-Optical Satellite Imagery, August 2013
Value of Commercial EO Satellite Imagery Purchased
• Respondents identified a total of $193.1 million in imagery purchases between 2008
and 2012, $145.1 of which was purchased directly from satellite operators.
• Purchases by survey respondents peaked at $53.9 million in 2010, though the
estimated size of the U.S. commercial satellite imagery market continued to grow.*
• This difference in trends is likely due in large part to the subset of market participants
represented in this survey. Based on publicly reported commercial sales of DigitalGlobe
and GeoEye—the dominant U.S. commercial satellite imagery providers—the
organizations covered in this study represent approximately 33% of the U.S.
commercial EO satellite imagery market.*
• DigitalGlobe and GeoEye provided the vast majority of identified imagery purchases,
with Spot Image—a subsidiary of EADS-Astrium and the distributor of imagery for the
Pléiades and SPOT 5 satellites—also noted as a provider.
• The two Pléiades satellites were launched in 2011 and 2012, and provide a resolution
that approaches that of commercially available U.S. EO satellite imagery.
*See Appendix C for details
34Chapter 4

Source: U.S. Department of Commerce, Bureau of Industry and Security,
Consumers of U.S. Commercial Electro-Optical Satellite Imagery, August 2013
Sales of Primary Providers of U.S. Commercial EO Satellite
Imagery and Reported Imagery Purchases, 2008-2012
$16
$25
$43
$34
$27
$8 $8
$11 $13 $8
$47
$40
$59
$69
$82
$0
$10
$20
$30
$40
$50
$60
$70
$80
$90
2008 2009 2010 2011 2012
Mil
lio
ns
of
Do
lla
rs
38 respondents
Reported Direct
Commercial Imagery
Purchases
Reported Indirect
Commercial Imagery
Purchases
Estimated U.S. Commercial
Imagery Sales of EO
Satellite Operators*
*Based on publicly available SEC Form 10-K disclosures of commercial imagery sales, details in Appendix C.
35Chapter 4

Source: U.S. Department of Commerce, Bureau of Industry and Security,
Consumers of U.S. Commercial Electro-Optical Satellite Imagery, August 2013
Average Value of U.S. Commercial EO Satellite Imagery
Purchases by Business Category, 2008-2012
0
5
10
15
20
25
Under $100,000 $100,000-$500,000 $500,000-$1 million Over $1 million
Nu
mb
er
of
Re
sp
on
de
nts
Average Annual Imagery Purchases
Analysis & Related Tools Imagery Provider/Reseller University/Non-Profit
38 respondents; Engineering/Support Service providers reported no imagery purchases
36Chapter 4

Source: U.S. Department of Commerce, Bureau of Industry and Security,
Consumers of U.S. Commercial Electro-Optical Satellite Imagery, August 2013
Commercial EO Satellite Imagery Purchases Identified by Size
• Respondents were also asked to quantify
the amount of imagery they purchased
between 2008 and 2012 in square
kilometers.
• Seventeen of the 38 respondents with
imagery purchases provided the amount
of imagery they purchased between 2008
and 2012 in square kilometers (km).
• The average area purchased by a
respondent between 2008 and 2012 was
17.3 million square km
• The median area purchased was 95.7
thousand square km
• Five respondents purchased over one million
square km, with two purchasing over 10
million square km
University/Non-Profit,
2
Imagery Reseller/
Provider, 8
Analysis & Related Tools, 7
Respondents Purchasing Imagery By Size of Coverage Area, 2008-2012
17 respondents reporting amount of imagery purchased in square kilometers.
37Chapter 4

Source: U.S. Department of Commerce, Bureau of Industry and Security,
Consumers of U.S. Commercial Electro-Optical Satellite Imagery, August 2013
Quantity of Commercial EO Satellite Imagery
Purchased Identified by Size, 2008-2012*
0
10
20
30
40
50
60
70
80
90
2008 2009 2010 2011 2012
Qu
an
tity
of
Ima
gery
(in
mil
lio
ns
of
sq
uare
km
)
Imagery Reseller/Provider Analysis & Related Tools University/Non-Profit
17 respondents
*Engineering/Support Service providers reported no imagery purchases. Universities/Non-Profits reported purchasing well under 1 million square km.
38Chapter 4

Source: U.S. Department of Commerce, Bureau of Industry and Security,
Consumers of U.S. Commercial Electro-Optical Satellite Imagery, August 2013
Purchases of Imagery-Related Products,
Technologies, and Services
• Seventeen respondents provided the
value of commercial EO satellite
imagery-related products or services they
purchased between 2008 and 2012.
• The average value purchased by a
respondent during this period was $7
million.
• The median value purchased was $414,000
• Four respondents accounted for 91.5% of
the reported value of imagery-related
products and services purchased.
University/ Non-Profit, 1
Imagery Reseller/
Provider, 6
Analysis & Related Tools, 8
Engineering/ Support
Services, 2
Respondents Purchasing Imagery-Related Products, Technologies, and
Services, by Business Category
17 respondents
39Chapter 4

Source: U.S. Department of Commerce, Bureau of Industry and Security,
Consumers of U.S. Commercial Electro-Optical Satellite Imagery, August 2013
Value of Imagery-Related Products and Services
Purchased by Business Category, 2008-2012
$0
$5
$10
$15
$20
$25
$30
$35
$40
$45
$50
2008 2009 2010 2011 2012
Va
lue
of
Pro
du
cts
an
d S
erv
ice
s (
in M
illi
on
s)
Imagery Reseller/Provider Analysis & Related Tools Engineering/Support Services University/Non-Profit*
17 respondents
*Universities/Non-Profits reported under $1 million in purchases.
40Chapter 4

Source: U.S. Department of Commerce, Bureau of Industry and Security,
Consumers of U.S. Commercial Electro-Optical Satellite Imagery, August 2013
Donations of Commercial EO Satellite Imagery, 2008-2012
• Respondents were asked if they received any donated U.S. commercial EO satellite
imagery between 2008 and 2012.
• Fourteen organizations received donated commercial EO satellite imagery during the
period, valued at a total of $10.3 million.
• Most (nine) of these organizations were Universities or Non-Profits, but they accounted
for just 30% of the value donated during the period, $3.1 million.
• Donations to for-profit respondents were generally for promotional purposes, with one
respondent noting donations were used “to build value-added products in order to
promote these products to specific customers and/or to use for tradeshows and
evaluation samples.”
• The value of donated imagery received fell sharply between 2010 and 2011, by over
85% (from $4.1 million to $490,000), with donations falling from all sources.
41Chapter 4

Source: U.S. Department of Commerce, Bureau of Industry and Security,
Consumers of U.S. Commercial Electro-Optical Satellite Imagery, August 2013
Did Not Receive Donated Imagery, 84
University/ Non-Profit, 9
Imagery Reseller/ Provider, 1
Analysis & Related Tools, 3
Engineering/ Support Services, 1
Received Donated
Imagery, 14
Received Donations of Commercial EO Satellite Imagery by Business Category, 2008-2012
98 respondents
42Chapter 4

Source: U.S. Department of Commerce, Bureau of Industry and Security,
Consumers of U.S. Commercial Electro-Optical Satellite Imagery, August 2013
CHAPTER 5:
NET AND IMAGERY-RELATED
SALES • NET SALES BY YEAR
• IMAGERY RELATED SALES BY YEAR
• BREAKDOWN OF SALES BY BUSINESS CATEGORY
• PRODUCT AND SERVICE AREAS OF FASTEST AND SLOWEST
GROWING RESPONDENTS
43
Source: U.S. Department of Commerce, Bureau of Industry and Security,
Consumers of U.S. Commercial Electro-Optical Satellite Imagery, August 2013
Respondent Net and Imagery-Related Sales
• Respondents reported their net sales by year for the 2008-2012 period, as well as the
percent of net sales related to commercial EO satellite imagery.
• Imagery-related sales accounted for roughly 7% of net sales, with both measures rising
steadily across the period.*
• Most respondents were not heavily reliant on imagery, with just 14 respondents having
imagery-related sales account for over half of total sales, and 21 respondents with
imagery-related sales of over one-quarter of total sales.
• Eighteen respondents had no sales between 2008 and 2012 or did not provide sales
data, and 34 respondents reported no imagery-related sales in that period.
• Those with no sales were mostly Universities and Non-Profits. Additionally, 10% of
Analysis & Related Tools and Engineering/Support Service providers also reported no
sales.
*Excludes one very large respondent whose sales data would have skewed results due to their size. The vast majority of this respondent’s sales were not
imagery-related.
44Chapter 5
Source: U.S. Department of Commerce, Bureau of Industry and Security,
Consumers of U.S. Commercial Electro-Optical Satellite Imagery, August 2013
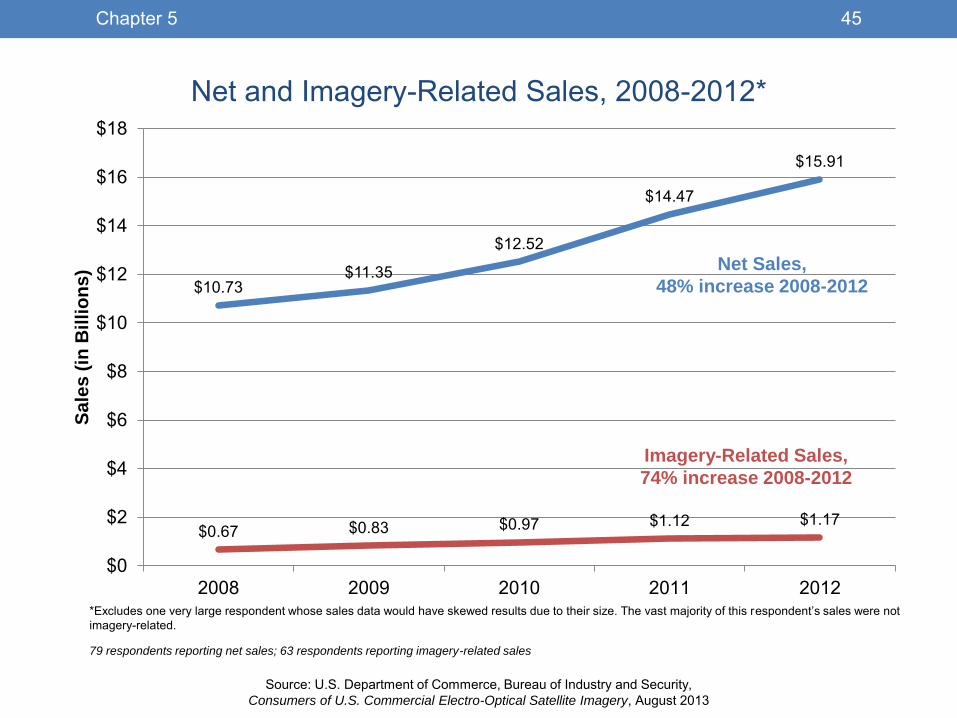
$10.73 $11.35
$12.52
$14.47
$15.91
$0.67 $0.83 $0.97 $1.12 $1.17
$0
$2
$4
$6
$8
$10
$12
$14
$16
$18
2008 2009 2010 2011 2012
Sa
les
(in
Bil
lio
ns
) Net and Imagery-Related Sales, 2008-2012*
*Excludes one very large respondent whose sales data would have skewed results due to their size. The vast majority of this respondent’s sales were not
imagery-related.
Imagery-Related Sales,
74% increase 2008-2012
Net Sales,
48% increase 2008-2012
79 respondents reporting net sales; 63 respondents reporting imagery-related sales
45Chapter 5

Source: U.S. Department of Commerce, Bureau of Industry and Security,
Consumers of U.S. Commercial Electro-Optical Satellite Imagery, August 2013
$1.5 $1.6 $2.0 $2.2 $2.3
$0.7 $1.0 $0.9
$1.2 $1.3
$8.5 $8.7
$9.5
$11.0
$12.3
$0.1 $0.1 $0.1 $0.1 $0.1
$0
$2
$4
$6
$8
$10
$12
$14
2008 2009 2010 2011 2012
Sa
les
(in
Bil
lio
ns
) Net Sales by Business Category, 2008-2012*
Imagery Provider/Reseller Analysis & Related Tools Engineering/Support Services University/Non-Profit
*Excludes one very large respondent whose sales data would have skewed results due to their size. The vast majority of this respondent’s sales were not
imagery-related.
79 respondents reporting net sales
46Chapter 5

Source: U.S. Department of Commerce, Bureau of Industry and Security,
Consumers of U.S. Commercial Electro-Optical Satellite Imagery, August 2013
$416.3
$547.8
$670.4 $679.2
$741.1
$97.5 $127.7 $137.9 $126.2
$158.1 $140.9
$175.4
$305.1 $304.3
$0.1 $0.1 $0.1 $0.0
$0.1
$0
$100
$200
$300
$400
$500
$600
$700
$800
2008 2009 2010 2011 2012
Sa
les
(in
Mil
lio
ns
)
Imagery-Related Sales by Business Category 2008-2012*
Imagery Reseller/Provider Analysis & Related Tools Engineering/Support Services University/Non-Profit
*Excludes one very large respondent whose sales data would have skewed results due to their size. The vast majority of this respondent’s sales were not
imagery-related.
63 respondents reporting imagery-related sales
47Chapter 5

Source: U.S. Department of Commerce, Bureau of Industry and Security,
Consumers of U.S. Commercial Electro-Optical Satellite Imagery, August 2013
78.0%
29.5%
92.5%
49.4%
-100%
-80%
-60%
-40%
-20%
0%
20%
40%
60%
80%
100%
120%
2008 2009 2010 2011 2012
Cu
mu
lati
ve
Sa
les
Gro
wth
Imagery-Related Sales Growth by Business Category, 2008-2012*
Imagery Reseller/Provider Analysis & Related Tools Engineering/Support Services University/Non-Profit
*Excludes one very large respondent whose sales data would have skewed results due to their size. The vast majority of this respondent’s sales were not
imagery-related.
63 respondents reporting imagery-related sales
48Chapter 5

Source: U.S. Department of Commerce, Bureau of Industry and Security,
Consumers of U.S. Commercial Electro-Optical Satellite Imagery, August 2013
0%
1%
2%
3%
4%
5%
6%
7%
8%
9%
2008 2009 2010 2011 2012
Ima
ge
ry-R
ela
ted
Sa
les
as
a
Pe
rce
nt
of
All
Ne
t S
ale
s
Imagery-Related Sales as Percent of All Net Sales 2008-2012*
Imagery Reseller/Provider Analysis & Related Tools Engineering/Support Services University/Non-Profit***Excludes one very large respondent whose sales data would have skewed results due to their size. The vast majority of this respondent’s sales were not imagery-
related.
**University/Non-Profit imagery-related sales are below 0.1% of total net sales.
79 respondents reporting net sales; 63 respondents reporting imagery-related sales
49Chapter 5

Source: U.S. Department of Commerce, Bureau of Industry and Security,
Consumers of U.S. Commercial Electro-Optical Satellite Imagery, August 2013
0%
5%
10%
15%
20%
25%
30%
35%
40%
2008 2009 2010 2011 2012
Imag
ery
-Rela
ted
Sale
s a
s P
erc
en
t
of
Ne
t S
ale
s o
f B
us
ine
ss
Ca
teg
ory
Imagery-Related Sales as a Percent of Net Sales
of Business Category, 2008-2012
Imagery Reseller/Provider Analysis & Related Tools Engineering/Support Services University/Non-Profit
*Excludes one very large respondent whose sales data would have skewed results due to their size. The vast majority of this respondent’s sales were not
imagery-related.
79 respondents reporting net sales; 63 respondents reporting imagery-related sales
50Chapter 5

Source: U.S. Department of Commerce, Bureau of Industry and Security,
Consumers of U.S. Commercial Electro-Optical Satellite Imagery, August 2013
0
5
10
15
20
25
30
35
No Sales $1-$1M $1M - $10M $10M-$25M $25M-100M $100M - $1B Over $1B
Nu
mb
er
of
Re
sp
on
de
nts
Average Annual Net Sales, 2008-2012
Distribution of Average Annual Net Sales, by Business Category, 2008-2012
Imagery Provider/Reseller Analysis & Related Tools Engineering/Support Services University/Non-Profit
80 respondents reporting net sales
51Chapter 5
Source: U.S. Department of Commerce, Bureau of Industry and Security,
Consumers of U.S. Commercial Electro-Optical Satellite Imagery, August 2013
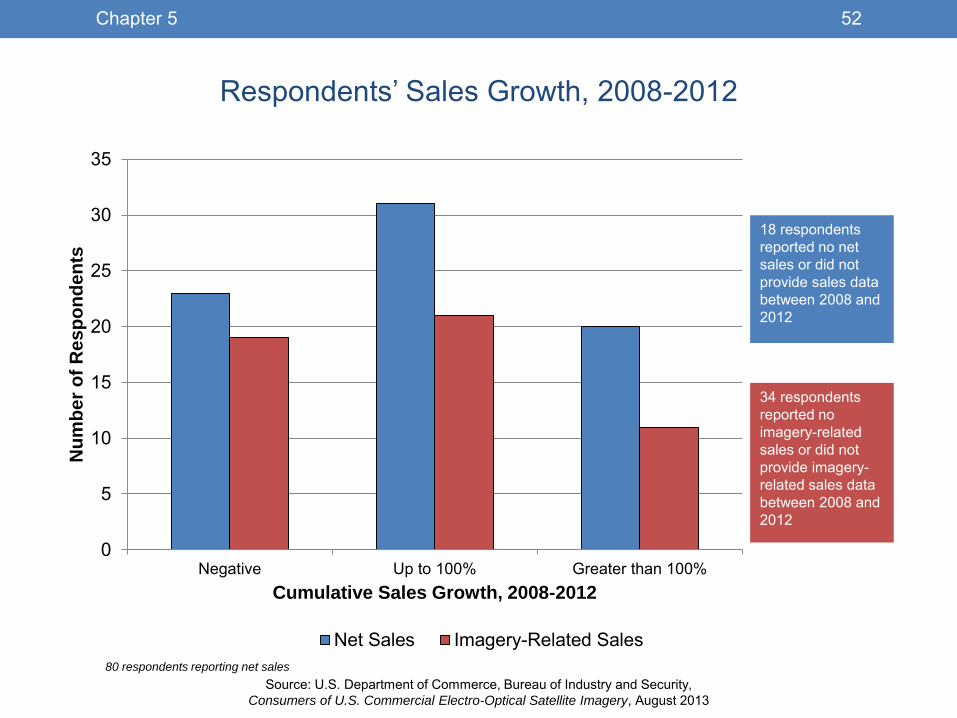
0
5
10
15
20
25
30
35
Negative Up to 100% Greater than 100%
Nu
mb
er
of
Re
sp
on
de
nts
Cumulative Sales Growth, 2008-2012
Respondents’ Sales Growth, 2008-2012
Net Sales Imagery-Related Sales
18 respondents
reported no net
sales or did not
provide sales data
between 2008 and
2012
34 respondents
reported no
imagery-related
sales or did not
provide imagery-
related sales data
between 2008 and
2012
80 respondents reporting net sales
52Chapter 5

Source: U.S. Department of Commerce, Bureau of Industry and Security,
Consumers of U.S. Commercial Electro-Optical Satellite Imagery, August 2013
Imagery Reseller/Provider Analysis & Related Tools Engineering/Support Services University/Non-Profit0%
10%
20%
30%
40%
50%
60%
70%
80%
90%
100%
Primary Business Category
Pe
rce
nt
of
Re
sp
on
de
nts
in
Bu
sin
es
s C
ate
go
ry
Respondents Reporting No Sales or No Imagery-Related Sales, 2008-2012*
Total Sales Imagery-Related Sales
*18 respondents reported no net sales for the 2008-2012 period or did not provide sales data, and 34 respondents reported no imagery-related sales.
53Chapter 5

Source: U.S. Department of Commerce, Bureau of Industry and Security,
Consumers of U.S. Commercial Electro-Optical Satellite Imagery, August 2013
PSAs of Fastest Growing Respondents, 2008-2012*
Product and Service Area Cumulative Net Sales
Growth of Participants
Total Respondents in
Product and Service Area
Mobile Wireless Networking 112% 10
Imagery Provider (Primary or Secondary) 96% 29
Intelligence Support Systems 86% 28
Synthetic Aperture Radar 81% 16
Geospatial Software 79% 52
Geographic Information Systems 79% 53
Mapping/Geospatial Data 79% 65
Storage & Server Technology 78% 15
Consulting 61% 49
Information Management 61% 31
*Growth is based on sales of all respondents participating in the given product/service area, NOT sales growth only in that area.
80 respondents reporting net sales
54Chapter 5

Source: U.S. Department of Commerce, Bureau of Industry and Security,
Consumers of U.S. Commercial Electro-Optical Satellite Imagery, August 2013
PSAs of Slowest Growing Respondents, 2008-2012*
Product and Service Area Cumulative Net Sales
Growth of Participants
Total Respondents in
Product and Service Area
Display Hardware -19% 4
Optics 6% 5
Collaborative Tools 13% 30
Remote Sensing 13% 37
Analytics Software 13% 44
Storage Optimization 16% 11
Client Server Technology 17% 31
Aerial Imaging 18% 37
Image Processing 18% 48
Data Sharing 19% 39
*Growth is based on sales of all respondents participating in the given product/service area, NOT sales growth only in that area.
80 respondents reporting net sales
55Chapter 5

Source: U.S. Department of Commerce, Bureau of Industry and Security,
Consumers of U.S. Commercial Electro-Optical Satellite Imagery, August 2013
CHAPTER 6:
RESEARCH & DEVELOPMENT • TOTAL R&D BY YEAR
• IMAGERY-RELATED R&D BY YEAR
• PRODUCT AND SERVICE AREAS WITH THE MOST AND FEWEST
RESPONDENTS PERFORMING R&D
56
Source: U.S. Department of Commerce, Bureau of Industry and Security,
Consumers of U.S. Commercial Electro-Optical Satellite Imagery, August 2013
Research & Development (R&D)
• Respondents reported their total R&D expenditures by year for the 2008-2012 period, as well as the
percent of R&D related to commercial EO satellite imagery each year.
• Fifty-five percent of respondents had R&D expenditures between 2008 and 2012, and 37% reported
imagery-related R&D expenditures.
• Universities and Non-Profits reported the highest dollar expenditures on imagery-related R&D,
though it was a small share of their overall R&D expenditures.
• Ten percent of respondents devoted more than half of their total R&D expenditures to imagery-
related R&D.
• The percent of respondents performing R&D rose steadily across the period for both total and
imagery-related R&D, and rose among all business categories.
57Chapter 6

Source: U.S. Department of Commerce, Bureau of Industry and Security,
Consumers of U.S. Commercial Electro-Optical Satellite Imagery, August 2013
Respondents Performing R&D, 2008-2012
Conducted Imagery-Related
R&D, 36
Conducted R&D, but none related to imagery, 18
Did not Conduct R&D, 44
98 respondents
Most of the R&D
expenditures of these 36
respondents were focused
on R&D not directly related
to imagery.
Overall, imagery-related
R&D expenditures
accounted for
approximately 1% of total
R&D expenditures.
58Chapter 6

Source: U.S. Department of Commerce, Bureau of Industry and Security,
Consumers of U.S. Commercial Electro-Optical Satellite Imagery, August 2013
0%
10%
20%
30%
40%
50%
60%
2008 2009 2010 2011 2012
Pe
rce
nt
of
Re
sp
on
de
nts
wit
h R
&D
Ex
pe
nd
itu
res
Percent of Respondents With R&D Expenditures,
2008-2012
Total R&D Imagery-Related R&D
98 respondents
59Chapter 6
Source: U.S. Department of Commerce, Bureau of Industry and Security,
Consumers of U.S. Commercial Electro-Optical Satellite Imagery, August 2013
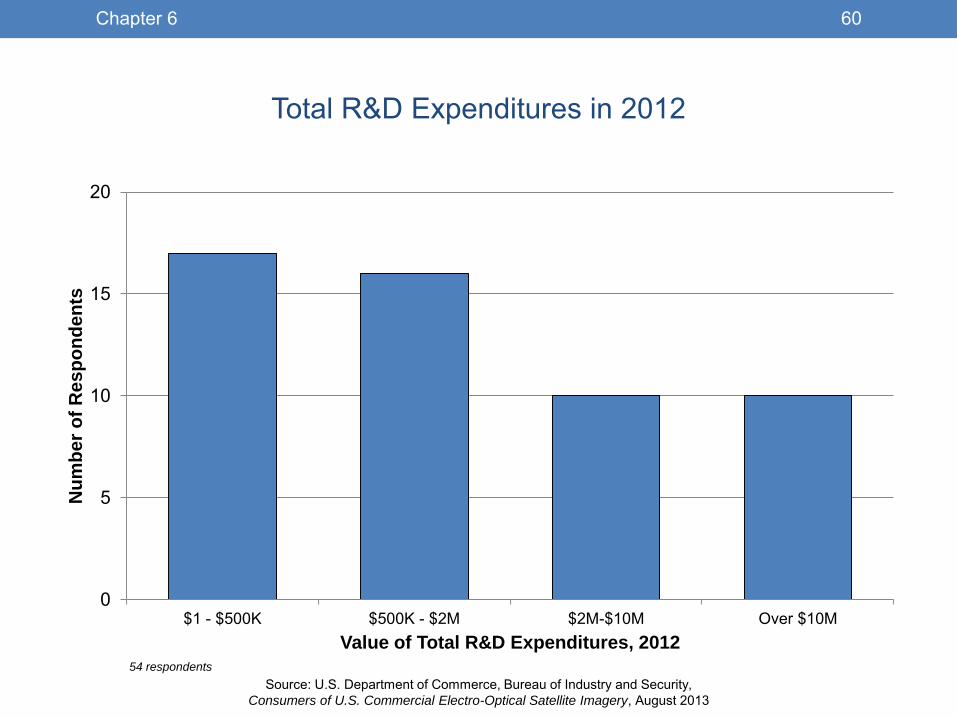
Total R&D Expenditures in 2012
0
5
10
15
20
$1 - $500K $500K - $2M $2M-$10M Over $10M
Nu
mb
er
of
Re
sp
on
de
nts
Value of Total R&D Expenditures, 2012
54 respondents
60Chapter 6

Source: U.S. Department of Commerce, Bureau of Industry and Security,
Consumers of U.S. Commercial Electro-Optical Satellite Imagery, August 2013
$1.7B
$2.6B
$14.6M
$22.5M
$0
$5
$10
$15
$20
$25
$30
$0.0
$0.5
$1.0
$1.5
$2.0
$2.5
$3.0
2008 2009 2010 2011 2012
Ima
ge
ry-R
ela
ted
R&
D (
In M
illio
ns
)
R&
D (
in B
illi
on
s)
Total and Imagery-Related R&D, 2008-2012
Total R&D Imagery-Related R&D
*Excludes one very large respondent whose R&D data would have skewed results due to their size. The vast majority of this respondent’s R&D were not
imagery-related.
53 respondents
Imagery-Related R&D accounted
for approximately 1% of total R&D.
Both measures rose just over 50%
during the period.
61Chapter 6

Source: U.S. Department of Commerce, Bureau of Industry and Security,
Consumers of U.S. Commercial Electro-Optical Satellite Imagery, August 2013
0
5
10
15
20
25
0 1-10% 11-25% 26-50% 51-75% 76%-100%
Nu
mb
er
of
Re
sp
on
de
nts
Imagery-Related R&D as Percent of Total R&D in 2012
Imagery-Related R&D Expenditures as a Percent of Total R&D Expenditures, 2012
Imagery Reseller/Provider Analysis & Related Tools Engineering/Support Services University/Non-Profit
54 respondents
As a group, imagery-related R&D
expenditures represented just one
percent of total R&D expenditures, but
several respondents did devote
significant portions of their R&D
budgets to imagery-related R&D.
62Chapter 6

Source: U.S. Department of Commerce, Bureau of Industry and Security,
Consumers of U.S. Commercial Electro-Optical Satellite Imagery, August 2013
0
5
10
15
20
25
Negative Up to 100% Over 100%
Nu
mb
er
of
Re
sp
on
de
nts
R&D Growth, 2008-2012
Total and Imagery-Related R&D Growth, 2008-2012
Total R&D Imagery-Related R&D
54 respondents
63Chapter 6

Source: U.S. Department of Commerce, Bureau of Industry and Security,
Consumers of U.S. Commercial Electro-Optical Satellite Imagery, August 2013
PSAs With the Highest Percentage of Respondents
Carrying out R&D (in 2012)
Product and Service Area Percent with R&D
Expenditures
Total Respondents
in Product and
Service Area
Video Analysis 82% 11
Geospatial R&D 82% 38
Optics 80% 5
Location Based Services 76% 21
Collaborative Tools 73% 30
Modeling 72% 29
Data Fusion 72% 39
Mobile Wireless Networking 70% 10
Synthetic Aperture Radar 69% 16
Mission Ground Systems 68% 22 *Figures are based on number of all respondents in the given product/service area that perform R&D, NOT R&D done solely in that
product/service area.
54 respondents
64Chapter 6

Source: U.S. Department of Commerce, Bureau of Industry and Security,
Consumers of U.S. Commercial Electro-Optical Satellite Imagery, August 2013
PSAs With the Highest Percentage of Respondents
Carrying out Imagery-Related R&D (in 2012)
Product and Service Area
Percent with
Imagery-Related
R&D Expenditures
Total Respondents
in Product and
Service Area
Optics 60% 5
Location Based Services 57% 21
Geospatial R&D 55% 38
Collaborative Tools 53% 30
Modeling 52% 29
Intelligence Support Systems 50% 28
Mission Ground Systems 50% 22
Open Source Intelligence 50% 20
Data Fusion 49% 39
3D Modeling 47% 32
*Figures are based on number of all respondents in the given product/service area that perform R&D, NOT R&D done solely in that
product/service area.
54 respondents
65Chapter 6

Source: U.S. Department of Commerce, Bureau of Industry and Security,
Consumers of U.S. Commercial Electro-Optical Satellite Imagery, August 2013
PSAs With the Lowest Percentage of Respondents
Carrying out R&D (in 2012)
Product and Service Area Percent with R&D
Expenditures
Total Respondents
in Product and
Service Area
Storage Optimization 45% 11
Storage & Server Technology 47% 15
Media 50% 10
Aerial Imaging 51% 37
Imagery Reseller/Provider 52% 29
Document & Media Exploitation 53% 17
Systems Integrators 54% 28
Data Storage 55% 33
Computers/Hardware 55% 11
Information Management 55% 31 *Figures are based on number of all respondents in the given product/service area that perform R&D, NOT R&D done solely in that
product/service area.
54 respondents
66Chapter 6
Source: U.S. Department of Commerce, Bureau of Industry and Security,
Consumers of U.S. Commercial Electro-Optical Satellite Imagery, August 2013
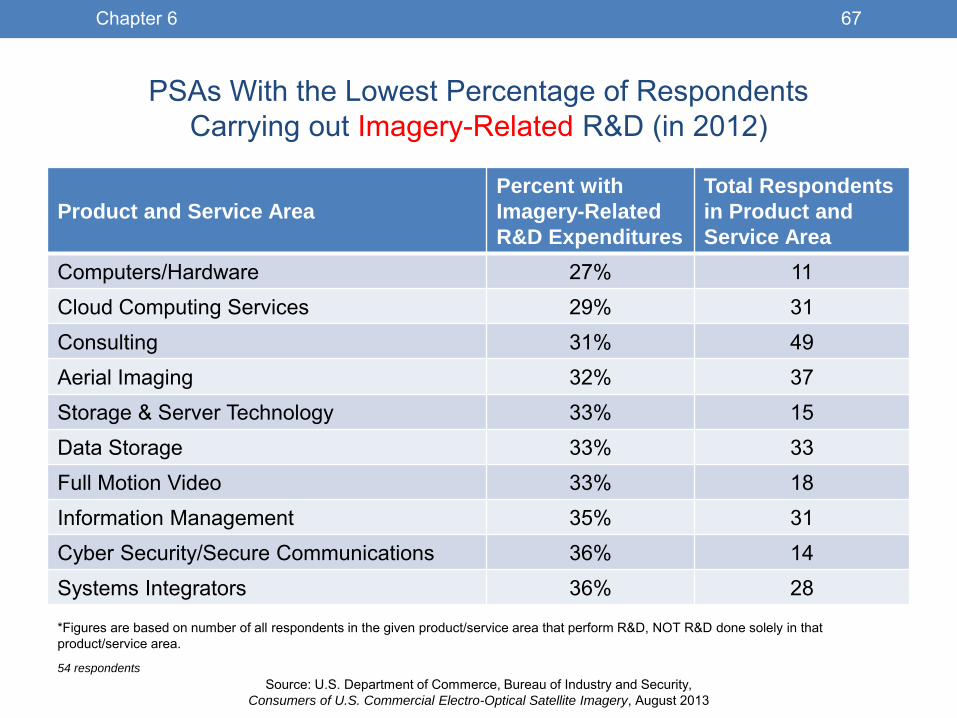
PSAs With the Lowest Percentage of Respondents
Carrying out Imagery-Related R&D (in 2012)
Product and Service Area
Percent with
Imagery-Related
R&D Expenditures
Total Respondents
in Product and
Service Area
Computers/Hardware 27% 11
Cloud Computing Services 29% 31
Consulting 31% 49
Aerial Imaging 32% 37
Storage & Server Technology 33% 15
Data Storage 33% 33
Full Motion Video 33% 18
Information Management 35% 31
Cyber Security/Secure Communications 36% 14
Systems Integrators 36% 28
*Figures are based on number of all respondents in the given product/service area that perform R&D, NOT R&D done solely in that
product/service area.
54 respondents
67Chapter 6

Source: U.S. Department of Commerce, Bureau of Industry and Security,
Consumers of U.S. Commercial Electro-Optical Satellite Imagery, August 2013
CHAPTER 7:
CAPITAL EXPENDITURES • TOTAL CAPITAL EXPENDITURES
• IMAGERY-RELATED CAPITAL EXPENDITURES
68

Source: U.S. Department of Commerce, Bureau of Industry and Security,
Consumers of U.S. Commercial Electro-Optical Satellite Imagery, August 2013
Capital Expenditures, 2008-2012
• Respondents reported their capital expenditures and percent of capital expenditures related to commercial EO satellite imagery by year for the 2008-2012 period.
• 62% of respondents had capital expenditures over the 2008-2012 period, while 28% had imagery-related capital expenditures.
• The percentage of respondents with capital expenditures was stable throughout the period, both as a total and within each of the four business categories.
• Imagery Resellers/Providers accounted for virtually all of the imagery-related capital expenditures.
Imagery-Related Capital
Expenditures 27
Capital Expenditures Unrelated to
Imagery 34
No Capital Expenditures
37
Type of Capital Expenditure 2008-2012
98 respondents
69Chapter 7

Source: U.S. Department of Commerce, Bureau of Industry and Security,
Consumers of U.S. Commercial Electro-Optical Satellite Imagery, August 2013
Value of Total Capital Expenditures, 2012
38
9
4
10
0
5
10
15
20
25
30
35
40
$1 - $500K $500K - $2M $2M-$10M Over $10M
Nu
mb
er
of
Re
sp
on
de
nts
Total Capital Expenditures, 2012 61 respondents
70Chapter 7

Source: U.S. Department of Commerce, Bureau of Industry and Security,
Consumers of U.S. Commercial Electro-Optical Satellite Imagery, August 2013
$1.0
$1.1 $1.0
$1.4
$1.3
$0.3 $0.3 $0.3
$0.6
$0.2
$0.0
$0.2
$0.4
$0.6
$0.8
$1.0
$1.2
$1.4
$1.6
2008 2009 2010 2011 2012
Ca
pit
al E
xp
en
dit
ure
s (i
n B
illi
on
s)
Total and Imagery-Related Capital Expenditures of All Respondents, 2008-2012*
*Excludes one very large respondent whose capital expenditure data would have skewed results due to their size. The vast majority of this respondent’s
capital expenditures were not imagery-related.
Total Capital
Expenditures
Imagery-
Related Capital
Expenditures
60 respondents
71Chapter 7

Source: U.S. Department of Commerce, Bureau of Industry and Security,
Consumers of U.S. Commercial Electro-Optical Satellite Imagery, August 2013
0%
5%
10%
15%
20%
25%
30%
35%
40%
45%
2008 2009 2010 2011 2012
Ima
ge
ry-R
ela
ted
Ca
pit
al E
xp
en
dit
ure
s
as
Pe
rce
nt
of
To
tal
Imagery-Related Capital Expenditures as Percent of Total, by Business Category, 2008-2012*
Imagery Reseller/Provider Analysis & Related Tools Engineering/Support Services University/Non-Profit
While all business categories had capital
expenditures, Imagery Resellers/Providers
accounted for between 96.0% and 99.4%
of all imagery-related capital expenditures.
*Excludes one very large respondent whose capital expenditure data would have skewed results due to their size. The vast majority of this respondent’s
capital expenditures were not imagery-related.
60 respondents
72Chapter 7

Source: U.S. Department of Commerce, Bureau of Industry and Security,
Consumers of U.S. Commercial Electro-Optical Satellite Imagery, August 2013
CHAPTER 8:
EMPLOYMENT • TOTAL AND IMAGERY-RELATED EMPLOYMENT BY YEAR
• DIFFERENCES IN EMPLOYMENT TRENDS BASED ON RESPONDENTS’
PERCENTAGE OF IMAGERY-RELATED SALES
• CHANGES IN TOTAL EMPLOYMENT COMPARED TO CHANGES IN
IMAGERY-RELATED EMPLOYMENT
73

Source: U.S. Department of Commerce, Bureau of Industry and Security,
Consumers of U.S. Commercial Electro-Optical Satellite Imagery, August 2013
Employment, 2008-2012
• Respondents provided their number of full time employees for each year between 2008 and 2012, as well as the percent of total employees who support imagery-related products and services.
• Both total employment and imagery-related employment rose, with imagery-related employment accounting for an increasing percentage of overall employment.
• Imagery-related employment rose in every year over the period, both in absolute terms and as a share of total employment, rising from 5.4% of total employment in 2008 to 7.6% in 2012.
• Employment growth was strongest among respondents with higher percentages of imagery-related sales. Organizations with at least one-quarter of their sales related to imagery increased employment 44% between 2008 and 2012, compared to 19% employment growth at organizations with a lesser percentage of imagery-related sales.
• Even among the 21 respondents who reduced their overall employment level between 2008 and 2012, imagery-related employment grew by 22%. In addition, 18 respondents had no imagery-related employees in 2008 but added some by 2012.
74Chapter 8

Source: U.S. Department of Commerce, Bureau of Industry and Security,
Consumers of U.S. Commercial Electro-Optical Satellite Imagery, August 2013
80,517 84,968
89,548
96,228 100,894
4,354 4,627 5,436 6,738 7,642 5.4% 5.4%
6.1% 7.0% 7.6%
0
20,000
40,000
60,000
80,000
100,000
2008 2009 2010 2011 2012
Nu
mb
er
of
Em
plo
ye
es
Total and Imagery-Related Employment, 2008-2012*
Total Employees Imagery-Related Employees .
*Excludes one very large respondent whose employment data would have skewed results due to their size. The vast majority of this respondent’s employees
were not imagery-related.
91 respondents reporting employment data
75Chapter 8

Source: U.S. Department of Commerce, Bureau of Industry and Security,
Consumers of U.S. Commercial Electro-Optical Satellite Imagery, August 2013
Change in Employment by Respondents’ Level of
Imagery-Related Sales, 2008-2012*
44%
19%
0%
10%
20%
30%
40%
50%
2008 2009 2010 2011 2012
Cu
mu
lati
ve
Em
plo
ym
en
t G
row
th f
rom
20
08
More Reliant on Imagery (25% or more of sales from imagery-related sources)
Less Reliant on Imagery (less than 25% of sales from imagery-related sources)
*Excludes one very large respondent whose employment data would have skewed results due to their size. The vast majority of this respondent’s
employees were not imagery-related.
91 respondents reporting employment data
76Chapter 8

Source: U.S. Department of Commerce, Bureau of Industry and Security,
Consumers of U.S. Commercial Electro-Optical Satellite Imagery, August 2013
Employment by Respondents With Over 25% of
Sales Related to Imagery, 2008-2012
19,616
21,771
24,128
26,237
28,289
1,523 1,645 2,004 2,005 2,108
0
5,000
10,000
15,000
20,000
25,000
30,000
2008 2009 2010 2011 2012
Nu
mb
er
of
Em
plo
ye
es
Total Employees Imagery-Related Employees
21 respondents with over 25% of net sales related to commercial EO satellite imagery.
Total Employment:
44% cumulative growth
Imagery-Related
Employment:
38% cumulative growth
77Chapter 8

Source: U.S. Department of Commerce, Bureau of Industry and Security,
Consumers of U.S. Commercial Electro-Optical Satellite Imagery, August 2013
Changes in Employment Levels, 2008-2012
Increased Employment:
60 (65%) Maintained
Employment Levels: 11
(11%)
Decreased Employment:
21 (23%)
Change in Overall Employment Level
• Among the 65% of respondents adding
employees between 2008 and 2012, overall
employment levels rose 38%.
• Total employment by respondents that cut
employees over the period was 14% lower in
2012 than in 2008.
• Imagery-related employment grew in all three
categories:
92 respondents
Type of Change
in Total
Employment
Percent
Change in
Total
Employment
Percent Change
in Imagery-
Related
Employment
Reduced
Employment -13.8% +22.3%
Maintained
Employment 0% +10.8%
Increased
Employment +38.5% +89.3%
78Chapter 8

Source: U.S. Department of Commerce, Bureau of Industry and Security,
Consumers of U.S. Commercial Electro-Optical Satellite Imagery, August 2013
CHAPTER 9:
RESPONDENT OPERATIONS &
REACTIONS TO INDUSTRY
CHANGES • RESPONDENT PRICING CHANGES IN RESPONSE TO CHANGES IN COST
OF IMAGERY
• IMPACTS EXPERIENCED AS A RESULT OF THE 2006 CONSOLIDATION OF
U.S. COMMERCIAL EO SATELLITE OPERATORS (FROM THREE TO TWO)
• EXPECTED IMPACTS FROM AN ADDITIONAL CONSOLIDATION OF U.S.
COMMERCIAL EO SATELLITE OPERATORS, REDUCING U.S. PROVIDERS
FROM TWO TO ONE (SCENARIO 1)
• EXPECTED IMPACTS IF RESPONDENTS WERE ONLY ABLE TO PURCHASE
IMAGERY FROM NON-U.S.-BASED PROVIDERS (SCENARIO 2)
79
Source: U.S. Department of Commerce, Bureau of Industry and Security,
Consumers of U.S. Commercial Electro-Optical Satellite Imagery, August 2013
Impacts of Changes to the Structure of the U.S.
Commercial EO Satellite Imagery Industry
• As consumers of EO satellite imagery or providers of enabling products, technologies, or
services, respondents were asked to assess the impacts on their organizations of four
events:
• If the cost of acquiring U.S. commercial EO satellite imagery increased, how the prices of
their products, technologies, and services would change;
• Whether their organization was impacted by the 2006 consolidation of U.S. commercial
EO satellite imagery providers (a reduction from three U.S. commercial EO satellite
operators to two);
• How their organization would be impacted by an additional consolidation in the number of
U.S. commercial EO satellite imagery providers (Scenario 1);
• How their organization would be impacted if they were only able to purchase imagery
from providers based outside the United States (Scenario 2)
• Summaries of the results are presented here, with complete tabulations available in
Appendix B.
80Chapter 9

Source: U.S. Department of Commerce, Bureau of Industry and Security,
Consumers of U.S. Commercial Electro-Optical Satellite Imagery, August 2013
Impact of Increased Imagery Costs on Respondent Pricing
No Price Change, 83
Price Increase Half of Cost Increase, 5
Price Increase Equal to Cost Increase, 6
Minimal Change in Prices, 4
Price Change, 15
98 respondents
• Fifteen respondents indicated that a change in the cost of imagery would result in a
change in the price of their products or services:
• Six expected to pass along the full cost of the increase to their customers;
• Five expected to pass along half the cost of the increase;
• Four expected a minimal change in their prices or could not predict how their prices would change.
81Chapter 9

Source: U.S. Department of Commerce, Bureau of Industry and Security,
Consumers of U.S. Commercial Electro-Optical Satellite Imagery, August 2013
Impact of Increased Imagery Costs on Respondent Pricing
Top PSAs Impacted by
Imagery Cost Increases*
Number of
Respondents
Mapping/Geospatial Data 13
Image Processing 11
Imagery Reseller/Provider 11
Geospatial Software 10
Geographic Information
Systems 10
Consulting 9
Remote Sensing 9
Multi-Sensor Data Collection 9
Data Fusion 9
Geospatial R&D 8
*Respondents can participate in multiple Product/Service Areas.
• Comments from respondents:
• “We resell [at prices] according to the commercial list price; if that goes up, our price goes up accordingly.” – Imagery Reseller/Provider; imagery-related products account for 90% of sales
• “For Products containing commercial imagery, the data cost averages about 50%. Therefore a 50% increase, increases price by about 25%.” – Analysis & Related Tools; imagery-related products account for 1% of sales
• “A 25% or 50% increase in satellite imagery costs would not increase our prices as much as it would decrease our revenue from fewer sales.” – Imagery Reseller/Provider; imagery-related products account for 1% of sales
• “An increase will have a significant negative impact on the use of imagery in education.” – University/Non-Profit
82Chapter 9
Source: U.S. Department of Commerce, Bureau of Industry and Security,
Consumers of U.S. Commercial Electro-Optical Satellite Imagery, August 2013
Impacts from Past and Potential Changes in the Structure of the
U.S. Commercial EO Satellite Imagery Industry
• Respondents were asked to consider the 2006 industry consolidation, two
potential future scenarios, and to assess their impacts on a number of
organizational factors:
• Respondents were able to indicate if they experienced or expected:
(a) a decrease, (b) no change, or (c) an increase for each area of impact.
• Quality of Imagery
• Capital Expenditures
• R&D Expenditures
• Technology/Products/Services Costs
• Technology/Products/Services Prices
• Personnel with Key Skills
• Lead Times
• New Product Lines
• Participation in U.S. Government Contracts
• Participation in Commercial Contracts
• Existing Product Lines
• Ability to Meet U.S. Government Contract
Obligations
• Sales Revenue
• Foreign Sourcing Purchasing
• No Impact
• Not Sure
• Other (specify)
83Chapter 9

Source: U.S. Department of Commerce, Bureau of Industry and Security,
Consumers of U.S. Commercial Electro-Optical Satellite Imagery, August 2013
Analytical Groupings of Factors
• For analysis, BIS grouped the areas of impact listed in the survey into three broad
categories. These groupings enabled easier interpretation of the net effects of industry
changes and potential changes:
• Beneficial Factors—the areas for which an increase is beneficial to an organization:
• Sales Revenue
• Quality of Imagery
• Participation in Commercial Contracts
• Participation in U.S. Government Contracts
• Ability to Meet U.S. Government Contract Obligations
• New Product Lines
• Existing Product Lines
• Costly Factors—the areas for which an increase is costly to an organization:
• Technology/Product/Service Costs
• Lead Times
• Capital Expenditures
• R&D Expenditures
• Other Factors—the areas for which an increase has no clearly positive or negative effect
• Personnel With Key Skills
• Technology/Product/Service Prices
• Foreign Sourcing Purchasing
• Availability of Imagery (Scenario 2 only)
84Chapter 9

Source: U.S. Department of Commerce, Bureau of Industry and Security,
Consumers of U.S. Commercial Electro-Optical Satellite Imagery, August 2013
Prior Case: Impacts of the 2006 Consolidation of U.S. Commercial
EO Satellite Imagery Providers
Eighteen respondents indicated that the 2006 imagery provider consolidation*, which
reduced the number of primary providers from three to two, affected their organization
in some way. The remaining 80 provided no feedback on the impact of this event.
Imagery Reseller/
Provider, 4
Analysis & Related Tools, 7
Engineering/ Support
Services, 4
University/ Non-Profit, 3
Top PSAs of Respondents
Affected by 2006
Consolidation**
Number of
Respondents
Impacted
Education & Training 12
Analytics Software 12
Mapping/Geospatial Data 11
Multi-Sensor Data Collection 11
Image Processing 11
Consulting 11
18 respondents
**Respondents participate in multiple PSAs.
*ORBIMAGE acquired Space Imaging to form GeoEye in 2006
85Chapter 9

Source: U.S. Department of Commerce, Bureau of Industry and Security,
Consumers of U.S. Commercial Electro-Optical Satellite Imagery, August 2013
Prior Case: Impacts of the 2006 Consolidation of U.S. Commercial
EO Satellite Imagery Providers (continued)
• Most of the 18 respondents impacted indicated that the merger resulted in increases in
their Beneficial Factors, but also increases in their Costly Factors:
• Engineering/Support Service providers reported the most positive impacts, with 47% reporting
increases in Beneficial Factors, though 20% reported increases in Costly Factors.
• Universities/Non-Profits reported the most negative impacts, with 29% reporting decreases in
Beneficial Factors and 44% reporting increases in Costly Factors.
• The most identified increases in Beneficial Factors were in: • Participation in commercial contracts
• Sales revenue
• Existing product lines
• The most identified increases in Costly Factors were in: • R&D expenditures
• Capital expenditures
• Product costs
• Other Factors: six respondents indicated they increased their personnel with key skills, and five
increased their foreign sourcing of EO satellite imagery.
86Chapter 9

Source: U.S. Department of Commerce, Bureau of Industry and Security,
Consumers of U.S. Commercial Electro-Optical Satellite Imagery, August 2013
Impacts of the 2006 Consolidation of U.S. Commercial EO
Satellite Imagery Providers (continued)
0% 20% 40%
Technology/Product/Service Prices
Foreign Sourcing Purchasing
Personnel with Key Skills
Lead Times
Capital Expenditures
Technology/Product/Service Costs
R&D Expenditures
Ability to Meet USG Contract Obligations
New Product Lines
Quality of Imagery
Participation in USG Contracts
Existing Product Lines
Participation in Commercial Contracts
Sales Revenue
Increased Beneficial Factors
Costly Factors
Other Factors
Factor
0% 20% 40% 60%
Decreased
Percent of Prior Case Respondents (18 Total)
* “No Change” and “Not Sure” answers omitted; full tabulation of results is available in Appendix B
18 respondents
87Chapter 9

Source: U.S. Department of Commerce, Bureau of Industry and Security,
Consumers of U.S. Commercial Electro-Optical Satellite Imagery, August 2013
Impacts of the 2006 Consolidation by Business Category Percent of 18 Respondents Providing Feedback
Business Category Increased No Change Decreased Not Sure
Beneficial Factors • Sales Revenue • Quality of Imagery • Participation in
Commercial Contracts • Participation in USG
Contracts • Ability to Meet USG
Contract Obligations • New Product Lines • Existing Product Lines
Imagery Resellers/Providers 43% 32% 7% 18%
Analysis & Related Tools 38% 48% 14% 0%
Engineering/Support Services 47% 53% 0% 0%
Universities/Non-Profits 24% 18% 29% 29%
Costly Factors • Technology/Product/
Service Costs • Lead Times • Capital Expenditures • R&D Expenditures
Imagery Resellers/Providers 19% 38% 6% 38%
Analysis & Related Tools 25% 67% 4% 4%
Engineering/Support Services 20% 80% 0% 0%
Universities/Non-Profits 44% 11% 11% 33%
18 respondents
88Chapter 9

Source: U.S. Department of Commerce, Bureau of Industry and Security,
Consumers of U.S. Commercial Electro-Optical Satellite Imagery, August 2013
Scenario 1: A Sudden Decrease in the Number of U.S.-Based
Commercial EO Satellite Imagery Providers
• In Scenario 1, respondents were asked how each factor listed might be impacted by a future sudden decrease in the number of U.S.-based commercial EO satellite operators, which would leave only one remaining primary imagery provider in the U.S.
• While most of the 69 respondents providing feedback expected no change or were unsure of the type of change they expected for any given factor, those foreseeing impacts expected mostly detrimental changes:
• Imagery Resellers/Providers expected the most harm, with 28% expecting decreases in Beneficial Factors (just 1% expected increases in these factors), and 25% expecting increases in Costly Factors.
• Engineering/Support Service providers foresaw the least impact, with 16% expecting decreases in Beneficial Factors, but slightly more expecting decreases in Costly Factors than increases (13% and 10%, respectively).
• Many respondents expected decreases in Beneficial Factors, with as many as 20 respondents predicting decreases, while no more than three respondents expected a Beneficial Factor to increase.
• Sales Revenue was most identified as being expected to decrease, by 31% of respondents
• This was followed by Participation in Commercial Contracts (28%) and New Product Lines (26%)
• Respondents expected both increases and decreases in Costly Factors: • Costs of Technology/Products/Services were expected to increase by 24% of respondents, and 23%
expected increases in Lead Times.
• 18% of respondents expected Capital Expenditures to decrease, and 17% expected decreased R&D.
89Chapter 9

Source: U.S. Department of Commerce, Bureau of Industry and Security,
Consumers of U.S. Commercial Electro-Optical Satellite Imagery, August 2013
Expected Impacts of a Sudden Decrease in the Number of U.S.-
Based Commercial EO Satellite Imagery Providers (Scenario 1)*
0% 20% 40%
Technology/Product/Service Prices
Foreign Sourcing Purchasing
Personnel with Key Skills
Lead Times
Capital Expenditures
Technology/Product/Service Costs
R&D Expenditures
Ability to Meet USG Contract Obligations
New Product Lines
Quality of Imagery
Participation in USG Contracts
Existing Product Lines
Participation in Commercial Contracts
Sales Revenue
Increase Beneficial Factors
Costly Factors
Other Factors
Factor
0% 20% 40% 60%
Decrease
Percent of Scenario 1 Respondents (69 Total)
* “No Change” and “Not Sure” answers omitted; full tabulation of results is available in Appendix B
69 respondents
90Chapter 9
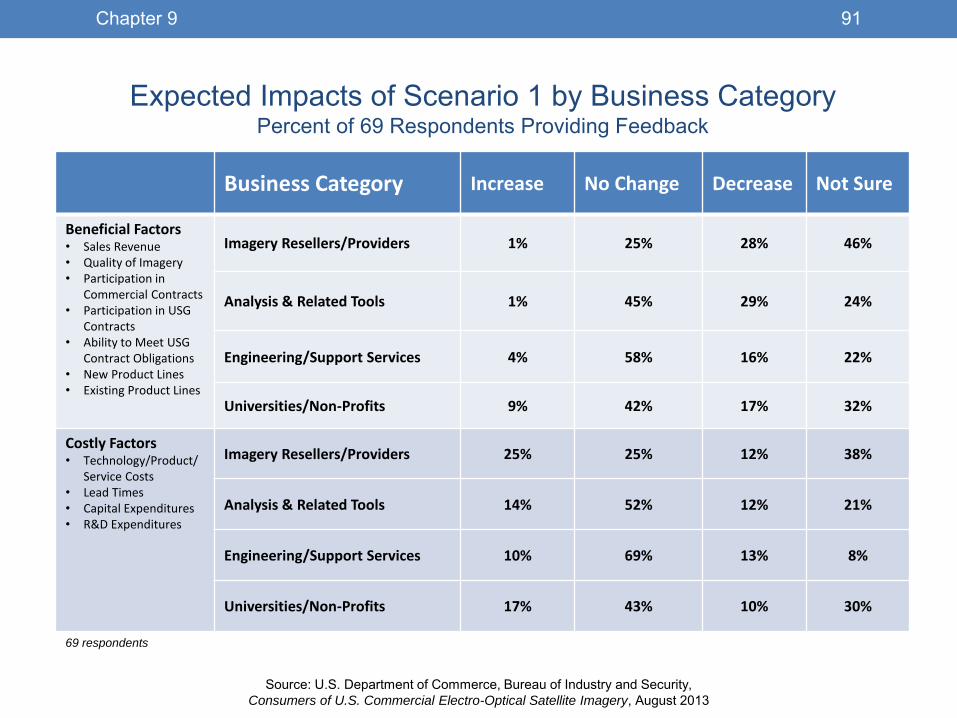
Source: U.S. Department of Commerce, Bureau of Industry and Security,
Consumers of U.S. Commercial Electro-Optical Satellite Imagery, August 2013
Expected Impacts of Scenario 1 by Business Category Percent of 69 Respondents Providing Feedback
Business Category Increase No Change Decrease Not Sure
Beneficial Factors • Sales Revenue • Quality of Imagery • Participation in
Commercial Contracts • Participation in USG
Contracts • Ability to Meet USG
Contract Obligations • New Product Lines • Existing Product Lines
Imagery Resellers/Providers 1% 25% 28% 46%
Analysis & Related Tools 1% 45% 29% 24%
Engineering/Support Services 4% 58% 16% 22%
Universities/Non-Profits 9% 42% 17% 32%
Costly Factors • Technology/Product/
Service Costs • Lead Times • Capital Expenditures • R&D Expenditures
Imagery Resellers/Providers 25% 25% 12% 38%
Analysis & Related Tools 14% 52% 12% 21%
Engineering/Support Services 10% 69% 13% 8%
Universities/Non-Profits 17% 43% 10% 30%
69 respondents
91Chapter 9

Source: U.S. Department of Commerce, Bureau of Industry and Security,
Consumers of U.S. Commercial Electro-Optical Satellite Imagery, August 2013
Scenario 2: Respondents Can Only Purchase from Non-U.S.-
Based Commercial EO Satellite Imagery Providers
• In Scenario 2, respondents were asked how each factor listed might be impacted if they were only able to purchase imagery from non-U.S.-based commercial EO satellite imagery providers.
• While most of the 67 respondents providing feedback expected no change or were unsure of the type of change they expected for any given factor, those foreseeing impacts expected mostly detrimental changes.
• Imagery Resellers/Providers expected the most harm, with 52% expecting decreases in Beneficial Factors (just 6% expected increases in these factors), and 44% expecting increases in Costly Factors.
• Engineering/Support Service providers foresaw the least impact, with 14% expecting decreases in Beneficial Factors, and very few expecting any change at all in Costly Factors.
• Many respondents expected decreases in Beneficial Factors, with over one-third predicting decreases, while no more than four respondents expected any Beneficial Factor to increase.
• Quality of Imagery was most identified as being expected to decrease, by 44% of respondents
• This was followed by Sales Revenue (37%) and Participation in Commercial Contracts (34%)
• Respondents expected both increases and decreases in Costly Factors: • Lead Times were expected to increase by 34% of respondents, and 33% expected increases in Costs
of Technology/Products/Services.
• 19% of respondents expected Capital Expenditures to decrease, and 17% expected decreased R&D.
92Chapter 9

Source: U.S. Department of Commerce, Bureau of Industry and Security,
Consumers of U.S. Commercial Electro-Optical Satellite Imagery, August 2013
Expected Impacts if Respondents Could Only Purchase From Non-U.S.
Based Commercial EO Satellite Imagery Providers (Scenario 2)*
0% 20% 40%
Technology/Product/Service Prices
Availability of Imagery
Personnel with Key Skills
Lead Times
Capital Expenditures
Technology/Product/Service Costs
R&D Expenditures
Ability to Meet USG Contract Obligations
New Product Lines
Quality of Imagery
Participation in USG Contracts
Existing Product Lines
Participation in Commercial Contracts
Sales Revenue
Increase Beneficial Factors
Costly Factors
Other Factors
Factor
0% 20% 40% 60%
Decrease
Percent of Scenario 2 Respondents (67 Total)
* “No Change” and “Not Sure” answers omitted; full tabulation of results is available in Appendix B
67 respondents
93Chapter 9

Source: U.S. Department of Commerce, Bureau of Industry and Security,
Consumers of U.S. Commercial Electro-Optical Satellite Imagery, August 2013
Expected Impacts of Scenario 2 by Business Category Percent of 67 Respondents Providing Feedback
Business Category Increase No Change Decrease Not Sure
Beneficial Factors • Sales Revenue • Quality of Imagery • Participation in
Commercial Contracts • Participation in USG
Contracts • Ability to Meet USG
Contract Obligations • New Product Lines • Existing Product Lines
Imagery Resellers/Providers 6% 5% 52% 38%
Analysis & Related Tools 1% 35% 39% 25%
Engineering/Support Services 4% 67% 14% 15%
Universities/Non-Profits 11% 36% 28% 25%
Costly Factors • Technology/Product/
Service Costs • Lead Times • Capital Expenditures • R&D Expenditures
Imagery Resellers/Providers 44% 14% 19% 22%
Analysis & Related Tools 22% 41% 12% 26%
Engineering/Support Services 3% 84% 5% 8%
Universities/Non-Profits 37% 43% 7% 13%
67 total respondents
94Chapter 9

Source: U.S. Department of Commerce, Bureau of Industry and Security,
Consumers of U.S. Commercial Electro-Optical Satellite Imagery, August 2013
Comparisons of Expected Impacts of Scenarios 1 and 2
• Respondents were more apprehensive about the potential impacts of Scenario 2 (only
able to purchase EO satellite imagery from non-U.S.-based providers) than Scenario 1
(a sudden decrease in the number of U.S.-based commercial EO satellite imagery
providers). For nearly every factor, respondents expected the impacts of Scenario 2 to
be more significant, though the trends of responses were similar for both scenarios.
• The biggest differences in expectations for Beneficial Factors were:
• Quality of Imagery, which 44% of respondents expected to decrease in Scenario 2, compared to
21% of respondents in Scenario 1;
• Ability to Meet USG Contract Obligations, which 30% of respondents expected to decrease in
Scenario 2, compared to 20% of respondents in Scenario 1.
• The biggest difference in expectations for Costly Factors was:
• Lead Times, which 34% of respondents expected to increase in Scenario 2, compared to 23% of
respondents in Scenario 1.
• The biggest difference in expectations for Other Factors was:
• Technology/Product/Service Prices, which 35% of respondents expected to increase in Scenario
2, compared to 25% of respondents in Scenario 1.
95Chapter 9

Source: U.S. Department of Commerce, Bureau of Industry and Security,
Consumers of U.S. Commercial Electro-Optical Satellite Imagery, August 2013
Impacts on Quality of Imagery by Scenario 1 & 2
0
5
10
15
20
25
30
35
Increase No Change Decrease
Nu
mb
er
of
Re
sp
on
de
nts
Scenario 1 Scenario 2
Scenario 1: Sudden Decrease in the Number of U.S.-Based Commercial EO Satellite Imagery Providers. (69 respondents)
Scenario 2: Only Able To Purchase from Non-U.S.-Based Commercial EO Satellite Imagery Providers. (67 respondents)
96Chapter 9

Source: U.S. Department of Commerce, Bureau of Industry and Security,
Consumers of U.S. Commercial Electro-Optical Satellite Imagery, August 2013
Impacts on Ability to Meet U.S.
Government Contract Obligations by Scenario 1 & 2
0
5
10
15
20
25
30
35
Increase No Change Decrease
Nu
mb
er
of
Re
sp
on
de
nts
Scenario 1 Scenario 2Scenario 1: Sudden Decrease in the Number of U.S.-Based Commercial EO Satellite Imagery Providers. (69 respondents)
Scenario 2: Only Able To Purchase from Non-U.S.-Based Commercial EO Satellite Imagery Providers. (67 respondents)
97Chapter 9

Source: U.S. Department of Commerce, Bureau of Industry and Security,
Consumers of U.S. Commercial Electro-Optical Satellite Imagery, August 2013
Scenarios 1 & 2: Comparison of Impacts on Beneficial Factors Percent of Respondents Providing Feedback
Scenario (respondents) Increase No Change Decrease Not Sure
Sales Revenue Scenario 1 (64 respondents) 5% 36% 31% 28%
Scenario 2 (60 respondents) 2% 33% 37% 28%
Quality of Imagery Scenario 1 (63 respondents) 0% 49% 21% 30%
Scenario 2 (62 respondents) 3% 27% 44% 26%
Existing Product Lines Scenario 1 (64 respondents) 2% 50% 23% 25%
Scenario 2 (59 respondents) 3% 41% 34% 22%
New Product Lines Scenario 1 (61 respondents) 2% 43% 26% 30%
Scenario 2 (58 respondents) 7% 38% 34% 21%
Participation in Commercial Contracts
Scenario 1 (61 respondents) 3% 39% 28% 30%
Scenario 2 (59 respondents) 3% 41% 34% 22%
Participation in USG Contracts Scenario 1 (60 respondents) 3% 42% 25% 30%
Scenario 2 (60 respondents) 5% 37% 33% 25%
Ability to Meet USG Contract Obligations
Scenario 1 (60 respondents) 5% 48% 20% 27%
Scenario 2 (60 respondents) 3% 35% 30% 32%
Scenario 1: Sudden Decrease in the Number of U.S.-Based Commercial EO Satellite Imagery Providers. (69 respondents)
Scenario 2: Only Able To Purchase from Non-U.S.-Based Commercial EO Satellite Imagery Providers. (67 respondents)
98Chapter 9

Source: U.S. Department of Commerce, Bureau of Industry and Security,
Consumers of U.S. Commercial Electro-Optical Satellite Imagery, August 2013
Impacts on Lead Times by Scenario 1 & 2
0
5
10
15
20
25
30
35
Increase No Change Decrease
Nu
mb
er
of
Re
sp
on
de
nts
Scenario 1 Scenario 2
Scenario 1: Sudden Decrease in the Number of U.S.-Based Commercial EO Satellite Imagery Providers. (69 respondents)
Scenario 2: Only Able To Purchase from Non-U.S.-Based Commercial EO Satellite Imagery Providers. (67 respondents)
99Chapter 9

Source: U.S. Department of Commerce, Bureau of Industry and Security,
Consumers of U.S. Commercial Electro-Optical Satellite Imagery, August 2013
Scenarios 1 & 2: Comparison of Impacts on Costly Factors Percent of Respondents Providing Feedback
Scenario (respondents) Increase No Change Decrease Not Sure
R&D Expenditures Scenario 1 (60 respondents) 10% 53% 17% 20%
Scenario 2 (58 respondents) 16% 50% 17% 17%
Capital Expenditures Scenario 1 (62 respondents) 5% 56% 18% 21%
Scenario 2 (58 respondents) 14% 48% 19% 19%
Lead Times Scenario 1 (60 respondents) 23% 43% 5% 28%
Scenario 2 (59 respondents) 34% 39% 3% 24%
Technology/Product/Service Costs
Scenario 1 (62 respondents) 24% 47% 8% 21%
Scenario 2 (58 respondents) 33% 40% 5% 22%
Scenario 1: Sudden Decrease in the Number of U.S.-Based Commercial EO Satellite Imagery Providers. (69 respondents)
Scenario 2: Only Able To Purchase from Non-U.S.-Based Commercial EO Satellite Imagery Providers. (67 respondents)
100Chapter 9

Source: U.S. Department of Commerce, Bureau of Industry and Security,
Consumers of U.S. Commercial Electro-Optical Satellite Imagery, August 2013
Impacts on Technology/Product/Service Prices by Scenario 1 & 2
0
5
10
15
20
25
30
35
Increase No Change Decrease
Nu
mb
er
of
Re
sp
on
de
nts
Scenario 1 Scenario 2Scenario 1: Sudden Decrease in the Number of U.S.-Based Commercial EO Satellite Imagery Providers. (69 respondents)
Scenario 2: Only Able To Purchase from Non-U.S.-Based Commercial EO Satellite Imagery Providers. (67 respondents)
101Chapter 9

Source: U.S. Department of Commerce, Bureau of Industry and Security,
Consumers of U.S. Commercial Electro-Optical Satellite Imagery, August 2013
Scenarios 1 & 2: Comparison of Impacts on Other Factors Percent of Respondents Providing Feedback
Scenario (respondents) Increase No Change Decrease Not Sure
Personnel With Key Skills Scenario 1 (59 respondents) 3% 54% 20% 23%
Scenario 2 (57 respondents) 4% 56% 19% 21%
Technology/Product/Service Prices
Scenario 1 (61 respondents) 25% 49% 8% 18%
Scenario 2 (57 respondents) 35% 42% 4% 19%
Foreign Sourcing Purchasing Scenario 1 (61 respondents) 20% 41% 5% 34%
Scenario 2 (NA) NA NA NA NA
Availability of Imagery Scenario 1 (NA) NA NA NA NA
Scenario 2 (62 respondents) 2% 23% 52% 24%
Scenario 1: Sudden Decrease in the Number of U.S.-Based Commercial EO Satellite Imagery Providers. (69 respondents)
Scenario 2: Only Able To Purchase from Non-U.S.-Based Commercial EO Satellite Imagery Providers. (67 respondents)
102Chapter 9

Source: U.S. Department of Commerce, Bureau of Industry and Security,
Consumers of U.S. Commercial Electro-Optical Satellite Imagery, August 2013
CHAPTER 10:
ADDITIONAL INDUSTRY
COMMENTS • FEEDBACK ON FACTORS CURRENTLY AFFECTING THE COMMERCIAL EO
SATELLITE IMAGERY INDUSTRY, OR THAT MIGHT AFFECT IT IN THE
FUTURE.
• MOST COMMENTS DIVIDED INTO THREE MAIN AREAS:
• A POTENTIAL DIGITALGLOBE-GEOEYE MERGER
• USG RESTRICTIONS ON THE SALES OF SATELLITE IMAGERY
• THE USG’s ROLE IN THE COMMERCIAL EO SATELLITE IMAGERY INDUSTRY
103

Source: U.S. Department of Commerce, Bureau of Industry and Security,
Consumers of U.S. Commercial Electro-Optical Satellite Imagery, August 2013
Industry Comments Related to a Potential
DigitalGlobe - GeoEye Merger
• “A merger between DigitalGlobe and GeoEye would create a situation where supply of quality satellite
imagery is restricted to us. We would likely either need to launch our own satellites (which is cost
prohibitive) or use sub-standard imagery thereby degrading our product and reducing revenue.” – Imagery
Reseller/Provider, 1% of sales are imagery-related
• “We predict that the [DigitalGlobe - GeoEye merger] would substantially decrease its R&D investments in
the absence of domestic competition, resulting in reduced capabilities for the U.S. Government and
significant financial impact to each company's technology suppliers.” – Engineering/Support Services, 15%
of sales are imagery related
• “Reduction of the sources of commercial E/O products from 2 to 1 would proportionally reduce the revenue,
personnel, IR&D, and capital related to that product line.” – Analysis & Related Tools, 1% of sales are
imagery-related
• “Despite having two commercial satellite providers in the US, there is still lack of data.” – Analysis &
Related Tools, 1% of sales are imagery related
104Chapter 10
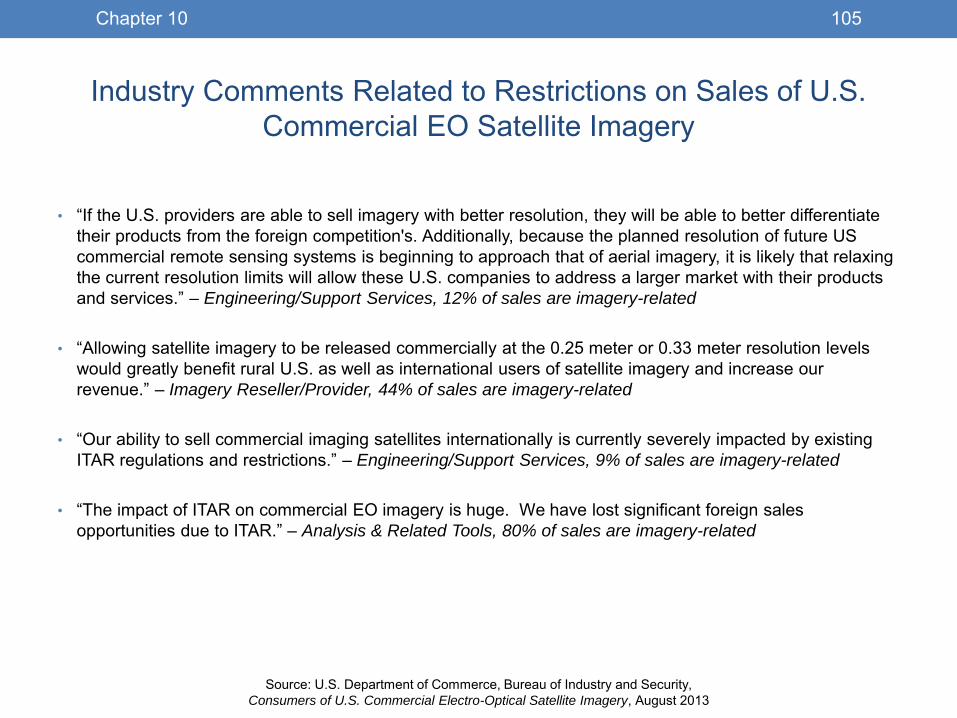
Source: U.S. Department of Commerce, Bureau of Industry and Security,
Consumers of U.S. Commercial Electro-Optical Satellite Imagery, August 2013
Industry Comments Related to Restrictions on Sales of U.S.
Commercial EO Satellite Imagery
• “If the U.S. providers are able to sell imagery with better resolution, they will be able to better differentiate
their products from the foreign competition's. Additionally, because the planned resolution of future US
commercial remote sensing systems is beginning to approach that of aerial imagery, it is likely that relaxing
the current resolution limits will allow these U.S. companies to address a larger market with their products
and services.” – Engineering/Support Services, 12% of sales are imagery-related
• “Allowing satellite imagery to be released commercially at the 0.25 meter or 0.33 meter resolution levels
would greatly benefit rural U.S. as well as international users of satellite imagery and increase our
revenue.” – Imagery Reseller/Provider, 44% of sales are imagery-related
• “Our ability to sell commercial imaging satellites internationally is currently severely impacted by existing
ITAR regulations and restrictions.” – Engineering/Support Services, 9% of sales are imagery-related
• “The impact of ITAR on commercial EO imagery is huge. We have lost significant foreign sales
opportunities due to ITAR.” – Analysis & Related Tools, 80% of sales are imagery-related
105Chapter 10

Source: U.S. Department of Commerce, Bureau of Industry and Security,
Consumers of U.S. Commercial Electro-Optical Satellite Imagery, August 2013
Industry Comments on the U.S. Government’s Role in the
Commercial EO Satellite Industry
• “Unstable demand from U.S. Government for commercial imagery is making it difficult to determine
appropriate amount of on-orbit resources. This makes it hard to justify new expenditures in R&D, Capital
and new product development.” – Engineering/Support Services, imagery-related products account for 9%
of sales
• “There is no doubt that the community would greatly benefit from a more heavily government subsidized
imagery acquisition program to make commercial imagery more widely available for R&D.” –
University/Non-Profit
• “U.S. Government subsidy of two domestic commercial EO satellite providers has created a profit-driven
industry with little competition and little incentive for improvement and innovation. This results in higher
prices and lower quality of service for the Government, limits access to other available commercial EO
sources that can be competitively leveraged, and diminishes interest in University and research
partnerships that would have promoted advances in the industry U.S. commercial EO satellite industry.” –
University/Non-Profit
• “The U.S. Government needs to overcome their skepticism of smaller satellites since that will put them
behind Europe in their technology advancement.” – Engineering/Support Services, imagery-related
products account for 7% of sales
• “There is a concern that if a significant drop in government sponsorship or support of US based commercial
imagery companies occurs, only non-US based commercial or government satellite platforms will remain.”
– Analysis & Related Tools, imagery-related products account for 40% of sales
106Chapter 10

Source: U.S. Department of Commerce, Bureau of Industry and Security,
Consumers of U.S. Commercial Electro-Optical Satellite Imagery, August 2013
CHAPTER 11:
REPORT FINDINGS • FINDINGS FROM EACH CHAPTER
107
Source: U.S. Department of Commerce, Bureau of Industry and Security,
Consumers of U.S. Commercial Electro-Optical Satellite Imagery, August 2013
Report Findings
• Chapter 2: Survey Design and Respondent Profile
• The 98 survey respondents were grouped based on their primary area of business in the
imagery industry: Imagery Resellers/Providers (14 organizations); Analysis & Related Tools (49);
Engineering/Support Services (20); and Universities/Non-Profits (15)
• The majority of respondents did not purchase imagery themselves but are nonetheless a
significant part of the industry, using imagery provided by clients or customers, or providing key
support services such as data management and engineering capabilities.
108Chapter 11

Source: U.S. Department of Commerce, Bureau of Industry and Security,
Consumers of U.S. Commercial Electro-Optical Satellite Imagery, August 2013
Report Findings
• Chapter 3: Product and Service Areas (PSAs)
• Respondents participated in all of the 47 Product and Service Areas listed, with no PSA having
fewer than four participating respondents, and the average respondent participating in 13 PSAs.
• The most-provided PSAs were:
• Mapping/Geospatial Data
• Geographic Information Systems
• Geospatial Software
• Two PSAs—Cyber Security/Secure Communications and Intelligence Support Systems—had
minimal commercial involvement, with fewer than 25% of participating respondents having
commercial customers.
• Engineering/Support Service providers, none of whom reported having purchased imagery
themselves, were mainly providers of key infrastructure enabling the use of imagery, especially
computers/software, information management, and data storage/sharing.
• Respondents have international growth opportunities, as only three PSAs have over 60% of
respondents with foreign customers.
109Chapter 11

Source: U.S. Department of Commerce, Bureau of Industry and Security,
Consumers of U.S. Commercial Electro-Optical Satellite Imagery, August 2013
Report Findings
• Chapter 4: Purchases of Imagery and Related Products and Services
• Between 2008 and 2012, respondents reported having purchased $193 million worth of imagery,
a figure that represents just a portion of the total size of the U.S. commercial EO satellite
imagery market.
• Sixty respondents did not purchase imagery themselves but are still key participants in the
industry, either through the provision of services or the use of imagery provided at no direct cost
to their organization.
• Roughly half of respondents knew the satellite or family of satellites from which they received
imagery, identifying a total of 14 countries of origin. The U.S., France, and Germany accounted
for 88% of identifications.
• The French-operated Pléiades satellites, launched in 2011 and 2012, introduce a challenge to
U.S. leadership in the commercial EO satellite imagery industry, as Pléiades provides resolutions
close to the 0.5 meter resolution DigitalGlobe is licensed to sell commerically.
• Other countries have also made advances in EO satellite technology, and the number of
satellites providing commercial EO imagery below one meter of resolution is likely to increase in
the near future.
110Chapter 11

Source: U.S. Department of Commerce, Bureau of Industry and Security,
Consumers of U.S. Commercial Electro-Optical Satellite Imagery, August 2013
Report Findings
• Chapter 5: Net and Imagery-Related Sales
• Net sales reported by survey respondents totaled nearly $65 billion, with imagery-related sales
accounting for roughly 7% of this amount, or $4.77 billion. Based on BIS estimates, the net sales
of all organizations involved in the U.S. commercial EO satellite imagery industry are now over
$50 billion per year.
• Imagery-related sales have grown at a rapid pace, rising 74% between 2008 and 2012.
• Engineering/Support Service providers reported the strongest imagery-related sales growth,
rising 92% between 2008 and 2012, to $304 million, followed by Imagery Resellers/Providers,
whose sales rose 78%, to $741 million.
• Imagery Resellers/Providers had the highest percentage of sales related to imagery, at roughly
30%, followed by Analysis & Related Tools providers, at roughly 12%. The remaining two
business categories reported imagery-related sales of less than 3% of net sales.
111Chapter 11

Source: U.S. Department of Commerce, Bureau of Industry and Security,
Consumers of U.S. Commercial Electro-Optical Satellite Imagery, August 2013
Report Findings
• Chapter 6: Research & Development (R&D)
• Slightly over half of all respondents reported performing some R&D between 2008 and 2012,
with about one-third of the total also reporting imagery-related R&D expenditures.
• The total value of imagery-related R&D expenditures was roughly 1% of the total level of R&D
expenditures, which amounted to over $10 billion between 2008 and 2012.
• The Product and Service Areas with the most respondents performing R&D were:
• Optics
• Location Based Services
• Geospatial R&D
• The Product and Service Areas with the fewest respondents performing R&D were:
• Computers/Hardware
• Cloud Computing Services
• Consulting
112Chapter 11

Source: U.S. Department of Commerce, Bureau of Industry and Security,
Consumers of U.S. Commercial Electro-Optical Satellite Imagery, August 2013
Report Findings
• Chapter 7: Capital Expenditures
• 61% of respondents reported having capital expenditures between 2008 and 2012, though only
27% had imagery-related capital expenditures.
• Most expenditures were relatively small, with 38 respondents, or 62% of those with capital
expenditures, spending under $500,000 in 2012. 10 respondents had significant expenditures of
over $10 million.
• Imagery Resellers/Providers accounted for virtually all imagery-related capital expenditures,
though all categories had some level of capital expenditures.
113Chapter 11

Source: U.S. Department of Commerce, Bureau of Industry and Security,
Consumers of U.S. Commercial Electro-Optical Satellite Imagery, August 2013
Report Findings
• Chapter 8: Employment
• Total reported employment rose 25% between 2008 and 2012, to approximately 100,000, while
imagery-related employment increased by 76% to 7,600 in 2012.
• Respondents with a higher percentage of imagery-related sales exhibited greater employment
growth:
• Organizations having over 25% of their sales related to imagery increased employment by
44% from 2008 to 2012
• Organizations with fewer imagery-related sales increased employment by 19%.
• Although 23% of respondents reported a lower level of total employment in 2012 than in 2008,
they increased their levels of imagery-related employment by 22%.
114Chapter 11

Source: U.S. Department of Commerce, Bureau of Industry and Security,
Consumers of U.S. Commercial Electro-Optical Satellite Imagery, August 2013
Report Findings
• Chapter 9: Industry Changes – Prior Case (number of U.S. commercial EO
satellite operators fell from three to two)
• Eighteen respondents indicated they were affected by the 2006 industry consolidation, when
ORBIMAGE acquired Space Imaging to form GeoEye. Many of these respondents found the
consolidation had positive effects on factors like their sales revenue and participation in
contracts, but also resulted in increased costs.
• Half of the respondents reported their Sales Revenue and Participation in Commercial Contracts increased
as a result of the formation of GeoEye, while under 15% reported decreases in either factor.
• Two-thirds of the affected respondents participated in the Product and Service Areas of
Education & Training and Analytics Software.
• Providers of Engineering/Support Services were most positive about the 2006 industry
consolidation, while Universities/Non-Profits reported seeing more cost increases than benefits.
• 47% of Engineering/Support Service providers reported increases in Beneficial Factors, while 0% reported
decreases.
• Slightly more Universities/Non-Profits reported decreases in Beneficial Factors than increases (29% vs.
24%), but four times as many reported increases in Costly Factors as decreases in these factors (44% vs.
11%).
115Chapter 11

Source: U.S. Department of Commerce, Bureau of Industry and Security,
Consumers of U.S. Commercial Electro-Optical Satellite Imagery, August 2013
Report Findings
• Chapter 9: Industry Changes – Scenario 1 (sudden decrease in the number
of U.S.-based commercial EO satellite operators)
• Sixty-nine respondents provided feedback on how they would be affected by Scenario 1. Many
expected decreases in factors such as Sales Revenue, Number of Product Lines, and
Participation in Contracts, along with increases in Costs and Lead Times.
• 31% of respondents expected decreased Sales Revenue, while just 5% expected increased Sales Revenue
• 25% of respondents expected increased Technology/Product/Service prices, with 8% expecting decreased
prices.
• Imagery Resellers/Providers were most pessimistic about this scenario, with 28% expecting
decreases in Beneficial Factors, and 25% expecting increases in Costly Factors.
• 50% expected decreases in Sales Revenue, and 40% expected increases in Lead Times
• Engineering/Support Service providers expected the least impact, with 58% expecting no
change in Beneficial Factors and 69% expecting no change in Costly Factors.
• The largest impact on Engineering/Support Service providers was in Capital Expenditures, where 33%
expected a decrease as a result of Scenario 1.
• Additionally, 29% expected decreases in Existing Product Lines, and 25% expected increased
Technology/Product/Service Prices.
116Chapter 11

Source: U.S. Department of Commerce, Bureau of Industry and Security,
Consumers of U.S. Commercial Electro-Optical Satellite Imagery, August 2013
Report Findings
• Chapter 9: Industry Changes – Scenario 2 (only able to purchase imagery
from non-U.S.-based providers)
• Sixty-seven respondents provided feedback on how they expected to be impacted by Scenario
2. Over one-third of these respondents expected decreases in Beneficial Factors.
• 44% predicted a decline in the Quality of Imagery
• 37% expected decreased Sales Revenue
• Over half of the Imagery Resellers/Providers predicted decreases in Beneficial Factors, with
44% also expecting increases in Costly Factors.
• 78% expected increased Lead Times
• 70% expected decreased Sales Revenue
• 67% expected decreased Quality of Imagery
• Engineering/Support Service providers expected to be least affected, with 14% foreseeing
decreases in Beneficial Factors, and just 3% predicting increases in Costly Factors.
• The greatest impact was foreseen on Technology/Product/Service Prices, with 22% expecting increases.
• 20% expected decreases in New Product Line
• Overall, significantly more respondents expected the quality of imagery would decrease under
Scenario 2 as under Scenario 1, and several more also expected a decreased ability to meet
U.S. Government contract obligations. Scenario 2 also resulted in more respondents expecting
longer lead times and higher technology/product/service prices.
117Chapter 11

Source: U.S. Department of Commerce, Bureau of Industry and Security,
Consumers of U.S. Commercial Electro-Optical Satellite Imagery, August 2013
Report Findings
• Chapter 10: Additional Industry Comments
• A number of respondents commented on the potential of a DigitalGlobe - GeoEye merger, with
almost universally negative assessments. Respondents noted such a merger would restrict the
supply of imagery, result in decreased R&D investments, and reduce the opportunities for sales.
• Several respondents commented that restrictions on sales of high resolution imagery and
satellites themselves resulted in significant losses of sales and potential sales.
• Many respondents also provided comments on the role of the U.S. Government in the satellite
industry, with uncertainty about the future of government support being a primary concern.
118Chapter 11

Source: U.S. Department of Commerce, Bureau of Industry and Security,
Consumers of U.S. Commercial Electro-Optical Satellite Imagery, August 2013
APPENDIX A: SURVEY INSTRUMENT • THE SURVEY DISTRIBUTED TO STAKEHOLDERS IN THE U.S.
COMMERCIAL EO SATELLITE IMAGERY INDUSTRY.
119

BURDEN ESTIMATE AND REQUEST FOR COMMENT
Public reporting burden for this collection of information is estimated to average 6 hours per response, including the time for reviewing instructions, searching existing data sources, gathering and maintaining the data needed, and completing and reviewing the collection of information. Send comments regarding this burden estimate or any other aspect of this collection of information to BIS Information Collection Officer, Room 6883, Bureau of Industry and Security, U.S. Department of Commerce, Washington, D.C. 20230, and to the Office of Management and Budget, Paperwork Reduction Project (OMB Control No. 0694-0119), Washington, D.C. 20503.
BUSINESS CONFIDENTIAL - Per Section 705(d) of the Defense Production Act
Next PageOMB Control Number: 0694-0119
Expiration Date: December 31, 2012
INDUSTRIAL BASE ASSESSMENT:Consumers of U.S. Commercial Electro-Optical (EO) Satellite Imagery
SCOPE OF ASSESSMENT
The U.S. Department of Commerce, Bureau of Industry and Security (BIS), Office of Technology Evaluation (OTE), in coordination with the National Geospatial-Intelligence Agency (NGA) and the National Oceanic and Atmospheric Administration (NOAA), is conducting an industrial base assessment of the consumers of and organizations supporting U.S. commercial electro-optical (EO) satellite imagery. The principal goal of this data collection is to evaluate the current market behavior of both consumers of commercial EO satellite imagery, and providers of enabling technologies/products/services in a constrained U.S. Defense Department budgetary environment.
RESPONSE TO THIS SURVEY IS REQUIRED BY LAWA response to this survey is required by law (50 U.S.C. app. Sec. 2155). Failure to respond can result in a maximum fine of $10,000, imprisonment of up to one year, or both. Information furnished herewith is deemed confidential and will not be published or disclosed except in accordance with Section 705 of the Defense Production Act of 1950, as amended (50 U.S.C App. Sec. 2155). Section 705 prohibits the publication or disclosure of this information unless the President determines that its withholding is contrary to the national defense. Information will not be shared with any non-government entity, other than in aggregate form. The information will be protected pursuant to the appropriate exemptions from disclosure under the Freedom of Information Act (FOIA), should it be the subject of a FOIA request.
Not withstanding any other provision of law, no person is required to respond to nor shall a person be subject to a penalty for failure to comply with a collection of information subject to the requirements of the Paperwork Reduction Act unless that collection of information displays a currently valid OMB Control Number.
1 of 22
PDF FOR REFERENCE ONLY
SUBMIT ONLY EXCEL VERSION--DROP DOWN CRITERIA ONLY IN EXCEL VERSION
120Appendix A

Previous Page Next Page
Section ISection IISection IIISection 1Section 2Section 3Section 4Section 5Section 6Section 7Section 8Section 9Section 10Section 11
Products and ServicesCommercial EO Satellite Imagery PurchasesSalesResearch and Development (R&D)Capital ExpendituresEmployment
BUSINESS CONFIDENTIAL - Per Section 705(d) of the Defense Production Act
Additional InformationCertification
Operations
TABLE OF CONTENTSGeneral InstructionsDefinitionsWho Must Respond to this SurveyOrganization InformationSupplier Countries
2 of 22
PDF FOR REFERENCE ONLY
SUBMIT ONLY EXCEL VERSION--DROP DOWN CRITERIA ONLY IN EXCEL VERSION
121Appendix A

Previous Page Next Page
A.
B.
C.
D.
E.
F.
Specific questions or assistance with the Excel survey should be directed to [email protected] E-mail is the preferred method of contact. For further assistance, call one of the analysts listed below.
Anna Bruse, Trade and Industry Analyst, U.S. Department of Commerce, (202) 482-7418Erika Maynard, Trade and Industry Analyst, U.S. Department of Commerce, (202) 482-5572Alex Whitaker, Trade and Industry Analyst, U.S. Department of Commerce, (202) 482-3893Matt Sigmund, Trade and Industry Analyst, U.S. Department of Commerce, (202) 482-0634
Table of ContentsSection I GENERAL INSTRUCTIONS
Your organization is required to complete this survey using an Excel template, which can be downloaded from the U.S. Department of Commerce, Bureau of Industry and Security (BIS) website at www.bis.doc.gov/EOsurvey. At your request, BIS staff will e-mail the Excel survey template directly to your organization. For your convenience, a PDF version of the survey is also available on the BIS website to aid internal data collection. DO NOT submit the PDF version of your organization’s response to BIS. BIS will only accept the Excel version.Respond to every question. Surveys that are not fully completed will be returned for completion. Use comment boxes to provide any information to supplement responses provided in the survey form. Make sure to record a complete answer in the cell provided, even if the cell does not appear to expand to fit all the information.
DO NOT COPY AND PASTE RESPONSES WITHIN THIS SURVEY. Survey inputs should be made manually, by typing in responses or by use of a drop-down menu. The use of copy and paste can disrupt the data collection process. If your survey response is corrupted as a result of copy and paste responses, a new survey will be sent to you for immediate completion.
If information is not available from your organization's records in the form requested, you may furnish informed estimates.
BUSINESS CONFIDENTIAL - Per Section 705(d) of the Defense Production Act
Upon completion, review, and certification of the Excel survey, transmit the survey via e-mail attachment to: [email protected] questions related to the overall scope of this industrial base assessment, contact:
Brad Botwin, Director, Industrial StudiesOffice of Technology Evaluation, Room 1093U.S. Department of Commerce1401 Constitution Avenue, NWWashington, DC 20230
DO NOT submit completed surveys to Brad Botwin's postal or personal e-mail address; all surveys must be submitted electronically to [email protected]
3 of 22
PDF FOR REFERENCE ONLY
SUBMIT ONLY EXCEL VERSION--DROP DOWN CRITERIA ONLY IN EXCEL VERSION
122Appendix A

Previous Page Table of Contents Next Page
Term
Full-Time Equivalent (FTE) Employees
Provider of Enabling Technology/Product/Service
Research and Development (R&D)
Reseller
Service
Supplier
United States Commercial Electro-Optical (EO) Satellite Imagery
United States
Employees who work for 40 hours in a normal work week. Convert part-time employees into "full-time equivalents" by taking their work hours as a fraction of 40 hours.
Includes basic and applied research and product development in the fields of science and engineering, and also includes design and development of prototype products and processes.
An organization that provides value-added technologies, products, and/or services related to commercial electro-optical (EO) satellite imagery. Examples: A software application for geospatial data, packaging commercial EO satellite images for mapping purposes, or using the Global Positioning System (GPS) to provide navigational services to a customer.
The portion of imagery collected by NOAA-licensed private remote sensing satellite operators that is universally available to commercial customers with few or no restrictions. This definition applies to "unenhanced data" as defined by statutory law, as well as to products derived from unenhanced data that are intended for unrestricted commercial sale.
An intermediary that disseminates commercial satellite imagery and/or enabling technologies/products/services to the broader market.
BUSINESS CONFIDENTIAL - Per Section 705(d) of the Defense Production Act
Section II DEFINITIONS Definition
An intangible product (contrasted to a good, which is a tangible product). Services typically cannot be stored or transported, are instantly perishable, and come into existence at the time they are bought and consumed.
The "United States" or "U.S." includes the 50 states, Puerto Rico, the District of Columbia, the island of Guam, the Trust Territories, and the U.S. Virgin Islands.
An entity from which your facility obtains inputs. A supplier may be another firm with which you have a contractual relationship, or it may be another facility owned by the same parent company. The inputs may be goods or services.
4 of 22
PDF FOR REFERENCE ONLY
SUBMIT ONLY EXCEL VERSION--DROP DOWN CRITERIA ONLY IN EXCEL VERSION
123Appendix A

Previous Page Table of Contents Next PageSection III WHO MUST RESPOND TO THIS SURVEY
EXEMPTION
Direct consumer of commercial EO satellite imagery?
Indirect consumer of commercial EO satellite imagery?
Provider of enabling technology/product/service that supports geospatial activity based on commercial EO satellite imagery?
Reseller of commercial EO satellite imagery and/or enabling technologies/products and/or services?
BUSINESS CONFIDENTIAL - Per Section 705(d) of the Defense Production Act
Your organization has been identified by the U.S. Government as a consumer of U.S. commercial electro-optical (EO) satellite imagery and/or a provider of enabling technology/products/services. Select from the drop-down menus all that apply.
A.
Is your organization a:
If you selected "No" to all of the statements above, your organization may be exempt from completing this U.S. Department of Commerce survey. If you think your organization is exempt, call the contacts listed in the General Instructions section of this survey to verify your status.
5 of 22
PDF FOR REFERENCE ONLY
SUBMIT ONLY EXCEL VERSION--DROP DOWN CRITERIA ONLY IN EXCEL VERSION
124Appendix A
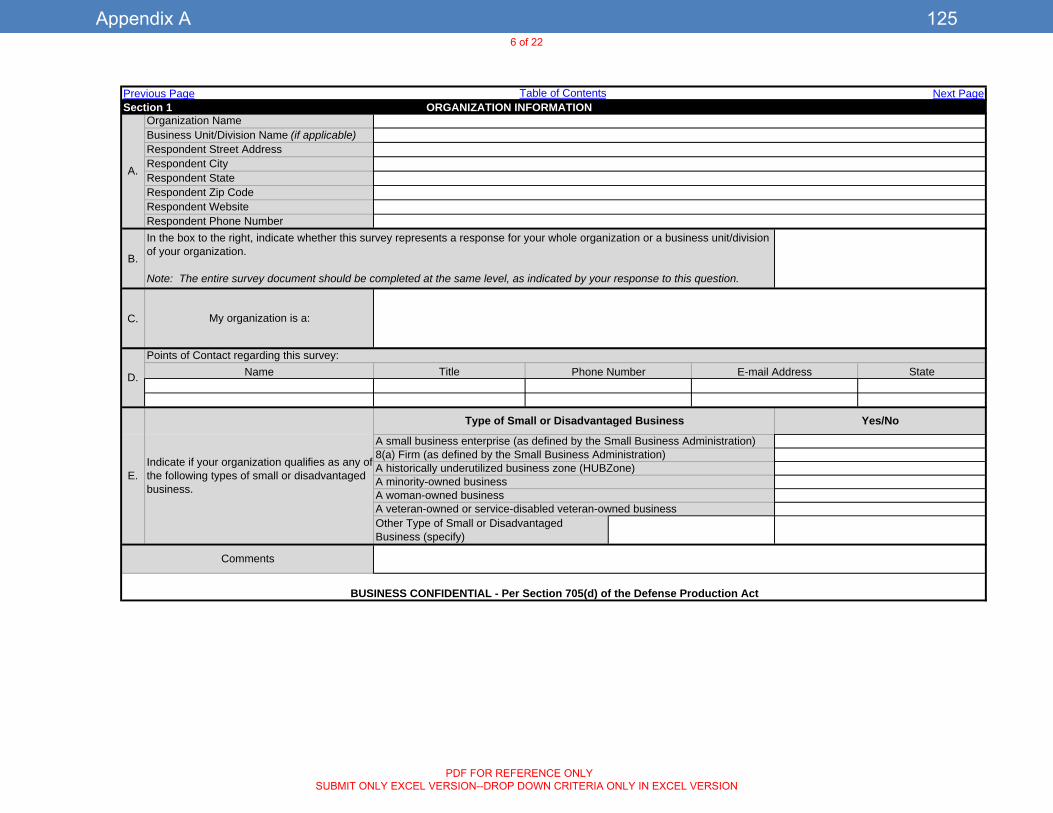
Previous Page Next Page
B.
C.
Title State
Respondent State
Respondent Website
Table of ContentsSection 1 ORGANIZATION INFORMATION
A.
Organization NameBusiness Unit/Division Name (if applicable)Respondent Street AddressRespondent City
In the box to the right, indicate whether this survey represents a response for your whole organization or a business unit/division of your organization.
Note: The entire survey document should be completed at the same level, as indicated by your response to this question.
Respondent Zip Code
Respondent Phone Number
D.
Points of Contact regarding this survey:Name Phone Number E-mail Address
A veteran-owned or service-disabled veteran-owned businessA woman-owned business
Yes/NoType of Small or Disadvantaged Business
A small business enterprise (as defined by the Small Business Administration)
BUSINESS CONFIDENTIAL - Per Section 705(d) of the Defense Production Act
A historically underutilized business zone (HUBZone)
Comments
E.Indicate if your organization qualifies as any of the following types of small or disadvantaged business.
Other Type of Small or Disadvantaged Business (specify)
My organization is a:
8(a) Firm (as defined by the Small Business Administration)
A minority-owned business
6 of 22
PDF FOR REFERENCE ONLY
SUBMIT ONLY EXCEL VERSION--DROP DOWN CRITERIA ONLY IN EXCEL VERSION
125Appendix A
Previous Page Next Page
A.
1.2.3.4.5.6.7.8.9.
10.11.12.13.14.15.16.17.18.19.20.21.22.23.24.25.26.27.28.29.30.31.32.33.34.35.
Section 2 Satellites
Satellite Name
Does your organization know the name and/or country of origin of the satellite from which your organization receives commercial EO satellite imagery directly or indirectly?
Table of Contents
Comments:
BUSINESS CONFIDENTIAL - Per Section 705(d) of the Defense Production Act
If you answered "Yes" to Question A, identify each satellite by name from which your organization currently receives commercial EO satellite imagery directly or indirectly, and/or indicate the country of origin from the drop-down, if known.
Note: For satellites owned by a joint-venture, select one country to represent the satellite in the country of origin box.
B.
Country of Origin
7 of 22
PDF FOR REFERENCE ONLY
SUBMIT ONLY EXCEL VERSION--DROP DOWN CRITERIA ONLY IN EXCEL VERSION
126Appendix A

Previous Page Next Page
U.S. DefenseU.S. Non-Defense
Government
U.S. Commercial
Foreign Government/ Commercial
Other (specify)
1.2.3.4.5.6.7.8.9.10.11.12.13.14.15.16.17.18.19.20.21.22.23.24.25.
Collaborative ToolsComputers/HardwareComputers/SoftwareConsulting
Full Motion VideoGeographic Information Systems Geospatial R&D
Cyber Security/Encryption/Secure
Education & Training
BUSINESS CONFIDENTIAL - Per Section 705(d) of the Defense Production Act
Global PositioningImage ProcessingImagery Provider
3D ModelingAerial ImagingAnalytics SoftwareApplication DeliveryCameras
Cloud Computing Services & SupportClient Server Technology
6: Non-U.S. Supplier (specify) and GeoEye7: Non-U.S. Supplier (specify) and both DigitalGlobe and GeoEye8: Non-U.S. Supplier (specify) and other U.S. Supplier (specify)9: Only Non-U.S. Suppliers (specify)10: Not Sure
Geospatial Software
Comments:
Data FusionData SharingData StorageDisplay HardwareDocument & Media Exploitation
Table of ContentsSection 3.a PRODUCTS AND SERVICES Sections 3.a and 3.b include a list of 50 product and service areas. Identify which of the following product and service areas your organization participates in. Next, identify your U.S. and Non-U.S. commercial EO satellite imagery suppliers that support each product/service area selected using the 1-10 options below. Finally, for each product/service area selected, indicate whether the customer is U.S. Defense, U.S. Non-Defense Government (e.g. NASA, NOAA, etc.), U.S. Commercial, Foreign Government/Commercial and/or Other (specify in box provided). Select all that apply.
Product or Service AreaParticipate in
Product/Service Area?
Commercial Imagery Supplier
Customer Type
Commercial Imagery Supplier Options:
1: DigitalGlobe2: GeoEye3: Both DigitalGlobe and GeoEye4: Other U.S. Supplier (specify in box to right)5: Non-U.S. Supplier (specify) and DigitalGlobe
Note: Commercial imagery suppliers can include resellers.
Specify Name of Commercial Imagery Supplier
8 of 22
PDF FOR REFERENCE ONLY
SUBMIT ONLY EXCEL VERSION--DROP DOWN CRITERIA ONLY IN EXCEL VERSION
127Appendix A

Previous Page Table of Contents Next Page
U.S. DefenseU.S. Non-Defense
Government
U.S. Commercial
Foreign Government/ Commercial
Other (specify)
26.27.28.29.30.31.32.33.34.35.36.37.38.39.40.41.42.43.44.45.46.47.
48. Other (Specify)
49. Other (Specify)
50. Other (Specify)
Unmanned Vehicles
Video Analysis
Comments:
Remote Sensing
Media
Visualization Software
BUSINESS CONFIDENTIAL - Per Section 705(d) of the Defense Production Act
Synthetic Aperture RadarSystems Integrators
Sections 3.a and 3.b include a list of 50 product and service areas. Identify which of the following product and service areas your organization participates in. Next, identify your U.S. and Non-U.S. commercial EO satellite imagery suppliers that support each product/service area selected using the 1-10 options below. Finally, for each product/service area selected, indicate whether the customer is U.S. Defense, U.S. Non-Defense Government (e.g. NASA, NOAA, etc.), U.S. Commercial, Foreign Government/Commercial and/or Other (specify in box provided). Select all that apply.
Commercial Imagery Supplier Options:
1: DigitalGlobe2: GeoEye3: Both DigitalGlobe and GeoEye4: Other U.S. Supplier (specify in box to right)5: Non-U.S. Supplier (specify) and DigitalGlobe
Note: Commercial imagery suppliers can include resellers.
6: Non-U.S. Supplier (specify) and GeoEye7: Non-U.S. Supplier (specify) and both DigitalGlobe and GeoEye8: Non-U.S. Supplier (specify) and other U.S. Supplier (specify)9: Only Non-U.S. Suppliers (specify)10: Not Sure
Specify Name of Commercial Imagery Supplier
Mission Ground SystemsMobile Wireless Networking
Light Detection And Ranging (LiDAR)Location Based Services
Storage & Server Technology
Mapping/Geospatial Data
SimulationStorage Optimization
ModelingMulti-Sensor Data CollectionNetwork Implementation & InfrastructureOpen Source Intelligence
Section 3.b PRODUCTS AND SERVICES (cont.)
Participate in Product/Service
Area?Commercial Imagery Supplier Product or Service Area
Customer Type
Optics
Information ManagementIntelligence Support Systems
9 of 22
PDF FOR REFERENCE ONLY
SUBMIT ONLY EXCEL VERSION--DROP DOWN CRITERIA ONLY IN EXCEL VERSION
128Appendix A

Previous Page Next Page
A.
Other Provider (specify)Other Provider (specify)Other Provider (specify)
Other Provider (specify)Other Provider (specify)Other Provider (specify)
Direct Providers Record in $ Thousands, e.g. $12,000.00 = survey input of $12
Section 4.a PURCHASE OF COMMERCIAL EO SATELLITE IMAGERY
Source of Revenue Data:
2008DigitalGlobeGeoEye
2009 2010 2011 2012
Table of Contents
Reporting Schedule:
If "Yes", record the total amount of U.S. commercial EO satellite imagery directly and indirectly purchased, in dollars, from each of the providers below between 2008 and 2012. If you have purchased commercial EO satellite imagery from other providers, provide this information in the text boxes below. Full-year estimates should be provided for 2012.
Note: If your organization has sourced commercial EO satellite imagery from vendors other than DigitalGlobe and GeoEye, provide up to 3 of the most significant additional vendors by total dollars.Note: Calendar year data preferred.
Does your organization purchase U.S. commercial EO satellite imagery directly or indirectly?
Note: For imagery donated to your organization, include in Section 4.d.
Indirect Providers Record in $ Thousands, e.g. $12,000.00 = survey input of $12
Comments:
GeoEye
2008
INDIRECT PROVIDERS
2009 2010 2011 2012
BUSINESS CONFIDENTIAL - Per Section 705(d) of the Defense Production Act
DigitalGlobe
B.
DIRECT PROVIDERS
10 of 22
PDF FOR REFERENCE ONLY
SUBMIT ONLY EXCEL VERSION--DROP DOWN CRITERIA ONLY IN EXCEL VERSION
129Appendix A

Previous Page Table of Contents Next Page
A.
Other Provider (specify)Other Provider (specify)Other Provider (specify)
Record in Square Kilometers2008 2009 2010 2011 2012
Reporting Schedule:
Provider
Section 4.b PURCHASE OF COMMERCIAL EO SATELLITE IMAGERY (cont.)
Does your organization purchase U.S. commercial EO satellite imagery by area (e.g. kilometers or square nautical miles)?
Note: For imagery donated to your organization, include in Section 4.d.
If "Yes", record the total amount of U.S. commercial EO satellite imagery purchased, in square kilometers*, from each of the providers below between 2008 and 2012. If you have purchased commercial EO satellite imagery from other providers, record this information in the boxes below. Full-year estimates should be provided for 2012.
Note: If your organization has sourced commercial EO satellite imagery from providers other than DigitalGlobe and GeoEye, provide up to 3 of the most significant additional providers by total number of square kilometers sourced.Note: Calendar year data preferred.
*Please convert any other unit of area into square kilometers.
Source of Data:
GeoEyeDigitalGlobe
Comments:
BUSINESS CONFIDENTIAL - Per Section 705(d) of the Defense Production Act
B.
11 of 22
PDF FOR REFERENCE ONLY
SUBMIT ONLY EXCEL VERSION--DROP DOWN CRITERIA ONLY IN EXCEL VERSION
130Appendix A

Previous Page Table of Contents Next Page
A.
Other Vendor (specify)Other Vendor (specify)Other Vendor (specify)Other Vendor (specify)Other Vendor (specify)Other Vendor (specify)Other Vendor (specify)Other Vendor (specify)Other Vendor (specify)Other Vendor (specify)
Does your organization purchase commercial EO satellite imagery-related products and/or services? Note: For imagery donated to your organization, include in Section 4.d.
DigitalGlobe -- Value Added Products/Services
Section 4.c PURCHASE OF COMMERCIAL EO SATELLITE IMAGERY RELATED SERVICES (cont.)
2012
Source of Revenue Data:Reporting Schedule:
2011
GeoEye -- Value Added Products/Services
Between 2008 and 2012, estimate the amount, in dollars, of commercial EO satellite imagery-related products and/or services that your organization has purchased from the following providers of commercial EO satellite imagery. If you have purchased commercial EO satellite imagery-related products and/or services from other U.S. and Non-U.S. vendors, record this information in the boxes below. Full-year estimates should be provided for 2012.
Note: If your organization has sourced commercial EO satellite imagery-related products and/or services from vendors other than DigitalGlobe and GeoEye, provide the 10 most significant U.S. and Non-U.S. vendors by total dollars.Note: Calendar year data preferred.
Vendor Record in $ Thousands, e.g. $12,000.00 = survey input of $122008 2009 2010
BUSINESS CONFIDENTIAL - Per Section 705(d) of the Defense Production Act
Comments:
B.
12 of 22
PDF FOR REFERENCE ONLY
SUBMIT ONLY EXCEL VERSION--DROP DOWN CRITERIA ONLY IN EXCEL VERSION
131Appendix A

Previous Page Table of Contents Next Page
A.
Other Provider (specify)Other Provider (specify)Other Provider (specify)
C.
Other Provider (specify)Other Provider (specify)Other Provider (specify)
E.
Other Provider (specify)Other Provider (specify)Other Provider (specify)Other Provider (specify)Other Provider (specify)Other Provider (specify)Other Provider (specify)Other Provider (specify)Other Provider (specify)Other Provider (specify)
Source of Revenue Data:Reporting Schedule:
Comments:
BUSINESS CONFIDENTIAL - Per Section 705(d) of the Defense Production Act
F.
Between 2008 and 2012, estimate the value, in dollars, of commercial EO satellite imagery-related products and/or services that your organization has received from the following providers of commercial EO satellite imagery. If you have received commercial EO satellite imagery-related products and/or services from other U.S. and Non-U.S. providers, record this information in the boxes below. Full-year estimates should be provided for 2012.
Note: If your organization has received commercial EO satellite imagery-related products and/or services from providers other than DigitalGlobe and GeoEye, provide the 10 most significant U.S. and Non-U.S. providers by total dollars.Note: Calendar year data preferred.
2009 2010
GeoEye -- Value Added Products/Services
2011 2012DigitalGlobe -- Value Added Products/Services
Provider Record in $ Thousands, e.g. $12,000.00 = survey input of $122008
Comments:
Does your organization receive donated commercial EO satellite imagery-related products and/or services?
GeoEyeDigitalGlobe
Comments:
Does your organization receive donated commercial EO satellite imagery by area (e.g. square nautical miles or kilometers)?
D.
Record the total amount of donated U.S. commercial EO satellite imagery received, in square kilometers*, from each of the providers below between 2008 and 2012. If you have received commercial EO satellite imagery from other sources, provide this information in the boxes below. Full-year estimates should be provided for 2012.
Note: Calendar year data preferred.
*Please convert any other unit of area into square kilometers.
Source of Data:Reporting Schedule:
Provider Record in Square Kilometers2008 2009 2010 2011 2012
DigitalGlobeGeoEye
Section 4.d DONATION OF COMMERCIAL EO SATELLITE IMAGERY AND RELATED SERVICES
Has your organization received donated U.S. commercial EO satellite imagery since 2008?
B.
If "Yes", record the total value of donated U.S. commercial EO satellite imagery received, in dollars, from each of the providers below between 2008 and 2012. If you have received commercial EO satellite imagery from other sources, provide this information in the boxes below. Full-year estimates should be provided for 2012.
Note: Calendar year data preferred. Source of Revenue Data:
Reporting Schedule:
Provider Record in $ Thousands, e.g. $12,000.00 = survey input of $122008 2009 2010 2011 2012
13 of 22
PDF FOR REFERENCE ONLY
SUBMIT ONLY EXCEL VERSION--DROP DOWN CRITERIA ONLY IN EXCEL VERSION
132Appendix A
Previous Page Table of Contents Next Page
a.
b.
Reporting Schedule:Record in $ Thousands, e.g. $12,000.00 = survey input of $12
Net Sales (and other revenue)
2008 2009 20122010
Section 5 SALES RELATED TO COMMERCIAL EO SATELLITE IMAGERY
A.
Record your annual net sales (and other revenue) as indicated on the top line of your income statement (profit and loss statement) for years 2008-2012. Then, as a percentage of annual net sales (and other revenue), estimate the revenue related to commercial EO satellite imagery. Full-year estimates should be provided for 2012.
Note: Universities and NGO's do not fill out this section. Indicate your type of organization in the Source of Data drop-down and continue to Section 6. Note: Calendar year data preferred.
Source of Data:
2011
BUSINESS CONFIDENTIAL - Per Section 705(d) of the Defense Production Act
Comments:
Revenue related to commercial EO satellite imagery [as a percent of a.]
14 of 22
PDF FOR REFERENCE ONLY
SUBMIT ONLY EXCEL VERSION--DROP DOWN CRITERIA ONLY IN EXCEL VERSION
133Appendix A

Previous Page Table of Contents Next Page
A.
a.
b.
BUSINESS CONFIDENTIAL - Per Section 705(d) of the Defense Production Act
2009
Comments:
Total R&D Expenditures
Did your organization conduct R&D between 2008 and 2012?
B.2010 2011
R&D expenditures related to commercial EO satellite imagery [as a percent of a.]
Record your annual R&D expenditures for years 2008-2012 below. Then, as a percentage of total R&D spending, estimate the R&D expenditures related to commercial EO satellite imagery. Full-year estimates should be provided for 2012. Note: Calendar year data preferred.
2008
Section 6 RESEARCH AND DEVELOPMENT (R&D) RELATED TO COMMERCIAL EO SATELLITE IMAGERY
Source of R&D Data:Reporting Schedule:
Record in $ Thousands, e.g. $12,000.00 = survey input of $122012
15 of 22
PDF FOR REFERENCE ONLY
SUBMIT ONLY EXCEL VERSION--DROP DOWN CRITERIA ONLY IN EXCEL VERSION
134Appendix A

Previous Page Table of Contents Next Page
A.
a.
b.
BUSINESS CONFIDENTIAL - Per Section 705(d) of the Defense Production Act
Capital Expenditures related to commercial EO satellite imagery [as a percent of a.]
Total Capital Expenditures
Comments:
If "Yes", record your annual capital expenditures for years 2008 to 2012 below. Then, as a percentage of total capital expenditures, estimate the capital expenditures related to commercial EO satellite imagery. Full-year estimates should be provided for 2012.
Note: Calendar year data preferred.
Record in $ Thousands, e.g. $12,000.00 = survey input of $122012
Section 7 CAPITAL EXPENDITURES RELATED TO COMMERCIAL EO SATELLITE IMAGERY
Source of Capital Expenditure Data:Reporting Schedule:
Did your organization have capital expenditures between 2008 and 2012?
B.20112008 2009 2010
16 of 22
PDF FOR REFERENCE ONLY
SUBMIT ONLY EXCEL VERSION--DROP DOWN CRITERIA ONLY IN EXCEL VERSION
135Appendix A

Previous Page Table of Contents Next Page
a.
b.
2010Reporting Schedule:
2011
Section 8 EMPLOYMENT RELATED TO COMMERCIAL EO SATELLITE IMAGERYRecord your total annual full-time employment for years 2008 to 2012. Then, as a percentage of total annual full-time employment, estimate the percent of employeessupporting your organization's commercial EO satellite imagery product and services areas. Full-year estimates should be provided for 2012.
Note: Calendar year data preferred.
2012
Total Number of Full-Time Employees
Source of Employment Data:
BUSINESS CONFIDENTIAL - Per Section 705(d) of the Defense Production Act
Comments:
Full-Time Employees supporting your organization's commercial EO satellite imagery product and service areas [as a percent of a.]
A. 2008 2009
17 of 22
PDF FOR REFERENCE ONLY
SUBMIT ONLY EXCEL VERSION--DROP DOWN CRITERIA ONLY IN EXCEL VERSION
136Appendix A

Previous Page Next Page
% Change in Price of Product/Technology/Service
BUSINESS CONFIDENTIAL - Per Section 705(d) of the Defense Production Act
Does the price of your organization's products, technologies, and/or services fluctuate in response to increases in the cost of purchasing/acquiring U.S. commercial EO satellite imagery? If "Yes", estimate the percent change in price for your organization's product/technology/services for the following increases in U.S. commercial imagery costs and explain your answer.
Explain
Comments:
Increase 50%
Increase 25%
Table of ContentsSection 9.a OPERATIONS
A. U.S. Commercial EO Satellite Imagery Cost Increase Percentage
18 of 22
PDF FOR REFERENCE ONLY
SUBMIT ONLY EXCEL VERSION--DROP DOWN CRITERIA ONLY IN EXCEL VERSION
137Appendix A

Previous Page Next Page
A.
Other (specify)
Other (specify)
Table of Contents
BUSINESS CONFIDENTIAL - Per Section 705(d) of the Defense Production Act
Comments:
B.
If "Yes", select the impacts, if any, that your organization experienced as a result of the consolidation of U.S. commercial EO satellite imagery providers. Select all that apply.
Participation in U.S. Government contracts
Research & development expenditures
Section 9.b OPERATIONS (cont.)
Personnel with key skills
Did the January 2006 consolidation of U.S. commercial EO satellite imagery providers (ORBIMAGE acquired Space Imaging to form GeoEye) affect your organization?
Quality of imagery
Ability to meet U.S. Government contract obligations
Technology/products/services prices
Participation in Commercial contracts
Sales revenue
Foreign sourcing purchasing
Capital expenditures
Existing product lines
Technology/products/services costs
Lead times
New product lines
19 of 22
PDF FOR REFERENCE ONLY
SUBMIT ONLY EXCEL VERSION--DROP DOWN CRITERIA ONLY IN EXCEL VERSION
138Appendix A

Previous Page Next Page
Other (specify)
Other (specify)
Other (specify)
Other (specify)
Other (specify)
Other (specify)
Existing product lines
Comments:
Participation in U.S. Government contracts
Comments:
A.
Participation in Commercial contracts
Quality of imagery
Ability to meet U.S. Government contract obligations
Technology/products/services costs
Technology/products/services prices Exit the business
Personnel with key skills
Participation in Commercial contracts
Quality of imagery
New product lines
Foreign sourcing purchasing
Table of Contents
Participation in U.S. Government contracts
Section 9.c OPERATIONS (cont.)The following are two scenarios that could affect consumers of U.S. commercial EO satellite imagery and providers of enabling technologies/products/services. Please read scenarios A and B, and select the corresponding impacts to your organization if each scenario were to occur.
Capital expenditures
Sales revenueResearch & development expenditures
Personnel with key skills
Lead times
BUSINESS CONFIDENTIAL - Per Section 705(d) of the Defense Production Act
New product lines
B.
From the list below, select the potential impacts if your organization could only purchase from non-U.S.-based commercial EO satellite imagery providers. Select all that apply.
Existing product lines
Capital expenditures Ability to meet U.S. Government contract obligations
Technology/products/services costs Availability of imagery
From the list below, select the potential impacts that a sudden decrease in the number of U.S.-based commercial EO satellite imagery providers would have on your organization. Select all that apply.
Not Sure
No Impact
Lead times Not Sure
No Impact
Technology/products/services prices Exit the business
Research & development expenditures Sales revenue
20 of 22
PDF FOR REFERENCE ONLY
SUBMIT ONLY EXCEL VERSION--DROP DOWN CRITERIA ONLY IN EXCEL VERSION
139Appendix A

Previous Page Table of Contents Next PageSection 10 ADDITIONAL INFORMATION
A.
Are there additional factors currently affecting the commercial EO satellite imagery industry that were not addressed in this survey or that you would like to further expand on? Explain below.
B.
Are there other factors you see affecting the commercial EO satellite imagery industry in the future that were not addressed in this survey or that you would like to further expand on? Explain below.
Comments:
BUSINESS CONFIDENTIAL - Per Section 705(d) of the Defense Production Act
C.
Are there any additional comments you would like to make regarding your business operations or sectors you operate in that you believe are important? Explain below.
21 of 22
PDF FOR REFERENCE ONLY
SUBMIT ONLY EXCEL VERSION--DROP DOWN CRITERIA ONLY IN EXCEL VERSION
140Appendix A

Previous Page Table of Contents
Organization NameOrganization's Internet AddressName of Authorizing OfficialTitle of Authorizing OfficialE-mail AddressPhone Number and ExtensionDate Certified
How many hours did it take to complete this survey?
Section 11 CERTIFICATIONThe undersigned certifies that the information herein supplied in response to this questionnaire is complete and correct to the best of his/her knowledge. It is a criminal offense to willfully make a false statement or representation to any department or agency of the United States Government as to any matter within its jurisdiction (18 U.S.C.A. 1001 (1984 & SUPP. 1197))
BUSINESS CONFIDENTIAL - Per Section 705(d) of the Defense Production Act
In the box below, provide any additional comments or any other information you wish to include regarding this survey assessment.
22 of 22
PDF FOR REFERENCE ONLY
SUBMIT ONLY EXCEL VERSION--DROP DOWN CRITERIA ONLY IN EXCEL VERSION
141Appendix A

Source: U.S. Department of Commerce, Bureau of Industry and Security,
Consumers of U.S. Commercial Electro-Optical Satellite Imagery, August 2013
APPENDIX B: FULL SCENARIO IMPACT TABLES • TABULATIONS OF IMPACTS ON ALL FACTORS FOR THE 2006 INDUSTRY
CONSOLIDATION AND THE TWO SCENARIOS PRESENTED. FOR THE
SCENARIOS, TABULATIONS FOR EACH BUSINESS CATEGORIZATION IS
ALSO INCLUDED.*
*There were an insufficient number of responses on the 2006 industry consolidation for a breakdown by business category.
142

Source: U.S. Department of Commerce, Bureau of Industry and Security,
Consumers of U.S. Commercial Electro-Optical Satellite Imagery, August 2013
Impacts of the 2006 Consolidation of U.S. Commercial EO Satellite
Imagery Providers (Formation of GeoEye)
Factor (Number of Respondents) Increased Unchanged Decreased Not Sure
All Beneficial Factors 38% 39% 13% 10%
Sales Revenue (14) 50% 21% 14% 14%
Participation in Commercial Contracts (16) 50% 25% 13% 13%
Existing Product Lines (16) 44% 31% 19% 6%
Participation in USG Contracts (13) 23% 54% 8% 15%
Quality of Imagery (16) 31% 56% 6% 6%
New Product Lines (13) 31% 46% 15% 8%
Ability to Meet USG Contract Obligations (13) 23% 54% 8% 15%
All Costly Factors 26% 50% 6% 19%
R&D Expenditures (14) 36% 36% 0% 29%
Technology/Product/Service Costs (13) 31% 46% 0% 23%
Capital Expenditures (13) 31% 54% 0% 15%
Lead Times (14) 7% 64% 21% 7%
All Other Factors
Personnel with Key Skills (16) 38% 56% 0% 6%
Foreign Sourcing Purchasing (14) 36% 50% 7% 7%
Technology/Product/Service Prices (13) 23% 62% 0% 15%
98 respondents
143Appendix B

Source: U.S. Department of Commerce, Bureau of Industry and Security,
Consumers of U.S. Commercial Electro-Optical Satellite Imagery, August 2013
Scenario 1: Expected Impacts of a Sudden Decrease in the Number of
U.S.-Based Commercial Satellite Imagery Providers
Factor (Number of Respondents) Increase No Change Decrease Not Sure
All Beneficial Factors 3% 44% 25% 28%
Sales Revenue (64) 5% 36% 31% 28%
Participation in Commercial Contracts (61) 3% 39% 28% 30%
Existing Product Lines (64) 2% 50% 23% 25%
Participation in USG Contracts (60) 3% 42% 25% 30%
Quality of Imagery (63) 0% 49% 21% 30%
New Product Lines (61) 2% 43% 26% 30%
Ability to Meet USG Contract Obligations (60) 5% 48% 20% 27%
All Costly Factors 16% 50% 12% 23%
R&D Expenditures (60) 10% 53% 17% 20%
Technology/Product/Service Costs (62) 24% 47% 8% 21%
Capital Expenditures (62) 5% 56% 18% 21%
Lead Times (60) 23% 43% 5% 28%
All Other Factors
Personnel with Key Skills (61) 3% 54% 20% 23%
Foreign Sourcing Purchasing (59) 20% 41% 5% 34%
Technology/Product/Service Prices (61) 25% 49% 8% 18%
69 total respondents
144Appendix B

Source: U.S. Department of Commerce, Bureau of Industry and Security,
Consumers of U.S. Commercial Electro-Optical Satellite Imagery, August 2013
Scenario 1: Expected Impacts on Imagery Resellers/Providers of a Sudden
Decrease in the Number of U.S.-Based Commercial Satellite Imagery Providers
Factor (Number of Respondents) Increase No Change Decrease Not Sure
All Benefits 1% 25% 28% 46%
Sales Revenue 8% 8% 50% 33%
Participation in Commercial Contracts 0% 30% 30% 40%
Existing Product Lines 0% 10% 40% 50%
Participation in USG Contracts 0% 20% 20% 60%
Quality of Imagery 0% 50% 20% 30%
New Product Lines 0% 20% 30% 50%
Ability to Meet USG Contract Obligations 0% 40% 0% 60%
All Costs 25% 25% 13% 38%
R&D Expenditures 20% 30% 10% 40%
Technology/Product/Service Costs 30% 20% 10% 40%
Capital Expenditures 10% 30% 20% 40%
Lead Times 40% 20% 10% 30%
All Other Factors
Personnel with Key Skills 20% 30% 10% 40%
Foreign Sourcing Purchasing 33% 27% 3% 37%
Technology/Product/Service Prices 40% 20% 0% 40%
14 respondents
145Appendix B

Source: U.S. Department of Commerce, Bureau of Industry and Security,
Consumers of U.S. Commercial Electro-Optical Satellite Imagery, August 2013
Scenario 1: Expected Impacts on Analysis & Related Tools Providers of a Sudden
Decrease in the Number of U.S.-Based Commercial Satellite Imagery Providers
Factor (Number of Respondents) Increase No Change Decrease Not Sure
All Benefits 1% 45% 29% 24%
Sales Revenue 0% 38% 38% 25%
Participation in Commercial Contracts 3% 42% 32% 23%
Existing Product Lines 0% 56% 22% 22%
Participation in USG Contracts 0% 42% 29% 29%
Quality of Imagery 0% 48% 24% 27%
New Product Lines 0% 42% 32% 26%
Ability to Meet USG Contract Obligations 6% 47% 28% 19%
All Costs 14% 52% 12% 21%
R&D Expenditures 3% 55% 26% 16%
Technology/Product/Service Costs 28% 44% 6% 22%
Capital Expenditures 6% 66% 13% 16%
Lead Times 19% 45% 3% 32%
All Other Factors
Personnel with Key Skills 0% 55% 23% 23%
Foreign Sourcing Purchasing 14% 52% 10% 24%
Technology/Product/Service Prices 25% 47% 13% 16%
49 respondents
146Appendix B

Source: U.S. Department of Commerce, Bureau of Industry and Security,
Consumers of U.S. Commercial Electro-Optical Satellite Imagery, August 2013
Scenario 1: Expected Impacts on Engineering/Support Service Providers of a Sudden
Decrease in the Number of U.S.-Based Commercial Satellite Imagery Providers
Factor (Number of Respondents) Increase No Change Decrease Not Sure
All Benefits 3% 58% 16% 22%
Sales Revenue 8% 54% 15% 23%
Participation in Commercial Contracts 8% 46% 15% 31%
Existing Product Lines 0% 57% 29% 14%
Participation in USG Contracts 8% 50% 25% 17%
Quality of Imagery 0% 73% 0% 27%
New Product Lines 0% 58% 17% 25%
Ability to Meet USG Contract Obligations 0% 73% 9% 18%
All Costs 10% 69% 13% 8%
R&D Expenditures 8% 83% 8% 0%
Technology/Product/Service Costs 23% 69% 8% 0%
Capital Expenditures 0% 50% 33% 17%
Lead Times 9% 73% 0% 18%
All Other Factors
Personnel with Key Skills 0% 75% 17% 8%
Foreign Sourcing Purchasing 0% 33% 0% 67%
Technology/Product/Service Prices 25% 75% 0% 0%
20 respondents
147Appendix B

Source: U.S. Department of Commerce, Bureau of Industry and Security,
Consumers of U.S. Commercial Electro-Optical Satellite Imagery, August 2013
Scenario 1: Expected Impacts on Universities/Non-Profits of a Sudden
Decrease in the Number of U.S.-Based Commercial Satellite Imagery Providers
Factor (Number of Respondents) Increase No Change Decrease Not Sure
All Benefits 9% 42% 17% 32%
Sales Revenue 14% 43% 0% 43%
Participation in Commercial Contracts 0% 29% 29% 43%
Existing Product Lines 13% 63% 0% 25%
Participation in USG Contracts 14% 29% 29% 29%
Quality of Imagery 0% 22% 33% 44%
New Product Lines 13% 50% 13% 25%
Ability to Meet USG Contract Obligations 14% 29% 29% 29%
All Costs 17% 43% 10% 30%
R&D Expenditures 29% 29% 0% 43%
Technology/Product/Service Costs 0% 57% 14% 29%
Capital Expenditures 0% 63% 13% 25%
Lead Times 38% 25% 13% 25%
All Other Factors
Personnel with Key Skills 0% 50% 25% 25%
Foreign Sourcing Purchasing 50% 25% 0% 25%
Technology/Product/Service Prices 0% 57% 14% 29%
15 respondents
148Appendix B

Source: U.S. Department of Commerce, Bureau of Industry and Security,
Consumers of U.S. Commercial Electro-Optical Satellite Imagery, August 2013
Scenario 2: Expected Impacts if Respondents Could Only Purchase
From Non-U.S. Based Commercial EO Satellite Imagery Providers
Factor (Number of Respondents) Increase No Change Decrease Not Sure
All Beneficial Factors 4% 36% 35% 25%
Sales Revenue (60) 2% 33% 37% 28%
Participation in Commercial Contracts (59) 3% 41% 34% 22%
Existing Product Lines (59) 3% 41% 34% 22%
Participation in USG Contracts (60) 5% 37% 33% 25%
Quality of Imagery (62) 3% 27% 44% 26%
New Product Lines (58) 7% 38% 34% 21%
Ability to Meet USG Contract Obligations (60) 3% 35% 30% 32%
All Costly Factors 24% 44% 11% 21%
R&D Expenditures (58) 16% 50% 17% 17%
Technology/Product/Service Costs (58) 33% 40% 5% 22%
Capital Expenditures (58) 14% 48% 19% 19%
Lead Times (59) 34% 39% 3% 24%
All Other Factors
Personnel with Key Skills (57) 4% 56% 19% 21%
Availability of Imagery (62) 2% 23% 52% 24%
Technology/Product/Service Prices (57) 35% 42% 4% 19%
67 total respondents
149Appendix B

Source: U.S. Department of Commerce, Bureau of Industry and Security,
Consumers of U.S. Commercial Electro-Optical Satellite Imagery, August 2013
Scenario 2: Expected Impacts on Imagery Resellers/Providers if Respondents Could
Only Purchase From Non-U.S. Based Commercial EO Satellite Imagery Providers
Factor (Number of Respondents) Increase No Change Decrease Not Sure
All Benefits 6% 5% 52% 38%
Sales Revenue 0% 10% 70% 20%
Participation in Commercial Contracts 11% 0% 56% 33%
Existing Product Lines 11% 0% 56% 33%
Participation in USG Contracts 0% 11% 33% 56%
Quality of Imagery 11% 0% 67% 22%
New Product Lines 11% 0% 67% 22%
Ability to Meet USG Contract Obligations 0% 11% 11% 78%
All Costs 44% 14% 19% 22%
R&D Expenditures 33% 22% 22% 22%
Technology/Product/Service Costs 33% 11% 22% 33%
Capital Expenditures 33% 11% 33% 22%
Lead Times 78% 11% 0% 11%
All Other Factors
Personnel with Key Skills 22% 22% 33% 22%
Availability of Imagery 0% 11% 78% 11%
Technology/Product/Service Prices 56% 11% 11% 22%
14 respondents
150Appendix B

Source: U.S. Department of Commerce, Bureau of Industry and Security,
Consumers of U.S. Commercial Electro-Optical Satellite Imagery, August 2013
Scenario 2: Expected Impacts on Analysis & Related Tools Providers if Respondents
Could Only Purchase From Non-U.S. Based Commercial EO Satellite Imagery Providers
Factor (Number of Respondents) Increase No Change Decrease Not Sure
All Benefits 1% 35% 39% 25%
Sales Revenue 0% 31% 44% 25%
Participation in Commercial Contracts 0% 44% 34% 22%
Existing Product Lines 0% 42% 35% 23%
Participation in USG Contracts 3% 35% 41% 21%
Quality of Imagery 0% 26% 44% 29%
New Product Lines 3% 35% 32% 29%
Ability to Meet USG Contract Obligations 3% 29% 41% 26%
All Costs 22% 41% 12% 26%
R&D Expenditures 10% 48% 19% 23%
Technology/Product/Service Costs 39% 33% 3% 24%
Capital Expenditures 13% 47% 19% 22%
Lead Times 24% 36% 6% 33%
All Other Factors
Personnel with Key Skills 0% 48% 23% 29%
Availability of Imagery 0% 18% 53% 29%
Technology/Product/Service Prices 34% 38% 3% 25%
49 respondents
151Appendix B

Source: U.S. Department of Commerce, Bureau of Industry and Security,
Consumers of U.S. Commercial Electro-Optical Satellite Imagery, August 2013
Scenario 2: Expected Impacts on Engineering/Support Service Providers if Respondents
Could Only Purchase From Non-U.S. Based Commercial EO Satellite Imagery Providers
Factor (Number of Respondents) Increase No Change Decrease Not Sure
All Benefits 4% 67% 14% 15%
Sales Revenue 0% 55% 9% 36%
Participation in Commercial Contracts 9% 55% 18% 18%
Existing Product Lines 0% 82% 18% 0%
Participation in USG Contracts 10% 60% 10% 20%
Quality of Imagery 0% 70% 10% 20%
New Product Lines 10% 70% 20% 0%
Ability to Meet USG Contract Obligations 0% 80% 10% 10%
All Costs 3% 84% 5% 8%
R&D Expenditures 0% 90% 10% 0%
Technology/Product/Service Costs 11% 78% 0% 11%
Capital Expenditures 0% 80% 10% 10%
Lead Times 3% 84% 5% 8%
All Other Factors
Personnel with Key Skills 0% 90% 10% 0%
Availability of Imagery 0% 60% 10% 30%
Technology/Product/Service Prices 22% 78% 0% 0%
20 respondents
152Appendix B

Source: U.S. Department of Commerce, Bureau of Industry and Security,
Consumers of U.S. Commercial Electro-Optical Satellite Imagery, August 2013
Scenario 2: Expected Impacts on Universities/Non-Profits if Respondents Could Only
Purchase From Non-U.S. Based Commercial EO Satellite Imagery Providers
Factor (Number of Respondents) Increase No Change Decrease Not Sure
All Benefits 11% 36% 28% 25%
Sales Revenue 14% 43% 0% 43%
Participation in Commercial Contracts 0% 57% 29% 14%
Existing Product Lines 13% 25% 25% 38%
Participation in USG Contracts 14% 43% 29% 14%
Quality of Imagery 11% 11% 56% 22%
New Product Lines 13% 50% 25% 13%
Ability to Meet USG Contract Obligations 14% 29% 29% 29%
All Costs 37% 43% 7% 13%
R&D Expenditures 38% 38% 13% 13%
Technology/Product/Service Costs 29% 57% 0% 14%
Capital Expenditures 14% 57% 14% 14%
Lead Times 63% 25% 0% 13%
All Other Factors
Personnel with Key Skills 0% 86% 0% 14%
Availability of Imagery 11% 11% 67% 11%
Technology/Product/Service Prices 29% 57% 0% 14%
15 respondents
153Appendix B

Source: U.S. Department of Commerce, Bureau of Industry and Security,
Consumers of U.S. Commercial Electro-Optical Satellite Imagery, August 2013
APPENDIX C: U.S. COMMERCIAL EO SATELLITE
IMAGERY MARKET SIZE
CALCULATIONS • DETAILS ON BIS’S ESTIMATION OF THE SIZE OF THE U.S. COMMERCIAL
EO SATELLITE IMAGERY MARKET AND THE PORTION COVERED BY THIS
SURVEY.
154
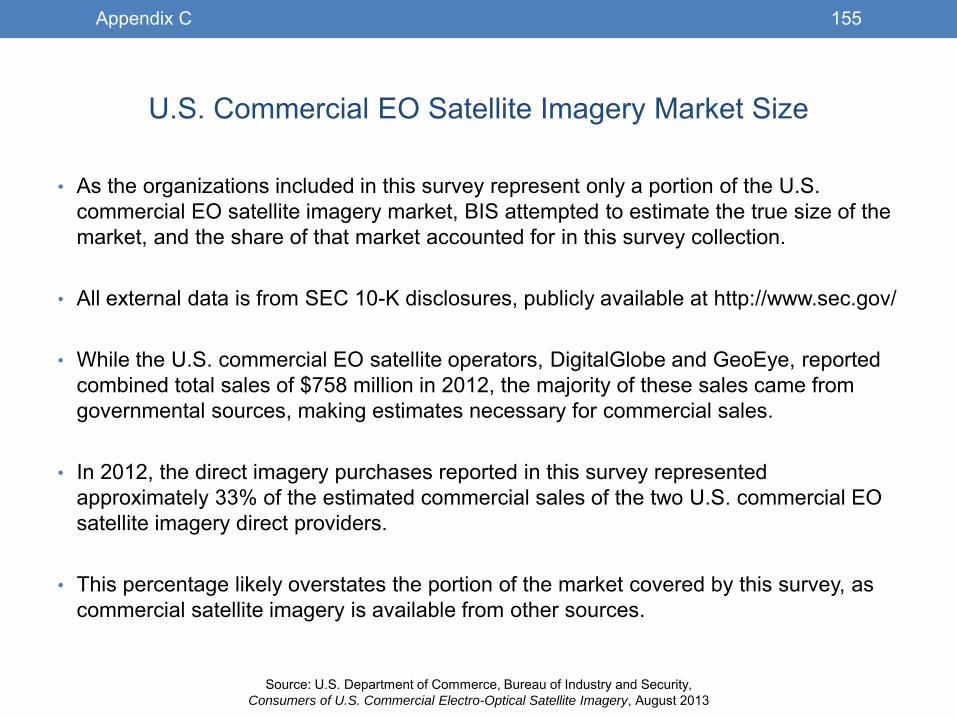
Source: U.S. Department of Commerce, Bureau of Industry and Security,
Consumers of U.S. Commercial Electro-Optical Satellite Imagery, August 2013
U.S. Commercial EO Satellite Imagery Market Size
• As the organizations included in this survey represent only a portion of the U.S.
commercial EO satellite imagery market, BIS attempted to estimate the true size of the
market, and the share of that market accounted for in this survey collection.
• All external data is from SEC 10-K disclosures, publicly available at http://www.sec.gov/
• While the U.S. commercial EO satellite operators, DigitalGlobe and GeoEye, reported
combined total sales of $758 million in 2012, the majority of these sales came from
governmental sources, making estimates necessary for commercial sales.
• In 2012, the direct imagery purchases reported in this survey represented
approximately 33% of the estimated commercial sales of the two U.S. commercial EO
satellite imagery direct providers.
• This percentage likely overstates the portion of the market covered by this survey, as
commercial satellite imagery is available from other sources.
155Appendix C
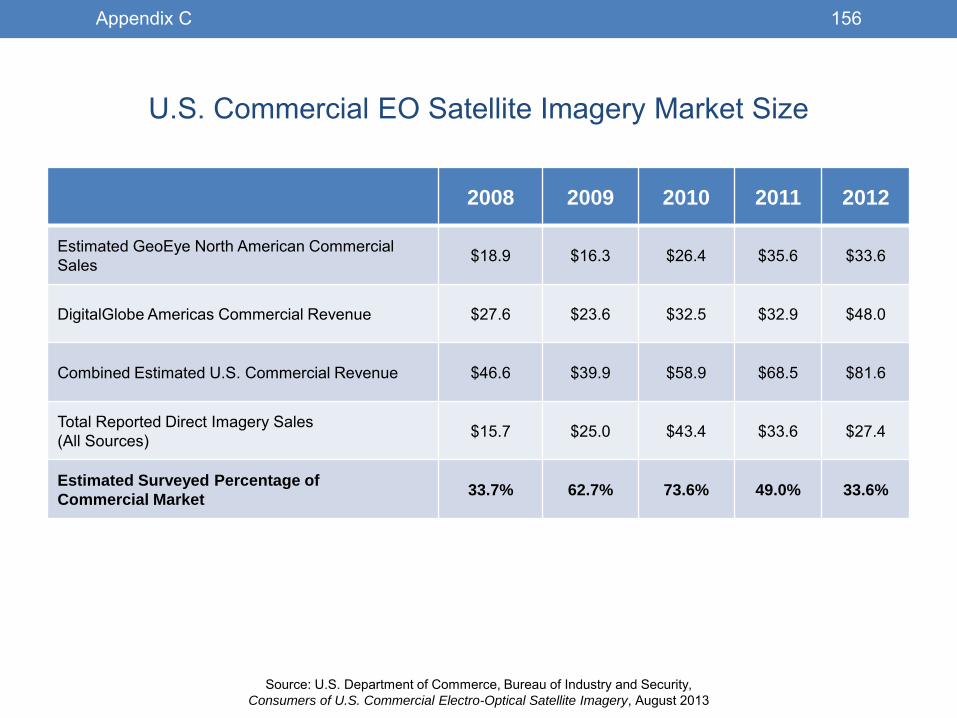
Source: U.S. Department of Commerce, Bureau of Industry and Security,
Consumers of U.S. Commercial Electro-Optical Satellite Imagery, August 2013
U.S. Commercial EO Satellite Imagery Market Size
2008 2009 2010 2011 2012
Estimated GeoEye North American Commercial
Sales $18.9 $16.3 $26.4 $35.6 $33.6
DigitalGlobe Americas Commercial Revenue $27.6 $23.6 $32.5 $32.9 $48.0
Combined Estimated U.S. Commercial Revenue $46.6 $39.9 $58.9 $68.5 $81.6
Total Reported Direct Imagery Sales
(All Sources) $15.7 $25.0 $43.4 $33.6 $27.4
Estimated Surveyed Percentage of
Commercial Market 33.7% 62.7% 73.6% 49.0% 33.6%
156Appendix C
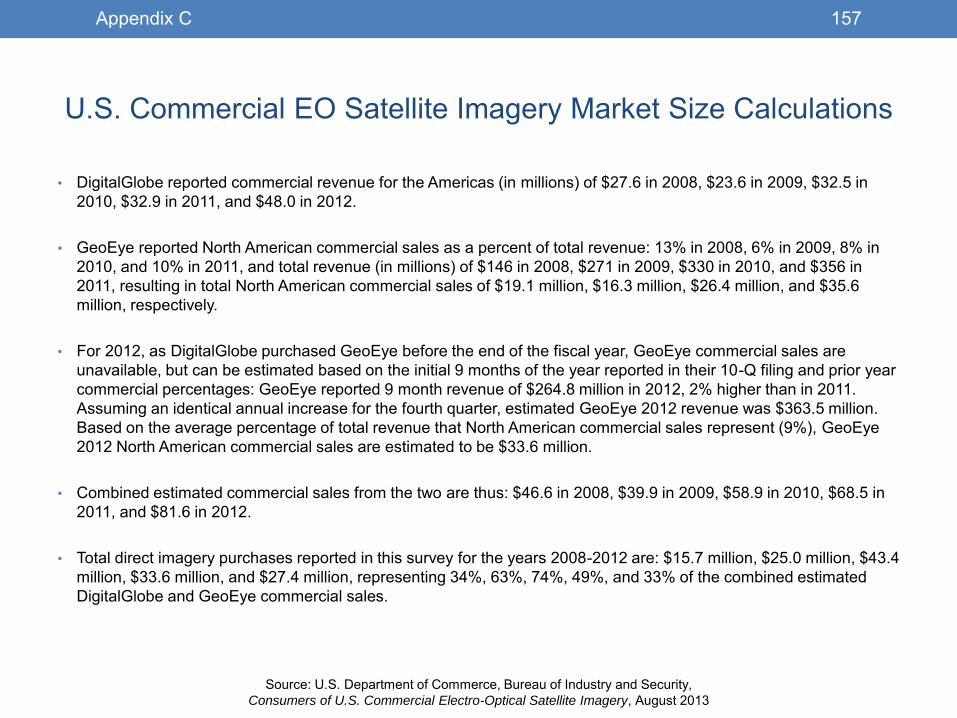
Source: U.S. Department of Commerce, Bureau of Industry and Security,
Consumers of U.S. Commercial Electro-Optical Satellite Imagery, August 2013
U.S. Commercial EO Satellite Imagery Market Size Calculations
• DigitalGlobe reported commercial revenue for the Americas (in millions) of $27.6 in 2008, $23.6 in 2009, $32.5 in
2010, $32.9 in 2011, and $48.0 in 2012.
• GeoEye reported North American commercial sales as a percent of total revenue: 13% in 2008, 6% in 2009, 8% in
2010, and 10% in 2011, and total revenue (in millions) of $146 in 2008, $271 in 2009, $330 in 2010, and $356 in
2011, resulting in total North American commercial sales of $19.1 million, $16.3 million, $26.4 million, and $35.6
million, respectively.
• For 2012, as DigitalGlobe purchased GeoEye before the end of the fiscal year, GeoEye commercial sales are
unavailable, but can be estimated based on the initial 9 months of the year reported in their 10-Q filing and prior year
commercial percentages: GeoEye reported 9 month revenue of $264.8 million in 2012, 2% higher than in 2011.
Assuming an identical annual increase for the fourth quarter, estimated GeoEye 2012 revenue was $363.5 million.
Based on the average percentage of total revenue that North American commercial sales represent (9%), GeoEye
2012 North American commercial sales are estimated to be $33.6 million.
• Combined estimated commercial sales from the two are thus: $46.6 in 2008, $39.9 in 2009, $58.9 in 2010, $68.5 in
2011, and $81.6 in 2012.
• Total direct imagery purchases reported in this survey for the years 2008-2012 are: $15.7 million, $25.0 million, $43.4
million, $33.6 million, and $27.4 million, representing 34%, 63%, 74%, 49%, and 33% of the combined estimated
DigitalGlobe and GeoEye commercial sales.
157Appendix C
Source: U.S. Department of Commerce, Bureau of Industry and Security,
Consumers of U.S. Commercial Electro-Optical Satellite Imagery, August 2013
APPENDIX D:
BIS PUBLICATIONS LIST • LIST OF PRIOR AND FORTHCOMING ASSESSMENTS PRODUCED BY BIS.
158

OFFICE OF TECHNOLOGY EVALUATION (OTE)
PUBLICATIONS LIST
August 1, 2013
The U.S. Department of Commerce’s Office of Technology Evaluation is the focal point within the Department for conducting assessments of defense-related industries and technologies. The studies are based on detailed industry-specific surveys used to collect information from U.S. companies and are conducted on behalf of the U.S. Congress, the military services, industry associations, or other interested parties.
PUBLICATION TITLE *Bold indicate forthcoming studies
Strategic and Critical Materials Supply Chain Assessment – Spring 2014 Cost-Metric Assessment of Diminishing Manufacturing Sources and Material Shortages (Update) – Winter 2013 Defense Industrial Base Assessment of the U.S. Underwater Acoustics Transducer Industry – Fall 2013 Assessment of the U.S. Space Industrial Base Supply Chain – Fall 2013 Industrial Base Assessment of Consumers of U.S. Electro-Optical (EO) Satellite Imagery – August 2013 National Security Assessment of the Cartridge and Propellant Actuated Device Industry: Fourth Review – July 2013 Defense Industrial Base S2T2 Survey of C4ISR Sector – Spring 2013 Critical Technology Assessment: Night Vision Focal Plane Arrays, Sensors, and Cameras – October 2012 National Aeronautics and Space Administration (NASA) Industrial Base – Post-Space Shuttle – June 2012 Defense Industrial Base Assessment of the Telecommunications Industry Infrastructure – April 2012 Reliance on Foreign Sourcing in the Healthcare and Public Health (HPH) Sector – December 2011 Defense Industrial Base S2T2 Survey of Six Sectors –July 2011 Cost-Metric Assessment of Diminishing Manufacturing Sources and Material Shortages – August 2010 Critical Technology Assessment: Impact of U.S. Export Controls on Green Technology Items – August 2010 Technology Assessment of Fine Grain, High-Density Graphite – April 2010 Defense Industrial Base Assessment of Counterfeit Electronics – January 2010 Technology Assessment of 5-Axis Machine Tools – July 2009 Defense Industrial Base Assessment of U.S. Integrated Circuit Design and Fabrication Capability – March 2009 Defense Industrial Base Assessment of the U.S. Space Industry – August 2007 Technology Assessment of Certain Aromatic Polyimides – July 2007 Defense Industrial Base Assessment of U.S. Imaging and Sensors Industry – October 2006 National Security Assessment of the Cartridge and Propellant Actuated Device Industry: Third Review – August 2006 Economic Impact Assessment of the Air Force C-17 Program – December 2005 National Security Assessment of the Munitions Power Sources Industry – December 2004 National Security Assessment of the Air Delivery (Parachute) Industry – May 2004 Industry Attitudes on Collaborating with DoD in R&D – Air Force – January 2004

Industrial Base/Economic Impact Assessment of Army Theater Support Vessel Procurement – December 2003 A Survey of the Use of Biotechnology in U.S. Industry – October 2003 Industrial Base Assessment of U.S. Textile and Apparel Industries – September 2003 Technology Assessment of U.S. Assistive Technology Industry – February 2003 Heavy Manufacturing Industries: Economic Impact and Productivity of Welding – Navy – June 2002 The Effect of Imports of Iron Ore and Semi-Finished Steel on the National Security – October 2001 National Security Assessment of the U.S. High-Performance Explosives & Components Sector –June 2001 National Security Assessment of the U.S. Shipbuilding and Repair Industry - May 2001 Statistical Handbook of the Ball and Roller Bearing Industry (Update) - June 2001 National Security Assessment of the Cartridge and Propellant Actuated Device Industry: Update - December 2000
Archived Studies The Effect on the National Security of Imports of Crude Oil and Refined Petroleum Products - November 1999 National Security Assessment of the Antifriction Bearings Industry - February 1993
U.S. Commercial Technology Transfers to The People’s Republic of China – January 1999 National Security Assessment of the U.S. Forging Industry - December 1992
Critical Technology Assessment of Optoelectronics - October 1998 The Effect of Imports of Gears & Gearing Products on the National Security – July 1992
National Security Assessment of the Emergency Aircraft Ejection Seat Sector - November 1997
Natl. Sec. Assessment of the Dom. and For. Subcontractor Base~3 US Navy Systems - March 1992
Critical Technology Assessment of the U.S. Semiconductor Materials Industry - April 1997
Natl. Sec. Assessment of the U.S. Semiconductor Wafer Processing Equipment Industry - April 1991
National Security Assessment of the Cartridge and Propellant Actuated Device Industry - October 1995 National Security Assessment of the U.S. Robotics Industry - March 1991
A Study of the International Market for Computer Software with Encryption – NSA -1995 National Security Assessment of the U.S. Gear Industry - January 1991
The Effect of Imports of Crude Oil and Petroleum Products on the National Security - December 1994 The Effect of Imports of Uranium on the National Security – Sept. 1989
Critical Technology Assessment of U.S. Artificial Intelligence - August 1994 The Effect of Imports of Crude Oil and Refined Petroleum on Natl. Security – Jan. 1989
Critical Technology Assessment of U.S. Superconductivity - April 1994 The Effect of Imports of Plastic Injection Molding Machines on Natl. Security – Jan. 1989
Critical Technology Assessment of U.S. Optoelectronics - February 1994 The Effect of Imports of Anti-Friction Bearings on the Natl. Security - July 1988
Critical Technology Assessment of U.S. Advanced Ceramics - December 1993 Investment Castings: A Natl. Security Assessment – Dec. 1987
Critical Technology Assessment of U.S. Advanced Composites - December 1993 An Economic Assessment of the U.S. Industrial Fastener Industry – Mar. 1987 The Effect of Imports of Ceramic Semiconductor Packages on the National Security - August 1993 Joint Logistics Commanders/DOC Precision Optics Study - June 1987
National Security Assessment of the U.S. Beryllium Industry - July 1993 Joint Logistics Commanders/DOC Bearing Study - June 1986
For further information about OTE’s programs or for additional copies of reports, please visit us at http://www.bis.doc.gov/dib or contact:
Brad Botwin, Director, Industrial Base Studies, OTE Phone: 202-482-4060 Fax: 202-482-5650 E-mail: [email protected]