Consumer Trends - Sweet Spreads in the United · PDF fileConsumer Trends . Sweet Spreads in...
12
MARKET ACCESS SECRETARIAT Global Analysis Report Consumer Trends Sweet Spreads in the United Kingdom December 2013 MARKET SNAPSHOT Sweet spreads, including jams, marmalades, honeys, nut butters and chocolate spreads are a household staple in the United Kingdom (U.K.), offering British consumers an easy and relatively low-cost accompaniment for their breakfast or afternoon tea. British sales of sweet spreads were valued at US$791.6 million in 2012, representing a 5% increase over 2011 and a 30.8% increase since 2007. However, rising commodity prices continue to impact the spreads market, particularly fruit and nut products, as evidenced by the smaller gains recorded in volume sales, which grew by 2% from 2011 to 2012 (Euromonitor, 2013). Changing consumer preferences and cautious spending are impacting the types of sweet spreads that Britons are buying. While sales have increased overall, market growth is particularly evident in the non-traditional segments of chocolate spreads and nut/seed- based spreads, largely at the expense of jams and other fruit-based products. This trend is expected to accelerate over the forecast period of 2012 to 2017. However, jam is expected to remain the largest subcategory over this time period, due to an already-high market penetration and the reinvigoration of products by manufacturers. To grow consumer interest, new sweet spread products are being launched in the British market with an emphasis on premium qualities and eco-awareness attributes, such as “vegetarian” and “environmentally friendly packaging.” Playing into the health and wellness trend with products promoting “minus” claims, such as “low/no/reduced sugar or fat,” is becoming a less prominent tactic, with consumers typically perceiving sweet spreads as a sort of indulgence. CONTENTS Market Snapshot ............................ 1 Consumer Trends........................... 2 Market Sizes ................................... 3 Market Share by Company and Brand ....................................... 5 Distribution Channels ..................... 6 New Product Launches .................. 7 New Product Examples .................. 9 Resources .................................... 11
Transcript of Consumer Trends - Sweet Spreads in the United · PDF fileConsumer Trends . Sweet Spreads in...

MARKET ACCESS SECRETARIAT Global Analysis Report
Consumer Trends
Sweet Spreads in the United Kingdom December 2013
MARKET SNAPSHOT Sweet spreads, including jams, marmalades, honeys, nut butters and chocolate spreads are a household staple in the United Kingdom (U.K.), offering British consumers an easy and relatively low-cost accompaniment for their breakfast or afternoon tea. British sales of sweet spreads were valued at US$791.6 million in 2012, representing a 5% increase over 2011 and a 30.8% increase since 2007. However, rising commodity prices continue to impact the spreads market, particularly fruit and nut products, as evidenced by the smaller gains recorded in volume sales, which grew by 2% from 2011 to 2012 (Euromonitor, 2013). Changing consumer preferences and cautious spending are impacting the types of sweet spreads that Britons are buying. While sales have increased overall, market growth is particularly evident in the non-traditional segments of chocolate spreads and nut/seed-based spreads, largely at the expense of jams and other fruit-based products. This trend is expected to accelerate over the forecast period of 2012 to 2017. However, jam is expected to remain the largest subcategory over this time period, due to an already-high market penetration and the reinvigoration of products by manufacturers. To grow consumer interest, new sweet spread products are being launched in the British market with an emphasis on premium qualities and eco-awareness attributes, such as “vegetarian” and “environmentally friendly packaging.” Playing into the health and wellness trend with products promoting “minus” claims, such as “low/no/reduced sugar or fat,” is becoming a less prominent tactic, with consumers typically perceiving sweet spreads as a sort of indulgence.
CONTENTS Market Snapshot ............................ 1
Consumer Trends ........................... 2
Market Sizes ................................... 3
Market Share by Company and Brand ....................................... 5
Distribution Channels ..................... 6
New Product Launches .................. 7
New Product Examples .................. 9
Resources .................................... 11

Page | 2
MARKET SNAPSHOT (continued) According to Euromonitor and Mintel, opportunities for sweet spreads can be found in the form of ingredients within baking and home-cooking, which are both experiencing a resurgence of interest in the U.K. Potential for market expansion may also be found in the “adultification” and premiumization of nut- and chocolate-based spreads, which are typically targeted at children, as more and more consumers integrate these products into their breakfast and snacking routines. CONSUMER TRENDS British consumers are seeking affordable, high-quality and health-conscious products, presenting both opportunities and challenges to the sweet spreads market. Breakfast remains the primary usage occasion for sweet spreads. A 2012 Mintel survey found that 69% of consumers who use sweet spread products do so at breakfast time (February 2013). However, British consumers, particularly younger generations, are increasingly turning to cereal, cereal bars, and breakfast options outside of the home due to the convenience they offer. Furthermore, sales of bread, the core accompaniment for sweet spreads, are expected to continue declining in the U.K. (Euromonitor, January 2013). Due to these trends, sweet spreads manufacturers will have to look beyond the breakfast market to generate sales growth. Opportunities may be found in the baking segment, due to British consumers’ resurging interest in baking and home-cooking. Mintel found that over 20% of current bakers have increased the frequency at which they do so, and 22% of current sweet spreads users already use them as an ingredient (February 2013). Offering consumers innovative and interesting ways to use sweet spreads in baking projects or for other non-breakfast eating occasions, especially snacks, could grow interest. Chocolate and nut-based spreads are already capitalizing on these changing preferences. Nutella, for example, has been investing in advertisements to emphasize the product’s versatility, with in-store, on-pack and online promotions (Euromonitor, January 2013). The brand’s value share of the British spreads market increased by almost five percentage points from 2007 to 2012 (Euromonitor, 2013). In terms of health and wellness, sweet spreads face a challenge in that they are not inherently healthy products. Mintel found that 39% of consumers were concerned about the high sugar content of sweet spreads, but only 15% would be willing to pay more for products with natural sugar-free sweeteners (see table on page 3). Furthermore, Euromonitor suggests that indulgence is a stronger sales driver than healthfulness in this particular market, finding that many reduced-sugar and reduced-fat jams were discontinued in recent years in favour of premiumized lines. Manufacturers are trying to appeal to consumers’ sense of indulgence and add value to sweet spreads through claims of heightened quality, provenance, and the sourcing of fine ingredients, rather than an emphasis on lowered sugar or fat content. The prominent claims found on recent launches in the sweet spreads market (see page 8 of this report) also attest to this trend. One exception would be honey, which continues to win favour due to health-oriented claims, including anti-bacterial properties, as well as pre and probiotics (Euromonitor, January 2013).
Source: Shutterstock

Page | 3
British Consumer Attitudes towards Sweet Spreads, 2013
Source: Mintel, February 2013. Survey of 1,314 British consumers of sweet spreads.
MARKET SIZES Sales of spreads in the U.K. were valued at US$792 million in 2012, representing a sales increase of almost 31% since 2007. However, volume sales grew by just 5% over the same period. This discrepancy is at least partially due to the effects of commodity price increases on this market, namely for fruit and nuts. Despite being the smallest subcategory within the spreads market with sales of US$83 million, chocolate spreads recorded the fastest growth rate, increasing by 125.7% and 66.9% in value and volume, respectively, from 2007 to 2012. Euromonitor attributes a large portion of this growth to the sales gains made by Nutella within the last few years. The second-best subcategory in terms of growth was nut- and seed-based spreads. These products are finding success through consumer interest in alternatives to traditional sweet spreads, as well as “plus” positioning, which emphasizes benefits such as high protein, vitamins and mineral content (Euromonitor, January 2013). Jams and preserves remains the most important spreads category, with sales of US$307.5 million in 2012. However, this more traditional category is posting only slight gains in value terms with a compound annual growth rate (CAGR) of 1.6% from 2007 to 2012, and actually declined in total volume sales (-2.7%) over the same period. This trend is linked to limited interest in jams and preserves among younger demographics, and a growing preference for chocolate- and nut-based spreads (Euromonitor, January 2013; Mintel, February 2013). According to Mintel (February 2013), the British spreads market poses a major barrier to growth due to the category’s traditionalist nature and already high penetration. However, the smaller sub-categories in this market present opportunities for continued growth, especially through innovative options that capitalize on premium attributes.
39
25
22
17
15
13
11
10
10
9
7
0 10 20 30 40 50
I am concerned about their sugar content
I prefer the taste of branded varieties
I use them as an ingredient in cooking/baking
I buy different varieties for different members of the household (e.g. children)
I would pay more for those made with natural, sugar-free sweetners
I have cut back on spreads because of cost
I would like to see more premium/adult varieties
I am willing to pay more for those with added benefits
I do not use them often enough for it to be worth buying them
I would like to see a wider variety of easy-to-use packaging
I have switched from jam/marmalade to peanut butter/chocolate spread
I am concerned about their sugar content
I prefer the taste of branded varieties
I use them as an ingredient in cooking/baking
I buy different varieties for different members of the household
I would pay more for those made with natural, sugar-free sweeteners
I have cut back on spreads because of cost
I would like to see more premium/adult varieties
I am willing to pay more for those with added benefits
I do not use them enough for it to be worth buying them
I would like to see a wider variety of easy-to-use packaging
I have switched from jam/marmalade to peanut butter/chocolate spread
% of Respondents

Page | 4
Spreads in the U.K. – Retail Value Sales in US$ millions
Category 2007 2008 2009 2010 2011 2012 Value growth 2007-2012 (%)
CAGR* Total Spreads 605.4 639.6 681.6 717.8 753.8 791.6 5.5 30.8 Jams and preserves 283.4 292.2 293.7 296.1 303.3 307.5 1.6 8.5 Honey 142.5 156.6 173.9 188.6 198.9 208.4 7.9 46.3 Nut/seed-based spreads 65.2 69.6 79.6 86.4 92.0 105.0 10.0 61.1 Yeast-based spreads 77.4 77.7 80.0 84.9 86.6 87.4 2.5 13.0 Chocolate spreads 36.9 43.6 54.4 62.0 73.0 83.3 17.7 125.7
Spreads in the U.K. – Retail Volume Sales in ’000 Tonnes
Category 2007 2008 2009 2010 2011 2012 Volume growth 2007-2012 (%)
CAGR* Total Spreads 108.9 111.8 111.6 112.0 113.0 114.8 1.0 5.3 Jams and preserves 66.1 66.0 65.6 65.2 64.7 64.4 -0.5 -2.7 Honey 17.5 18.8 17.9 17.5 17.4 17.4 -0.1 -0.6 Nut/seed-based spreads 11.8 12.3 12.8 13.0 13.7 14.7 4.5 24.9 Yeast-based spreads 5.6 5.5 5.2 5.4 5.3 5.1 -2.0 -9.5 Chocolate spreads 7.9 9.2 10.0 10.9 12.0 13.2 10.8 66.9
Source for all: Euromonitor 2013. *CAGR = compound annual growth rate Forecasts Spreads in the U.K. are expected to reach sales of over US$1 billion by 2017, growing in value terms by an estimated 27.9% from 2012 to 2017. However, volume sales are expected to maintain a much slower pace over the forecast period. Sales of nut- and seed-based spreads are expected to accelerate over the forecast period, becoming the fastest-growing subcategory in both value and volume terms. This may illustrate their continued success in emphasizing features such as high protein content. It may also attest to the range development Mintel expects within this particular segment, as manufacturers extend their target market for nut-based spreads beyond children (April 2013). Over the forecast period, jams and preserves are expected to maintain their prominent position within the spreads category, reaching value sales of US$374.3 million by 2017. However, volume sales are expected to continue declining, registering a CAGR of -0.7% from 2012 to 2017.

Page | 5
Spreads in the U.K. – Forecast Retail Value Sales in US$ millions
Category 2012 2013 2014 2015 2016 2017 Value growth 2012-2017 (%)
CAGR* Total Spreads 791.6 837.7 885.1 929.2 972.0 1,012.7 5.1 27.9 Jams and preserves 307.5 315.3 329.3 344.9 360.6 374.3 4.0 21.7 Honey 208.4 219.3 229.0 237.6 246.7 256.5 4.2 23.0 Nut/seed-based spreads 105.0 121.5 135.3 148.0 159.0 171.0 10.3 62.9 Yeast-based spreads 87.4 86.4 86.7 86.9 86.3 85.9 -0.3 -1.7 Chocolate spreads 83.3 95.2 104.8 111.9 119.3 125.0 8.5 50.1
Spreads in the U.K. – Forecast Retail Volume Sales in ’000 Tonnes
Category 2012 2013 2014 2015 2016 2017 Volume growth 2012-2017 (%)
CAGR* Total Spreads 114.8 115.9 117.3 118.5 119.9 120.7 1.0 5.2 Jams and preserves 64.4 63.5 63.1 62.8 62.7 62.3 -0.7 -3.3 Honey 17.4 17.3 17.2 17.0 16.9 16.9 -0.5 -2.5 Nut/seed-based spreads 14.7 16.2 17.4 18.4 19.4 20.2 6.5 37.0 Yeast-based spreads 5.1 5.0 4.9 4.9 4.9 4.8 -1.0 -5.0 Chocolate spreads 13.2 13.9 14.7 15.4 16.0 16.5 4.6 25.1 Source for all: Euromonitor 2013. *CAGR = compound annual growth rate MARKET SHARE BY COMPANY AND BRAND By company, Premier Foods Plc. maintained its leading position in the spreads market in 2012, holding a 19% value share. Four of the company’s brands, Hartley’s (jams and preserves), Robertson’s (jams and preserves), Sun Pat (nut-based spreads), and Gales (honey), were among the top ten spreads brands by market share. Unilever Group ranked second in terms of company share, holding 10% of the overall spreads market in 2012, largely attributable to Marmite, the leading spreads brand by value sales. Combined, Unilever’s Marmite and Bovril brands represent 92% of the yeast-based spreads segment. Ferrero Group held the third-largest company share in 2012, solely due to its Nutella brand, which represented 7.9% of the overall spreads market in 2012. Nutella continues to gain ground and currently dominates the chocolate spreads segment, with a 75% value share. Private labels represented 31.8% of U.K. spreads sales in 2012, and continue to gain share due to lower prices and expanding premium lines.
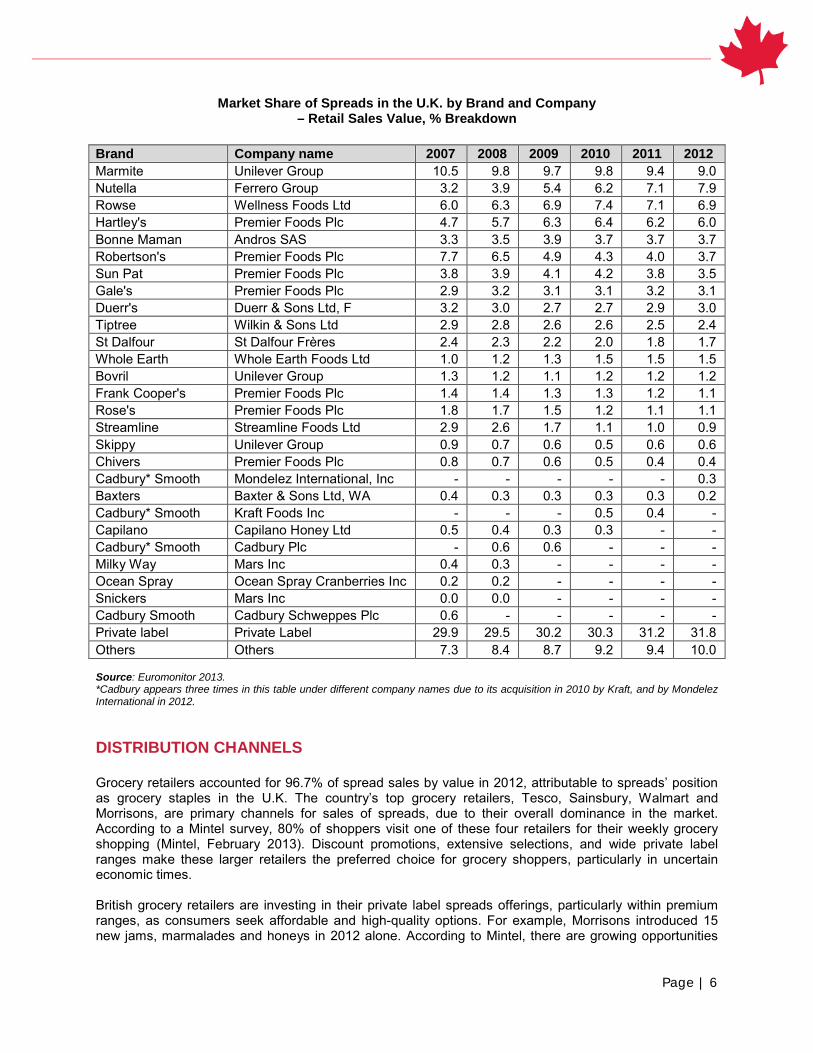
Page | 6
Market Share of Spreads in the U.K. by Brand and Company – Retail Sales Value, % Breakdown
Brand Company name 2007 2008 2009 2010 2011 2012 Marmite Unilever Group 10.5 9.8 9.7 9.8 9.4 9.0 Nutella Ferrero Group 3.2 3.9 5.4 6.2 7.1 7.9 Rowse Wellness Foods Ltd 6.0 6.3 6.9 7.4 7.1 6.9 Hartley's Premier Foods Plc 4.7 5.7 6.3 6.4 6.2 6.0 Bonne Maman Andros SAS 3.3 3.5 3.9 3.7 3.7 3.7 Robertson's Premier Foods Plc 7.7 6.5 4.9 4.3 4.0 3.7 Sun Pat Premier Foods Plc 3.8 3.9 4.1 4.2 3.8 3.5 Gale's Premier Foods Plc 2.9 3.2 3.1 3.1 3.2 3.1 Duerr's Duerr & Sons Ltd, F 3.2 3.0 2.7 2.7 2.9 3.0 Tiptree Wilkin & Sons Ltd 2.9 2.8 2.6 2.6 2.5 2.4 St Dalfour St Dalfour Frères 2.4 2.3 2.2 2.0 1.8 1.7 Whole Earth Whole Earth Foods Ltd 1.0 1.2 1.3 1.5 1.5 1.5 Bovril Unilever Group 1.3 1.2 1.1 1.2 1.2 1.2 Frank Cooper's Premier Foods Plc 1.4 1.4 1.3 1.3 1.2 1.1 Rose's Premier Foods Plc 1.8 1.7 1.5 1.2 1.1 1.1 Streamline Streamline Foods Ltd 2.9 2.6 1.7 1.1 1.0 0.9 Skippy Unilever Group 0.9 0.7 0.6 0.5 0.6 0.6 Chivers Premier Foods Plc 0.8 0.7 0.6 0.5 0.4 0.4 Cadbury* Smooth Mondelez International, Inc - - - - - 0.3 Baxters Baxter & Sons Ltd, WA 0.4 0.3 0.3 0.3 0.3 0.2 Cadbury* Smooth Kraft Foods Inc - - - 0.5 0.4 - Capilano Capilano Honey Ltd 0.5 0.4 0.3 0.3 - - Cadbury* Smooth Cadbury Plc - 0.6 0.6 - - - Milky Way Mars Inc 0.4 0.3 - - - - Ocean Spray Ocean Spray Cranberries Inc 0.2 0.2 - - - - Snickers Mars Inc 0.0 0.0 - - - - Cadbury Smooth Cadbury Schweppes Plc 0.6 - - - - - Private label Private Label 29.9 29.5 30.2 30.3 31.2 31.8 Others Others 7.3 8.4 8.7 9.2 9.4 10.0 Source: Euromonitor 2013. *Cadbury appears three times in this table under different company names due to its acquisition in 2010 by Kraft, and by Mondelez International in 2012. DISTRIBUTION CHANNELS Grocery retailers accounted for 96.7% of spread sales by value in 2012, attributable to spreads’ position as grocery staples in the U.K. The country’s top grocery retailers, Tesco, Sainsbury, Walmart and Morrisons, are primary channels for sales of spreads, due to their overall dominance in the market. According to a Mintel survey, 80% of shoppers visit one of these four retailers for their weekly grocery shopping (Mintel, February 2013). Discount promotions, extensive selections, and wide private label ranges make these larger retailers the preferred choice for grocery shoppers, particularly in uncertain economic times. British grocery retailers are investing in their private label spreads offerings, particularly within premium ranges, as consumers seek affordable and high-quality options. For example, Morrisons introduced 15 new jams, marmalades and honeys in 2012 alone. According to Mintel, there are growing opportunities

Page | 7
for this type of expansion within private label sweet spreads. Just 25% of surveyed consumers preferred the taste of branded options over their private-label counterparts (Mintel, February 2013).
Sales of Spreads in the U.K. by Distribution Format
% Retail Sales Value
Format 2007 2008 2009 2010 2011 2012
Store-based retailing 97.4 97.1 97.0 96.9 96.8 96.7 Grocery retailers 97.4 97.1 97.0 96.9 96.8 96.7
Supermarkets 42.0 41.3 40.9 40.5 40.1 40.0 Hypermarkets 38.6 39.0 39.2 39.5 39.7 39.7 Discounters 2.8 3.1 3.4 3.5 3.5 3.5 Small grocery retailers 12.0 11.7 11.5 11.4 11.5 11.5
Convenience stores 5.9 6.0 6.1 6.2 6.3 6.3 Independent small grocers 5.3 4.9 4.7 4.5 4.5 4.5 Forecourt retailers 0.8 0.8 0.7 0.7 0.7 0.7
Other grocery retailers 2.0 2.0 2.0 2.0 2.0 2.0 Non-store retailing 2.6 2.9 3.0 3.1 3.2 3.3
Internet retailing 2.6 2.9 3.0 3.1 3.2 3.3
Source: Euromonitor, 2013.
Top Grocery Retailers in the U.K., 2012
Company Number Of Outlets Total Grocery Market Share %
Tesco 3,141 17.00 Sainsbury 1,106 9.36 Walmart (Asda) 564 8.16 Morrisons 498 6.46
Co-operative Group 4,530 4.01
Source: Planet Retail, 2013.
NEW PRODUCT LAUNCHES Between July 2012 and July 2013, the British market saw the introduction of 226 new sweet spread products, according to Mintel’s Global New Products Database (2013). Fruit spreads and related flavours are still the preferred choice in the U.K., dominating the 226 new products. Fruit spreads represented 57.5% of all spread launches during the time period, and four of the top five flavours were fruit-based. Despite representing a small share of the new product launches, nut (particularly peanut) and chocolate spreads continue to gain market share at the expense of more traditional favourites. This trend is expected to continue, particularly as manufacturers promote their use with breakfast fare, and develop more gourmet variations targeting an adult palate (Mintel, April 2013).

Page | 8
Many of the new products boasted claims related to providence or quality rather than healthfulness, illustrating the positioning and general consumer acceptance of sweet spreads as a sort of indulgence. Packaging innovation has primarily focused on mess-free and otherwise more convenient options. Squeezable bottles are growing in popularity for their simplicity of use (Mintel, April 2013), but jars remain the preferred package choice for new sweet spreads launched in the U.K. New sweet spreads launched between July 2012 and July 2013, were fairly evenly split between branded options (51.8%) and private label (48.2%). This evidences growing consumer interest in private label spreads, offering high-quality attributes for a lower cost.
New Launches of Sweet Spread Products in the U.K., July 2012 to July 2013, by Features
Feature Launch count Percent of total
Subcategory Confiture and fruit spreads 130 57.5% Honey 40 17.7% Nut spreads 21 9.3% Syrups 17 7.5% Chocolate spreads 15 6.6% Caramel and cream spreads 3 1.3% Top five flavours Unflavoured/plain 42 18.6% Orange 30 13.3% Strawberry 17 7.5% Blackcurrant/cassis 9 4.0% Raspberry 8 3.5% Top five claims* Vegetarian 98 43.4% Ethical - environmentally friendly package 84 37.2% No additives/preservatives 40 17.7% Premium 30 13.3% Low/no/reduced allergen Gluten-free
21 21
9.3% 9.3%
Package type Jar 180 79.6% Bottle 23 10.2% Tottle** 2 0.9% Tub 2 0.9% Flexible stand-up pouch 1 0.4% Manufacturer type Branded 117 51.8% Private label 109 48.2%
Source: Mintel GNPD, 2013. * Please note that the totals for the count and percentage of products launched by claim will add to more than 226 (100%), as products can use multiple claims. **An industry word for a type of bottle (often used for ketchup, shampoo, etc.) that can sit on the top, or cap end.

Page | 9
NEW PRODUCT EXAMPLES Australian Honey
Company: Morrisons Price in US$: 3.64
Brand: M Package: Plastic bottle
Subcategory: Honey Size: 340 g
Date: July 2013 Flavours: Unflavoured
Claims: Vegetarian
This Australian Honey is new to the M brand range and is suitable for vegetarians.
Date Syrup
Company: Crazy Jack Community Foods
Price in US$: 3.97
Brand: Crazy Jack Organic Package: Plastic bottle
Subcategory: Syrups Size: 340 g
Date: July 2013 Flavours: Date
Claims: Organic, vegetarian
This product is an organic concentrated date extract that can be used instead of sugar treacle or honey in all cooking, and is also suitable for drizzling over ice cream.
Clementine and Liquorice Jam
Company: Azienda Agricola Gerace Maria Caterina
Price in US$: n/a
Brand: La Terre di Zoè Package: Glass jar
Subcategory: Confiture and fruit spreads Size: 240 g
Date: June 2013 Flavours: Clementine, liquorice
Claims: Organic
This organic-certified product was displayed at the Tutto Food 2013 Trade Show in Milan.
Orange Chocolate Spread Company: Tesco Price in US$: 2.67
Brand: Tesco Package: Glass jar
Subcategory: Chocolate spreads Size: 400 g
Date: January 2013 Flavours: Orange
Claims: Vegetarian, ethical-environmentally friendly package.
This product is suitable for vegetarians and retails in a recyclable package.

Page | 10
Marma Chilli
Company: Clippy’s Price in US$: 3.16
Brand: Clippy’s Package: Glass jar
Subcategory: Confiture and fruit spreads Size: 340 g
Date: July 2012 Flavours: Orange, chilli
Claims: Vegetarian
This fine-cut Seville orange marmalade is made with chilli, and is said to be ideal with croissants or cheeses.
Original Crunchy Caramelised Biscuit Spread
Company: Lotus Bakeries Price in US$: 3.96
Brand: Lotus Bakeries Package: Glass jar
Subcategory: Caramel and cream spreads Size: 400 g
Date: June 2013 Flavours: Caramel, biscuit
Claims: No additives/preservatives, vegetarian, low/no/reduced transfat, vegan, no animal ingredients.
This product is suitable for vegetarians, and is free from added flavours, colours and hydrogenated fats.
Black Olive Crema Dolce
Company: Cellina Price in US$: n/a
Brand: Olivotto Crème Package: Glass jar
Subcategory: Confiture and fruit spreads Size: 210 g
Date: September 2012 Flavours: Black olive
Claims: No additives/preservatives, gluten-free, antioxidant, low/no/reduced allergen.
This product is made with black Cellina olives from the Salento region in Italy. It is ideal as a spread on toast or as a filling in croissants.
Source for all: Mintel GNPD, 2013.

Page | 11
RESOURCES Euromonitor (2013). Packaged food data. Euromonitor (January 2013). Passport: Spreads in the United Kingdom. Planet Retail (2013). Mintel Global New Products Database [GNPD] (2013). Mintel (February 2013). Sweet and Savoury Spreads—United Kingdom. Mintel (May 2013). Category Insights: Sweet and Savoury Spreads.

Page | 12
Consumer Trends: Sweet Spreads in the United Kingdom © Her Majesty the Queen in Right of Canada, represented by the Minister of Agriculture and Agri-Food (2013). ISSN 2292-0676 AAFC No. 12158E Photo Credits All photographs reproduced in this publication are used by permission of the rights holders. All images, unless otherwise noted, are copyright Her Majesty the Queen in Right of Canada. For additional copies, to request an alternate format, and for all other inquiries regarding this publication, please contact: Agriculture and Agri-Food Canada, Global Analysis 1341 Baseline Road, Tower 5, 4th floor Ottawa, ON Canada K1A 0C5 E-mail: [email protected] Aussi disponible en français sous le titre : Tendances de consommation : Tartinades sucrées au Royaume-Uni The Government of Canada has prepared this report based on primary and secondary sources of information. Although every effort has been made to ensure that the information is accurate, Agriculture and Agri-Food Canada (AAFC) assumes no liability for any actions taken based on the information contained herein. Reproduction or redistribution of this document, in whole or in part, must include acknowledgement of Agriculture and Agri-Food Canada as the owner of the copyright in the document, through a reference citing AAFC, the title of the document and the year. Where the reproduction or redistribution includes data from this document, it must also include an acknowledgement of the specific data source(s), as noted in this document. Agriculture and Agri-Food Canada provides this document and other report services to agriculture and food industry clients free of charge.