
Consumer Sovereignty 2 - Cengage EMEAcws.cengage.co.uk/himmelweit/ch02.pdf · 2 Consumer...
32
2 Consumer Sovereignty Andrew Trigg Concepts and techniques Consistent preferences Indifference curves Ordinal preferences; utility maximization Marginal rate of substitution Diminishing marginal rate of substitution; convexity Feasible consumption set; budget constraint Slope of a line; slope of a curve; tangency Income and substitution effects Normal, inferior and Giffen goods Lexicographic preferences Slutsky approximation Revealed preference Links ● This chapter shows how two of the core assumptions of neoclassical economics, methodological individualism and rationality, explored in Chapter 1, form the basis of the neoclassical theory of consumption. ● The consumer demand curve forms one of the essential building blocks of the general equilibrium model. It was introduced in Chapter 1 and will be explored further in Chapter 18. ● Similar techniques of maximization under constraints will be used in Chapter 5 to derive a household’s labour supply curve, and in Chapter 10 to consider how firms choose between competing techniques of production. ● Alternative theories of consumption will be explored in Chapter 3. ● In Chapter 4, demand curves and the Slutsky approximation are used to derive price indices and provide one measure of household welfare.
Transcript of Consumer Sovereignty 2 - Cengage EMEAcws.cengage.co.uk/himmelweit/ch02.pdf · 2 Consumer...

2Consumer SovereigntyAndrew Trigg
Concepts andtechniques Consistent preferencesIndifference curvesOrdinal preferences; utility
maximizationMarginal rate of substitutionDiminishing marginal rate of
substitution; convexity
Feasible consumption set; budgetconstraint
Slope of a line; slope of a curve;tangency
Income and substitution effectsNormal, inferior and Giffen goodsLexicographic preferencesSlutsky approximationRevealed preference
Links� This chapter shows how two of the core assumptions of neoclassical
economics, methodological individualism and rationality, explored inChapter 1, form the basis of the neoclassical theory of consumption.
� The consumer demand curve forms one of the essential building blocksof the general equilibrium model. It was introduced in Chapter 1 andwill be explored further in Chapter 18.
� Similar techniques of maximization under constraints will be used inChapter 5 to derive a household’s labour supply curve, and in Chapter 10 to consider how firms choose between competingtechniques of production.
� Alternative theories of consumption will be explored in Chapter 3.
� In Chapter 4, demand curves and the Slutsky approximation are used toderive price indices and provide one measure of household welfare.
1 Introduction
‘The free enterprise economy is the truecounterpart of democracy: it is the onlysystem which gives everyone a say. Everyonewho goes into a shop and chooses one articleinstead of another is casting a vote in theeconomic ballot box: with thousands ormillions of others that choice is signalled toproduction and investment and helps tomould the world just a tiny fraction nearer topeople’s desire. In this great and continuousgeneral election of the free economy nobody,not even the poorest, is disfranchized: we areall voting all the time. Socialism is designedon the opposite pattern: it is designed toprevent people getting their own way,otherwise there would be no point in it.’
(Powell, 1969, p.33)
In this quotation from the late Enoch Powell’s bookFreedom and Reality, the once prominent UKpolitician conveys the idea of consumer sovereignty– the idea that in a free market economy, individualconsumers choose which goods are produced.Instead of a king, dictator or central planner makingdecisions, sovereignty is vested in the everydaychoices of individual consumers. These individualchoices lead by an ‘invisible hand’ to the bestpossible outcome for the economy as a whole.
This view of the free market became increasinglydominant with the emergence of Thatcherite andReaganite policies in the early 1980s, and thecollapse of the eastern European bloc of centrallyplanned economies in the late 1980s. Indeed, it hasbeen argued that the inability of the Soviet system tosatisfy consumer demand was one of the mainreasons for its demise. John Kenneth Galbraith, forexample,has pronounced that the Soviet system:
‘… could not satisfy the infinitely diverse andunstable demand for the services and
products that make up the modernconsumers’ goods economy. Here socialism,both in planning and administration, provedfar too inflexible. One may marvel at theattraction of often frivolous and dispensableconsumer artifacts and entertainments in ourtime, but their ultimately controlling appealcannot be doubted.’
(Galbraith, 1992, p.7–8)
An enduring image of the collapse of communismin eastern Europe was that of East Germans queuingto cross into the west in their patched-togetherTrabants. These 1950s style vehicles revealed howstarved the East Germans had been of westernconsumption goods during the years of stateplanning. More than anything, the car has providedthe symbol of the triumph of consumerism. Forthose on the right of the political spectrum,‘… themotor car epitomizes the freedom of privateconsumers to go where they please, without relyingon government, business or anyone else to run thebuses, coaches or railways on time’ (Gabriel andLang, 1995, p.16). In this view, the triumph ofwestern capitalism can be attributed more toMercedes Benz and BMW than to Cruise and Tridentmissiles.
Mirroring this dominance of capitalism in theworld economy, the world’s economics professionhas been dominated by neoclassical economics(Chapter 1 outlined the framework of neoclassicaleconomics and some alternative approaches).Although neoclassical economists vary in theirindividual political allegiances, their approach hasbeen used to provide a technical demonstration ofwhy free market capitalism offers the best systemfor organizing an economy. In neoclassicaleconomics, the choices of the individual consumerare shown to determine what is produced: this iswhat is meant by consumer sovereignty.A definingassumption of neoclassical economics is that allindividuals follow their own self-interest, whetheras producers deciding which is the most profitablemethod of production, or as consumers choosingwhich goods to purchase. To make profits, pro-ducers must sell their wares. To do so, they mustproduce what consumers want. The neoclassicalapproach shows how consumer sovereignty isachieved by a market economy in which bothproducers and consumers act according to theirself-interest.
28 CONSUMPTION
Consumer sovereignty
Consumer sovereignty holds when consumershave the power to dictate what is produced in theeconomy.
This chapter focuses on the individualconsumer whose behaviour provides the keybuilding block for the neoclassical theory ofconsumption. In this theory, the individual’s prefer-ences provide the basis for choosing betweendifferent goods and services. I may, for example,according to my own particular tastes, prefer tobuy a Top 10 CD than a record by Showaddywaddy.It follows,since others obviously feel the same way,that we will be prepared to pay the full price for aTop 10 CD in a Virgin Megastore, but we will onlybuy Showaddywaddy records when they arediscounted for 99p in Woolworths.The point hereis that my preferences drive my demand and henceprovide the signal in the marketplace as to whatprices can be charged. This relationship betweenpreferences, demand and price provides the focusof Section 2 of this chapter which demonstrateshow the tastes and preferences of individualconsumers are communicated in the marketplace.
The rest of the chapter critically discusses theneoclassical theory of consumer behaviour. Ofparticular interest is the way in which consumersrespond to changes in price. Say the price of breadfalls sharply in your supermarket.This can have twoeffects. It may encourage you to buy more breadinstead of,say,potatoes;and it will also mean that youare better off in real terms and can, therefore, affordto buy more bread and more potatoes. Section 3provides an initial analysis of these two impacts of aprice change, using the neoclassical theory ofconsumer behaviour.
In Section 4 I look at this theory’s core assumptionthat consumers act according to their own prefer-ences, like rational calculating machines,and that thisgives them a full say in the ballot box of consumerdemocracy. I shall consider the implications of con-sumers either being too poor to exercise muchchoice in this ballot or being irrational in theirbehaviour.
As part of this discussion, a test of the model isprovided by introducing an example from experi-mental economics.The problem with economics, incomparison with many physical sciences, is that it isvery difficult to carry out controlled experiments. Achemist can control the amount of chemicals in hismeasuring jar and test whether or not they willgenerate an explosion. Experimental economicstries to carry out its own tests by setting up arti-ficial environments in which economic behaviourcan be observed.
2 The neoclassical theory ofconsumption
A schoolboy calling at the corner shop on the wayhome from school has to decide how to allocate hispocket money on crisps and chocolate; a youngexecutive decides how to spend her month’s salaryon clothes and jewellery; and Lennox Lewis,surviving yet another challenge to his world heavy-weight boxing title, decides whether to spend hisearnings on a helicopter or a yacht.
Neoclassical consumer theory is based on theassumption that, in making a comparison betweendifferent items of consumption,individuals have pref-erences which they use to rank the possible alterna-tives. Assume, for example, that the schoolboy has tochoose between two possible combinations of crispsand chocolate.In one shopping basket there are threepackets of crisps and three bars of chocolate – thiscan be referred to as bundle A. In the other shoppingbasket there are two packets of crisps and two bars ofchocolate, referred to as bundle B.
In choosing between these two bundles, the indi-vidual, in this case the schoolboy, must decide ‘Do Iprefer bundle A to bundle B?’ We use the symbol > toindicate the direction of preference:
A > B; read this as A is preferred to B.
29CHAPTER 2 CONSUMER SOVEREIGNTY
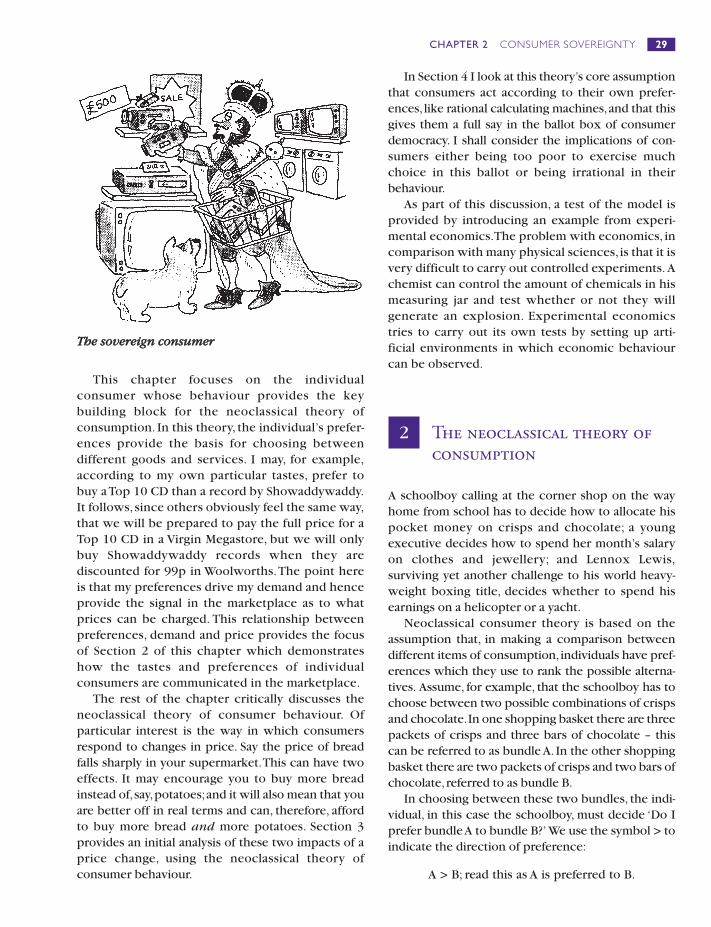
TThhee ssoovveerreeiiggnn ccoonnssuummeerr
Since the schoolboy likes both crisps andchocolate,he will prefer bundle A to bundle B, and itfollows that he ranks bundle A more highly thanbundle B. The bundles are arranged in a particularorder, in which A is ranked higher than bundle B.Notice that we are not assuming that the individualplaces any particular absolute value on either basket,merely that one is valued more, or ranked higher,than the other. Since preferences produce a rankedordering in this way, they can be said to be ordinal.
The assumption that individuals use preferencesto rank alternatives provides the starting point forthe neoclassical theory of consumption.
In addition to assuming that consumers rankalternatives, neoclassical economics also assumesthat their rankings are consistent. Consumers mustbe consistent in their choices: if an individualprefers bundle A to bundle B, he or she cannot alsoprefer B to A. Consumers must behave like rationalindividuals who carefully calculate choices andthen stick to these choices. Switching from onechoice to another would be behaving inconsis-tently and this would be considered irrational bythe neoclassical economist.
The assumption of consistency can be repre-sented formally by the statement:
If A > B, then B � A
Many of the important predictions and policyimplications of the neoclassical approach dependon the consistency assumption. Some of thesepredictions and the evidence for and against themwill be dealt with specifically in this chapter, whileChapter 4 will look at the way in which consumertheory is used for measuring the welfare of indi-viduals. For welfare purposes, when someoneprefers A to B, the neoclassical assumption is that
we can infer that they are better off with A ratherthan B, so that a policy which results in that personconsuming A is better than a policy that results inthem consuming B. If, however, the individual’schoices were inconsistent then they would notprovide a basis for assessing welfare and makingpolicy choices. It would be impossible to judgewhether consuming A or B is the better outcome. Aswell as examining the theoretical implications ofthe consistency assumption, the discussion thatfollows will also examine some empirical evidenceas to the viability of that assumption.
2.1 The indifference map
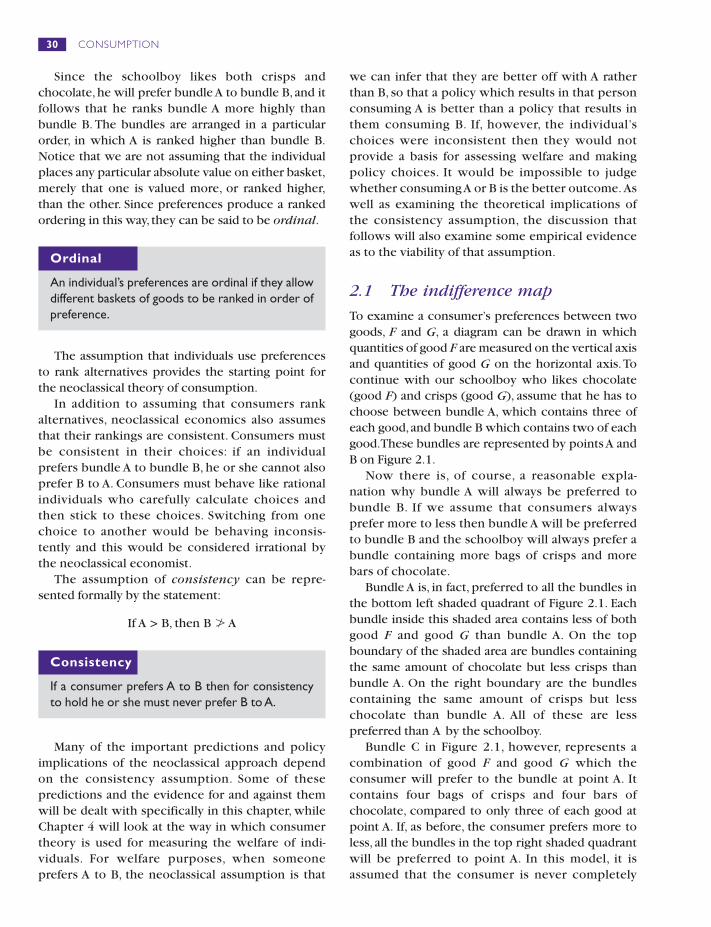
To examine a consumer’s preferences between twogoods, F and G, a diagram can be drawn in whichquantities of good F are measured on the vertical axisand quantities of good G on the horizontal axis.Tocontinue with our schoolboy who likes chocolate(good F) and crisps (good G), assume that he has tochoose between bundle A, which contains three ofeach good,and bundle B which contains two of eachgood.These bundles are represented by points A andB on Figure 2.1.
Now there is, of course, a reasonable expla-nation why bundle A will always be preferred tobundle B. If we assume that consumers alwaysprefer more to less then bundle A will be preferredto bundle B and the schoolboy will always prefer abundle containing more bags of crisps and morebars of chocolate.
Bundle A is, in fact, preferred to all the bundles inthe bottom left shaded quadrant of Figure 2.1. Eachbundle inside this shaded area contains less of bothgood F and good G than bundle A. On the topboundary of the shaded area are bundles containingthe same amount of chocolate but less crisps thanbundle A. On the right boundary are the bundlescontaining the same amount of crisps but lesschocolate than bundle A. All of these are lesspreferred than A by the schoolboy.
Bundle C in Figure 2.1, however, represents acombination of good F and good G which theconsumer will prefer to the bundle at point A. Itcontains four bags of crisps and four bars ofchocolate, compared to only three of each good atpoint A. If, as before, the consumer prefers more toless, all the bundles in the top right shaded quadrantwill be preferred to point A. In this model, it isassumed that the consumer is never completely
30 CONSUMPTION
Ordinal
An individual’s preferences are ordinal if they allowdifferent baskets of goods to be ranked in order ofpreference.
Consistency
If a consumer prefers A to B then for consistencyto hold he or she must never prefer B to A.
satisfied, always preferring more to less. Howevermuch he or she consumes, the consumer has neverhad enough of either good.This is the assumption ofnon-satiation.
This leaves the top left and bottom right quad-rants of Figure 2.1. The important point to noteabout these unshaded areas is that they containbundles of crisps and chocolate which are not neces-sarily regarded more highly or less highly thanbundle A. There could, in fact, be some bundleswhich the consumer ranks equally to bundle A.Theconsumer is indifferent between these bundles, notpreferring one particular combination of good F andgood G to the others.
Assume that in Figure 2.1 our schoolboy is indif-ferent between the bundles at A and D.He is equallysatisfied with a bundle which contains four bars ofchocolate and two bags of crisps (bundle D) and abundle which contains three bags of crisps andthree bars of chocolate (bundle A). Assume furtherthat crisps and chocolate can be divided into infini-tesimal amounts. This allows us to join up all thebundles between which the individual is indifferentby a line which we call an indifference curve. Allthe bundles of goods represented by the points on
an indifference curve are ranked equally by theconsumer.
Before looking at how such an indifferencecurve is used, we need to spend some time exam-ining the assumptions underlying its shape. Themagnitude of the slope of an indifference curvemeasures the rate at which a consumer is willing togive up one good in order to consume more ofanother. This rate is known as the consumer’smarginal rate of substitution (MRS).
31CHAPTER 2 CONSUMER SOVEREIGNTY
0
1
2
3
4
1 2 3 4
A
B
CD
Go
od
F(c
ho
cola
te)
Good G (crisps)
5
5
Figure 2.1 Comparing bundles of goods F and G
Indifference curve
An indifference curve represents all bundles ofcommodities which are ranked equally by theconsumer.
Marginal rate of substitution (MRS)
The marginal rate of substitution (MRS) of good Gfor good F is the amount of good F the consumer iswilling to give up for one additional unit of G, thusremaining on the same indifference curve.
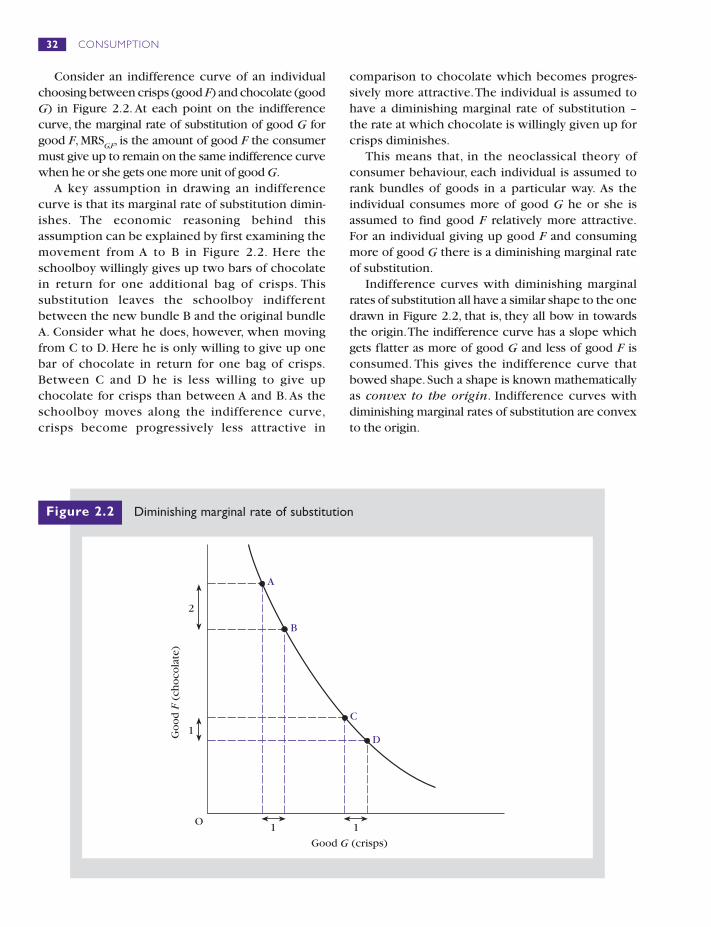
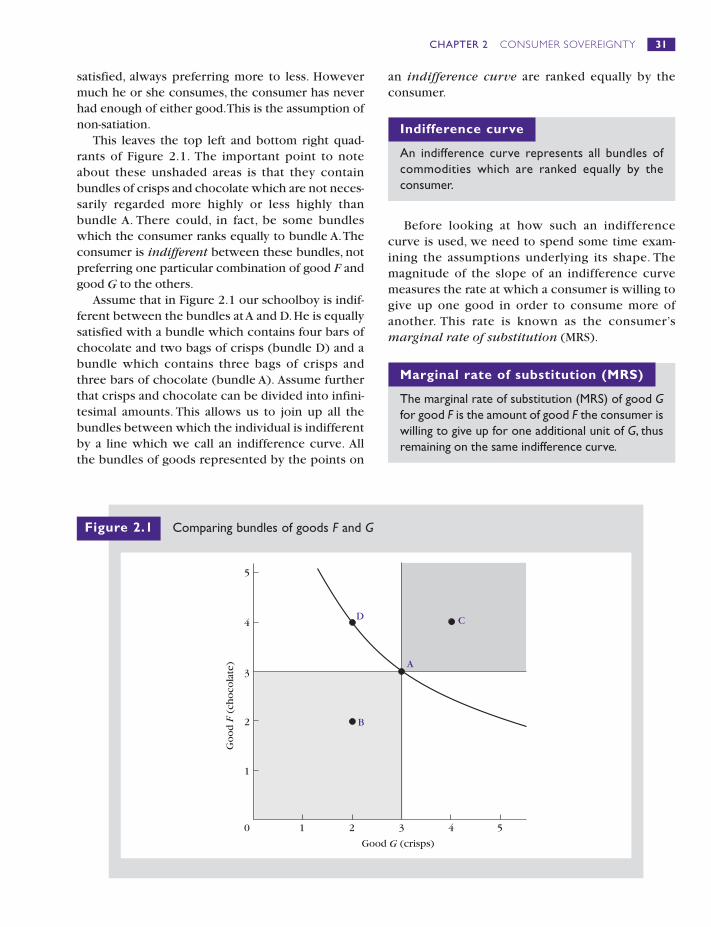
Consider an indifference curve of an individualchoosing between crisps (good F) and chocolate (goodG) in Figure 2.2. At each point on the indifferencecurve, the marginal rate of substitution of good G forgood F, MRSG,F, is the amount of good F the consumermust give up to remain on the same indifference curvewhen he or she gets one more unit of good G.
A key assumption in drawing an indifferencecurve is that its marginal rate of substitution dimin-ishes. The economic reasoning behind thisassumption can be explained by first examining themovement from A to B in Figure 2.2. Here theschoolboy willingly gives up two bars of chocolatein return for one additional bag of crisps. Thissubstitution leaves the schoolboy indifferentbetween the new bundle B and the original bundleA. Consider what he does, however, when movingfrom C to D. Here he is only willing to give up onebar of chocolate in return for one bag of crisps.Between C and D he is less willing to give upchocolate for crisps than between A and B. As theschoolboy moves along the indifference curve,crisps become progressively less attractive in
comparison to chocolate which becomes progres-sively more attractive.The individual is assumed tohave a diminishing marginal rate of substitution –the rate at which chocolate is willingly given up forcrisps diminishes.
This means that, in the neoclassical theory ofconsumer behaviour, each individual is assumed torank bundles of goods in a particular way. As theindividual consumes more of good G he or she isassumed to find good F relatively more attractive.For an individual giving up good F and consumingmore of good G there is a diminishing marginal rateof substitution.
Indifference curves with diminishing marginalrates of substitution all have a similar shape to the onedrawn in Figure 2.2, that is, they all bow in towardsthe origin.The indifference curve has a slope whichgets flatter as more of good G and less of good F isconsumed. This gives the indifference curve thatbowed shape. Such a shape is known mathematicallyas convex to the origin. Indifference curves withdiminishing marginal rates of substitution are convexto the origin.
32 CONSUMPTION
O
1
2
1
A
B
C
DGo
od
F(c
ho
cola
te)
Good G (crisps)
1
Figure 2.2 Diminishing marginal rate of substitution
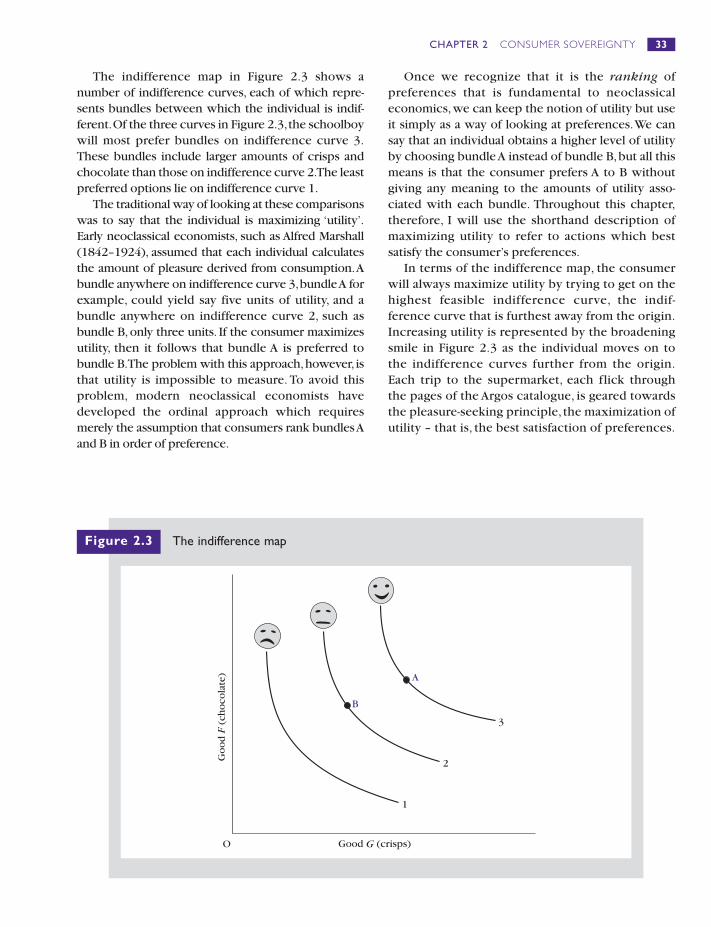
The indifference map in Figure 2.3 shows anumber of indifference curves, each of which repre-sents bundles between which the individual is indif-ferent.Of the three curves in Figure 2.3,the schoolboywill most prefer bundles on indifference curve 3.These bundles include larger amounts of crisps andchocolate than those on indifference curve 2.The leastpreferred options lie on indifference curve 1.
The traditional way of looking at these comparisonswas to say that the individual is maximizing ‘utility’.Early neoclassical economists, such as Alfred Marshall(1842–1924), assumed that each individual calculatesthe amount of pleasure derived from consumption.Abundle anywhere on indifference curve 3,bundle A forexample, could yield say five units of utility, and abundle anywhere on indifference curve 2, such asbundle B,only three units. If the consumer maximizesutility, then it follows that bundle A is preferred tobundle B.The problem with this approach,however, isthat utility is impossible to measure. To avoid thisproblem, modern neoclassical economists havedeveloped the ordinal approach which requiresmerely the assumption that consumers rank bundles Aand B in order of preference.
Once we recognize that it is the ranking of preferences that is fundamental to neoclassicaleconomics,we can keep the notion of utility but useit simply as a way of looking at preferences.We cansay that an individual obtains a higher level of utilityby choosing bundle A instead of bundle B,but all thismeans is that the consumer prefers A to B withoutgiving any meaning to the amounts of utility asso-ciated with each bundle. Throughout this chapter,therefore, I will use the shorthand description ofmaximizing utility to refer to actions which bestsatisfy the consumer’s preferences.
In terms of the indifference map, the consumerwill always maximize utility by trying to get on thehighest feasible indifference curve, the indif-ference curve that is furthest away from the origin.Increasing utility is represented by the broadeningsmile in Figure 2.3 as the individual moves on tothe indifference curves further from the origin.Each trip to the supermarket, each flick throughthe pages of the Argos catalogue, is geared towardsthe pleasure-seeking principle, the maximization ofutility – that is, the best satisfaction of preferences.
33CHAPTER 2 CONSUMER SOVEREIGNTY
O
1
2
3
B
A
Go
od
F(c
ho
cola
te)
Good G (crisps)
Figure 2.3 The indifference map
2.2 The consumer’s feasible set andbudget constraint
Of course the consumer cannot buy everything he orshe wants; only certain bundles of consumer goodscan be afforded.There are two main constraints onthe consumer pursuing utility maximization:
� income
� the price of the goods to be purchased.
For example, a consumer receiving incomesupport of £45 a week will be unable to purchase abasket of goods that costs £60 at the supermarket.The restrictions of income and price are embodiedin the individual’s feasible consumption set andbudget constraint.
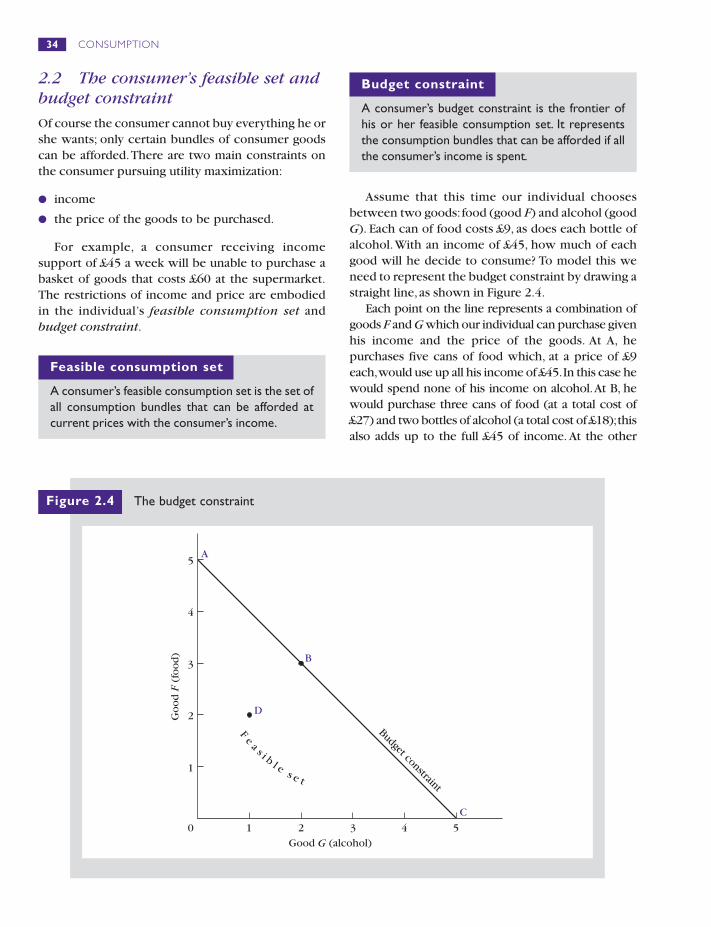
Assume that this time our individual choosesbetween two goods:food (good F) and alcohol (goodG). Each can of food costs £9, as does each bottle ofalcohol.With an income of £45, how much of eachgood will he decide to consume? To model this weneed to represent the budget constraint by drawing astraight line,as shown in Figure 2.4.
Each point on the line represents a combination ofgoods F and G which our individual can purchase givenhis income and the price of the goods. At A, hepurchases five cans of food which, at a price of £9 each,would use up all his income of £45.In this case hewould spend none of his income on alcohol.At B, hewould purchase three cans of food (at a total cost of£27) and two bottles of alcohol (a total cost of £18);thisalso adds up to the full £45 of income. At the other
34 CONSUMPTION
0
1
2
3
4
5
1 2 3 4 5
B
D
Budget constraint
Go
od
F(f
oo
d)
Good G (alcohol)
Fe
a s i b l es e t
A
C
Figure 2.4 The budget constraint
Feasible consumption set
A consumer’s feasible consumption set is the set ofall consumption bundles that can be afforded atcurrent prices with the consumer’s income.
Budget constraint
A consumer’s budget constraint is the frontier ofhis or her feasible consumption set. It representsthe consumption bundles that can be afforded if allthe consumer’s income is spent.
extreme,if he chooses not to buy any food,all of the £45could be spent on five bottles of alcohol,as shown at C.
Note that the line does not just account for wholebottles of alcohol and cans of food,since it joins up allinfinitesimal combinations of the two goods,down tofractions of grammes and millilitres.Note also that theindividual could choose point D where only £27 isspent on two cans of food and a bottle of alcohol.
The question which we can now ask is ‘Whichcombination of food and alcohol will the individualchoose?’To provide an answer, the consumer’s indif-ference map needs to be brought back into the picture.Our individual will have particular preferences for foodand alcohol which are represented by his indifferencemap. Given these preferences, and given the budgetconstraint, his objective is to maximize utility byreaching the highest possible indifference curve.
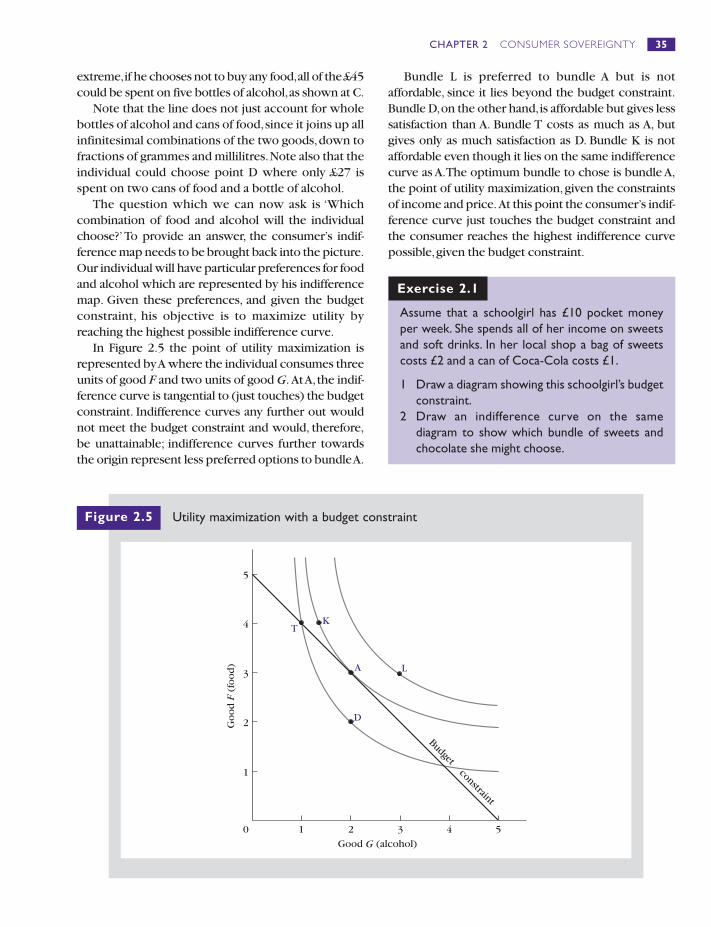
In Figure 2.5 the point of utility maximization isrepresented by A where the individual consumes threeunits of good F and two units of good G. At A,the indif-ference curve is tangential to (just touches) the budgetconstraint. Indifference curves any further out wouldnot meet the budget constraint and would, therefore,be unattainable; indifference curves further towardsthe origin represent less preferred options to bundle A.
Bundle L is preferred to bundle A but is notaffordable, since it lies beyond the budget constraint.Bundle D,on the other hand,is affordable but gives lesssatisfaction than A. Bundle T costs as much as A, butgives only as much satisfaction as D. Bundle K is notaffordable even though it lies on the same indifferencecurve as A.The optimum bundle to chose is bundle A,the point of utility maximization,given the constraintsof income and price.At this point the consumer’s indif-ference curve just touches the budget constraint andthe consumer reaches the highest indifference curvepossible,given the budget constraint.
35CHAPTER 2 CONSUMER SOVEREIGNTY
0
1
2
3
4
5
1 2 3 4 5
A
D
TK
L
Budget constraint
Go
od
F(f
oo
d)
Good G (alcohol)
Figure 2.5 Utility maximization with a budget constraint
Exercise 2.1
Assume that a schoolgirl has £10 pocket moneyper week. She spends all of her income on sweetsand soft drinks. In her local shop a bag of sweetscosts £2 and a can of Coca-Cola costs £1.
1 Draw a diagram showing this schoolgirl’s budgetconstraint.
2 Draw an indifference curve on the samediagram to show which bundle of sweets andchocolate she might choose.
The indifference curve approach has been usedfor the analysis of a whole range of individual choicedecisions. It has not been restricted to choosingbetween items of consumption from the super-market but has been applied to many other deci-sions, from the choice of school for your children toyour preferences for the environment and militarydefence. One particularly important area of choice,which is examined in Chapter 5, is the choicebetween leisure and income from working.
36 CONSUMPTION
A
B
C
YPG
YPF
A
Go
od
F
Good GOO
Go
od
F
Good G
Go
od
F
Good GO
Slope at A = ∆F∆G
Slope at A = = –∆F∆G
PG
PF
(a) (b) (c)
∆F
∆G
Figure 2.6 The mathematical properties of the indifference curve and the budget constraint
Utility maximization with abudget constraint
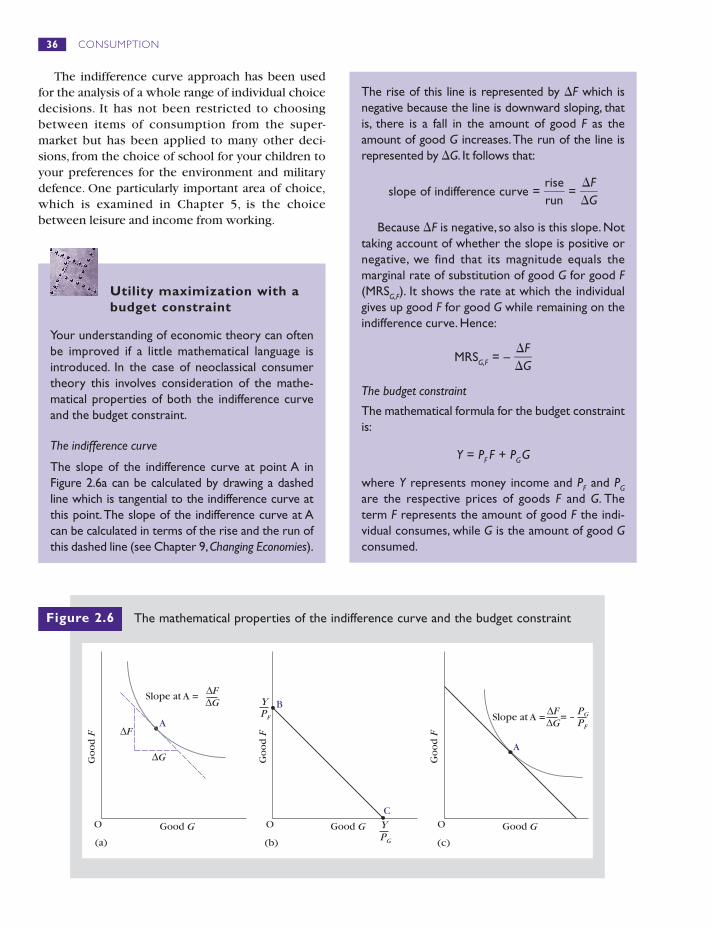
Your understanding of economic theory can oftenbe improved if a little mathematical language isintroduced. In the case of neoclassical consumertheory this involves consideration of the mathe-matical properties of both the indifference curveand the budget constraint.
The indifference curve
The slope of the indifference curve at point A inFigure 2.6a can be calculated by drawing a dashedline which is tangential to the indifference curve atthis point.The slope of the indifference curve at Acan be calculated in terms of the rise and the run ofthis dashed line (see Chapter 9,Changing Economies).
The rise of this line is represented by �F which isnegative because the line is downward sloping, thatis, there is a fall in the amount of good F as theamount of good G increases.The run of the line isrepresented by �G. It follows that:
slope of indifference curve = �rriusne
� = ��
�
GF�
Because �F is negative, so also is this slope. Nottaking account of whether the slope is positive ornegative, we find that its magnitude equals themarginal rate of substitution of good G for good F(MRSG,F). It shows the rate at which the individualgives up good F for good G while remaining on theindifference curve. Hence:
MRSG,F = – ��
�
GF�
The budget constraint
The mathematical formula for the budget constraintis:
Y = PF F + PGG
where Y represents money income and PF and PG
are the respective prices of goods F and G. Theterm F represents the amount of good F the indi-vidual consumes, while G is the amount of good Gconsumed.

37CHAPTER 2 CONSUMER SOVEREIGNTY
The above formula shows the constraint onthe individual’s budget if all income is spent ongoods F and G.
Using this formula we can establish where thebudget constraint cuts the horizontal and verticalaxes in Figure 2.6b. It cuts the horizontal axis atpoint C where the individual allocates all income togood G, so F = 0. Inserting F = 0 in the formula forthe budget constraint gives:
Y = PGG
Thus G = �PYG� at the point C where the budget
constraint cuts the horizontal axis.On the vertical axis, all of the individual’s budget
is allocated to good F, so G = 0.Thus at point B onthe vertical axis, inserting G = 0 in the budgetconstraint gives:
Y = PF F
So F = �PY
F� at the point B where the budget
constraint cuts the vertical axis.Having found points B and C, we can now
examine the slope of the budget constraint inFigure 2.6b. As the amount of good G consumedincreases, the amount of good F the consumer canafford decreases so the budget constraint isdownward sloping and hence its slope is negative.We can measure this line’s rise and run along theaxes, so that its slope is given by:
slope = �rriusne
� = – �OO
CB�
Now, since the distance OB is equal to �PY
F� and the
distance OC is equal to �PYG� the slope can be written
as:
Hence the magnitude of the slope of the budgetconstraint equals the price ratio:
�PP
G
F
�
It follows that the original formula for thebudget constraint can be re-expressed in terms ofits slope and intercept. If, as before:
slope = − = −
YPYP
PP
F
G
G
F
Y = PF F + PGG
then dividing by PF gives:
�PY
F
� = F + �PP
G
F
� G
which by manipulation means that:
F = �PY
F
� – �PP
G
F
� G
The budget constraint has an intercept �PY
F�
(where the budget line cuts the vertical axis) andslope – �PP
G
F� (which is negative because the budget
constraint is downward sloping). In economicterms this means that the individual’s budgetconstraint can be worked out from:
� real income – the amount of good F that can bepurchased for money income Y
� relative prices – the ratio of the price of good Gto good F.
The condition for utility maximization
The consumer maximizes utility by choosing thepoint on the highest possible indifference curve he orshe can get to, given the budget constraint. Becauseindifference curves are convex and so bow intowards the origin,the point of greatest utility on anybudget constraint will be not at one of its end points,but somewhere in-between at the point where thebudget constraint just touches the highest indif-ference curve it can reach.This is point A on Figure2.6c. At this point the indifference curve and thebudget constraint have the same slope. So at thispoint of utility maximization, the slope of the indifference curve �
��
GF�, is equal to the slope of
the budget constraint – �PP
G
F�. Thus �
��
GF� = – �
PP
G
F� and
so – ���
GF� = �
PP
G
F�.
This means that at the point of utility maxi-mization, the marginal rate of substitution betweentwo goods (MRSG,F) is equal to their price ratio:
MRSG,F = �PP
G
F
�
This condition for utility maximization along a budget constraint depends on consumers havingdiminishing marginal rates of substitution and thus
2.3 Deriving the demand curve
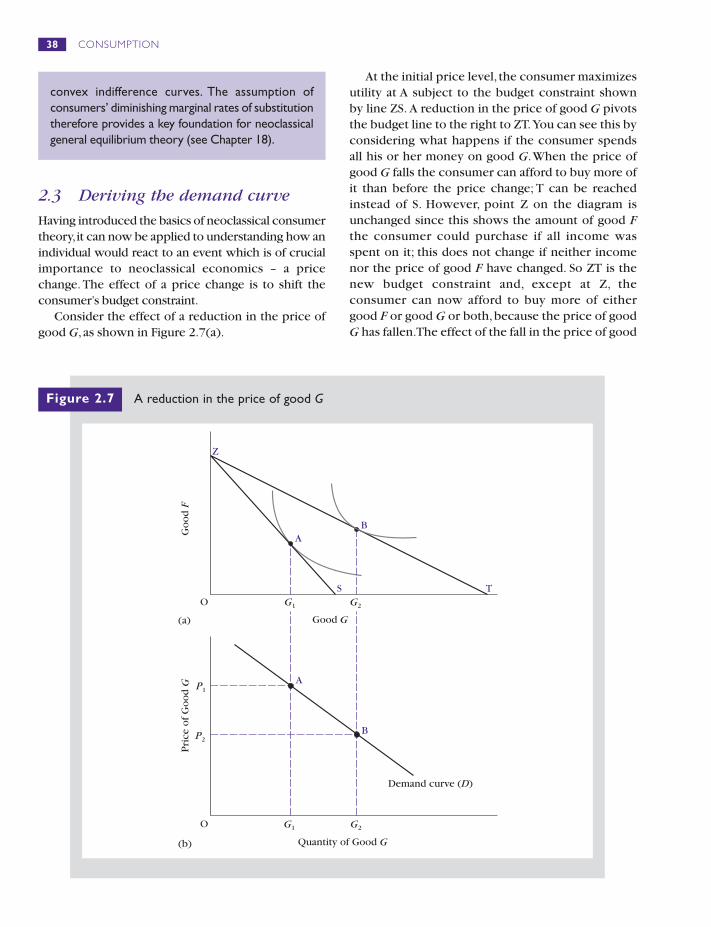
Having introduced the basics of neoclassical consumertheory,it can now be applied to understanding how anindividual would react to an event which is of crucialimportance to neoclassical economics – a pricechange. The effect of a price change is to shift theconsumer’s budget constraint.
Consider the effect of a reduction in the price ofgood G, as shown in Figure 2.7(a).
At the initial price level, the consumer maximizesutility at A subject to the budget constraint shownby line ZS. A reduction in the price of good G pivotsthe budget line to the right to ZT.You can see this byconsidering what happens if the consumer spendsall his or her money on good G.When the price ofgood G falls the consumer can afford to buy more ofit than before the price change; T can be reachedinstead of S. However, point Z on the diagram isunchanged since this shows the amount of good Fthe consumer could purchase if all income wasspent on it; this does not change if neither incomenor the price of good F have changed. So ZT is thenew budget constraint and, except at Z, theconsumer can now afford to buy more of eithergood F or good G or both,because the price of goodG has fallen.The effect of the fall in the price of good
38 CONSUMPTION
convex indifference curves. The assumption ofconsumers’ diminishing marginal rates of substitutiontherefore provides a key foundation for neoclassicalgeneral equilibrium theory (see Chapter 18).
O
Z
AB
S T
A
B
Go
od
FP
rice
of
Go
od
G P1
P2
G2
Good G
G1
G1 G2
Quantity of Good G
Demand curve ( )D
(a)
(b)
O
Figure 2.7 A reduction in the price of good G
G is to pivot the budget line around point Z fromline ZS to line ZT on the diagram.
The shift in the budget constraint means theconsumer can move onto a higher indifference curve.If A was the point of maximum utility on the previousbudget constraint, then,on the new budget constraint,a higher indifference curve can be reached by maxi-mizing utility at B.In response to the reduction in price,consumption of good G increases from G1 to G2 units.
We can represent the effect of the reduction inprice shown in Figure 2.7(a) by drawing the indi-vidual’s demand curve.When the price of good G fallsfrom P1 to P2, the amount of good G the consumerwants to buy increases from G1 to G2.This is trans-lated into a demand curve in Figure 2.7(b), showingthe relationship between price and demand.
2.4 Market demand and consumersovereignty
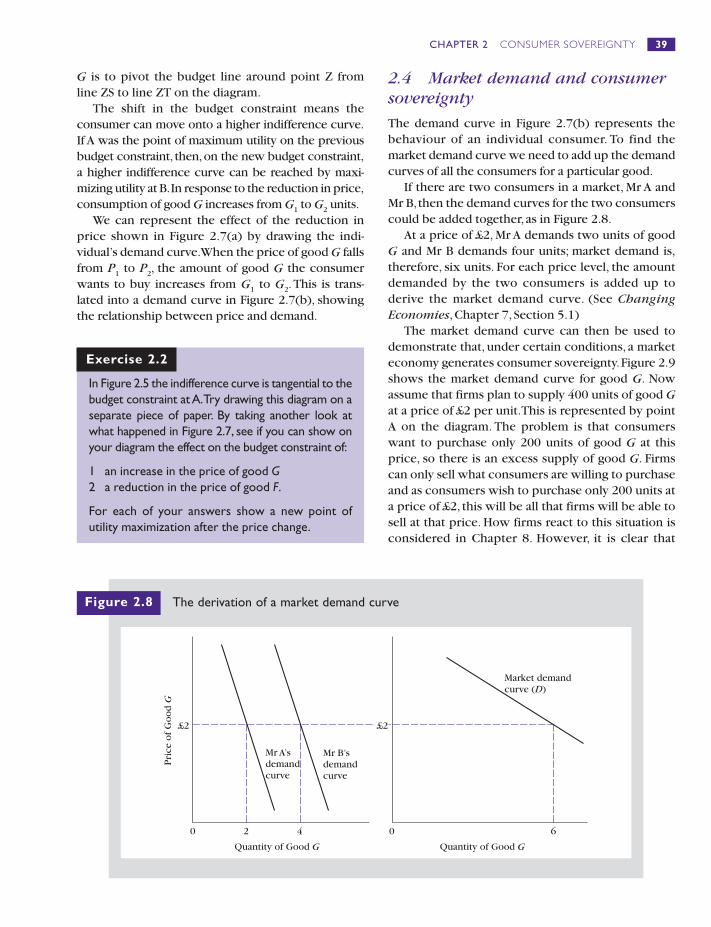
The demand curve in Figure 2.7(b) represents thebehaviour of an individual consumer. To find themarket demand curve we need to add up the demandcurves of all the consumers for a particular good.
If there are two consumers in a market, Mr A andMr B,then the demand curves for the two consumerscould be added together,as in Figure 2.8.
At a price of £2, Mr A demands two units of goodG and Mr B demands four units; market demand is,therefore, six units. For each price level, the amountdemanded by the two consumers is added up toderive the market demand curve. (See ChangingEconomies,Chapter 7,Section 5.1)
The market demand curve can then be used todemonstrate that, under certain conditions, a marketeconomy generates consumer sovereignty.Figure 2.9shows the market demand curve for good G. Nowassume that firms plan to supply 400 units of good Gat a price of £2 per unit.This is represented by pointA on the diagram. The problem is that consumerswant to purchase only 200 units of good G at thisprice, so there is an excess supply of good G. Firmscan only sell what consumers are willing to purchaseand as consumers wish to purchase only 200 units ata price of £2, this will be all that firms will be able tosell at that price. How firms react to this situation isconsidered in Chapter 8. However, it is clear that
39CHAPTER 2 CONSUMER SOVEREIGNTY
Exercise 2.2
In Figure 2.5 the indifference curve is tangential to thebudget constraint at A.Try drawing this diagram on aseparate piece of paper. By taking another look atwhat happened in Figure 2.7, see if you can show onyour diagram the effect on the budget constraint of:
1 an increase in the price of good G2 a reduction in the price of good F.
For each of your answers show a new point ofutility maximization after the price change.
0 2 4
Mr A’sdemandcurve
Mr B’sdemandcurve
£2
0 6
Market demandcurve ( )D
Pri
ce o
f G
oo
dG
Quantity of Good G Quantity of Good G
£2
Figure 2.8 The derivation of a market demand curve
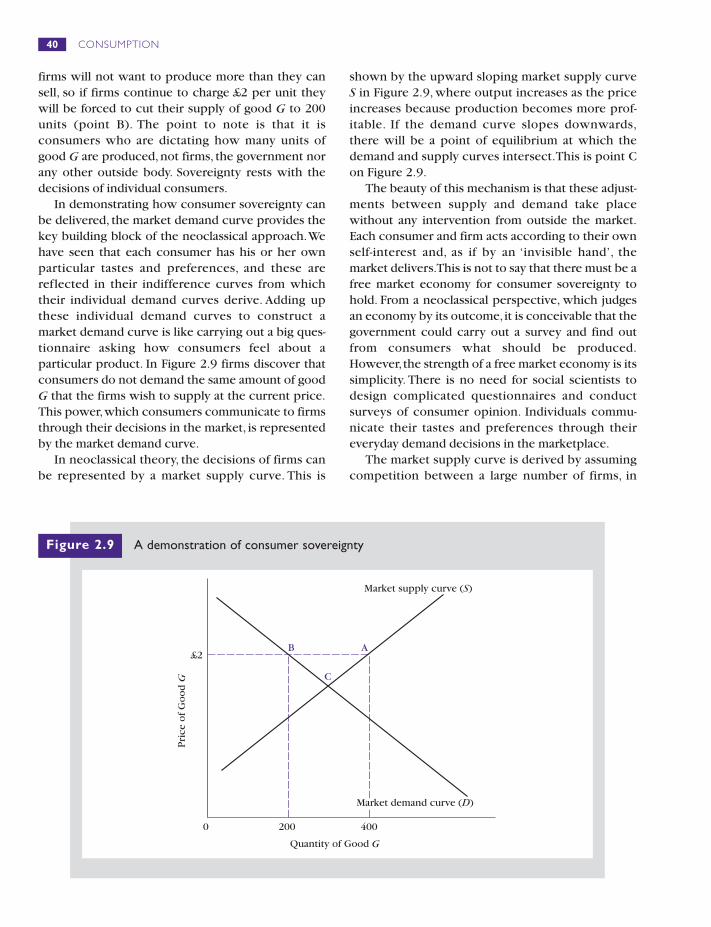
firms will not want to produce more than they cansell, so if firms continue to charge £2 per unit theywill be forced to cut their supply of good G to 200units (point B). The point to note is that it isconsumers who are dictating how many units ofgood G are produced, not firms, the government norany other outside body. Sovereignty rests with thedecisions of individual consumers.
In demonstrating how consumer sovereignty canbe delivered, the market demand curve provides thekey building block of the neoclassical approach.Wehave seen that each consumer has his or her ownparticular tastes and preferences, and these arereflected in their indifference curves from whichtheir individual demand curves derive. Adding upthese individual demand curves to construct amarket demand curve is like carrying out a big ques-tionnaire asking how consumers feel about aparticular product. In Figure 2.9 firms discover thatconsumers do not demand the same amount of goodG that the firms wish to supply at the current price.This power,which consumers communicate to firmsthrough their decisions in the market, is representedby the market demand curve.
In neoclassical theory, the decisions of firms canbe represented by a market supply curve. This is
shown by the upward sloping market supply curveS in Figure 2.9, where output increases as the priceincreases because production becomes more prof-itable. If the demand curve slopes downwards,there will be a point of equilibrium at which thedemand and supply curves intersect.This is point Con Figure 2.9.
The beauty of this mechanism is that these adjust-ments between supply and demand take placewithout any intervention from outside the market.Each consumer and firm acts according to their ownself-interest and, as if by an ‘invisible hand’, themarket delivers.This is not to say that there must be afree market economy for consumer sovereignty tohold. From a neoclassical perspective, which judgesan economy by its outcome,it is conceivable that thegovernment could carry out a survey and find outfrom consumers what should be produced.However,the strength of a free market economy is itssimplicity. There is no need for social scientists todesign complicated questionnaires and conductsurveys of consumer opinion. Individuals commu-nicate their tastes and preferences through theireveryday demand decisions in the marketplace.
The market supply curve is derived by assumingcompetition between a large number of firms, in
40 CONSUMPTION
£2
0 200 400
Market supply curve ( )S
AB
C
Pri
ce o
f G
oo
dG
Quantity of Good G
Market demand curve ( )D
Figure 2.9 A demonstration of consumer sovereignty
which no single firm can influence the price level.If this assumption was relaxed and, say, one firmdominated a particular market, a degree of powerwould then rest with this particular firm and itcould influence the price level; as a result,consumer sovereignty would be compromised. Ademonstration of consumer sovereignty, therefore,requires more than just the assumptions aboutconsumer behaviour necessary to derive adownward sloping market demand curve. Itrequires us to derive an upward sloping supplycurve and to make a number of assumptions aboutthe behaviour of firms, in particular, to ensure pricetaking behaviour in the market in which theyoperate (see Chapters 1 and 18).
It should also be noted that the scope of thisexposition is limited to particular markets for goods.The approach is partial, with each marketconsidered in isolation from others. Unlike generalequilibrium theory, in which all markets are interde-pendent (see Chapter 1), in the partial equilibriumanalysis of this chapter there is no feedbackbetween markets.
3 The structure of the demandcurve
Since the demand curve is so important to theneoclassical approach, this section examines itsstructure in more detail and evaluates the assump-tions that are necessary to derive a downwardsloping individual demand curve. This evaluationwill provide the basis for discussing some of thelimitations of the neoclassical demonstration ofconsumer sovereignty.
3.1 Income and substitution effects
Changes in price can have two main impacts onthe behaviour of consumers. First, in response to aprice change, consumers substitute between
commodities. For example, if the price of breadfalls and that of potatoes stays the same,consumerswill substitute between the two commodities, thatis, they will reduce their consumption of potatoesand increase their consumption of bread. This isknown as the substitution effect of the pricechange. Second, changes in price have an impacton the income of consumers. A reduction in theprice of bread will make consumers better off inreal terms and, as a result, they may buy morebread. This is known as the income effect of theprice change.
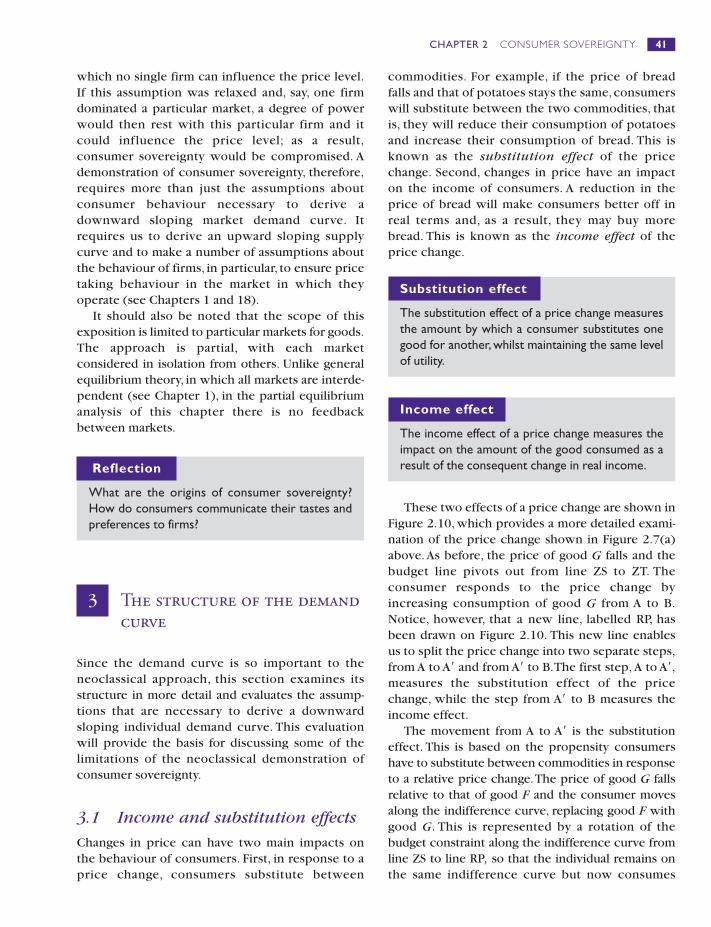
These two effects of a price change are shown inFigure 2.10, which provides a more detailed exami-nation of the price change shown in Figure 2.7(a)above. As before, the price of good G falls and thebudget line pivots out from line ZS to ZT. Theconsumer responds to the price change byincreasing consumption of good G from A to B.Notice, however, that a new line, labelled RP, hasbeen drawn on Figure 2.10. This new line enablesus to split the price change into two separate steps,from A to A� and from A� to B.The first step, A to A�,measures the substitution effect of the pricechange, while the step from A� to B measures theincome effect.
The movement from A to A� is the substitutioneffect. This is based on the propensity consumershave to substitute between commodities in responseto a relative price change.The price of good G fallsrelative to that of good F and the consumer movesalong the indifference curve, replacing good F withgood G. This is represented by a rotation of thebudget constraint along the indifference curve fromline ZS to line RP, so that the individual remains onthe same indifference curve but now consumes
41CHAPTER 2 CONSUMER SOVEREIGNTY
Reflection
What are the origins of consumer sovereignty?How do consumers communicate their tastes andpreferences to firms?
Substitution effect
The substitution effect of a price change measuresthe amount by which a consumer substitutes onegood for another, whilst maintaining the same levelof utility.
Income effect
The income effect of a price change measures theimpact on the amount of the good consumed as aresult of the consequent change in real income.
more of good G and less of good F because of theprice change. In defining the substitution effect, wedeliberately keep the consumer at the same level ofutility so that the effect of the relative price changethen can be isolated.
Assume, for example, that good F represents jamand good G marmalade. If the price of marmalade(good G) falls, a typical consumer may substitute outof jam and buy marmalade instead.The substitutioneffect measures the amount by which the consumersubstitutes marmalade for jam in response to a pricechange while maintaining the same level of utility.Substitution effects always work in the samedirection. As a good becomes relatively cheaper,consumers substitute it for other goods and buymore of it.
The second part of the price change is the incomeeffect, the movement from A� to B in Figure 2.10. Inthe example of marmalade given above, a fall in itsabsolute price, other things being equal, improvesthe real income of the consumer as more can bebought than before.The income effect measures theeffect of this change in real income on the amount ofmarmalade consumed. As we shall see, incomeeffects can work in either direction. Sometimesconsumers buy more, sometimes they buy less of agood,as income rises.
The effect of such an increase in real income canbe represented by shifting the budget constraint tothe right, from line RP to ZT. This increase in incomedoes not affect the slope of the budget constraint,since this depends on the relative prices of goods F
and G and this was taken into account in the shiftfrom ZS to RP. The budget constraint ZT is thereforeparallel to the budget constraint RP. It represents theadditional amount of both good F and good G theconsumer can afford as a consequence of the changein real income.
The total effect of a price change is the combinedeffect of the income and substitution effects.Substitution, as we have seen, can work in only onedirection; as a good becomes relatively cheaperconsumers substitute it for other goods. However,income effects can work in either direction. Asincome rises, people have more to spend, so theymay increase their consumption of some goods andnot change or even reduce their consumption ofother goods.
3.2 Giffen goods
Income effects can be very important, as RobertGiffen (1837–1910), a contemporary of Marshall’s,found. Giffen, who examined consumption behav-iour during the Irish potato famines, was interestedin the effects of a change in the price of a staplefood, such as bread or potatoes, on working-classconsumption.
The substitution effect suggests that thereshould be an increase in the demand for bread if itsprice falls. However, we also have to allow for theincome effect and the fact that people will bebetter off when the price of bread falls. Since breadis a staple part of the working-class diet, a
42 CONSUMPTION
O
Z
AB
S T
Go
od
F
A → A� Substitution effect
A� B Income effect→
R
P
A�
Good G
Figure 2.10 Income and substitution effects

reduction in its price will leave more incomeavailable for the consumption of other goods.Indeed, since they can now afford other, moreexpensive items, such as meat, people mayconsume less bread than before its price fell.Instead of filling up working-class stomachs withbread, a different diet, with less bread and moremeat, is made possible.The demand for bread couldfall in response to a reduction in price, therebyproviding an example of a Giffen good.
A good is described as Giffen-like or Giffenesquein character if its demand increases in response to aprice increase or its demand decreases in responseto a price decrease. For the case of bread, this couldmean that when its price increases, the detrimentaleffect on income could result in consumers havingto buy more bread. If a good is Giffen-like, the effectof the change in price is positive – a price increaseleads to an increase in demand; a price decreaseleads to a decrease in demand.Although the Giffengood was originally identified as a nineteenthcentury phenomenon, it is still relevant to theanalysis of the consumption of staple foods byconsumers living in poverty today.
Looking back at Figure 2.7 you can see how adownward sloping demand curve can be derivedfrom a consumer’s indifference map diagram.In thiscase, in response to the fall in the price of good G,consumer utility maximization results in more ofgood G being consumed.When the price of good Gfalls, the budget constraint moves out to the rightfrom ZS to ZT. This reaction to the price fall isshown by the movement from A to B in Figure2.7(a), which gives a downward sloping demandcurve in Figure 2.7(b).
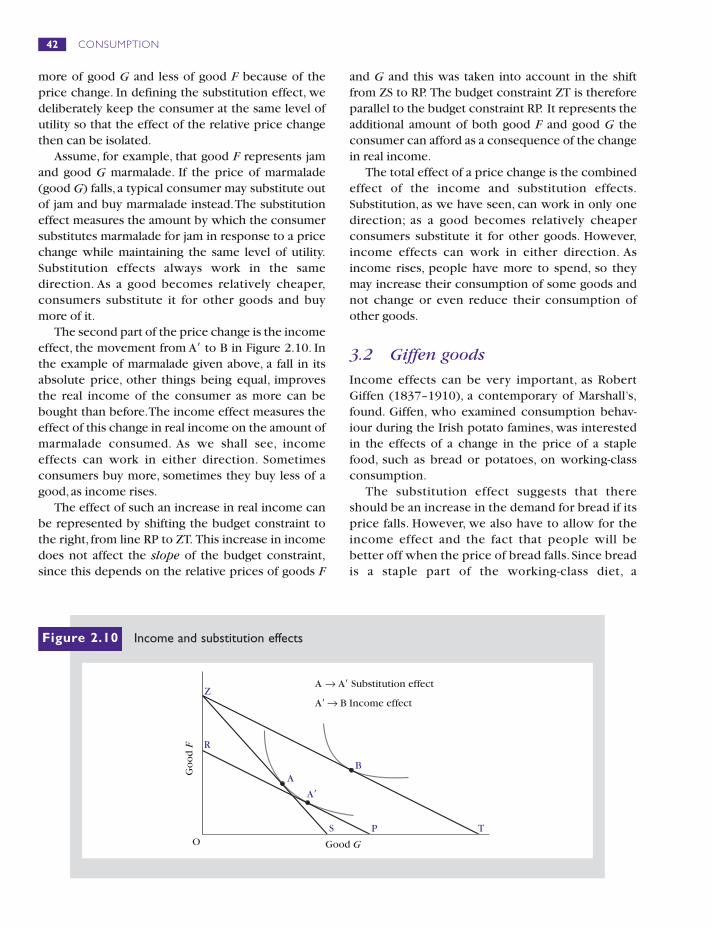
Sometimes, however, the demand for good G willfall when the price of good G falls. In that case, asshown in Figure 2.11(a), instead of moving from A toB, the consumer moves from A to C in response tothe fall in the price of good G. This results in areduction in the quantity demanded of good G fromG1 to G2 units.This possibility cannot be excluded.Depending on the shape of the indifference map,theconsumer could maximize utility at either B or Cafter the price fall.
Figure 2.11(b) shows that the movement to pointC results in an upward sloping demand curve. In thisexample, good G is a Giffen good: as the price ofgood G falls, the quantity demanded of good G alsofalls. The universality of the downward slopingdemand curve is contradicted by this example ofGiffenesque behaviour.Note that this does not meanthat all of the demand curve is upward sloping, onlythat a part of it may take this shape.
The Giffen good can be examined in more detailby splitting up the effect of a price change onconsumer demand into two separate parts. Figure2.12 provides an illustration of how the income andsubstitution effects interact to give an upwardsloping demand curve.
The effect of the reduction in the price of good Gis broken down into a substitution effect, from A toA�, and an income effect, from A� to C.
The substitution effect always goes in the samedirection (provided the indifference curves areconvex). It is the income effect that drives thereduction in the quantity demanded of good G. As aresult of the price reduction, when real incomeincreases, the individual in this case reducesconsumption of good G and increases consumptionof good F.
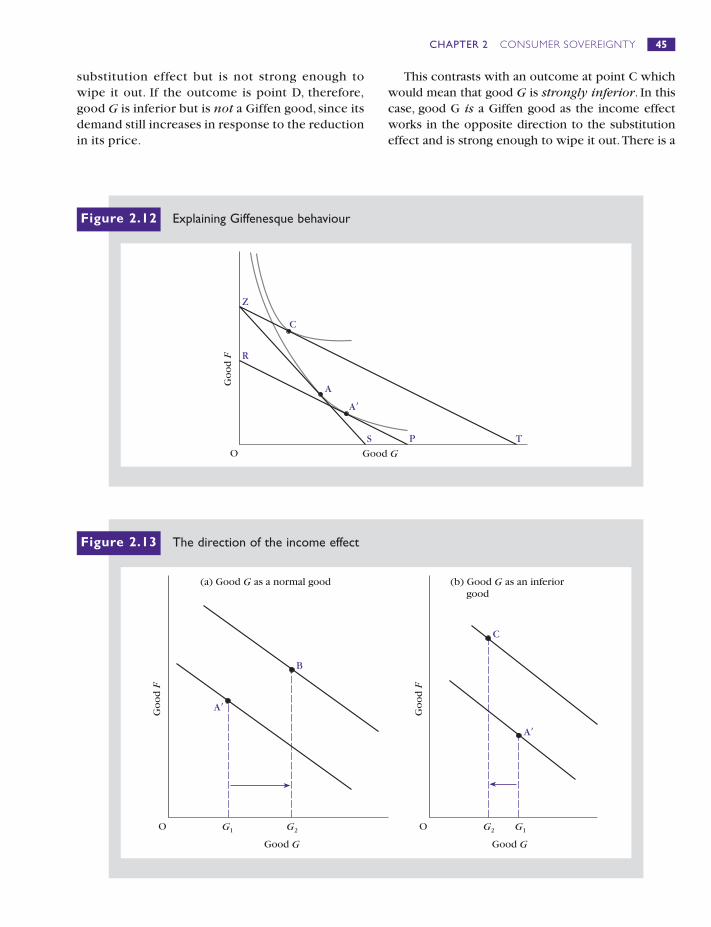
Income effects can go in one of two directions,and therefore we can distinguish between two typesof goods,both of which are illustrated in Figure 2.13.The first, illustrated in Figure 2.13(a), is a normalgood.The demand for good G increases from G1 toG2, when there is a parallel shift of the budgetconstraint as income increases In calling such a good‘normal’, the presumption is that it is normal for theconsumption of a good to increase as real incomeincreases and fall as real income falls.
Figure 2.13(b), on the other hand, shows whathappens if good G is an inferior good. As incomeincreases,consumption of good G falls from G1 to G2
units. This fits the Giffen example in whichconsumers can afford to buy less bread as realincome increases. Conversely, if income falls
43CHAPTER 2 CONSUMER SOVEREIGNTY
Giffen good
A good for which demand falls (rises) when itsprice falls (rises).
Normal good
A commodity is defined as normal if itsconsumption increases as income increases and,conversely, its consumption falls when incomeis reduced.
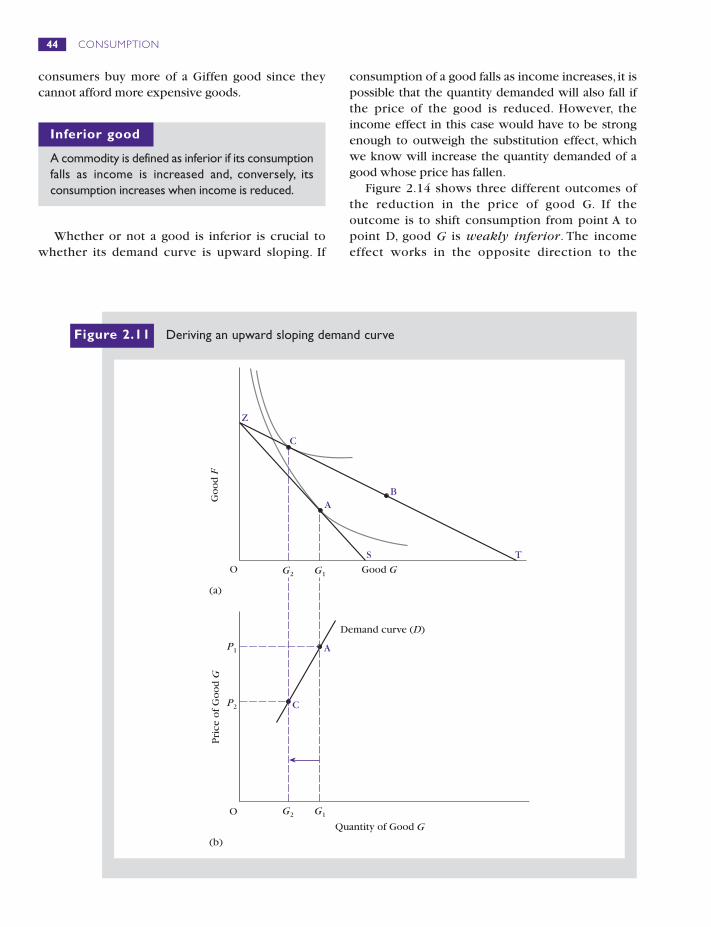
consumers buy more of a Giffen good since theycannot afford more expensive goods.
Whether or not a good is inferior is crucial towhether its demand curve is upward sloping. If
consumption of a good falls as income increases, it ispossible that the quantity demanded will also fall ifthe price of the good is reduced. However, theincome effect in this case would have to be strongenough to outweigh the substitution effect, whichwe know will increase the quantity demanded of agood whose price has fallen.
Figure 2.14 shows three different outcomes ofthe reduction in the price of good G. If theoutcome is to shift consumption from point A topoint D, good G is weakly inferior. The incomeeffect works in the opposite direction to the
44 CONSUMPTION
(a)
O
A
C
(b)
P2
P1
G2 G1
Pri
ce o
f G
oo
dG
Quantity of Good G
Demand curve ( )D
O
Z
AB
S T
Go
od
F
Good G
C
G2 G1
Figure 2.11 Deriving an upward sloping demand curve
Inferior good
A commodity is defined as inferior if its consumptionfalls as income is increased and, conversely, itsconsumption increases when income is reduced.
substitution effect but is not strong enough towipe it out. If the outcome is point D, therefore,good G is inferior but is not a Giffen good, since itsdemand still increases in response to the reductionin its price.
This contrasts with an outcome at point C whichwould mean that good G is strongly inferior. In thiscase, good G is a Giffen good as the income effectworks in the opposite direction to the substitutioneffect and is strong enough to wipe it out.There is a
45CHAPTER 2 CONSUMER SOVEREIGNTY
P
A�
O
Z
A
S T
Go
od
F
Good G
C
R
Figure 2.12 Explaining Giffenesque behaviour
O
A�
B
(a) Good G as a normal good
O
A�
C
(b) Good G as an inferiorgood
Good G
G2G1
Go
od
F
Go
od
F
G2 G1
Good G
Figure 2.13 The direction of the income effect
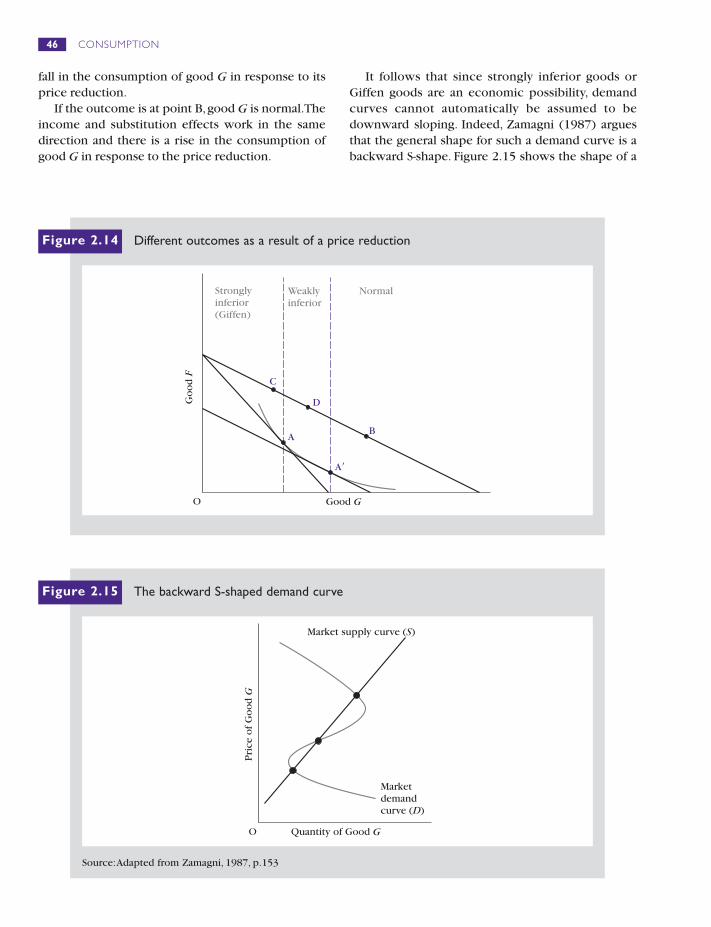
fall in the consumption of good G in response to itsprice reduction.
If the outcome is at point B,good G is normal.Theincome and substitution effects work in the samedirection and there is a rise in the consumption ofgood G in response to the price reduction.
It follows that since strongly inferior goods orGiffen goods are an economic possibility, demandcurves cannot automatically be assumed to bedownward sloping. Indeed, Zamagni (1987) arguesthat the general shape for such a demand curve is abackward S-shape. Figure 2.15 shows the shape of a
46 CONSUMPTION
Stronglyinferior(Giffen)
Weaklyinferior
Normal
O
AB
Go
od
F
Good G
D
C
A�
Figure 2.14 Different outcomes as a result of a price reduction
O
Marketdemandcurve ( )D
Pri
ce o
f G
oo
dG
Market supply curve ( )S
Quantity of Good G
Figure 2.15 The backward S-shaped demand curve
Source:Adapted from Zamagni, 1987, p.153
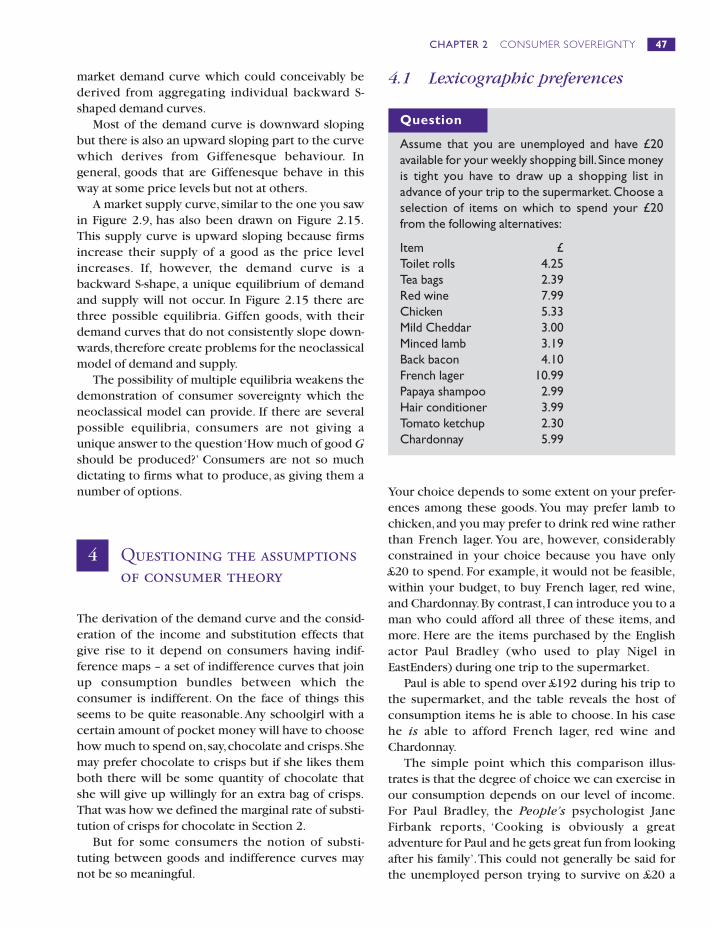
market demand curve which could conceivably bederived from aggregating individual backward S-shaped demand curves.
Most of the demand curve is downward slopingbut there is also an upward sloping part to the curvewhich derives from Giffenesque behaviour. Ingeneral, goods that are Giffenesque behave in thisway at some price levels but not at others.
A market supply curve, similar to the one you sawin Figure 2.9, has also been drawn on Figure 2.15.This supply curve is upward sloping because firmsincrease their supply of a good as the price levelincreases. If, however, the demand curve is abackward S-shape, a unique equilibrium of demandand supply will not occur. In Figure 2.15 there arethree possible equilibria. Giffen goods, with theirdemand curves that do not consistently slope down-wards, therefore create problems for the neoclassicalmodel of demand and supply.
The possibility of multiple equilibria weakens thedemonstration of consumer sovereignty which theneoclassical model can provide. If there are severalpossible equilibria, consumers are not giving aunique answer to the question ‘How much of good Gshould be produced?’ Consumers are not so muchdictating to firms what to produce, as giving them anumber of options.
4 Questioning the assumptionsof consumer theory
The derivation of the demand curve and the consid-eration of the income and substitution effects thatgive rise to it depend on consumers having indif-ference maps – a set of indifference curves that joinup consumption bundles between which theconsumer is indifferent. On the face of things thisseems to be quite reasonable.Any schoolgirl with acertain amount of pocket money will have to choosehow much to spend on,say,chocolate and crisps.Shemay prefer chocolate to crisps but if she likes themboth there will be some quantity of chocolate thatshe will give up willingly for an extra bag of crisps.That was how we defined the marginal rate of substi-tution of crisps for chocolate in Section 2.
But for some consumers the notion of substi-tuting between goods and indifference curves maynot be so meaningful.
4.1 Lexicographic preferences
Your choice depends to some extent on your prefer-ences among these goods. You may prefer lamb tochicken,and you may prefer to drink red wine ratherthan French lager. You are, however, considerablyconstrained in your choice because you have only£20 to spend. For example, it would not be feasible,within your budget, to buy French lager, red wine,and Chardonnay.By contrast, I can introduce you to aman who could afford all three of these items, andmore. Here are the items purchased by the Englishactor Paul Bradley (who used to play Nigel inEastEnders) during one trip to the supermarket.
Paul is able to spend over £192 during his trip tothe supermarket, and the table reveals the host ofconsumption items he is able to choose. In his casehe is able to afford French lager, red wine andChardonnay.
The simple point which this comparison illus-trates is that the degree of choice we can exercise inour consumption depends on our level of income.For Paul Bradley, the People’s psychologist JaneFirbank reports, ‘Cooking is obviously a greatadventure for Paul and he gets great fun from lookingafter his family’.This could not generally be said forthe unemployed person trying to survive on £20 a
47CHAPTER 2 CONSUMER SOVEREIGNTY
Question
Assume that you are unemployed and have £20available for your weekly shopping bill. Since moneyis tight you have to draw up a shopping list inadvance of your trip to the supermarket. Choose aselection of items on which to spend your £20from the following alternatives:
Item £Toilet rolls 4.25Tea bags 2.39Red wine 7.99Chicken 5.33Mild Cheddar 3.00Minced lamb 3.19Back bacon 4.10French lager 10.99Papaya shampoo 2.99Hair conditioner 3.99Tomato ketchup 2.30Chardonnay 5.99

week, where surviving is more likely to be anightmare than an adventure.
For the individual whose income is restricted,outlay must be directed towards the satisfaction ofcertain basic needs. He must eat, of course, so food
will be a priority in his consumption basket. Heprobably has to decide how much food is requiredbefore allocating his income to less important itemssuch as hair conditioner. Food obviously satisfies amore basic need,his hunger, than conditioner whichhelps his appearance. We can now consider theimplications of this type of choice for an individual’sindifference map.
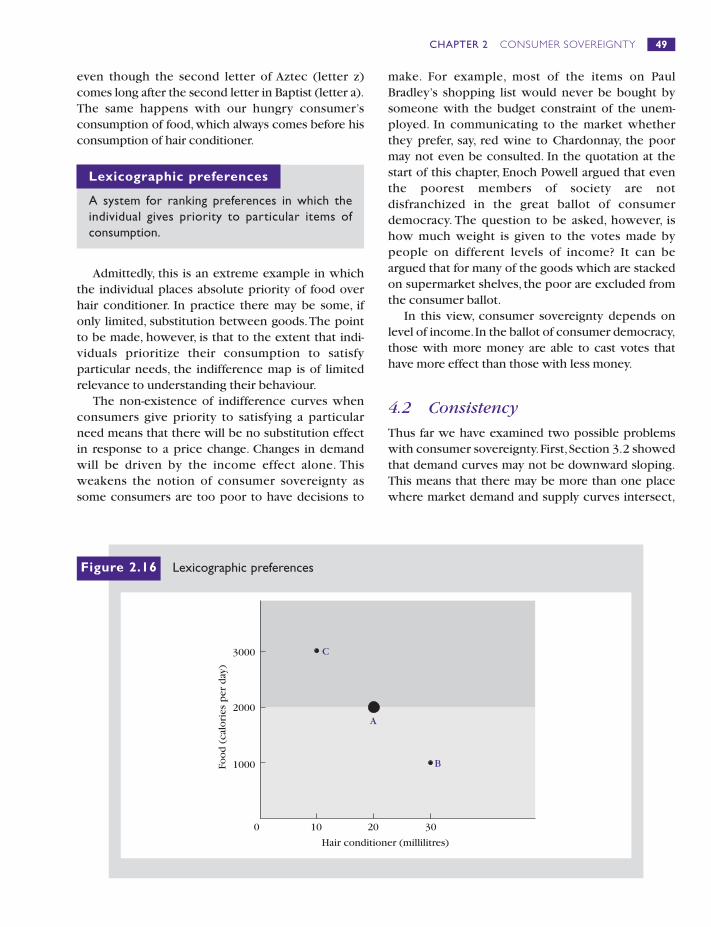
Consider the consumption of food and hair condi-tioner by a 30 year old male. According to theMedical Research Council, ‘an average 30 year oldman needs between 2,500 and 3,500 calorific units aday, whereas a woman will use up only between1,750 and 2,250’ (Cathie, 1976, p.11). Let us say thatthis man consumes only 2000 calories of food and 20millilitres of hair conditioner. This bundle is repre-sented by A on Figure 2.16.
At this level of consumption he is still hungry, sobundle A is preferred to any combination of food andconditioner which involves less than 2000 calories aday. If, for example,he consumed 1000 calories a dayand 30 millilitres of conditioner, point B, this wouldgive him less utility than his 2000 calories and 20millilitres of conditioner at A.All bundles which arebelow the horizontal line in Figure 2.16 are,therefore,worse than A.
Further, because 2000 calories per day leaveshim still hungry, all bundles above the horizontalline are better than bundle A. If, for example, theconsumer can increase his consumption of food to3000 calories per day, and only consume 10 millil-itres of conditioner, as shown by bundle C, he willprefer C to A.
If,on the other hand, the consumer has to stick to2000 calories a day, then he will prefer more condi-tioner to less.All points to the right of point A on thehorizontal line are preferred to A,and all points to theleft are less preferred than A.
All points on the diagram, therefore, are eitherpreferred to A or less preferred than A.Since there areno points on the diagram which the consumer regardswith indifference, as compared to point A, it followsthat there is no indifference curve which passesthrough this point. This example demonstrates thenon-existence of indifference curves for someconsumers. The individual who prioritizes a certaincategory of consumption, such as food, displays whatare called lexicographic preferences. This term isbased on the layout of a dictionary,where the letter Ais always before the letter B regardless of which lettersfollow.The word Aztec always comes before Baptist
48 CONSUMPTION
SSoouurrccee:: TThhee PPeeooppllee,, 1166 JJuunnee 11999966,, pp..2211
even though the second letter of Aztec (letter z)comes long after the second letter in Baptist (letter a).The same happens with our hungry consumer’sconsumption of food, which always comes before hisconsumption of hair conditioner.
Admittedly, this is an extreme example in whichthe individual places absolute priority of food overhair conditioner. In practice there may be some, ifonly limited, substitution between goods.The pointto be made, however, is that to the extent that indi-viduals prioritize their consumption to satisfyparticular needs, the indifference map is of limitedrelevance to understanding their behaviour.
The non-existence of indifference curves whenconsumers give priority to satisfying a particularneed means that there will be no substitution effectin response to a price change. Changes in demandwill be driven by the income effect alone. Thisweakens the notion of consumer sovereignty assome consumers are too poor to have decisions to
make. For example, most of the items on PaulBradley’s shopping list would never be bought bysomeone with the budget constraint of the unem-ployed. In communicating to the market whetherthey prefer, say, red wine to Chardonnay, the poormay not even be consulted. In the quotation at thestart of this chapter, Enoch Powell argued that eventhe poorest members of society are notdisfranchized in the great ballot of consumerdemocracy. The question to be asked, however, ishow much weight is given to the votes made bypeople on different levels of income? It can beargued that for many of the goods which are stackedon supermarket shelves, the poor are excluded fromthe consumer ballot.
In this view, consumer sovereignty depends onlevel of income.In the ballot of consumer democracy,those with more money are able to cast votes thathave more effect than those with less money.
4.2 Consistency
Thus far we have examined two possible problemswith consumer sovereignty.First,Section 3.2 showedthat demand curves may not be downward sloping.This means that there may be more than one placewhere market demand and supply curves intersect,
49CHAPTER 2 CONSUMER SOVEREIGNTY
Foo
d (
calo
ries
per
day
)
0
1000
2000
3000
Hair conditioner (millilitres)
10 20 30
A
B
C
Figure 2.16 Lexicographic preferences
Lexicographic preferences
A system for ranking preferences in which theindividual gives priority to particular items ofconsumption.
so there may not be a unique equilibrium price andquantity. Consumer demand may be satisfied by anumber of different possible equilibrium prices,each corresponding to a different equilibriumquantity, so that how much is produced cannot bedetermined by consumers alone.
Second,we saw in Section 4.1 that consumers caninfluence only those markets they enter. In practicewe do not buy small quantities of everything. Manyconsumers, therefore, have no influence in manymarkets. In particular, the poor, through having lessmoney to spend, will have less influence than therich.Consumer sovereignty is not egalitarian.
This section will raise a third problem with theneoclassical demonstration of consumer sovereignty.Neoclassical theories of consumer sovereigntydepend upon assumptions about the consistency ofhuman behaviour which may not hold. Section 3.2showed that the effect of a price change could notalways be predicted because income effects maywork in the opposite direction and outweigh substi-tution effects,as they do for Giffen goods.However,itis usually assumed that the ‘Law of Demand’ is met,that is that substitution effects always work in onedirection – they are always negative. In this section Iwill show how this assumption of negative substi-tution effects can be tested by examining the consis-tency of consumer preferences.To do this I must firstintroduce you to some additional concepts whichare used in consumer theory. These will help toprepare you for a case study in experimentaleconomics at the end of this section.
The Slutsky approximation
In any application of the neoclassical theory ofconsumption, one of the key problems is that indif-ference curves, which provide its theoretical core,cannot be observed.We cannot, as it were, peep intothe heads of each consumer and find out their pref-erences among the vast array of consumption goodsthat are on offer.We cannot plot an individual’s indif-ference curve using real world data.
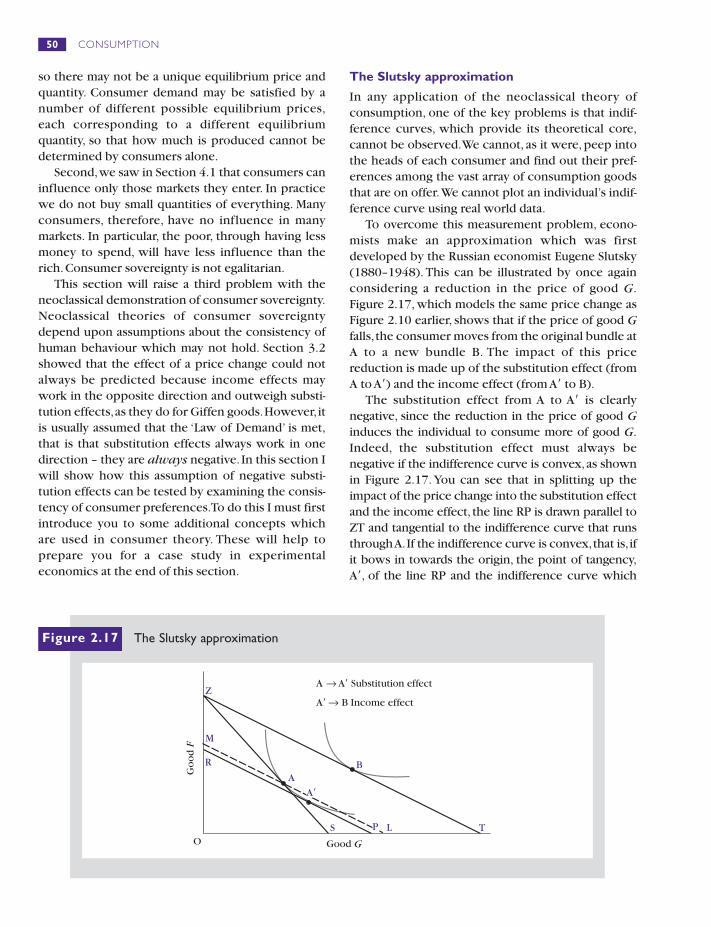
To overcome this measurement problem, econo-mists make an approximation which was firstdeveloped by the Russian economist Eugene Slutsky(1880–1948). This can be illustrated by once againconsidering a reduction in the price of good G.Figure 2.17, which models the same price change asFigure 2.10 earlier, shows that if the price of good Gfalls,the consumer moves from the original bundle atA to a new bundle B. The impact of this pricereduction is made up of the substitution effect (fromA to A�) and the income effect (from A� to B).
The substitution effect from A to A� is clearlynegative, since the reduction in the price of good Ginduces the individual to consume more of good G.Indeed, the substitution effect must always benegative if the indifference curve is convex,as shownin Figure 2.17. You can see that in splitting up theimpact of the price change into the substitution effectand the income effect, the line RP is drawn parallel toZT and tangential to the indifference curve that runsthrough A.If the indifference curve is convex,that is,ifit bows in towards the origin, the point of tangency,A�, of the line RP and the indifference curve which
50 CONSUMPTION
R
Good G
A�
M
O
Z
AB
S T
Go
od
F
P L
A → A� Substitution effect
A� B Income effect→
Figure 2.17 The Slutsky approximation
runs through A must be to the right of A.There must bea negative substitution effect.
The key thing to notice about Figure 2.17 is that toexamine the substitution effect in isolation, we wouldneed to specify an income effect.This income effectcompensates for the effect of the price change bykeeping the individual on the same indifference curve.It is referred to as a compensating variation. (In thiscase the compensation is negative because the indi-vidual gains from the price reduction – the compen-sation would be positive under a price increase.) Thecompensating reduction in income is represented bythe parallel shift of the budget constraint from ZT to RP.
However, since the indifference curve is notobservable we can observe neither the substitutioneffect nor the income effect. To test whether thesubstitution effect is negative we must modify themodel in some way,using observable data.
Now to make an approximation of the incomeeffect, using information which is at our disposal, anew line ML can be drawn which is close to RP,provided the price change is small,and parallel to it.This new line is drawn through point A. This isbecause we can observe how much of good F andgood G the individual chooses in the originalbundle A. In drawing this new line we make what isknown as a Slutsky approximation to the incomeeffect. Instead of trying to find out how muchincome, after the price change, is needed to keepthe individual on the same indifference curve, wecan observe how much income is required toenable the individual to afford the original bundleof goods at A.We make a Slutsky approximation ofthe compensating variation, often referred to as theSlutsky compensating variation.
Revealed preferences
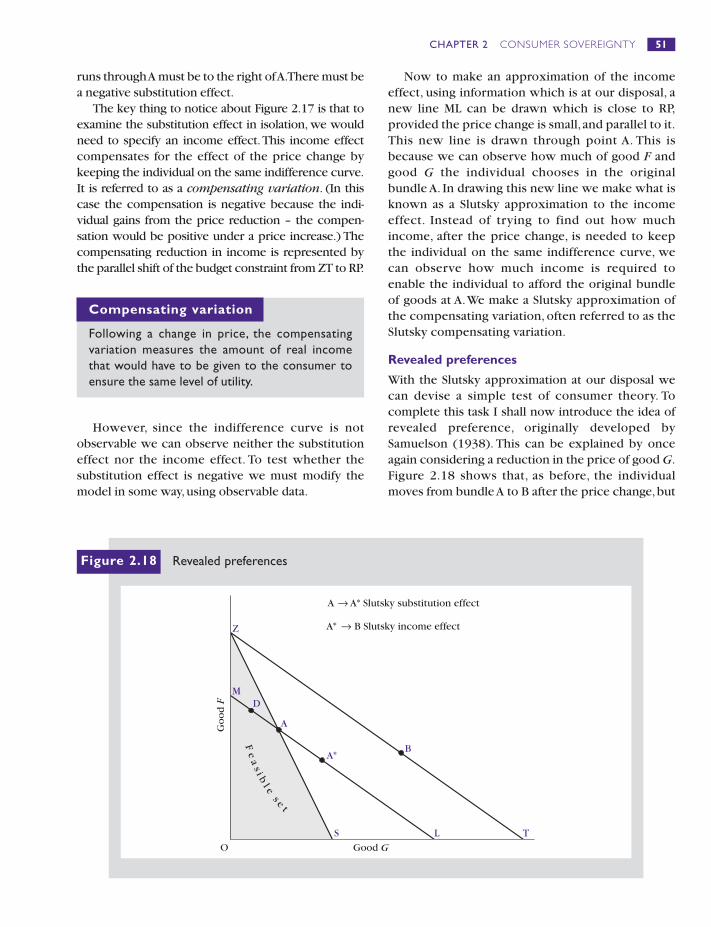
With the Slutsky approximation at our disposal wecan devise a simple test of consumer theory. Tocomplete this task I shall now introduce the idea ofrevealed preference, originally developed bySamuelson (1938). This can be explained by onceagain considering a reduction in the price of good G.Figure 2.18 shows that, as before, the individualmoves from bundle A to B after the price change,but
51CHAPTER 2 CONSUMER SOVEREIGNTY
Compensating variation
Following a change in price, the compensatingvariation measures the amount of real incomethat would have to be given to the consumer toensure the same level of utility.
Z
S T
D
O
M
L
A
BA*
A → A* Slutsky substitution effect
A* B Slutsky income effect→
Go
od
F
Good G
Fe
as i b
l es e
t
Figure 2.18 Revealed preferences

the Slutsky approximation to the income effect isestablished by drawing the line ML through A.
The Slutsky approximation to the substitutioneffect, more commonly known as the Slutsky substi-tution effect, is represented by the movement from Ato A*.The Slutsky approximation to the income effect,again more commonly known as the Slutsky incomeeffect, is represented by the movement from A* to B.
We saw earlier that if the indifference curve isconvex then the substitution effect must be negative.We can also prove that the Slutsky substitution effectmust also be negative. Consider the choice the indi-vidual made before the price change,when his or herbudget constraint was ZS. Bundle A was preferred toall other bundles that could have been affordedwithin the confines of the budget.Any of the combi-nations of goods F and G on the budget constraint ZS,and any of the bundles within the feasible set to theleft of the budget constraint could have beenafforded, for example bundle D in Figure 2.18. Theindividual could have afforded D but chose bundle A.Indeed, we can say that A is revealed to be preferredto D. By choosing A when D could have beenafforded,the individual displays a revealed preferencefor A over D.
Now consider the behaviour of the individualafter the price change. If we make a compensatingvariation of income, in order to isolate the substi-tution effect,you can see that the individual can nowchoose a new bundle from the line ML. Will thesubstitution effect be negative for this consumer?
In asking this question we can establish whetherthe individual satisfies a basic assumption of neoclas-sical consumer theory, namely that of consistency,which was defined earlier in Section 2. If an indi-vidual prefers A to D then, to be consistent,he or shemust never prefer D to A.
The individual’s behaviour would be consistentonly if bundle A* was chosen, since this bundle wasnot affordable before the price change: choosingbundle D after the price change would be incon-sistent behaviour. Before the price change the indi-vidual revealed a preference for A compared to D;both were affordable and he or she chose A ratherthan D.
Consistency requires that after the price change,the individual chooses bundles that fall on the newbudget line ML at or to the right of point A.Choosingbundles on the new budget line to the left of point Awould be inconsistent.These bundles, since they liewithin the original budget constraint ZS, could havebeen chosen before the price change. Choosing abundle somewhere between A and L results in anincrease in the demand for good G. So consistencyrequires that a compensated reduction in the priceof good G must result in an increase in the demandfor good G or perhaps no change in its demand. Areduction in the price of good G cannot consistentlyresult in a fall in its demand.Again this is a negative(or zero) substitution effect, in which the price ofgood G and its (compensated) demand cannot movein the same direction.
This result enables us to test one of the corner-stones of neoclassical consumer theory, its assump-tion of consistency. To test consistency by therevealed preference approach and the Slutskyapproximation requires only data which are observ-able, bundles of goods and their prices. We did notneed to know anything about indifference curves todraw Figure 2.18; only observable bundles of goodsare needed.
In applying this methodology to test for consis-tency there are two strategies which economistsfollow.The first is to examine consumers’ behaviourover time. A test for analysing time series data hasbeen developed by Varian (1982). The basicapproach is to observe consumption patterns atdifferent points of time, and assess whetherconsumers behave consistently. The problem withthis approach, however, is that one cannot be surethat tastes are stable over time. A consumer mayappear to behave inconsistently,but it may be insteadthat his or her tastes have changed and that theobserved behaviour is a consistent reflection of theconsumer’s changed taste.
A second research strategy is to carry out someexperimental economics by simulating in a labo-ratory the choices facing consumers.The advantage
52 CONSUMPTION
Revealed preference
By purchasing a particular bundle of goods, an indi-vidual reveals that this bundle is preferred to allother affordable bundles.
Question
On the new line ML in Figure 2.18, to showconsistent behaviour which of bundle A* or bundleD should an individual choose?

of this approach is that the economist can, to someextent,control the environment in which individualsmake their decisions.An economist using non-exper-imental data lacks any control over the many factorswhich influence economic behaviour. However, theexperimental economist can ensure in the labo-ratory situation that choices are effectively simulta-neous in order to overcome the problem of changesin tastes over time.
53CHAPTER 2 CONSUMER SOVEREIGNTY
Experimental economics
Where economic theory is tested using laboratory conditions which simulate real-lifeeconomic situations.
An experiment to test consistency
In order to test whether consumers madeconsistent choices, Sippel (1997) invited groups ofstudents to take part in two separate experiments,one in June 1993 and the other in February 1995. Inthe first experiment, 12 subjects took part and inthe second, 30 students were used. Each subjectwas given a fixed budget within which he or shecould purchase a bundle of goods to be consumedover a period of one hour. Table 2.1 shows thegoods that were available.
Table 2.1 Goods to be consumed
Goods offered Description Range
Video clips Watching a 30–60 minsvideotape of rock and pop music video clips
Computer Playing ‘Super Blast’ 27.5–60 games (in the first mins
experiment) or ‘Pinball’ (in the second experiment)
Magazines Reading a selection 30–60 minsof newspapers and magazines
Coca-Cola Cold soft drink 400–2000 grammes
Orange juice Cold drink 750–2000 grammes
Coffee Prepared when 600–2000 demanded grammes
Haribo Popular brand of 400–2000 sweets grammes
Snacks Pretzels, peanuts etc. 600–2000grammes
To test for consistency, the subjects wereconfronted with ten different budget constraints,each budget constraint involving a different set ofprices for the goods shown in Table 2.1. Thesubjects were asked to choose their optimumbundle for each of the different budget con-straints. However, they were allowed to consumeonly one of their chosen bundles, selected atrandom by a computer, at the end of the exper-iment. By having his subjects make their choiceseffectively simultaneously, that is, before anyconsumption took place, Sippel provided apossible way of overcoming the problem ofchanges in taste, so that he could then checkwhether the individuals in his experiments madeinconsistent choices.
He found that a large proportion of individualsregularly made inconsistent choices. In the firstexperiment, 11 out of the 12 subjects were incon-sistent in some of their choices, and in the secondexperiment 22 out of 30 subjects were, on occa-sions, inconsistent.
In assessing the results of his experiment Sippelconsiders ‘how serious these deviations from opti-mising behaviour really are’ (Sippel, 1997, p.1439).Two main points can be made. First, just becausean individual occasionally breaks consistency doesnot mean that this individual is generally incon-sistent. Sippel qualifies his results by pointing outthat only a small proportion of the possiblenumber of violations took place in the experi-ments.The individuals behaved consistently morefrequently than they behaved inconsistently.Second, on a number of occasions, the breaks inconsistency may have occurred because alter-native bundles of goods had very similar combina-tions of goods. For example, could the consumerreasonably be expected to compare a bundle with30 grammes of Coca-Cola and 30 grammes of
This case study provides an insight into how econ-omists have gone about testing a key assumption ofneoclassical economics, but it offers no clear answeras to whether or not reported violations of consis-tency have serious implications for the neoclassicalapproach. For most consumers in the experiment,consistency is broken for at least some of theirconsumption decisions. In defence of the neoclassicalapproach, however, it can be argued that occasionalbreaks in consistency do not invalidate consistency asa general assumption of consumer behaviour.
As mentioned earlier, the validity of the consis-tency assumption has implications for aspects ofneoclassical economics beyond the shape of thedemand curve and its use in demonstrating consumersovereignty.The consistency of preferences is central
to the application of neoclassical consumer theory topractical policy issues.
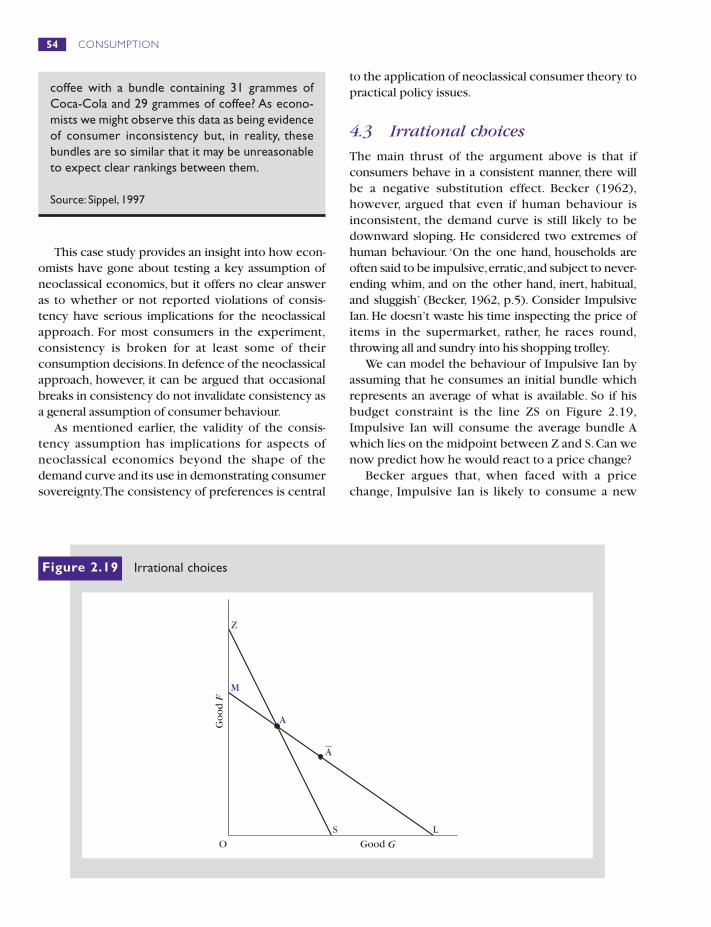
4.3 Irrational choices
The main thrust of the argument above is that ifconsumers behave in a consistent manner, there willbe a negative substitution effect. Becker (1962),however, argued that even if human behaviour isinconsistent, the demand curve is still likely to bedownward sloping. He considered two extremes ofhuman behaviour. ‘On the one hand, households areoften said to be impulsive,erratic,and subject to never-ending whim, and on the other hand, inert, habitual,and sluggish’ (Becker, 1962, p.5). Consider ImpulsiveIan. He doesn’t waste his time inspecting the price ofitems in the supermarket, rather, he races round,throwing all and sundry into his shopping trolley.
We can model the behaviour of Impulsive Ian byassuming that he consumes an initial bundle whichrepresents an average of what is available. So if hisbudget constraint is the line ZS on Figure 2.19,Impulsive Ian will consume the average bundle Awhich lies on the midpoint between Z and S.Can wenow predict how he would react to a price change?
Becker argues that, when faced with a pricechange, Impulsive Ian is likely to consume a new
54 CONSUMPTION
coffee with a bundle containing 31 grammes ofCoca-Cola and 29 grammes of coffee? As econo-mists we might observe this data as being evidenceof consumer inconsistency but, in reality, thesebundles are so similar that it may be unreasonableto expect clear rankings between them.
Source: Sippel, 1997
Z
S
O
M
L
A
A
Go
od
F
Good G
Figure 2.19 Irrational choices
bundle to the right of point A, for the simple reasonthat most of the new budget constraint ML is to theright of point A. More bundles are available on thesegment AL than are available on the segment AM.Theaverage bundle is now ,the midpoint of the line ML.
In his whiz through the supermarket, ImpulsiveIan is more likely to throw combinations of goodsinto his trolley from line AL than from line AM. Amidthe erratic throwing of goods into the trolley, ,represents the mean combination of goods that he ismost likely to purchase. Even though he is erratic,this consumer is likely to increase his demand forgood G in response to a reduction in its price. ‘Thefundamental theorem of rational behaviour, thatmarket demand curves are negatively inclined, is,therefore, also implied by impulsive behaviour …’(Becker,1962,p.6).
A similar argument applies to Cautious Colin, thesluggish,habitual consumer. If this consumer starts atpoint A in Figure 2.19, it might be expected that, outof habit,he will remain at A after the price change.Thesame follows if he starts anywhere on the segment ASof the budget line. If he chose one of these bundlesbefore the price change he will stick to this choiceafter the price change. Since these bundles arefeasible within his budget after the price change,if heis a creature of habit he will stay on this segment.
However, if Cautious Colin consumes an initialbundle on the segment AZ, the top part of budgetline ZS, this is no longer feasible after the pricechange.Even though Cautious Colin is a bit of a stick-in-the-mud with regards to his consumption, he willreluctantly have to choose a new bundle, since hecannot afford bundles on the segment AZ. Inchoosing this new bundle he is likely to increase hisconsumption of good G.This is because his originalbundle on line AZ involves less of good G than mostof the new line ML.Now that the price of good G hasfallen there is more of good G available, so, in beingforced to change his consumption, he is likely toconsume more of good G.
Becker concludes that for both impulsive andinert consumers, if there is a substitution effect, it islikely to be a negative.The conclusion has implica-tions,however,for the neoclassical idea of consumersovereignty.The irrational consumer cannot be saidto be sovereign in the marketplace. Impulsive Ian, inhis whiz around the supermarket, cannot be said tobe dictating to the supermarket and its supplierswhat goods should be on display. Indeed, modernretailing techniques enable supermarkets to place
and package certain goods such that the erraticconsumer is bound to pick them up.Cautious Colin,on the other hand, is so passive that he is obliviousto the array of goods available and he changes hisbehaviour only when forced to.For consumer sover-eignty to hold, he should be forcing suppliers tochange their behaviour, not them forcing him tochange.
For some economists, it does not matter whetherconsumers are consistent or inconsistent, as long asthe demand curve is downward sloping. Mishan, forexample, argues that constructing the apparatus ofconsumer theory is a waste of time and energy.Theeconomist ‘would be no worse off if he remainedignorant of all the theories of consumers’ behaviour,accepting the obviously indispensable “Law ofDemand” on trust’ (Mishan, 1961, p.1). For Mishan,the downward sloping demand curve is a usefuldevice which enables economists to predict thebehaviour of consumers in response to pricechanges. For him it does not matter whether thedemand curve derives from the consistent prefer-ences of consumers.All that matters is the practicalapplication of the concept.
This practical interpretation of one of the tech-niques of neoclassical economics provides animportant strand of opinion. Even though theneoclassical approach can be used to show how thefree market delivers consumer sovereignty, manyneoclassical economists are not concerned withsuch grandiose political statements. For them, tech-niques, such as the demand curve, are important forthe evaluation of a whole range of economic policychanges.Will a tax on fuel, for example, reduce thedemand for fuel? Will an increase in the price of oilreduce the demand for cars? Answering these ques-tions does not necessarily involve drawing indif-ference curves and budget constraints.
However, the neoclassical theory of consumerbehaviour is also used for policy analysis. In policyanalysis, the question that is asked is whether apolicy change would make people better off.Neoclassical welfare economics assumes that whatis meant by people being ‘better off’ is that theycan better satisfy their preferences, and thatwhether this is the case can be found out by exam-ining the choices they make as consumers.This isbecause, according to neoclassical theory, con-sumers choose whatever option will maximizetheir utility, given their available budget.Therefore,for policy analysis, the assumptions of neoclassical
A
A
55CHAPTER 2 CONSUMER SOVEREIGNTY
theory do matter.This issue is considered in moredepth in Chapter 4.
5 Conclusion
This chapter has shown how neoclassical consumertheory can be used to demonstrate consumer sover-eignty. In a free market economy, consumers dictatetheir tastes and preferences to firms through theirdemand decisions. Every expression of a consumer’spreferences represents a vote in the ballot box ofconsumer democracy and provides the mandate foreconomic activity.
I have shown that neoclassical consumer theoryassumes that consumers have preferences by whichthey rank different bundles of goods. These prefer-ences are represented by indifference curves fromwhich downward sloping individual and marketdemand curves can be derived. It is through theirdemand curves that consumers are able to dictatetheir preferences to the marketplace.
The downward sloping demand curve shows theresponse of consumer demand to changes in price.This price change can be analysed in terms of twoseparate effects: the substitution effect and theincome effect. Neoclassical economists tend toemphasize the importance of the substitution effect.The more consumers substitute between alternativebundles of commodities in response to pricechanges, the more able they are to exercise choice inthe marketplace.Critics of the neoclassical approachhave tended to emphasize the importance of theincome effect. In their view, consumers do not havemuch freedom to choose between commodities asthey are constrained by their levels of income.Whenincome changes, the income effect can override theimpact of the substitution effect.The importance ofthis income effect has been considered in relation tothe case of the Giffen good, for which the demandcurve can be upward sloping.
A number of key assumptions of neoclassicalconsumer theory have been considered. Theassumption that consumers have indifferencecurves has been examined for individuals with lowincome. For these individuals, it was shown thatlexicographic preferences can mean that indif-ference curves do not exist. Using an example fromexperimental economics, the even more basic
assumption that consumers’ preferences areconsistent was tested.There is some evidence thatconsumers regularly break consistency, but theconsequences of this finding for consumer theoryare inconclusive. However, following Becker, it wasshown that even if consumers are irrational in theirbehaviour, their demand curves should still bedownward sloping.
In this chapter I have tried to evaluate the neoclas-sical notion of consumer sovereignty which relies onthe assumption that individuals make their choicesindependently of others in the economy, accordingto their own particular tastes and preferences. Theschoolboy spending his pocket money at the cornershop is not influenced by the proclivity for crispsand chocolate of his schoolmates; the young exec-utive deciding how to spend her salary on clothesand jewellery is not influenced by the consumptiondecisions of her colleagues;and Lennox Lewis,whendeciding whether to buy a helicopter or a yacht, isnot influenced by the way in which his opponentspends his purse. He is an individual, his own man,acting independently of other consumers. Here liethe origins of consumer sovereignty,the idea that it isconsumers alone who control what goes on in theeconomy.The next chapter will explore alternativeviews of consumer behaviour which regard eachconsumer not as sovereign, but as dependent on thebehaviour of other consumers, firms and the widersociety in which they are situated.
Further Reading
Donaldson,P. (1973) The Economics of the RealWorld,Harmondsworth,Penguin: includes a briefbut very accessible insight into the notion ofconsumer sovereignty.
Gabriel,Y.and Lang,T. (1995) The UnmanageableConsumer, London,Sage:gives an overview ofthe changes that have taken place in consumersociety in recent years.
Mason,R.S. (1989) Robert Giffen and the GiffenParadox,Oxford,Philip Allan:an extensive reviewof the literature on the Giffen good,with an evalu-ation of its relevance to the twentieth century.
Lavoie,M.(1992) Foundations of Post-KeynesianEconomic Analysis,Aldershot,Edward Elgar:
56 CONSUMPTION
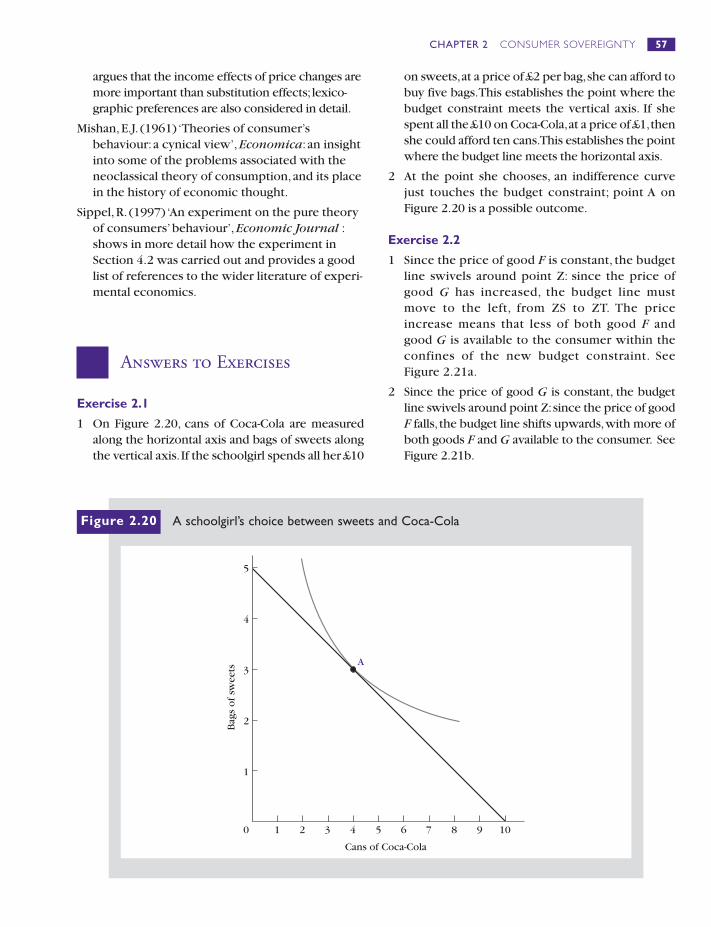
argues that the income effects of price changes aremore important than substitution effects; lexico-graphic preferences are also considered in detail.
Mishan,E.J. (1961) ‘Theories of consumer’sbehaviour:a cynical view’,Economica: an insightinto some of the problems associated with theneoclassical theory of consumption,and its placein the history of economic thought.
Sippel,R. (1997) ‘An experiment on the pure theoryof consumers’behaviour’,Economic Journal :shows in more detail how the experiment inSection 4.2 was carried out and provides a goodlist of references to the wider literature of experi-mental economics.
Answers to Exercises
Exercise 2.1
1 On Figure 2.20, cans of Coca-Cola are measuredalong the horizontal axis and bags of sweets alongthe vertical axis.If the schoolgirl spends all her £10
on sweets,at a price of £2 per bag,she can afford tobuy five bags.This establishes the point where thebudget constraint meets the vertical axis. If shespent all the £10 on Coca-Cola,at a price of £1,thenshe could afford ten cans.This establishes the pointwhere the budget line meets the horizontal axis.
2 At the point she chooses, an indifference curvejust touches the budget constraint; point A onFigure 2.20 is a possible outcome.
Exercise 2.2
1 Since the price of good F is constant, the budgetline swivels around point Z: since the price ofgood G has increased, the budget line mustmove to the left, from ZS to ZT. The priceincrease means that less of both good F andgood G is available to the consumer within theconfines of the new budget constraint. SeeFigure 2.21a.
2 Since the price of good G is constant, the budgetline swivels around point Z:since the price of goodF falls, the budget line shifts upwards,with more ofboth goods F and G available to the consumer. SeeFigure 2.21b.
57CHAPTER 2 CONSUMER SOVEREIGNTY
Bag
s o
f sw
eets
Cans of Coca-Cola
0
1
2
3
4
1 2 3 4 5 6 7 8 9 10
A
5
Figure 2.20 A schoolgirl’s choice between sweets and Coca-Cola
58 CONSUMPTION
O
T
S
Z
Go
od
F
A
B
Good G
Figure 2.21b A reduction in the price of good F
O
Z
T S
AB
Go
od
F
Good G
Figure 2.21a An increase in the price of good G