
CONSUMER PROTECTION COMPARISON
68
Xxxxx continuesssss CONSUMER PROTECTION COMPARISON The Federal Pension System and the State Insurance System May 22, 2016
Transcript of CONSUMER PROTECTION COMPARISON

Consumer Protection Comparison The Federal Pension System and the State Insurance System | i
Xxxxx continuesssss
CONSUMER PROTECTION COMPARISONThe Federal Pension System and the State Insurance System
May 22 2016
CONSUMER PROTECTION COMPARISONThe Federal Pension System and the State Insurance System
A report from the National Organization of Life and Health Insurance Guaranty Associations with substantial contributions from Faegre Baker Daniels
May 22 2016
copy 2016 National Organization of Life and Health Insurance Guaranty Associations
All rights reserved
Consumer Protection Comparison The Federal Pension System and the State Insurance System | 1
Introduction 2Executive Summary 4
ONE A Brief Overview of the Two Consumer Protection Systems 6The Pension Protection System 6The Insurance Protection System 7The Special Status of Insurance under ERISA 9
TWO How the Systems Protect Payer Solvency 12Insolvency Prevention in the Pension System 12
Private pension funding sources 12Pension solvency-regulation mechanisms 13Pension plan failure experience 14Current pension plan financial health 14
Insolvency Prevention in the Insurance System 15Private insurance funding sources 15Insurance solvency-regulation mechanisms 16Insurance company failure experience 18Current insurance company financial health 18
Summary of Insolvency Prevention in the Two Systems 19
THREE How the Systems Protect Benefits After Payer Insolvency 20The PBGC Safety Net for Failed Pension Plans 20
PBGC pension guaranty and federal priority formulas 20Actual pension benefit loss experience 21
The Guaranty Association Safety Net for Failed Insurance Companies 21Insurance guaranty and priority formulas 21Actual insurance benefit loss experience 24
Summary of Post-Insolvency Protections in the Two Systems 25Willis Towers Watson Study 26
Conclusion 38
Appendix Individual Protection Examples A-1Plan-Level Assumptions A-1An Example in Detail A-2Summary of All Examples A-5
Individual 1 A-5Individual 2 A-7Individual 3 A-10
End Notes B-1
Table of Contents
2 | National Organization of Life and Health Insurance Guaranty Associations
Introduction
The life insurance industry has played a major role in employer-based pension plans
for nearly a century Insurers helped spur the growth of pension plans by issuing group annuity contracts to employers and federal pension regulation has carved out a special role for insurance companies in recognition of their risk-spreading capabilities and their close oversight by state regulators
In the most recent manifestation of pension-in-surance interaction some defined benefit pension plansmdashparticularly those sponsored by large publicly traded companiesmdashhave purchased group annuity contracts to transfer to insurance companies the plan-promised benefit obligations for categories of participants By implementing such ldquode-riskingrdquo strategies sponsoring employers have attempted both to reduce financial volatility and other risks and expenses associated with managing plan assets and liabilities and to take advantage of the exper-tise the insurance industry has developed in its core business of matching assets to liabilities to deliver long-term annuity benefits Through such annuity purchases pension plans do not avoid the costs of paying for earned pension benefits instead they pre-pay those costs in the form of annuity premiums equal to the full economic value of the earned benefits for affected participants1
This report reviews in detail the array of protec-tions provided both for participants in defined benefit plans and former plan participants who come to be protected by annuities issued in pension de-risking transactions An objec-tive comparison of those protectionsmdashwhich are delivered through two different protection systems that have similar objectives but are very
different in applicationmdashcompels the conclusion that participants are strongly protected in both cases the resolution and safety net mecha-nisms of the two systems would fully cover the vast majority of all benefit claims and the small minority of benefit claims not fully covered would have marginally different outcomes sometimes slightly favoring one system or the other for some individuals depending on the specific circumstances of a particular case
Some de-risking transactions have employed voluntary lump-sum ldquowindowrdquo programs These programs which have been offered on a stand-alone basis or in combination with annu-ity-purchase transactions have typically offered categories of participants the option for a limited time period to elect to receive their pension benefits as lump-sum payments Concerns about lump-sum window programs have been raised in many quarters in part because window programs offer participants the opportunity for large one-time payments while shifting the burdens of investment longevity and other financial risks to participants who may have difficulty managing them2 With annuity-purchase approaches to de-risking by contrast participants continue to receive the same forms of benefit provided under their plans and the investment longevity and other financial risks are borne by highly regu-lated insurance companies3
In most respects todayrsquos annuity-purchase de-risking transactions are familiar with the same legal and financial characteristics as annu-ity-purchase arrangements that federal law has long mandated for terminating defined benefit plans But current de-risking trends have never-theless focused attention on one consequence
Introduction
Consumer Protection Comparison The Federal Pension System and the State Insurance System | 3
Introduction
of de-riskingmdashthe transfer of benefit-protection responsibilities for lifetime pensionannuity benefits from the pension system to the insur-ance system4
Private-sector pension benefits are primarily protected by a 40-year-old federal regula-tory system while group annuity benefits are protected by a somewhat older state regulatory system Both systems have evolved over time The two comprehensive benefit-protection systems share many general objectives and attributes but differ in important details The federal pension system and the state insurance system protect consumers against the risk of non-payment of benefits in significantly different ways Any comparison of the two systems that focuses only on the nominal benefit levels guaranteed by the two systemsrsquo vastly different safety nets is inadequate and misleading A valid comparison of the protection systems requires a broader comparison of two vital elements of each system (1) the regulatory controls designed to ensure payment of all promised benefits by preventing the insolvency of the private benefit payer (whether an employer-sponsored pension plan or a life insurance company that issues annuities) and (2) the post-insolvency safety net mechanisms particularly the operations of their guaranty formulas and the extent to which consumers may recover from the insolvent planrsquos or insurerrsquos remaining assets for claims exceeding guaranteed amounts5
To help explain the two elements and compare the two benefit-protection systems the National Organization of Life and Health Insurance Guaranty Associations (NOLHGA) with substantial assis-tance from the law firm Faegre Baker Daniels and
actuarial consultants at Willis Towers Watson has undertaken a qualitative and quantitative compar-ison of the consumer protections afforded to participants under pension plans6 and protections that are provided to payees under annuities issued by life insurance companies (sometimes referred to herein respectively as ldquoplan participantsrdquo and ldquoannuitantsrdquo or ldquoannuity payeesrdquo)
4 | National Organization of Life and Health Insurance Guaranty Associations
Executive Summary
When an employer de-risks its pension plan by purchasing one or more annuity
contracts consumer protections for affected individuals shift from the pension system to the insurance system From a consumer-protection perspective how does that shift affect the rela-tive levels of protection As this report summa-rizes the two systems employ different methods of protections that have different features and formulas but both provide strong time-tested protection of future pension or annuity benefit payments One fact clearly emerges from the qualitative and quantitative analysis described in this report to obtain an accurate understanding of the two systemsrsquo consumer-protection differ-ences it is wholly inadequate and misleading to look only at the nominal guaranty levels of the Pension Benefit Guaranty Corporation and the state guaranty associations
The systems provide consumer protection in two important ways first by protecting against the failure of the entity obligated to make the benefit payments and second by providing protections to the benefit recipients if the entity fails
Since consumers rely on the pension plan or annuity issuer to make ongoing benefit payments both systems have established financial standards and regulatory bodies to protect the solvency of the plan or insurer The pension system principally through the federal Employee Retirement Income Security Act of 1974 (ERISA) and the Internal Revenue Code sets funding and other requirements for about 22000 single-employer defined benefit pension plans and it authorizes the Department of Labor the Internal Revenue Service and the Pension Benefit Guaranty Corporation (PBGC) to administer and enforce those requirements The
insurance system operating through a national network of state insurance laws coordinated through the National Association of Insurance Commissioners (NAIC) establishes reserve investment and other financial standards for the approximately 460 life insurance companies that issue annuity policies today and it empowers insurance regulators to enforce those standards
Even though both systems focus on payer solvency insurance regulation generally holds life insurance companies to stricter financial standards and more intensive oversight than are applied by pension regulation to single-employer pension plans As one significant difference although ERISA places the ultimate funding responsibility on a pension planrsquos sponsoring employer ERISA gives pension regulators no control over the financial condition of the spon-soring employer Pension plan funding is often but not always consistent with the plan spon-sorrsquos financial condition and for some purposes pension plan funding levels may fall to as low as 80 of plan liabilities before triggering certain adverse consequences under federal law7 ERISA plan sponsors are not meaningfully regulated for solvency whereas constant solvency regulation is the primary focus of insurance regulation
The relative intensity of the regulatory systems is reflected in the comparative failure rates of pension plans and annuity issuers Since the 2008 financial crisis no active issuer of annuity contracts with remaining annuity obligations failed while pension plan failures have claimed a total of 931 single employer plans covering more than 560000 participants Historically when annuity issuers have failed they have also typically closed with substantially higher funded ratios (of assets to liabilities) than the compa-
Executive Summary
Consumer Protection Comparison The Federal Pension System and the State Insurance System | 5
Executive Summary
rable funded ratios for failed pension plansmdash76 for annuity issuers and 52 for pension plans8
In the second element of consumer protec-tionmdashif and when a pension plan or annuity issuer failsmdashaffected consumers must rely on the failure resolution processes and on the financial safety nets provided under each of the two systems In the pension system the PBGC guarantees pension benefits within statutory limits The PBGC receives its funding from insurance premiums charged to active pension plans investment income the assets of insolvent plans it takes over and some additional recov-eries against plan sponsors It receives no direct funding from general tax revenues and its obli-gations are not backed by the full faith and credit of the United States9 In the insurance system each state has created a guaranty association (GA) under state law to protect annuity and life insurance benefits for its residents (within statu-tory limits) as part of a comprehensive insolvency process for failed insurers that allocates a failed insurerrsquos remaining assets to the GAs and to the policyholders (for benefits not covered by the GAs) as priority creditors on the same priority level The GAs receive funding from assessments against licensed insurers a proportional share of the assets of failed life insurance companies and other private sources Like the PBGC the GAs are not directly funded by tax dollars and are not backed by any statersquos full faith and credit10
The safety net mechanisms differ in significant respects from system to system and direct comparisons are difficult In the pension system for example the PBGC generally uses a higher maximum guaranty level than most GAs provide On the other hand in the insurance system many annuity holders receive in addition to the GArsquos guaranteed payments benefits above the guaranty level backed by more assets from the failed insurance company than what is typically available to plan participants from the assets of failed pension plans On balance as reflected in a recent quantitative analysis by Willis Towers Watson commissioned by NOLHGA11 both
systems provide strong safety nets that cover the vast majority of all benefit claims Because the two systems use such fundamentally different approaches for the small minority of benefit claims not fully covered each system offers at least marginally stronger protections for some individuals than the counterpart system offers under certain factual circumstances
The Willis Towers Watson Study concludes that both systems would protect the vast majority of participants for 100 of their benefit payments It also concludes that both systems would protect over 90 of aggregate benefits if the plan or annuity issuer has a funded ratio (of assets to liabilities) of at least 75 Where the funded ratio is lower the PBGC safety net generally provides higher levels of protection under some circumstancesmdashparticularly if the pension planrsquos benefit levels do not exceed PBGC guaranty limits and have not been increased by recent plan amendments By contrast the insurance safety net generally provides higher levels of protection under other circumstancesmdashfor instance when (a) benefits exceed PBGC guaranty levels (b) recent plan amendments have increased benefit levels or (c) funded ratios are relatively high While the Willis Towers Watson Study compares the two systems at equal funded ratios at the time of failure there is little evidence to suggest that failed insurers issuing pension de-risking annuities under the modern insurance regulatory system would have funded ratios of 75 or lower which occurs routinely in pension plan failures
Both the pension system and the insurance system provide strong protections for their consumersrsquo benefits This conclusion is a conse-quence of the combined effects of each systemrsquos two protection componentsmdashfirst protecting the solvency of pension or annuity payers and second providing an effective resolution process and safety net if and when the payer becomes insolvent and requires resolution
6 | National Organization of Life and Health Insurance Guaranty Associations
THE PENSION PROTECTION SYSTEM
Private-sector employer-sponsored pension plans first appeared in the United States in
the late 19th Century and developed over time for various reasons in particular responding to tax advantages that came to be provided under federal tax law12 The modern pension regulatory system however began four decades ago with the enactment of the federal Employee Retirement Income Security Act of 1974 (ERISA)13 Congress enacted ERISA primarily to address high-profile cases of lost pension benefitsmdashsome caused by employer-initiated cutbacks of promised bene-fits and some by employer financial failures14 In response Congress created a complex federal regulatory system for private-sector pension plans dividing regulatory responsibility among the Treasury Departmentrsquos Internal Revenue Service (IRS) the Department of Labor (DOL) and the newly created Pension Benefit Guaranty Corporation (PBGC)15
Although ERISA protects benefits promised under pension plans ERISA does not require that employers adopt defined benefit pension plans or any other types of retirement plan Even for those employers who adopt pension plans ERISA allows them to terminate their plans so long as they provide for benefits already earned (or are in financial distress) and meet other stat-utory requirements16 An employerrsquos decisions to establish and to continue maintaining a pension plan are entirely voluntary and the prevalence of pension plans has decreased materially over time In the past two decades for example the number of single-employer pension plans in the PBGC system has decreased from more than 53500 plans (in 1995) to about 22000 (in 2015) and covered participant counts have decreased
from almost 20 of the private-sector workforce to approximately 10 of that workforce17
In creating the ERISA structure Congress made private pension regulation a federal domain by preempting virtually all state laws that affect ERISA-covered plans Congress did however recognize that states would continue their long-standing regulation of the business of insurance18 mdashan important exception given the insurance industryrsquos traditional role in the development and delivery of pension benefit programs
Under the federal regulatory system the DOL and the IRS enforce a range of ERISA requirements intended to protect pension plan participants but the PBGC has the primary responsibility for insuring participants against private-sector pension plan insolvency Formed within the DOL as an independent federal corporation the PBGC is governed by a Board of Directors whose members are the Secretary of Labor the Secretary of the Treasury and the Secretary of Commerce19
The PBGC operates two separately funded insur-ance programs for private-sector defined benefit plansmdashone for multiemployer plans (co-spon-sored by unions and employers) and another for single-employer plans (each sponsored by one employer and its corporate affiliates) The PBGC insurance program for single-employer plans which is the main subject of this summary is funded primarily through three distinct sources (1) two-part annual premiums paid by active pension plans (2) assets assumed from underfunded terminated plans and (3) invest-ment earnings20 In recent years Congress has increased both parts of PBGC premiumsmdashfrom
ONEA Brief Overview of the Two Consumer Protection Systems
ONE A Brief Overview
Consumer Protection Comparison The Federal Pension System and the State Insurance System | 7
$35 per participant plus 09 of any unfunded liability (in 2012) to $80 per participant plus 41 of unfunded liability (to take full effect by 2019)21 The programs do not receive funding from general tax revenues and their obligations are not backed by the full faith and credit of the United States22
PBGC funding resources have been significantly strained in recent years The multiemployer programrsquos financing has been particularly chal-lenged with the PBGC projecting as recently as 2014 that ldquothe multiemployer program is highly likely to run out of money within a decaderdquo23 As part of the Multiemployer Pension Reform Act of 2014 Congress relieved some pressure on the program by providing funding relief for multiemployer pension plans including allowing distressed plans to reduce promised bene-fits24 The single-employer program while less distressed is operating at significant deficits and has been affected by a declining base of pension plans At the end of its Fiscal Year 2015 the PBGCrsquos single-employer program covered fewer than 30 million participants in about 22000 active pension plans The single-employer program then had liabilities from previously terminated plans of $1098 billion assets of $857 billion and a deficit of $241 billion25 By comparison at the end of Fiscal Year 2008 the program covered almost 34 million participants in about 28000
plans and had liabilities of $723 billion assets of $616 billion and a deficit of $107 billion26 In the Multiemployer Pension Reform Act Congress did not extend to single-employer pension plans the power to reduce promised benefits
THE INSURANCE PROTECTION SYSTEMThe regulation of insurance and the protection of insurance consumers have been part of the United States legal landscape since 1851 when New Hampshire appointed the first insurance commissioner in the country27 Although the federal government comprehensively regulates many other financial sectors states have long had the primary responsibility for regulating insur-ance companies and protecting their customers The US Supreme Court held 70 years ago that Congress has constitutional authority to regu-late insurance but shortly thereafter Congress enacted the McCarran-Ferguson Act of 1945 reserving to the states the primary responsibility for regulating the business of insurance except to the extent Congress enacts statutes specifi-cally applicable to insurance28 The US Supreme Court has ruled that the authority reserved to the states under the McCarran-Ferguson Act extends to the regulation of insurers from cradle to grave limited only where state law conflicts with federal law specific to insurance29
ONE A Brief Overview
Under the federal regulatory system the DOL and the IRS
enforce a range of ERISA requirements intended to protect
pension plan participants but the PBGC has the primary
responsibility for insuring participants against private-
sector pension plan insolvency
8 | National Organization of Life and Health Insurance Guaranty Associations
ONE A Brief Overview
A series of insurer insolvencies in the late 1980s in some cases resulting from speculative investment practices brought about a significant strengthening of insurer solvency regulation in the early 1990s by state insurance commis-sioners acting through the National Association of Insurance Commissioners (NAIC) The NAIC was created in 1871 to coordinate regulation of multistate insurers30 Those regulatory changes included the development of risk-based capital requirements two NAIC receivership model acts new NAIC model laws regarding insurer investment practices the codification of statutory accounting new audit requirements and the NAICrsquos state insurance department accreditation system which is designed to ensure uniformity of important aspects of solvency regulation
Each statersquos insurance commissioner has the primary responsibility for regulating the solvency of insurers incorporated in that state (commonly described as the ldquostate of domicilerdquo or the ldquodomestic staterdquo) That regulatory oversight is accomplished through a substantially uniform framework of frequent and detailed financial reporting obligations and rigorous financial restrictions developed through the NAIC including limitations on the types and concentra-tions of assets insurers are permitted to hold and conservative standards for valuing those assets and future insurance liabilities
Each statersquos review of its domestic insurers is effectively peer reviewed through the NAIC by
the insurance commissioners of the other states where the insurers are licensed The NAIC struc-ture produces a series of checks and balances in the financial oversight of life insurers In partic-ular nationally significant insurers and groups that exhibit characteristics of trending toward financial trouble are reviewed regularly on a coor-dinated multistate basis by the NAICrsquos Financial Analysis Working Group (FAWG) a standing body made up of experienced senior financial regula-tors from multiple states31
If a potential financial issue is uncovered by the insurerrsquos domestic department of insurance or through FAWGrsquos review the domestic commis-sioner has broad statutory authority to intervene directly in the insurerrsquos business and require that a corrective plan be developed and implemented to remove the cause of the financial concern If corrective actions do not or cannot remediate the problems the domestic commissioner has the authority to seek a court-supervised receivership in which the commissioner serves under state law as court-appointed receiver for the financially impaired insurance company32 In that capacity the commissioner assumes full control of the insol-vent insurer and retains any necessary indepen-dent experts to evaluate the insurerrsquos condition The receiver determines whether the insurerrsquos financial issues can be addressed in a way that will permit the insurer to return to business and private management or whether the problems require that the insurer be liquidated
The US Supreme Court has ruled that the authority
reserved to the states under the McCarran-Ferguson Act
extends to the regulation of insurers from cradle to grave
limited only where state law conflicts with federal law
specific to insurance
Consumer Protection Comparison The Federal Pension System and the State Insurance System | 9
ONE A Brief Overview
In the worst-case financial situation the receiver may seek a court order declaring the insurer insolvent and ordering it to be liquidated Such an order ldquotriggersrdquo the GAs obligating and empow-ering them to protect their state residents up to statutorily specified benefit levels
The national network of GAs began to take shape in 1971 Before 1971 only two states (New York and Wisconsin) had enacted guaranty mech-anisms for insurance consumers In 1971 the NAIC adopted the first model life health and annuity guaranty association act33 By 1991 every state legislature had created a GA to protect its life health and annuity policyholders against insurer insolvency34
While a court order of liquidation is necessary to trigger GA payment obligations the GAs and the insurance commissionerreceiver typically begin to coordinate efforts much earlier in troubled insurer situations often before any receivership proceeding is commenced35 For life insurers licensed in multiple states that coop-eration generally occurs between the domiciliary regulator (and any ldquospecial deputy receiverrdquo the regulator may have designated to act on the regulatorrsquos behalf) and NOLHGA The GAs formed NOLHGA in 1983 to provide a process facilities and staff to coordinate and support the activities of the member GAs particularly in connection with the insolvencies of insurers writing business in multiple states36
If an insurer liquidation occurs each affected GA obtains funds to meet its guaranty obligations through two primary sources First to the extent GAs are liable for the financial risks that other-wise would be borne by policyholders the GAs stand on equal footing with the insolvent insur-errsquos policyholders as priority claimants to the insurerrsquos remaining assets37 To the extent that those assets are insufficient to meet GA coverage obligations each GA may levy assessments against all other life insurers licensed in the state By statute each licensed life insurer must become and remain a member of the statersquos GA
If the GA needs funds when one of those member insurers becomes insolvent it determines the needed amount and assesses it against all of the licensed insurers based on their shares of the premiums in the state typically over the three years prior to the insolvency Member insurers are obliged to make prompt payment of those assessments as a condition to continuing to do business in the state38 Like the PBGC each GArsquos protections are self-financed primarily through member assessments and assets of insolvent insurers allocated to the insurance and annuity obligations the GA protects The GAs do not receive general tax revenue from their states and their obligations are not backed by their statesrsquo full faith and credit39
The GAs work with the insolvent insurerrsquos receiver to develop comprehensive resolution plans for the affected policyholders and annuitants Such resolutions are often accomplished by effecting a transfer of the insolvent insurerrsquos business to a financially healthy life insurer through an assumption reinsurance transaction in which the healthy insurer acquires certain policy liabil-ities and assets supporting those liabilities In some transactions the failed insurerrsquos annuity business will have an additional strategic value to the purchaser in which case the purchaser will pay additional value for the assumption usually described as a ldquoceding feerdquo or an ldquoenhancementrdquo Although the form of that payment may vary it produces additional value that can be used to protect the insolvent insurerrsquos policyholders and annuitants who have benefits in excess of the GAsrsquo coverage levels Assumption reinsurance transactions have been employed in a number of significant insurance receiverships 40
THE SPECIAL STATUS OF INSURANCE UNDER ERISABy the time Congress enacted ERISA insur-ance companies had long been quite involved in providing pension benefits As far back as the 1920s employer plans often relied upon major insurers to bear pension funding risks through group annuity contracts41 When created in the
10 | National Organization of Life and Health Insurance Guaranty Associations
ONE A Brief Overview
1970s the ERISA regulatory system did not supplant the insurance industryrsquos traditional role In fact in view of insurersrsquo highly regulated character and unique risk-spreading capabili-ties ERISA has accorded insurers special status including in these respects
bull Even though ERISA prohibits most state laws from affecting ERISA-covered plans it expressly allows states to regulate insurance even annuity policies that pay benefits under ERISA-covered pension plans42
bull Although ERISA generally requires employers to hold pension plan assets in trust employers may instead safeguard plan assets by paying them directly to an insurance company either as premiums to purchase policies or as deposits43
bull ERISArsquos required annual reports (on the Form 5500 series) provide simplified reporting and audit requirements for benefit plans funded through insurance44
bull While ERISA generally guarantees defined benefit pensions through the PBGC PBGC guaranties do not apply to pension benefits covered by irrevocable commitments from insurance companies 45
bull Recently the Departments of the Treasury and Labor have been looking to the insurance industry as a means to provide lifetime income options under defined contribution plans The
Departments ldquoare engaged in a joint initiative to encourage the prudent consideration offering and use of lifetime income alternatives including annuities in retirement plansrdquo 46
bull Of particular relevance to current de-risking initiatives if a sponsoring employer decides to terminate its pension plan ERISArsquos standard termination rules require that the employer provide for future benefit payments by offering to purchase annuity contracts from private insurers47 In a standard plan termination or other de-risking transaction an individual ceases to be a plan ldquoparticipantrdquo once the indi-vidualrsquos ldquoentire benefit rightsrdquo are ldquofully guar-anteed by an insurance companyrdquo are legally enforceable at the individualrsquos sole choice and are reflected in a policy or certificate issued to the individual 48
One of the most important interactions between the ERISA and insurance worlds occurs when a pension plan purchases an annuity contract to pay benefits whether as part of a complete de-risking transaction resulting from a full plan termination or as part of a partial de-risking transaction for one or more subsets of plan participants In implementing such a purchase the planrsquos fiduciaries must comply with the prudence loyalty and other statutory duties that ERISA demands of fiduciaries and by violating those duties fiduciaries may incur a range of
Even though ERISA prohibits most state laws from affecting
ERISA-covered plans it expressly allows states to regulate
insurance even annuity policies that pay benefits under
ERISA-covered pension plans
Consumer Protection Comparison The Federal Pension System and the State Insurance System | 11
ONE A Brief Overview
statutory sanctions including personal liability The Department of Labor has issued special guidance for fiduciaries when selecting annuity providers for pension plans including the central requirement that they ldquotake steps calculated to obtain the safest annuity available unless under the circumstances it would be in the interests of participants and beneficiaries to do otherwiserdquo To satisfy that requirement commonly referred to as the ldquosafest available annuityrdquo standard fiduciaries are to consider such factors as the insurerrsquos investment portfolio (including quality and diversification) its size relative to the annuity contract its capital and surplus and its business lines and exposure to liability In addition the fiduciaries must consider state guaranty associ-ation coverage and ldquothe structure of the annuity contract and guarantees supporting the annu-ities such as the use of separate accountsrdquo49 Given those obligations plan fiduciaries often engage independent fiduciaries to implement major annuity-purchase transactions and they have strong incentives to select the largest and most financially secure insurers
12 | National Organization of Life and Health Insurance Guaranty Associations
TWO How the Systems Protect Payer Solvency
In both the pension system and the insurance system the first line of consumer defense is
to assure the financial health of those private entities that have promised to pay benefits If the government regulatory systems can help prevent the insolvency of those private payers the consumers will receive all their promised benefits without having to invoke the backup protections of the resolution and safety net mechanisms50
INSOLVENCY PREVENTION IN THE PENSION SYSTEMPrivate pension funding sourcesOngoing pension plans typically have two sources of benefit fundingmdashthe planrsquos trust assets and the sponsoring employerrsquos general assets At the first level a pension plan normally funds benefits through a trust a separate legal entity established for the exclusive purpose of paying plan benefits and related expenses The planrsquos sponsoring employer establishes the trust by agreement with a trustee often a bank or other financial institution The trust accumulates assets from periodic contributions made by the sponsoring employer (and in some cases by participants) and from investment earnings on those contributions When participants retire the trust pays plan benefits from its assets Trust assets are protected from the sponsoring employerrsquos insolvency and cannot be reached by the employerrsquos creditors nor can they be with-drawn by the employer except in a plan termina-tion after full satisfaction of all benefits51
But trust assets are not always equal to the planrsquos benefit liabilities In a defined benefit plan benefit formulas (often based on participantsrsquo compensation levels and years of service) dictate the participantsrsquo earned benefit amounts At
a given time the trust may be ldquounderfundedrdquo having trust asset values less than the value of the planrsquos promised benefits Underfunding may occur for a variety of reasonsmdashcommonly because contributions have been phased in gradually investment earnings have been smaller than predicted benefit liabilities have grown larger (often because of interest rate movements) or become payable more quickly than expected or a combination of those factors Moreover the rules applicable to pension plans do not require a plan to recognize the planrsquos full economic liability For instance the recognition of future expenses of the plan and a provision for asset defaults are not required to be part of the accounting value for a pension plan but are required to be included in the reserves an insur-ance company must establish and fully fund Nor does ERISA require that trust assets always equal the present value of future liabilities instead it generally allows plans to remedy underfunding gradually over several years
When trust assets do not match plan liabilities the ERISA system looks to the ultimate source of plan fundingmdashthe sponsoring employer and its corporate affiliates52 For an underfunded plan that continues to function and pay bene-fits ERISA generally requires the sponsoring employer to make contributions that over time and using various assumptions are expected to bring the plan to full funding And for a pension plan that terminates in a ldquostandard termina-tionrdquomdasha process managed by plan fiduciaries and service providers (without the PBGC assuming plan assets and payment obligations) through the purchase of an annuity from a licensed life insurance companymdashERISA requires the spon-soring employer to make whatever contributions are necessary to fund plan benefits fully53
TWOHow the Systems Protect Payer Solvency
Consumer Protection Comparison The Federal Pension System and the State Insurance System | 13
TWO How the Systems Protect Payer Solvency
Pension solvency-regulation mechanismsIn regulating the first level of funding sourcesmdashthe trust assetsmdashERISA employs a variety of mech-anisms to encourage sound funding Compared to insurance company regulation however the regulatory oversight is less regular pervasive and strict With about 22000 single-employer pension plans to oversee the ERISA compliance system relies heavily on plan-level fiduciaries and service providers with regulators primarily limited to reviewing (to varying degrees) plan reporting auditing compliance on occasion and taking aggressive action only after serious financial problems have been clearly identified ERISArsquos primary controls on trust funding include the following
bull Annual minimum funding requirements Federal law establishes an annual contribution requirement which the IRS may waive in the event of business hardship Rules for calcu-lating minimum contributions are complex but they rely on actuarial assumptions (with prescribed interest rates and mortality tables) and offer some contribution-smoothing mech-anisms (including seven-year amortization of funding shortfalls) The calculations are done deterministically and stochastic testing is not required54 Funding status can deteriorate rapidly even if the sponsoring employer has always met its minimum contribution require-ments Pension plans which are not subject to fixed asset-allocation requirements and often allocate more than 60 of their invest-ments to equities may experience unexpected asset losses55 And they can have unexpected spikes in benefit liabilities caused by drops in the discount rates used for determining the present value of future benefit liabilities56
bull Benefit restrictions If a planrsquos funding level falls below certain levels suspensions are imposed (at various funding thresholds) on certain ancillary benefits lump sum distributions benefit improvements and additional benefit accruals57
bull Fiduciary duties Those who exercise discretion and control over plan assets including invest-
ment decisions must satisfy fiduciary duties of prudence loyalty and diversification and must comply with ERISA and plan provisions58 Those duties are general in nature however and focus more on compliance with appropriate procedures than with actual results
bull Procedural requirements Most pension plans must have annual audits obtain actuarial eval-uations and file various reports with federal agencies59
bull IRS and DOL enforcement Both the IRS and the DOL may audit plans to determine compliance with legal requirements and impose a variety of sanctions for violations The DOL may also bring court actions for injunctive and mone-tary relief and in limited situations criminal sanctions60
bull PBGC enforcement The PBGC collects premiums for its insurance coverage including a variable premium that increases with funding shortfalls and requires formal notice of certain ldquoreportable eventsrdquo that may suggest deterio-ration in plan financial security If plan funding is sufficiently threatened the PBGC may initiate an involuntary termination take over the planrsquos assets and benefit payments and seek to recover any shortfall from the plan sponsor and its affiliates The PBGC may also file claims and take other litigation action if the sponsoring employer (or an affiliate) goes through bank-ruptcy proceedings In advance of taking those formal enforcement actions the PBGC may also negotiate for funding improvements or other financial security enhancements61
bull Termination procedures To terminate a pension plan in a standard termination the spon-soring employer must obtain special actuarial certifications and provide special reports to employees and regulators If the plan has insufficient assets the sponsor must make up the shortfall or abandon the termination process62
In contrast to its regulation of trust funding ERISA includes no regulatory power at all over a planrsquos ultimate funding sourcemdashthe financial strength of the sponsoring employer and its corporate affili-
14 | National Organization of Life and Health Insurance Guaranty Associations
TWO How the Systems Protect Payer Solvency
ates As the PBGC recognized in an August 2012 report on plan funding ldquothe risk of termination of a plan depends most significantly on the plan sponsorrsquos financial strength not on its current funding levelrdquo63 The sponsoring employer and its affiliates are jointly and severally liable for making plan contributions and for covering the planrsquos funding shortfall upon plan termination Despite that reality the federal pension system contains no mechanisms to control the financial health of sponsoring employers
Pension plan failure experienceThe global financial crisis that began in late 2008 and the related ldquoGreat Recessionrdquo took a toll on the nationrsquos pension plans Several hundred plans covering hundreds of thousands of partic-ipants failed financially causing PBGC takeovers and triggering PBGC benefit guaranties As described in the PBGCrsquos 2009 Annual Report the ldquobreadth of business failures across sectors and regions in FY 2009 was unprecedented in PBGCrsquos 35-year experiencerdquo In that year ldquoPBGC became directly responsible for the pensions of nearly 201000 new participants the third-highest annual total in PBGCrsquos history and about nine
times the 22000 new participants in plans taken in during FY 2008rdquo 64
Table 1 (below) using data drawn from PBGC annual reports summarizes the underfunded single-employer plans that terminated during the eight most recent PBGC fiscal years (ending September 30 of the listed year)
Note what pension plans are not covered by the above statistics (1) fully funded single-employer defined benefit plans that terminated in stan-dard terminations (2) multiemployer plans (also called Taft-Hartley plans) which are covered by a separate PBGC program (3) defined contri-bution retirement plans which are not covered by PBGC insurance and (4) plans sponsored by governmental entities and most churches which are not covered by PBGC insurance or by ERISA generally
Current pension plan financial healthAlthough comprehensive funding data is not readily available for all single-employer private-sector pension plans actuarial estimates of large employer plans provide some sense of general
FY 2008 FY 2009 FY 2010 FY 2011 FY 2012 FY 2013 FY 2014 FY 2015
Number of 67 144 147 152 155 111 86 69 Plan Failures
Number of Affected 22000 201000 99000 57000 47000 57000 53000 25000 Participants
Plan Liabilities $662 $15692 $3130 $2363 $2035 $4246 $1928 $1912
Plan Assets $391 $9860 $1688 $1173 $1027 $2367 $993 $1132
Plan Under-funding $271 $5832 $1442 $1190 $1008 $1879 $935 $780
AssetLiability Ratio 591 628 539 496 505 560 515 592
All dollar amounts are expressed in millions Plan assets do not include a recovery ratio for affected participants which is typically a small portion of benefits recovered from pension plan sponsors and their corporate affiliates
Table 1 Terminated Single-Employer Plans 2008ndash2015
Consumer Protection Comparison The Federal Pension System and the State Insurance System | 15
TWO How the Systems Protect Payer Solvency
funding levels As of the end of 2015 Milliman Inc estimated that the 100 largest corporate pension plans had an average funded ratio of 827 and Mercer LLC estimated the pension funded status for Standard amp Poorrsquos 1500 companies to average 8265 As of December 31 2015 Willis Towers Watson examined pension plan data for the 413 Fortune 1000 companies that sponsor calendar year plans and estimated an aggregate funded status of 8266
INSOLVENCY PREVENTION IN THE INSURANCE SYSTEMPrivate insurance funding sourcesThe payment of annuity benefits depends primarily on the insurerrsquos assets Those assets usually held in the insurerrsquos general account come primarily from two sources (1) premiums charged by the insurer for its insurance and annuity contracts and (2) investment income Life insurers may also raise funds from investors through issuance of corporate stock (stock companies only) or subor-dinated debt sometimes referred to as ldquosurplus notesrdquo (stock and mutual companies) This ability to raise needed capital through equity or debt issuance (coupled with the transfer of existing assets within an insurerrsquos holding company) was identified in a recent report from the Government Accountability Office as among the chief reasons many large life insurance companies were able to recover quickly from the financial crisis of 200867 Both sources of capital funding are subject to regulatory oversight by the insurerrsquos domestic commissioner 68 Although an insolvent insurance companyrsquos general creditors have legal claims against the insurerrsquos general account state law gives policyholders including annuity contract
owners and GAs (to the extent of the consumer protection they provide) the highest priority claims against the insurerrsquos general account after the administrative expenses of the insurerrsquos receivership
Insurers are also authorized to establish one or more separate accounts to support specific products issued by the insurer The assets in the separate account may be used only to meet the insurerrsquos policy obligations under the products supported by the separate account The policy-holders have no legal or beneficial ownership interest in the separate account and the insurer is prohibited under applicable insurance law from representing that the assets in the sepa-rate account are held in trust for the benefit of the policyholders or contract holders In effect a separate account creates a security interest for the benefits backed by the separate account The insurer remains fully liable for all the annuity benefits it has guaranteed regardless of whether the separate account is sufficiently funded to cover the annuity benefits it was created to protect If at any point the value of the assets held in the separate account is not at least equal to the insurerrsquos liability for the annuity obligations backed by the separate account the insurer is required to establish and hold a reserve in its general account for the deficit
ERISA regulations do not necessarily require that plan-purchased annuities be backed by separate accounts but Department of Labor guidance includes among six ldquotypes of factors a fiduciary should considerrdquo in carrying out its ERISA fidu-ciary duties the ldquostructure of the annuity contract
As the PBGC recognized in an August 2012 report on plan
funding ldquothe risk of termination of a plan depends most
significantly on the plan sponsorrsquos financial strength not on
its current funding levelrdquo
16 | National Organization of Life and Health Insurance Guaranty Associations
TWO How the Systems Protect Payer Solvency
and guarantees supporting the annuities such as the use of separate accountsrdquo69 In a trans-action utilizing a separate account the amount deposited in the separate account is available only to support the insurerrsquos benefit payment obligations to the former plan participants The separate account effectively grants former plan participants a type of secured creditor status which is further backed by recourse against the insurerrsquos general account assets if the separate account assets are insufficient to satisfy obliga-tions to payees One large de-risking transac-tion elected to split the pension planrsquos payment obligations equally between two independent life insurers rather than using a single insurer and a separate account70 And at least one large sponsor is reported to have made use of both a split transaction and a separate account
Insurance solvency-regulation mechanismsTo assure an insurerrsquos ability to meet obligations under policy commitments state insurance laws focus primarily on reporting adequate reserves for the insurerrsquos insurance and annuity obligations maintaining capital and asset levels that exceed the insurerrsquos policy obligations and requiring the insurerrsquos assets to be invested in a sound port-folio The process starts with establishing appro-priate ldquoreservesrdquomdashin effect the present value at any time typically each year-end of all the insur-errsquos insurance and annuity obligations Insurers must use NAIC-approved mortality tables and maximum discount rates which vary based on the annuity contractrsquos issue year to establish a reserve value for the insurerrsquos annuity obliga-tions Each year an insurerrsquos aggregate reserves along with the assets backing those reserves are cash-flow tested using various modeling techniques (including stochastic testing) to determine whether they are adequate in the aggregate under a range of moderately adverse conditions (including economic environments) or need to be strengthened An actuarial opinion is required as to the adequacy of the assets backing the liabilities71
The insurerrsquos assets must at all times exceed its insurance obligations by a significant margin generally measured by risk-based capital (RBC) calculations performed as of each year-end72 RBC calculations are intended to measure the minimum acceptable level of capital necessary for the insurer to support its business in view of its size and risk profile before remedial action (by either the insurer or its domestic regulator) must be taken effectively limiting the amount of risk the insurer can assume The higher the risk of an insurerrsquos insurance and annuity obli-gations the higher the amount of capital the insurer must maintain RBC values establish a minimum regulatory capital standard unique to each life insurer and its business The NAICrsquos RBC formulas establish that minimum level by focusing on four major areas (1) asset risk (2) underwriting risk (3) interest rate and market risk and (4) other risk No parallel requirement is applicable to ongoing pension plans under the federal system and funding deficits for ongoing pension plans covered by the PBGC program are permitted
The RBC results determine whether the insurer exceeds defined thresholds that would trigger corrective action The thresholds are often described as a ratio of its ldquoAuthorized Control Level RBCrdquomdashwhere the insurerrsquos financial condition has deteriorated sufficiently to autho-rize the domestic insurance commissioner to take control of the insurer An earlier warning threshold the ldquoCompany Action Level RBCrdquo is typically 200 of the insurerrsquos Authorized Control Level RBC or 300 of its Authorized Control Level RBC if the insurer is experiencing a negative trend If the ratio of an insurerrsquos Total Adjusted Capital to its Authorized Control Level RBC falls to the Company Action Level RBC the insurer must submit to its domestic insurance commissioner an explanation for that condition and a plan for raising its Total Adjusted Capital above that threshold If the insurerrsquos RBC ratio falls to lower thresholds the domestic insurance commissioner may take more aggressive action to address the insurerrsquos finances and operations
Consumer Protection Comparison The Federal Pension System and the State Insurance System | 17
TWO How the Systems Protect Payer Solvency
This regulatory scrutiny allows an insurance regulator to intervene early if an insurance company is in troublemdashbefore assets are less than the reserves needed to meet the insurerrsquos benefit obligations
Since the RBC metrics are a regulatory tool for monitoring a life insurerrsquos financial condition not a financial standard for marketing purposes the RBC ratios are not published The Authorized Control Level RBC however is published annually for each insurer and can be compared to the Total Adjusted Capital for the insurer73 The NAIC also provides an annual Summary Report that shows the results for all reporting companies in the aggregate74 According to data compiled by the American Council of Life Insurers the 2014 RBC ratios for the 50 largest individual life insurers ranged from 652 to 3508 with an average RBC ratio for these insurers of 1074 These results are significantly higher than the highest early warning ldquoCompany Action Level RBCrdquo for any of these insurers (eg an RBC ratio of 300 if the insurer is experiencing a negative trend)
In addition state insurance commissioners heavily regulate and closely monitor life insurer investments because the bulk of a life insurerrsquos assets are invested to meet the insurerrsquos long-term policy obligations75 Life insurers must generally invest in highly rated investment grade debt obligations Some investments in equities are permitted but in limited amounts Unlike pension plans whose portfolios usually include at least 60 equities life insurers are generally restricted from investing in the aggre-gate more than 20 of their admitted assets in equities listed on a qualified exchange or more than 5 in the aggregate in equities of unaffili-ated entities not listed on a qualified exchange76 Insurers must also diversify their investments with generally no more than 3 of a life insurerrsquos admitted assets invested in any single entity77 Because of the long-term nature of life insurance and annuity obligations life insurers generally invest heavily in longer-term assets like high-grade corporate bonds with long maturities78
An insurerrsquos domestic insurance commissioner confirms compliance with the applicable invest-ment requirements every year
Each life insurer must submit quarterly and annual financial statements to its domestic insurance commissioner which are accessible to the insurance regulators in every other state in which the insurer is licensed The domestic commissionerrsquos staff reviews those financial statements using a variety of financial tools and metrics to make sure the insurer is complying with financial requirements and to identify poten-tial financial and solvency issues Those financial tools and metrics have evolved over time as a result of experience gained from prior life insurer impairments and insolvencies especially during periods of significant financial stress in the life insurance marketplace
State insurance regulators must also conduct on-site risk-focused financial examinations every three to five years but may do so more frequently when circumstances warrant The ldquotriennial examinationsrdquo involve a deeper investi-gation of the insurerrsquos financial condition and the processes and controls the insurer has imple-mented to avoid financial losses
During the same 2008ndash
2015 period that saw the
failures of 931 pension
plans affecting more than
560000 participants no
active annuity insurer
with unsatisfied annuity
obligations was liquidated
18 | National Organization of Life and Health Insurance Guaranty Associations
TWO How the Systems Protect Payer Solvency
Life insurers also face public scrutiny of their financial condition Significant life insurers main-tain financial ratings by at least one public rating agency To conduct business particularly issuing annuities in connection with ERISA pension plans life insurers must generally maintain ratings in the highest financial rating categories The most widely known rating agencies for life insurance companies are AM Best Standard and Poorrsquos and Moodyrsquos Investors Service79
Insurance company failure experienceThe recent financial crisis and its aftermath had a limited effect on the insurance industry and policyholders and those few life insurers that did experience any capital or liquidity pressure generally rebounded quickly80 In fact during the same 2008ndash2015 period that saw the failures of 931 pension plans affecting more than 560000 participants no active annuity insurer with unsatisfied annuity obligations was liquidated81
Current insurance company financial healthLike all financial services industry sectors the life insurance industry experienced stress during the financial crisis but it weathered the crisis comparatively well Although much has been said and written about AIG and its ldquotoo big to failrdquo presence that resulted in a federal rescue of that company in reality the problems at AIG did not arise within the operating insurance companies or prevent them from meeting their policyholder
obligations either before or following the Great Recession82
Published data demonstrate that the overall financial health of the life insurance industry recovered quickly and remains strong For example the NAICrsquos Summary Report of RBC results for the period of 2007ndash2014 shows not surprisingly that the industry low point as measured by the median RBC ratio for all reporting life insurers occurred as of year-end 200883 Even then however the median RBC ratio of Total Adjusted Capital to Authorized Control Level RBC for all reporting life insurers was 910 In other words instead of being less than 100 funded to meet benefit obligations a life insurer at the median RBC had Total Adjusted Capital of more than 9 times the amount that would permit (but not require) an insurance regulator to take control of a life insurer Since 2008 both the median and the aggregate RBC ratios for the life industry have improved and remain strong84 In fact the median and aggregate RBC ratios for 2013 were the highest during the 10-year period reported A 2013 report published by the NAIC and the Center for Insurance Policy and Research found that medium to large annuity insurers rebounded from the financial crisis more quickly than smaller insurers through a combination of raising new capital and cutting dividends85 That reality reinforces the funding importance of access to the capital marketsmdasha strategy not directly available to private pension plans86
The insurerrsquos assets must at all times exceed its insurance
obligations by a significant margin generally measured by
risk-based capital (RBC) calculations performed as of each
year-end
Consumer Protection Comparison The Federal Pension System and the State Insurance System | 19
TWO How the Systems Protect Payer Solvency
SUMMARY OF INSOLVENCY PREVENTION IN THE TWO SYSTEMSInsurance regulators enforce stricter financial controls on insurance companies than the ERISA system applies to defined benefit pension trusts Most notably life insurers must at all times maintain assets significantly in excess of their insurance obligations and the minimum capital requirement increases with the insurerrsquos risk level ERISA defined benefit pension plans on the other hand can and oftentimes do run for years at a time with total assets lower than their pension obligations and ERISA does not require that pension plans hold additional assets to insure against equity credit longevity or interest rate risks But more importantly the federal system places no financial controls at all on the ultimate source of each pension planrsquos fundingmdashthe business that employs the participants and bears the ultimate responsibility to fund prom-ised benefits The plan is not required to hold assets equal to or in excess of plan obligations and the plan sponsor is not required to hold capital There is no federal pension plan equiva-lent to the RBC calculations or cash flow testing that would measure the financial capability of the pension plan or the plan sponsor to satisfy the promised benefits Nor is there a federal regulator charged with ongoing monitoring of the financial condition of plan sponsors and if necessary overseeing the rehabilitation of a plan sponsor The PBGC has some leverage to inter-vene and demand corrective action when a weak pension plan or plan sponsor creates risk for the PBGC but that power is not the equivalent of the ongoing regulatory financial monitoring that is at the core of the insurance regulatory system
The relative strength of the insurance regulatory controls is reflected in the comparative failure rates during the financial crisis and recovery While only five small life insurers have failed since 2008 no operating life insurer with an
active block of annuity business failed during this period By contrast that same period saw the failure of 931 single-employer pension plans affecting more than 560000 participants
20 | National Organization of Life and Health Insurance Guaranty Associations
THREE How the Systems Protect Benefits After Payer Insolvency
If the first line of consumer defense fails and a pension plan or insurance company becomes
insolvent the pension system (through the PBGC) and the insurance system (through the GAs that are members of NOLHGA) have resolution mechanisms and backup ldquosafety netrdquo programs to ensure that benefits expected by consumers will be substantially protected The two systems make use of different guaranty methodologies and claims priorities and those differences make a direct comparison difficult On balance however both systems provide a very high level of protection
THE PBGC SAFETY NET FOR FAILED PENSION PLANSPBGC pension guaranty and federal priority formulasFor single-employer defined benefit pension plans PBGC guaranties usually are triggered when an underfunded plan goes through a distress termination (initiated by the employer) or an involuntary termination (initiated by the PBGC) For each participant the PBGC generally guarantees the vested pension benefit under the plan payable as an annuity over the participantrsquos lifetime (and a survivorrsquos lifetime if applicable) up to a maximum amount that varies with the participantrsquos age at the effective date (the later of the PBGCrsquos triggering date or the participantrsquos retirement date) If a participantrsquos plan benefit is payable in the form of a joint-and-survivor annuity the benefit guaranty is reduced actuar-ially to account for the survivor interest
For PBGC-covered plans terminating in 2015 the following are representative monthly maximums (rounded to the nearest dollar)87
bull at 55mdashsingle-life annuity of $2255month joint-and-survivor (50) annuity of $2030month
bull at 65mdashsingle-life annuity of $5011month joint-and-survivor (50) annuity of $4510month
bull at 75mdashsingle-life annuity of $15235month joint-and-survivor (50) annuity of $13711month
In addition to guaranteed benefits the PBGC typically pays a small portion of non-guaranteed benefits that are not funded by the assets of the terminating plan based on what the PBGC is able to recover from the terminating planrsquos sponsor (and its controlled group affiliates) The recoverymdashexpressed as a percentage of the planrsquos unfunded non-guaranteed benefitsmdashtypi-cally results in a ldquorecovery ratiordquo (as defined by ERISA) in single digits88
The PBGC guaranties do not apply fully to new plans or to benefit increases by plan amend-ments that are adopted within a 5-year period ending with the planrsquos termination In general the guaranties phase in ratably over the 5-year period89
When a defined benefit pension plan is terminated without sufficient assets to meet its benefit obli-gations the PBGC takes over the planrsquos payment obligations and all the planrsquos trust assets The PBGC must allocate the trust assets to help fund different categories of plan benefits in order of six priority categories (PCs)90
PC 1 Benefits derived from participantsrsquo non-mandatory contributions
THREEHow the Systems Protect Benefits After Payer Insolvency
Consumer Protection Comparison The Federal Pension System and the State Insurance System | 21
THREE How the Systems Protect Benefits After Payer Insolvency
PC 2 Benefits derived from participantsrsquo manda-tory contributions
PC 3 Benefits for participants who started receiving distributions (or could have retired and started receiving distributions) at least 3 years before plan termination based on plan provisions in effect 5 years before plan termination
PC 4 Other benefits guaranteed by the PBGCPC 5 Other non-forfeitable plan benefits under
the plan andPC 6 Other (forfeitable) plan benefits
As a result of those allocation categories an underfunded planrsquos assets are generally used first to pay all benefit amounts guaranteed by the PBGCmdashexcept for any higher benefits in category 3 (which may exceed PBGC-guaranteed amounts)mdashand only the remaining plan assets if any are available to pay non-guaranteed benefits
In short the distressed planrsquos assets are often used to pay benefits that the PBGCrsquos guaranties would otherwise have to cover While one cate-gory of participants (the longer-term retirees or retirement-eligible participants in PC 3) may receive benefits in excess of PBGC guaranty limits (if trust assets are sufficient) all other participants in failed plans are generally limited to the PBGC guaranties plus minor ldquorecovery ratiordquo amounts In other words a participant in a failed pension plan generally receives benefit protection as a ldquogreater of A or Brdquo approachmdasheither (A) the PBGCrsquos guaranteed benefit level or (B) benefits supported by the participantrsquos share of the failed planrsquos assets (determined by priority categories) but not both
Actual pension benefit loss experienceIn 2008 the PBGC published a report that summa-rized how the PBGC limits have affected partici-pants in failed single-employer plans According to the report a 1999 study had found that fewer than 6 of participants in PBGC-trusteed plans lost some benefits and that the average loss for
those participants was 16 By the 2008 report however the impact was greater (in part because of changes made by the Pension Protection Act of 2006)mdashthe PBGC limits and other adjustments affected 16 of the participants in PBGC-trusteed plans and the average benefit reduction for those affected was 2891
THE GUARANTY ASSOCIATION SAFETY NET FOR FAILED INSURANCE COMPANIESInsurance guaranty and priority formulasIn the relatively rare cases when an annuity issuer fails financially GAs step in to protect the annuity certificate holders Every state has a GA that provides a guaranteed minimum level of protection to the statersquos residents And unlike the pension systemrsquos ldquogreater of A or Brdquo approach the insurance system gives each policyholder the benefit of an ldquoA plus Brdquo approach allowing a poli-cyholder with benefits exceeding GA coverage levels to receive both (A) the GA coverage level of benefits and (B) benefits supported by the policyholderrsquos share as a priority claimant of the insurerrsquos remaining assets which are usually substantial
For annuities used in pension de-risking trans-actions all state GAs provide as a guaranteed minimum level protection for at least $250000 in present value of future annuity payments for each covered life As of year-end 2015 14 states extend that coverage level to $300000 or more per life for annuity payout benefits and four of those states extend that coverage level to $500000 per life
The present value of future annuity payments is determined by appropriate mortality tables and discount rates If the present value of annuity benefits does not exceed the GA guaranty level the GA will pay all future benefits even if the aggregate amount of all payments ultimately exceeds the stated GA present value guaranty level92 If the present value of an annuitantrsquos
22 | National Organization of Life and Health Insurance Guaranty Associations
THREE How the Systems Protect Benefits After Payer Insolvency
benefits exceeds the GArsquos guaranteed level the GA will pay a percentage of the annuity benefits equal to the ratio of the guaranty level to the benefitrsquos total present value and the GA will continue those payments for the annuitantrsquos lifetime even if the aggregate amount of all payments eventually exceeds the GArsquos present value guaranty level
Consumer protection does not end with the GArsquos guaranty Under insurer-liquidation statutes all annuitants along with other policy owners and the GAs share a priority claim to the insolvent insurerrsquos remaining assets As a result if some annuity benefits exceed the GA guaranty level excess claims (for benefits higher than those covered by GAs) are entitled to share in the insol-vent insurerrsquos assets in the same proportion as all other policy-level claimants That statutory structure results in significant additional protec-tion to annuitants with benefits exceeding the amounts guaranteed by the GAs In other words GA coverage should be viewed as providing a minimum protected benefitmdashin effect a ldquofloorrdquomdashwith no limit on the ability of an annuitant to recover all benefits due if the insolvent insurerrsquos remaining assets are adequate to cover the claims of all policyholders
For example assume the following (1) a failed life insurer had a funded ratio of 90mdashassets equal to 90 of its insurance liabilities (which is not uncommon when life insurers fail)93 (2) two spouses were covered by a joint-and-survivor annuity of $3000 per month (with no reduction after the death of the primary annuitant) (3) the couple resides in a state that guarantees $250000 of annuity present value ldquowith respect to one liferdquo and (4) the total present value of the joint-and-survivor annuity is calculated to be $500000mdashconsisting of $350000 for the primary annuitantrsquos lifetime and $150000 for the survi-vorrsquos remaining lifetime Under those assump-tions which include a benefit level far in excess of typical pension benefits the insurance system will protect 98 of the couplersquos annuity benefits as explained below
bull The GA would guarantee $400000 of that annu-ityrsquos $500000 valuemdash$250000 (out of $350000) for the primary annuitant plus $150000 for the survivor94 With an aggregate GA coverage percentage of 80 ($400000 divided by $500000) the GA would pay 80 of each $3000 monthly benefit or $2400 per month as long as either annuitant is alive
bull That would leave $600 of each monthly payment (with a $100000 present value) not covered by the GA guaranty But that $600 excess amount would share a priority claim to the insurerrsquos remaining assets Since the insurerrsquos assets in this example equal 90 of its policy liabilities the couple would receive from the insurerrsquos assets 90 of the $600 excess amount or $540 per month with a present value equal to 90 of $100000 or $90000
bull As a result $490000 of the couplersquos total annuity value would be protected by the combi-nation of the GA guaranty and the priority claim to the insurerrsquos assets95 That would produce total protected payments of $2940 ($2400 plus $540) per month or 98 of the original $3000 monthly benefit96
Unlike the PBGC guaranty for pension plan bene-fits the GA guaranties do not reduce coverage for annuity benefits purchased shortly before insolvency Nor are the holders of uncovered benefits subject to different priority rights to the insurerrsquos remaining assetsmdashall annuity benefits have the same priority claim to the insurerrsquos assets without regard to the annuitantrsquos age or retirement status
As described above the GAs fund their guaran-teed benefits from two primary sources First the GAs step into the shoes of the policyholders whose protection they provide to the extent of their guaranteed benefits so they share with uncovered policyholders a priority claim on the insurerrsquos remaining assets In the example above that would yield assets of $360000 (90 of $400000) Second a GA covering an annuity payee in this example would collect the necessary additional funds by assessing every life insurer
Consumer Protection Comparison The Federal Pension System and the State Insurance System | 23
THREE How the Systems Protect Benefits After Payer Insolvency
licensed in the GArsquos state for its share of the guar-anteed benefit costs
Although not required by law in many large de-risking transactions the pension plan has arranged for the insurer to create a fully funded ldquoseparate accountrdquo as security for all the insurerrsquos benefit obligations to the former plan participants transferred to the insurer under the group annuity contract The separate account is owned by the insurer but by state statute the insurer cannot use the separate account assets for any purpose other than to pay the liabilities for which the separate account was established For benefits supported by a separate account the technique effectively grants annuitants (for example former pension plan participants) a type of secured-creditor status making the insurerrsquos solvency status less important than the separate accountrsquos funding level As long as the separate account is fully funded to support the related annuity contracts the insurerrsquos insol-vency (regardless of funded ratio) would cause no reduction in the related annuity benefits If the separate account assets were ever to fall below the applicable annuity benefit liabilities the annuitants would be protected by GAs and their claims in excess of separate account assets and GA coverage levels would be a claim against the insurerrsquos general account and would share to the extent of the separate account shortfall the
same priority claim as other policy-level claim-ants to the insurerrsquos general assets
As noted above in at least two recent de-risking transactions the pension plans split their annuity purchases equally between two major unrelated life insurers That approach spreads the solvency risk between two insurers and results in twice the level of available GA guaranties because GA guaranties are determined on a per-personper-insurer basis at the time of an insurerrsquos liquidation For example assume that a pension plan participant lived in a state with a $250000 GA coverage level but had a total pension benefit with a present value of $500000 at the time of a failure If the plan had transferred the entire benefit obligation to a single insurance company and the insurance company failed only half of the participantrsquos benefit would fall within the GArsquos coverage level But if the plan split that benefit obligation equally between two unrelated insurers the participantrsquos entire benefit would fall within GA coverage levels because each $250000 portion would be entitled to its own $250000 GA guaranty In the event one of the insurers were to fail the half of the benefits being provided by the second solvent insurer would be unaffected (ie the annuitants would continue to receive 100 of that half of their benefits being paid by the solvent insurer) The half of the annuity benefits promised by the insurer
Although the two systems use a variety of mechanisms to
satisfy benefit claims the two most important elements
are (1) the level of an individualrsquos benefits that are directly
guaranteed and (2) the extent to which an individual will
benefit from the assets of the insolvent payer (whether
pension plan or insurance company)
24 | National Organization of Life and Health Insurance Guaranty Associations
THREE How the Systems Protect Benefits After Payer Insolvency
becoming insolvent would be protected by the GA up to the full present value per life coverage level If the benefits promised by the failed insurer exceed the maximum present value GA coverage level the excess benefits would be supported by the insolvent insurerrsquos remaining assets as described in the example above In the unlikely event that the second insurer also were to fail the benefits promised by that insurer would also be covered up to the full per-life GA present value coverage level without any reduction from the GA benefits provided as a result of the first insurerrsquos
failure So by splitting pension benefits between two insurers the solvency risk is split between two insurers and the plan participants receive twice the level of GA coverage
Actual insurance benefit loss experienceNOLHGArsquos data show that policyholders and annuitants have fared well historically in insurance company insolvencies especially in insolvencies of large annuity issuers that might be considered by pension plan fiduciaries for de-risking transactions The bar graphs below
2
4
6
8
10
12
14
16
1173 Loss1680 Billion
18
0Allocated Annuities
Bill
ions
of D
olla
rs
Allocated Annuities(Including ELNY)
Loss
GA Cost
Estate Assets ndash Covered
Estate Assets ndash Uncovered
Ceding Fee
Total Obligation Protected
2
4
6
8
10
12
14
16
411 Loss582 Billion
18
0Allocated Annuities
Bill
ions
of D
olla
rs
Allocated Annuities(Excluding ELNY)
Loss
GA Cost
Estate Assets ndash Covered
Estate Assets ndash Uncovered
Ceding Fee
Total Obligation Protected
Consumer Protection Comparison The Federal Pension System and the State Insurance System | 25
THREE How the Systems Protect Benefits After Payer Insolvency
demonstrate thatmdashthrough a combination of the GA guaranties claims against insolvent insurersrsquo remaining assets and other carriersrsquo assump-tion of failed insurersrsquo policiesmdashinsurer failures from 1991ndash2014 caused annuities to experience an aggregate loss of 1173 including the effect of the anomalous ELNY case97 and its extraordi-narily large structured settlement annuities and unusually high asset shortfall98 By removing the distorting effect of the outlier 1991 ELNY failure (which occurred before the modern regulatory enhancements and their focus on risk-based capital) annuitantsrsquo experience improves to an aggregate loss of only 411 In all cases the losses were borne by those individuals who had the largest benefit levels in excess of GA guar-anty levels and their loss experience varied by the size of their excess benefits and the value of the insurerrsquos remaining assets
SUMMARY OF POST-INSOLVENCY PROTECTIONS IN THE TWO SYSTEMSIf a pension plan or an insurance company actu-ally reaches the point of financial failure both systems provide very strong benefit protection for the affected individuals As reflected in the Willis Towers Watson Study (summarized in the next section) the two systems have some significant differences in the design and application of their safety net formulas priorities and other details but both systems cover the vast majority of all benefit claims For the small minority of benefit claims not fully covered at the margins each system may provide slightly better coverage than the other with respect to individuals in particular situations
Although the two systems use a variety of mech-anisms to satisfy benefit claims the two most important elements are (1) the level of an indi-vidualrsquos benefits that are directly guaranteed and (2) the extent to which an individual will benefit from the assets of the insolvent payer (whether pension plan or insurance company) In general the PBGC guarantees pension benefits at a higher level than the annuity level that most state
GAs guarantee The PBGC maximum is slightly more than $5000 per month for a single-life annuity starting at age 65 (for 2015 plan termi-nations) while most guaranty associations use a $250000 present-value maximum ldquowith respect to one liferdquo
On the other hand the insurance receivership process operating as it does in tandem with the guaranty system allows most individuals to benefit from a substantially higher share of an insolvent annuity issuerrsquos assets than would be available from the assets of a failed pension plan With the exception of one category of participants (those actually receiving or eligible to receive retirement benefits for at least three years before plan termination) the PBGC uses plan assets to satisfy PBGC-guaranteed benefits and generally pays participants little from the plan or sponsoring employer to cover benefits above the guaranteed level For insurer insolvencies policyholders with claims exceeding the levels guaranteed by GAs have priority claims to the insolvent companyrsquos assets ranking pari passu with all other policy-level claims (including those of GAs for covered claims) That priority creditor status for such ldquoexcessrdquo claims in fact provides substantial protection in addition to the baseline protection levels that are guaranteed by GAs
For example if an insolvent insurer had a funded ratio of 75 a policyholder would receive payment for 75 of the benefit claim amounts exceeding the amount fully guaranteed by the GA By contrast if a pension plan had the same funded ratio plan participants (other than those in the actualeligible retirement priority category) would receive a much smaller percentage (typi-cally in single digits) of claims in excess of the PBGC guaranty Those plan participants in the actualeligible retirement priority category might end up with some higher protection from the planrsquos assets for benefits in excess of the PBGC guaranty depending on how much of the planrsquos liability would be attributable to those benefits
26 | National Organization of Life and Health Insurance Guaranty Associations
THREE How the Systems Protect Benefits After Payer Insolvency
The ultimate level of protection any individual would receive under either system for the same level of promised benefits would be driven by many different factorsmdashsome unique to the indi-vidual (eg age promised benefit level and (for the PBGC) whether the individual was or could have retired) and some based on the financial condition of the failed payer (eg the funded ratio and (for the PBGC) the aggregate levels of bene-fits falling within each of the ldquoPCrdquo categories) To help illustrate and compare how the two safety net mechanisms would operate in some specific individual situations several examples drawn from the sample Hourly Salaried and Retiree Plans that Willis Towers Watson analyzed in its study are included in the attached Appendix
Table 2 (below) summarizes the most significant differences between the two systemsrsquo guaranty and priority mechanisms
WILLIS TOWERS WATSON STUDYAt NOLHGArsquos request Willis Towers Watson performed a quantitative analysis that compared the post-insolvency benefit protections under the PBGC safety net with those under the GA safety net The Willis Towers Watson Study did not attempt to compare the systemsrsquo relative strengths in assuring the financial health of private pension plans and private annuity issuers (discussed in Part TWO above) Instead the study focused on how the systems restore promised benefits in the event a pension plan or insurer actually fails (discussed in this Part THREE)
The Willis Towers Watson Study used sample populations drawn in part from actual insolven-cies and in part from typical demographic and benefit patterns to compare the PBGC protec-tion levels for a pension plan insolvency to the GA protection levels in an annuity issuer insolvencymdash
Pension System Annuity (Insurance) System
Guaranty maximum slightly more than $5000 per month present value ldquowith respect to one as a single-life annuity at age 65 (for liferdquo of at least $250000 2016 plan terminations)
Application to joint single reduced maximum applies separate maximum applies to each and survivor annuities covered life
Priority of claim as longer-term retirees and retirement all insureds have the same priority among individuals to eligibles have priority over other insolvent payerrsquos assets participants
Priority of claim as plan assets used first to pay all policy-level claims have equal compared to guarantor PBGC-guaranteed benefits priority (including those of GAs) to benefit of insolvent (except for longer-term retirees payerrsquos assets and retirement eligibles)
Coverage for recent limited coverage for benefits added full coverage for all earned benefits benefit increases within 5 years of termination including recent benefit enhancements
Participants who have been receiving or have been eligible to receive retirement benefits for at least three years before plan termination based on plan provisions in effect five years before plan termination
Table 2 Differences Between the Two Systemsrsquo Guaranty and Priority Mechanisms
Consumer Protection Comparison The Federal Pension System and the State Insurance System | 27
THREE How the Systems Protect Benefits After Payer Insolvency
assuming identical populations of covered indi-viduals (as the plan participants or the annuity payees) and equal funded ratios for the private payers (the pension plan versus the insurerrsquos general account)99 Willis Towers Watson noted that this approach was necessary because the federal-state comparison is ldquohighly dependent on certain key features of the population for which the comparison is maderdquomdashincluding participant ages benefit amounts history of plan changes early retirement provisions and prevalence of different payment formsmdashand using actual data was an objective approach for defining these critical features for comparison100 The study also applied the same mortality and discount rates used in an actual insurer liquidation case and made additional assumptions that included the following
bull the pension plans terminated in 2014 and were subject to PBGC guaranty limits and equiva-lence assumptions for 2014 terminations
bull the annuity issuers failed and triggered GA coverage in 2014
bull the GA coverage level was $250000 per covered life including spouses for joint-and-survivor annuities101
bull one-half of plan participants not yet retired would receive 50 joint-and-survivor annuities
bull for participants not yet retired benefit payments would start at age 65 and
bull annuity purchases did not involve the added security (unlike several recently reported de-risking transactions) of either insurance company separate accounts or splitting annuity purchases between multiple insurers
Willis Towers Watson compared the safety nets using three different pension plan populations with representative characteristics (1) an ldquoHourly Planrdquo that covered both unionized and non-unionized hourly paid employees (including active employees vested former employees not yet receiving benefit payments and retirees already receiving payments) and had a history of benefit improvements (2) a ldquoSalaried Planrdquo that covered a salaried workforce (including active terminated vested and retired participants)
and benefit amounts broadly comparable to recent annuity-purchase transactions and (3) a ldquoRetiree Planrdquo that included only salaried partic-ipants who had retired and were receiving benefit payments For each plan population the study measured each systemrsquos protection level on a ldquoHeadcount Basisrdquomdashcomparing the numbers of participants with 100 protection in each system as well as the numbers and average protection levels of the remaining participants not receiving 100 protectionmdashand on an ldquoObligation Basisrdquomdashcomparing the protected percentages of partici-pantsrsquo aggregate benefits (at present value)
The following explanations and bar graphs summarize the comparative protections provided for each plan population at various funded ratios under the pension and insurance safety nets In each Headcount Basis graph each pair of columns compares at a particular plan and insurer funded ratio the protection that covered individuals would receive from the pension and insurance resolution and safety net systems In each column the lower box (completely filled with the darker color) represents the number of individuals with fully protected benefits The upper box represents the number of partic-ipants whose benefits are partially covered and the lighter color-filled portion of the upper box reflects the average protection percentage for those partially covered individuals In each Obligation Basis graph each pair of columns compares at a particular planinsurer funded ratio the percentage of aggregate benefits that would be protected under both safety nets for the entire population of covered individuals All of the bar graphs are based on the Willis Towers Watson quantitative analysis that compares pension plan failures to insurance company failures at the same funded ratios Historical experience shows that such a comparison does not provide a complete picture because the funded ratios tend to be materially higher in the rare cases of insurance company failures than the funded ratios when pension plans fail A more detailed discussion of the impact of higher funded ratios for failed insurance companies follows the comparisons below
28 | National Organization of Life and Health Insurance Guaranty Associations
THREE How the Systems Protect Benefits After Payer Insolvency
Hourly Planbull PBGC system Without allocating any plan
fundingmdashas if the failed plan had a funded ratio (of assets to liabilities) of zeromdashthe PBGC guaranty itself would fully protect all of the benefits for 92 of participants and for the remaining 8 of participants the PBGC guar-anty would cover 965 of their benefits On an aggregate obligation basis the PBGC guaranty itself would cover 995 of the planrsquos overall obligations After adding in participant rights to the planrsquos remaining assets participants would not receive additional protection unless the planrsquos funded ratio was at least 995
bull State guaranty system Before allocating any insolvent insurerrsquos assetsmdashas if the insurerrsquos funded ratio were zeromdashthe GA guaranty would fully protect all benefits for 98 of annuitants and for the remaining 2 of annuitants 77 of their benefits On an aggregate basis the GA guaranty itself would cover 969 of the insur-
errsquos overall annuity obligations After taking into account the participantsrsquo rights to the insurerrsquos remaining assets (and assuming a funded ratio of 85) the GA system would provide full protection for the same 98 of annuitants the remaining 2 of annuitants would have 965 of their benefits covered and on an aggregate basis the GA system would cover 995 of all annuity obligations102
bull Comparison The GA system would leave fewer individuals with benefit reductions and its overall coverage percentage would be somewhat higher than the PBGCrsquos overall percentage if the insur-errsquos funded ratio was at least 85 Comparisons on a Headcount Basis and an Obligation Basis are reflected in the ldquoHourly Planrdquo bar graphs The percentage numbers at the top of each bar in the ldquoHeadcount Basisrdquo graph identify the average protection received by those individuals who would not be fully protected
Historical data however demonstrate first that failures of
life insurers writing annuities are rare while pension plan
failures are more common and second that in the relatively
rare cases when insurance companies have failed their
funded ratios have been materially higher on average than
the funded ratios of failed pension plans
Consumer Protection Comparison The Federal Pension System and the State Insurance System | 29
THREE How the Systems Protect Benefits After Payer Insolvency
0
5000
10000
15000
20000
30000
25000
35000
Protection by Fully and Partially Protected Participant Groups
Insurer Plan Funded Ratio
Fully
Par
tially
Pro
tect
ed In
divi
dual
s
Hourly Plan mdash Headcount Basis
PBGC ndash Partially Protected (average)
PBGC ndash Fully Protected
GA ndash Partially Protected (average)
GA ndash Fully Protected
0
96 77
0
96 83
25
96 88
50
96 94
75
96 99
95
96 100
98 100
0
10
20
30
40
50
60
70
80
90
100Aggregate Protection Level
Insurer Plan Funded Ratio
Aggr
egat
e Pr
otec
tion
Leve
l
Hourly Plan mdash Obligation Basis
PBGC GA
0 0 25 50 75 95 98 100
30 | National Organization of Life and Health Insurance Guaranty Associations
THREE How the Systems Protect Benefits After Payer Insolvency
Salaried Plan bull PBGC system Without allocating any plan
funding (as if the planrsquos funded ratio were zero) the PBGC guaranty itself would fully protect all benefits for 92 of participants for the remaining 8 of participants 57 of their bene-fits and in the aggregate 837 of all participant benefits After adding participant rights to plan assets (assuming a funded ratio of 60) the PBGC system would fully protect the same 92 of participants for the remaining 8 of partic-ipants 61 of their benefits and in the aggre-gate 86 of all plan obligations
bull State guaranty system Before allocating any of the insolvent insurerrsquos assets (as if the insurerrsquos funded ratio were zero) the GA guaranty would fully protect all benefits for 81 of the annuitants for the remaining 19 of annuitants 46 of their benefits and in the aggregate 653 of overall
annuity obligations After taking into account the participantsrsquo rights to the insurerrsquos assets (assuming a 60 funded ratio) the GA system would fully protect benefits for the same 81 of annuitants for the other 19 of participants 80 of their benefits and in the aggregate 86 of total annuity obligations
bull Comparison If funded ratios exceed 60 the GA system would protect a higher portion of the overall plan obligations but the PBGC system would give full protection to a higher percentage of participants Comparisons on a Headcount Basis and an Obligation Basis are reflected in the ldquoSalaried Planrdquo bar graphs The percentage numbers at the top of each bar in the ldquoHeadcount Basisrdquo graph identify the average protection received by those individuals who would not be fully protected
According to the PBGCrsquos most recent Data Book the average
funded ratio for failed pension plans for the 1990ndash2013
period was about 52
Consumer Protection Comparison The Federal Pension System and the State Insurance System | 31
THREE How the Systems Protect Benefits After Payer Insolvency
0
10000
20000
30000
40000
60000
50000
70000
Protection by Fully and Partially Protected Participant Groups
Insurer Plan Funded Ratio
Fully
Par
tially
Pro
tect
ed In
divi
dual
s
Salaried Plan mdash Headcount Basis
PBGC ndash Partially Protected (average)
PBGC ndash Fully Protected
GA ndash Partially Protected (average)
GA ndash Fully Protected
0
57 46
0
58 49
25
61 73
50
61 86
75
86 97
95
95 99
98 100
0
10
20
30
40
50
60
70
80
90
100
Aggregate Protection Level
Insurer Plan Funded Ratio
Aggr
egat
e Pr
otec
tion
Leve
l
Salaried Plan mdash Obligation Basis
PBGC GA
0 0 25 50 75 95 98 100
32 | National Organization of Life and Health Insurance Guaranty Associations
THREE How the Systems Protect Benefits After Payer Insolvency
Retiree Planbull PBGC system Without allocating any plan funding
(as if the planrsquos funded ratio were zero) the PBGC guaranty would protect all benefits for 98 of participants for the remaining 2 of participants 67 of their benefits and in the aggregate 951 of the planrsquos overall obligations After adding participant rights to plan assets (assuming a funded ratio of 95) the PBGC system would protect all benefits for the same 98 of partici-pants for the remaining 2 of participants 91 of their benefits and in the aggregate 987 of overall obligations
bull State guaranty system Before allocating any of the insolvent insurerrsquos assets (as if the insurerrsquos funded ratio were zero) the GA system would fully protect all benefits for 84 of the annuitants for the other 16 of annuitants 54 of their benefits and in the aggregate 733 of overall
annuity obligations After taking into account the participantsrsquo rights to the insurerrsquos assets (assuming a 95 funded ratio) the GA system would fully protect all benefits for the same 84 of annuitants for the other 16 of annuitants 98 of their benefits and in the aggregate 987 of the total annuity obligations
bull Comparison Unless funded ratios were at least 95 the PBGC system would protect a higher percentage of overall retiree obligations and at all funding levels under 100 the PBGC would provide full protection for a higher percentage of retired participants Comparisons on a Headcount Basis and an Obligation Basis are reflected in the ldquoRetiree Planrdquo bar graphs The percentage numbers at the top of each bar in the ldquoHeadcount Basisrdquo graph identify the average protection received by those individuals who would not be fully protected
The insurance receivership process operating as it does in
tandem with the guaranty system allows most individuals
to benefit from a substantially higher share of an insolvent
annuity issuerrsquos assets than would be available from the
assets of a failed pension plan
Consumer Protection Comparison The Federal Pension System and the State Insurance System | 33
THREE How the Systems Protect Benefits After Payer Insolvency
0
5000
10000
15000
20000
25000
Protection by Fully and Partially Protected Participant Groups
Insurer Plan Funded Ratio
Fully
Par
tially
Pro
tect
ed In
divi
dual
s
Retiree Plan mdash Headcount Basis
PBGC ndash Partially Protected (average)
PBGC ndash Fully Protected
GA ndash Partially Protected (average)
GA ndash Fully Protected
0
67 54
0
70 77
50
78 89
75
77 99
98
91 98
95 100
67 66
25
010
20
30
40
50
60
70
80
90
100
Aggregate Protection Level
Insurer Plan Funded Ratio
Aver
age
Prot
ectio
n Le
vel
Retiree Plan mdash Obligation Basis
PBGC GA
0 0 25 50 75 95 98 100
34 | National Organization of Life and Health Insurance Guaranty Associations
THREE How the Systems Protect Benefits After Payer Insolvency
Overall the Willis Towers Watson Study reached these general conclusions
bull Both systems provide high levels of protection mdashover 90 of promised benefitsmdashwhere the pension planrsquos and insurerrsquos funded ratios are at least 75
bull The majority of participants are protected at 100 by both systems
bull In both systems the amount of benefits lost is small in all but the lowest-funded scenarios
bull For lower funded ratios the PBGC generally provides a higher level of protection to partici-pants where pension plans have benefits that are below PBGC guaranty levels and have not had recent increases
bull The GA system generally provides a higher level of protection where pension plan benefits exceed the PBGC guaranty levels when recent plan amendments have increased benefit levels and when funded ratios are relatively high
bull The cross-over pointmdashwhere the GA system begins to provide a higher level of protection than the PBGC systemmdashdepends primarily on the proportion of benefits exceeding PBGC guaranty levels and the presence of recent plan amend-ments to increase benefit levels
The Willis Towers Watson quantitative comparison assumed that in each failure scenario the failed payerrsquos funded ratio (assets to liabilities) was the same for the pension plan as for the comparable annuity issuer Historical data however demon-strate first that failures of life insurers writing annuities are rare while pension plan failures are more common and second that in the relatively rare cases when insurance companies have failed their funded ratios have been materially higher on average than the funded ratios of failed pension plans NOLHGArsquos records reflect that between 1991 and 2015 and excluding the effects of the anomalous ELNY liquidation the average funded ratio for insolvencies of annuity issuers was about
76 when the effects of the ELNY liquidation are included the funded ratio for all annuity issuer insolvencies was about 71103 Under modern insurance company solvency monitoring and testing that has evolved since the mid-1990s and the prompt corrective action authority since given to insurance company regulators the funded ratio of a major annuity issuer that might fail can reasonably be expected to be significantly higher than the historical average funded ratio of failed annuity issuers104 Since that regulatory change in fact no active issuer of annuity contracts has failed
By contrast according to the PBGCrsquos most recent Data Book the average funded ratio for failed pension plans for the 1990ndash2013 period was about 52105 The funded ratio is particularly important with a failed annuity issuer because annuitantsrsquo benefits in excess of state guaranty levels are allocated a significant share of the insurerrsquos remaining assets For that reason a more realistic comparison emerges by contrasting how individ-uals would fare at (i) the funded ratios typical of failed pension plans with (ii) the higher funded ratios typical of failed insurers or the even higher funded ratio that reasonably could be expected in the unlikely event of the insolvency of one of the countryrsquos largest annuity issuers (the type of insurer that pension fiduciaries typically select for de-risking transactions)
The following graphs and tables provide that comparison for the hourly salaried and retiree populations in the Willis Towers Watson Study for hypothesized pension plan failures at the 50 funded ratio compared to insurer failures at both the 75 and the 95 funded ratio levels For each plan the bar graph reflects the percentage of total payment obligations protected in the three scenarios Immediately following each bar graph is a table that shows for the same group the levels of protection provided to all individuals in that group
Consumer Protection Comparison The Federal Pension System and the State Insurance System | 35
THREE How the Systems Protect Benefits After Payer Insolvency
Protection ratios PBGC with 50 plan GA with 75 insurer GA with 95 insurer experienced by funded ratiomdashindividuals funded ratiomdash funded ratiomdash individuals by protection range individuals by individuals by protection range protection range
lt20
20-40
40-60 2
60-80 4
80-90 22 72
90-95 533 247
95-98 1190 240 72
98-100 1134 172 659
100 31152 33306 33306
Total 34037 34037 34037
Hourly Plan
0
10
30
50
70
90
20
40
60
80
100
of Total Obligation ProtectedHourly Plan
995 992 999
PBGC Protection with 50 Plan Funded Ratio
GA Protection with 75 Insurer Funded Ratio
GA Protection with 95 Insurer Funded Ratio
0 50 75 95
36 | National Organization of Life and Health Insurance Guaranty Associations
THREE How the Systems Protect Benefits After Payer Insolvency
Protection ratios PBGC with 50 plan GA with 75 insurer GA with 95 insurer experienced by funded ratiomdashindividuals funded ratiomdash funded ratiomdash individuals by protection range individuals by individuals by protection range protection range
lt20
20-40 656
40-60 991
60-80 1280 749
80-90 868 5445
90-95 445 3125
95-98 240 1697 6194
98-100 167 1156 5978
100 60210 52685 52685
Total 64857 64857 64857
Salaried Plan
0
10
30
50
70
90
20
40
60
80
100
of Total Obligation ProtectedSalaried Plan
863913
993
0 50 75 95
PBGC Protection with 50 Plan Funded Ratio
GA Protection with 75 Insurer Funded Ratio
GA Protection with 95 Insurer Funded Ratio
Consumer Protection Comparison The Federal Pension System and the State Insurance System | 37
THREE How the Systems Protect Benefits After Payer Insolvency
0
10
30
50
70
90
20
40
60
80
100
of Total Obligation ProtectedRetiree Plan
955 933995
0 50 75 95
PBGC Protection with 50 Plan Funded Ratio
GA Protection with 75 Insurer Funded Ratio
GA Protection with 95 Insurer Funded Ratio
Protection ratios PBGC with 50 plan GA with 75 insurer GA with 95 insurer experienced by funded ratiomdashindividuals funded ratiomdash funded ratiomdash individuals by protection range individuals by individuals by protection range protection range
lt20
20-40 7
40-60 111
60-80 144 76
80-90 83 1361
90-95 34 1034
95-98 26 646 1437
98-100 16 429 2109
100 22204 19079 19079
Total 22625 22625 22625
Retiree Plan
As shown by the above graphs and tables in the failure scenarios consistent with what one reasonably could expect the insurer protection regime would tend to protect the total promised annuity benefit obligations on par with or better than the protections afforded by the pension system for promised pension benefits On an individual basis the vast majority of participants and policy holders would be fully protected under both systems and a minority would experience reductionsmdashsome with better protection under the PBGC system and some with better protection under the insurance system
38 | National Organization of Life and Health Insurance Guaranty Associations
CONCLUSION
Both the federal pension protection system and the state insurance protection system
have been in place for many decades have long interacted with each other and have devel-oped multi-layered and complex structures and processes to protect consumers In their objectives and design the protective systems have similarities but some of their general approaches and many of their specific tech-niques differ in significant ways In practice both systems provide strong protections for their consumers
At the first level of protection both systems employ regulatory techniques to help assure that the private benefit payersmdashwhether private pension plans or private annuity issuersmdashstay healthy and have sufficient assets to pay prom-ised benefits as they become due In general insurance regulators impose more rigorous financial controls on the approximately 460 life insurance companies that issue annuities than the ERISA system employs to police the financial health of about 22000 pension plans In addition the pension system has a significant protection gap not shared by the insurance system ERISA provides no authority to regulate the financial health of the employers that sponsor pension plans and remain ultimately responsible for their funding
Actual failure experience has reflected the system differences In the aftermath of the 2008 financial crisis no operating annuity issuers with an active book of annuities failed and only a single former annuity issuermdashExecutive Life Insurance Company of New York which had been in receivership since 1991mdashwas placed into liqui-dation106 By comparison 931 single-employer pension plans failed during that period affecting over 560000 pension plan participants
If a pension plan or insurance company fails financially both the federal pension system and the state insurance system provide strong benefit protections for individual plan participants and annuity payees The two systems differ in enough significant respects to make direct comparisons difficult but both systems cover the vast majority of all benefit claims in the event of payer insol-vency For the relatively small minority of covered individuals not fully protected and depending on the specific facts of a particular financial failure each system can provide slightly better benefits than the other in specific individual cases The Appendix that follows illustrates those outcomes for some specific individual examples drawn from the sample Hourly Salaried and Retiree Plans that Willis Towers Watson analyzed in its study
Conclusion
Consumer Protection Comparison The Federal Pension System and the State Insurance System | A-1
APPENDIX Individual Protection Examples
The case examples in this Appendix are drawn from the sample populations for the Hourly Salaried and Retiree Plans that Willis Towers Watson analyzed in its study As these examples
demonstrate patterns of individual protection under the pension and insurance safety nets vary considerably depending upon many factual variables including the age and benefit amounts of the individual and other covered individuals the planrsquos and insurerrsquos funded ratios and the allocation of plan obligations and assets among the PBGC priority categoriesA1
PLAN-LEVEL ASSUMPTIONSThe comparisons contained in this Appendix of the protections provided to certain individuals assume that the counterpart pension plan and annuity issuer failed with equal funding ratios that the GA coverage level is $250000 per person that the pension plans have not had recent benefit increases and that the respective pension plans have benefit obligations that fall into PBGC priority categories as follows
PC 3 PC 4 PC 5Hourly Plan 65 34 1Salaried Plan 40 46 14Retiree Plan 96 3 1
Given that spread of benefit obligations among the PBGC priority categories each pension planrsquos assets are allocated among the PBGC priority categories in proportions that depend on the pension planrsquos funded ratio as described on the following table
Hourly Plan
Assumed Percentage of Entire Planrsquos Priority Category Obligation Covered by Assets
Plan Funded Ratio 0 25 50 75 95 98 100
Priority Categories
PC 3 0 38 77 100 100 100 100
PC 4 0 0 0 29 88 97 100
PC 5 0 0 0 0 0 0 100
AppendixINDIVIDUAL PROTECTION EXAMPLES
A1 Federal pension priority categories shown with a ldquoPCrdquo designation in these examples are described in the report to which this Appendix is attached at note 90 and the accompanying text
A-2 | National Organization of Life and Health Insurance Guaranty Associations
APPENDIX Individual Protection Examples
Salaried Plan
Assumed Percentage of Entire Planrsquos Priority Category Obligation Covered by Assets
Plan Funded Ratio 0 25 50 75 95 98 100
Priority Categories
PC 3 0 63 100 100 100 100 100
PC 4 0 0 23 77 100 100 100
PC 5 0 0 0 0 65 86 100
Retiree Plan
Assumed Percentage of Entire Planrsquos Priority Category Obligation Covered by Assets
Plan Funded Ratio 0 25 50 75 95 98 100
Priority Categories
PC 3 0 26 52 78 99 100 100
PC 4 0 0 0 0 0 67 100
PC 5 0 0 0 0 0 0 100
AN EXAMPLE IN DETAILAs an initial detailed example (one of the nine examples summarized below) consider a single indi-vidual at age 60 who is eligible for a single life monthly benefit of $7549 when a failure occurs For purposes of determining the level of benefits protected under the federal pension system assume that the individual could have retired under the Salaried Plan and started receiving a $5557 monthly pension benefit under the planrsquos terms three years before the failure (when the individual was 57) That individualrsquos ultimate level of protection would vary under both systems depending on the pension planrsquos or insurerrsquos funded ratio and in the PBGC system also depending on how the individ-ualrsquos benefit falls into the six priority categoriesmdashprincipally PC 3 PC 4 and PC 5
In this example under the PBGC system the monthly amount protected by the PBGC guaranty itself (without taking plan assets into account) would be $3213 But if the pension planrsquos assets were suffi-cient to pay all plan obligations in priority categories through PC 3 this individualrsquos monthly benefit protection would be $5557mdashall due to the planrsquos remaining assets Based on the sample population used by Willis Towers Watson and the allocation of plan assets among priority categories at various plan funded ratios this individual would have the following levels of ultimate benefit protection
Consumer Protection Comparison The Federal Pension System and the State Insurance System | A-3
APPENDIX Individual Protection Examples
Final Pension Benefit Protection Determination
Plan Funded Ratio 0 25 50 75 95 98 100
A Benefit Guaranteed 3213 3213 3213 3213 3213 3213 3213 by PBGC
B Benefit Covered by Plan Assets
PC 3 - 3501 5557 5557 5557 5557 5557
PC 4 - - - - - - -
PC 5 - - - - 1295 1713 1992
Total Protection from Plan Assets - 3501 5557 5557 6852 7270 7549
Final Protected (Greater of 3213 3501 5557 5557 6852 7270 7549 A or B)
Note that under the pension system the individual is protected at the greater of either (A) the PBGC guaranteed benefit level or (B) the benefits supported by the participantrsquos share of the failed pension planrsquos assets (determined by priority categories)mdashbut not both Since a monthly benefit of $5557 falls in PC 3 (the monthly pension benefits the individual could have received three years before the pension plan failure) this individualrsquos protection would be determined by the pension planrsquos assets not the PBGC guaranty at funded ratios near 25 and above And this individual would not receive additional protection unless the pension planrsquos funded ratio reached about 85 well above the historical 52 average funded ratio for failed pension plans
A-4 | National Organization of Life and Health Insurance Guaranty Associations
APPENDIX Individual Protection Examples
The following table illustrates how the same individual receiving the same $7549 single life benefit under an annuity would fare if the insurer failed at various funded ratios
Final Annuity Benefit Protection Determination
Insurer Funded Ratio 0 25 50 75 95 98 100
A Benefit Guaranteed 1434 1434 1434 1434 1434 1434 1434 by GA
B Benefit Covered by - 1529 3057 4586 5809 5992 6115 Insurer Assets
Final Protected (A + B) 1434 2963 4491 6020 7243 7426 7549
As the table illustrates under the insurance system the individualrsquos protection is the sum of both (A) the GA coverage level and (B) the insurerrsquos remaining assets allocated to the benefits in excess of the GA coverage level (which are allocated proportionately among all annuity benefits) So for benefits in excess of GA coverage levels the ultimate protection increases proportionately as the failed insurerrsquos funded ratio increases At a funded ratio of 75 which historically has been more typical for failed life insurers this individual would receive higher protection under the state insurance system ($6020 monthly) than under the federal pension system ($5557 monthly) In fact insurance system protec-tion for this individual would overtake and remain higher than pension system protection at funded ratios of more than 674
The following graph demonstrates for this example each systemrsquos change in protected benefits at the various funded ratios The insurance system protection (shown by the blue line) grows ratably with the funded ratio By contrast the growth in pension system protection (shown by the red line) is interrupted by a plateau caused by the allocation of pension plan assets among priority categories
$0
$1000
$3000
$6000
$7000
$2000
0 10 50
Plan Issuer Funded Ratio ()
Individual Protection Comparison Example
Ben
efit
Prot
ectio
n Am
ount
30 70 9020
230
PC3 PC4 PC5
6742 7549
5557
PBGC Guarantee Limit at Age 60
GA Protection
Pension Protection
6040 80 98
$5000
$4000
$8000
Consumer Protection Comparison The Federal Pension System and the State Insurance System | A-5
APPENDIX Individual Protection Examples
SUMMARY OF ALL EXAMPLESThe following examples (which include the example described in detail above) involve three individuals having different ages and benefit amounts (expressed as the monthly amount of a single-life annuity) and they analyze each individualrsquos comparative protections as if the individual were covered under the Hourly Plan the Salaried Plan or the Retiree Plan In some examples the assumed benefit amounts may be more realistic for some plans than for others but they are used across all three plans to illustrate how the safety nets operate
The insurance systemrsquos safety net gives all annuity holders an equal-priority claim against the insurerrsquos remaining assets so while an individualrsquos protection increases ratably with the insurerrsquos funded ratio it follows the same pattern in the Hourly Plan the Salaried Plan and the Retiree Plan By contrast the pension safety net assigns differing priorities among participantsrsquo claims to plan assets For that reason an individualrsquos protection under the pension systemrsquos safety net can vary considerably from plan to plan depending on the planrsquos overall allocation of benefit obligations and plan assets among the priority categories
INDIVIDUAL 1Age = 60 Monthly benefit amount = $7549 PBGC maximum guaranty = $3213
For this individual (discussed above in more detail with respect to the Salaried Plan) whose benefit exceeds the PBGC guaranteed amount and some of which falls into PC 3 the insurance system protection begins below the pension system protection at zero funded ratios but overtakes pension system protection at relatively low funded ratios The precise cross-over point varies by the planmdashunder a 50 funded ratio for the Hourly Plan and the Retiree Plan (both of which have relatively high concentrations of PC 3 benefits) and slightly under a 75 funded ratio for the Salaried Plan
Individual 1mdashInsurance SystemmdashAll Plans Final Annuity Benefit Protection Determination
Insurer Funded Ratio 0 25 50 75 95 98 100
A Benefit Guaranteed 1434 1434 1434 1434 1434 1434 1434 by GA
B Benefit Covered - 1529 3057 4586 5809 5992 6115 by Insurer Assets
Final Protected 1434 2963 4491 6020 7243 7426 7549 (A + B)
A-6 | National Organization of Life and Health Insurance Guaranty Associations
APPENDIX Individual Protection Examples
Individual 1-HmdashPBGC SystemmdashHourly Plan Final Pension Benefit Protection Determination
Insurer Funded Ratio 0 25 50 75 95 98 100
A Benefit Guaranteed 3213 3213 3213 3213 3213 3213 3213 by PBGC
B Benefit Covered by Plan Assets
PC 3 2112 4279 5557 5557 5557 5557
PC 4 - - - - - - -
PC 5 - - - - - - 1992
Total Protection - 2112 4279 5557 5557 5557 7549 from Plan Assets
Final Protected 3213 3213 4279 5557 5557 5557 7549 (Greater of A or B)
Protected by 1434 2963 4491 6020 7243 7426 7549 Insurance System
Individual 1-SmdashPBGC SystemmdashSalaried Plan Final Pension Benefit Protection Determination
Plan Funded Ratio 0 25 50 75 95 98 100
A Benefit Guaranteed 3213 3213 3213 3213 3213 3213 3213 by PBGC
B Benefit Covered by Plan Assets
PC 3 3501 5557 5557 5557 5557 5557
PC 4 - - - - - - -
PC 5 - - - - 1295 1713 1992
Total Protection - 3501 5557 5557 6852 7270 7549 from Plan Assets
Final Protected 3213 3501 5557 5557 6852 7270 7549 (Greater of A or B)
Protected by 1434 2963 4491 6020 7243 7426 7549 Insurance System
Consumer Protection Comparison The Federal Pension System and the State Insurance System | A-7
APPENDIX Individual Protection Examples
Individual 1-RmdashPBGC SystemmdashRetiree Plan Final Pension Benefit Protection Determination
Plan Funded Ratio 0 25 50 75 95 98 100
A Benefit Guaranteed 3213 3213 3213 3213 3213 3213 3213 by PBGC
B Benefit Covered by Plan Assets
PC 3 1445 2890 4334 5501 5557 5557
PC 4 - - - - - - -
PC 5 - - - - - - 1992
Total Protection - 1445 2890 4334 5501 5557 7549 from Plan Assets
Final Protected 3213 3213 3213 4334 5501 5557 7549 (Greater of A or B)
Protected by 1434 2963 4491 6020 7243 7426 7549 Insurance System
INDIVIDUAL 2Age = 56 Monthly benefit amount = $4784 PBGC maximum guaranty = $2422
This slightly younger individual has a benefit that exceeds the PBGC guaranteed amount and none of that benefit falls within PC 3 Under the pension safety net the individual receives only the PBGC guaranteed amount without additional protection from plan assets until the planrsquos funded ratio reaches very high levelsmdashabove 98 for the Hourly and Retiree Plans (which have high PC 3 concen-trations) and well above 75 for the Salaried Plan (with lower PC 3 concentrations) The insurance safety netrsquos protection overtakes the pension safety netrsquos protection at relatively low funded ratios well below 50 in all three plans
A-8 | National Organization of Life and Health Insurance Guaranty Associations
APPENDIX Individual Protection Examples
Individual 2mdashInsurance SystemmdashAll Plans Final Annuity Benefit Protection Determination
Insurer Funded Ratio 0 25 50 75 95 98 100
A Benefit Guaranteed 1323 1323 1323 1323 1323 1323 1323 by SGA
B Benefit Covered - 865 1731 2596 3288 3392 3461 by Insurer Assets
Final Protected 1323 2188 3054 3919 4611 4715 4784 (A + B)
Individual 2-HmdashPBGC SystemmdashHourly Plan Final Pension Benefit Protection Determination
Insurer Funded Ratio 0 25 50 75 95 98 100
A Benefit Guaranteed 2422 2422 2422 2422 2422 2422 2422 by PBGC
B Benefit Covered by Plan Assets
PC 3 - - - - - - -
PC 4 - - - 702 2131 2349 2422
PC 5 - - - - - - 2362
Total Protection - 0 0 702 2131 2349 4784 from Plan Assets
Final Protected 2422 2422 2422 2422 2422 2422 4784 (Greater of A or B)
Protected by 1323 2188 3054 3919 4611 4715 4784 Insurance System
Consumer Protection Comparison The Federal Pension System and the State Insurance System | A-9
APPENDIX Individual Protection Examples
Individual 2-SmdashPBGC SystemmdashSalaried Plan Final Pension Benefit Protection Determination
Insurer Funded Ratio 0 25 50 75 95 98 100
A Benefit Guaranteed 2422 2422 2422 2422 2422 2422 2422 by PBGC
B Benefit Covered by Plan Assets
PC 3 - - - - - - -
PC 4 - - 533 1841 2422 2422 2422
PC 5 - - - - 1512 2031 2362
Total Protection - 0 533 1841 3934 4453 4784 from Plan Assets
Final Protected 2422 2422 2422 2422 3934 4453 4784 (Greater of A or B)
Protected by 1323 2188 3054 3919 4611 4715 4784 Insurance System
Individual 2-RmdashPBGC SystemmdashRetiree Plan Final Pension Benefit Protection Determination
Insurer Funded Ratio 0 25 50 75 95 98 100
A Benefit Guaranteed 2422 2422 2422 2422 2422 2422 2422 by PBGC
B Benefit Covered by Plan Assets
PC 3 - - - - - - -
PC 4 - - - - - 1623 2422
PC 5 - - - - - - 2362
Total Protection - 0 0 0 0 1623 4784 from Plan Assets
Final Protected 2422 2422 2422 2422 2422 2422 4784 (Greater of A or B)
Protected by 1323 2188 3054 3919 4611 4715 4784 Insurance System
A-10 | National Organization of Life and Health Insurance Guaranty Associations
APPENDIX Individual Protection Examples
INDIVIDUAL 3Age = 72 Monthly benefit amount = $7896 PBGC maximum guaranty = $10944
This older individual with a benefit lower than the PBGC maximum has full protection under the PBGC system under plans at all funded ratios The insurance safety net provides high levels of protection at high funded ratios but does not reach full protection so long as the funded ratios are under 100
Individual 3mdashInsurance SystemmdashAll Plans Final Annuity Benefit Protection Determination
Insurer Funded Ratio 0 25 50 75 95 98 100
A Benefit Guaranteed 2033 2033 2033 2033 2033 2033 2033 by SGA
B Benefit Covered - 1466 2932 4397 5570 5746 5863 by Insurer Assets
Final Protected 2033 3499 4965 6430 7603 7779 7896 (A + B)
Individual 3mdashPBGC SystemmdashAll Plans Final Pension Benefit Protection Determination
Insurer Funded Ratio 0 25 50 75 95 98 100
A Benefit Guaranteed 7896 7896 7896 7896 7896 7896 7896 by PBGC
B Benefit Covered na na na na na na na by Plan Assets
Final Protected 7896 7896 7896 7896 7896 7896 7896 (Greater of A or B)
At different funded ratios plan assets would be allocated differently among PBGC priority categories but in this example the PBGC guaranteed amount would always determine the protection amount
Consumer Protection Comparison The Federal Pension System and the State Insurance System | B-1
End Notes
1 In fact plans typically pay more to purchase annuity contracts than the liability value previously recognized for plan funding purposes and employer financial statements According to testi-mony before the ERISA Advisory Council in 2013 ldquogenerally annuities are 5 to 15 higher than the value of the same pension promises under the planrdquo Private Sector Pension De-Risking and Participant Protections Advisory Council on Employee Welfare and Pension Benefit Plans [hereinafter ERISA Advisory Council Report] page 15 (November 2013) available at httpwwwdolgovebsapdf2013ACreport2pdf In one of the largest annuity-purchase transactions for example the Verizon plan paid the insurer a total of $84 billion $1 billion more than the amount of the transferred liabilities previously recognized by the Verizon plan Lee v Verizon Commcrsquons Inc 2014 WL 1407416 (ND Tex Apr 11 2014) affirmed per curiam 623 Fed Appx 132 60 EBC 1309 (5th Cir 2015) cert granted vacated and remanded 578 US ___ --- SCt ---- 2016 WL 2945235 (Mem) 84 USLW 3354 (May 23 2016) (vacated and remanded only on standing of those participants remaining in the Verizon plan to bring a claim) More recently changing mortality assumptions have generally been causing employers to recognize increased pension liability bringing annuity purchase costs on average to approximately a 5 premium over the employerrsquos pension liability Mercer Pension Buyout Index available at httpwwwmercerusour-thinkingmercer-us-pension-buyout-indexhtml
2 In mid-2015 the Internal Revenue Service announced regulation changes that prospectively prohibit pension plans from offering lump-sum payments to participants who are already receiving annuity payments IRS Notice 2015-49 (July 9 2015)
3 This report does not analyze the detailed procedures advantages and disadvantages of de-risking through lump-sum window programs it focuses instead on de-risking through annuity-pur-chase transactions
4 In his 2013 testimony before the ERISA Advisory Council then-PBGC Director Gotbaum ldquostated that he did not think that a defined benefit plan with a PBGC guarantee was necessarily safer than an insurance company annuity backed by a state insurance guaranty associationrdquo ERISA Advisory Council Report p 12
5 In addition plan participants also receive different types of ldquoconduct of businessrdquo protections under both systems Under ERISA plan participants rely significantly on the right to hold plan administrators and other fiduciaries accountable under fiduciary conduct standards Payees and beneficiaries of annuities are protected both through contractual rights and by an extensive system of conduct-of-business regulation by state insurance commissioners acting both inde-pendently and through the National Association of Insurance Commissioners
End Notes
B-2 | National Organization of Life and Health Insurance Guaranty Associations
End Notes
6 When this report refers to a ldquopension planrdquo without further description it is referring to a defined benefit pension plan sponsored by a single employer (and its controlled group affiliates) in the private sector Unless otherwise noted it is not referring to multiemployer plans (often called Taft-Hartley plans) to defined contribution retirement plans or to plans sponsored by govern-mental entities
7 ERISA sect206(g) 29 USC sect1056(g) For a discussion of the popularity of and problems with using 80 as a general indicator of adequate pension funding see American Academy of Actuaries Issue Brief July 2012 available at httpswwwactuaryorgfiles80_Percent_Funding_IB_071912pdf
8 See infra notes 103 and 105 and accompanying text see also discussions in Part THREE under ldquoActual Pension Benefit Loss Experiencerdquo and ldquoActual Insurance Benefit Loss Experiencerdquo The technical terms applicable to pension plans under federal law and to insurance companies under state insurance law are different For ease of comparison this paper uses the generic terms ldquofailedrdquo or ldquofailurerdquo to mean (1) for pension plans the planrsquos ldquodistress terminationrdquo or ldquoinvoluntary terminationrdquo resulting in the Pension Benefit Guaranty Corporationrsquos takeover of the pension plan and (2) for insurance companies the entry of a court order of liquidation against the insurer with a finding of insolvency thereby triggering the state guaranty associations When this report refers to a ldquofunded ratiordquo without further description it is referring to the ratio of the market value of an insolvent entityrsquos remaining assets to the present value of the entityrsquos current and future liabilities to plan participants or annuity payees as the case may be Those values depend on assumptions that often differ from one context and purpose to another but a detailed examination of those differences is beyond the scope of this report For further discussion of typical sources and levels of funding in life insurer insolvencies and historical outcomes for contract owners and payees see infra at Part THREE under ldquoActual Insurance Benefit Loss Experiencerdquo
9 The Pension Benefit Guaranty Corporation was created ldquowithin the Department of Labor as a body corporaterdquo and given ldquothe powers conferred on a nonprofit corporationrdquo under District of Columbia law ERISA sect1302 29 USC sect4002 The United States ldquois not liable for any obligation or liability of the [PBGC]rdquo ERISA sect1302(g)(2) 29 USC sect4002(g)(2) The lack of financial backing from the United States is highlighted by the PBGC in its annual reports See eg Public Benefit Guaranty Corporation Annual Report for Fiscal Year 2015 51(Nov 16 2015) httpwwwpbgcgovdocuments2015-annual-reportpdf (ldquoERISA requires that PBGC programs be self-financing ERISA provides that the US Government is not liable for any obligation or liability incurred by PBGCrdquo) [hereinafter PBGC 2015 Annual Report]
Consumer Protection Comparison The Federal Pension System and the State Insurance System | B-3
End Notes
10 The District of Columbia Puerto Rico and all states in the United States have enacted statutes substantially similar to a Model Law promulgated by the National Association of Insurance Commissioners Each such statute creates for that jurisdiction a guaranty association that protects annuitants and insureds under annuities and life insurance policies See National Association of Insurance Commissioners Model Laws Regulations and Guidelines Vol III Life and Health Insurance Guaranty Association Model Act 520-1 (2009) httpwwwnaicorgstorefreeMDL-520pdf [hereinafter Model GA Act] The state guaranty associations are generally ldquononprofit legal entit[ies]rdquo See id at sect6 All licensed life insurance companies are required to be members of each state guaranty association and the guaranty association is authorized to assess all member insurers to obtain the funds it needs to protect annuitants and insureds See id at sectsect6 9 Each guaranty association is also entitled to assets from each insolvent insurer allocable to the annuity and insurance obligations the guaranty association protects See id at sectsect8K amp 14C
11 Willis Towers Watson has authorized NOLHGA to reference its analysis and results in this report and in presentations to or discussions with third parties provided that NOLHGA specifically discloses that Willis Towers Watson performed its analysis using a specific set of methods and assumptions that the analysis and conclusions are based strictly on and are subject to the data methods and assumptions stated that the results of that analysis may not be applicable to other situations and that any changes in the methods assumptions or data used could materially change the conclusions Willis Towers Watson Analysis of Plan Participant Protections Provided by the Pension Benefit Guaranty Corporation (PBGC) and Insured Annuitant Protections Available via State Insurer Receiverships and State Guaranty Associations (SGA) (2016) [hereinafter Willis Towers Watson Study]
12 Patrick W Seburn Evolution of Employer-Provided Defined Benefit Pensions United States Deprsquot of Labor Monthly Labor Review (December 1991) httpwwwblsgovmlr199112art3fullpdf [hereinafter Seburn Article]
13 ERISA Pub L No 93-406 88 Stat 829 (September 2 1974)
14 ERISA sect2 29 USC sect1001
15 The Department of Labor has primary regulatory authority over Title I of ERISA ldquoProtection of Employee Benefit Rightsrdquo ERISA sectsect2 et seq 29 USC sectsect1001 et seq The Treasury Department has primary regulatory authority over Title II of ERISA which amended the Internal Revenue Code The Pension Benefit Guaranty Corporation has primary regulatory authority over Title IV of ERISA ldquoPlan Termination Insurancerdquo ERISA sectsect4001 et seq 29 USC sectsect1301 et seq
16 ERISA sect4041 29 USC sect1341
17 Pension Benefit Guaranty Corporation Pension Insurance Data Pension Insurance Data Tables 2013 Tables S-30 (Insured Plan Participants) S-31 (Insured Plans) S-33 (Workforce Percentage) (2013) httpwwwpbgcgovpracdata-bookshtml PBGC 2015 Annual Report
18 ERISA sect514(a) (b)(2)(A) 29 USC sect1144(a) (b)(2)(A) (stating that ERISA does not ldquoexempt or relieve any Person from any law of any State which regulates insurancerdquo)
B-4 | National Organization of Life and Health Insurance Guaranty Associations
End Notes
19 ERISA sect4002(d) 29 USC sect1302(d)
20 ERISA sect4005 29 USC sect1305
21 Public Benefit Guaranty Corporation Premium Rates (2015) httpwwwpbgcgovpracprempremium-rateshtml
22 ERISA sect4002(g)(2) 29 USC sect1302(g)(2)
23 Public Benefit Guaranty Corporation 2013 Projections Report FAQs (June 30 2014) httpwwwpbgcgovaboutprojections-reportprojections-report-faqhtml See also Public Benefit Guaranty Corporation New PBGC Projections Solvency of Multiemployer Program Fund Extended Three Years Condition of Single-Employer Program Continues to Improve (September 28 2015) (projecting some improvement but still projected to run out of funds 2025) httpwwwpbgcgovnewspressreleasespr15-09htmlCID=COLA01ACSEP2820151ampsource=govdeliveryamputm_medium=emailamputm_source=govdelivery
24 Division O of the Consolidated and Further Continuing Appropriations Act of 2015 Pub L No 113-235 128 Stat 2130 (December 16 2014)
25 PBGC 2015 Annual Report supra note 9 at 3 25
26 Public Benefit Guaranty Corporation Annual Report for Fiscal Year 2008 2 9 (Nov 13 2008) httpswwwpbgcgovdocs2008_annual_reportpdf
27 National Association of Insurance Commissioners State Insurance Regulation History Purpose and Structure httpwwwnaicorgdocumentsconsumer_state_reg_briefpdf
28 United States v South-Eastern Underwriters Assrsquon 322 US 533 (1944) Congress responded with the McCarran Ferguson Act 15 USC sectsect1011-15 (2012)
29 US Dept of Treasury v Fabe 508 US 491 (1993)
30 See supra note 27
31 FAWG is a Working Group of the NAIC Financial Condition (E) Committee Information about FAWGrsquos charges can be found at httpwwwnaicorgcommittees_e_fawghtm FAWGrsquos primary charge is to ldquo[a]nalyze nationally significant insurers and groups that exhibit characteristics of trending toward or being financially troubled [and] determine if appropriate action is being takenrdquo
32 US domestic insurance companies are not eligible for federal bankruptcy protection 11 USC sect109(b) (d) Insurance companies that become financially impaired or insolvent are subject exclusively to the insurance company conservation rehabilitation and liquidation statutes of the state where the insurance company is domiciled
Consumer Protection Comparison The Federal Pension System and the State Insurance System | B-5
End Notes
33 See Model GA Act supra note 10 at 520-45 (noting that NAIC first adopted the model act in 1971)
34 Peter G Gallanis Policyholder Protection in the Wake of the Financial Crisis in Modernizing Insurance Regulation (John H Biggs amp Matthew P Richardson ed 2014) [hereinafter Gallanis Chapter]
35 National Association of Insurance Commissioners Receivership and Insolvency (E) Task Force Communication and Coordination Among Regulators Receivers and Guaranty Associations An Approach to a National State Based System (2004) httpwwwnaicorgstorefreeCAC-OPpdf
36 Gallanis Chapter supra note 34 at 217
37 See supra note 10
38 In addition to the assessments and estate assets the GAs also assume the right to receive all premiums under covered policies due from insureds after the order of liquidation and they are authorized to continue reinsurance contracts the insolvent insurer had in place and to receive purchase proceeds (commonly referred to as ldquoceding commissionsrdquo) for any books of covered policies the GAs sell to a solvent assuming insurer
39 See supra note 10 and accompanying text
40 See eg the insolvencies of the following companies Mutual Benefit Life Insurance Company information available at httpswwwnolhgacomcompaniespublicmaincfmNAICCode=66362 Confederation Life Insurance Company information available at httpswwwnolhgacomcompaniespublicmaincfmNAICCode=80667 London Pacific Life amp Annuity Company information available at httpwwwnolhgacomcompaniespublicmaincfmNAICCode=68934 and Kentucky Central Life Insurance Company information available at httpwwwnolhgacomcompaniespublicmaincfmNAICCode=65188
41 James M Poterba The History of Annuities in the United States National Bureau of Economic Research (April 1997) httpwwwnberorgpapersw6001pdf Seburn Article
42 ERISA sect514(b)(2) 29 USC sect1144(b)(2)
43 ERISA sect403(b) 29 USC sect1103(b) John Hancock Mutual Life Insurance Co v Harris Trust amp Savings Bank 510 US 86 (1993)
44 See 29 CFR sectsect2520103-8(a) 2520104-21
45 29 CFR sect25103-3(d)(2)(ii)
46 Field Assistance Bulletin No 2015-02 3 (Deprsquot of Labor July 13 2015) httpwwwdolgovebsapdffab2015-2pdf See also Safe Harbor Rule 29 CFR sect2550404a-4 (providing a safe harbor for individual account plans for satisfying ERISA fiduciary duties in certain transactions) Deprsquot of Labor and Deprsquot of Treasury Joint Request for Information 75 Fed Reg 5253 (Feb 2 2010) (requesting information related to a joint review of ERISA and plan qualification tax rules)
B-6 | National Organization of Life and Health Insurance Guaranty Associations
End Notes
47 ERISA sect4041(b)(3)(A)(i) 29 USC sect1341(b)(3)(A)(i)
48 29 CFR sect 25103-3(d)(2)(ii)
49 29 CFR sect250995-1(c)(5) (Interpretive bulletin clarifying the fiduciary standards under ERISA when selecting an annuity provider for a defined benefit plan)
50 Although obvious it is still important to note that prevention of insolvencies also minimizes the social costs of invoking the safety net mechanisms which like all public goods have direct and indirect social costs
51 ERISA sect403(a) 29 USC sect1103(a) ERISA sect404 29 USC sect1104 ERISA sect4044(d) 29 USC sect1344(d)
52 Affiliates that are members of the plan sponsorrsquos ldquocontrolled grouprdquo are jointly and severally liable ERISA sect4001(a)(14) 29 USC sect1301(a)(14) ERISA sect4062(b) 29 USC sect1362(b)
53 ERISA sect302 29 USC sect1082 ERISA sect4041(b) 29 USC sect1341(b)
54 A detailed description of stochastic testing which may be required for insurance companies but not for pension plans is beyond the scope of this report In short to evaluate assets held to meet future payment obligations stochastic testing compares a wide range of assumptionsmdashwhich may include varying interest rates investment returns default rates and other factorsmdashwith long-term mortality-adjusted payment obligations to project multiple future cash flow scenarios to determine the probability that the invested assets will be adequate to meet the payment obligations The deterministic method for evaluating whether a plan (or an insurance company) is financially sound utilizes a single set of assumptions at a point in time While either approach ultimately depends on the reasonableness of the underlying assumptions the deterministic method may not be as rigorous or as robust as stochastic testing for evaluating the financial ability of either a plan or an insurance company to meet its future benefit payment obligations Moreover insurance companies are required to assess reserve adequacy using moderately adverse assumptions
55 Although the PBGC invests approximately 70 of its assets in fixed-income securities federal law requires that the PBGC report its returns as compared against an ldquoERISA Benchmarkrdquomdasha hypothetical portfolio ldquoused as a benchmark for a typical pension plan rather than an insurerrdquo with a 60 equity allocation PBGC 2015 Annual Report supra note 9 at 11 44
56 See generally Society of Actuaries Pension Risk Transfer Evaluating Impact and Barriers for De-Risking Strategies (2014) httpswwwsoaorgResearchResearch-ProjectsFinance-InvestmentPension-Risk-Transferaspx
57 ERISA sect206(g) 29 USC sect1056(g)
58 See ERISA sect404 29 USC sect1104
Consumer Protection Comparison The Federal Pension System and the State Insurance System | B-7
End Notes
59 See generally ERISA Title I Subtitle B Part 1 29 USC sect1021 et seq
60 ERISA sect501 29 USC sect1131 ERISA sect502 29 USC sect1132
61 See generally ERISA Title IV Subtitles A and C 29 USC sectsect1301 et seq 1341 et seq
62 ERISA sect4041 29 USC sect1341
63 4010 Summary Report Attachment to Letter from Joshua Gotbaum Director Pension Benefit Guaranty Corporation to Senator Tom Harkin Chairman Senate Committee on Health Education Labor and Pensions (August 21 2012) available at httpwwwpbgcgovdocumentsPBGC-4010-report-harkinpdf
64 Public Benefit Guaranty Corporation Annual Report 2009 3 (Nov 12 2009) httpswwwpbgcgovdocs2009_annual_reportpdf
65 Milliman Pension Funding Index (January 2016) httpusmillimancomPFI Mercer SampP 1500 pension funding status (January 5 2016) httpwwwmercercomnewsroomdecember-2015-pension-fundinghtml
66 Willis Towers Watson Corporate Pension Plan Funding Levels (January 4 2016) httpswwwtowerswatsoncomen-USPress201601corporate-pension-plan-funding-levels-showed-little-change-in-2015
67 See US Govrsquot Accountability Office GAO-13-583 Insurance Markets Impacts of and Regulatory Response to the 2007ndash2009 Financial Crisis at 10ndash12 (June 27 2013) available at httpwwwgaogovassets660655612pdf [hereinafter GAO Insurance Study]
68 By contrast pension plans do not have the ability to issue equity or debt to raise needed funding for the planrsquos operations but a planrsquos sponsor could do so and has the legal obligation to fund the plan obligations Nonetheless different market dynamics may apply in the case of raising capital to support core business operations (in the life insurance company context) as compared to raising capital to meet ldquosunk costrdquo obligations outside of the entityrsquos core business operations (in the context of funding pension plan liabilities)
69 29 CFR sect250995-1(c)(5) supra note 49 and accompanying text
70 This approach spreads the solvency risk between two insurers and results in twice the level of GA protection because that protection is provided on a per-insolvent insurer basis
71 See generally Part 332 of the NAIC standards httpwwwactuarialstandardsboardorgasopsstatements-opinion-based-asset-adequacy-analysis-actuaries-life-health-insurers (requiring that an insurerrsquos reserves reflect moderately adverse assumptions)
B-8 | National Organization of Life and Health Insurance Guaranty Associations
End Notes
72 See National Association of Insurance Commissioners Model Laws Regulations and Guidelines Vol III Risk-Based Capital (RBC) For Insurers Model Act 520-1 (2009) httpwwwnaicorgstorefreeMDL-312pdf The critical standards utilized in RBC calculations such as ldquoTotal Adjusted Capitalrdquo ldquoCompany Action Level RBCrdquo ldquoAuthorized Control Level RBCrdquo etc are defined in the Model Law and in the various state statutes adopting the Model Law The actual formulas for calculating these amounts are published by the NAIC
73 The ldquoAuthorized Control Level RBCrdquo is the number each insurer must calculate annually under the risk-based capital formula in accordance with the NAICrsquos RBC Instructions See supra note 72
74 National Association of Insurance Commissioners Summary Aggregate Life RBC Results By Year (June 23 2015) httpwwwnaicorgdocumentsresearch_stats_rbc_results_lifepdf
75 See National Association of Insurance Commissioners Model Laws Regulations and Guidelines Vol III Investments of Insurers Model Act (Defined Limits Version) (October 1996) httpwwwnaicorgstorefreeMDL-280pdf [hereinafter Model Investment Law]
76 See Model Investment Law 13B See also NAIC amp The Center for Insurance Policy and Research Capital Markets Special Report httpwwwnaicorgcapital_markets_archive130809htm Common stock and preferred stock invested in unaffiliated entities totaled 49 of total cash and invested assets of the insurance industry year-end 2012 For life insurers the percentage of investments in equities of unaffiliated entities was reportedly much lower at 08 of cash and admitted assets See supra note 55 regarding typical asset allocations for pension plan investments
77 See Model Investment Law 10A
78 See GAO Insurance Study supra note 67 at 6ndash7
79 See also pages 10ndash12 of MetLife 2013 written testimony delivered to the ERISA Advisory Council available at httpwwwdolgovebsapdfMetLife082913pdf
80 See generally GAO Insurance Study supra note 67
81 Standard Life insurance Company of Indiana was placed into liquidation in 2012 but all of the annuities it originally issued had been transferred to and assumed by a solvent insurer a year before liquidation The only insurer with outstanding annuity obligations placed into liquidation in the years following the ldquoGreat Recessionrdquo was Executive Life Insurance Company of New York (ldquoELNYrdquo) The financial failure of ELNY however dates back decades to an era before states implemented important new safeguards (eg the RBC capital framework) that would make a repeat of the ELNY scenario unlikely Formal receivership proceedings for ELNY began in 1991 when ELNY was seized and placed into rehabilitation by the New York Department of Insurance following the failure of its parent Executive Life Insurance Company ELNY wrote no annuities after its 1991 seizure The ELNY rehabilitation proceedings continued until 2013 when ELNY
Consumer Protection Comparison The Federal Pension System and the State Insurance System | B-9
End Notes
became subject to an order of liquidation ELNY suffered from the same problems of the 1980s that caused its parent to failmdashunderpricing of large structured settlement annuities and heavy investments in the junk bond market ELNYrsquos 2013 liquidation was the last chapter in that 1991 insolvency ELNYrsquos liquidation affected approximately 10000 annuity contracts and certificates which represents a very small portion of the overall annuity marketplace Almost half of ELNYrsquos remaining 10000 annuity contracts and certificates (more than 4700 annuity certificates) were held by individuals who received them in pension plan terminations that occurred in the 1980s At liquidation 998 of the former plan participants were fully protected by the GAs under the ELNY liquidation plan and 986 of their aggregate benefits were protected Approximately 1400 other annuities were not fully covered due to their very large size (some having present values in excess of $20 million) and the anomalously low funded ratio of the ELNY estate at the time liquidation commenced in 2013
82 See generally R Boyd Fatal Risk A Cautionary Tale of AIGrsquos Corporate Suicide (Wiley 2011)
83 See eg supra note 74
84 Id
85 National Association of Insurance Commissioners State of the Life Insurance Industry Implications of Industry Trends (August 2013) httpwwwnaicorgdocumentscipr_home_130823_implications_industry_trends_finalpdf
86 Of course as noted above a planrsquos sponsor may have access to capital markets however it may be more feasible for an insurer to raise capital to support its core business operations than for a plan sponsor to raise capital to fund pension obligations that are outside its core business operations
87 Public Benefit Guaranty Corporation Maximum Monthly Guarantee Tables httpwwwpbgcgovwrbenefitsguaranteed-benefitsmaximum-guaranteehtml The amounts for joint-and-survivor annuities assume spouses of the same age as the participants
88 For a large plan (with at least $20 million in unfunded benefits) the recovery ratio is based on the recovery for that plan alone for smaller plans the recovery ratio is the average ratio for all such plans over a 5-year period ERISA sect4044(f)(2)(A) (C) 29 USC sect1344(f)(2)(A) (C) In its December 2011 report on Delphi plan terminations in 2009 the GAO reported that ldquoPBGC would pay about 6 percent of all participant unfunded nonguaranteed plan benefitsrdquo and that ldquothis [6 percent] ratio falls within the range of recovery ratios for other large terminated plans we reviewedrdquo US Govrsquot Accountability Office GAO-12-168 Delphi Pension Plans GM Agreements with Unions Give Rise to Unique Differences in Participant Benefits 24 27-28 (December 2011) The GAO report also noted that in 2009 the small-plan ldquoratio was set at 385 percentrdquo Id at 27 n 68
89 ERISA sect4022(b) 29 USC sect1322(b)
90 ERISA sect4044(a) 29 USC sect1344(a)
B-10 | National Organization of Life and Health Insurance Guaranty Associations
End Notes
91 Pension Benefit Guaranty Corporation PBGCrsquos Guarantee Limitsmdashan Update 2 (Sept 2008) httpswwwpbgcgovdocsguaranteelimitspdf
92 The guaranteed minimum level applies to the value of future annuity payments payable after the insurer is placed into liquidationmdashthere is no reduction for the annuity payments the individual has already received Additionally the present value coverage level is for each measuring life For joint-and-survivor annuity benefits the present value of the benefits payable for the primary life is actuarially determined and then the present value of benefits payable for the secondary life is actuarially determined Each present value is protected up to the statersquos present value coverage level (usually $250000) Once the present value of the protected annuity benefits is determined the annuitant will continue to receive the benefit payments regardless of how long the annuitant lives So all mortality and economic risk is assumed by the GA which may end up paying the annuitant more in benefits than what was used to determine the present value at the time the insurer became insolvent and was placed into liquidation
93 An insurerrsquos funded ratio at the time of liquidation bears no intrinsic relationship to and should not be confused with RBC ratios calculated prior to liquidation
94 In any state with a $500000 present value GA coverage level the annuity in this example would be fully guaranteed
95 This outcome assumes no separate account had been established by the insurer to fund the promised annuity benefits If the insurer had established a separate account and that account was adequately funded the annuity benefits backed by the separate account would be fully protected notwithstanding the insurerrsquos insolvency or the level of assets available in the ldquoestaterdquo of the insolvent insurer
96 While the uncovered benefits are backed by their proportionate share of the insolvent insurerrsquos assets there is no entity charged with guaranteeing that those remaining assets will ultimately prove to be sufficient to meet all future payment obligations the assets support Due to investment risk and mortalitylongevity risk those estate assets could prove to be inadequate For this reason NOLHGA and its member GAs and receivers often try to transfer the liabilities (either at the commencement of the companyrsquos receivership or at a favorable time afterwards) to a solvent insurer that will guarantee the assets are sufficient Such transactions do have a cost but they yield guaranties for benefits not covered by the GAs and result in the transfer of administrative responsibilities to an ongoing life insurer actively engaged in the administration of such business
97 In the ELNY case as explained in more detail above 998 of former pension plan participants were fully protected under the liquidation plan See supra note 81
98 For comparative purposes holders of life insurance policies with failed insurers insurance did somewhat better having an average loss over the same period of only 392
99 At NOLHGArsquos direction Willis Towers Watson assumed equal funded ratios for a plan and insurer for purposes of comparing quantitatively the two safety net mechanisms Actual historical patterns however demonstrate that failed insurers have substantially higher funded ratios than those of failed pension plans See infra notes 103 and 105 and accompanying text
Consumer Protection Comparison The Federal Pension System and the State Insurance System | B-11
End Notes
100 A Participant Census Data Summary attached as Appendix I to Willis Towers Watsonrsquos analysis reflects the key participant data (by headcount average age average benefit amount and employment and benefit-payment status) that Willis Towers Watson used in performing its quantitative comparisons for three plan populationsmdashthe hourly employeesrsquo plan the salaried employeesrsquo plan and the retiree portion of the salaried employeesrsquo plan Willis Towers Watson Study supra note 11 at 19
101 Willis Towers Watson used the $250000 coverage level in the current NAIC Model GA Act at NOLHGArsquos direction Fourteen states currently have higher coverage levels for payout annuities with four states having limits of $500000 (Connecticut New Jersey New York and Washington) Puerto Rico (which is not currently a member of NOLHGA) remains at the $100000 coverage levels Id at 8
102 In all scenarios the allocation of plan or insurer assets would not change the percentage of fully protected participants
103 The funded ratio for insolvent annuity issuers is significantly affected by the eventual 2013 liquidation of ELNY which first entered receivership in 1991 See supra note 81 Not only was ELNY anomalous because it occurred prior to implementation of the more rigorous insurance financial oversight standards developed in the 1990s (even though it was not placed into liquidation until 2013) it also suffered from large increases in liabilities as its book of annuity business aged due to its underwriting and pricing practices before receivership ELNY used aggressive interest rate assumptions and age rating for many annuitants under its largest structured settlement annuities (eg treating several annuitants as decades older than their actual age under the belief that the seriousness of their personal injuries had a materially negative impact on life expectancy)
104 For example in Confederation Life one of the largest insolvencies of annuity issuers in history the funded ratio was ultimately sufficient to protect fully all annuitants (that is Confederation Lifersquos funded ratio ultimately proved to be 100) Even in the Executive Life Insurance Company (CA) insolvency the funded ratio reached nearly 78 by 2006 and with recent litigation recoveries the ultimate funded ratio will increase further See US and Japan Life Insurers Insolvencies Case Studies Lessons learned from resolutions The Geneva Association (2015)
105 Pension Benefit Guaranty Corporation Pension Insurance Data Tables 2013 Table S-3 (PBGC Terminations and Claims (1975-2013) Single-Employer Program) (2013) httpwwwpbgcgovpracdata-bookshtml
106 In 2012 Standard Life insurance Company of Indiana was also placed into liquidation but all of the annuities it originally issued had been transferred to and assumed by a solvent insurer prior to liquidation
National Organization of Life and Health Insurance Guaranty Associations13873 Park Center Road Suite 505 | Herndon VA 20171
Phone 7034815206 | Fax 7034815209wwwnolhgacom


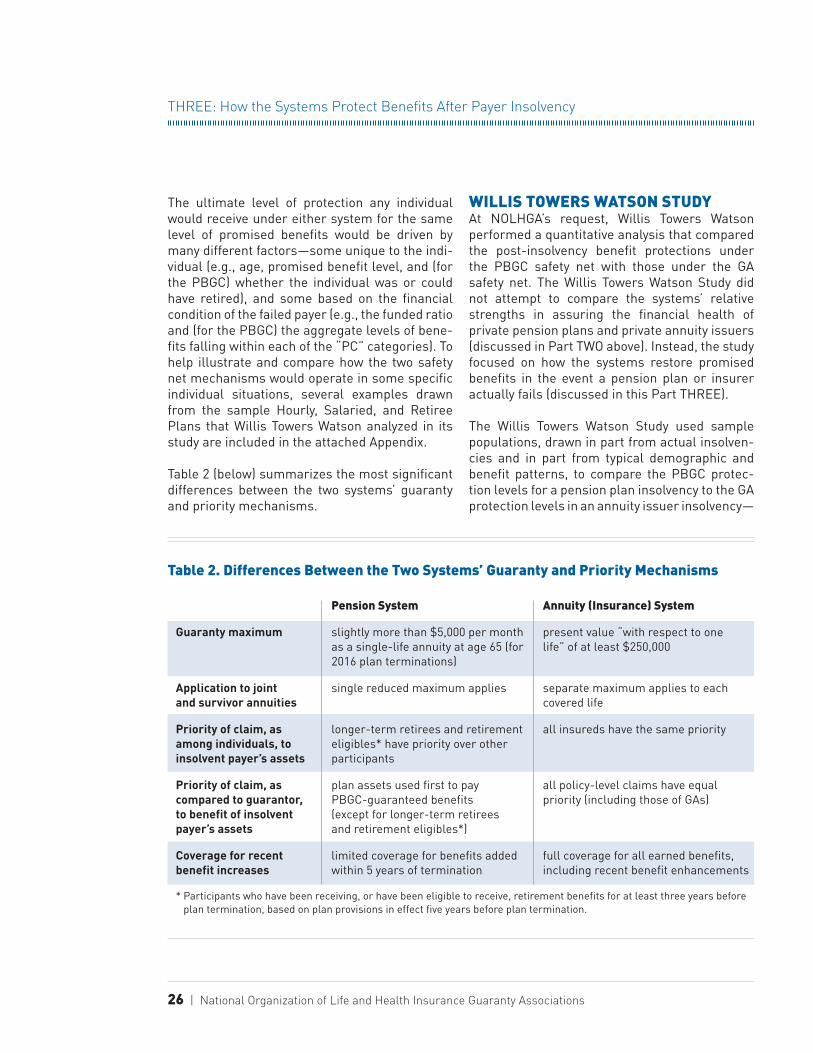


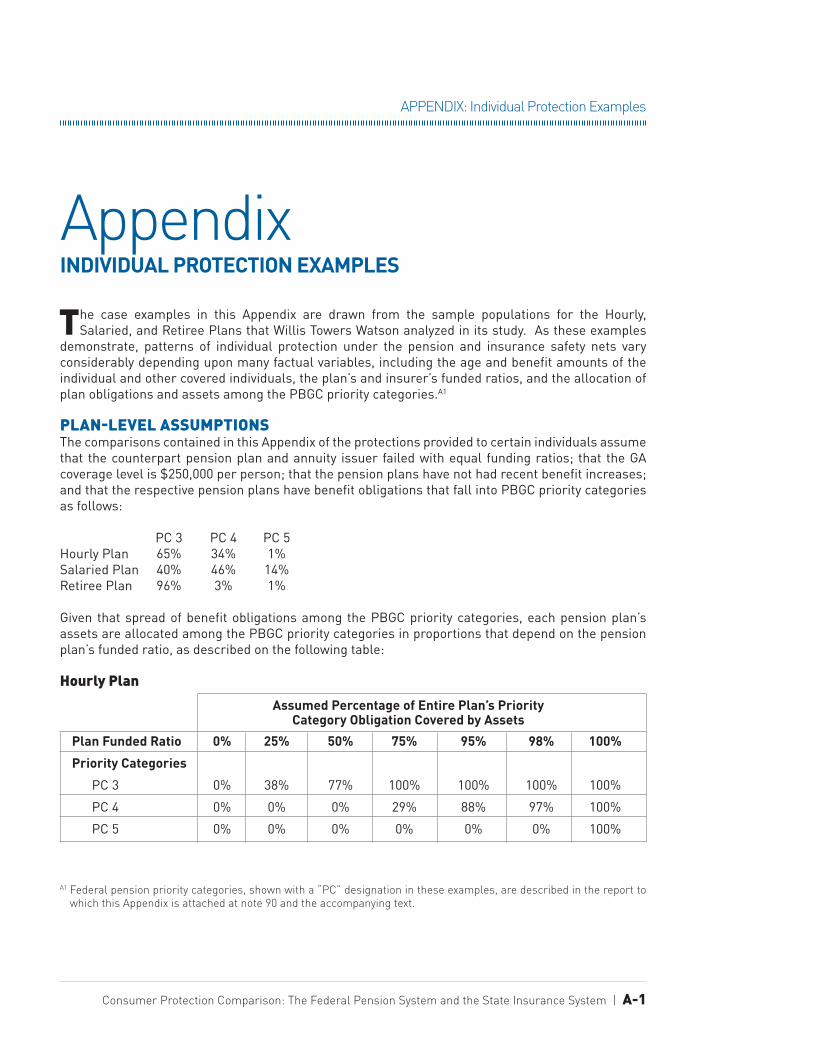


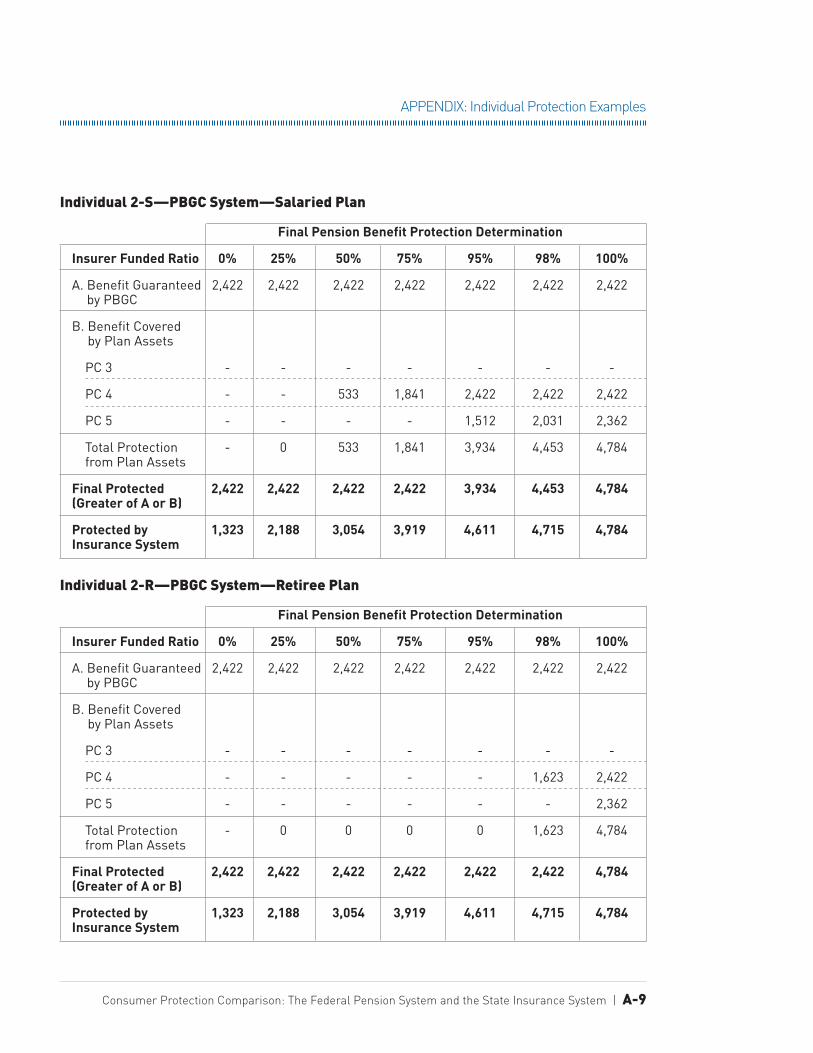


![Diagnostic Review of Consumer Protection and Financial ...Diagnostic Review of Consumer Protection and Financial Literacy Volume II Comparison against Good Practices [February 2009]](https://static.fdocuments.in/doc/165x107/5e2c25bac538286e87046f63/diagnostic-review-of-consumer-protection-and-financial-diagnostic-review-of.jpg)