CONSUMER PREFERENCES, USAGE PATTERN AND …
13
ELK ASIA PACIFIC JOURNAL OF SOCIAL SCIENCE ISSN 2394-9392 (Online); DOI: 10.16962/EAPJSS/issn. 2394-9392/2015; Volume 5 Issue 2 (2019) 1 www.elkjournals.com ………………………………………………………………………………………………………………………………… CONSUMER PREFERENCES, USAGE PATTERN AND SATISFACTION TOWARDS HIMALAYA COSMETICS IN BABY CARE PRODUCTS SEGMENT – AN ANALYTICAL STUDY Dr. Rajee M Assistant Professor, Department of Business Administration, Don Bosco College of Arts and Science, (Affiliated to Manonmaniam Sundaranar University) KeelaEral, Tuticorin. (Tamilnadu), India [email protected] Kasinathan S Assistant Professor, Department of Management Studies, Sikkim Manipal University – DDE, Majitar (Sikkim), India [email protected] Abstract India's cosmetics and cosmeceutical market is expected to register annual growth of 25 per cent touching USD 20 billion by 2025, according to industry experts. The Indian cosmeceutical and cosmetics industry has an overall market standing of USD 6.5 billion from a global market of USD 274 billion. It is expected to grow to USD 20 billion by 2025 at a compounded rate of 25 per cent. The rising awareness of beauty products, increasing premium on personal grooming, changes in consumption patterns and lifestyles and improved purchasing power among the peoples are expected to boost the industry. Many players in the field are competing aggressively to capture more and more markets. The purpose of this article is to investigate the consumers’ preferences towards Himalaya Cosmetics especially in Baby care products segment in Chennai region. The following six product categories are been selected for this study such as Moisturizing Baby Soap, Gentle Baby Shampoo, Baby Lotion, Baby Powder, Baby Care Gift Pack, Baby Care Gift Box Mini (Soap-Powder). Questionnaires were distributed and self-administered to 500 respondents. Descriptive analysis, and Pearson Chi- Square were used in this study. Keywords: Consumer Preference, Usage Pattern, Baby care products, Cosmetics 1. INTRODUCTION: Understanding the needs of a baby’s body is essential to their proper development both mental and physical. Himalaya’s baby care products are ayurvedic formulations, containing 100 percent pure herbal actives, and conform to the standards of the Pharmaceutical industry, thus making each product effective, mild and soothing to suit and nourish the baby’s delicate skin. Parenthood is the most challenging part of anyone’s life. Suddenly, and wonderfully,
Transcript of CONSUMER PREFERENCES, USAGE PATTERN AND …
ELK ASIA PACIFIC JOURNAL OF SOCIAL SCIENCE
ISSN 2394-9392 (Online); DOI: 10.16962/EAPJSS/issn. 2394-9392/2015; Volume 5 Issue 2 (2019)
1
www.elkjournals.com
…………………………………………………………………………………………………………………………………
CONSUMER PREFERENCES, USAGE PATTERN AND SATISFACTION
TOWARDS HIMALAYA COSMETICS IN BABY CARE PRODUCTS SEGMENT –
AN ANALYTICAL STUDY
Dr. Rajee M
Assistant Professor, Department of Business
Administration, Don Bosco College of Arts
and Science, (Affiliated to Manonmaniam
Sundaranar University) KeelaEral,
Tuticorin.
(Tamilnadu), India
Kasinathan S
Assistant Professor, Department of
Management Studies,
Sikkim Manipal University – DDE, Majitar
(Sikkim), India [email protected]
Abstract
India's cosmetics and cosmeceutical market is expected to register annual growth of 25 per
cent touching USD 20 billion by 2025, according to industry experts. The Indian cosmeceutical
and cosmetics industry has an overall market standing of USD 6.5 billion from a global market
of USD 274 billion. It is expected to grow to USD 20 billion by 2025 at a compounded rate of
25 per cent. The rising awareness of beauty products, increasing premium on personal
grooming, changes in consumption patterns and lifestyles and improved purchasing power
among the peoples are expected to boost the industry. Many players in the field are competing
aggressively to capture more and more markets. The purpose of this article is to investigate
the consumers’ preferences towards Himalaya Cosmetics especially in Baby care products
segment in Chennai region. The following six product categories are been selected for this
study such as Moisturizing Baby Soap, Gentle Baby Shampoo, Baby Lotion, Baby Powder,
Baby Care Gift Pack, Baby Care Gift Box Mini (Soap-Powder). Questionnaires were
distributed and self-administered to 500 respondents. Descriptive analysis, and Pearson Chi-
Square were used in this study.
Keywords: Consumer Preference, Usage Pattern, Baby care products, Cosmetics
1. INTRODUCTION:
Understanding the needs of a baby’s body
is essential to their proper development
both mental and physical. Himalaya’s baby
care products are ayurvedic formulations,
containing 100 percent pure herbal actives,
and conform to the standards of the
Pharmaceutical industry, thus making each
product effective, mild and soothing to suit
and nourish the baby’s delicate skin.
Parenthood is the most challenging part of
anyone’s life. Suddenly, and wonderfully,
ELK ASIA PACIFIC JOURNAL OF SOCIAL SCIENCE
ISSN 2394-9392 (Online); DOI: 10.16962/EAPJSS/issn. 2394-9392/2015; Volume 5 Issue 2 (2019)
2
life is no longer just about you. There is a
new person to love and nurture, an
education to plan. And most importantly a
strong healthy body and mind to build.
Himalaya range of products has been
carefully developed to give the best start in
life for the most important person in
universe.
At Himalaya, science of baby care is geared
towards bringing the very best of natural
care for the most precious person in
customers’ life. Their science of baby care
is backed by a strong team of research
scientists who have carefully selected time-
tested herbal ingredients for the Baby care
range. The products have been developed,
keeping in mind the special requirements of
baby’s skin. They are clinically tested to
ensure safety and efficacy. So, when people
choose Himalaya for their little ones, the
rest can be assured that very best product
has been chosen.
2. REVIEW OF LITERATURE:
Yvonne Clarke and Geoffrey N.Soutar
(1982) conducted a study to analyze the
consumer acquisition patterns for durable
goods. It also revealed that a population has
underlying common order of acquisition for
a large set of heterogeneous durables. Some
of the differences in priority patterns for
durable products due to climate and cultural
differences of the areas and due to time lag
in purchase.
Pride & Ferell (1985) have examined that
connotations associated with body motions,
greetings, colours, numbers, shapes, size
and symbols vary considerably across
cultures, and these cultural differences have
marketing implications that pertain to
product development, personal sales,
advertising, packaging and pricing.
Abdullah bin junaid & Dr. Reshma Nasreen
(2012) have identified that the Delhi’s male
cosmetic consumption behaviour was
strongly influenced by cultural and personal
factors, the main influencing factors of
male consumption behaviour are the price,
celebrity endorsement, features, easiness to
use of the products etc.
Vigneron and Johnson (1999) reported that
people's needs for appearances and
materialism were increasing. That is human
beings wanted to satisfy the need to look
and feel good. This created a boom in the
cosmetic and toiletries sector across the
world.
Malhotra (2003) describes the main reasons
for boom in cosmetic industry as increasing
fashion and beauty consciousness coupled
with rising incomes and focus on health and
fitness. To complement this, beauty culture
or cosmetology has emerged as a major
occupational avenue with significant
commercial potential.
ELK ASIA PACIFIC JOURNAL OF SOCIAL SCIENCE
ISSN 2394-9392 (Online); DOI: 10.16962/EAPJSS/issn. 2394-9392/2015; Volume 5 Issue 2 (2019)
3
Monteiro (2003) claimed that there is a
tremendous increase in the female cosmetic
consumers. This is due to increasing
number of women becoming the earning
members of the family due to their
increased level of literacy and growing
influence of the media. More males in India
are becoming conscious about the way they
look and are increasingly looking to
grooming products to spruce up their
physical appearance.
Ben amour (2009) research was to
determine the effectiveness of product
sampling in terms of usage in the cosmetics
industry and to draw a consumer profile that
is reactive to free samples and to determine
product characteristics that would lead to
free samples usage companies should give
away free samples of new products.
Jyothsna Priyadarsini K (2009) in her study
revealed that many rural men feel delicate
to use cosmetics. Rural males have a feeling
that cosmetics are mainly meant for
females. The social stigmas against male
grooming products persist a lot. These male
respondents consider their use as feminine.
Now it is the job of marketers to create a
cosmetic sense among the masculine breed.
P.K. Khicha, Benard Oyagi and Andrew S.
Nysngau (2012), Studied that Baby
accessory products are selected through the
brand perception and Brand Equity. The
study explored how to create brand
perception and brand equity by using
different marketing communication tools.
3. SIGNIFICANCE OF THE STUDY:
This study is needed to consider when
designing and implementing marketing
programs. Failure to understand the
dynamic buyer behaviour and improper
allocation and coordination of resources
will lead the organization to great losses.
There are three sections of consumer
behaviour that need to be addressed
carefully: psychological influences, socio-
cultural influences and situational
influences. The marketers have to go
through a number of challenges in selling
products like “baby-care” as they have to be
applied directly on new-born or infant
skins, body and other parts.
4. OBJECTIVES OF THE STUDY:
➢ To examine the socio-economic
profile of buyers of Baby care
products of Himalaya cosmetics.
➢ To study the buyer’s preference and
usage pattern of Baby care products
of Himalaya cosmetics
➢ To study the buyer’s usage pattern
and satisfaction of Baby care
products of Himalaya cosmetics

ELK ASIA PACIFIC JOURNAL OF SOCIAL SCIENCE
ISSN 2394-9392 (Online); DOI: 10.16962/EAPJSS/issn. 2394-9392/2015; Volume 5 Issue 2 (2019)
4
5. HYPOTHESIS OF THE STUDY:
✓ There is no significant association
between the frequency of purchase
and usage of baby care products of
Himalaya
✓ There is no significant association
between the usage and satisfaction
of baby care products of Himalaya
6. METHODOLOGY:
Descriptive Research is adopted in this
research. Descriptive Research is used to
describe characteristics of a population or
phenomenon being studied. Non
Probability sampling method is used to
select the samples. Non Probability
sampling is a sampling technique where the
samples are gathered in a process that does
not give at all the individuals in the
population equal chances of being selected.
Convenience Sampling is a method in
which for convenience sake the study units
that happen to be available at the time of
data collection are selected. With
convenience sampling, the samples are
selected because they are accessible to the
researcher. The sample size of 100 from
each region, thus totally 500 samples has
been selected for the present study by
adopting non-probability convenience
sampling.
A questionnaire is a research instrument
consisting of a series of questions and other
prompts for the purpose of gathering
information from respondents. The Buyers
Preference of Baby Care Products of
Himalaya Cosmetics was analysed by using
the Chi Square Test.
7. RESULTS AND DISCUSSION:
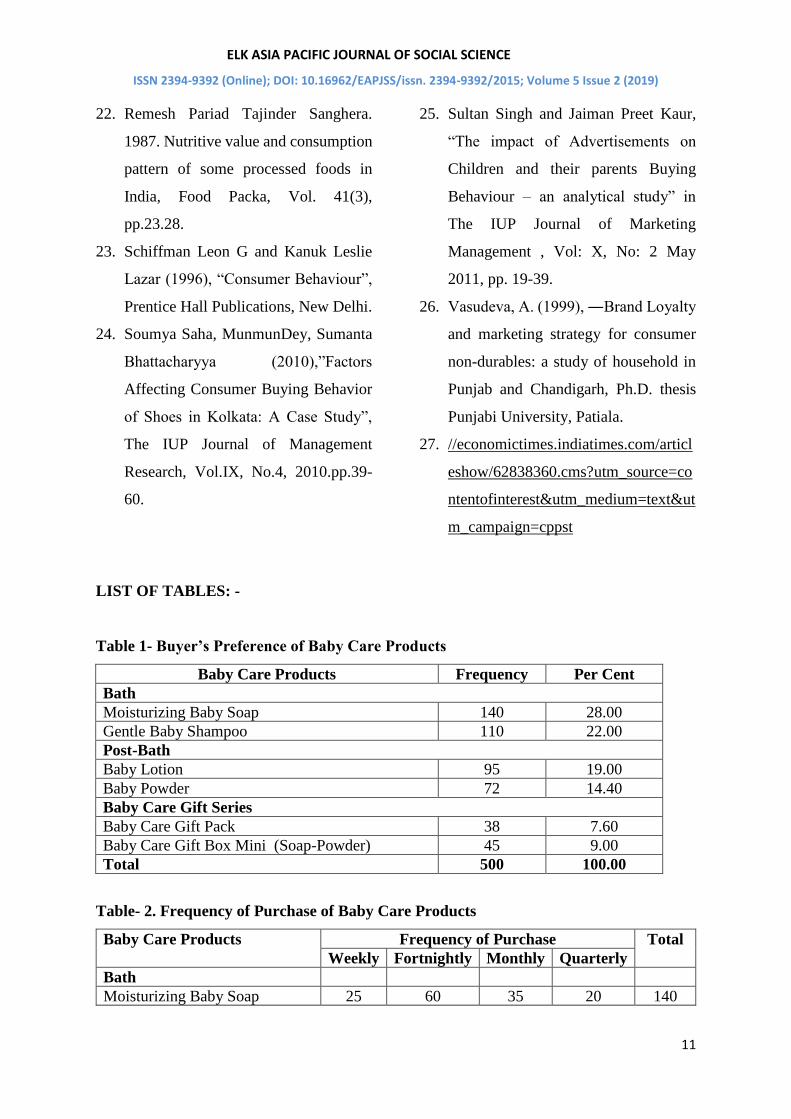
7.1. Buyer’s Preference of Baby Care
Products
The buyer’s preference of baby care
products of Himalaya was analyzed and the
results are presented in (Ref Table 1)
The results show that about 28.00 per cent
of buyers prefer moisturizing baby soap
followed by gentle baby shampoo(22.00
per cent), baby lotion(19.00 per cent), baby
powder(14.40 per cent), baby care gift box
mini (soap-powder)(9.00 per cent)and
baby care gift pack(7.60 per cent).
7.2. Frequency of Purchase of Baby Care
Products
The frequency of purchase of Baby care
products of Himalaya was analyzed and the
results are presented in (Ref Table- 2)
Source: Primary Data
Note: The figures in the parentheses are per
cent to total
The results show that out of 140 buyers of
moisturizing baby soap, about 42.86 per
cent of buyers purchase fortnightly
followed by monthly (25.00 per cent),
weekly (17.86 per cent)and quarterly
(14.28 per cent). Out of 110 buyers of
ELK ASIA PACIFIC JOURNAL OF SOCIAL SCIENCE
ISSN 2394-9392 (Online); DOI: 10.16962/EAPJSS/issn. 2394-9392/2015; Volume 5 Issue 2 (2019)
5
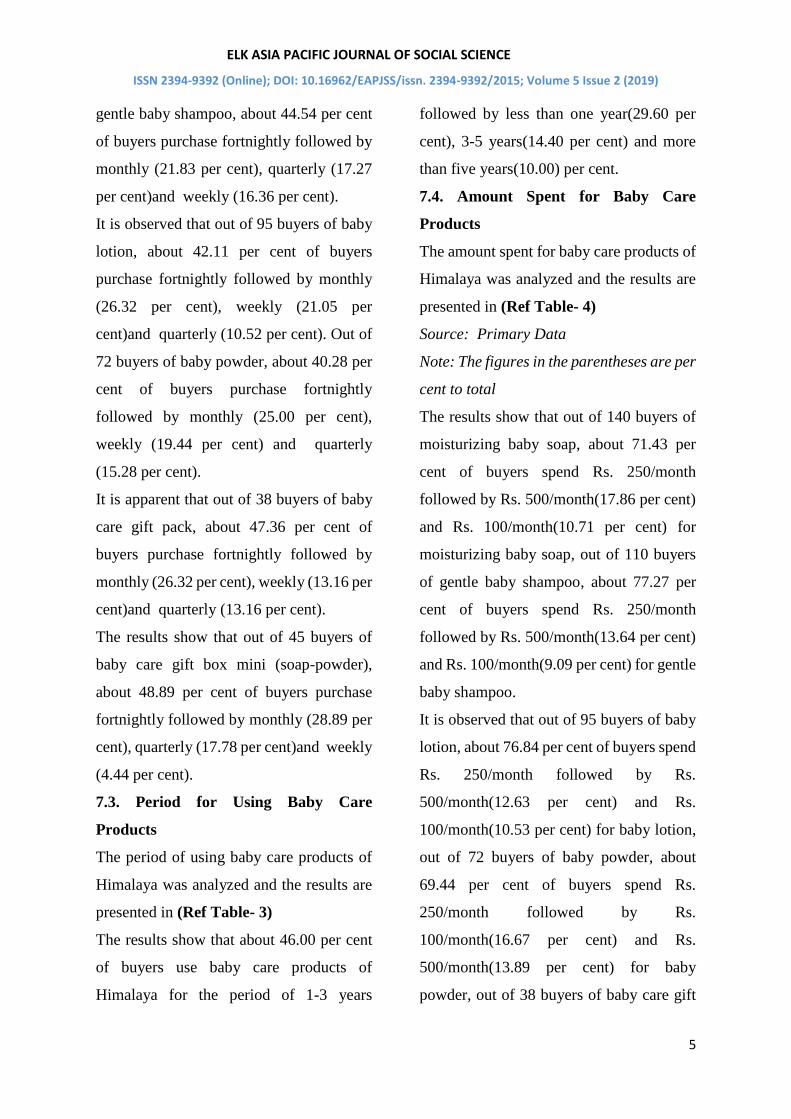
gentle baby shampoo, about 44.54 per cent
of buyers purchase fortnightly followed by
monthly (21.83 per cent), quarterly (17.27
per cent)and weekly (16.36 per cent).
It is observed that out of 95 buyers of baby
lotion, about 42.11 per cent of buyers
purchase fortnightly followed by monthly
(26.32 per cent), weekly (21.05 per
cent)and quarterly (10.52 per cent). Out of
72 buyers of baby powder, about 40.28 per
cent of buyers purchase fortnightly
followed by monthly (25.00 per cent),
weekly (19.44 per cent) and quarterly
(15.28 per cent).
It is apparent that out of 38 buyers of baby
care gift pack, about 47.36 per cent of
buyers purchase fortnightly followed by
monthly (26.32 per cent), weekly (13.16 per
cent)and quarterly (13.16 per cent).
The results show that out of 45 buyers of
baby care gift box mini (soap-powder),
about 48.89 per cent of buyers purchase
fortnightly followed by monthly (28.89 per
cent), quarterly (17.78 per cent)and weekly
(4.44 per cent).
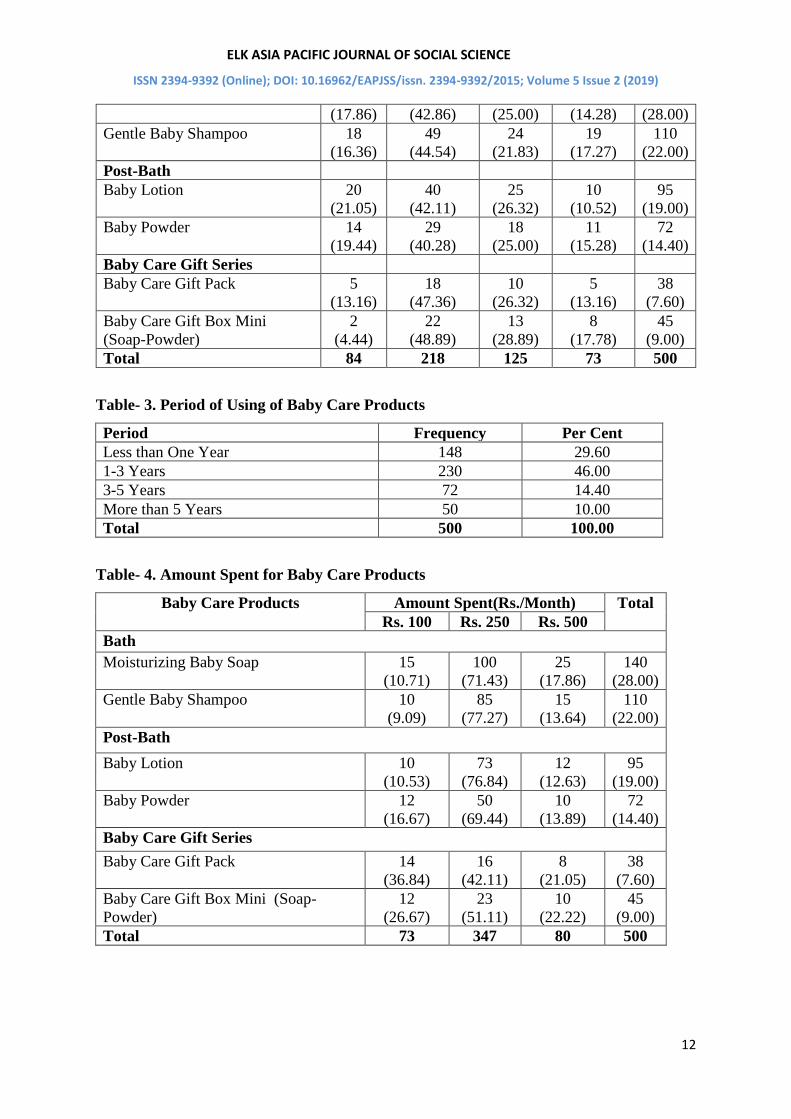
7.3. Period for Using Baby Care
Products
The period of using baby care products of
Himalaya was analyzed and the results are
presented in (Ref Table- 3)
The results show that about 46.00 per cent
of buyers use baby care products of
Himalaya for the period of 1-3 years
followed by less than one year(29.60 per
cent), 3-5 years(14.40 per cent) and more
than five years(10.00) per cent.
7.4. Amount Spent for Baby Care
Products
The amount spent for baby care products of
Himalaya was analyzed and the results are
presented in (Ref Table- 4)
Source: Primary Data
Note: The figures in the parentheses are per
cent to total
The results show that out of 140 buyers of
moisturizing baby soap, about 71.43 per
cent of buyers spend Rs. 250/month
followed by Rs. 500/month(17.86 per cent)
and Rs. 100/month(10.71 per cent) for
moisturizing baby soap, out of 110 buyers
of gentle baby shampoo, about 77.27 per
cent of buyers spend Rs. 250/month
followed by Rs. 500/month(13.64 per cent)
and Rs. 100/month(9.09 per cent) for gentle
baby shampoo.
It is observed that out of 95 buyers of baby
lotion, about 76.84 per cent of buyers spend
Rs. 250/month followed by Rs.
500/month(12.63 per cent) and Rs.
100/month(10.53 per cent) for baby lotion,
out of 72 buyers of baby powder, about
69.44 per cent of buyers spend Rs.
250/month followed by Rs.
100/month(16.67 per cent) and Rs.
500/month(13.89 per cent) for baby
powder, out of 38 buyers of baby care gift
ELK ASIA PACIFIC JOURNAL OF SOCIAL SCIENCE
ISSN 2394-9392 (Online); DOI: 10.16962/EAPJSS/issn. 2394-9392/2015; Volume 5 Issue 2 (2019)
6
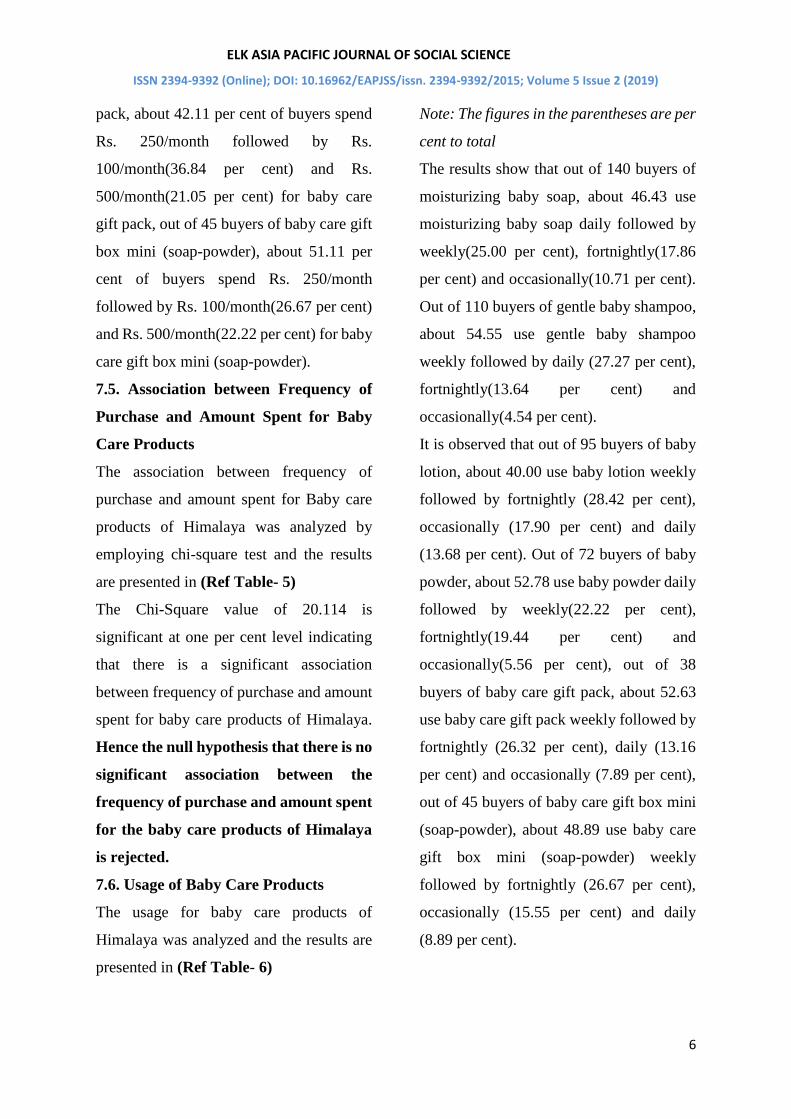
pack, about 42.11 per cent of buyers spend
Rs. 250/month followed by Rs.
100/month(36.84 per cent) and Rs.
500/month(21.05 per cent) for baby care
gift pack, out of 45 buyers of baby care gift
box mini (soap-powder), about 51.11 per
cent of buyers spend Rs. 250/month
followed by Rs. 100/month(26.67 per cent)
and Rs. 500/month(22.22 per cent) for baby
care gift box mini (soap-powder).
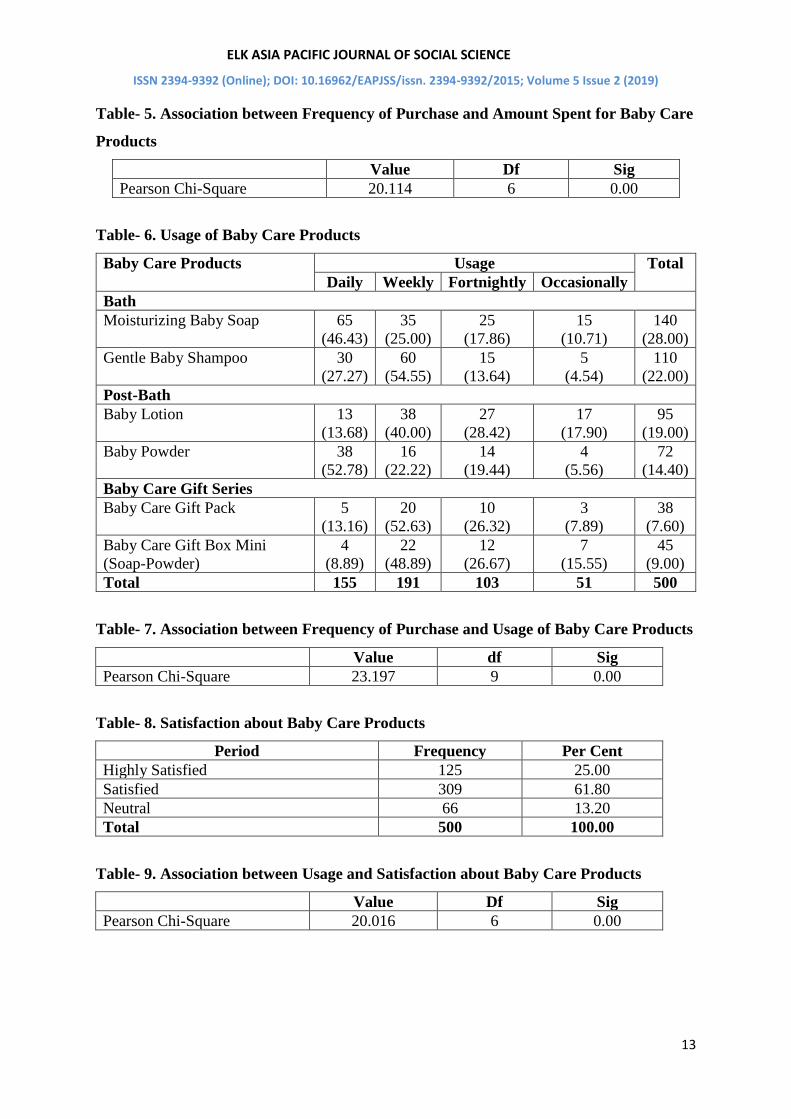
7.5. Association between Frequency of
Purchase and Amount Spent for Baby
Care Products
The association between frequency of
purchase and amount spent for Baby care
products of Himalaya was analyzed by
employing chi-square test and the results
are presented in (Ref Table- 5)
The Chi-Square value of 20.114 is
significant at one per cent level indicating
that there is a significant association
between frequency of purchase and amount
spent for baby care products of Himalaya.
Hence the null hypothesis that there is no
significant association between the
frequency of purchase and amount spent
for the baby care products of Himalaya
is rejected.
7.6. Usage of Baby Care Products
The usage for baby care products of
Himalaya was analyzed and the results are
presented in (Ref Table- 6)
Note: The figures in the parentheses are per
cent to total
The results show that out of 140 buyers of
moisturizing baby soap, about 46.43 use
moisturizing baby soap daily followed by
weekly(25.00 per cent), fortnightly(17.86
per cent) and occasionally(10.71 per cent).
Out of 110 buyers of gentle baby shampoo,
about 54.55 use gentle baby shampoo
weekly followed by daily (27.27 per cent),
fortnightly(13.64 per cent) and
occasionally(4.54 per cent).
It is observed that out of 95 buyers of baby
lotion, about 40.00 use baby lotion weekly
followed by fortnightly (28.42 per cent),
occasionally (17.90 per cent) and daily
(13.68 per cent). Out of 72 buyers of baby
powder, about 52.78 use baby powder daily
followed by weekly(22.22 per cent),
fortnightly(19.44 per cent) and
occasionally(5.56 per cent), out of 38
buyers of baby care gift pack, about 52.63
use baby care gift pack weekly followed by
fortnightly (26.32 per cent), daily (13.16
per cent) and occasionally (7.89 per cent),
out of 45 buyers of baby care gift box mini
(soap-powder), about 48.89 use baby care
gift box mini (soap-powder) weekly
followed by fortnightly (26.67 per cent),
occasionally (15.55 per cent) and daily
(8.89 per cent).
ELK ASIA PACIFIC JOURNAL OF SOCIAL SCIENCE
ISSN 2394-9392 (Online); DOI: 10.16962/EAPJSS/issn. 2394-9392/2015; Volume 5 Issue 2 (2019)
7
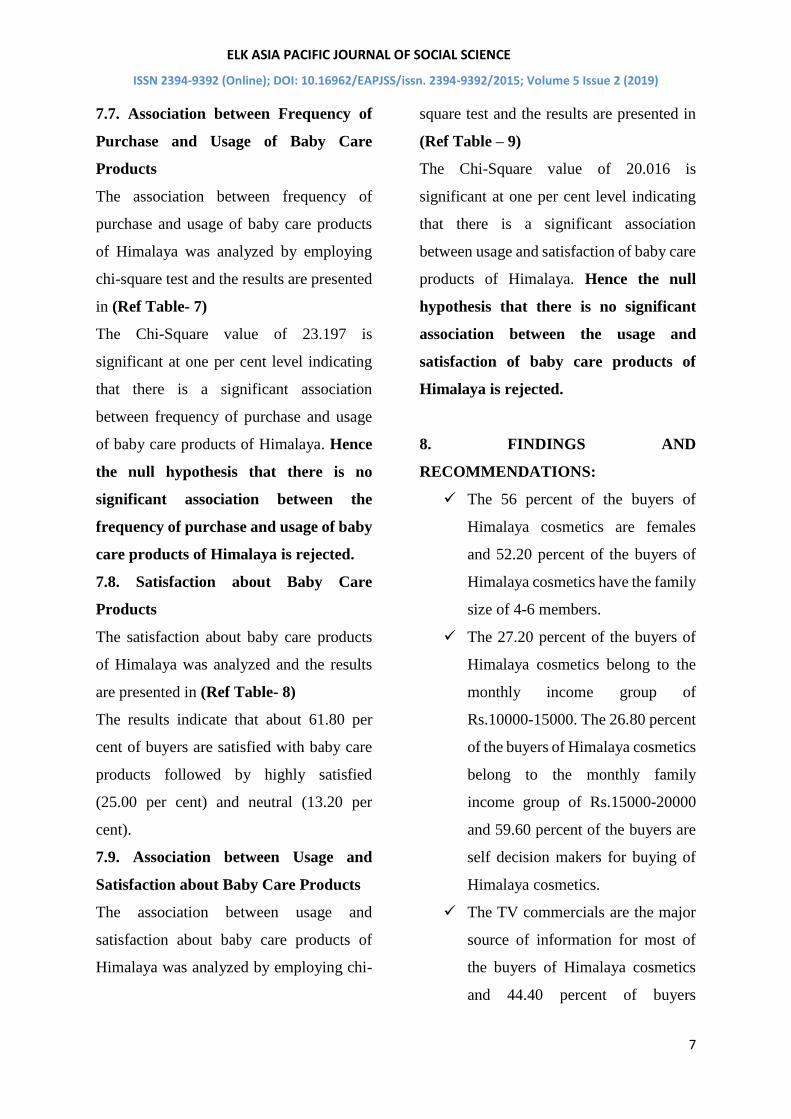
7.7. Association between Frequency of
Purchase and Usage of Baby Care
Products
The association between frequency of
purchase and usage of baby care products
of Himalaya was analyzed by employing
chi-square test and the results are presented
in (Ref Table- 7)
The Chi-Square value of 23.197 is
significant at one per cent level indicating
that there is a significant association
between frequency of purchase and usage
of baby care products of Himalaya. Hence
the null hypothesis that there is no
significant association between the
frequency of purchase and usage of baby
care products of Himalaya is rejected.
7.8. Satisfaction about Baby Care
Products
The satisfaction about baby care products
of Himalaya was analyzed and the results
are presented in (Ref Table- 8)
The results indicate that about 61.80 per
cent of buyers are satisfied with baby care
products followed by highly satisfied
(25.00 per cent) and neutral (13.20 per
cent).
7.9. Association between Usage and
Satisfaction about Baby Care Products
The association between usage and
satisfaction about baby care products of
Himalaya was analyzed by employing chi-
square test and the results are presented in
(Ref Table – 9)
The Chi-Square value of 20.016 is
significant at one per cent level indicating
that there is a significant association
between usage and satisfaction of baby care
products of Himalaya. Hence the null
hypothesis that there is no significant
association between the usage and
satisfaction of baby care products of
Himalaya is rejected.
8. FINDINGS AND
RECOMMENDATIONS:
✓ The 56 percent of the buyers of
Himalaya cosmetics are females
and 52.20 percent of the buyers of
Himalaya cosmetics have the family
size of 4-6 members.
✓ The 27.20 percent of the buyers of
Himalaya cosmetics belong to the
monthly income group of
Rs.10000-15000. The 26.80 percent
of the buyers of Himalaya cosmetics
belong to the monthly family
income group of Rs.15000-20000
and 59.60 percent of the buyers are
self decision makers for buying of
Himalaya cosmetics.
✓ The TV commercials are the major
source of information for most of
the buyers of Himalaya cosmetics
and 44.40 percent of buyers
ELK ASIA PACIFIC JOURNAL OF SOCIAL SCIENCE
ISSN 2394-9392 (Online); DOI: 10.16962/EAPJSS/issn. 2394-9392/2015; Volume 5 Issue 2 (2019)
8
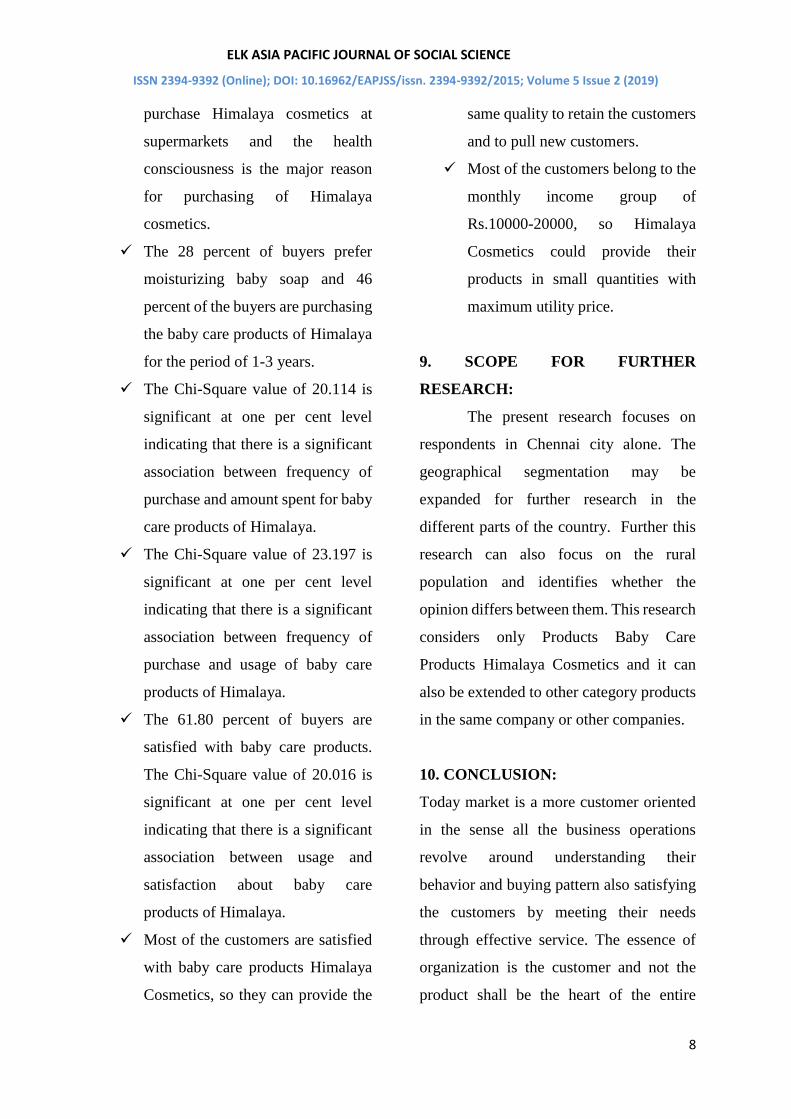
purchase Himalaya cosmetics at
supermarkets and the health
consciousness is the major reason
for purchasing of Himalaya
cosmetics.
✓ The 28 percent of buyers prefer
moisturizing baby soap and 46
percent of the buyers are purchasing
the baby care products of Himalaya
for the period of 1-3 years.
✓ The Chi-Square value of 20.114 is
significant at one per cent level
indicating that there is a significant
association between frequency of
purchase and amount spent for baby
care products of Himalaya.
✓ The Chi-Square value of 23.197 is
significant at one per cent level
indicating that there is a significant
association between frequency of
purchase and usage of baby care
products of Himalaya.
✓ The 61.80 percent of buyers are
satisfied with baby care products.
The Chi-Square value of 20.016 is
significant at one per cent level
indicating that there is a significant
association between usage and
satisfaction about baby care
products of Himalaya.
✓ Most of the customers are satisfied
with baby care products Himalaya
Cosmetics, so they can provide the
same quality to retain the customers
and to pull new customers.
✓ Most of the customers belong to the
monthly income group of
Rs.10000-20000, so Himalaya
Cosmetics could provide their
products in small quantities with
maximum utility price.
9. SCOPE FOR FURTHER
RESEARCH:
The present research focuses on
respondents in Chennai city alone. The
geographical segmentation may be
expanded for further research in the
different parts of the country. Further this
research can also focus on the rural
population and identifies whether the
opinion differs between them. This research
considers only Products Baby Care
Products Himalaya Cosmetics and it can
also be extended to other category products
in the same company or other companies.
10. CONCLUSION:
Today market is a more customer oriented
in the sense all the business operations
revolve around understanding their
behavior and buying pattern also satisfying
the customers by meeting their needs
through effective service. The essence of
organization is the customer and not the
product shall be the heart of the entire

ELK ASIA PACIFIC JOURNAL OF SOCIAL SCIENCE
ISSN 2394-9392 (Online); DOI: 10.16962/EAPJSS/issn. 2394-9392/2015; Volume 5 Issue 2 (2019)
9
business system. The success key in
modern marketing is high consideration of
customers. Manufactures produce different
kinds of products in order to sell them in the
marketing. In modern time without market
research and without understanding the
market needs and desire, it becomes
difficult to survive in the market. It is
necessary to find the out behaviour and
buying pattern of the customers and satisfy
them.
11. REFERENCES:
1. A.Abdul Brosekhan, Dr.c.Muthu
Velayutham (2014),” Rapid Change in
Consumer Buying Behabior- A Big
challenge for sustainable growth of
Todays Business”, Samzodhana Journal
of Management Research,vol.2, Issue 1
March 2014.
2. Abdullah bin junaid & Dr.Reshma
Nasreen 2012. “Study of consumption
pattern of cosmetics products among
young males in delhi” International
journal of research in commerce,
economics and management, 22(9), 77-
83, September 2012.
3. Al-ashban. A and Burney, “Key
Antecedents to cosmetics use among
women in Saudi Arabia: Empirical
Evidence from Saudi Arabia in JISSM,
vol.9, No.2.2001. pp. 3-20.
4. Alka gupta and Amtrik Singh Sudan
(1999),” Psycho Graphic Dimension and
Advertising Effectiveness”, Indian
Journal of Marketing, vol.29 March-
July.
5. Amit Kumar Sinha (2005),” Gender
difference among adolescents as
influencers and impact of
communication in the Family Purchase
Decision: A Study”, The ICFAI Journal
of Marketing Management,
Nov.2005.pp.50-59.
6. Bharadwaj Sivakumaran (2009), “
Buying Behaviour of women with
respect to cosmetics” Journal of
Marketing Research , vol 4,65-75.
August 2009.
7. Bishmupriya Mishra and Sakkthivel
A.M (2005), ―Effectiveness of sachets
in modifying rural consumers‘ Buying
behavior and their consumption pattern
Indian Journal of Marketing,
Vol.XXXV, No.2, PP, 33-37.
8. Dr.Vinith Kumar Nair, Dr.Prakash
Pillai.R (2007).” A study on Purchase
Pattern of Cosmetics among Consumers
in Kerala” International Marketing
Conference on Marketing & Society, 8-
10 April 2007, IIMK.
9. Du Preez, R. (2001). ‘Female apparel
shopping behaviour within a multi-
cultural consumer society: Variables,
market segments, profiles and
ELK ASIA PACIFIC JOURNAL OF SOCIAL SCIENCE
ISSN 2394-9392 (Online); DOI: 10.16962/EAPJSS/issn. 2394-9392/2015; Volume 5 Issue 2 (2019)
10
implications’, Unpublished Doctoral
thesis. Stellenbosch University.
10. Jagadish N.Sheth (1973), “A Model of
Consumer Behavior”, Journal of
Marketing Research, vol.37.pp.50-56.
11. Janse van Noordwyk, H.S. (2002).
Perceived importance of retail store
image attributes to the female large-
size apparel consumer in a
multicultural society. Unpublished
Master’s thesis. Stellenbosch
University.
12. Jarvis C.B (1998), ―An Exploratory
Investigation of Consumers‘
Evaluation of External Information
Sources in Pre-purchase Search,
Advances in Consumer Research,
XXXV, Ed. J, W. Alba and W.
Hutchinson.
13. Jyothsna Priyadarsini K (2009),
―Cosmetic Touch for Guy‘s Market:
An Empirical Study on the Penetration
of Male Grooming Brands into Rural
Area of East Godavari District, AP,
The Icfai Journal of Consumer
Behavior , Vol IV, No. 1, pp46-59.
14. Khicha PK, Benard N Oyagi, Andrew
Nyangau S. Brand Perception on Baby
Accessory Products, Kaim Journal of
Management and Research. 2012; 4(1-
2):3842.
15. Lau, M.M., Chang, M. S., Moon, K., &
Liu, W.S. (2006). The Brand Loyalty
of Sportswear in Hong Kong Journal of
Textile and Apparel. Technology and
Management, 5 ,1-13.
16. Levine and Campbell,
D.T.(1972).Ethnocentrism: Theories
of conflict, ethnic attitudes and Group
Behavior, John Wiley, New York.
17. Loudon and Bitta (1988)”Consumer
Behaviour-concepts and
Applications”, Newyork. Pg.605.
18. Mahajan, B.M.(1980) Consumer
Behavior in India (An economic
study), New Delhi, p:338
19. Manit Mishra and BB Mishra, “A
quantitative assessment of materialistic
value and its relationship with
consumer behavior in Indian culture”
in the IUP Journal of Marketing
Management in Vol. X. No.2 May
2011. pp. 33-53
20. Raghava Rao Gundala,Kavita
Chavali(2005),”Ethical Aspects in the
Advertising of Fairness Creams”, The
ICFAI Journal of Marketing
Management.nov2005.pp.61-70.
21. Rajeev Kaushal, CS. Raghubanshi and
B.K. Sinha(1976),” Purchasing
Behavior Pattern of the Consumers and
their Brand Preferences for Washing
Soaps Syndents”,Indian Journal of
Marketing, Vol.VIII,December, pp.9-
14.
ELK ASIA PACIFIC JOURNAL OF SOCIAL SCIENCE
ISSN 2394-9392 (Online); DOI: 10.16962/EAPJSS/issn. 2394-9392/2015; Volume 5 Issue 2 (2019)
11
22. Remesh Pariad Tajinder Sanghera.
1987. Nutritive value and consumption
pattern of some processed foods in
India, Food Packa, Vol. 41(3),
pp.23.28.
23. Schiffman Leon G and Kanuk Leslie
Lazar (1996), “Consumer Behaviour”,
Prentice Hall Publications, New Delhi.
24. Soumya Saha, MunmunDey, Sumanta
Bhattacharyya (2010),”Factors
Affecting Consumer Buying Behavior
of Shoes in Kolkata: A Case Study”,
The IUP Journal of Management
Research, Vol.IX, No.4, 2010.pp.39-
60.
25. Sultan Singh and Jaiman Preet Kaur,
“The impact of Advertisements on
Children and their parents Buying
Behaviour – an analytical study” in
The IUP Journal of Marketing
Management , Vol: X, No: 2 May
2011, pp. 19-39.
26. Vasudeva, A. (1999), ―Brand Loyalty
and marketing strategy for consumer
non-durables: a study of household in
Punjab and Chandigarh, Ph.D. thesis
Punjabi University, Patiala.
27. //economictimes.indiatimes.com/articl
eshow/62838360.cms?utm_source=co
ntentofinterest&utm_medium=text&ut
m_campaign=cppst
LIST OF TABLES: -
Table 1- Buyer’s Preference of Baby Care Products
Baby Care Products Frequency Per Cent
Bath
Moisturizing Baby Soap 140 28.00
Gentle Baby Shampoo 110 22.00
Post-Bath
Baby Lotion 95 19.00
Baby Powder 72 14.40
Baby Care Gift Series
Baby Care Gift Pack 38 7.60
Baby Care Gift Box Mini (Soap-Powder) 45 9.00
Total 500 100.00
Table- 2. Frequency of Purchase of Baby Care Products
Baby Care Products Frequency of Purchase Total
Weekly Fortnightly Monthly Quarterly
Bath
Moisturizing Baby Soap 25 60 35 20 140
ELK ASIA PACIFIC JOURNAL OF SOCIAL SCIENCE
ISSN 2394-9392 (Online); DOI: 10.16962/EAPJSS/issn. 2394-9392/2015; Volume 5 Issue 2 (2019)
12
(17.86) (42.86) (25.00) (14.28) (28.00)
Gentle Baby Shampoo 18
(16.36)
49
(44.54)
24
(21.83)
19
(17.27)
110
(22.00)
Post-Bath
Baby Lotion 20
(21.05)
40
(42.11)
25
(26.32)
10
(10.52)
95
(19.00)
Baby Powder 14
(19.44)
29
(40.28)
18
(25.00)
11
(15.28)
72
(14.40)
Baby Care Gift Series
Baby Care Gift Pack 5
(13.16)
18
(47.36)
10
(26.32)
5
(13.16)
38
(7.60)
Baby Care Gift Box Mini
(Soap-Powder)
2
(4.44)
22
(48.89)
13
(28.89)
8
(17.78)
45
(9.00)
Total 84 218 125 73 500
Table- 3. Period of Using of Baby Care Products
Period Frequency Per Cent
Less than One Year 148 29.60
1-3 Years 230 46.00
3-5 Years 72 14.40
More than 5 Years 50 10.00
Total 500 100.00
Table- 4. Amount Spent for Baby Care Products
Baby Care Products Amount Spent(Rs./Month) Total
Rs. 100 Rs. 250 Rs. 500
Bath
Moisturizing Baby Soap 15
(10.71)
100
(71.43)
25
(17.86)
140
(28.00)
Gentle Baby Shampoo 10
(9.09)
85
(77.27)
15
(13.64)
110
(22.00)
Post-Bath
Baby Lotion 10
(10.53)
73
(76.84)
12
(12.63)
95
(19.00)
Baby Powder 12
(16.67)
50
(69.44)
10
(13.89)
72
(14.40)
Baby Care Gift Series
Baby Care Gift Pack 14
(36.84)
16
(42.11)
8
(21.05)
38
(7.60)
Baby Care Gift Box Mini (Soap-
Powder)
12
(26.67)
23
(51.11)
10
(22.22)
45
(9.00)
Total 73 347 80 500
ELK ASIA PACIFIC JOURNAL OF SOCIAL SCIENCE
ISSN 2394-9392 (Online); DOI: 10.16962/EAPJSS/issn. 2394-9392/2015; Volume 5 Issue 2 (2019)
13
Table- 5. Association between Frequency of Purchase and Amount Spent for Baby Care
Products
Value Df Sig
Pearson Chi-Square 20.114 6 0.00
Table- 6. Usage of Baby Care Products
Baby Care Products Usage Total
Daily Weekly Fortnightly Occasionally
Bath
Moisturizing Baby Soap 65
(46.43)
35
(25.00)
25
(17.86)
15
(10.71)
140
(28.00)
Gentle Baby Shampoo 30
(27.27)
60
(54.55)
15
(13.64)
5
(4.54)
110
(22.00)
Post-Bath
Baby Lotion 13
(13.68)
38
(40.00)
27
(28.42)
17
(17.90)
95
(19.00)
Baby Powder 38
(52.78)
16
(22.22)
14
(19.44)
4
(5.56)
72
(14.40)
Baby Care Gift Series
Baby Care Gift Pack 5
(13.16)
20
(52.63)
10
(26.32)
3
(7.89)
38
(7.60)
Baby Care Gift Box Mini
(Soap-Powder)
4
(8.89)
22
(48.89)
12
(26.67)
7
(15.55)
45
(9.00)
Total 155 191 103 51 500
Table- 7. Association between Frequency of Purchase and Usage of Baby Care Products
Value df Sig
Pearson Chi-Square 23.197 9 0.00
Table- 8. Satisfaction about Baby Care Products
Period Frequency Per Cent
Highly Satisfied 125 25.00
Satisfied 309 61.80
Neutral 66 13.20
Total 500 100.00
Table- 9. Association between Usage and Satisfaction about Baby Care Products
Value Df Sig
Pearson Chi-Square 20.016 6 0.00