CONSUMER INSIGHTS REPORT - nielsen.comWelcome to the Consumer Insights Report (FMCG and...
34
FMCG - SUPERMARKETS October 2014 CONSUMER INSIGHTS REPORT COMMISSIONED BY COMMERCIAL RADIO AUSTRALIA A CUSTOM ANALYSIS +
Transcript of CONSUMER INSIGHTS REPORT - nielsen.comWelcome to the Consumer Insights Report (FMCG and...

FMCG - SUPERMARKETS
October 2014
CONSUMER INSIGHTS REPORT
COMMISSIONED BY COMMERCIAL RADIO AUSTRALIA A CUSTOM ANALYSIS
+

Co
pyr
igh
t ©
2012
Th
e N
iels
en C
om
pan
y. C
on
fid
enti
al a
nd
pro
pri
etar
y.
2
INTRODUCTION
Welcome to the Consumer Insights Report (FMCG and Supermarkets), developed in collaboration with Commercial Radio Australia.
While consumer confidence in Q3 2014 is back to similar levels experienced one year ago, Australia remains slightly lower than global average. Topping the list of concerns are rising utility bills, the economy and job security. Also on the list is the rising cost of groceries and in response, consumers are switching to lower priced brands, looking for more bargains and specials, and cooking more at home.
The share of advertising spend allocated to metro radio in the FMCG and Supermarket categories remains below the market average. However radio is ideally placed to reach and influence these consumers.
In this report we examine the revenue opportunities for radio, the top social and cost of living concerns across the Super, Avid and Regular listener groups, their attitudes towards Food and Advertising and their ‘shopper profile’.
We hope you find it informative and useful.
Monique Perry Executive Director, Media Industry Group
2 A CUSTOM ANALYSIS COMMISSIONED BY COMMERCIAL RADIO AUSTRALIA

CONSUMER CONFIDENCE

Co
pyr
igh
t ©
2012
Th
e N
iels
en C
om
pan
y. C
on
fid
enti
al a
nd
pro
pri
etar
y.
4
CONSUMER CONFIDENCE – Q3 2014 Consumer Confidence in Australia returns to similar levels seen one-year prior
Source: Nielsen Global Consumer Confidence Report – Q3 2014
AP AU NZ
Global = 98
+1 (highest score since Q2 2007)
Asia/Pac = 107
+1
Aust. = 97
+12 (coming from the lowest score on record in Q2-14)
NZ = 102
+3

Co
pyr
igh
t ©
2012
Th
e N
iels
en C
om
pan
y. C
on
fid
enti
al a
nd
pro
pri
etar
y.
5
Health
18%
INCREASING FOOD PRICES IS A TOP CONCERN (AU) What are your major concerns over the next six months?
Source: Nielsen Global Consumer Confidence Report – Q3 2014 | Sum of ‘Biggest concern’ and ‘2nd biggest concern’
Increasing utility bills
28%
The economy
20%
Job security
25%
Increasing food prices
11%

Co
pyr
igh
t ©
2012
Th
e N
iels
en C
om
pan
y. C
on
fid
enti
al a
nd
pro
pri
etar
y.
6
THE CONSUMER RESPONSE: COOKING MORE AT HOME, BUYING CHEAPER BRANDS Compared to this time last year, which actions have you taken to save on household expenses?
Source: Nielsen Global Consumer Confidence Report – Q3 2014 | Sum of ‘Agree’ and ‘Strongly Agree’ | AU
65% Try to save on gas and electricity
60% Cut down on take-away meals
60% Spend less on new clothes
55% Spend less on out-of-home entertainment
52% Switch to cheaper grocery brands
THEY
SA
Y TH
EY D
O…

HOW ARE ADVERTISERS SPENDING THEIR $ WITHIN FMCG AND SUPERMARKETS?

Co
pyr
igh
t ©
2012
Th
e N
iels
en C
om
pan
y. C
on
fid
enti
al a
nd
pro
pri
etar
y.
8
OPPORTUNITY EXISTS FOR RADIO
Source: Nielsen AIS | 12 months to September 27 2014
$231m - Supermarkets
$899m - FMCG
3.6%
3.0%
METRO RADIO’S SHARE TOTAL SPEND
TOTAL ADSPEND
Metro Radio’s average share of spend across all categories: 7.6%

Co
pyr
igh
t ©
2012
Th
e N
iels
en C
om
pan
y. C
on
fid
enti
al a
nd
pro
pri
etar
y.
9
WHAT’S “OUT THERE” FOR RADIO?
Source: Nielsen AIS | 12 months to September 27 2014
Supermarkets
133 advertisers…
…spent a total of
$36,540,000
FMCG
843 advertisers…
…spent a total of
$400,575,000
[active advertisers who are NOT using Metro Radio]

Co
pyr
igh
t ©
2012
Th
e N
iels
en C
om
pan
y. C
on
fid
enti
al a
nd
pro
pri
etar
y.
10
$25 $28
$144
$25 $21 $6
$63
$160
BEVERAGES DENTAL FOOD HAIR CARE CLEANERS PET CARE PHARMAC. TOILETR./COSM.
ADSPEND $M
FOOD AND TOILETRIES ARE THE DEEPEST POOLS AdSpend by Advertisers who are not using Metro Radio within the Category
Source: Nielsen AIS | 12 months to September 27 2014
$160m spent in the Toiletries category, by
Advertisers who are not using Metro Radio

Co
pyr
igh
t ©
2012
Th
e N
iels
en C
om
pan
y. C
on
fid
enti
al a
nd
pro
pri
etar
y.
11
Combined AdSpend of the Big 5 = $214m
3.3% 3.8%
0.0%
2.7%
7.1%
WOOLWORTHS COLES ALDI METCASH 7 ELEVEN
RADIO ADSPEND SHARE
THE BIG 5 - SUPERMARKETS Percent of ad budget spent on Radio
Source: Nielsen AIS | 12 months to September 27 2014
S-Mkts Average
3.6%
For three of the top 5 Supermarket advertisers, the share of adSpend
allocated to Metro Radio is less than the category average

Co
pyr
igh
t ©
2012
Th
e N
iels
en C
om
pan
y. C
on
fid
enti
al a
nd
pro
pri
etar
y.
12
Combined AdSpend of the Big 5 = $202m
0.3%
0.5%
1.0%
0.0% 0.0%
RECKITT BENCKISER UNILEVER MONDELEZ KELLOGG L'OREAL
RADIO ADSPEND SHARE
THE BIG 5 - FMCG Percent of ad budget spent on Radio
Source: Nielsen AIS | 12 months to September 27 2014
FMCG Average
3.0%
For all of the top 5 FMCG advertisers, the share of adSpend allocated to
Metro Radio is far less than the category average

RADIO AND SHOPPER INSIGHTS
Co
pyr
igh
t ©
2012
Th
e N
iels
en C
om
pan
y. C
on
fid
enti
al a
nd
pro
pri
etar
y.
14
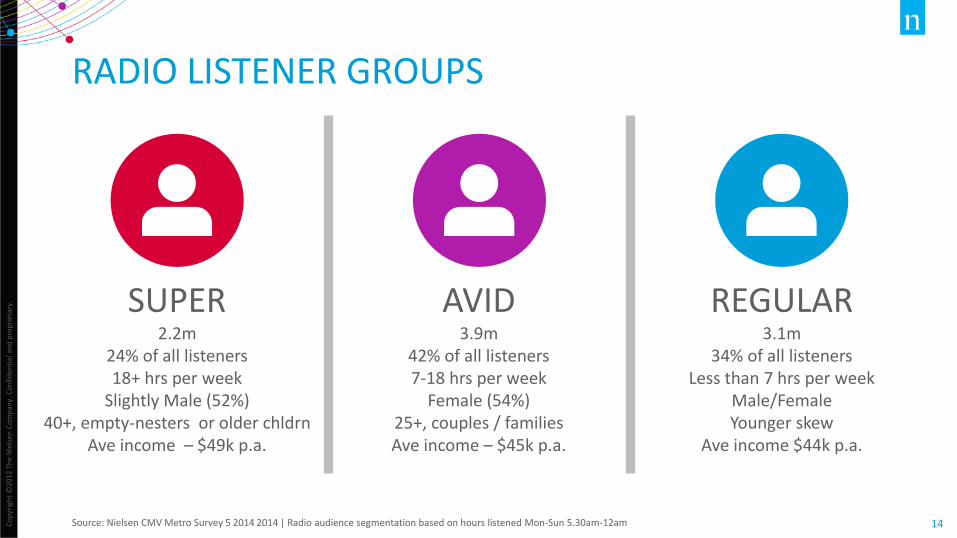
SUPER 2.2m
24% of all listeners 18+ hrs per week
Slightly Male (52%) 40+, empty-nesters or older chldrn
Ave income – $49k p.a.
RADIO LISTENER GROUPS
Source: Nielsen CMV Metro Survey 5 2014 2014 | Radio audience segmentation based on hours listened Mon-Sun 5.30am-12am
AVID 3.9m
42% of all listeners 7-18 hrs per week
Female (54%) 25+, couples / families Ave income – $45k p.a.
REGULAR 3.1m
34% of all listeners Less than 7 hrs per week
Male/Female Younger skew
Ave income $44k p.a.

Co
pyr
igh
t ©
2012
Th
e N
iels
en C
om
pan
y. C
on
fid
enti
al a
nd
pro
pri
etar
y.
15
TOP SOCIAL CONCERNS
Source: Nielsen CMV Metro Survey 5 2014 | Top 5 most important social issues in Australia - ranked by % of column group, All People 14+
Radio audience segmentation – Super, Avid, Regular - based on hours listened Mon-Sun 5.30am-12am
RED values indicate ‘index against the population’, with the population benchmark being 100 [an index value of 110 means “10% more likely than the population”]
SUPER AVID REGULAR
Economy Economy Economy
Health Unemployment Unemployment
Unemployment Health Health
Crime Education Education
Education Crime Crime
110
105
104
85
103
106
97
98
103
98
92
While the same social issues are of concern to all three listener groups, when compared to the broader population…
• The SUPER listener is more likely to be concerned about the Economy, Health and Crime
• The AVID listener more likely against Crime and Education
• REGULAR listeners more likely for Unemployment…(and less likely concerned about Health)
Over the past four years the
rising concerns are the
Economy and Unemployment.
Falling is Health, Interest Rates
and Environment.

Co
pyr
igh
t ©
2012
Th
e N
iels
en C
om
pan
y. C
on
fid
enti
al a
nd
pro
pri
etar
y.
16
TOP COST OF LIVING CONCERNS
Source: Nielsen CMV Metro Survey 5 2014 | Top 5 cost of living concerns in Australia - ranked by % of column group, All People 14+
Radio audience segmentation – Super, Avid, Regular - based on hours listened Mon-Sun 5.30am-12am
RED values indicate ‘index against the population’, with the population benchmark being 100 [an index value of 110 means “10% more likely than the population”]
SUPER AVID REGULAR
Electricity Electricity Electricity
Petrol Petrol Petrol
Water Water Groceries
Groceries Groceries Water
Gn. Insurance General Insurance Gen. Insurance
While the same cost of living issues are of concern to all three listener groups, when compared to the broader population…
• The SUPER listener is more likely to be concerned about all issues in the top 5
• The AVID listener is mostly ‘in line’, but slightly more likely for Water costs
• REGULAR listeners are slightly less concerned about all issues
Rising Grocery costs features
in the top 5 for all groups.
107
107
107
110
109 103
97
97
94
96
96

Co
pyr
igh
t ©
2012
Th
e N
iels
en C
om
pan
y. C
on
fid
enti
al a
nd
pro
pri
etar
y.
17
HOW TO SAVE ON EXPENSES? ENERGY AND FOOD OPTIONS TOP THE LIST
Source: Nielsen CMV Metro Survey 5 2014 – Actions taken to save on expenses
Radio audience segmentation – Super, Avid, Regular - based on hours listened Mon-Sun 5.30am-12am
GREEN and RED arrows indicate MORE or LESS likely than the broader population
SUPER AVID REGULAR
63% shop a lot for bargains/specials
62% switch food brands for specials
58% cook basic fav’s within budget
82% conserve energy where they can
65% shop a lot for bargains/specials
62% switch food brands for specials
59% cook basic fav’s within budget
80% conserve energy where they can
63% shop a lot for bargains/specials
62% switch food brands for specials
56% tend to hold out until sales
78% conserve energy where they can

Co
pyr
igh
t ©
2012
Th
e N
iels
en C
om
pan
y. C
on
fid
enti
al a
nd
pro
pri
etar
y.
18 18
SHOW ME THE MONEY…AND THE INFORMATION
64% of SUPER listeners “prefer ads which give me the price”
62% prefer ads which give them information
51% always listen to radio on the way to work
42% talk about what they hear on radio
24% trust their favourite radio station to inform them about products/services that
are relevant to them Source: Nielsen CMV Metro Survey 5 2014
Radio audience segmentation – Super, Avid, Regular - based on hours listened Mon-Sun 5.30am-12am
Over index on all
responses

Co
pyr
igh
t ©
2012
Th
e N
iels
en C
om
pan
y. C
on
fid
enti
al a
nd
pro
pri
etar
y.
19 19
SHOW ME THE MONEY…AND THE INFORMATION
62% of AVID listeners “prefer ads which give me the price”
61% prefer ads which give them information
48% always listen to radio on the way to work
41% talk about what they hear on radio
25% trust their favourite radio station to inform them about products/services
that are relevant to them Source: Nielsen CMV Metro Survey 5 2014
Radio audience segmentation – Super, Avid, Regular - based on hours listened Mon-Sun 5.30am-12am
Over index on all
responses

Co
pyr
igh
t ©
2012
Th
e N
iels
en C
om
pan
y. C
on
fid
enti
al a
nd
pro
pri
etar
y.
20 20
SHOW ME THE MONEY…AND THE INFORMATION
59% of REGULAR listeners “prefer ads which give the price”
56% prefer ads which give them information
41% always listen to radio on the way to work
35% talk about what they hear on radio
22% trust their favourite radio station to inform them about products/services
that are relevant to them Source: Nielsen CMV Metro Survey 5 2014
Radio audience segmentation – Super, Avid, Regular - based on hours listened Mon-Sun 5.30am-12am
Flat or under index on all responses

Co
pyr
igh
t ©
2012
Th
e N
iels
en C
om
pan
y. C
on
fid
enti
al a
nd
pro
pri
etar
y.
21
TRENDS IN FOOD ATTITUDES 2011 to 2014…
Source: Nielsen CMV Metro Survey 5 2014, 2103, 2012, 2011
Radio audience segmentation – Super, Avid, Regular - based on hours listened Mon-Sun 5.30am-12am
Buying more organic, fresh and
chilled; but less wholegrain and high-fibre; restricting fat
intake; eating less ‘on-the-run’.
More vegetarian; buying more organic,
fresh and chilled;
concerned with
preservatives
and processed foods.
More vegetarian and
organic; avoiding processed foods; less
wholegrain and high-fibre.
SUPER AVID REGULAR
Co
pyr
igh
t ©
2012
Th
e N
iels
en C
om
pan
y. C
on
fid
enti
al a
nd
pro
pri
etar
y.
22
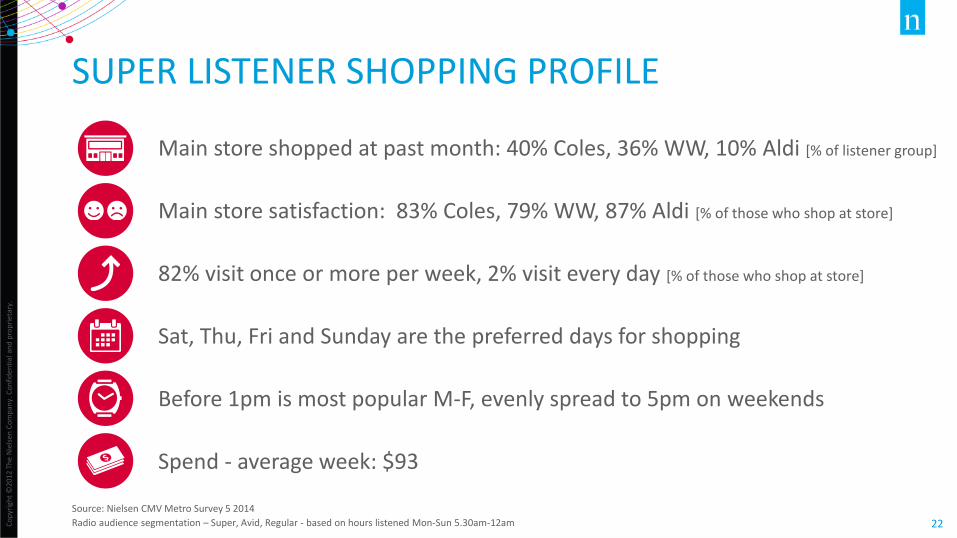
SUPER LISTENER SHOPPING PROFILE
Source: Nielsen CMV Metro Survey 5 2014
Radio audience segmentation – Super, Avid, Regular - based on hours listened Mon-Sun 5.30am-12am
Main store shopped at past month: 40% Coles, 36% WW, 10% Aldi [% of listener group]
Main store satisfaction: 83% Coles, 79% WW, 87% Aldi [% of those who shop at store]
82% visit once or more per week, 2% visit every day [% of those who shop at store]
Sat, Thu, Fri and Sunday are the preferred days for shopping
Before 1pm is most popular M-F, evenly spread to 5pm on weekends
Spend - average week: $93

Co
pyr
igh
t ©
2012
Th
e N
iels
en C
om
pan
y. C
on
fid
enti
al a
nd
pro
pri
etar
y.
23
AVID LISTENER SHOPPING PROFILE
Main store shopped at past month: 38% Coles, 36% WW, 10% Aldi
Main store satisfaction: 83% Coles, 78% WW, 85% Aldi [% of those who shop at store]
81% visit once or more per week, 3% visit every day [% of those who shop at store]
Sat, Thu, Sun and Friday are the preferred days for shopping
Before 1pm is most popular M-F, 1-5pm more popular on weekends
Spend – average week: $93
Source: Nielsen CMV Metro Survey 5 2014
Radio audience segmentation – Super, Avid, Regular - based on hours listened Mon-Sun 5.30am-12am

Co
pyr
igh
t ©
2012
Th
e N
iels
en C
om
pan
y. C
on
fid
enti
al a
nd
pro
pri
etar
y.
24
REGULAR LISTENER SHOPPING PROFILE
Main store shopped at past month: 36% Coles, 36% WW, 10% Aldi
Main store satisfaction: 82% Coles, 79% WW, 84% Aldi [% of those who shop at store]
78% visit once or more per week, 2% visit every day [% of those who shop at store]
Sat, Thu, Fri and Sunday are the preferred days for shopping
Before 1pm is most popular M-F, 1-5pm most popular on weekends
Spend – average week: $87
Source: Nielsen CMV Metro Survey 5 2014
Radio audience segmentation – Super, Avid, Regular - based on hours listened Mon-Sun 5.30am-12am

Co
pyr
igh
t ©
2012
Th
e N
iels
en C
om
pan
y. C
on
fid
enti
al a
nd
pro
pri
etar
y.
25
SHOPPER TRENDS OVER TIME
A move towards Coles and Aldi
Super listeners visiting less frequently; Avid/Regular listeners more frequently
Super listeners less Wed-Thu and more Sa-Su; Avid and Regular show no trend
Increased patronage before 1pm weekdays
Super listeners spending slightly more p/week, Regular listeners slightly less
Source: Nielsen CMV Metro Survey 5 2014
Radio audience segmentation – Super, Avid, Regular - based on hours listened Mon-Sun 5.30am-12am
2011 - 2014
Co
pyr
igh
t ©
2012
Th
e N
iels
en C
om
pan
y. C
on
fid
enti
al a
nd
pro
pri
etar
y.
26
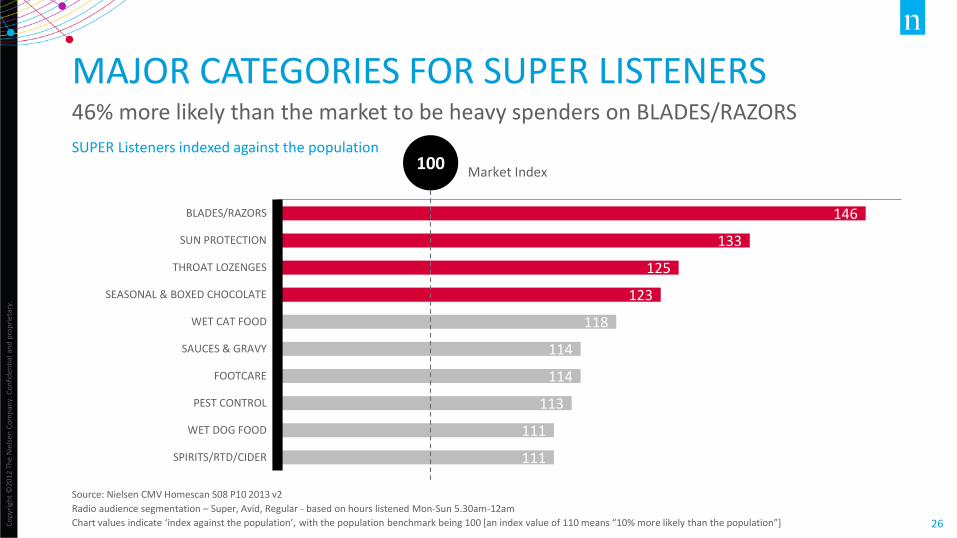
146
133
125
123
118
114
114
113
111
111
BLADES/RAZORS
SUN PROTECTION
THROAT LOZENGES
SEASONAL & BOXED CHOCOLATE
WET CAT FOOD
SAUCES & GRAVY
FOOTCARE
PEST CONTROL
WET DOG FOOD
SPIRITS/RTD/CIDER
SUPER Listeners indexed against the population
MAJOR CATEGORIES FOR SUPER LISTENERS 46% more likely than the market to be heavy spenders on BLADES/RAZORS
Source: Nielsen CMV Homescan S08 P10 2013 v2
Radio audience segmentation – Super, Avid, Regular - based on hours listened Mon-Sun 5.30am-12am
Chart values indicate ‘index against the population’, with the population benchmark being 100 [an index value of 110 means “10% more likely than the population”]
100 Market Index

Co
pyr
igh
t ©
2012
Th
e N
iels
en C
om
pan
y. C
on
fid
enti
al a
nd
pro
pri
etar
y.
27
115
112
112
109
109
109
108
108
107
106
SNACKING - POT/DRY NOODLES
FROZEN PIZZA
PARTY PICNIC
TOPPINGS
COOKING CHOCOLATE
BIRD FOOD
WEIGHT LOSS/BODY BUILD. PRODUCTS
DIPS
HEALTH BARS
GUM
100 AVID Listeners indexed against the population
MAJOR CATEGORIES FOR AVID LISTENERS 15% more likely than the market to be heavy spenders on SNACKS (POT/DRY NOODLES)
Market Index
Source: Nielsen CMV Homescan S08 P10 2013 v2
Radio audience segmentation – Super, Avid, Regular - based on hours listened Mon-Sun 5.30am-12am
Chart values indicate ‘index against the population’, with the population benchmark being 100 [an index value of 110 means “10% more likely than the population”]

Co
pyr
igh
t ©
2012
Th
e N
iels
en C
om
pan
y. C
on
fid
enti
al a
nd
pro
pri
etar
y.
28
148
131
117
115
115
115
113
113
113
109
STILL DRINKS
SPECIALITY IMPULSE
GLOVE SCOURERS & CLOTHS
DENTURE CARE PRODUCTS
HEALTH/BEAUTY/BABY
DISPOSABLE NAPPIES
DRY DOG FOOD
ACCESSORIES (IMPULSE)
POPCORN
BABY WIPES
100 Market Index
REGULAR Listeners indexed against the population
MAJOR CATEGORIES FOR REGULAR LISTENERS 48% more likely than the market to be heavy spenders on STILL DRINKS
Source: Nielsen CMV Homescan S08 P10 2013 v2
Radio audience segmentation – Super, Avid, Regular - based on hours listened Mon-Sun 5.30am-12am
Chart values indicate ‘index against the population’, with the population benchmark being 100 [an index value of 110 means “10% more likely than the population”]

WHY USE RADIO FOR FCMG AND SUPERMARKETS?

Co
pyr
igh
t ©
2012
Th
e N
iels
en C
om
pan
y. C
on
fid
enti
al a
nd
pro
pri
etar
y.
30
REACH CONSUMERS AT THE RIGHT TIMES
0%
10%
20%
30%
40%
50%
60%
70%
80%
5.30-9AM 9AM-1PM 1PM-5PM 5PM-8PM 8PM-11PM
LISTEN TO RADIO DRIVING AROUND CITY PUBLIC TRANSPORT VISIT SUPERMARKET
A typical Monday to Friday for GROCERY BUYERS
Source: Nielsen CMV Metro Survey 5 2014
Listen to Radio = Cume Audience
Radio is perfectly placed to reach consumers before, during and after purchase
Radio listening patterns closely match those for supermarket visits.
Radio is ideally placed to reach consumers in the car or on public transport at these same times.

Co
pyr
igh
t ©
2012
Th
e N
iels
en C
om
pan
y. C
on
fid
enti
al a
nd
pro
pri
etar
y.
31
RADIO REACHES THE RIGHT AUDIENCE SUPER Radio Listeners
Source: Nielsen CMV Metro Survey 5 2014
Radio audience segmentation – Super, Avid, Regular - based on hours listened Mon-Sun 5.30am-12am
82% are grocery
buyers
74% influence grocery purchases
74% are the main grocery buyer
67% cook once or
more each week
57% influence recipes
and meal ideas
51% do a top-up shop once or twice
per week
Co
pyr
igh
t ©
2012
Th
e N
iels
en C
om
pan
y. C
on
fid
enti
al a
nd
pro
pri
etar
y.
32
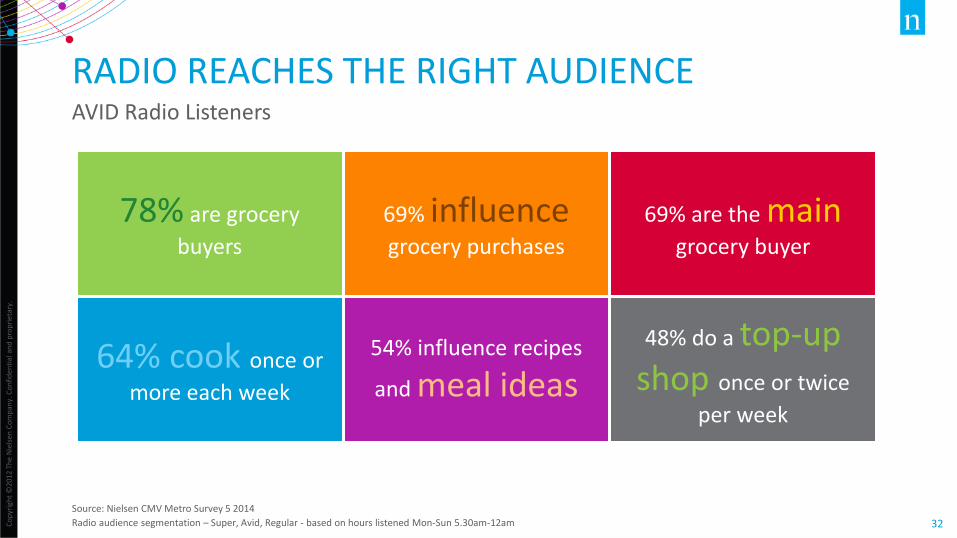
RADIO REACHES THE RIGHT AUDIENCE AVID Radio Listeners
Source: Nielsen CMV Metro Survey 5 2014
Radio audience segmentation – Super, Avid, Regular - based on hours listened Mon-Sun 5.30am-12am
78% are grocery
buyers
69% influence grocery purchases
69% are the main grocery buyer
64% cook once or
more each week
54% influence recipes
and meal ideas
48% do a top-up shop once or twice
per week

Co
pyr
igh
t ©
2012
Th
e N
iels
en C
om
pan
y. C
on
fid
enti
al a
nd
pro
pri
etar
y.
33
RADIO REACHES THE RIGHT AUDIENCE REGULAR Radio Listeners
Source: Nielsen CMV Metro Survey 5 2014
Radio audience segmentation – Super, Avid, Regular - based on hours listened Mon-Sun 5.30am-12am
74% are grocery
buyers
67% influence grocery purchases
65% are the main grocery buyer
60% cook once or
more each week
51% influence recipes
and meal ideas
47% do a top-up shop once or twice
per week