Consumer Discretionary - S&P Global
15
Index Education Contributor Louis Bellucci Associate Director Product Management U.S. Equities [email protected] Sector Primer Series: Consumer Discretionary INTRODUCTION The Global Industry Classification Standard ® (GICS ® ) assigns a company to a single business classification according to its principal business activity. This assignment uses quantitative and qualitative factors, including revenues, earnings, and market perception. The sector is the first level of the four-tiered, hierarchical industry classification system that includes 11 sectors, 24 industry groups, 69 industries, and 158 sub-industries. GICS was developed in 1999 and is jointly managed by S&P Dow Jones Indices and MSCI. The Consumer Discretionary sector comprises companies primarily engaged in: Manufacturing consumer products including durables, leisure products, apparel, and luxury goods; Retail, as distributors, internet and direct marketing retailers, specialty retailers, and multiline retailers such as department stores; Providing consumer services such as restaurants, hotels, resorts, and casinos; and Manufacturing automobiles and automobile components. Register to receive our latest research, education, and commentary at go.spdji.com/SignUp.
Transcript of Consumer Discretionary - S&P Global

Index Education
Contributor
Louis Bellucci
Associate Director
Product Management
U.S. Equities
Sector Primer Series: Consumer Discretionary
INTRODUCTION
The Global Industry Classification Standard® (GICS®) assigns a company to
a single business classification according to its principal business activity.
This assignment uses quantitative and qualitative factors, including
revenues, earnings, and market perception. The sector is the first level of
the four-tiered, hierarchical industry classification system that includes 11
sectors, 24 industry groups, 69 industries, and 158 sub-industries. GICS
was developed in 1999 and is jointly managed by S&P Dow Jones Indices
and MSCI.
The Consumer Discretionary sector comprises companies primarily
engaged in:
Manufacturing consumer products including durables, leisure
products, apparel, and luxury goods;
Retail, as distributors, internet and direct marketing retailers,
specialty retailers, and multiline retailers such as department stores;
Providing consumer services such as restaurants, hotels, resorts,
and casinos; and
Manufacturing automobiles and automobile components.
Register to receive our latest research, education, and commentary at go.spdji.com/SignUp.

Sector Primer Series: Consumer Discretionary June 2019
INDEX EDUCATION | Equity 101 2
Exhibit 1: GICS of the Consumer Discretionary Sector
SECTOR INDUSTRY GROUP INDUSTRY SUB-INDUSTRY
Consumer Discretionary Code (25)
Automobiles & Components Code (2510)
Auto Components Code (251010)
Auto Parts & Equipment Code (25101010)
Tires & Rubber Code (25101020)
Automobiles Code (251020)
Automobile Manufacturers Code (25102010)
Motorcycle Manufacturers Code (25102020)
Consumer Durables & Apparel Code (2520)
Household Durables Code (252010)
Consumer Electronics Code (25201010)
Home Furnishings Code (25201020)
Homebuilding Code (25201030)
Household Appliances Code (25201040)
Housewares & Specialties Code (25201050)
Leisure Products Code (252020)
Leisure Products Code (25202010)
Textiles, Apparel & Luxury Goods Code (252030)
Apparel, Accessories & Luxury Goods Code (25203010)
Footwear Code (25203020)
Textiles Code (25203030)
Consumer Services Code (2530)
Hotels, Restaurants & Leisure Code (253010)
Casinos & Gaming Code (25301010)
Hotels, Resorts & Cruise Lines Code (25301020)
Leisure Facilities Code (25301030)
Restaurants Code (25301040)
Diversified Consumer Services Code (253020)
Education Services Code (25302010)
Specialized Consumer Services Code (25302020)
Retailing Code (2550)
Distributors Code (255010)
Distributors Code (25501010)
Internet & Direct Marketing Retail Code (255020)
Internet & Direct Marketing Retail Code (25502020)
Multiline Retail Code (255030)
Department Stores Code (25503010)
General Merchandise Stores Code (25503020)
Specialty Retail Code (255040)
Apparel Retail Code (25504010)
Computer & Electronics Retail Code (25504020)
Home Improvement Retail Code (25504030)
Specialty Stores Code (25504040)
Automotive Retail Code (25504050)
Homefurnishing Retail Code (25504060)
Source: S&P Dow Jones Indices LLC, MSCI. Data as of Dec. 31, 2018. Table is provided for illustrative purposes.
Sector Primer Series: Consumer Discretionary June 2019
INDEX EDUCATION | Equity 101 3
COMPOSITION
The S&P 500 Consumer Discretionary comprises all companies in the S&P
500 included in the sector by GICS. Created in 1957, the S&P 500 was the
first broad U.S. market-cap-weighted stock market index. Today, it is the
basis of many listed and over-the-counter investment instruments.
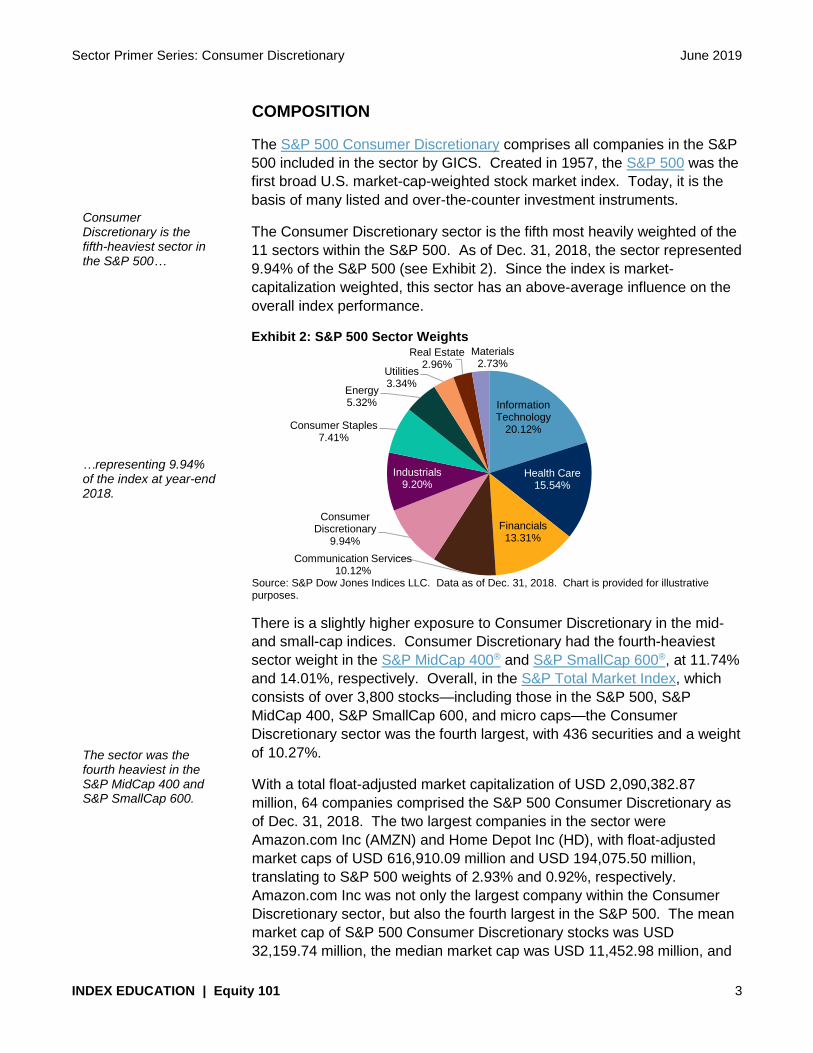
The Consumer Discretionary sector is the fifth most heavily weighted of the
11 sectors within the S&P 500. As of Dec. 31, 2018, the sector represented
9.94% of the S&P 500 (see Exhibit 2). Since the index is market-
capitalization weighted, this sector has an above-average influence on the
overall index performance.
Exhibit 2: S&P 500 Sector Weights
Source: S&P Dow Jones Indices LLC. Data as of Dec. 31, 2018. Chart is provided for illustrative purposes.
There is a slightly higher exposure to Consumer Discretionary in the mid-
and small-cap indices. Consumer Discretionary had the fourth-heaviest
sector weight in the S&P MidCap 400® and S&P SmallCap 600®, at 11.74%
and 14.01%, respectively. Overall, in the S&P Total Market Index, which
consists of over 3,800 stocks—including those in the S&P 500, S&P
MidCap 400, S&P SmallCap 600, and micro caps—the Consumer
Discretionary sector was the fourth largest, with 436 securities and a weight
of 10.27%.
With a total float-adjusted market capitalization of USD 2,090,382.87
million, 64 companies comprised the S&P 500 Consumer Discretionary as
of Dec. 31, 2018. The two largest companies in the sector were
Amazon.com Inc (AMZN) and Home Depot Inc (HD), with float-adjusted
market caps of USD 616,910.09 million and USD 194,075.50 million,
translating to S&P 500 weights of 2.93% and 0.92%, respectively.
Amazon.com Inc was not only the largest company within the Consumer
Discretionary sector, but also the fourth largest in the S&P 500. The mean
market cap of S&P 500 Consumer Discretionary stocks was USD
32,159.74 million, the median market cap was USD 11,452.98 million, and
Information Technology
20.12%
Health Care15.54%
Financials13.31%
Communication Services10.12%
Consumer Discretionary
9.94%
Industrials9.20%
Consumer Staples7.41%
Energy5.32%
Utilities3.34%
Real Estate2.96%
Materials2.73%
Consumer Discretionary is the fifth-heaviest sector in the S&P 500… …representing 9.94% of the index at year-end 2018. The sector was the fourth heaviest in the S&P MidCap 400 and S&P SmallCap 600.

Sector Primer Series: Consumer Discretionary June 2019
INDEX EDUCATION | Equity 101 4
the minimum market cap was USD 3,110.39 million. The top 10 Consumer
Discretionary holdings made up 67.45% of the sector (see Exhibit 3).
Exhibit 3: Snapshot of the Top 10 Holdings in the S&P 500 Consumer Discretionary
CONSTITUENT NAME TICKER S&P 500 WEIGHT (%) S&P 500 CONSUMER
DISCRETIONARY INDEX WEIGHT (%)
Amazon.com Inc AMZN 2.93 29.51
Home Depot Inc HD 0.92 9.28
McDonald's Corp MCD 0.65 6.55
NIKE Inc NKE 0.45 4.52
Starbucks Corp SBUX 0.38 3.82
Booking Holdings Inc BKNG 0.38 3.82
Lowe's Cos Inc LOW 0.35 3.55
TJX Cos Inc TJX 0.26 2.65
General Motors Company
GM 0.21 2.10
Target Corp TGT 0.16 1.65
Total 6.71 67.45
Source: S&P Dow Jones Indices LLC. Data as of Dec. 31, 2018. Table is provided for illustrative purposes.
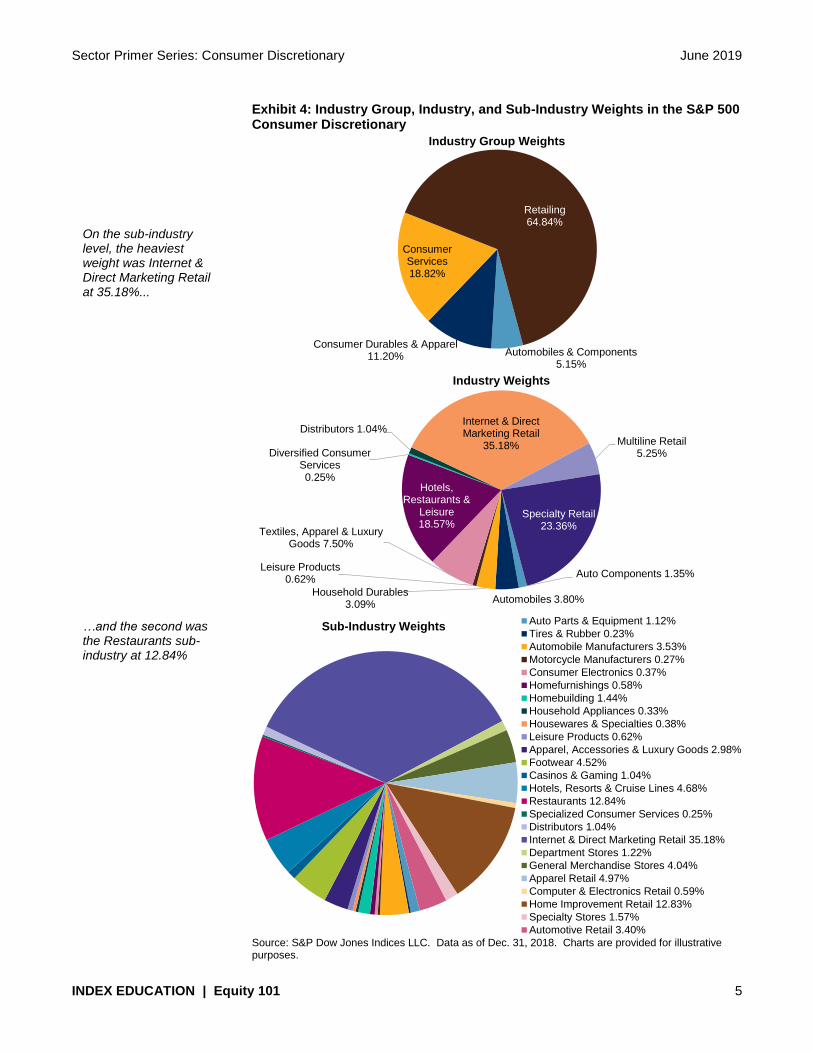
Within the S&P 500 Consumer Discretionary, Retailing was the heaviest of
the four industry groups. As of Dec. 31, 2018, it was approximately 65% of
the sector, Consumer Services was 19%, Consumer Durables & Apparel
was 11%, and Automobiles & Components accounted for the remaining
5%. The two largest industries were Internet & Direct Marketing Retail
(35%) and Specialty Retail (23%), both in the Retailing industry group.
On the sub-industry level, the heaviest weight was Internet & Direct
Marketing Retail at 35.18%, consisting of retail service providers primarily
on the Internet, through mail order, and TV home shopping. Also included
were companies providing online marketplaces for consumer products and
services, such as Amazon.com Inc. The second-heaviest weight was the
Restaurants sub-industry at 12.84%, defined as owners and operators of
restaurants, bars, pubs, fast-food and take-out facilities, and companies
that provide food catering services. The largest company classified in the
Restaurants sub-industry was McDonald's Corp (MCD). The third-heaviest
sub-industry was Home Improvement Retail, at 12.83%, consisting of only
two companies, Home Depot Inc and Lowe’s Cos Inc (LOW).
The two largest companies in the sector were Amazon and Home Depot… …translating to S&P 500 weights of 2.93% and 0.92%, respectively. Retailing had the heaviest of the four industry group weights, with approximately 65% of the sector.
Sector Primer Series: Consumer Discretionary June 2019
INDEX EDUCATION | Equity 101 5
Exhibit 4: Industry Group, Industry, and Sub-Industry Weights in the S&P 500 Consumer Discretionary
Source: S&P Dow Jones Indices LLC. Data as of Dec. 31, 2018. Charts are provided for illustrative purposes.
Automobiles & Components5.15%
Consumer Durables & Apparel11.20%
Consumer Services18.82%
Retailing64.84%
Industry Group Weights
Auto Components 1.35%
Automobiles 3.80%Household Durables
3.09%
Leisure Products 0.62%
Textiles, Apparel & Luxury Goods 7.50%
Hotels, Restaurants &
Leisure18.57%
Diversified Consumer Services 0.25%
Distributors 1.04%Internet & Direct Marketing Retail
35.18% Multiline Retail5.25%
Specialty Retail23.36%
Industry Weights
Sub-Industry WeightsAuto Parts & Equipment 1.12%
Tires & Rubber 0.23%
Automobile Manufacturers 3.53%
Motorcycle Manufacturers 0.27%
Consumer Electronics 0.37%
Homefurnishings 0.58%
Homebuilding 1.44%
Household Appliances 0.33%
Housewares & Specialties 0.38%
Leisure Products 0.62%
Apparel, Accessories & Luxury Goods 2.98%
Footwear 4.52%
Casinos & Gaming 1.04%
Hotels, Resorts & Cruise Lines 4.68%
Restaurants 12.84%
Specialized Consumer Services 0.25%
Distributors 1.04%
Internet & Direct Marketing Retail 35.18%
Department Stores 1.22%
General Merchandise Stores 4.04%
Apparel Retail 4.97%
Computer & Electronics Retail 0.59%
Home Improvement Retail 12.83%
Specialty Stores 1.57%
Automotive Retail 3.40%
On the sub-industry level, the heaviest weight was Internet & Direct Marketing Retail at 35.18%... …and the second was the Restaurants sub-industry at 12.84%
Sector Primer Series: Consumer Discretionary June 2019
INDEX EDUCATION | Equity 101 6
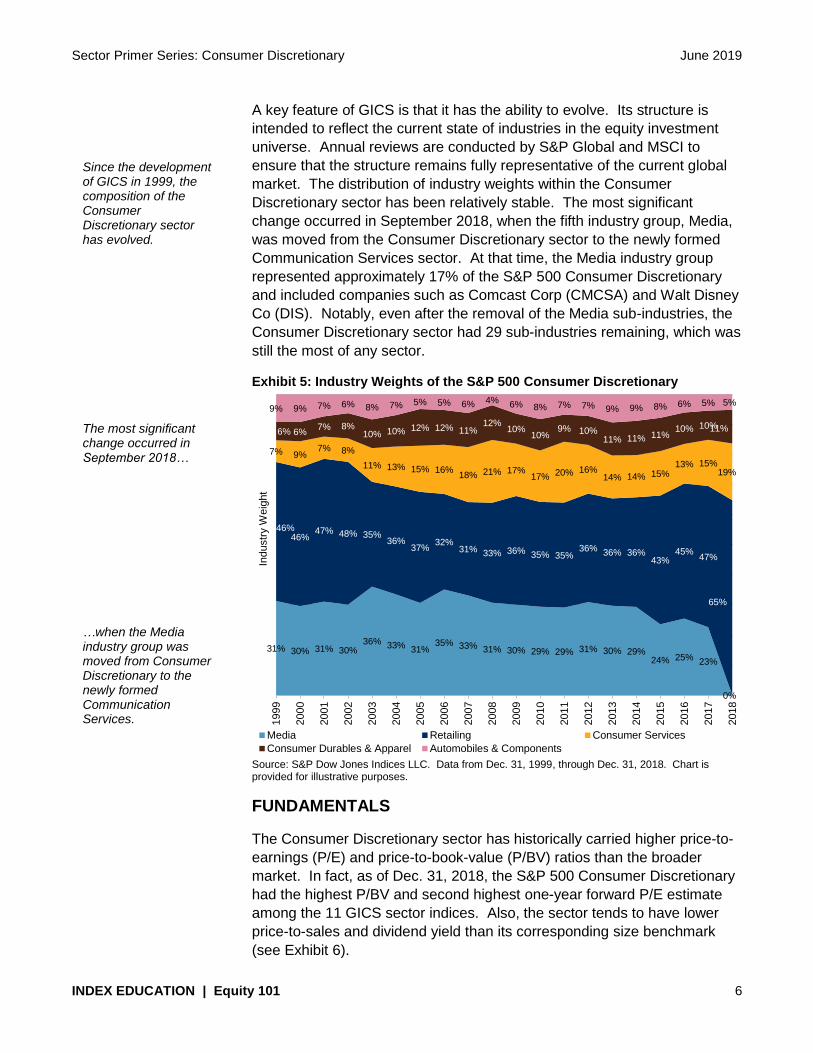
A key feature of GICS is that it has the ability to evolve. Its structure is
intended to reflect the current state of industries in the equity investment
universe. Annual reviews are conducted by S&P Global and MSCI to
ensure that the structure remains fully representative of the current global
market. The distribution of industry weights within the Consumer
Discretionary sector has been relatively stable. The most significant
change occurred in September 2018, when the fifth industry group, Media,
was moved from the Consumer Discretionary sector to the newly formed
Communication Services sector. At that time, the Media industry group
represented approximately 17% of the S&P 500 Consumer Discretionary
and included companies such as Comcast Corp (CMCSA) and Walt Disney
Co (DIS). Notably, even after the removal of the Media sub-industries, the
Consumer Discretionary sector had 29 sub-industries remaining, which was
still the most of any sector.
Exhibit 5: Industry Weights of the S&P 500 Consumer Discretionary
Source: S&P Dow Jones Indices LLC. Data from Dec. 31, 1999, through Dec. 31, 2018. Chart is provided for illustrative purposes.
FUNDAMENTALS
The Consumer Discretionary sector has historically carried higher price-to-
earnings (P/E) and price-to-book-value (P/BV) ratios than the broader
market. In fact, as of Dec. 31, 2018, the S&P 500 Consumer Discretionary
had the highest P/BV and second highest one-year forward P/E estimate
among the 11 GICS sector indices. Also, the sector tends to have lower
price-to-sales and dividend yield than its corresponding size benchmark
(see Exhibit 6).
31% 30% 31% 30%36% 33% 31%
35% 33% 31% 30% 29% 29% 31% 30% 29%24% 25% 23%
0%
46%46%
47% 48% 35%36%
37%32%
31% 33% 36% 35% 35%36% 36% 36%
43%45%
47%
65%
7% 9%7% 8%
11% 13% 15% 16%18% 21% 17%
17% 20% 16%14% 14% 15%
13% 15%19%
6% 6%7% 8%
10% 10% 12% 12% 11%12%
10%10%
9% 10%11% 11% 11%
10% 10%11%
9% 9% 7% 6% 8% 7% 5% 5% 6% 4% 6% 8% 7% 7% 9% 9% 8% 6% 5% 5%
1999
2000
2001
2002
2003
2004
2005
2006
2007
2008
2009
2010
2011
2012
2013
2014
2015
2016
2017
2018
Industr
y W
eig
ht
Media Retailing Consumer Services
Consumer Durables & Apparel Automobiles & Components
Since the development of GICS in 1999, the composition of the Consumer Discretionary sector has evolved. The most significant change occurred in September 2018… …when the Media industry group was moved from Consumer Discretionary to the newly formed Communication Services.

Sector Primer Series: Consumer Discretionary June 2019
INDEX EDUCATION | Equity 101 7
Exhibit 6: Fundamental Data Comparison
INDEX 12-MONTH TRAILING
P/E
ONE-YEAR FORWARD
P/E P/BV
PRICE-TO-
SALES
INDICATED DIVIDEND YIELD (%)
S&P 500 18.94 15.55 3.00 1.87 2.23
S&P 500 Consumer Discretionary
23.77 19.44 6.64 1.48 1.49
S&P MidCap 400 23.27 15.45 2.00 1.11 1.90
S&P MidCap 400 Consumer Discretionary
17.17 13.09 3.63 0.79 1.67
S&P SmallCap 600 36.24 17.11 1.81 0.84 1.76
S&P SmallCap 600 Consumer Discretionary
29.95 14.07 2.11 0.48 1.52
Source: S&P Dow Jones Indices LLC. Data as of Dec. 31, 2018. Past performance is no guarantee of future results. Table is provided for illustrative purposes.
Consumer Discretionary sector companies tend to be historically mixed
across growth and value, with some years tilted overall toward growth and
other years toward value. For the 10-year period ending in 2018, large-cap
Consumer Discretionary companies were tilted toward growth in six years,
by as much as 65%, and four years toward value, by as much as 60% (see
Exhibit 7). Mid-cap Consumer Discretionary companies tended to
consistently be more evenly split across growth and value, while small-cap
was tilted toward value in all 10 years between 2009 and 2018. As of Dec.
31, 2018, S&P 500 Consumer Discretionary companies averaged 60%
value and 40% growth. The average was 54% value and 46% growth for
Consumer Discretionary companies in the S&P MidCap 400 and 62% value
and 38% growth in the S&P SmallCap 600.
Exhibit 7: Growth and Value Factor Tilts of the Large-, Mid-, and Small-Cap Consumer Discretionary Indices
Source: S&P Dow Jones Indices LLC. Data as of Dec. 31, 2009 through Dec. 31, 2018. Chart is provided for illustrative purposes.
54% 53%65% 58% 56% 55%
65% 66% 66% 62%
46% 47%35% 42% 44% 45%
35% 34% 34% 38%
48% 46%60%
42% 50% 52% 61% 51% 52% 54%
52% 54%40%
58% 50% 48% 39% 49% 48% 46%
53%39%
52%38% 35% 42% 48% 45%
60% 60%
47%61%
48%62% 65% 58% 52% 55%
40% 40%
2009 2010 2011 2012 2013 2014 2015 2016 2017 2018
Growth
Value
Growth
Value
Growth
Value
S&
P S
mallC
ap
600
S&
P M
idC
ap
400
S&
P 5
00
The Consumer Discretionary sector tends to be mixed across growth and value… …averaging 60% value and 40% growth at the end of 2018.

Sector Primer Series: Consumer Discretionary June 2019
INDEX EDUCATION | Equity 101 8
Consumer Discretionary companies are approximately on par with the
broader market as far as how insulated their revenue is from regions
outside the U.S., according to data from the FactSet Geographic Revenue
Exposure (GeoRev™) database. Generally, if international exposure is a
goal, large-cap companies do the most global business. As of Dec. 31,
2018, S&P 500 Consumer Discretionary companies had an average U.S.
revenue exposure of 69%. Mid- and small-cap Consumer Discretionary
companies were more insulated from foreign markets, with averages of
approximately 82% and 85%, respectively, of revenue sourced domestically
(see Exhibit 8).
Exhibit 8: Average U.S. Revenue Exposure
Source: S&P Dow Jones Indices LLC, FactSet GeoRev database. Data as of Dec. 31, 2018. Chart is provided for illustrative purposes.
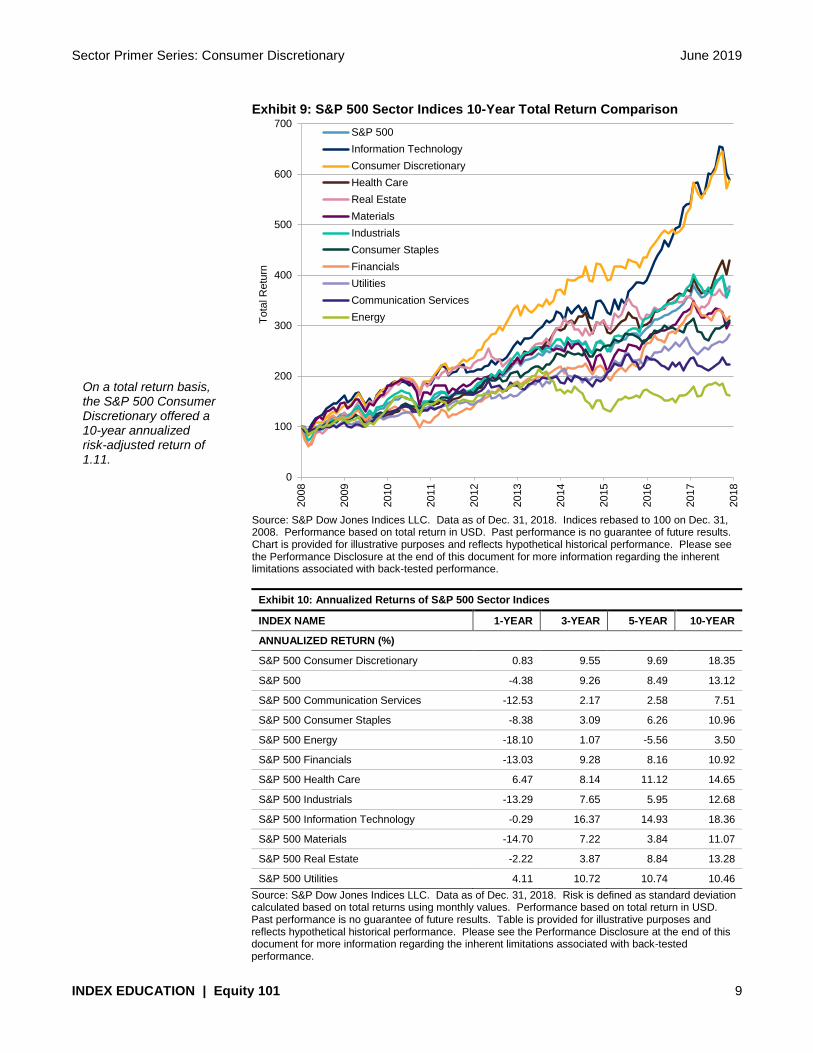
PERFORMANCE
Over the 10-year period ending in 2018, Consumer Discretionary was one
of the top-performing of the 11 GICS sectors. The 18.35% 10-year
annualized return was second best, narrowly behind the 18.36% return of
Information Technology (see Exhibit 9). Consumer Discretionary
outperformed the S&P 500, which as a whole had a 10-year annualized
return of 13.12%. In terms of risk, defined by standard deviation and
calculated based on the total returns of monthly values, Consumer
Discretionary was the sixth highest. On a total return basis, the S&P 500
Consumer Discretionary offered a 10-year annualized risk-adjusted return
of 1.11, which was the second best (see Exhibit 10).
69% 69%76%
82% 80% 85%
0%
10%
20%
30%
40%
50%
60%
70%
80%
90%
S&P 500 S&P 500Consumer
DiscretionaryIndex
S&P MidCap400
S&P MidCap400 ConsumerDiscretionary
Index
S&P SmallCap600
S&P SmallCap600 ConsumerDiscretionary
Index
Avera
ge U
.S. R
evenue E
xposure
Over the past 10 years, Consumer Discretionary was one of the top performing of the 11 GICS sectors… …outperforming the S&P 500, with a 10-year annualized return of 18.35%, compared with the S&P 500’s 13.12%.
Sector Primer Series: Consumer Discretionary June 2019
INDEX EDUCATION | Equity 101 9
Exhibit 9: S&P 500 Sector Indices 10-Year Total Return Comparison
Source: S&P Dow Jones Indices LLC. Data as of Dec. 31, 2018. Indices rebased to 100 on Dec. 31, 2008. Performance based on total return in USD. Past performance is no guarantee of future results. Chart is provided for illustrative purposes and reflects hypothetical historical performance. Please see the Performance Disclosure at the end of this document for more information regarding the inherent limitations associated with back-tested performance.
Exhibit 10: Annualized Returns of S&P 500 Sector Indices
INDEX NAME 1-YEAR 3-YEAR 5-YEAR 10-YEAR
ANNUALIZED RETURN (%)
S&P 500 Consumer Discretionary 0.83 9.55 9.69 18.35
S&P 500 -4.38 9.26 8.49 13.12
S&P 500 Communication Services -12.53 2.17 2.58 7.51
S&P 500 Consumer Staples -8.38 3.09 6.26 10.96
S&P 500 Energy -18.10 1.07 -5.56 3.50
S&P 500 Financials -13.03 9.28 8.16 10.92
S&P 500 Health Care 6.47 8.14 11.12 14.65
S&P 500 Industrials -13.29 7.65 5.95 12.68
S&P 500 Information Technology -0.29 16.37 14.93 18.36
S&P 500 Materials -14.70 7.22 3.84 11.07
S&P 500 Real Estate -2.22 3.87 8.84 13.28
S&P 500 Utilities 4.11 10.72 10.74 10.46
Source: S&P Dow Jones Indices LLC. Data as of Dec. 31, 2018. Risk is defined as standard deviation calculated based on total returns using monthly values. Performance based on total return in USD. Past performance is no guarantee of future results. Table is provided for illustrative purposes and reflects hypothetical historical performance. Please see the Performance Disclosure at the end of this document for more information regarding the inherent limitations associated with back-tested performance.
0
100
200
300
400
500
600
700
2008
2009
2010
2011
2012
2013
2014
2015
2016
2017
2018
To
tal R
etu
rn
S&P 500
Information Technology
Consumer Discretionary
Health Care
Real Estate
Materials
Industrials
Consumer Staples
Financials
Utilities
Communication Services
Energy
On a total return basis, the S&P 500 Consumer Discretionary offered a 10-year annualized risk-adjusted return of 1.11.

Sector Primer Series: Consumer Discretionary June 2019
INDEX EDUCATION | Equity 101 10
Exhibit 10: Annualized Returns of S&P 500 Sector Indices (cont.)
INDEX NAME 1-YEAR 3-YEAR 5-YEAR 10-YEAR
RISK
S&P 500 Consumer Discretionary 19.89 13.58 13.69 16.54
S&P 500 15.33 10.95 10.94 13.60
S&P 500 Communication Services 13.60 15.90 14.40 14.54
S&P 500 Consumer Staples 15.13 11.39 11.35 11.32
S&P 500 Energy 23.75 18.71 18.95 19.33
S&P 500 Financials 16.57 16.46 14.69 21.95
S&P 500 Health Care 18.47 13.69 13.06 13.33
S&P 500 Industrials 20.11 14.59 13.53 18.11
S&P 500 Information Technology 18.65 15.29 14.53 16.10
S&P 500 Materials 15.36 14.51 15.34 19.50
S&P 500 Real Estate 14.46 13.01 13.08 21.48
S&P 500 Utilities 9.80 12.39 12.78 12.62
ANNUALIZED RISK-ADJUSTED RETURNS
S&P 500 Consumer Discretionary 0.04 0.70 0.71 1.11
S&P 500 -0.29 0.85 0.78 0.96
S&P 500 Communication Services -0.92 0.14 0.18 0.52
S&P 500 Consumer Staples -0.55 0.27 0.55 0.97
S&P 500 Energy -0.76 0.06 -0.29 0.18
S&P 500 Financials -0.79 0.56 0.56 0.50
S&P 500 Health Care 0.35 0.59 0.85 1.10
S&P 500 Industrials -0.66 0.52 0.44 0.70
S&P 500 Information Technology -0.02 1.07 1.03 1.14
S&P 500 Materials -0.96 0.50 0.25 0.57
S&P 500 Real Estate -0.15 0.30 0.68 0.62
S&P 500 Utilities 0.42 0.86 0.84 0.83
Source: S&P Dow Jones Indices LLC. Data as of Dec. 31, 2018. Risk is defined as standard deviation calculated based on total returns using monthly values. Performance based on total return in USD. Past performance is no guarantee of future results. Table is provided for illustrative purposes and reflects hypothetical historical performance. Please see the Performance Disclosure at the end of this document for more information regarding the inherent limitations associated with back-tested performance.
The Consumer Discretionary sector has been most highly correlated with
Industrials and least correlated with Utilities. Exhibit 11 shows that as of
Dec. 31, 2018, the S&P 500 Consumer Discretionary had a correlation of
0.89 with the S&P 500 Industrials, based on 10 years of monthly returns.
The correlation was 0.24 with the S&P 500 Utilities. Correlation with other
major country indices also varied. Outside of the U.S., the S&P 500
Consumer Discretionary was most highly correlated with the S&P
Developed Ex-U.S. BMI (0.79) and S&P Germany BMI (0.78). It was least
correlated with the S&P China BMI (0.59).
Consumer Discretionary has been most highly correlated with Industrials and least correlated with Utilities. Outside of the U.S., the S&P 500 Consumer Discretionary was most highly correlated with the S&P Developed Ex-U.S. BMI.

Sector Primer Series: Consumer Discretionary June 2019
INDEX EDUCATION | Equity 101 11
Exhibit 11: Correlations of the S&P 500 Consumer Discretionary
S&P 500 SECTOR (TR) CORRELATION INDEX (TR) CORRELATION
Industrials 0.89 S&P Developed Ex-U.S. BMI 0.79
Materials 0.83 S&P Germany BMI 0.78
Information Technology
0.83 S&P Global Ex-U.S. BMI 0.78
Financials 0.80 S&P United Kingdom BMI 0.74
Real Estate 0.70 S&P France BMI 0.73
Health Care 0.67 S&P Australia BMI 0.70
Energy 0.63 S&P Canada BMI 0.70
Consumer Staples 0.62 S&P Switzerland BMI 0.69
Communication Services
0.47 S&P Korea BMI 0.68
Utilities 0.24 S&P Emerging BMI 0.66
S&P Japan BMI 0.61
S&P China BMI 0.59
S&P United States BMI 0.93
S&P 500 0.92
S&P MidCap 400 0.91
S&P Developed BMI 0.88
S&P SmallCap 600 0.87
S&P Global BMI 0.87
Source: S&P Dow Jones Indices LLC. Correlations based on monthly total return data from January 2009 to December 2018. Past performance is no guarantee of future results. Table is provided for illustrative purposes and reflects hypothetical historical performance. Please see the Performance Disclosure at the end of this document for more information regarding the inherent limitations associated with back-tested performance.
Performance of various industry group, industry, and sub-industry buckets
within the Consumer Discretionary sector can vary. These groupings,
based on qualitative and quantitative factors, are increasingly more specific
to the types of companies included. Exhibit 12 shows the annualized
returns of the company groupings within the Consumer Discretionary
sector.
The S&P 500 Consumer Discretionary was least correlated with the S&P China BMI

Sector Primer Series: Consumer Discretionary June 2019
INDEX EDUCATION | Equity 101 12
Exhibit 12: Annualized Returns of the S&P 500 Consumer Discretionary GICS Subindices
INDEX ANNUALIZED RETURN (%)
1-YEAR 3-YEAR 5-YEAR 10-YEAR
S&P 500 Consumer Discretionary 0.83 9.55 9.69 18.35
INDUSTRY GROUP
S&P 500 Automobiles & Components -26.01 -4.02 -3.33 13.16
S&P 500 Consumer Durables & Apparel -11.96 -0.56 1.30 13.06
S&P 500 Consumer Services -1.43 10.58 10.88 15.23
S&P 500 Retailing 13.46 16.10 16.91 22.92
INDUSTRY
S&P 500 Auto Components -29.45 -1.71 -0.72 12.09
S&P 500 Automobiles -24.66 -4.60 -4.41 14.91
S&P 500 Household Durables -34.18 -5.69 -0.09 13.78
S&P 500 Leisure Products -17.31 -6.69 -7.81 6.17
S&P 500 Textiles, Apparel & Luxury Goods 2.65 2.44 2.98 14.69
S&P 500 Hotels Restaurants & Leisure -1.46 10.89 11.06 16.56
S&P 500 Diversified Consumer Services 0.52 -5.28 0.38 -3.11
S&P 500 Distributors -17.93 1.63 2.70 11.63
S&P 500 Internet & Direct Marketing Retail 26.65 26.75 26.26 40.18
S&P 500 Multiline Retail 6.08 5.86 5.21 11.84
S&P 500 Specialty Retail -0.27 7.53 11.07 18.52
SUB-INDUSTRY
S&P 500 Auto Parts & Equipment -27.93 1.31 0.34 12.26
S&P 500 Tires & Rubber -35.37 -13.15 -1.79 13.85
S&P 500 Automobile Manufacturers -24.16 -4.48 -3.72 16.68
S&P 500 Motorcycle Manufacturers -30.52 -6.21 -10.87 9.52
S&P 500 Consumer Electronics 9.83 19.46 11.83 20.56
S&P 500 Home Furnishings -48.40 -10.70 -1.09 9.76
S&P 500 Homebuilding -32.25 2.32 5.32 13.78
S&P 500 Household Appliances -34.50 -7.58 -5.15 12.48
S&P 500 Housewares & Specialties -37.52 -23.11 -8.47 9.99
S&P 500 Leisure Products -17.31 -6.69 -7.81 7.08
S&P 500 Apparel, Accessories & Luxury Goods -15.76 -3.44 -7.07 9.76
S&P 500 Footwear 19.86 7.14 14.87 20.88
S&P 500 Casinos & Gaming -32.99 14.32 -11.43 7.56
S&P 500 Hotels, Resorts & Cruise Lines -18.06 9.51 11.10 18.10
S&P 500 Restaurants 10.57 12.71 13.24 17.03
S&P 500 Specialized Consumer Services 0.52 -5.28 0.47 4.76
S&P 500 Distributors -17.93 1.63 2.70 11.63
S&P 500 Internet & Direct Marketing Retail 26.65 26.75 26.26 40.18
S&P 500 Department Stores 19.34 6.00 -1.05 9.48
S&P 500 General Merchandise Stores 2.57 5.82 7.89 12.51
S&P 500 Apparel Retail 1.84 3.93 6.33 21.49
S&P 500 Computer & Electronics Retail -20.60 24.81 7.85 10.28
S&P 500 Home Improvement Retail -5.11 10.73 17.46 22.43
S&P 500 Specialty Stores -2.41 -0.55 -1.71 3.17
S&P 500 Automotive Retail 27.64 5.85 12.73 21.42
Source: S&P Dow Jones Indices LLC. Data as of Dec. 31, 2018. Past performance is no guarantee of future results. Table is provided for illustrative purposes.
The S&P 500 Consumer Discretionary had a 10-year annualized return of 18.35%.

Sector Primer Series: Consumer Discretionary June 2019
INDEX EDUCATION | Equity 101 13
CONCLUSION
As of Dec. 31, 2018, the S&P 500 Consumer Discretionary had the second-
best 10-year annualized return of the 11 GICS sector indices. Consumer
Discretionary was the fifth largest of the 11 GICS sectors in the U.S. market
and accounted for approximately 10% of the weight of the S&P 500. Within
the sector, Retailing has historically been the highest-weighted industry
group, with Internet & Direct Marketing Retail the largest industry and sub-
industry. Amazon.com Inc was the largest Consumer Discretionary
company—over three times larger than the second largest. In the mid- and
small-cap segments, Consumer Discretionary was the third heaviest-
weighted sector, at 12% and 14%, respectively. A closer look at the
sector’s characteristics provides further insights into the investment profile.
Companies from the Consumer Discretionary sector on average were tilted
toward value as of Dec. 31, 2018. Historically, they tended to vary between
growth and value, with large caps tilting toward growth 6 of the preceding
10 years, mid caps more evenly split between growth and value, and small
caps consistently maintaining a tilt towards value. The sector has foreign
revenue exposure similar to the broader market benchmarks. Additionally,
Consumer Discretionary has varying correlations with different sectors and
countries, with highest correlations to the Industrials sector and Germany,
respectively.
Consumer Discretionary was not only the fifth largest of the 11 GICS sectors in the U.S. market… …but it also had the second-best 10-year annualized return of the 11 GICS sector indices.

Sector Primer Series: Consumer Discretionary June 2019
INDEX EDUCATION | Equity 101 14
PERFORMANCE DISCLOSURE
The S&P 500 Real Estate was launched September 19, 2016. All information presented prior to an index’s Launch Date is hypothetical (back-tested), not actual performance. The back-test calculations are based on the same methodology that was in effect on the index Launch Date. However, when creating back-tested history for periods of market anomalies or other periods that do not reflect the general current market environment, index methodology rules may be relaxed to capture a large enough universe of securities to simulate the target market the index is designed to measure or strategy the index is designed to capture. For example, market capitalization and liquidity thresholds may be reduced. Complete index methodology details are available at www.spdji.com. Past performance of the Index is not an indication of future results. Prospective application of the methodology used to construct the Index may not result in performance commensurate with the back-test returns shown.
S&P Dow Jones Indices defines various dates to assist our clients in providing transparency. The First Value Date is the first day for which there is a calculated value (either live or back-tested) for a given index. The Base Date is the date at which the Index is set at a fixed value for calculation purposes. The Launch Date designates the date upon which the values of an index are first considered live: index values provided for any date or time period prior to the index’s Launch Date are considered back-tested. S&P Dow Jones Indices defines the Launch Date as the date by which the values of an index are known to have been released to the public, for example via the company’s public website or its datafeed to external parties. For Dow Jones-branded indices introduced prior to May 31, 2013, the Launch Date (which prior to May 31, 2013, was termed “Date of introduction”) is set at a date upon which no further changes were permitted to be made to the index methodology, but that may have been prior to the Index’s public release date.
The back-test period does not necessarily correspond to the entire available history of the Index. Please refer to the methodology paper for the Index, available at www.spdji.com for more details about the index, including the manner in which it is rebalanced, the timing of such rebalancing, criteria for additions and deletions, as well as all index calculations.
Another limitation of using back-tested information is that the back-tested calculation is generally prepared with the benefit of hindsight. Back-tested information reflects the application of the index methodology and selection of index constituents in hindsight. No hypothetical record can completely account for the impact of financial risk in actual trading. For example, there are numerous factors related to the equities, fixed income, or commodities markets in general which cannot be, and have not been accounted for in the preparation of the index information set forth, all of which can affect actual performance.
The Index returns shown do not represent the results of actual trading of investable assets/securities. S&P Dow Jones Indices LLC maintains the Index and calculates the Index levels and performance shown or discussed, but does not manage actual assets. Index returns do not reflect payment of any sales charges or fees an investor may pay to purchase the securities underlying the Index or investment funds that are intended to track the performance of the Index. The imposition of these fees and charges would cause actual and back-tested performance of the securities/fund to be lower than the Index performance shown. As a simple example, if an index returned 10% on a US $100,000 investment for a 12-month period (or US $10,000) and an actual asset-based fee of 1.5% was imposed at the end of the period on the investment plus accrued interest (or US $1,650), the net return would be 8.35% (or US $8,350) for the year. Over a three year period, an annual 1.5% fee taken at year end with an assumed 10% return per year would result in a cumulative gross return of 33.10%, a total fee of US $5,375, and a cumulative net return of 27.2% (or US $27,200).
Sector Primer Series: Consumer Discretionary June 2019
INDEX EDUCATION | Equity 101 15
GENERAL DISCLAIMER
Copyright © 2019 S&P Dow Jones Indices LLC. All rights reserved. STANDARD & POOR’S, S&P, S&P 500, S&P 500 LOW VOLATILITY INDEX, S&P 100, S&P COMPOSITE 1500, S&P MIDCAP 400, S&P SMALLCAP 600, S&P GIVI, GLOBAL TITANS, DIVIDEND ARISTOCRATS, S&P TARGET DATE INDICES, GICS, SPIVA, SPDR and INDEXOLOGY are registered trademarks of Standard & Poor’s Financial Services LLC, a division of S&P Global (“S&P”). DOW JONES, DJ, DJIA and DOW JONES INDUSTRIAL AVERAGE are registered trademarks of Dow Jones Trademark Holdings LLC (“Dow Jones”). These trademarks together with others have been licensed to S&P Dow Jones Indices LLC. Redistribution or reproduction in whole or in part are prohibited without written permission of S&P Dow Jones Indices LLC. This document does not constitute an offer of services in jurisdictions where S&P Dow Jones Indices LLC, S&P, Dow Jones or their respective affiliates (collectively “S&P Dow Jones Indices”) do not have the necessary licenses. Except for certain custom index calculation services, all information provided by S&P Dow Jones Indices is impersonal and not tailored to the needs of any person, entity or group of persons. S&P Dow Jones Indices receives compensation in connection with licensing its indices to third parties and providing custom calculation services. Past performance of an index is not an indication or guarantee of future results.
It is not possible to invest directly in an index. Exposure to an asset class represented by an index may be available through investable instruments based on that index. S&P Dow Jones Indices does not sponsor, endorse, sell, promote or manage any investment fund or other investment vehicle that is offered by third parties and that seeks to provide an investment return based on the performance of any index. S&P Dow Jones Indices makes no assurance that investment products based on the index will accurately track index performance or provide positive investment returns. S&P Dow Jones Indices LLC is not an investment advisor, and S&P Dow Jones Indices makes no representation regarding the advisability of investing in any such investment fund or other investment vehicle. A decision to invest in any such investment fund or other investment vehicle should not be made in reliance on any of the statements set forth in this document. Prospective investors are advised to make an investment in any such fund or other vehicle only after carefully considering the risks associated with investing in such funds, as detailed in an offering memorandum or similar document that is prepared by or on behalf of the issuer of the investment fund or other investment product or vehicle. S&P Dow Jones Indices LLC is not a tax advisor. A tax advisor should be consulted to evaluate the impact of any tax-exempt securities on portfolios and the tax consequences of making any particular investment decision. Inclusion of a security within an index is not a recommendation by S&P Dow Jones Indices to buy, sell, or hold such security, nor is it considered to be investment advice. Closing prices for S&P Dow Jones Indices’ US benchmark indices are calculated by S&P Dow Jones Indices based on the closing price of the individual constituents of the index as set by their primary exchange. Closing prices are received by S&P Dow Jones Indices from one of its third party vendors and verified by comparing them with prices from an alternative vendor. The vendors receive the closing price from the primary exchanges. Real-time intraday prices are calculated similarly without a second verification.]
These materials have been prepared solely for informational purposes based upon information generally available to the public and from sources believed to be reliable. No content contained in these materials (including index data, ratings, credit-related analyses and data, research, valuations, model, software or other application or output therefrom) or any part thereof (“Content”) may be modified, reverse-engineered, reproduced or distributed in any form or by any means, or stored in a database or retrieval system, without the prior written permission of S&P Dow Jones Indices. The Content shall not be used for any unlawful or unauthorized purposes. S&P Dow Jones Indices and its third-party data providers and licensors (collectively “S&P Dow Jones Indices Parties”) do not guarantee the accuracy, completeness, timeliness or availability of the Content. S&P Dow Jones Indices Parties are not responsible for any errors or omissions, regardless of the cause, for the results obtained from the use of the Content. THE CONTENT IS PROVIDED ON AN “AS IS” BASIS. S&P DOW JONES INDICES PARTIES DISCLAIM ANY AND ALL EXPRESS OR IMPLIED WARRANTIES, INCLUDING, BUT NOT LIMITED TO, ANY WARRANTIES OF MERCHANTABILITY OR FITNESS FOR A PARTICULAR PURPOSE OR USE, FREEDOM FROM BUGS, SOFTWARE ERRORS OR DEFECTS, THAT THE CONTENT’S FUNCTIONING WILL BE UNINTERRUPTED OR THAT THE CONTENT WILL OPERATE WITH ANY SOFTWARE OR HARDWARE CONFIGURATION. In no event shall S&P Dow Jones Indices Parties be liable to any party for any direct, indirect, incidental, exemplary, compensatory, punitive, special or consequential damages, costs, expenses, legal fees, or losses (including, without limitation, lost income or lost profits and opportunity costs) in connection with any use of the Content even if advised of the possibility of such damages.
S&P Global keeps certain activities of its various divisions and business units separate from each other in order to preserve the independence and objectivity of their respective activities. As a result, certain divisions and business units of S&P Global may have information that is not available to other business units. S&P Global has established policies and procedures to maintain the confidentiality of certain non-public information received in connection with each analytical process.
In addition, S&P Dow Jones Indices provides a wide range of services to, or relating to, many organizations, including issuers of securities, investment advisers, broker-dealers, investment banks, other financial institutions and financial intermediaries, and accordingly may receive fees or other economic benefits from those organizations, including organizations whose securities or services they may recommend, rate, include in model portfolios, evaluate or otherwise address.
The Global Industry Classification Standard (GICS®) was developed by and is the exclusive property and a trademark of S&P and MSCI. Neither MSCI, S&P nor any other party involved in making or compiling any GICS classifications makes any express or implied warranties or representations with respect to such standard or classification (or the results to be obtained by the use thereof), and all such parties hereby expressly disclaim all warranties of originality, accuracy, completeness, merchantability or fitness for a particular purpose with respect to any of such standard or classification. Without limiting any of the foregoing, in no event shall MSCI, S&P, any of their affiliates or any third party involved in making or compiling any GICS classifications have any liability for any direct, indirect, special, punitive, consequential or any other damages (including lost profits) even if notified of the possibility of such damages.