CONSUMER ATTITUDE TOWARDS RESTAURANT SELECTION: A CASE...
73
CONSUMER ATTITUDE TOWARDS RESTAURANT SELECTION: A CASE STUDY OF OYSTER RESTAURANT AT NEW SATHORN AREA
Transcript of CONSUMER ATTITUDE TOWARDS RESTAURANT SELECTION: A CASE...

CONSUMER ATTITUDE TOWARDS RESTAURANT SELECTION: A CASE STUDY OF OYSTER RESTAURANT AT NEW SATHORN AREA
CONSUMER ATTITUDE TOWARDS RESTAURANT SELECTION: A CASE STUDY OF OYSTY RESTAURANT AT NEW SATHORN AREA
Wenqi Gao
An Independent Study Presented to The Graduate School of Bangkok University
In Partial Fulf illment of
the Requirements for the Degree Master of Business Administration
2009

2010 Wenqi Gao
All Rights Reserved

Gao Wenqi. Master of Business Administration, May 2010, Graduates School, Bangkok University A Study of Consumer Attitude Toward Restaurant Selection: Oyster Restaurant at New Sathorn Area (64 pp.) Advisor of Independent Study: Dr. Paul TJ James
ABSTRACT
This study aims to investigate the consumer’s attitude toward restaurant selection, and how these variables affect successful seafood restaurant. The example restaurant is located in the heart of Bangkok´s central business and well-organized the living earns. The restaurant is decorated with a style and character, trying to attract the costumer around this area with speciality food style and unique service. The methodology used in this study is the quantitative approach by descriptive research design in order to collect the pr imary data. In this research, the Fishbein’s multi-attribute attitude model and the Fazio’s MODE model were used to measure customer selection attitude and intention. The result of using multi-attribute attitude model from the study is that customer did not form positive attitude on selecting Oyster restaurant. There is a weak empirical relationship between consumer’s attitudes towards Oyster restaurant and their selection behavior . Next of measur ing customer selection attitude and intention, the result implies that there is high attendance opportunity exit for the restaurant.

v
TABLE OF CONTENTS
Page ABSTRACT iv CONTENTS v LIST OF TABLES viii LIST OF FIGURES ix CHAPTER 1: INTRODUCTION -------------------------------------------------------------1
Background --------------------------------------------------------------------- 1 Intention and Reason for Study----------------------------------------------- 3 Objective of the Study--------------------------------------------------------- 4 Major Research Questions --------------------------------------------------- 4 Assumption --------------------------------------------------------------------- 4 Scope of the Study-------------------------------------------------------------- 5 Significance of the Study-------------------------------------------------------5 Limitation of Research-------------------------------------------------------- 5
CHAPTER 2: LITERATURE REVIEW ---------------------------------------------------6
Introduction of Consumer Behavior---------------------------------------- 6 Consumer Behavior on Store Selection------------------------------------- 7 Definition of Consumer Attitude--------------------------------------------11 Development of Attitudes Model------------------------------------------ 14 Benefits of Attitude-Based Strategies-------------------------------------- 18 Conclusion -------------------------------------------------------------------- 19
vi
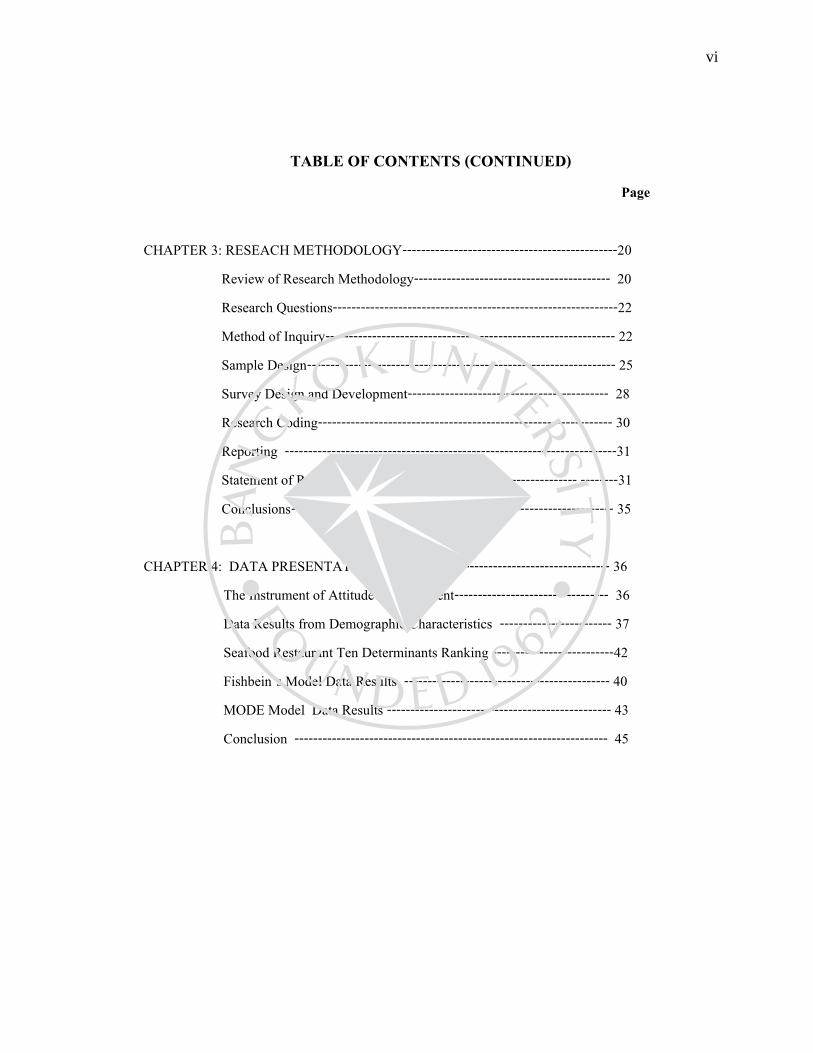
TABLE OF CONTENTS (CONTINUED) Page CHAPTER 3: RESEACH METHODOLOGY----------------------------------------------20
Review of Research Methodology------------------------------------------ 20 Research Questions-------------------------------------------------------------22 Method of Inquiry-------------------------------------------------------------- 22 Sample Design------------------------------------------------------------------ 25 Survey Design and Development------------------------------------------- 28 Research Coding--------------------------------------------------------------- 30 Reporting -----------------------------------------------------------------------31 Statement of Research Method Used-------------------------------- --------31 Conclusions--------------------------------------------------------------------- 35
CHAPTER 4: DATA PRESENTATION-------------------------------------------------- 36
The Instrument of Attitude Measurement--------------------------------- 36 Data Results from Demographic Characteristics ------------------------ 37 Seafood Restaurant Ten Determinants Ranking --------------------------42 Fishbein’s Model Data Results -------------------------------------------- 40 MODE Model Data Results ------------------------------------------------ 43 Conclusion ------------------------------------------------------------------- 45

vii
TABLE OF CONTENTS (CONTINUED) Page CHAPTER 5 DATA ANALYSIS--------------------------------------------------------------46
Demographic Data Analysis -------------------------------------------------- 46 Ten Determinants Toward Seafood Restaurant Analysis-------------------47 Fishbein Model Data Analysis -------------------------------------------------47 MODE Model Data Analysis -------------------------------------------------49 Conclusion ---------------------------------------------------------------------- 49
CHAPTER 6 CONCLUSIONS AND RECOMMENDATIONS--------------------------- 50
Summary of the Study ----------------------------------------------------------- 50 Fishbein’s Attitude Model Discussion ----------------------------------------- 50 Fazio’s MODE Model Discussion-----------------------------------------------52 Recommendations ---------------------------------------------------------------53 Conclusion -------------------------------------------------------------------------57
BIBLIOGRAPHY-----------------------------------------------------------------------------------58 APPENDIX------------------------------------------------------------------------------------------60 Appendix A: Coding Structures ------------------------------------------------------------------60 Appendix B: English Questionnaire--------------------------------------------------------------61

viii
LIST OF TABLES Page Table 1.1: Economic Forecasts 2010 ------------------------------------------------------- 2 Table 1.2: Major Economic Indicators -------------------------------------- -------------- --2 Table 2.1: Attitude Function Theory -------------------------------------------------------- 12 Table 2.2: Combining Beliefs to Form Attitudes -----------------------------------------16 Table 3.1: Research Differentiations ------------------------------------------------------- 24 Table 3.2: Yamane Taro’s Sample Size Table -------------------------------------------- 28 Table 4.1: Demographic Characteristics -------------------------------------------------- 38 Table 4.2.: Seafood Restaurant Selection Score Summary ------------------------------- 39 Table 4.3: The Group Attitude Towards Particular Attributes --------------------------40 Table 4.4: An sample of a Single Individual’s Overall Attitudes ---------------------- 41 Table 4.5.: Total Respondents Overall Attitude Result ----------------------------------- 42 Table 4.6: Data Results of Consumer’s Intention ----------------------------------------- 44

ix
LIST OF FIGURES Page Figure 2.1: Attitude evaluative judgment range ------------------------------------------ 8 Figure 2.2: A Model of Consumer Choice ---------------------------------------------- 13 Figure 2.3: Fazio’s MODE model process ----------------------------------------------- 16 Figure 2.4: Deliberative vs. Spontaneous Processing ------------------------------------17 Figure 3.1: Phase of the Research Process -------------------------------------------------21 Figure 4.1: Summary of Overall Attitudes ------------------------------------------------43 Figure 4.2: Summary of Consumer’s Intention ------------------------------------------- 45 Figure 6.1: Changing Attributes Importance ---------------------------------------------- 54 Figure 6.2: Changing Consumer’s Beliefs ------------------------------------------------ 54

1
CHAPTER ONE INTRODUCTION
This chapter describes research proposal of the study, provide information for this research, the introduction part includes: background, statement of problem, study reason, question development, assumption and benefits. At end of chapter 1 are the limitation of this study. The detail is as following: 1.1 Background In 2008 the fourth quarter represented the worst of the global crisis; economic problems have weakened people’s consumer purchasing power. The recession had transformed consumers’ behavior, says a study by the advertising agency BBDD Bangkok. (Bangkok Post, Aug 2009). Consumer prices, a measure of prices for 417 key products, fell for a sixth month, plummeting to a 12-year low in June, 2009. The core consumer price index was up to 0.7%. (Table 1.1).It shows inflation was higher than expected, indication that domestic consumption, private investment government expenditure and export income remain weak. In Thailand, Thai residences have become more economical and spend more time choosing products. But some product categories still have growth potential. Most Thai people have cut their out of home entertainment and fashion spending, preferring to stay home and spend more time with family. So the market for indoor products and house- brand products keeping growth. And higher living costs have also had a positive impact on family relationships, people more like to go out for dinner with family or friend (B. Nijathaworn, Bangkok Post) During the last quarter of 2009, the economy started recover. The consumer price index in Thailand turned positive for the first time in October on an annualized basis. This shows that Thai people have more confidence in the economy and have started spending more, and this will drive
2
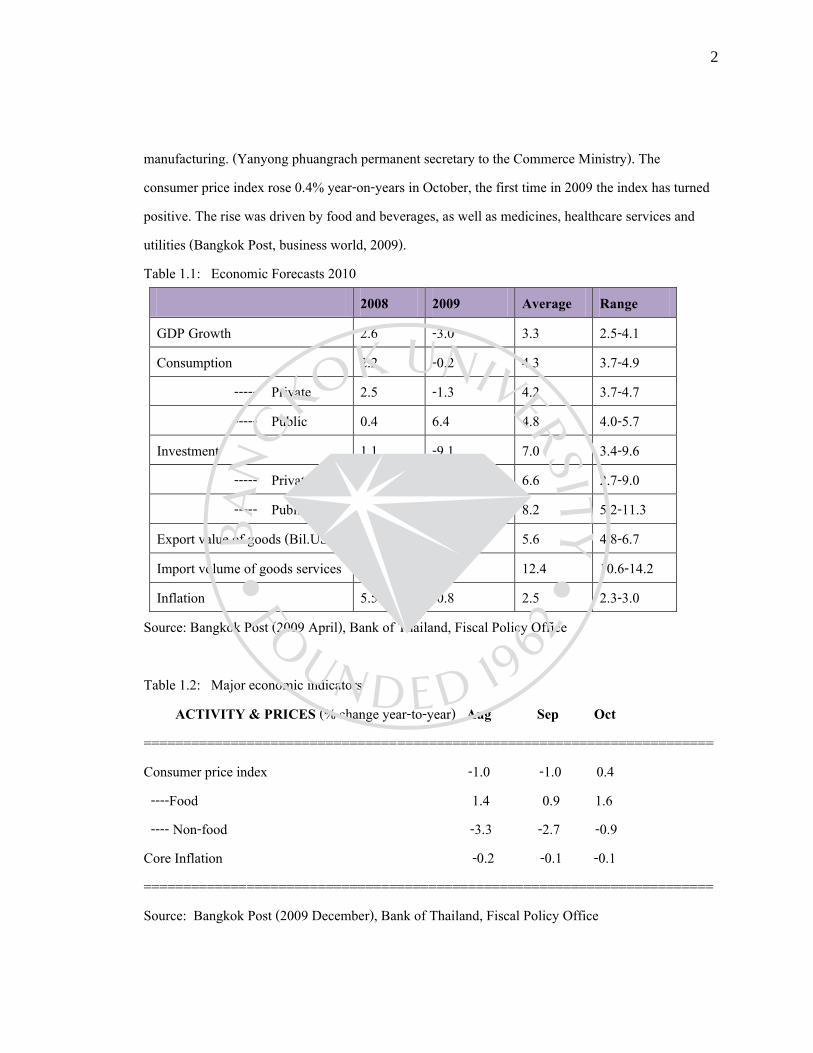
manufacturing. (Yanyong phuangrach permanent secretary to the Commerce Ministry). The consumer price index rose 0.4% year-on-years in October, the first time in 2009 the index has turned positive. The rise was driven by food and beverages, as well as medicines, healthcare services and utilities (Bangkok Post, business world, 2009). Table 1.1: Economic Forecasts 2010
2008 2009 Average Range GDP Growth 2.6 -3.0 3.3 2.5-4.1 Consumption 2.2 -0.2 4.3 3.7-4.9 ----- Private 2.5 -1.3 4.2 3.7-4.7 ----- Public 0.4 6.4 4.8 4.0-5.7 Investment 1.1 -9.1 7.0 3.4-9.6 ----- Private 3.2 -13.7 6.6 2.7-9.0 ----- Public -4.8 5.3 8.2 5.2-11.3 Export value of goods (Bil.USD) 5.4 -14.8 5.6 4.8-6.7 Import volume of goods services 7.5 -22.2 12.4 10.6-14.2 Inflation 5.5 -0.8 2.5 2.3-3.0
Source: Bangkok Post (2009 April), Bank of Thailand, Fiscal Policy Office Table 1.2: Major economic indicators ACTIVITY & PRICES (% change year-to-year) Aug Sep Oct ======================================================================== Consumer price index -1.0 -1.0 0.4 ----Food 1.4 0.9 1.6 ---- Non-food -3.3 -2.7 -0.9 Core Inflation -0.2 -0.1 -0.1 ======================================================================== Source: Bangkok Post (2009 December), Bank of Thailand, Fiscal Policy Office
3
This study is about the Oyster restaurant which is located in Sathu Pradit Road, New Sathorn. The restaurant is small and cozy. It can seat around 20 people at any one time. This restaurant is on a completely different level in terms of selection, compare with Witches Bar and Tavern, which was the first dedicated Oyster bar to open in Bangkok. The manager in this restaurant was eager to share his knowledge of where the oysters come from, the restaurant’s history and lots of interesting facts about oysters in general. The Oyster offers a huge selection of oysters from which to choose. The restaurant strengthens are on the location, diversified oyster food selection and passionate staffs (weekend Thailand, 2008, P.23). Therefore, with Thailand’s consumer spending having room to grow, the Oyster restaurant industry in Bangkok has an opportunity for success. This study first used Fishbein’s multi-attribute model to collect several types of data (cognitive, affective) about the attribute of the Oyster restaurant selection to identify the factors people deem important in making casual dining restaurant choice decisions. Then an investigation will be conducted by Fazio’s MODE model to determine consumer’s intention. The findings obtained from the study can be used as guidelines for restaurant management and improvement in the future. 1.2 Intention and Reason for Study Organizations who really understand their customers can develop better products and services, Organizations who know their customers can reach and satisfy them more efficiently (Kardes.R.F,2e 2002).This study is based on the observation of an oyster restaurant, and the mission of this restaurant is trying to let guests have different experience with its unique food supply and aims to create a special memory for the guests. The intention for this study is to validate the existing theories of the determinants of consumer attitude on selecting the listed restaurant in Thailand. To find out what factors affect on consumer’s minds during restaurant selection and moreover, the business owner can identify the problem areas to improve their management of the restaurant.

4
1.3 Objectives of Study The general purpose of this study is to investigate how consumers evaluate value determinants factors on selection of an oyster seafood restaurant .The objectives of this study are:
1. To identify the factors people deem important in making casual dining restaurant choice decisions
2. To assess the degree to which the customer is satisfied with their oyster bar restaurant experience.
3. To identify the exit consumer segment 4. To assess the likelihood of the customer’s willingness to return to the restaurant in the future. 5. To develop an accurate profile of restaurant‘s customer base.
1.4 Major Research Questions Main research questions: How do consumers evaluate value determinant factors in selection of the Oyster seafood restaurant? Sub-questions development:
1) What is the Oyster seafood restaurant’s potential market segment? 2) What are the factors consumers deem important in making seafood dining restaurant choice
decisions? 3) When motivation and opportunity for Oyster restaurant selection is higher, what is the
consumer’s intention?
1.5 Assumptions The assumptions of this research are as following:
1) The collected information and data analyzed in the research study are complete and reliable. 2) The samples used for the survey are considered to be representative. 3) Self-selected volunteers do not represent the viewing of those who don’t volunteer.

5
4) The data obtained are appropriate and unique. Currently, there is no existing metric data, historical data or other similar methodology available for measuring its effectiveness.
1.6 Scope of Research This research is focused on studying the consumer attitude at the Sathu Pradit Oyster restaurant. Interviewer data come from the respondents who are working or living in these areas. The study aims to investigate in details about the customer‘s attitude toward this restaurant. 1.7 Significance of Research One of the benefits in this study understands consumer’s selection attitude and what is consumer’s intention on dining returning. The findings obtained from the study can be used as guidelines for restaurant’s management. The result will be useful for the restaurant‘s expansion in other markets. In addition, this study is concert with the relationship between consumer attitude and a successful restaurant, which will help to make the most possibly profitable investment; can also consider the studied determinants for selecting seafood restaurant that tend to perform best. 1.8 Limitation of Research Fishbein and Ajzen’s multi-attribute attitude model argues that an attitude can be measured from a combination of belief and evaluation scores for a series of salient features relevant to a particular object. It suggests attitude measures are only predictive of actual behavior if what they measure is very precisely focused on the context and not far removed in time from eventual behavior. This may indicate that actual purchase is a relatively good predictor of repeat purchase. (Bareham.J, 1995, P.178). However, there are a variety of reasons why attitudes and behavior do not always tie up. It may be the measures of behavior and attitudes are inappropriate or the same attitude may evoke different behavior at different thresholds. For example: social pressures, consumer’s habit and special situational factors have strong influence on a behavior but not an attitude. In addition to limited sampling, budget and a time shortage are other limitations in this study.

6
CHAPTER TWO LITERATURE REVIEW
This chapter is a literature review of consumer attitude. It starts with an introduction on consumer behavior, consumer behavior on store selection and its behavioral responses followed by a definition of consumer attitude, a development of the attitude model. At end of the chapter are the benefits of the attitude-based model and the conclusion. 2.1 Introduction of Consumer Behavior Consumer behavior is defined as activities people undertake when obtaining, consuming and disposing of products and services (Blackwell & Miniard, 2001, P.24). Consumer behavior is the study of human responses to products, services, and the marketing of products and services (Kardes.R.Frand, 2e, 2002, P.5). It is important. As it focus on the consumer who is the key contribution of marketing to business practice. Behavioral measures have defined loyalty by the sequence of purchases and /or the proportion of purchases. Consumers are loyal to stores just as they are to brands (Rober B Jared, 5e, 1995, P.34). To understand consumers and why they make the choices they do, consumer researchers investigate a broad range of human responses, including affective (feelings), cognitive (thoughts), and behavioral (actions) responses (Kardes, 2002, P.5).Behavioral responses include purchase decisions and consumption-related practices. (i.e., actions in behavioral responses involved in obtaining, using and disposing of products or services). Many businesses today are attaching more importance to identifying their customer’s attitudes and feeling as a way to determine their strengths and weaknesses. Attitudes are useful in understanding consumers’ and industrial buyers’ observable marketplace behaviors (Hair, Bush, & Orrinau3e, 2006, P. 391).
7
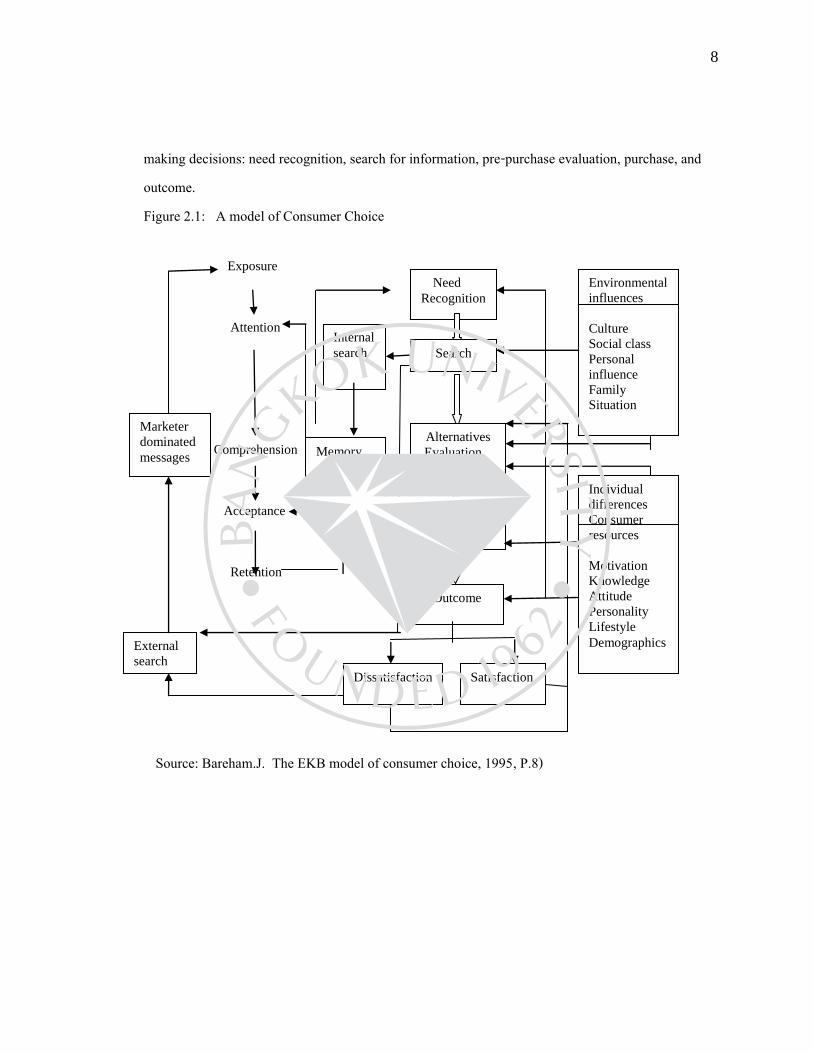
2.2 Consumer Behavior on Store Selection Consumer behavior has four types of consumer choice processes based on the level of involvement and decision making: complex decision making, brand loyalty, limited decision making, and inertia. (Rober, 1995, P.105). Consumer choice involves selecting one product or service from a set of possibilities. Unlike judgment, which is continuous, choice is discrete (non-continuous): Consumers either buy the product or they do not – there are no in betweens (Kardes, 2002, P.109). Having decided what to buy the consumer buys it and is either satisfied or dissatisfied. The level of satisfaction may change after purchase. The individual may come to emphasize to themselves the good features of whatever is bought in order to justify why it was bought. Particularly, the attitude toward a restaurant selection is based on beliefs about the restaurant. Your beliefs about the restaurant’s cuisine, atmosphere, price, location led you to the conclusion that that restaurant is a type of place that you would like. (Black &.Minijard, 9e. 2001, P.290). Beliefs can be viewed as information that has direct implications for attitudes, and indeed, beliefs often serve as building, blocks for attitudes (Fishbein &Ajzen, 1975; Zanna & Rempel, 1988; Kardes.2e.2002, P.87). 2.2.1 A Model of Store Choice The process of choosing a specific store involves the matching of consumer characteristics and purchase characteristics with store characteristics. (Royer Black, Paul w .Miniard, 2001, P.30). An individual may use different criteria to evaluate which store best meets his or her needs. A consumer’s decision making process for a store is similar to that for a brand (Robert, 1995, P.101). Five phases have been identified in the decision process: A consumer begins with a particular state of mind that represents his or her perceptions of and attitudes toward known brands. The total model is outlined in Figure 2.1. As the model shows, consumers typically go through five major stages when
8
making decisions: need recognition, search for information, pre-purchase evaluation, purchase, and outcome. Figure 2.1: A model of Consumer Choice Exposure
Attention
Comprehension
Acceptance
Retention
Source: Bareham.J. The EKB model of consumer choice, 1995, P.8)
Need
Recognition
Search
Alternatives
Evaluation
Purchase
Outcome
Marketer
dominated
messages
Satisfaction
Memory
Environmental
influences
Culture
Social class
Personal
influence
Family
Situation
Individual
differences
Consumer
resources
Motivation
Knowledge
Attitude
Personality
Lifestyle
Demographics
Internal
search
External
search
Dissatisfaction

9
2.2.2 Determinants of Store Choice When consumers choose a product to purchase, their decision strategy is based either on a comparison of their previously formed attitudes toward the considered alternatives (attitude-based choice), or on a comparison of specific attributes or features offered by the considered alternatives (attribute-based choice) (Kardes, 2002, P.117). The determinants of store choice may vary by market segment and by product class. But only the most important attributes determine which retails succeed and which one fail (Robert, 1995, P.103). These determinants may fall into the following categories noted:
1. Location: For most consumers, location is perceived in terms of time and hassles as well as actual distance. Cognitive maps or consumer perceptions of store locations and shopping areas are more important than actual location. These related to factors such as ease of parking in the area (special in Bangkok), quality of food or merchandise, checkout procedures, ease of driving to an area, helpfulness of staff.
2. Nature and quality of assortment: Depth, breadth, and quality of assortment are important determinants of store choice. This is especially true for stores in shopping centers.
3. Price: The importance of price as a determinant of store patronage varies by type of product
and consumer’s perception of price, which is usually more important than actual price. Nevertheless price advertising is frequently used to maintain competitive parity.
4. Advertising & promotion: Advertising and other forms of promotion are important tools to
create retail brand, a summary of consumer perceptions about the store and overall image. Today, in an effort to change perceptions of the store and attract consumers, retailers are adding marketing activities, like ‚preferred customers‛.

10
5. Sales personnel: European stores recognize the importance of personal selling and hire individuals who attend apprentice programs and complete specific educational and test requirements.
6. Services offered: Convenient self-service facilities, ease of merchandise return, delivery, credit, and overall good service have all been found to be considerations affecting store image. This varies depending on the type of outlet and consumer expectations.
7. Physical store attributes: Elevators, lighting, air conditioning, convenient and visible
washrooms, layout, aisle placement and width, parking facilities, carpeting, and architecture affect store image and choice. The store setting can also elicit particular emotional reactions, such as pleasure and arousal, that can influence the amount of time and money consumers spend while shopping.
8. Store Clientele: The type of person who shops in a store affects consumer purchase intention
because of the tendency to match one’s self-image with that of the store. Restaurants frequently reflect a trendy belief about what type of people are likely to be the clientele and thus offer positive or negative reasons for patronage.
9. Store atmosphere: The physical properties of the retail environment designed to create an
effect on consumer purchase are often referred to as store atmospheric. These can help shape both the direction and duration of consumers ‘attention, and increase the odds that a consumer will select products or service.
10. Post-transaction service & satisfaction: It involves the examination of store characteristic.
For example, lighting, service, checkout, keeping people shopping behaviors in mind are all related to post-transaction service and satisfaction. What consumers expect and demand from a purchase situation changes depending on what type of store they are visiting.
11
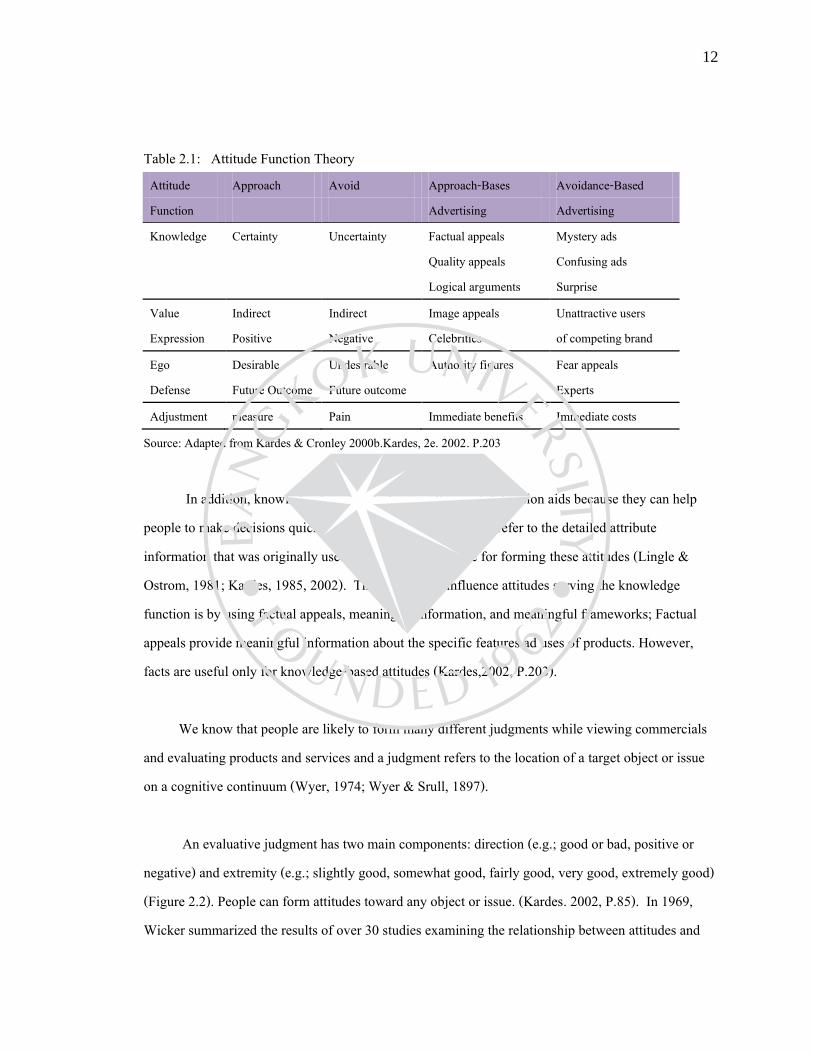
Each this variable is important in determining consumer choice although the weight given them varies by market segment (Engel & Blackwell; 9e.2001). Attracting consumers to a particular store includes performing well on the variables that consumers think are most important. For most consumer goods and services, beliefs are combined using an averaging rule to form attitudes. 2.3 Definition of Consumer Attitude Focused on the relationship between consumer attitudes and consumer behavior is very important as attitude are extremely helpful to consumers. Fox example, the four key functions that attitudes serve are: the knowledge function, the value expression function, the ego defense function and the utilitarian function. Any particulate attitude may perform more than one of the functions (Katz, 1960; Smith, Bruner& White, 1956). ). Attitudes are learned predispositions to respond to an object or class of objects in a consistently favorable or unfavorable way (Gordon Allport). 2.3.1 Attitude Function Theory Attitudes have many different functions. Table 2.1 shows the function theory of attitude. An attitude summarizing large amounts of information and simplifying the world so we can make decisions quicker and easier is known as the knowledge function. The value expression function states that attitudes can express out traits, characteristics, and preferences to others so they will know how to interact with us more effectively. The ego defense function states that attitudes bolster our self-esteem and help us to feel better about ourselves. Last is the utilitarian function, which states that attitudes help us to gain immediate rewards and avoid immediate punishments (Kardes, 2002, P.201).
12
Table 2.1: Attitude Function Theory Attitude Approach Avoid Approach-Bases Avoidance-Based Function Advertising Advertising Knowledge Certainty Uncertainty Factual appeals Mystery ads
Quality appeals Confusing ads
Logical arguments Surprise Value Indirect Indirect Image appeals Unattractive users Expression Positive Negative Celebrities of competing brand Ego Desirable Undesirable Authority figures Fear appeals Defense Future Outcome Future outcome Experts Adjustment pleasure Pain Immediate benefits Immediate costs
Source: Adapted from Kardes & Cronley 2000b.Kardes, 2e. 2002. P.203
In addition, knowledge-based attitudes are often useful decision aids because they can help people to make decisions quickly and easily without having to refer to the detailed attribute information that was originally used as an information base for forming these attitudes (Lingle & Ostrom, 1981; Kardes, 1985, 2002). The best way to influence attitudes serving the knowledge function is by using factual appeals, meaningful information, and meaningful frameworks; Factual appeals provide meaningful information about the specific features ad uses of products. However, facts are useful only for knowledge-based attitudes (Kardes,2002, P.203). We know that people are likely to form many different judgments while viewing commercials and evaluating products and services and a judgment refers to the location of a target object or issue on a cognitive continuum (Wyer, 1974; Wyer & Srull, 1897). An evaluative judgment has two main components: direction (e.g.; good or bad, positive or negative) and extremity (e.g.; slightly good, somewhat good, fairly good, very good, extremely good) (Figure 2.2). People can form attitudes toward any object or issue. (Kardes. 2002, P.85). In 1969, Wicker summarized the results of over 30 studies examining the relationship between attitudes and

13
behaviors and found that firstly, Behavior is determined by many variables, not just attitudes. Secondly, individuals are very different from each other. Third, strong attitudes influence behavior but weak attitudes do not (Kardes,2002, P.103). Figure 2.2: Attitude evaluative judgment range from very low to very high Attitudes-Evaluative judgments at any point on a continuum
Source: Kardes.R.Fran, 2e. 2002, P.85 2.3.2 Attitude Formation How to form the attitude? To form an attitude, individuals must first combine information, they have gathered through the perceptual process with knowledge they recall from past experiences (Engel & Blackwell, 9e.2001, P.291). For instance, consumer process the information in the ad about the restaurant’s attributes (seafood cuisine, reasonable prices, relaxing atmosphere, service, and location and so on). Once this information has been gathered, it is evaluated in insight of the person’s needs and person’s back group characterization to form on attitude. If it’s a place that would provide an enjoyable dining experience, consumer can makes a mental note to dine at the restaurant next time.
Very Bad Very Good
Very Unfavorable Very favorable
Very Negative Very Positive
Dislike Very Much Like Very Much

14
Attitude formation is the process by which individuals form a feeling or opinion about objects in their environment, and methods of attitude formation including: (1) Learned knowledge from their own experiences, (2) evaluation of the object on their knowledge of it, and (3) predisposition to act based on the evaluation (Wells &Prensky, 1996, P.58). The three components of attitudes are brand beliefs, brand evaluations, and intention to buy. The components of attitudes can be measured by develop rating scales (Churchill.A.Giblert, 9e, P.158). There are commonly used judgment scales, or rating scales, for measuring beliefs and attitudes. These types of scales are often included in consumer surveys, political polls, and other types of paper and pencil questionnaires for assessing beliefs and attitudes (Kardes.R.F, 2e, P.87). 2.4 Development of Attitude Model Motivated by a desire to understand the relationship between attitudes and behavior, psychologists have sought to construct models that capture the underlying dimensions o an attitude (Kanuk & Schiffman, 8e, P.256). The following part uses an attitude models to focus on specifying the composition of an attitude for a better explanation of consumer behavior. 2.4.1 Fishbein’s Attitude Model One popular attitudinal model is the Fishbein Multi-attribute attitude model (Hair, 3e, 2006, P.423). Fishbein’s theory shows the evaluations of salient beliefs cause overall attitudes (Peter.S.Paul & Olson.C.J. 7e, P.147). This model captures a person’s attitude toward his or her behavior with a given object. This Theory of Reasoned Action describes attitude formation as a function of consumer beliefs about the attributes and benefits of a brand (Rober 5e 1995, P.283). Consumers start with the evaluation of certain attributes and then form beliefs (Kardes,2002, P.90). The Fishbein’s attitude model can be expressed as below, and table 2.2 is an example of this model.

15
Attitude Model A0 = A๐ = attitude toward the object
bì = the strength of the belief that the object has attributesì
eì = the evaluation of attributeì N = the number of import attributes Source: Anderspn, 1981, 1982; Troutman& Shanteau, 1970; Robert B.Jared., 1995, P.54
Table 2.2: Combining Beliefs to Form Attitudes (Theory of Reasoned Action)
Attribute Belief (bᵢ) Evaluation (eᵢ) bᵢeᵢ
Comfortable + 2 × +1 = +2
Expensive + 1 × -2 = -2
Fashionable + 3 × +3 = +9
Total +9
Source: A sample of Dr. Marten;s shoes attitude. Kardes.R.F, 2002, P.88
2.4.2 Fazio’s MODE Model When are consumers likely to form strong accessible attitudes? Research has shown that effortful thinking and deliberation leads to strong attitudes and that snap judgments lead to weak attitudes (Fazio).There are many different ways to measure attitude strength (Petty & Krosnick, 1995). The approach that has received the greatest amount of research attention and support is Fazio’s response-latency approach for assessing attitude accessibility.

16
Fazio’s MODE model developed a theory that explains how and why accessible attitudes influence behavior. Consumers often engage in greater levels of thought and effort when the attitude is based on direct experience as opposed to indirect experience. (Smith& Swinyard, 1983, Kardes.R.F 2002, P.103) Figure 2.3: Fazio’s model suggests that attitudes influence behavior through a relatively effortless process.
Source: adapted from Sanbonmatsu & Fazio (1990)
In MODE model, M stand for motivation, O for opportunity and DE stand for determinant. M&O are key for determinants of manner in which attitudes guide behavior (Kardes, 2002, P.103). The theory of reasoned action represents a comprehensive integration of attitude components into a structure that is designed to lead to both better explanation and better predication of behavior ( Kanuk & Schiffman, 8e.2004, P.261)
Attitude activation
Immediate perceptions
of the attitude object
Selective perception
Definition of the event
Behavior
Norms
Definition of the
situation
17
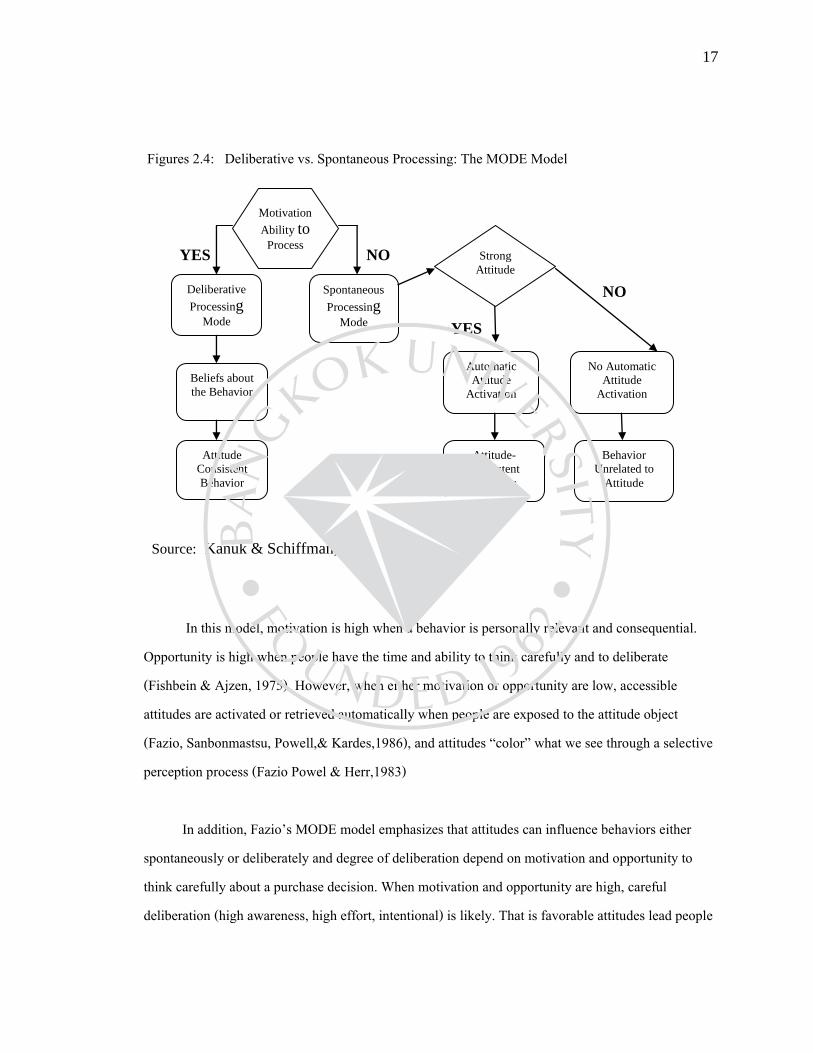
Figures 2.4: Deliberative vs. Spontaneous Processing: The MODE Model
YES NO
NO
YES
Source: Kanuk & Schiffman, 8e.2004, P.261
In this model, motivation is high when a behavior is personally relevant and consequential. Opportunity is high when people have the time and ability to think carefully and to deliberate (Fishbein & Ajzen, 1975). However, when either motivation or opportunity are low, accessible attitudes are activated or retrieved automatically when people are exposed to the attitude object (Fazio, Sanbonmastsu, Powell,& Kardes,1986), and attitudes ‚color‛ what we see through a selective perception process (Fazio Powel & Herr,1983) In addition, Fazio’s MODE model emphasizes that attitudes can influence behaviors either spontaneously or deliberately and degree of deliberation depend on motivation and opportunity to think carefully about a purchase decision. When motivation and opportunity are high, careful deliberation (high awareness, high effort, intentional) is likely. That is favorable attitudes lead people
Motivation
Ability to Process
Deliberative
Processing Mode
Beliefs about
the Behavior
Attitude
Consistent
Behavior
Spontaneous
Processing Mode
Automatic
Attitude
Activation
No Automatic
Attitude
Activation
Attitude-
Consistent
Behavior
Behavior
Unrelated to
Attitude
Strong
Attitude
18
to focus on positive aspects of a product and neglect negative aspects. Conversely, when either is low, less effortful, spontaneous (low awareness, low effort, unintentional) processes are likely. Unfavorable attitudes lead people to focus on negative aspects of a product and neglect positive ones (Kardes,2002, P.103). Finally, when positive dimensions are highlighted approach behaviors are likely. When negative dimensions are accentuated, avoidance behaviors are likely. 2.5 Benefits of Attitude-Based Strategies The Fishbein Multi-attribute attitude model is the modeling approach that provides researches and decision makers with a lot of diagnostic insight into the components that make up the consumer’s attitude. Decision makers can learn how and what the customer used to evaluate with the potential or actual performance of a given object. It is linked to the traditional hierarchy of effects, the sum total of desired attributes and brand beliefs influence brand evaluations. Moreover, it also stated a linkage between brand evaluations and intended or actual behavior: A positive (negative) attitude toward a brand will increase (decrease) the likelihood that consumers intend to buy it. Positive buying intentions are likely to lead to actual behavior (A, Henry, 5e; 1995, P.285) The Fazio’s MODE model has important implications for store choice. (Sanbonmatsu & Fazio, 1990). Motivation can mean a variety of things, but integral to its definition is the exertion of effort. This effort can be focused on making the best, most accurate decision, or a fear of coming to an invalid conclusion and would be reflected in the a though consideration of the behavior’ potential consequences. (e.g., Kruglanske , Webster, 1996). The object of a MODE model is two-fold. First, the intention is to enable description, explanation, prediction and ultimately control of consumer behavior. Second, models help researchers developing better hypotheses and theories about the relationship between factors that have an influence on consumer behavior. (Bareham.J, 1995, P.2).
19
2.6 Conclusion A scientific view is used in this chapter to understand customers’ attitude and how it can lead consumer’s two directions. Strong attitude can guide behavior, but weak attitude do not. (Petty & Krosnick, 1995). The Fishbein Multi-attribute attitude model and Fazio’s MODE model will be used for the next chapter to test the theory by finding out the characteristics for the seafood restaurant; by examining the factors on consumer choice decision on Oyster restaurant. According to many researchers reviewed for this literature review, both models are suggested to be the key on which can lead to analysis customer’ attitude on the restaurant decision.

20
CHAPTER THREE RESEARCH METHODOLOGY
This chapter presents an overview of the research study methodology and tries to use the scientific method to reduce uncertainty in the research period given and to improve the quality of the study. It first introduces the literature related to research methodology, then the research questions, survey design and sampling method. Finally, the conclusion and statement of research method used are presented. 3.1 Review of Research Methodology Basic (pure) research is research that is intended to expand the boundaries of knowledge itself; conducted to verify the acceptability of a given theory (Ziknund.6e, P.5). This is important in marketing decisions, can help marketers to improve decision making related to problem identification and solving. The process of research involves the identification, collection, analysis, and dissemination of information (Malhotra; 2002, P.4). A major purpose of marketing research is to identify and then satisfy customer needs. Through the collected market data links are made between the consumer and the marketer to identify and define marketing problems (Churchill; 2004, P.6). In today’s high technology century, timely market information has become more valuable. There are four pieces of information that research can provide: first, the identification of problems and opportunities by discussing with the decision marketers, and interviews with experts or focus groups; next, the evaluation of marketing actions by explaining data and/or actions to clarify the problem, and translation the management problem into a marketing research problem; third, by comparison of performance versus objectives to determine whether information already exists and
21
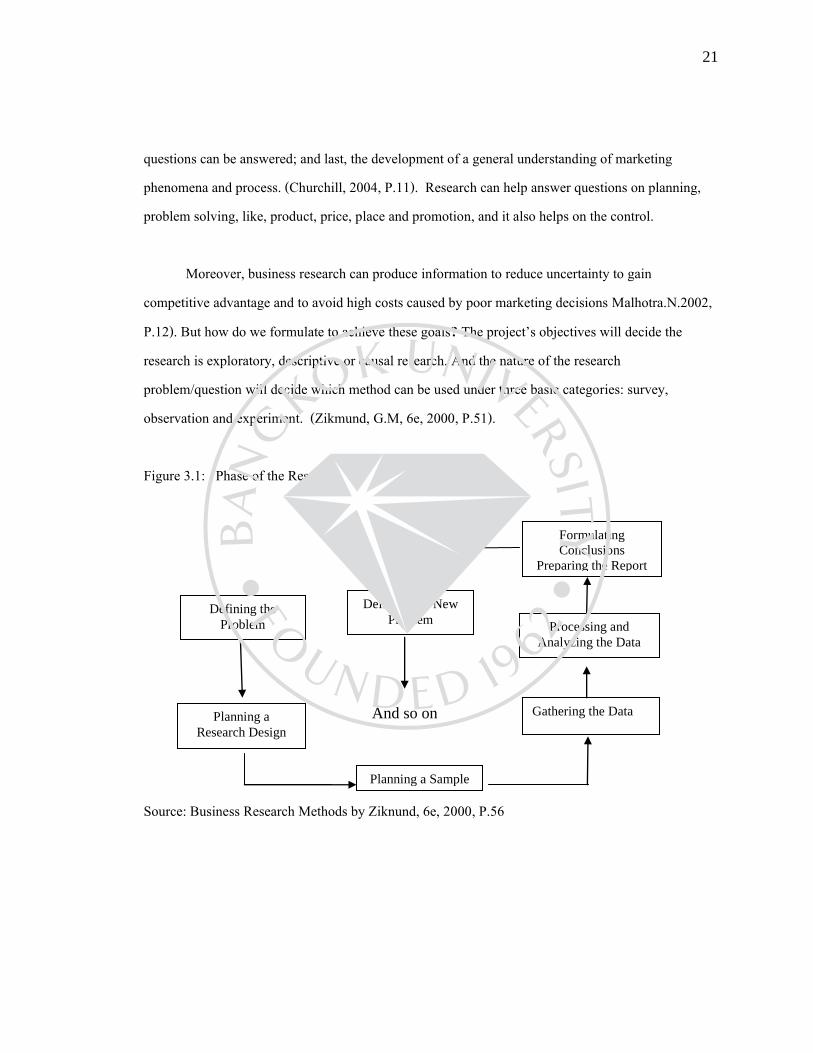
questions can be answered; and last, the development of a general understanding of marketing phenomena and process. (Churchill, 2004, P.11). Research can help answer questions on planning, problem solving, like, product, price, place and promotion, and it also helps on the control. Moreover, business research can produce information to reduce uncertainty to gain competitive advantage and to avoid high costs caused by poor marketing decisions Malhotra.N.2002, P.12). But how do we formulate to achieve these goals? The project’s objectives will decide the research is exploratory, descriptive or causal research. And the nature of the research problem/question will decide which method can be used under three basic categories: survey, observation and experiment. (Zikmund, G.M, 6e, 2000, P.51). Figure 3.1: Phase of the Research Process
And so on
Source: Business Research Methods by Ziknund, 6e, 2000, P.56
Defining the
Problem
Defining the New
Problem
Formulating
Conclusions
Preparing the Report
Processing and
Analyzing the Data
Gathering the Data
Planning a Sample
Planning a
Research Design
22
3.2 Research Questions
Conducting marketing research involves a series of logical steps: beginning with identification of the problem; and these management decision problems should be translated into a marketing research problem. According to the literature books, research questions (RQs) are refined statements of the specific components of the problem (Malhotra; 2002, P.55). The research questions of this study are: Main research questions: How do consumers evaluate value determinant factors in selection of the Oyster seafood restaurant? Sub-questions development: (1) What is the Oyster seafood restaurant’s potential market segment? (2) What are the factors consumers deem important in making seafood dining restaurant choice decisions? (3) When motivation and opportunity for Oyster restaurant selection is higher, what is consumer’s the intention? 3.3 Method Inquiry The research design is a framework or road map for conducting the marketing research project, to contain the needed information, to structure and solve the research problem. It is the plan to be followed to answer the marketing research objectives. Research designs are of two broad types: exploratory and conclusive. Conclusive designs may be either descriptive or causal. Descriptive designs may be further categorized as either cross-sectional or longitudinal (Malhotra.N.2002, P.85). Market investigators need to decide whether the research will be exploratory, descriptive or causal.
23
Exploratory research is usually conducted during the initial stage of the research process. The preliminary activities undertaken to refine the problem into a researchable one need not be formal or precise (Ziknund.G.W.6e, P.57). The objective is to discover ideas and insights. Research methods can be broad, like: expert surveys, pilot surveys, case studies, secondary data or qualitative research. Descriptive research is a type of conclusive research conducted to answer who, what, when, where, and how questions. Its major objective is to describe market characteristics or functions. (Malhotra, 2002, P.85). It is preplanned, structured and designed for identifying variable relationships or making predictions. Causal research is like descriptive research; it requires a planned and structured design and is a type of conclusive research as well. Causal relations are those that involve cause-and-effect variables, such as, predicting the influence of price, package advertising and the like on sales. (Ziknund, 6e, P.57). Furthermore, there are two main paradigms of research approaches: qualitative research and quantitative research. The distinction between qualitative and quantitative research closely parallels the distinction between exploratory and conclusive research discussed (Malhotra.N.2002, P.167). Qualitative research is an unstructured, exploratory research methodology based on small samples; which enables researchers to gain insights to people. Qualitative research is analyzed in a non statistical way with non representative samples. Its outcome is the development of an initial understanding (McDaniel & Gates, 7e, 2007, P.129). Quantitative research on the other hand, is concerned with quantifying the data, and data collection can be from highly structured to completely unstructured. A multiple-choice question is an example of a highly structured question. A marketer normally uses quantitative research to evaluate customer behavior on goods or store selection in developing marketing strategy (McBurney, 2004).
24
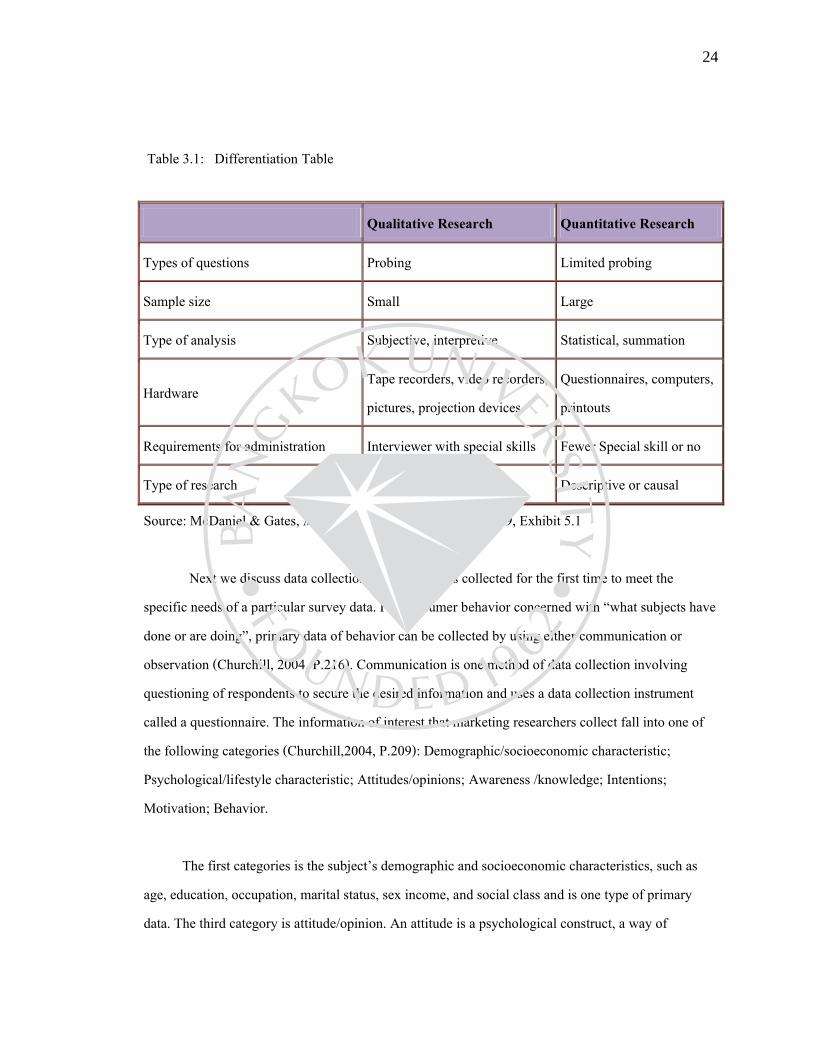
Table 3.1: Differentiation Table
Qualitative Research Quantitative Research
Types of questions Probing Limited probing
Sample size Small Large
Type of analysis Subjective, interpretive Statistical, summation
Hardware Tape recorders, video recorders, pictures, projection devices
Questionnaires, computers, printouts
Requirements for administration Interviewer with special skills Fewer Special skill or no
Type of research Exploratory Descriptive or causal
Source: McDaniel & Gates, Marketing Research .7e, 2007, P.129, Exhibit 5.1
Next we discuss data collection. Primary data is collected for the first time to meet the specific needs of a particular survey data. For consumer behavior concerned with “what subjects have done or are doing”, primary data of behavior can be collected by using either communication or observation (Churchill, 2004, P.216). Communication is one method of data collection involving questioning of respondents to secure the desired information and uses a data collection instrument called a questionnaire. The information of interest that marketing researchers collect fall into one of the following categories (Churchill,2004, P.209): Demographic/socioeconomic characteristic; Psychological/lifestyle characteristic; Attitudes/opinions; Awareness /knowledge; Intentions; Motivation; Behavior. The first categories is the subject’s demographic and socioeconomic characteristics, such as age, education, occupation, marital status, sex income, and social class and is one type of primary data. The third category is attitude/opinion. An attitude is a psychological construct, a way of
25
conceptualizing an intangible. It refers to an individual’s preference, inclination, views, or feelings toward some phenomenon (Churchill, 5e, 2004, P.209) and is one of the more important notions in the marketing literature, as generally thought attitudes are related to behavior. For example: if a person has a positive attitude towards a product or brand, that person tends to select it, if that person has a negative attitude, that will likely lead to a refusal to select the product or brand (Churchill, 2004, P.213). The fifth category is intention. For predictions of future behavior, the marketers need to know the consumer’s intention. A person’s intention refers to the individual’s anticipated or planned future behavior, the intentions primarily related to person’s purchasing behavior (Churchill, 2001, P.242). The more favorable people’s attitudes towards a product; the more likely people are to purchase the product. Attitudes are likely to predict purchase behavior only under conditions of high involvement. To add effectiveness regarding a consumer’s involvement, motivation is necessary. Motivation refers to “a need, a want, a drive, a wish, a desire, or inner state that energizes, activates, or moves and that directs or channels behavior towards a goal” (Churchill, 2001, P.244) Researcher are interested in motivation because they believe that a person’s motivation tend to be more stable than an individual’s behavior. 3.4 Sampling Design “Who is to be sampled?” The answer to this primary question requires the identification of a target population (Zikmund, 5e, P.64). There are two main components in determining whom you will interview. The first is deciding what kind of people to interview. Researchers often call this group the target population. The next thing to decide is how many people you need to interview. Statisticians know that a small, representative sample will reflect the group from which it is drawn. The larger the sample, the more precisely it reflects the target group (Zikmund, 5e, P.67).

26
3.4.1 Target population Once the decision to sample has been made, the first question related to sampling is concerned with identifying the target population. (Zikmund, 6e, P.345). The population of interest is often specified in terms of geographic area, demographic characteristic, product or service usage characteristic, and/or awareness measures (McDaniel, 2007, P.377). For understand population of attitude, we need to know how they develop. Attitudes develop over time through a learning process affected by family influences, peer group influences, information, experience, and personality (Henry,1995, P.275). Consumers are surrounded by other people who have various degrees of influence on their attitudes and behavior and hence what products they buy. A strong influence is likely to be exerted by family and friends and rather less influence by people known only vaguely or not at all (Bareham, 1995, P.117). The group evolves belief, attitudes and ways of behaving which are similar. A household differs from a family in that it is grouped as one and all persons, both related and unrelated, who live in a particular unit. This is becoming a more important unit of analysis in market research than the family because of the increase in non-family households and non-traditional families (Bareham, 1995, P.123). Regarding young and teenage consumers, there is evidence that children may influences as much as 15% of food consumption decisions. A study by Ward and Wackman (1972) showed mothers were more likely to be influenced by children in the selection of food than any other products (Bareham, 1995, p.135) 3.4.2 Sampling Techniques There are two basic sampling techniques: probability and non probability sampling. A probability sample is defined as a sample in which every member of the population has a known, nonzero probability of selection (Zikmund, 6e, P.350). Probability sampling techniques vary in terms
27
of sampling efficiency and include: simple random sampling, systematic sampling; stratified sampling and cluster sampling Simple random sampling refers to a sampling method in which each element in the population has a known and equal probability of selection. Every element is selected independently of every other element, and the sample is drawn by a random procedure from a sampling frame (Zikmund, 6e, P.351). Each possible sample of a given size (n) has a known and equal probability of being the sample actually selected. Cluster sampling is a two-step probability sampling technique and each of the sampling units is selected in groups. The target population is divided into mutually exclusive and exhaustive subpopulations, or clusters, and then a random sample of clusters is selected (Malhotra.2002, P.360). The most popular type of cluster sample is the area sample, in which the clusters are units of geography. A researcher can conduct a door-to-door survey in a particular metropolitan area, and might do so by randomly choosing a sample of city blocks from the metropolitan areas, selecting a sample of clusters and then interviewing a sample of consumers from each cluster. 3.4.3 Sampling Size How big should the sample be? Typically, large samples are more precise than small samples, but if proper probability sampling is implemented, a small proportion of the total population will give a reliable measure of the whole. (Zikmund, 5e, P.65). Sample size is a group of elements subject to selection in the sample in the research. The formulas for sample size determination required are not just for simple random samples, but also for other types of probability samples like: stratified and cluster samples (McDanniel & Gates, 2007, P.421). Yamane’s determination sample table describes an appropriate sample size for the research.
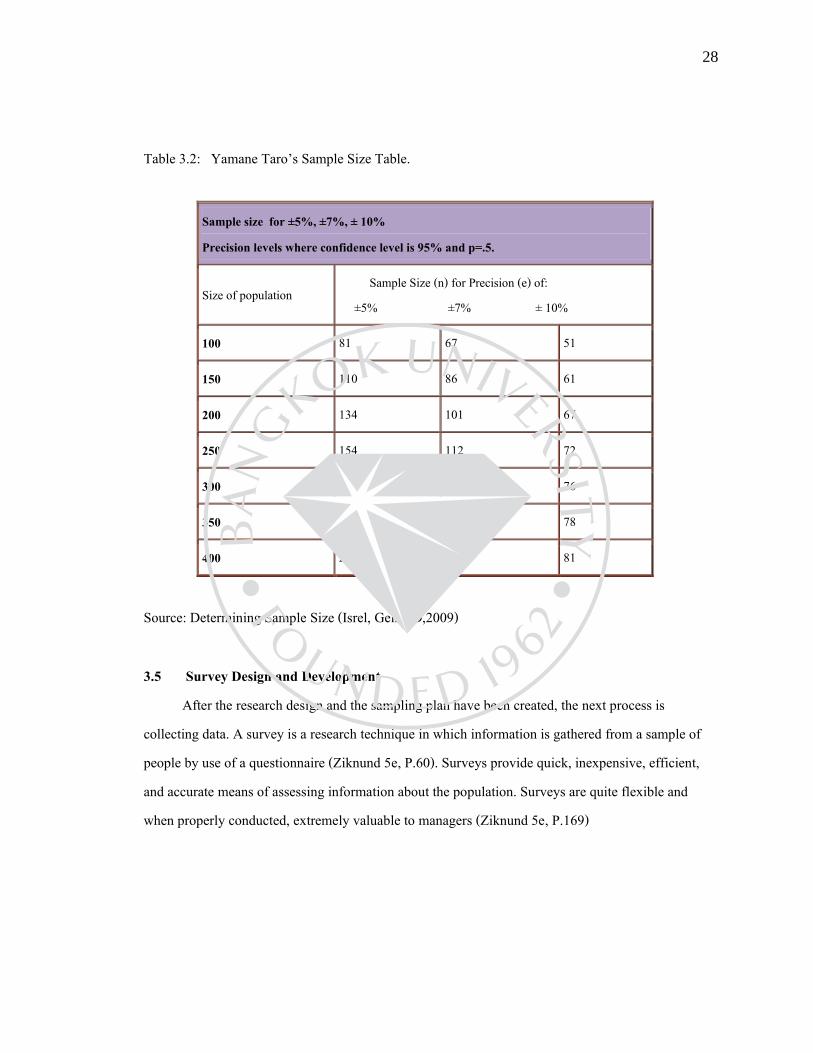
28
Table 3.2: Yamane Taro’s Sample Size Table.
Sample size for ±5%, ±7%, ± 10% Precision levels where confidence level is 95% and p=.5.
Size of population Sample Size (n) for Precision (e) of: ±5% ±7% ± 10%
100 81 67 51
150 110 86 61
200 134 101 67
250 154 112 72
300 172 121 76
350 187 129 78
400 201 135 81
Source: Determining Sample Size (Isrel, Gelnn D,2009) 3.5 Survey Design and Development After the research design and the sampling plan have been created, the next process is collecting data. A survey is a research technique in which information is gathered from a sample of people by use of a questionnaire (Ziknund 5e, P.60). Surveys provide quick, inexpensive, efficient, and accurate means of assessing information about the population. Surveys are quite flexible and when properly conducted, extremely valuable to managers (Ziknund 5e, P.169)

29
3.5.1 Measuring attitudes Measurements of attitudes usually involve the identification of the following attitude components: belief measure, value measure and intention measure. The respondent is asked to indicate the level of agreement with each statement (Bareham.J, 1995, P.171). By knowing attitudes you can be in a position to know their behavior. For example: Fishbein’s attitude-toward behavior model is a popular model used to capture a person’s attitude toward his or her behavior with a given object (Hair, Bush and Ortinau, 3e, 2006, P.423). Both qualitative and quantitative research activities can be used to create different scale measurements for collecting both the cognitive components (bᵢ) and the affective components (eᵢ) that relate to assessing respondents’ attitudes towards consumption. The formula is
But, how can we measure the consumer attitude? Attitude scaling requires that an individual agree or disagree with a statement or respond to a single question (Zikmund, 2000, P.289). Likert scales, semantic differential scales, and behavior intention scales are main three attitude scale formats (Hair, 2006, P.423). The Likert scale is an adaptation of the summated rating method, developed by Rensis Likert and is extremely popular for measuring attitudes. In this scale, the respondents are asked to indicate their attitudes by checking how strongly they agree or disagree with carefully constructed statements that range from very positive to very negative toward the attitudinal object. Individuals generally choose five alternatives: strongly agree, agree, uncertain, disagree, and strongly disagree (Zikmund, 2000, P.293).
30
The Behavior intention scale is another widely used scale format in commercial marketing research. It is a rating scale designed to capture the likelihood that people will demonstrate some type of predictable behavioral intent toward purchasing an object or service in a future time frame. In general, behavioral intent scales have been found to be good predictors of consumers’ choices of frequently purchased and durable consumer products (Hair, 2006:428, Ziknund, 6e, P.57). 3.5.2 Questionnaire design A questionnaire increases the speed and accuracy of recording, facilitates data processing and is a formalized set of questions to accomplish the objectives of the research project (McDanniel, 7e.2007, P.330). It plays a critical role in the data-collection process. A good organized questionnaire should be written to minimize demands imposed on respondents and should also minimize response error. The development of a questionnaire follows the steps of problem definition and approach, specification of the type of research design, and selection of the scaling procedures. The researchers must consider three criteria: (1) Does it provide the necessary decision-making information of management? (2) Does it consider the respondent? (3) Does it meet editing, coding, and data processing requirements? (McDanniel.2007, P.331) 3.6 Research Coding Coding means assigning a code, it is usually a number, to each possible response to each question. Generally, all the data for a respondent will be stored on a single record. A well planned questionnaire can reduce the time spent on coding and increase the accuracy of the process. Typically, the codes are numerical a number from 0 to 9, because numbers are quick and easy to input and computers work better with numbers than alphanumerical values (Hair, Bush and Ortinau, 3e, 2006, P.485).
31
3.7 Reporting Report preparation is the final stage of the research project. It is a key stage because the project can guide management decisions only if it is effectively communicated (Zikmund, 6e, 2000, P.574). The research report must establish credibility for the research methods, findings, and conclusions. This can be accomplished only if the repost is accurate, believable, and professionally organized. 3.8 Statement of Research Method Used This study is using quantitative research methods, and seeks to provide a quantified expression of the research. In the study, the survey research via questionnaire is used to collect primary data. A randomly selected group of consumers is the best known way to represent the characteristics and behavior of the population. However, by using cluster/area sampling and a simple random sampling, this research can meet its entire population. Population: The Oyster restaurant is located at Sathu Pradit Road. This section covers Narathiwas Ratchankrindra Road and Sathu Pradit Road. This area is a well organized living place. It has eight high-rise condominiums, three service apartments, two elementary schools, and other facilities. As the average number of customers in the restaurant are around 150 people per week, because there are limits from the restaurant dinning space and hours of operation. The definition of target population for this research includes: Geographic Area is located on Sathu Pradit soi 19, same place where the restaurant is located; Demographics include any people who eat seafood; Usage: individuals who has been to the seafood restaurant in last six months. Awareness: individuals who are aware of the Oyster restaurant. Sampling technique: The Oyster restaurant is special restaurant in this area, people who are working and living in the area knowing the restaurant well. In case to identify also the potential customers, cluster sampling is more useful for the research. It can be employed by selecting all residential blocks
32
in the area, then randomly choosing individuals. The sample unit consists of ranging from students, employees, service staff, manager and housewives who do belong to the target population. Sample size: In determining the sample size, there are several possible methods with can be used. However using Yamane’s determination sample table will be best describe an appropriate sample size for this research. The level of precision selected is ±5%, with a 95% confidence level. Therefore, the sample size of this study is approximately 110 customers (page 11 Yamane’s determination sample table). The sample will be randomly selected and everyone in the population has an equal chance of being selected. Attitudes measurement: Fishbein’s multi-attribute model will be used to conduct consumer’s attitude toward restaurant by measuring consumer’s beliefs and cognitive. Next Fazio’s MODE model will be used to measure the consumer’s intentions for a repeat visit or the possible chance of choosing the oyster restaurant. The likert scale and consumer intention scale methods are two common types of questions in the questionnaire. Examples of questions used to measure different aspects of attitude are: Belief measure: What is your importance degree on Oyster restaurant? Value measure: Do you agree or disagree with the following statement? Intention measure: How likely is it that you will come again? Questionnaire design: The survey research method will be the basic research design. During the interview, a self-administered written questionnaire will be given to the respondents. However, to identity the target popular for this Oyster restaurant research, the participants need to answer two questions before complete the questionnaire, and if both answers are yes, they will be possible to continue.

33
Question 1: Have you been to the seafood restaurant? Question 2: Do you know the Oyster restaurant? In this research, the questionnaire instrument used both the Fishbein’s attitude model and Fazio’s MODE model. The questionnaire consists of four parts: Part1 Demographic data explores the segment of seafood restaurant consumer; Part2 Determinant features toward seafood restaurant choice; Part3 Oyster restaurant perception. Data for part 2 and part 3 include: First, data of consumer’s affective components (eì) and second, data of consumer’s cognitive (bì). Both relate to assessing respondents’ attitude toward the restaurant selection; Part 4 Determines customer intention when both Motivation and Opportunity are higher. Questionnaire reliability: A tool of Cronbach’s Alpha-coefficient in SPSS system was used to conduct a pretest survey, aim to check the questions are appropriate and support fully in the study. The questionnaire items were pre-tested with 10 respondents in the survey area, Sathu Pradit soi 19 roads, these respondents consist of ranging from employees, service staffs and housewives. All the participants have been to seafood restaurant in last six months and know the Oyster restaurant well. The result of pilot test is 0.797, which is bigger than minimum requirement 0.6. Reliability Statistics
Cronbach's Alpha N of Items
.797 10
34
Coding: The coding structures of research questionnaire for Part 1 demographic data is referring in an appendix A: Coding Structure. Rest parts of questionnaire coding is as follows: Part 2, coding for an attitude statement that will be used in the questionnaire of this research to measure consumers’ affective is: (1 =Not at all important; 2 = Slightly Important; 3 = Somewhat Important; 4 =Generally Important; 5 = Definitely important; 6 = Extremely important) Part 3, coding for an attitude statement that will be used in the questionnaire of this research to measure consumers’ cognitive (Belief) is: (1 = Definitely disagree; 2 = Generally disagree; 3 =Slightly disagree; 4 = Slightly agree; 5 =Generally agree; 6 =Definitely agree) Part 4, coding for restaurant intention is: (1 =Definitely would consider attending; 2 = Probably would consider attending; 3 =Probably would not consider attending; 4 = Definitely would not consider attending) Reporting: A written report will be prepared in the final process, and the data in quantitative research will be presented and directly answer to the research question. The research results will explore the consumer’s attitude at the Oyster restaurant
35
3.9 Conclusion This chapter is concerned with reviewing research methodology and describes the research method used. The quantitative approach and cluster sampling technique are used in this study. And the SPSS program and Microsoft Office Excel will be used in the research. The primary data collected for Fishbein model will input in excel sheet and with the help of various formula it is easy to do data analysis, the SPSS system will be used for data rank, data reliability, etc. The next chapter will present the data results

36
CHAPTER FOUR DATA PRESENTATION
Chapter 4 presents the data findings of the research after the fieldwork has been completed in order to evaluate the selection attitudes of Oyster restaurant. The research finding can be described as the general determinants of seafood restaurant selection and perception of Oyster restaurant. In addition, this chapter presents the results of the data collection based upon discussions from Chapter 3’s research methodology. 4.1 The Instrument of Score Measurement The questionnaire consists of four parts: Part1 contains demographic data which explores the market segmentation of seafood restaurant consumer; Part2 contains determinant features toward seafood restaurant choice; Part3 is about Oyster restaurant perception. Data for part 2 and part 3 include: first, data of consumer’s affective components (eì) and second, data of consumer’s cognitive (bì), which both relate to assessing respondents’ attitudes toward the restaurant selection; Part 4 determines customer intention when both Motivation and Opportunity are high. Firstly, Fishbein‘s multiplicative-additive model is used to determine respondents’ overall composite attitude toward the Oyster restaurant performance and the respondent’s individual attitudes for each of the separate ten attributes. To see how to determine a respondent’s individual attitudes toward a particular attribute, simple multiply the respondents’ belief score (bì) assigned to this factor by the corresponding raw affective importance score (eì), which will result in a possible score range of lowest score1 (1×1 = 1), with 1 standing for definitely disagree, to highest score 36 (6× 6 = 36), with 6 standing for definitely agree. The score would be interpreted to mean that the lower the value, the weaker the attitude and the higher the value, the stronger the attitude (Hair, 2006, P.421).
37
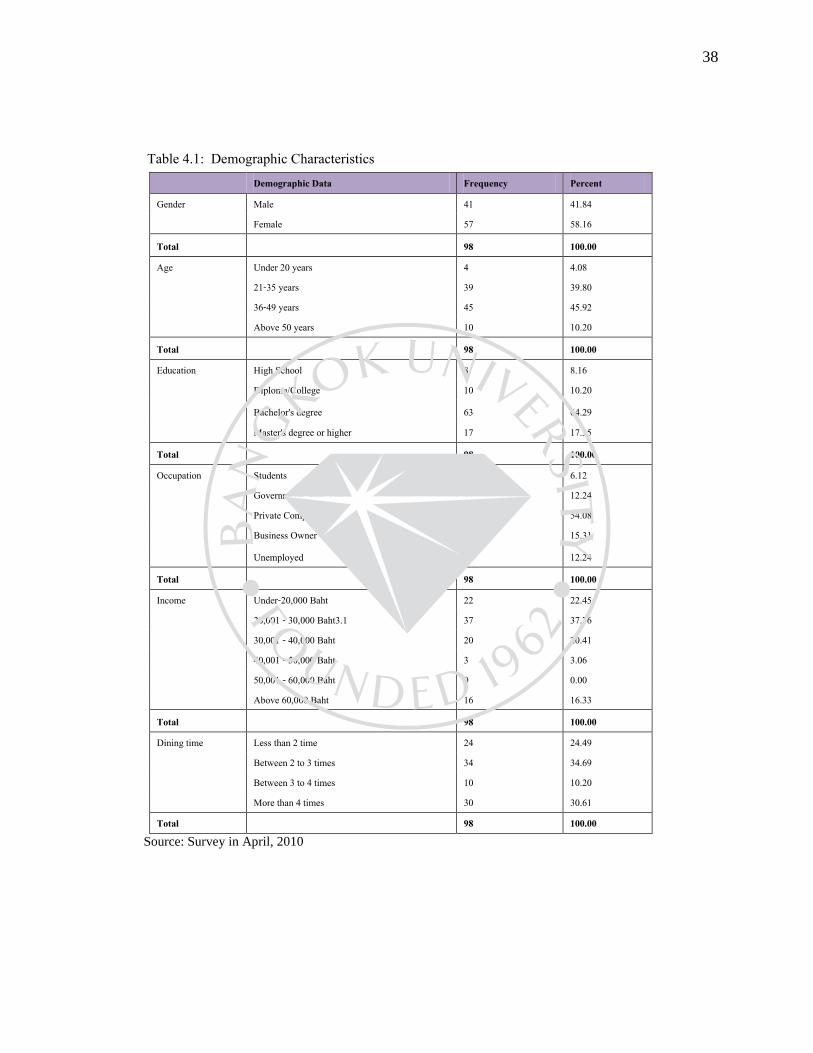
In determining a respondent’s overall attitude toward the performance of the restaurant, research would take each of the individual derived attitude scores for each factor and simply add them together into one composite score that could range between 10 (10 attributes × 1 = 10) on the low end and 360 (10 attributes×36 = 360) at high end. Again, interpretation of the composite scores would be that the lower the composite value, the weaker the overall attitude and the higher the score, the stronger the attitude (Hair, 2006, P.419). Secondly, Part 4 of the questionnaire used the MODE model (Fazio, 1990) to test if there is a positive relation between when a participant has high motivation, high-opportunity and the selecting Oyster restaurant. For Part 4, the questions are designed trying to ascertain manipulate motivation opportunity on behavior intention, like: the persons’ social beliefs, perceived social pressure, or subjective norm. Manipulative motivation opportunity effects on behavior intention are determined by the person’s perception of how referent individuals or groups think that he should behave in a situation (books.google.co.th/books,2010.April). Participants need to answer a few questions on how likely they would attend the restaurant. The MODE model test is used to determine whether when a participant has high motivation, high-opportunity they will choose the restaurant more positively. 4.2 Data results from Demographic Characteristics The statistic used in this part is descriptive, with the demographic data broken down by frequencies and percentage. It presents the participants’ information so that the restaurant’s market segmentation can be identified.
38
Table 4.1: Demographic Characteristics
Demographic Data Frequency Percent
Gender Male 41 41.84 Female 57 58.16 Total 98 100.00 Age Under 20 years 4 4.08 21-35 years 39 39.80 36-49 years 45 45.92 Above 50 years 10 10.20 Total 98 100.00 Education High School 8 8.16 Diploma/College 10 10.20 Bachelor's degree 63 64.29 Master's degree or higher 17 17.35 Total 98 100.00 Occupation Students 6 6.12 Government/ State Enterprises 12 12.24 Private Company 53 54.08 Business Owner 15 15.31 Unemployed 12 12.24 Total 98 100.00 Income Under-20,000 Baht 22 22.45 20,001 - 30,000 Baht3.1 37 37.76 30,001 - 40,000 Baht 20 20.41 40,001 - 50,000 Baht 3 3.06 50,001 - 60,000 Baht 0 0.00 Above 60,000 Baht 16 16.33 Total 98 100.00 Dining time Less than 2 time 24 24.49 Between 2 to 3 times 34 34.69 Between 3 to 4 times 10 10.20 More than 4 times 30 30.61 Total 98 100.00
Source: Survey in April, 2010

39
4.3 Seafood Restaurant Ten Determinants Ranking This part presents the scores of determinants of seafood restaurant selection and a summary of determinant mean scores. The scale measurement is from a lowest of 1 standing for ‚Not at all important‛ to highest score of 6 which stands for ‚extremely important‛. Table 4.2: Seafood Restaurant Selection Score Summary
Determinants
Total Score
Mean
Score Rank
Quality of food 509 5.19 1 Knowledgeable employees 329 3.36 8 Food taste 501 5.11 2 Reasonable price 499 5.09 3 Speed of service 413 4.21 4 Convenience of location 382 3.90 6 Dining atmosphere 390 3.98 5 Wide variety selection 361 3.68 7 Ad & promotion 259 2.64 9 Valet parking 240 2.45 10
Source: Survey in April, 2010

40
4.4 Fishbein’s Model Data Results The following data represents the result of Fishbein’s multi-attribute model used on Oyster restaurant perception. Interpretation of the group’s average composite attitude score would be, the lower the composite value, the weaker the overall attitude and the higher the score, the stronger the attitude. Part A: To analyze the group attitude towards a particular attribute, the process involves first calculating the individual composite scores for each of the ten restaurant attributes and adding those scores together. Then the average attitude for each attribute is calculated. The scores range from l to 36. A score rank is given to each of the attributes. Table 4.3: The Group Attitude Towards Particular Attributes
Attribute
∑(bᵢ eᵢ)
Mean
Max
Min
Score Rank
Quality of food 2752 28.08 36 4 1 Knowledgeable employees 1406 14.34 36 4 5 Food taste 2553 26.05 36 4 2 Reasonable price 1488 15.18 25 5 4 Speed of service 1143 11.66 20 3 7 Convenience of location 1258 12.83 30 2 6 Dining atmosphere 1689 17.23 36 4 3 Wide variety selection 881 8.98 30 1 8 Ad & promotion 522 5.32 18 1 9 Valet parking 483 4.92 18 1 10
Source: Survey in April, 2010
41
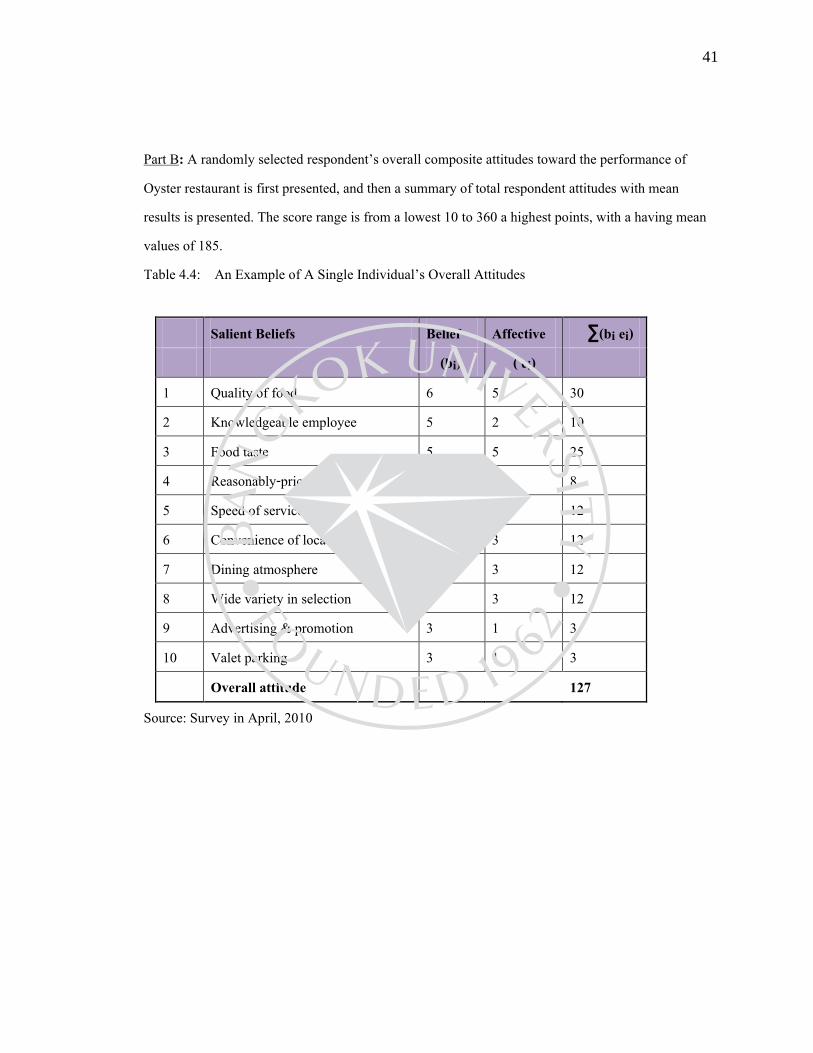
Part B: A randomly selected respondent’s overall composite attitudes toward the performance of Oyster restaurant is first presented, and then a summary of total respondent attitudes with mean results is presented. The score range is from a lowest 10 to 360 a highest points, with a having mean values of 185. Table 4.4: An Example of A Single Individual’s Overall Attitudes
Salient Beliefs Belief Affective ∑(bᵢ eᵢ) (bᵢ) ( eᵢ) 1 Quality of food 6 5 30 2 Knowledgeable employee 5 2 10 3 Food taste 5 5 25 4 Reasonably-priced 2 4 8 5 Speed of service 3 4 12 6 Convenience of location 4 3 12 7 Dining atmosphere 4 3 12 8 Wide variety in selection 4 3 12 9 Advertising & promotion 3 1 3 10 Valet parking 3 1 3 Overall attitude 127
Source: Survey in April, 2010

42
Table 4.5: Total Respondents Overall Attitude Result.
Number Overall score 1 169 122 124 137 199 138 154 2 96 127 158 120 135 141 166 3 164 136 168 151 161 136 135 4 157 161 124 126 181 126 169 5 167 136 178 150 138 149 138 6 153 118 123 138 150 115 160 7 146 108 181 184 130 143 130 8 140 123 135 190 127 153 165 9 167 170 69 156 150 141 10 127 166 152 127 141 143 11 130 147 150 169 146 138 12 113 142 138 101 122 158 13 153 194 161 156 139 166 14 131 147 145 102 144 138 15 169 158 150 146 141 123 Sub-Total 2182 2155 2156 2153 2204 2108 1217
Total
14175 Average 144.64
Source: Survey in April, 2010

43
Figure 4.1: Summary of Overall Attitudes
4.5 MODE Model Data Results This part presents the data collected from questionnaire part 4. The data presents the results of increasing the effective on consumer’s motivation and opportunity at Oyster restaurant.
4.10%
93.87%
2.04%
Above 184
Between 100-183
Low than 99

44
Table 4.6: Data Analysis of Consumer’s Intention
Source: Survey in April,2010
Total Definitely attending
Probably attending
Probably not attending
Definitely not attending
Count % Count % Count % Count % Friend recommend 37 21.39 51 12.91 10 5.24 0 0.00 Family or friend celebration 23
13.29 56
14.18 13
6.81 6
24.00
Restaurant promotion 18 10.40 42 10.63 36 18.85 2 8.00 Knowing brand 15 8.67 52 13.16 29 15.18 2 8.00 Attractive sign 9 5.20 50 12.66 33 17.28 6 24.00 Variety of food selection 24
13.87 48
12.15 26
13.61 0
0.00
Get invited by somebody 35
20.23 51
12.91 12
6.28 0
0.00
Advertising awareness 12 6.94 45 11.39 32 16.75 9 36.00 Total 173 395 191 25
% for each selection 22.07 50.38 24.36 3.19
45
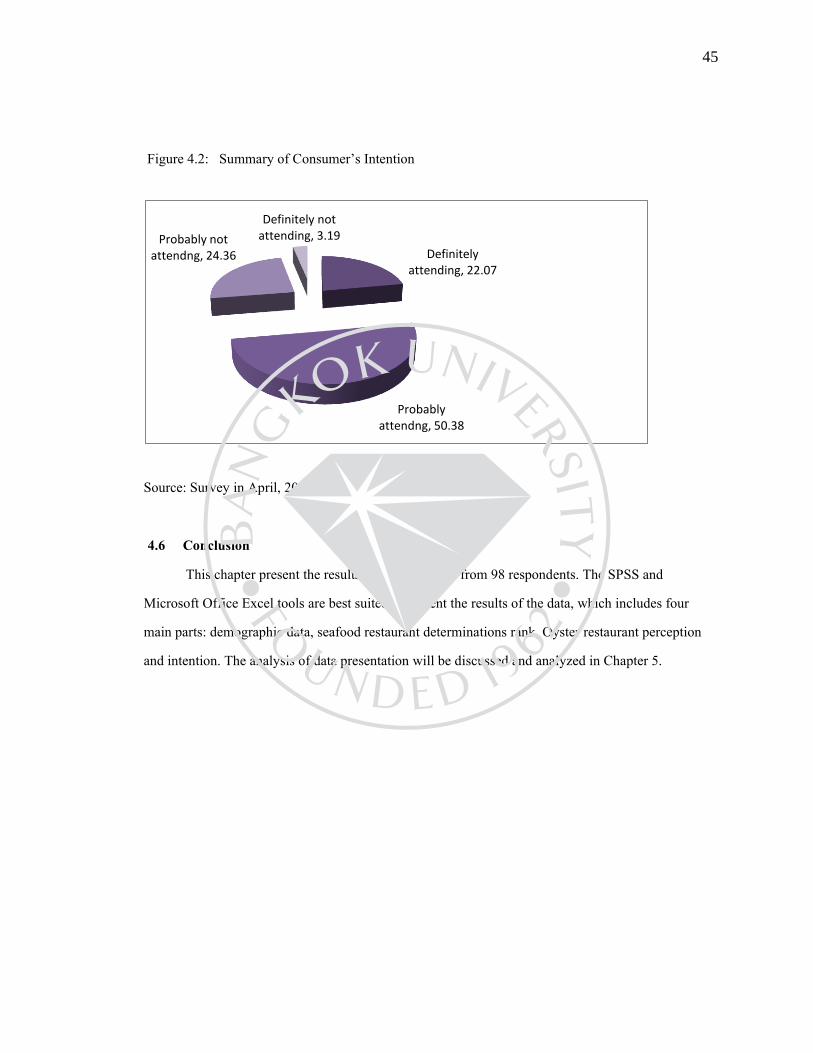
Figure 4.2: Summary of Consumer’s Intention
Source: Survey in April, 2010
4.6 Conclusion This chapter present the results of data collected from 98 respondents. The SPSS and Microsoft Office Excel tools are best suited to present the results of the data, which includes four main parts: demographic data, seafood restaurant determinations rank, Oyster restaurant perception and intention. The analysis of data presentation will be discussed and analyzed in Chapter 5.
Definitely attending, 22.07
Probably attendng, 50.38
Probably not attendng, 24.36
Definitely not attending, 3.19

46
CHAPETER FIVE DATA ANALYSIS
This chapter analyzes and summarizes the data findings based upon the data presentation presented in Chapter 4.The data will be presented here are to answer the research questions. The data analysis in this chapter consists of five parts as follows: 5.1 Demographic Data Analysis This research required sample size is 110 (p35 Yamane’s table). But when the questionnaires were returned, 12 respondents did not complete the questionnaire. Per research methodology demands, this data cannot be included, so I consider that data from 98 respondents (89.09%) is still acceptable. There are forty-one males and fifty-seven females. Table 4.1 in Chapter 4 shows that 45.92% of the respondents are age 36-49 years old, followed by 39.80% that are 21-35 years old. And 63% of them have a bachelor’s education background, while 17% have a master’s degree. For occupation information, majority (53%) is working for private companies and business ownership is second at 15%. Next, most of the respondents earned monthly rates of 20,001 – 30,000 Baht (37%), followed by under 20,000 Baht (22.45%) and 30,001 to 40,000 Baht (20.4%). Last time dining was: 34.69% respondents selected 2 to 3 times, more than 4 times has 30.61%. Rest is 24.49% respondents went to less than 2 times, 10.20% went between 3 to 4 times. It indicates that the Oyster restaurant primary market segmentation is between 36-49 years old, has a bachelor education background, most are working for private companies and monthly income is 20,001 to 30,000 Baht. The secondary target market is age 21 to 35 years old and the monthly income is under 20,000 Baht.

47
5.2. Ten Seafood Restaurant Determinants Ranking In comparing ten determinants of seafood restaurant’s perception means, this research ranked the mean of dimensions as follows: the highest score was ranked 1 and the lowest score was ranked 10. According to Table 4.2, determinants could be divided into three parts, a high range (ranks 1,2,3) , a middle range (4,5,6,7,8) and low range (9,10). Firstly, top three determinants include Quality of food with a mean value 5.19, Food taste with a mean value 5.11 and Reasonable price with a mean value 5.09. This implies that customers gave top priority consideration to the restaurant which can provide high quality food, and both food taste and reasonable price are also important factors in selection process. Secondly, Speed of service, Dining atmosphere, Convenience of location, Variety menu selection and knowledgeable employees are in the middle range. Regarding meaning of these factors shown in Chapter 2, it indicates that customers perceived that speed of service, variety selection and knowledgeable employees are involved in the examination of restaurant service characteristics, and Location in terms of time as well as actual distance is a condition which consumer may consider. Dining atmospheres is the physical properties of restaurant; it can also increase the odds on a consumer’s selection willing behavior on a restaurant. Thirdly, Advertisement & promotion (2.64) and Valet parking (2.45) are the lowest scores in the ranking. It shows the respondents are not focused much on these factors when they select a seafood restaurant. 5.3 Fishbein’s Model Data Results Analysis In Fishbein’s attitude-to-behavior measurement approach, equal emphasis is given to measuring both a person’s beliefs (cognitive) and a person’s feelings (affective) toward the attributes of the object under investigation. This modeling approach provides researchers and decision makers with a lot of diagnostic insight into the components that make up the consumer’s attitude. Decision

48
markers can learn how and what the customer used to evaluate the potential or actual performance of a given object (2006, P.423) 5.3.1 Data Analysis on Each Particular Attribute Table 4.3 represents the group attitude results to ten attributes of Oyster restaurant. It shows all selected respondents overall attitude to each particular attribute. It implies that customers viewed that Quality of food and Food taste are the stronger factors for Oyster restaurant. Dining atmosphere is the next, followed by Reasonable price and knowledgeable employees. Rank position levels 7 and 8 are Convenience of location and Speed of service. The weaker attributes for this restaurant are Wide variety selection, Ad& promotion and Valet parking which are ranked at the last three positions. In addition, comparing Table 4.2 and 4.3, shows that both Food quality and Taste of Oyster restaurant got the highest perceptions values (28.08 and 26.05) among the ten attributes. Regarding this, it implies that consumers perceived that Oyster restaurant served high quality materials and good tasting food. Next, most of the customers considered that the Dining atmosphere, knowledgeable employee and Location of this restaurant are also good. These scores got higher ranks when compared with normal seafood restaurant expectations. Moreover, consumers got same beliefs of Location, Ad &promotion and Parking, which ended up at the same position on both tables (6, 9 and 10). On the contrary; a majority of participants were not satisfied with the restaurant’s three lowest ranking attributes: Price, Speed service and Variety of food selection. It shows that consumers thought the restaurant may not offer a suitable price for food value; service speed is too slow and has limited food selection. 5.3.2 Restaurant Overall Evaluation From the table 4.4, it was that there is a weak empirical relationship between consumer’s attitudes towards Oyster restaurant and their selection behavior. The group‘s overall score on

49
composite performance attitude toward the Oyster restaurant is 14175, while mean value is only 144.64, which is lower than the expected mean value of 185 points. It shows the Oyster restaurant did not form a very favorable impression on the customers, Moreover, Figure 4.1 gives a detailed analysis from the data results of table 4.4. It indicates that 93.7% of consumers gave an overall score between 100 and 183, only 4.10% rated the score higher or equal to the expected mean value, and 2.04% of consumers gave the lowest score 69 and 98. 5.4 MODE Model Data Analysis According Figure 4.2, more than half of the respondents selected the probably attending (50.38%), definitely attending is 22.07% and only a small number of respondents (3.19%) selected definitely not attending. It implies that to motivate customers to make the best choice, the suggestion for the restaurant is that greater attention should be given to the attributes of each potential attitude, like promotion (Grill, 2009, P.210). Table 4.5 indicates that when a consumer has both motivation and opportunity, a deliberative decision-making process may ensue. MODE confirmed that only participants in a high motivation, high-opportunity condition believed the restaurant were better. And Table 4.5 column of probably attending which majority customers selected indicates that weak attitudes can be effort fully improved: 18.85% consumer considered coming if restaurant give a promotion, 17.28% selected when restaurant sign is more attractive, 13.61% customers would like to go when restaurant increase food selection 5.5 Conclusion This chapter analyzed the data results presented in Chapter 4. Primary and secondary target markets are founded. And the differentiation selecting behavior between a normal seafood restaurant and Oyster restaurant is compared. Also both models data results are analyzed. The summary of the data analysis will be will presented and discussed in the next chapter.
50
CHAPTER SIX CONCLUSION AND RECOMMENDATIONS
This chapter summarizes the main findings of the research in this study and will answer the research questions posed. Chapter 6 includes a summary of the study, a discussion of the findings, and recommendations. The last part is a conclusion. 6.1 Summary of the Study This study is about consumer attitude toward Oyster restaurant which is located at New Sathron area. The intention of the study is to validate the existing theories of the determinants of consumer attitude on selecting a restaurant and tries to answer the main research questions and sub-questions that were stated in chapter 1. Using quantitative information research practices to collect the necessary data, the scales were developed, tested and administered to a randomly selected sample of 98 known customers by using the cluster sampling data collection method. The sample size is less than planned because some participants did not fill the questionnaire out completely, data was processed with the SPSS program and Windows Excel tools. Research questions are answered in Fishbein’s Attitude model and Fazio’s MODE model discussion. 6.2 Fishbein’s Attitude Model Discussion Fishbein’s multi-attribute model provides researchers and decision makers with a lot of diagnostic insight into the components that make up the consumer’s attitude. Decision markers can learn how and what the customer used to evaluate wither the potential or actual performance of a given object (Hair,2006, P.423). It stated a linkage between brand evaluations and intended or actual behavior: A positive (negative) attitude toward a brand will increase (decrease) the likelihood that
51
consumers intend to buy it. Positive buying intentions are likely to lead to actual behavior (A, Henry, 5e; 1995, P.285). Question 1: How do consumers evaluate value determinant factors in selection of the Oyster seafood restaurant? According to data analysis in Chapter5 topic 5.3.2, the result shows that consumers did not form a positive attitude toward the Oyster restaurant. Overall evaluation of the restaurant (Ao = ∑bᵢeᵢ ) not tied to situational factors while conduct selection behaviors (Ao = 144.64 < ×185). Only 4.10% respondents rated Oyster restaurant higher or equal to the expected mean value, 95.9% respondents gave scores lower than that. Question 2: What is the Oyster seafood restaurant’s potential market segment? From chapter5 topic 5.1 Demographic Data Analysis, the results indicates that the Oyster restaurant primary market segmentation is between 36-49 years old, has a bachelor education background, most are working for private companies and monthly income is 20,001 to 30,000 Baht. The secondary target market is age 21 to 35 years old and the monthly income is under 20,000 Baht. Question 3: What are the factors consumers deem important in making seafood dining restaurant choice decisions? From topic 5.3.1 in Chapter 5, Oyster restaurant’s particular attributes analysis, we know that the restaurant still has a good market opportunity. The particular strengths of the restaurant are: it focuses on serving a broad selection of oyster and features the signature “Fresh List” highlighting an impressive variety of fresh seafood. Findings from the semantic differential data structures revealed that customers perceived Oyster restaurant as having a good reputation as a seafood restaurant that offered high-quality, stylish food.

52
Next, customers like the food taste and dining atmosphere. And customers’ feel the staff is very knowledgeable and friendly. The location is also expected. Chapter 5 analyses also show the restaurant’s weakness. The main problems include: Reasonable price. It had only an average assortment of items that score somewhat high priced. It implies that customers expected the price to be more fixable combine with different food offered and need provide prompt service. Speed of service is also unexpected, which implies that consumers are satisfied with the staff service but food wait time is not satisfactory. The Oyster restaurant needs to improve the food service. Variety of food selection: Table 4.3 shows clearly that variety of food selection is ranked 8, but customers believed the variety of food selection should be higher than this rank. Consumers expected the restaurant to offer different food in consideration of non-seafood eaters. Therefore, the restaurant must emphasize on improving on reasonable- price as top priority since it was the top three determinants that consumer expected. Speed of service and variety of good selection should combine to be a service strategy for the restaurant. 6.3. Fazio’s MODE Model Discussion MODE model predictions: (Fzaio1990,1999). Situations lead people to engage in effortful and deliberate reflection upon their attitude when formulating behavioral intention. It is when people formulate behavioral intentions through effortful reflection that the relationship between a person’s personal attitude and his behavior is not always straightforward. The theory of reasoned behavior (Fishben & Ajzen,1975,1980) according to the Fazio’s MODE model states that: behavioral intention compares both personal factors (the personal attitude and his or her perceived level of behavioral control) and social factors (social norms).
53
Question 4: When motivation and opportunity for Oyster restaurant selection is higher, what is the consumer’s intention? According Chapter 5 topic 5.4, the respondents selected the probably attending are 50.38% and definitely attending customers are 22.07%. It implies that there is high attendance opportunity exit for the restaurant. With detail analysis of dimensions, the motivation or opportunity includes: Family or friend celebration got most favorite motive (14.18%); Friend recommend (12.91%) and followed by Get invited by somebody (12.91). Therefore, these factors indicate that opinion influence by friend or family can affect consumers frequently turn to others. Other factors that can affect the consumer’s intention to select the Oyster restaurant are Knowing this brand better got second place (13.16%). giving consumer promotion (10.63), Attractive sign is next (12.66), All these relate to the restaurant’ awareness. All this strategies can increase the word-of –mouth influence happens. 6.4 Recommendations With the MODE model result at total 72.45% (50.38%+22.07) participants would like to attend the restaurant, it can be seen that more than half of the respondents would like to select this restaurant. So in case to increase the highly accessible attitudes spontaneously to guide selection behavior, Oyster restaurant can influence customers’ perception in a particular target or situation. Here, the motivation to make the best choice is high, suggesting that greater attention will be given to the attributes for changing consumers beliefs. However, efforts should be made to increase the awareness of the restaurant. Regarding topic 6.3, to give sufficient motivation to the restaurant’s potential consumer, a few salient features or beliefs about a restaurant can be emphasized. A lot of marketing effort should be concerned with trying to change attitudes so as to persuade people to buy something for the first time or to repeat purchase .Advertisers, using this example, might be
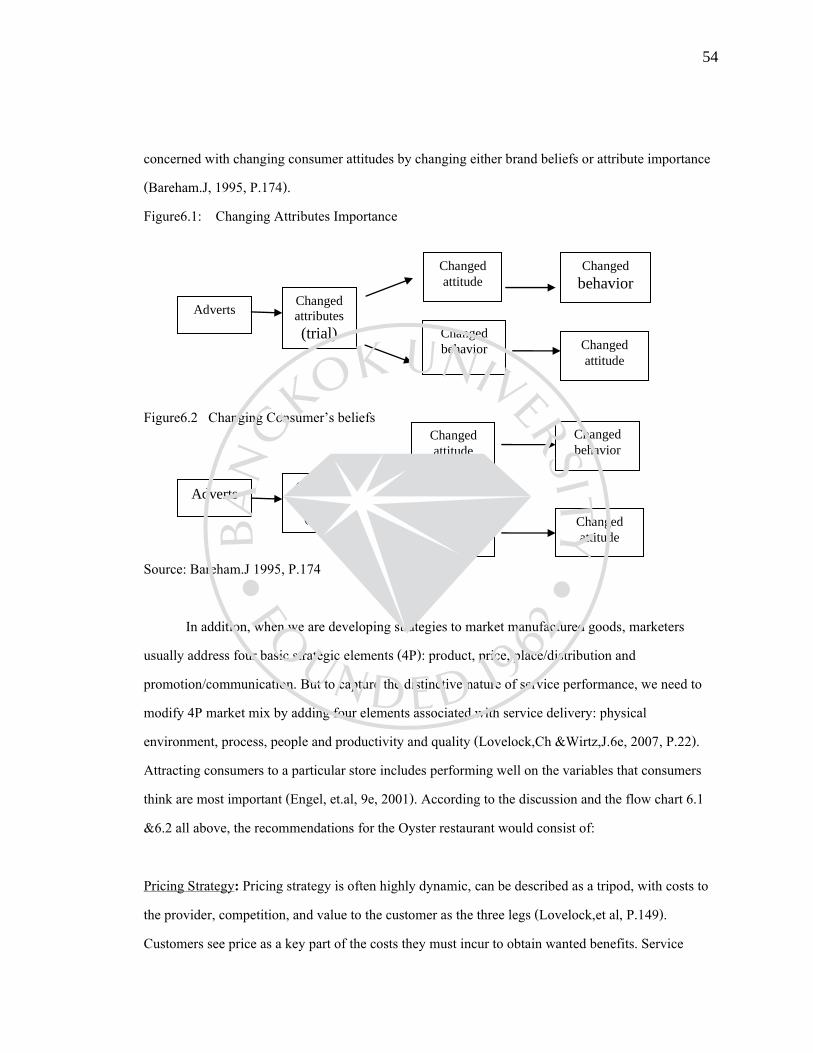
54
concerned with changing consumer attitudes by changing either brand beliefs or attribute importance (Bareham.J, 1995, P.174). Figure6.1: Changing Attributes Importance
Figure6.2 Changing Consumer’s beliefs
Source: Bareham.J 1995, P.174 In addition, when we are developing strategies to market manufactured goods, marketers usually address four basic strategic elements (4P): product, price, place/distribution and promotion/communication. But to capture the distinctive nature of service performance, we need to modify 4P market mix by adding four elements associated with service delivery: physical environment, process, people and productivity and quality (Lovelock,Ch &Wirtz,J.6e, 2007, P.22). Attracting consumers to a particular store includes performing well on the variables that consumers think are most important (Engel, et.al, 9e, 2001). According to the discussion and the flow chart 6.1 &6.2 all above, the recommendations for the Oyster restaurant would consist of: Pricing Strategy: Pricing strategy is often highly dynamic, can be described as a tripod, with costs to the provider, competition, and value to the customer as the three legs (Lovelock,et al, P.149). Customers see price as a key part of the costs they must incur to obtain wanted benefits. Service
Adverts Changed attributes
(trial)
Changed
attitude
Changed
behavior
Changed
behavior
Changed
attitude
Adverts Changed
beliefs
(trial)
Changed
attitude
Changed behavior
Changed
behavior
Changed
attitude
55
marketers may need to understand and seek to minimize possible conditions. Like: additional monetary costs, time expenditures, unwanted mental and physical effort, and exposure to negative sensory experiences. From topic 6.2 discussion, the customers thought the price of the Oyster restaurant did not match the food value. The restaurant must ensure that their food price will consider how the customer feels and try to minimize negative experience. One price strategy may consider that offer the lower price on certain foods, to attract customers whose only loyalty to the restaurant with regularly low price service. Communication/Promotion: Communication efforts serve not only to attract new customers but also to maintain contact with an organization’s existing customers and build relationships with them. No marketing program can succeed without effective communications (Lovelock,et al, P.155). In case to persuading target customers of the merits of a restaurant awareness, and encouraging them to take action. The marketing communications mixes for the restaurant may focus on: Personal communications: The restaurant should concentrate on the customer service and training of the employees. To avoid the speed of service problem, the restaurant may need good corporate between chef and staff. Restaurant one side of the restaurant to train staff or cut off unnecessary time waste and another side could offer some magazines, books or TV for customers watch while waiting. Advertising: As the dominant form of communication in consumer marketing, advertising is often the first point of contact between service marketers and their customers, serving to build awareness, inform, persuade, and remind (Lovelock,et al, P.169). How to let consumer notice the restaurant name? The restaurant may need to increase the awareness by outdoor media like, billboards, posters. These methods can target specific geographic areas easier. Another way can be deliver restaurant message on printed magazines or newspapers.
56
Sales Promotion: Sales promotions for service firms may take such forms as samples, coupons and other discounts, gifts and competitions with prizes. It can add value, provide a “competitive edge”, boost sales during periods when demand would otherwise be weak (Lovelock,et al:171). For Oyster restaurant may need to add food variety according topic 6.2. The customer felt that was not enough of a selection besides the oysters. They expect the restaurant to offer food besides oyster. For example, a lunch set menu of steaks or rice set available for those who do not like seafood. The purpose is to make a high quality, diverse menu for everyone from casual diners, families and tourists to businesses and special occasion diners. Second, other promotions may include have some daily or monthly promotions, give a number card for regular guests, or add some wine options to combine with the oyster on special events or dates. Physical Environment: The appearance of buildings, landscaping, vehicles, interior furnishing, equipment, staff member’s uniforms, sign, printed material and other visible cues all provide tangible evidence of a firm’s service quality (Lovelock,et al:22). Physical surroundings help to shape appropriate feelings and reactions in customers and employees. Oyster restaurant is located at condo-style building; there is not absolutely sign to catch consumers’ eyes. For this facility, a suggestion is to place a advertising board on the road which can be combined with other shop’s signs together. To give better service environments, options maybe add some chairs and tables outside of the restaurant. Productivity and Quality: It defined as the task of value enhancement requires quality improvement programs to deliver and continuously enhance the benefits desired by customers (Lovelock,et al, P.417). To be more productivity, the restaurant must beware of making inappropriate cuts in service. For example, restaurant should think about cutting unnecessary waiting time. Combining both productivity and quality, restaurant can increase customer satisfaction for building customer loyalty.

57
6.5 Conclusion This study was conducted in order to determine the customer’s behaviour during seafood restaurant selection. From this study, the customers of Oyster restaurant did not perceive the restaurant as the best selection for their casual seafood dining. The restaurant needs to be aware of the reasons, and consider few marker strategies on price, promotion/communication, physical environment and productivity /quality. Apart from the data provided in each chapter that can be benefit to the restaurant owner, and this study also gives the researcher a learning opportunity. First is basic research knowledge, like: how to conduct research process and right research methodology; how to identify and analysis the important data which related to the research study. Second is about logical thinking. For example: how to conduct the research in appropriate way and how to create the research instrument logically. Finally, communication skill, by doing this study the researcher have learnt how to create an efficiency communication.
58
BIBLIOGRAPHY
Assael, Henry. (1995). Condumer Behavior and marketing action. South-Western College Publishing Cincinnati, Ohio. Blackwell.D.Royer, Miniard.W.Paul & Engel.F.James . Consumer Behavior. South-Westen 5191 Naterp Boulevaud 450054 Bareham.Jonathan (1995). Consumer Behavior in the Food Industry, A European Perspective. Butterworth-Heinemann Ltd Liancre House, Jordan Hill, Oxford OX2 8DP Brown.J.Tom & Churchill.A.Gilbert. (2004). Basic Marketing Research. South-Westernm, part of Thomson Corporation. Printer: Donnelley R.R. & Ohio.W Churchill.A.Gilbert & Lacobucci.Dawn (1991). Market Research Methodological Foundation Seventh Edition. South-Western, U.S.A Cravens, W Daid. (1982, 1987, and 1994). Strategic Marketing. Fourth Edition. Richard. Irwin, INC., Engel.F.James & Miniard.W.Paul & Blackwell.D.Roger, (2001). Consumer Behavior, Ninth Edition, Harcourt, Inc. Harcourt College Publishers. Fill Chris (1999). Marketing Communications, Contexts, Contents &Strategies. Prenticae Hall Campus 400, Hemel Hempstead Hertfordshire HP2 7E2 Fitzsimmons.J & Fitzsimmons M (1998), Service Management;Operatiuons, Stragegy & Information Technology. The Morgraw-Hill Companies., Inc. Hair,Joseph. F, Bush, Robert P & Ortinau, David j, (2000, 2003, 2006). Marketing Research Within a Changing Information Environment. Thide edition, McGraw-Hill/Irwin, a business unit of The McGraw-Hill Companies, Inc.1221. Kanuk.L.Leslie & Schiffman.G.Leon (1987,1991,1997,2000,2004). Consumer Behavior.Eighth Edition. Pearson Education, Inc., Upper Saddle River, New Jersey, Kardes.R.Frank. ( 1999, 2002). Consumer Behavior and Managerial Decision Making. Second Edition. Pearson Education, Inc., Upper Saddle River, New Jersey,

59
Lovelock, Ch & Wirtz, Jochen. ( 2004, 2007). Service Marketing people, thchnology, strategy, Sixth Edition. Christopher H.Lovelock and Jochen Wirtz. McDanniel,Jr.C & Roger, Gates. (2007). Marketing Research, seventh Edition,John Wiley & Sons,Inc.111 River Street, Hoboken. Malhotra,K. Naresh. (2002). Basic Marketing Research Applications to contemporary issues, Pearson Education, Inc, Upper Saddle River, New Jersey. Printed in the U.S.A. Peter.S.Paul & Olson.c.Jerry. Consumer Behavior and Marketing Strategy. Seventh Edition. McGraw-Hill New York.NY.1002 Well.D.William & Preusky.David (1996), Consumer Behavior. Johm Wiley & Sons.Inc . Canada Worcester, M.R & Downham.J. Consumer Market Research Handbook. Third Edition. Great Britain at the University, Cambridge. Wilkie.L.Willion (1986, 1994). Consumer Behavior. Third Edition. John Wiley & Sons Inc. Canada Zikmund.G.William. (2000). Business Research Methods. Sixth Edition. South-Western, a division of Thaoson Learning. Publisher: Mike RocheBandid Nijathaworn ,Bank of Thailand Deputy Governor, Bangkok Post.Yanyong phuangrach, permanent secretary to the Commerce Ministry of Thailand. Bangkok Post. Bangkok Post: business world. Saturday, February 28, 2009. Source: Consumer Price Index, Commerce Ministry.Bangkok Post: business world. Tuesday, December 1, 2009. Article: Output rises as exports improve. Source: Bank of Thailand. Major economic indicators. http://books.google.co.th/books?id=wmph8grxWpAC&pg=PA275&lpg=PA275&dq=example+of+Fazio's+MODE, 2019,March. http://www.sykronix.com/tsoc/courses/cb/cb_fsh.htm http://www.atkinson.yorku.ca/~lripley/cbUattitude.htm Expat weekend Thailand magazine (2008) , about Oyster Bar restaurant introdution.p23 http://www.infosurv.com/customer-attitude-survey.htm, 2010, March http://books.google.co.th/books?id=wmph8grxWpAC&pg=PA275&lpg http://en.wikipedia.org/wiki/Sampling_(statistics) ,2010,March
60
APPENDIX
Appendix A: The coding structures for questionnaire part 1: Demographic data
Number Variables Coding
1 Gender 1=male , 2=female
2 Age 1= Under 21 years, 2=21-35 years, 3= 36-49 years,
4= Above 49 years old
3 Education Level 1= High School or below, 2= Diploma/ College,
3= Bachelor’s degree, 4= Master’s degree or higher
4 Occupation 1= Students, 2= Government/ State Enterprises, 3=
Private Company, 4= Business Owner, 5= Unemployed
5 Income per month 1= Under 20,000 Baht, 2= 20,001–30,000Baht,
3= 30,001–40,000Baht, 4= 40,001 –50,000Baht,
5= 50,001–60,000Baht, 6= Above 60,00 Baht
6 Dining time 1= Less than 2 times, 2= 2 to 3 times, 3= 4 times ,
4= More than 4 times

61
Appendix B: Survey Questions
Thanks you for your participation in this interesting study. The questionnaire is for a research project conducted by a Master of Business Administration graduate student of the International Program at Bangkok University. Your participation will aid us in determining what people think about the seafood restaurant. This questionnaire is composed of four parts. Please read the instruction carefully before completing the questions. Please mark . Before you give the answer, we would like you to answer two questions first: 1. Do you eat seafood, if yes, 2. Do you know the Oyster restaurant? If both answers are yes, please continue questionnaire.
Part 1: Demographic data
1. Please indicate your gender
1. Male 2. Female
2. Into which age group do you fall?
1. Under 21 years 2. 21 – 35 years
3. 36 – 49 years 4. Above 49 years old
3. Please select the last level of schooling you completed?
1. High School or below 2 Diploma/College
3. Bachelor degree 4. Master degree or higher
4. Which one of the following categories best describes the nature of your work?
1. Students 2. Government/ State Enterprises
3. Private Company 4. Business Owner
5. Unemployed (e.g. housewives, retire, job seekers)

62
5. Income per month
1. Under - 20,000 Baht 2. 20,001 – 30,000 Bath
3. 30,001 – 40,000 Baht 4. 40,001 – 50,000 Baht
5. 50,001 – 60,000 Baht 6. Above 60,000 Baht
6. How often have you dined at sea food restaurants in the last six months?
1. Less than 2 times 2. 2 to 3 times
3. 4 times 4. More than 4 times
Part 2: Determinants of Seafood Restaurant Choice
A: Affective (importance) scale measurement. To capture respondents’ emotional importance
(eᵢ), the following scale measurement was developed. Using the scale below, please mark for how you
feel each statement best describes how you assess the performance of a seafood restaurant.
Statement
Not at all
Important
(1)
Slightly
Important
(2)
Somewhat
Important
(3)
Generally
Important
(4)
Definitely
Important
(5)
Extremely
Important
(6)
1.Quality food
2.Knowledgeable
employees
3.Food taste
4.Reseaonably-price
5.Speed of service
6.Convenience of
location
7.Dining atmosphere
8.Wide variety in

63
selection
9.Advertising &
promotion
10.Valet parking
Part 3: Oyster Restaurant Perception
B. Cognitive (Belief) Scale Measurement
To capture respondents’ evaluative beliefs (bᵢ) about the restaurant, the following scale measurement was
developed .Think about all of your experiences with The Oyster restaurant or what you think an Oyster
seafood restaurant should perform? Please mark an in the box which best describes how important you
consider each statement.
Statement
Definitely
disagree
(1)
Generally
disagree
(2)
Slightly
disagree
(3)
Slightly agree
(4)
Generally
agree
(5)
Definitely
agree
(6)
11.Has quality food
12.Has Knowledgeable
employees
13.Has excellent food
taste
14.Has reasonably-price
15.Has quick service
16.Convenience of
location
17.Dining atmosphere

64
18.Wide variety in
selection
19.Advertising &
promotion
20.Valet parking
Part 4: Restaurant Intention
A. The MODE model behavior Intention Scale for Determining Attendance at Oyster Restaurant. Please
check how likely you would go to Oyster seafood restaurant based on the following reasons.
=====================================================================================
Definitely Would Probably Would probably Would Definitely Would
Consider Attending Consider Attending Not Consider Attending Not Consider Attending
1. Friends recommend me
2. Celebration for family or friends
3. Restaurant promotion
4. Store brand
5. Attractive restaurant sign
6. Variety of food selection
7. Invitation
8. Advertising
THANK YOU