Construction of a Voxel Model from CT Images with Density ... · The voxel models representing...
5
Progress in NUCLEAR SCIENCE and TECHNOLOGY, Vol. 2, pp.237-241 (2011) c 2011 Atomic Energy Society of Japan, All Rights Reserved. 237 ARTICLE Construction of a Voxel Model from CT Images with Density Derived from CT Numbers Mengyun CHENG 1,2,* , Qin ZENG 1,2 , Ruifen CAO 1,2 , Gui LI 1,2 , Huaqing ZHENG 1,2 , Shanqing HUANG 1,2 , Gang SONG 1,2 and Yican WU 1,2 1 Institute of Plasma Physics, Chinese Academy of Sciences (ASIPP), Hefei, Anhui, 230031, China 2 School of Nuclear Science and Technology, University of Science and Technology of China (USTC), Hefei, Anhui, 230029, China The voxel models representing human anatomy have been developed to calculate dose distribution in human body, while the density and elemental composition are the most important physical properties of voxel model. Usually, when creating the Monte Carlo input files, the average tissue densities recommended in ICRP Publication were used to assign each voxel in the existing voxel models. As each tissue consists of many voxels with different densities, the conventional method of average tissue densities failed to take account of the voxel’s discrepancy, and therefore could not represent human anatomy faithfully. To represent human anatomy more faithfully, a method was implemented to assign each voxel, the densities of which were derived from CT number. In order to compare with the traditional me- thod, we constructed two models from the cadaver specimen dataset. A CT-based pelvic voxel model called Pelvis-CT model was constructed, the densities of which were derived from the CT numbers. A color photo- graph-based pelvic voxel model called Pelvis-Photo model was also constructed, the densities of which were taken from ICRP Publication. The CT images and the color photographs were obtained from the same female cadaver spe- cimen. The Pelvis-CT and Pelvis-Photo models were both ported into Monte Carlo code MCNP to calculate the conversion coefficients from kerma free-in-air to absorbed dose for external monoenergetic photon beams with ener- gies of 0.1, 1 and 10 MeV under anterior-posterior (AP) geometry. The results were compared with those of given in ICRP Publication 74. Differences of up to 50% were observed between conversion coefficients of Pelvis-CT and Pel- vis-Photo models, moreover the discrepancies decreased for the photon beams with higher energies. The overall trend of conversion coefficients of the Pelvis-CT model agreed well with that of ICRP Publication 74 data. KEYWORDS: voxel, modeling, CT number, Monte Carlo, dosimetry I. Introduction 1 Human Models, which represent the whole or a part of the human body, are widely used in radiation protection. The first heterogeneous human model, known as Medical Inter- nal Radiation Dose (MIRD) model, was designed for the adult human. 1,2) This model described the shapes of human body and organs by combinations of mathematical equations describing planes, cylindrical, conical, elliptical and spheri- cal surfaces. Existing MIRD-based mathematical models are easy to compute and standardize, but they are simplified and crude compared with human anatomy. 3) With great devel- opment of computers and medical imaging techniques, researchers have been able to develop anatomically realistic models of the human body. In recent years, more than 30 voxel-based models varying in age, sex, and ethnicity have been developed worldwide from computed tomography (CT), magnetic resonance imaging (MRI), or color photograph reported in literature. 4,5) The voxel models representing human anatomy have been developed to calculate dose distributions in human body; For example, several Chinese adult male voxel phantoms were *Corresponding author, E-mail: [email protected] developed using the Chinese Visible Human images. 6,7) The density and elemental composition are the most important physical properties of voxel model; usually, the average tis- sue densities recommended in ICRP Publication 23 are used to tag each voxel in the existing voxel phantoms. However, as each organ or tissue consists of many voxels which are different in their densities, the method of average tissue den- sities can’t precisely represent human anatomy. Usually, dataset includes not only color photographs but also CT images obtained from the same cryosectioned human body. The color photographs can easily to segment organs and tissues though fail to offer the information of density. The CT images offer the information of density, but difficult to accurate segment organs and tissues. 8,9) If used the color photograph to segment the organ or tissue and using CT im- age to define the density of voxel, it will be a good method to construct the voxel model. In this study, the CT images and color photographs of the pelvic portion of a young female cadaver were used for the construction of voxel model. Based on color photographs, most of organs and tissue were segmented especially radi- osensitive female organs and tissues. After registering the voxels of CT image and color photograph, then the densities derived from the CT numbers are used to assign voxel. Thus,
-
Upload
truongdang -
Category
Documents
-
view
219 -
download
0
Transcript of Construction of a Voxel Model from CT Images with Density ... · The voxel models representing...
Progress in NUCLEAR SCIENCE and TECHNOLOGY, Vol. 2, pp.237-241 (2011)
c© 2011 Atomic Energy Society of Japan, All Rights Reserved.
237
ARTICLE
Construction of a Voxel Model from CT Images with Density Derived from CT Numbers
Mengyun CHENG1,2,*, Qin ZENG1,2, Ruifen CAO1,2, Gui LI1,2, Huaqing ZHENG1,2,
Shanqing HUANG1,2, Gang SONG1,2 and Yican WU1,2
1 Institute of Plasma Physics, Chinese Academy of Sciences (ASIPP), Hefei, Anhui, 230031, China 2 School of Nuclear Science and Technology, University of Science and Technology of China (USTC),
Hefei, Anhui, 230029, China
The voxel models representing human anatomy have been developed to calculate dose distribution in human body, while the density and elemental composition are the most important physical properties of voxel model. Usually, when creating the Monte Carlo input files, the average tissue densities recommended in ICRP Publication were used to assign each voxel in the existing voxel models. As each tissue consists of many voxels with different densities, the conventional method of average tissue densities failed to take account of the voxel’s discrepancy, and therefore could not represent human anatomy faithfully. To represent human anatomy more faithfully, a method was implemented to assign each voxel, the densities of which were derived from CT number. In order to compare with the traditional me-thod, we constructed two models from the cadaver specimen dataset. A CT-based pelvic voxel model called Pelvis-CT model was constructed, the densities of which were derived from the CT numbers. A color photo-graph-based pelvic voxel model called Pelvis-Photo model was also constructed, the densities of which were taken from ICRP Publication. The CT images and the color photographs were obtained from the same female cadaver spe-cimen. The Pelvis-CT and Pelvis-Photo models were both ported into Monte Carlo code MCNP to calculate the conversion coefficients from kerma free-in-air to absorbed dose for external monoenergetic photon beams with ener-gies of 0.1, 1 and 10 MeV under anterior-posterior (AP) geometry. The results were compared with those of given in ICRP Publication 74. Differences of up to 50% were observed between conversion coefficients of Pelvis-CT and Pel-vis-Photo models, moreover the discrepancies decreased for the photon beams with higher energies. The overall trend of conversion coefficients of the Pelvis-CT model agreed well with that of ICRP Publication 74 data.
KEYWORDS: voxel, modeling, CT number, Monte Carlo, dosimetry
I. Introduction1
Human Models, which represent the whole or a part of the human body, are widely used in radiation protection. The first heterogeneous human model, known as Medical Inter-nal Radiation Dose (MIRD) model, was designed for the adult human.1,2) This model described the shapes of human body and organs by combinations of mathematical equations describing planes, cylindrical, conical, elliptical and spheri-cal surfaces. Existing MIRD-based mathematical models are easy to compute and standardize, but they are simplified and crude compared with human anatomy.3) With great devel-opment of computers and medical imaging techniques, researchers have been able to develop anatomically realistic models of the human body. In recent years, more than 30 voxel-based models varying in age, sex, and ethnicity have been developed worldwide from computed tomography (CT), magnetic resonance imaging (MRI), or color photograph reported in literature.4,5)
The voxel models representing human anatomy have been developed to calculate dose distributions in human body; For example, several Chinese adult male voxel phantoms were
*Corresponding author, E-mail: [email protected]
developed using the Chinese Visible Human images.6,7) The density and elemental composition are the most important physical properties of voxel model; usually, the average tis-sue densities recommended in ICRP Publication 23 are used to tag each voxel in the existing voxel phantoms. However, as each organ or tissue consists of many voxels which are different in their densities, the method of average tissue den-sities can’t precisely represent human anatomy.
Usually, dataset includes not only color photographs but also CT images obtained from the same cryosectioned human body. The color photographs can easily to segment organs and tissues though fail to offer the information of density. The CT images offer the information of density, but difficult to accurate segment organs and tissues.8,9) If used the color photograph to segment the organ or tissue and using CT im-age to define the density of voxel, it will be a good method to construct the voxel model.
In this study, the CT images and color photographs of the pelvic portion of a young female cadaver were used for the construction of voxel model. Based on color photographs, most of organs and tissue were segmented especially radi-osensitive female organs and tissues. After registering the voxels of CT image and color photograph, then the densities derived from the CT numbers are used to assign voxel. Thus,
238 Mengyun CHENG et al.
PROGRESS IN NUCLEAR SCIENCE AND TECHNOLOGY
the voxel model was constructed. The conversion coefficients from kerma free-in-air to absorbed dose of this model calcu-lated by Monte Carlo method were in comparison with those of the models based on traditional average tissue densities method.
II. Materials and Methods 1. Original Images
The dataset constructing of the voxel model was acquired from the Chinese Visible Human Project research team in the Third Military Medical University, People’s Republic of China. It was obtained from a 22-year-old Chinese female cadaver judged to represent normal human anatomy as much as possible. The woman was 162 cm high and 54 kg in weight, which was close to those of the Chinese reference adult females. The cadaver was free of organic disease and lesions. The dataset includes color photographs and CT im-ages. Each color photographs has a resolution of 3,072 × 2,048 pixels, corresponding to a voxel size of 0.167 mm × 0.167 mm × 0.5 mm and the size of each color photograph is 513 mm × 342 mm; CT images were at the 512 × 512 pixel resolution, corresponding to a voxel size of 0.977 mm × 0.977 mm × 2.0 mm and the size of CT image is 500 mm × 500 mm. The data set covering the pelvic portion of the body was in 18.4 cm thick, including 368 color photographs and 92 CT images.
2. Image Processing
In order to utilize both CT image and color photograph in one model, it is necessary to register the voxels of CT image and color photograph. In this study, we adopted the follow-ing two steps to registration. (1) Color Photographs Processing
The surrounding space without any organs or tissues was cut out from the color photograph to reduce the resolution of color photograph from 3,072 × 2,048 to 2,231 × 1,461 pixels, and the adjusted size of the photograph is 372 mm × 244 mm. The boundaries between different organs and tissues dis-played in cross-sectional images were easily distinguished and segmented by handwork. Segmentation work was per-formed on the color photographs. Index numbers were assigned to different organs and tissues by drawing the boundary of each contour and filling it with different gray scale color. (2) CT Images Processing
First, we cut out CT images to ensure that the size of CT images and color photographs are the same. As a result, the size of CT image is 372 mm × 244 mm, and the pixel resolu-tion of CT image is 381×250. Secondly, we adjusted the color photograph’s resolution to 381×250 to ensure that the resolution of CT images and color photographs are the same. Thirdly, as the skeleton was not easy to distort, whose loca-tion in the body is more stabilizable, so we used the skeleton in CT to register the color photograph.
After the above procedures were carried out, each pixel of CT images and color photographs was approximately regis-tered; the organ and tissue of the CT images had the same
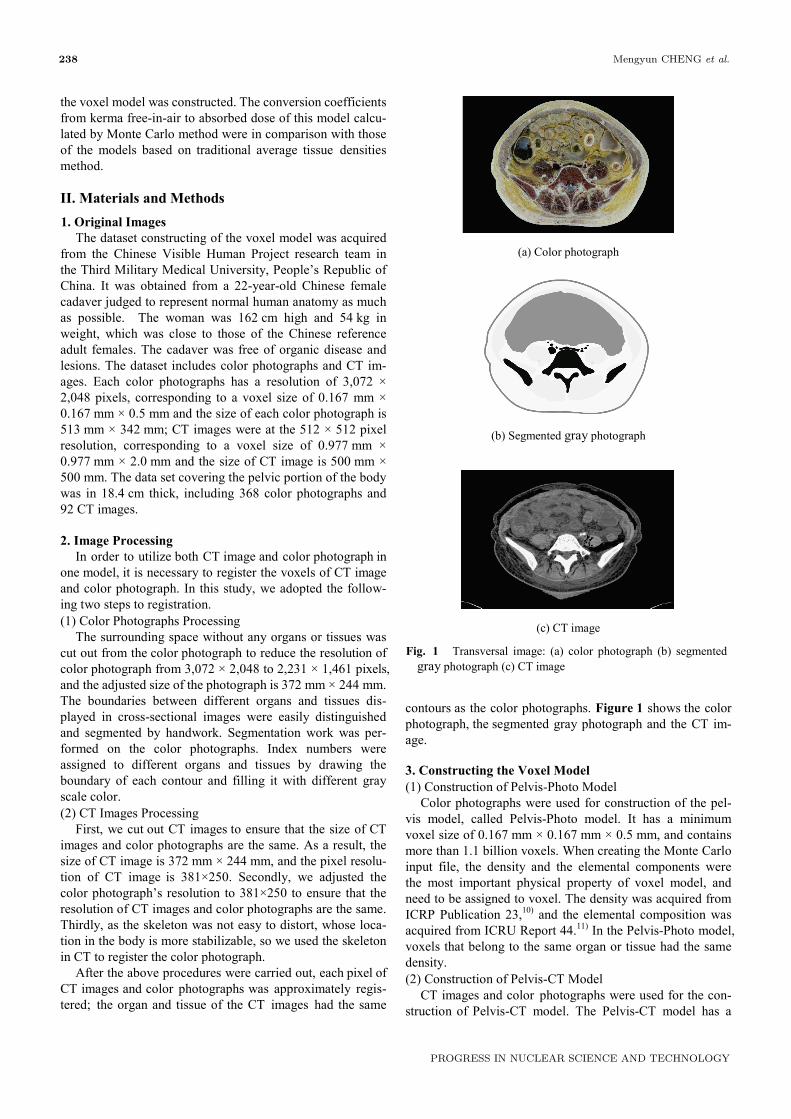
contours as the color photographs. Figure 1 shows the color photograph, the segmented gray photograph and the CT im-age. 3. Constructing the Voxel Model (1) Construction of Pelvis-Photo Model
Color photographs were used for construction of the pel-vis model, called Pelvis-Photo model. It has a minimum voxel size of 0.167 mm × 0.167 mm × 0.5 mm, and contains more than 1.1 billion voxels. When creating the Monte Carlo input file, the density and the elemental components were the most important physical property of voxel model, and need to be assigned to voxel. The density was acquired from ICRP Publication 23,10) and the elemental composition was acquired from ICRU Report 44.11) In the Pelvis-Photo model, voxels that belong to the same organ or tissue had the same density. (2) Construction of Pelvis-CT Model
CT images and color photographs were used for the con-struction of Pelvis-CT model. The Pelvis-CT model has a
(a) Color photograph
(b) Segmented gray photograph
(c) CT image
Fig. 1 Transversal image: (a) color photograph (b) segmented gray photograph (c) CT image
Construction of a Voxel Model from CT Images with Density Derived from CT Numbers 239
VOL. 2, OCTOBER 2011
minimum voxel size of 0.997 mm × 0.997 mm × 2 mm, and contains more than 8 million voxels.
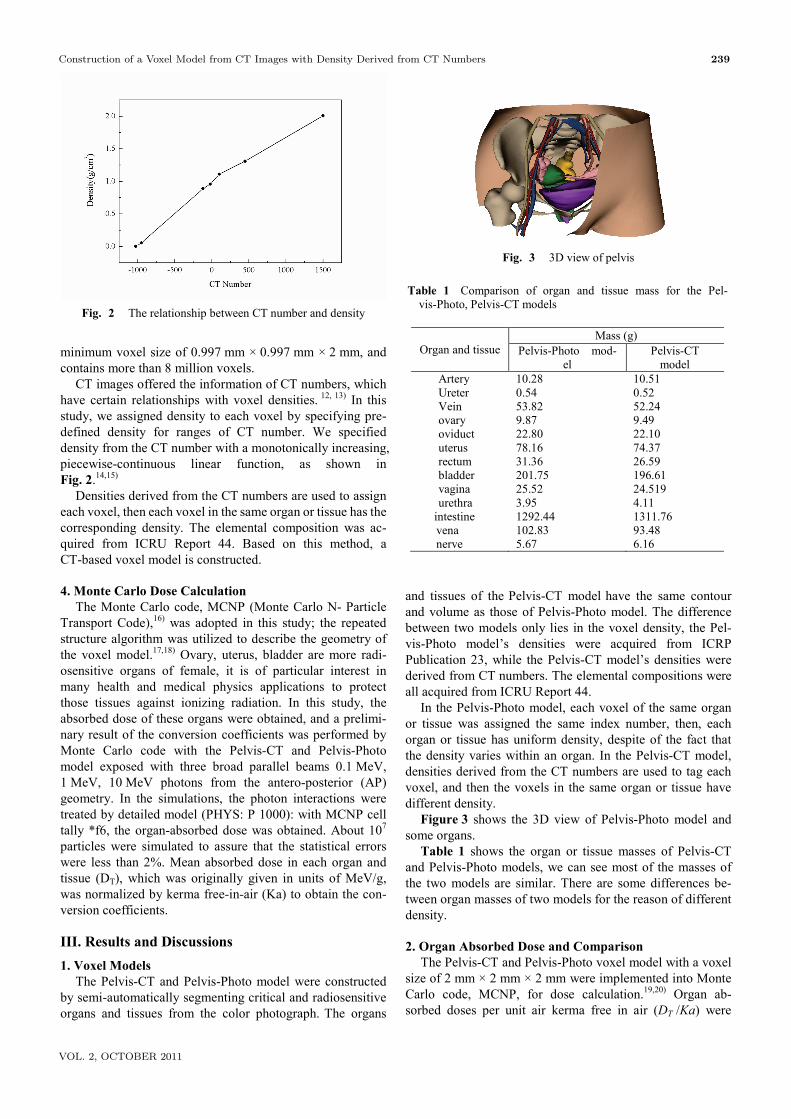
CT images offered the information of CT numbers, which have certain relationships with voxel densities. 12, 13) In this study, we assigned density to each voxel by specifying pre-defined density for ranges of CT number. We specified density from the CT number with a monotonically increasing, piecewise-continuous linear function, as shown in Fig. 2.14,15)
Densities derived from the CT numbers are used to assign each voxel, then each voxel in the same organ or tissue has the corresponding density. The elemental composition was ac-quired from ICRU Report 44. Based on this method, a CT-based voxel model is constructed. 4. Monte Carlo Dose Calculation
The Monte Carlo code, MCNP (Monte Carlo N- Particle Transport Code),16) was adopted in this study; the repeated structure algorithm was utilized to describe the geometry of the voxel model.17,18) Ovary, uterus, bladder are more radi-osensitive organs of female, it is of particular interest in many health and medical physics applications to protect those tissues against ionizing radiation. In this study, the absorbed dose of these organs were obtained, and a prelimi-nary result of the conversion coefficients was performed by Monte Carlo code with the Pelvis-CT and Pelvis-Photo model exposed with three broad parallel beams 0.1 MeV, 1 MeV, 10 MeV photons from the antero-posterior (AP) geometry. In the simulations, the photon interactions were treated by detailed model (PHYS: P 1000): with MCNP cell tally *f6, the organ-absorbed dose was obtained. About 107 particles were simulated to assure that the statistical errors were less than 2%. Mean absorbed dose in each organ and tissue (DT), which was originally given in units of MeV/g, was normalized by kerma free-in-air (Ka) to obtain the con-version coefficients. III. Results and Discussions 1. Voxel Models
The Pelvis-CT and Pelvis-Photo model were constructed by semi-automatically segmenting critical and radiosensitive organs and tissues from the color photograph. The organs
and tissues of the Pelvis-CT model have the same contour and volume as those of Pelvis-Photo model. The difference between two models only lies in the voxel density, the Pel-vis-Photo model’s densities were acquired from ICRP Publication 23, while the Pelvis-CT model’s densities were derived from CT numbers. The elemental compositions were all acquired from ICRU Report 44.
In the Pelvis-Photo model, each voxel of the same organ or tissue was assigned the same index number, then, each organ or tissue has uniform density, despite of the fact that the density varies within an organ. In the Pelvis-CT model, densities derived from the CT numbers are used to tag each voxel, and then the voxels in the same organ or tissue have different density.
Figure 3 shows the 3D view of Pelvis-Photo model and some organs.
Table 1 shows the organ or tissue masses of Pelvis-CT and Pelvis-Photo models, we can see most of the masses of the two models are similar. There are some differences be-tween organ masses of two models for the reason of different density. 2. Organ Absorbed Dose and Comparison
The Pelvis-CT and Pelvis-Photo voxel model with a voxel size of 2 mm × 2 mm × 2 mm were implemented into Monte Carlo code, MCNP, for dose calculation.19,20) Organ ab-sorbed doses per unit air kerma free in air (DT /Ka) were
Fig. 2 The relationship between CT number and density
Fig. 3 3D view of pelvis
Table 1 Comparison of organ and tissue mass for the Pel-vis-Photo, Pelvis-CT models
Organ and tissue Mass (g)
Pelvis-Photo mod-el
Pelvis-CT model
Artery 10.28 10.51 Ureter 0.54 0.52 Vein 53.82 52.24 ovary 9.87 9.49 oviduct 22.80 22.10 uterus 78.16 74.37 rectum 31.36 26.59 bladder 201.75 196.61 vagina 25.52 24.519 urethra 3.95 4.11
intestine 1292.44 1311.76 vena 102.83 93.48 nerve 5.67 6.16
240 Mengyun CHENG et al.
PROGRESS IN NUCLEAR SCIENCE AND TECHNOLOGY
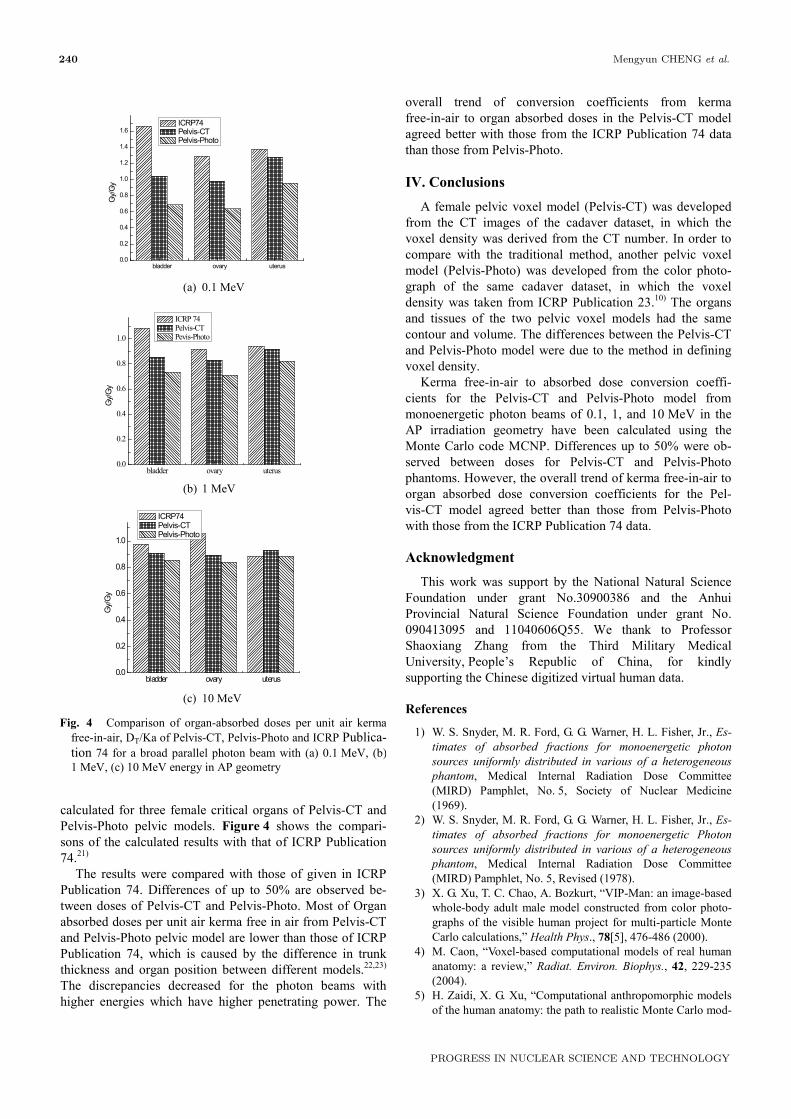
calculated for three female critical organs of Pelvis-CT and Pelvis-Photo pelvic models. Figure 4 shows the compari-sons of the calculated results with that of ICRP Publication 74.21)
The results were compared with those of given in ICRP Publication 74. Differences of up to 50% are observed be-tween doses of Pelvis-CT and Pelvis-Photo. Most of Organ absorbed doses per unit air kerma free in air from Pelvis-CT and Pelvis-Photo pelvic model are lower than those of ICRP Publication 74, which is caused by the difference in trunk thickness and organ position between different models.22,23) The discrepancies decreased for the photon beams with higher energies which have higher penetrating power. The
overall trend of conversion coefficients from kerma free-in-air to organ absorbed doses in the Pelvis-CT model agreed better with those from the ICRP Publication 74 data than those from Pelvis-Photo. IV. Conclusions
A female pelvic voxel model (Pelvis-CT) was developed from the CT images of the cadaver dataset, in which the voxel density was derived from the CT number. In order to compare with the traditional method, another pelvic voxel model (Pelvis-Photo) was developed from the color photo-graph of the same cadaver dataset, in which the voxel density was taken from ICRP Publication 23.10) The organs and tissues of the two pelvic voxel models had the same contour and volume. The differences between the Pelvis-CT and Pelvis-Photo model were due to the method in defining voxel density.
Kerma free-in-air to absorbed dose conversion coeffi-cients for the Pelvis-CT and Pelvis-Photo model from monoenergetic photon beams of 0.1, 1, and 10 MeV in the AP irradiation geometry have been calculated using the Monte Carlo code MCNP. Differences up to 50% were ob-served between doses for Pelvis-CT and Pelvis-Photo phantoms. However, the overall trend of kerma free-in-air to organ absorbed dose conversion coefficients for the Pel-vis-CT model agreed better than those from Pelvis-Photo with those from the ICRP Publication 74 data.
Acknowledgment
This work was support by the National Natural Science Foundation under grant No.30900386 and the Anhui Provincial Natural Science Foundation under grant No. 090413095 and 11040606Q55. We thank to Professor Shaoxiang Zhang from the Third Military Medical University, People’s Republic of China, for kindly supporting the Chinese digitized virtual human data.
References
1) W. S. Snyder, M. R. Ford, G. G. Warner, H. L. Fisher, Jr., Es-timates of absorbed fractions for monoenergetic photon sources uniformly distributed in various of a heterogeneous phantom, Medical Internal Radiation Dose Committee (MIRD) Pamphlet, No. 5, Society of Nuclear Medicine (1969).
2) W. S. Snyder, M. R. Ford, G. G. Warner, H. L. Fisher, Jr., Es-timates of absorbed fractions for monoenergetic Photon sources uniformly distributed in various of a heterogeneous phantom, Medical Internal Radiation Dose Committee (MIRD) Pamphlet, No. 5, Revised (1978).
3) X. G. Xu, T. C. Chao, A. Bozkurt, “VIP-Man: an image-based whole-body adult male model constructed from color photo-graphs of the visible human project for multi-particle Monte Carlo calculations,” Health Phys., 78[5], 476-486 (2000).
4) M. Caon, “Voxel-based computational models of real human anatomy: a review,” Radiat. Environ. Biophys., 42, 229-235 (2004).
5) H. Zaidi, X. G. Xu, “Computational anthropomorphic models of the human anatomy: the path to realistic Monte Carlo mod-
bladder ovary uterus0.0
0.2
0.4
0.6
0.8
1.0
1.2
1.4
1.6
Gy/
Gy
ICRP74 Pelvis-CT Pelvis-Photo
bladder ovary uterus0.0
0.2
0.4
0.6
0.8
1.0
Gy/
Gy
ICRP 74 Pelvis-CT Pevis-Photo
bladder ovary uterus0.0
0.2
0.4
0.6
0.8
1.0
Gy/
Gy
ICRP74 Pelvis-CT Pelvis-Photo
Fig. 4 Comparison of organ-absorbed doses per unit air kerma
free-in-air, DT/Ka of Pelvis-CT, Pelvis-Photo and ICRP Publica-tion 74 for a broad parallel photon beam with (a) 0.1 MeV, (b) 1 MeV, (c) 10 MeV energy in AP geometry
(a) 0.1 MeV
(b) 1 MeV
(c) 10 MeV
Construction of a Voxel Model from CT Images with Density Derived from CT Numbers 241
VOL. 2, OCTOBER 2011
eling in radiological sciences,” Ann. Rev. Biomed. Eng., 9, 1.1-1.30 (2007).
6) B. Zhang, J. Ma, L. Liu, J. Cheng, “CNMAN: A Chinese adult male voxel phantom constructed from color photographs of a visible anatomical data set,” Radiat. Prot. Dosim., 124[2), 130-136 (2007).
7) G. Zhang, Q. Luo, S. Zeng, Q. Liu, “The development and application of the Visible Chinese Human model for Monte Carlo dose calculations,” Health Phys, 94[2], 118-125 (2008).
8) W. Yican, L. Guoli, T. Shengxiang, W. Aidong et al., “Re-search and development of an accurate/advanced radiation therapy system (ARTS),” Chinese J. Med. Phys., 22[6], 683-690 (2005), [in Chinese].
9) W. Y.-Can, S. Gang, C. R.-Fen, W. A.-Dong, C. M.-Yun, et al., “Development of accurate/advanced radiotherapy treatment planning and quality assurance system (ARTS),” Chinese Phy. C (HEP & NP), 32(Suppl. II), 177-182 (2008).
10) International Commission on Radiological Protection, Report of the Task Group on Reference Man, Oxford: Pergamon Press, ICRP Publication 23 (1975).
11) International Commission on Radiation Units and Measure-ments, Tissue substitutes in radiation dosimetry and measurement, ICRU Report 44, Bethesda, MD: ICRU (1989).
12) W. Schneider, Th. Bortfeld, W. Schlegel, “Correlation be-tween CT numbers and tissue parameters needed for Monte Carlo simulations of clinical dose distributions,” Phys. Med. Biol., 45, 459-478 (2000).
13) C. B. Saw, A. Loper, K. Komanduri, T. Combine, S. Huq, C. Scicutella, “Determination of CT-to-density conversion rela-tionship for image-based treatment planning systems,” Med. Dosim., 30[3], 145-148 (2005).
14) C. Chao-bin, H. Qun-ying, W. Yi-can, “Effects of CT based voxel phantoms on dose distribution calculated with Monte
Carlo method,” Plasma Sci. Technol., 7[2], 2777-2780 (2005). 15) Z. Pan, C. Y-Xue, L. Hui, Z. Shangliang, W. Yican, “Effect of
different voxel-uniting methods on the dose calculation of MCNP/MCNPX,” Nucl. Phys. Rev., 23[2] 258-262 (2006), [in Chinese].
16) J. F. Briesmeister, MCNP - A General Monte Carlo N-Particle Transport Code Version 4C, LA-l3709-M, Los Alamos Na-tional Laboratory (LANL) (2000).
17) C. Chaobin, H. Qunying, W. Yican, L. Hui, “Application of Monte Carlo techniques in radiation treatment planning,” Nucl. Tech., 29[1], 22-28 (2006), [in Chinese].
18) Y. Wu, X. G. Xu, “The Need for Further Development of CAD/MCNP Interface Codes,” Trans. Am. Nucl. Soc., 96, 392-394 (2007).
19) Y. Wu, Y. Li, L. Lu, A. Ding, "Research and development of the automatic modeling system for Monte Carlo particle transport simulation," Chinese J. Nucl. Sci. Eng., 26[1], 20-27 (2006), [in Chinese].
20) W. Ai-dong, W. Yi-can, “Effect of CT Image-based Voxel Size on Monte Carlo Dose Calculation,” 27th Annual Interna-tional Conference of the IEEE Engineering in Medicine and Biology Society, Shanghai, China (2005), [CD-ROM].
21) International Commission on Radiological Protection, Con-version coefficients for use in radiological protection against external radiation, ICRP Publication 74 (1996).
22) C. Lee, I. Lee, “Korean adult male voxel model Korman seg-mented from magnetic resonance images,” Med. Phys., 31[5], 1017-1022 (2004).
23) H. Schlattl, M. Zankl, N. P.-Henss, “Organ dose conversion coefficients for voxel models of the reference male and fe-male from idealized photon exposures,” Phys. Med. Biol., 52, 2123-2145 (2007).