Construction cost prediction model for conventional … · Construction cost prediction model for...
9
Please cite this article in press as: O.S. Alshamrani. Construction cost prediction model for conventional and sustainable college buildings in North America, J. Taibah Univ. Sci. (2016), http://dx.doi.org/10.1016/j.jtusci.2016.01.004 ARTICLE IN PRESS +Model JTUSCI-284; No. of Pages 9 Journal of Taibah University for Science xxx (2016) xxx–xxx Available online at www.sciencedirect.com ScienceDirect Construction cost prediction model for conventional and sustainable college buildings in North America Othman Subhi Alshamrani ∗ Department of Building Engineering, College of Architecture and Planning, University of Dammam, 31451 Al-Dammam, Saudi Arabia Received 27 August 2015; received in revised form 24 January 2016; accepted 25 January 2016 Abstract The literature lacks in initial cost prediction models for college buildings, especially comparing costs of sustainable and con- ventional buildings. A multi-regression model was developed for conceptual initial cost estimation of conventional and sustainable college buildings in North America. RS Means was used to estimate the national average of construction costs for 2014, which was subsequently utilized to develop the model. The model could predict the initial cost per square feet with two structure types made of steel and concrete. The other predictor variables were building area, number of floors and floor height. The model was developed in three major stages, such as preliminary diagnostics on data quality, model development and validation. The developed model was successfully tested and validated with real-time data. © 2016 The Authors. Production and hosting by Elsevier B.V. on behalf of Taibah University. This is an open access article under the CC BY-NC-ND license (http://creativecommons.org/licenses/by-nc-nd/4.0/). Keywords: Initial cost; Sustainability; College building; Regression model; RS Means; Normal distribution; Residual analysis 1. Introduction Practitioners and researchers have recognized the uncertainty of construction cost estimates and the need to improve the capability of cost prediction models [1]. Substantial efforts have been made to address this issue, and considerable conceptual cost prediction models are currently available in practice based on such techniques as probabilistic cost estimation, regression ∗ Tel.: +966 548008002; fax: +966 38578739. E-mail address: [email protected] Peer review under responsibility of Taibah University. http://dx.doi.org/10.1016/j.jtusci.2016.01.004 1658-3655 © 2016 The Authors. Production and hosting by Elsevier B.V. on behalf of Taibah University. This is an open access article under the CC BY-NC-ND license (http://creativecommons.org/licenses/by-nc-nd/4.0/). analysis, neural network (NN), fuzzy logic (FL), genetic algorithm (GA), and case-based reasoning (CBR). The relative merits and demerits of these techniques were analyzed by experts and are well-documented [2–4]. However, a review of updated literature related to the current study is presented in this report. Regarding studies on regression analysis, Li et al. [5] proposed step-wise linear regression models for office buildings in Hong Kong, while a multivariate regression model named estimate score procedure was developed by Trost and Oberlender [6]. A similar study was reported by Lowe et al. [7], who developed lin- ear regression models to predict the construction cost of buildings in the United Kingdom based on 286 sets of real data. Application of NN, FL and GA for construction cost prediction has attracted researchers and practition- ers and literature in this area is abundant. Siqueira [8] applied NNs for cost estimation of low-rise prefabricated
Transcript of Construction cost prediction model for conventional … · Construction cost prediction model for...

J
A
vcssts©t
K
1
ut[tmt
P
h1C
ARTICLE IN PRESS+ModelTUSCI-284; No. of Pages 9
Journal of Taibah University for Science xxx (2016) xxx–xxx
Available online at www.sciencedirect.com
ScienceDirect
Construction cost prediction model for conventional and sustainablecollege buildings in North America
Othman Subhi Alshamrani ∗Department of Building Engineering, College of Architecture and Planning, University of Dammam, 31451 Al-Dammam, Saudi Arabia
Received 27 August 2015; received in revised form 24 January 2016; accepted 25 January 2016
bstract
The literature lacks in initial cost prediction models for college buildings, especially comparing costs of sustainable and con-entional buildings. A multi-regression model was developed for conceptual initial cost estimation of conventional and sustainableollege buildings in North America. RS Means was used to estimate the national average of construction costs for 2014, which wasubsequently utilized to develop the model. The model could predict the initial cost per square feet with two structure types made ofteel and concrete. The other predictor variables were building area, number of floors and floor height. The model was developed in
hree major stages, such as preliminary diagnostics on data quality, model development and validation. The developed model wasuccessfully tested and validated with real-time data.2016 The Authors. Production and hosting by Elsevier B.V. on behalf of Taibah University. This is an open access article underhe CC BY-NC-ND license (http://creativecommons.org/licenses/by-nc-nd/4.0/).
odel; R
eywords: Initial cost; Sustainability; College building; Regression m. Introduction
Practitioners and researchers have recognized thencertainty of construction cost estimates and the needo improve the capability of cost prediction models1]. Substantial efforts have been made to addresshis issue, and considerable conceptual cost prediction
odels are currently available in practice based on suchechniques as probabilistic cost estimation, regression
Please cite this article in press as: O.S. Alshamrani. Construction cobuildings in North America, J. Taibah Univ. Sci. (2016), http://dx.d
∗ Tel.: +966 548008002; fax: +966 38578739.E-mail address: [email protected]
eer review under responsibility of Taibah University.
ttp://dx.doi.org/10.1016/j.jtusci.2016.01.004658-3655 © 2016 The Authors. Production and hosting by Elsevier B.V. on
C BY-NC-ND license (http://creativecommons.org/licenses/by-nc-nd/4.0/).
S Means; Normal distribution; Residual analysis
analysis, neural network (NN), fuzzy logic (FL), geneticalgorithm (GA), and case-based reasoning (CBR). Therelative merits and demerits of these techniques wereanalyzed by experts and are well-documented [2–4].However, a review of updated literature related to thecurrent study is presented in this report.
Regarding studies on regression analysis, Li et al.[5] proposed step-wise linear regression models foroffice buildings in Hong Kong, while a multivariateregression model named estimate score procedure wasdeveloped by Trost and Oberlender [6]. A similar studywas reported by Lowe et al. [7], who developed lin-ear regression models to predict the construction costof buildings in the United Kingdom based on 286 sets of
st prediction model for conventional and sustainable collegeoi.org/10.1016/j.jtusci.2016.01.004
behalf of Taibah University. This is an open access article under the
real data. Application of NN, FL and GA for constructioncost prediction has attracted researchers and practition-ers and literature in this area is abundant. Siqueira [8]applied NNs for cost estimation of low-rise prefabricated

IN+Model
Univer
ARTICLEJTUSCI-284; No. of Pages 9
2 O.S. Alshamrani / Journal of Taibah
structural steel buildings in Canada. The data were col-lected from 75 building projects over a 3-month period.A similar study was reported from Turkey [9], whichused data from 30 projects to train and test the NNmodel developed for cost prediction of reinforced con-crete structural systems of four- to eight-story residentialbuildings. Kim et al. [10] incorporated GA in theirbackpropagation network (BPN) model to improve theaccuracy of construction cost estimation. Data for 530residential buildings constructed in Korea between 1997and 2000 were used for training and evaluation of themodel. The web-based intelligent cost estimator (WICE)model developed by Lai and Lee [11] included featuresof WWW, neuro-fuzzy system, and data mining. Theproposed model was claimed to provide not only a glob-ally accessible and promptly responding means for costestimation but also an effective and reliable tool for real-time decision-making. A subsequent study [12] proposedthe evolutionary fuzzy neural inference model (EFNIM),which incorporated features of GA, FL and NNs. TheEFNIM was subsequently combined with WWW andhistorical data to form evolutionary web-based con-ceptual cost estimators (EWCCE), which provided twotypes of estimators for conceptual construction cost.The artificial neural network (ANN)-based evolutionaryfuzzy hybrid neural network (EFHNN) was developedby Cheng et al. [13], which was claimed to be effec-tive for accurate cost estimation during the early stagesof construction projects. Other recent NN-based modelsincluded those reported by Juszczyk [14], Bala et al. [1]and Aibinu et al. [15].
In the CBR model, new problems are solved by rec-ognizing the similarity to a known problem and adaptingsolutions that were used to resolve the previous problems[16]. Many studies on model development based on CBRwere reported. For instance, An et al. [16] proposed aCBR model using the analytic hierarchy process (AHP),which included experience in all processes of cost esti-mation. While few similar models were developed byKoo et al. [17], Hong et al. [18] and Park and Lee [19],an advanced CBR model with 101 cases of multi-familyhousing projects was reported by Koo et al. [20] integrat-ing the advantages of CBR, multiple regression analysis(MRA), ANN, and the optimization process using GA.The model was developed by the Microsoft Excel-basedvisual basic application (VBA), which is user-friendly[20]. In a recent study, the CBR model was integratedwith AHP for cost estimation of highway projects [21].
Please cite this article in press as: O.S. Alshamrani. Construction cobuildings in North America, J. Taibah Univ. Sci. (2016), http://dx.d
Attempts were also reported on developing new andhybrid prediction models. The online analytical process-ing (OLAP) environment introduced by Moon et al. [22],the principal item ratios estimating method (PIREM)
PRESSsity for Science xxx (2016) xxx–xxx
proposed by Yu [23], and the bootstrap approachpresented by Sonmez [24], are good examples for newapproaches. Although green buildings are designed toreduce negative environmental impacts with enhancedfunctionality, initial cost is a matter of concern for theowners [25]. This issue was addressed by Ahn [25],who developed a multiple regression model to establishthe relationship between initial cost and saving usinglife cycle cost (LCC) for implementing green buildingstrategies into capital projects in the United States.However, as far as the author is aware, there are fewpublished studies concerning the development of initialcost prediction models for college buildings, particu-larly in provision of cost comparison of sustainable andconventional buildings and selection of economicallyviable structure options. This paper presents a regressionmodel for initial cost prediction for conventional andsustainable college buildings in North America. Theinitial cost is estimated for two structural alternatives(steel and concrete) with specific area, floor heightand number of floors. RS Means was used to estimatethe national average of construction costs for the year2014.
2. Methodology
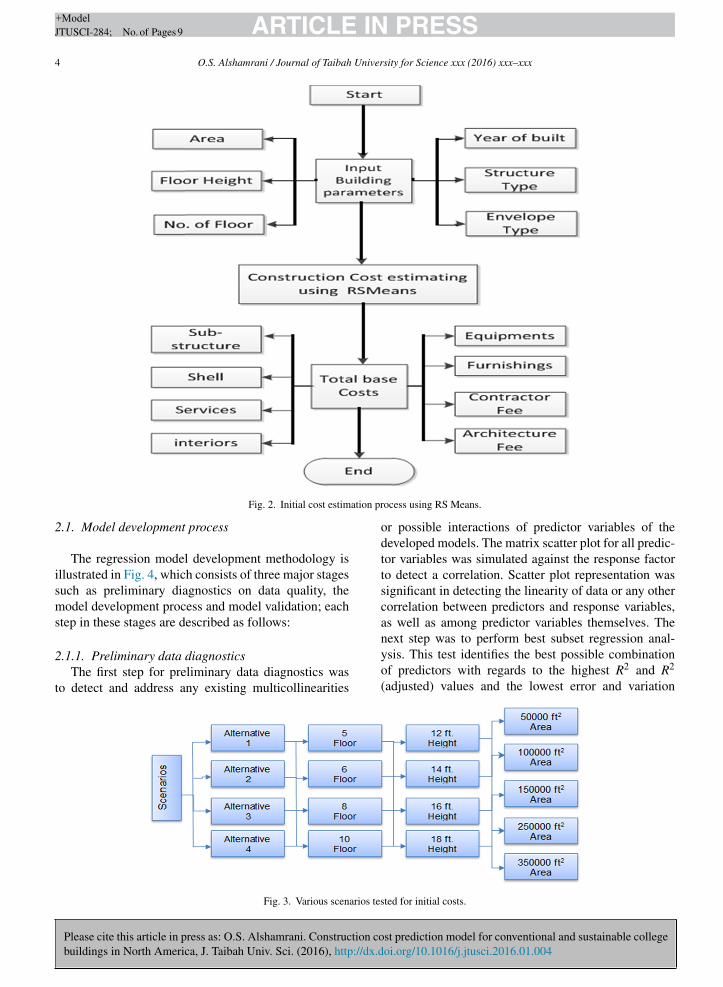
RS Means was used to estimate the construction costsof new green mid-rise college buildings by identifyingsignificant parameters. Several input parameters weredefined for initial cost calculation, such as building area(50,000–350,000 ft2), floor height (12–18 ft), number offloors (1–3), and structure type (steel and concrete, asdetailed in Fig. 1). All of the costs were estimated basedon cost index of the third quarter of year 2014 andnational average costs for North American cities. Thebreakdown cost components accounted for were sub-structure, super-structure, services, interiors, equipmentand furnishings, and contractor and architecture fees(Fig. 2). Estimated breakdown component costs are usedfor calculation of subtotal costs which, together withcontractor and architecture fees, ultimately determinetotal building costs.
The initial costs were computed by applying 80 dif-ferent scenarios (Fig. 3) to build a correlation betweeninput parameters and total base cost per square-feet.Each structure-envelope alternative was estimated forgreen mid-rise college buildings with specific area, floorheight and number of floors. A total of 320 construc-
st prediction model for conventional and sustainable collegeoi.org/10.1016/j.jtusci.2016.01.004
tion cost estimation scenarios were obtained from thecombination of the complete range of input parametersfor college buildings. The input parameters (independentvariables) for initial costs were gathered from RS Means.

ARTICLE IN PRESS+ModelJTUSCI-284; No. of Pages 9
O.S. Alshamrani / Journal of Taibah University for Science xxx (2016) xxx–xxx 3
for var
Stsai
Fig. 1. Detailed sections
everal of these variables were normalized, such as loca-
Please cite this article in press as: O.S. Alshamrani. Construction cobuildings in North America, J. Taibah Univ. Sci. (2016), http://dx.d
ion and year of construction. Other parameters, such astructure-envelope type, floor height, number of floor,nd building area, were variables significantly affectingnitial costs. These factors were investigated to develop
ious tested alternatives.
their correlation with the initial cost results (dependent
st prediction model for conventional and sustainable collegeoi.org/10.1016/j.jtusci.2016.01.004
factor). Computed initial costs from RS Means included320 data points, out of which 250 points were used formodel development and 70 points were used for modelvalidation.
ARTICLE IN PRESS+ModelJTUSCI-284; No. of Pages 9
4 O.S. Alshamrani / Journal of Taibah University for Science xxx (2016) xxx–xxx
ation pr
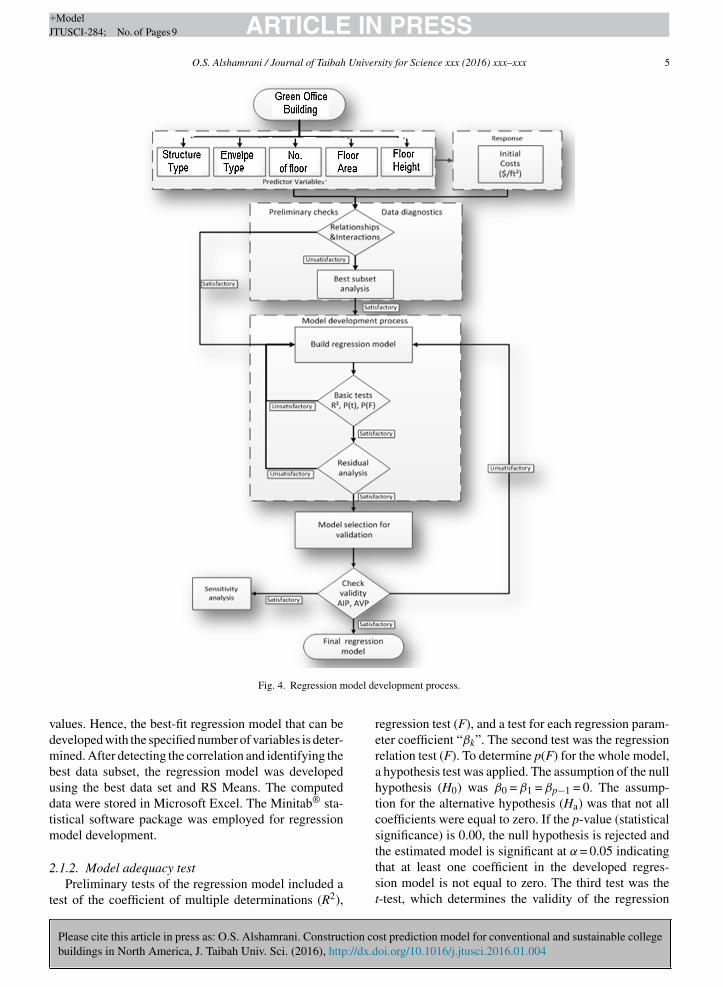
Fig. 2. Initial cost estim2.1. Model development process
The regression model development methodology isillustrated in Fig. 4, which consists of three major stagessuch as preliminary diagnostics on data quality, themodel development process and model validation; eachstep in these stages are described as follows:
Please cite this article in press as: O.S. Alshamrani. Construction cobuildings in North America, J. Taibah Univ. Sci. (2016), http://dx.d
2.1.1. Preliminary data diagnosticsThe first step for preliminary data diagnostics was
to detect and address any existing multicollinearities
Fig. 3. Various scenarios tes
ocess using RS Means.
or possible interactions of predictor variables of thedeveloped models. The matrix scatter plot for all predic-tor variables was simulated against the response factorto detect a correlation. Scatter plot representation wassignificant in detecting the linearity of data or any othercorrelation between predictors and response variables,as well as among predictor variables themselves. The
st prediction model for conventional and sustainable collegeoi.org/10.1016/j.jtusci.2016.01.004
next step was to perform best subset regression anal-ysis. This test identifies the best possible combinationof predictors with regards to the highest R2 and R2
(adjusted) values and the lowest error and variation
ted for initial costs.
ARTICLE IN PRESS+ModelJTUSCI-284; No. of Pages 9
O.S. Alshamrani / Journal of Taibah University for Science xxx (2016) xxx–xxx 5
odel de
vdmbudtm
2
t
Fig. 4. Regression m
alues. Hence, the best-fit regression model that can beeveloped with the specified number of variables is deter-ined. After detecting the correlation and identifying the
est data subset, the regression model was developedsing the best data set and RS Means. The computedata were stored in Microsoft Excel. The Minitab® sta-istical software package was employed for regressionodel development.
Please cite this article in press as: O.S. Alshamrani. Construction cobuildings in North America, J. Taibah Univ. Sci. (2016), http://dx.d
.1.2. Model adequacy testPreliminary tests of the regression model included a
est of the coefficient of multiple determinations (R2),
velopment process.
regression test (F), and a test for each regression param-eter coefficient “βk”. The second test was the regressionrelation test (F). To determine p(F) for the whole model,a hypothesis test was applied. The assumption of the nullhypothesis (H0) was β0 = β1 = βp−1 = 0. The assump-tion for the alternative hypothesis (Ha) was that not allcoefficients were equal to zero. If the p-value (statisticalsignificance) is 0.00, the null hypothesis is rejected and
st prediction model for conventional and sustainable collegeoi.org/10.1016/j.jtusci.2016.01.004
the estimated model is significant at α = 0.05 indicatingthat at least one coefficient in the developed regres-sion model is not equal to zero. The third test was thet-test, which determines the validity of the regression

IN PRESS+Model
University for Science xxx (2016) xxx–xxx
Table 1Statistical diagnostic of the model.
Predictor Coefficient SE coef. T P VIF
Constant 171.3 1.84 92.91 0Height (ft) 0.666 0.0989 6.73 0 1No. of floor 4.498 0.272 16.52 0 1.02Area (ft2) −0.000129 0.000004 −29.59 0 1.02Sustainability 6.292 0.441 14.26 0 1.01
ARTICLEJTUSCI-284; No. of Pages 9
6 O.S. Alshamrani / Journal of Taibah
coefficient and is performed separately for β0, β1, . . .,βp−1. In the case of β0, the null hypothesis (H0) of the t-test assumed that β0 = 0, while the alternative hypothesis(Ha) assumed that β0 /= 0. After coefficients and baseswere satisfactorily diagnosed, the residuals and their pat-terns were analyzed. The normality of error was checkedto verify the linearity of correlation assumptions. Normalprobability and frequency were represented in a graphof the developed model in order to perform residualanalysis.
2.1.3. Model validationThe first step in model validation was to compare
the actual observation with predicted values for thevalidation data for each developed model. This vali-dation was performed using the excluded 70 data points,which were plotted to compare the prediction modelwith the observed data in hand. The mathematical vali-dation method was performed using average validity andinvalidity percentages. Average invalidity and validitypercentage was computed using the following equations[26],
AIP =
n∑i=1
∣∣∣1 −(
Ei
Ci
)∣∣∣
n
and
AVP = 1 − AIP
where AVP is the average validity percentage, AIP is theaverage invalidity percentage, Ei is the predicted value,Ci is the actual value, and n is the number of observations.The AIP value varies from 0 to 1.
3. Results and discussion
3.1. The developed regression model
The regression model developed in the present studyfor predicting the initial cost of sustainable college build-ings in North American cities is
IC = 171.3 + 0.666 ∗ H + 4.498 ∗ nf
− 0.000129 ∗ A + 6.292 ∗ S + 5.003 ∗ Str
where IC – predicted initial cost in USD/ft2, H – height2
Please cite this article in press as: O.S. Alshamrani. Construction cobuildings in North America, J. Taibah Univ. Sci. (2016), http://dx.d
of one floor (12–18 ft), A – area of building in ft , nf –number of floors (1–3), S – sustainability index (1 forconventional and 2 for sustainable), Str – structure type(1 for concrete bearing wall steel and 2 for steel frame).
Structure 5.003 0.44 11.37 0 1
3.2. Correlation tests
Correlation tests were conducted to test the linearityof the data by detecting a possible correlation of obtainedscatter plot matrix and correlation matrix with the trans-formed Y′ variable. The results are presented in Fig. 5,which shows that the data are constant and distributedevenly across the graph without forming any pattern. Theplots also indicate that each of the predictor variablesis nearly linearly associated with the response variable.Hence, the plots are considered satisfactory.
3.3. Best subset analysis
The output of subset regression analysis generatesvarious regression models in each line, as shown in Fig. 6.In the WC regression model, the highest values of R2
and R2 (adjusted) are recorded at 87.6% and 87.3%,respectively, while the lowest values of Cp and standarddeviation (S) are recorded at 6.0 and 3.1396, respec-tively. The result of the best subset analysis proves thatall predictors are significant and should be combined andincluded in the developed regression model. This com-bination of variables is proven to be the best case for thedeveloped regression model.
3.4. Results of t-test and F-test
As summarized in Table 1, the t-test shows that the p-values for the estimated coefficients of all predictors are0.000. Therefore, the null hypothesis is rejected and thealternative hypothesis is accepted. This indicates that thepredictors are significantly correlated with the responsevariable, i.e., ‘initial cost’ at α = 0.1. The p-value (statis-tical significance) in the analysis of variance is 0.000 asshown in Table 2. The null hypothesis is thus rejected.This finding demonstrates that the estimated model is
st prediction model for conventional and sustainable collegeoi.org/10.1016/j.jtusci.2016.01.004
significant at α = 0.05. Consequently, at least one coef-ficient in the developed regression model is not equal tozero.

ARTICLE IN PRESS+ModelJTUSCI-284; No. of Pages 9
O.S. Alshamrani / Journal of Taibah University for Science xxx (2016) xxx–xxx 7
Fig. 5. Scatter matrix plot for regression model parameters.
alysis
3
t
Fig. 6. Best subset an
Please cite this article in press as: O.S. Alshamrani. Construction cobuildings in North America, J. Taibah Univ. Sci. (2016), http://dx.d
.5. Result of residual analysis
Figs. 7 and 8 represent the normal distribution plot andhe histogram, respectively, from residual analysis. The
result using Minitab.
st prediction model for conventional and sustainable collegeoi.org/10.1016/j.jtusci.2016.01.004
normal probability plot (Fig. 7) indicates that the errorterms are approximately normally distributed. The minordepartures from normality observed are considered to beunusual possible outliers. Errors around a regression line
ARTICLE IN PRESS+ModelJTUSCI-284; No. of Pages 9
8 O.S. Alshamrani / Journal of Taibah University for Science xxx (2016) xxx–xxx
Table 2Analysis of variance of the model.
Source DF SS MS F P
Regression 5 13,795.0 2758.99 279.9 0Height (ft) 1 446.7 446.74 45.32 0No. of floor 1 2691.0 2690.96 273 0Area (ft2) 1 8629.5 8629.48 875.46 0Sustainability 1 2005.3 2005.32 203.44 0Struc. & env. 1 1274.6 1274.59 129.31 0
Fig. 9. Residual versus observation order plot.
100
120
140
160
180
200
220
240
260
280
300
1 3 5 7 9 11 13 15 17 19 21 23 25 27 29 31 33 35 37 39
Fig. 7. Normal probability plot from residual analysis.should be independent for each predicted value. Fig. 9shows the residuals versus the order of data plot, whichillustrates that the positive residuals are observed at innerbands of X values, and the outer bands largely consistof negative residuals. The R2 values and other statisti-cal parameters could be improved by eliminating theseoutliers. However, the model would not be the best rep-resentation of the real world data in hand. This resultis satisfactory because minor departures from normalityare acceptable [27].
Please cite this article in press as: O.S. Alshamrani. Construction cobuildings in North America, J. Taibah Univ. Sci. (2016), http://dx.d
Fig. 8. Histogram from residual analysis.
Actual Estimated
Fig. 10. Plot validation for the developed regression model.
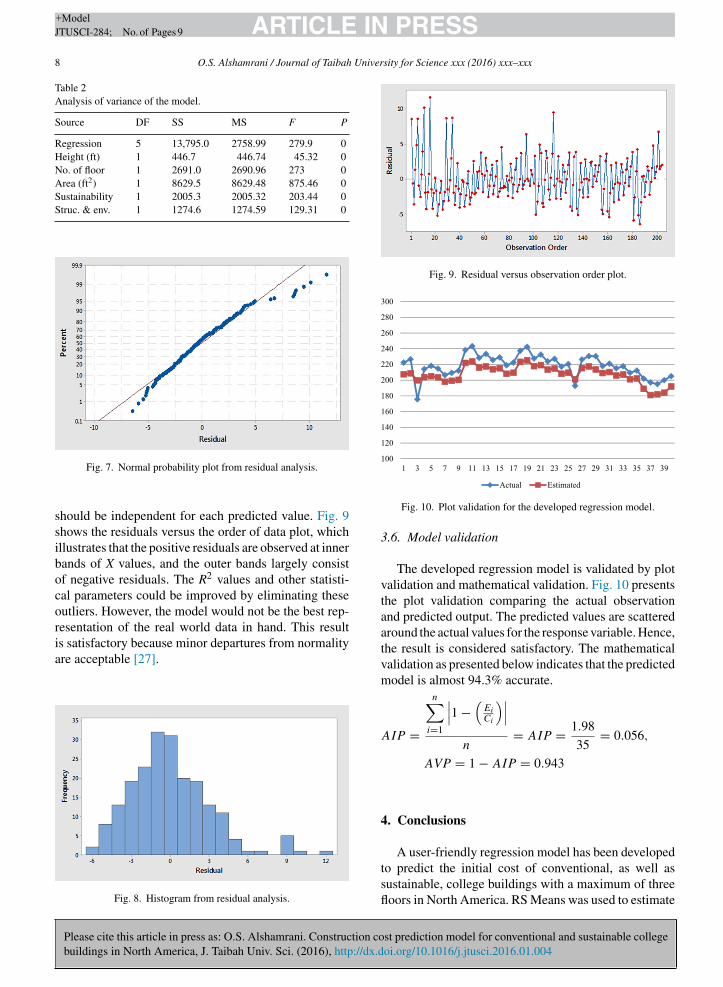
3.6. Model validation
The developed regression model is validated by plotvalidation and mathematical validation. Fig. 10 presentsthe plot validation comparing the actual observationand predicted output. The predicted values are scatteredaround the actual values for the response variable. Hence,the result is considered satisfactory. The mathematicalvalidation as presented below indicates that the predictedmodel is almost 94.3% accurate.
AIP =
n∑i=1
∣∣∣1 −(
Ei
Ci
)∣∣∣
n= AIP = 1.98
35= 0.056,
AVP = 1 − AIP = 0.943
4. Conclusions
st prediction model for conventional and sustainable collegeoi.org/10.1016/j.jtusci.2016.01.004
A user-friendly regression model has been developedto predict the initial cost of conventional, as well assustainable, college buildings with a maximum of threefloors in North America. RS Means was used to estimate

IN+ModelJ
Univer
t2aeimsocmrets
R
[
[
[
[
[
[
[
[
[
[
[
[
[
[
[
[
[
ARTICLETUSCI-284; No. of Pages 9
O.S. Alshamrani / Journal of Taibah
he national average of construction costs for the year014. The input parameters considered were buildingrea, floor height, number of floors, and structure andnvelope types. The model was validated by compar-ng the predictions with real data, as well as by using
athematical equations. The model validation demon-trated acceptable discrepancies, while the accuracybtained by mathematical validation was 94.3%. Theontributory aspect of this model compared to previousodels is that besides predicting the initial cost of mid-
ise college buildings, it enables universities to assess theconomic viability of sustainable buildings over conven-ional buildings and compare the costs of concrete andteel structures.
eferences
[1] K. Bala, S.A. Mustani, B.S. Waziri, A computer-based cost pre-diction model for institutional building projects in Nigeria, J. Eng.Des. Technol. 12 (4) (2014) 518–529.
[2] R. Sonmez, Review of conceptual cost modeling techniques,AACE Int. Trans. (2005) EST.07.1–EST.07.4.
[3] G.-H. Kim, S.-H. An, K.-I. Kang, Comparison of construc-tion cost estimating models based on regression analysis, neuralnetworks, and case-based reasoning, Build. Environ. 39 (10)(2004) 1235–1242.
[4] R. Sonmez, Conceptual cost estimation of building projects withregression analysis and neural networks, Can. J. Civil Eng. 31 (4)(2004) 677–683.
[5] H. Li, Q.P. Shen, P.E.D. Love, Cost modelling of office buildingsin Hong Kong: an exploratory study, Facilities 23 (9/10) (2005)438–452.
[6] S.M. Trost, G.D. Oberlender, Predicting accuracy of early costestimates using factor analysis and multivariate regression, J.Constr. Eng. Manag. 129 (2) (2003) 198–204.
[7] D.J. Lowe, M.W. Emsley, A. Harding, Predicting constructioncost using multiple regression techniques, J. Constr. Eng. Manag.132 (July (7)) (2006) 750–758.
[8] I. Siqueira, Neural Network-based Cost Estimating (Master the-sis), Concordia University, 1999.
[9] H.M. Günaydın, S.Z. Dogan, A neural network approach for earlycost estimation of structural systems of buildings, Int. J. Proj.Manag. 22 (7) (2004) 595–602.
10] G.-H. Kim, J.-E. Yoon, S.-H. An, H.-H. Cho, K.-I. Kang, Neural
Please cite this article in press as: O.S. Alshamrani. Construction cobuildings in North America, J. Taibah Univ. Sci. (2016), http://dx.d
network model incorporating a genetic algorithm in estimatingconstruction costs, Build. Environ. 39 (11) (2004) 1333–1340.
11] W. Yu, C. Lai, W. Lee, A WICE approach to real-time constructioncost estimation, Autom. Constr. 15 (1) (2006) 12–19.
[
PRESSsity for Science xxx (2016) xxx–xxx 9
12] M.Y. Cheng, H.C. Tsai, W.S. Hsieh, Web-based conceptual costestimates for construction projects using evolutionary fuzzy neu-ral inference model, Autom. Constr. 18 (2) (2009) 164–172.
13] M.-Y. Cheng, H.-C. Tsai, E. Sudjono, Conceptual cost esti-mates using evolutionary fuzzy hybrid neural network for projectsin construction industry, Expert Syst. Appl. 37 (6) (2010)4224–4231.
14] M. Juszczyk, The use of artificial neural networks for residen-tial buildings conceptual cost estimation, in: AIP ConferenceProceedings 1558, vol. 1302, no. May, 2013, pp. 1302–1306.
15] A.A. Aibinu, D. Dassanayake, T. Chan, R. Thangaraj, Cost esti-mation for electric light and power elements during buildingdesign – a neural network approach, Eng. Constr. Archit. Manag.22 (2) (2015) 190–213.
16] S.-H. An, G.-H. Kim, K.-I. Kang, A case-based reasoning costestimating model using experience by analytic hierarchy process,Build. Environ. 42 (7) (2007) 2573–2579.
17] C. Koo, T. Hong, C. Hyun, S.H. Park, J. Seo, A study on the devel-opment of a cost model based on the owner’s decision making atthe early stages of a construction project, Int. J. Strateg. Prop.Manag. 14 (2) (2010) 121–137.
18] T. Hong, C. Hyun, H. Moon, CBR-based cost prediction model-II of the design phase for multi-family housing projects, ExpertSyst. Appl. 38 (3) (2011) 2797–2808.
19] S.-H. Ji, M. Park, H.-S. Lee, Cost estimation model for buildingprojects using case-based reasoning, Can. J. Civil Eng. 38 (May(5)) (2011) 570–581.
20] C. Koo, T. Hong, C. Hyun, The development of a constructioncost prediction model with improved prediction capacity usingthe advanced CBR approach, Expert Syst. Appl. 38 (7) (2011)8597–8606.
21] S. Kim, Hybrid forecasting system based on case-based reasoningand analytic hierarchy process for cost estimation, J. Civil Eng.Manag. 19 (1) (2013) 86–96.
22] S.W. Moon, J.S. Kim, K.N. Kwon, Effectiveness of OLAP-basedcost data management in construction cost estimate, Autom.Constr. 16 (3) (2007) 336–344.
23] W. Yu, PIREM: a new model for conceptual cost estimation,Constr. Manag. Econ. 24 (3) (2006) 259–270.
24] R. Sonmez, Parametric range estimating of building costs usingregression models and bootstrap, J. Constr. Eng. Manag. 134(December (12)) (2008) 1011–1016.
25] Y.H. Ahn, The Development of Models to Identify RelationshipsBetween First Costs of Green Building Strategies and Technolo-gies and Life Cycle Cost for Public Green Facilities (PhD thesis),Virginia Polytechnic Institute and State University, 2010.
26] T.M. Zayed, D.W. Halpin, Productivity and cost regression mod-
st prediction model for conventional and sustainable collegeoi.org/10.1016/j.jtusci.2016.01.004
els for pile construction, J. Constr. Eng. Manag. 131 (7) (2005)779–789.
27] M. Kutner, C. Nachtsheim, J. Neter, W. Li, Applied Linear Sta-tistical Models, 5th ed., McGraw-Hill/Irwin, 2004.