Construction and Evaluation of a Fast Switching Trigger...
30
1 Construction and Evaluation of a Fast Switching Trigger Circuit for a Cosmic Ray Detection Spark Chamber Candidate Number: 8261R Project Supervisor: Dr. Lester 1. ABSTRACT A pulsing circuit is designed and constructed capable of raising up to +6.7kV between plates of a small (~50cm side length) spark chamber. The device is triggered by the ~2V output of a cosmic ray detection device, and its overall gain of ~1:3000 is achieved by a sequence of amplifiers and fast switching devices – namely a Bipolar Junction Transistor (BJT), Insulated Gate Bipolar Transistor (IGBT), 1:53 gain pulsed transformer and a triggered spark gap. The qualitative response of each component is assessed with respect to its response and relaxation time. The overall delay time between electronic input and this 6.7kV pulse is found to be as short as 580±100ns. The response of the electronics is investigated under a range of square input pulse amplitudes and durations, simulating input pulses expected from the cosmic ray detector. A pulse shape of 200ns and depth of 2V or more is found to minimise rise times within limits set by adjacent components. The majority (over 60%) of the overall rise time is identified with the LC charging of the step-up transformer. The 55.7±2ms RC recharge time of the capacitor driving the transformer input limits the system’s maximum repetition rate to ~10Hz. It is found that the assembled system is compatible with operation of a small spark chamber, and recommendations are made regarding further fine tuning and potential future challenges. 2. INTRODUCTION Though the era of the spark chamber as the workhorse in particle detection of the 1960s has passed, it is remembered for its elegant design and dramatic visual impact. The device discharges a sequence of alternating high and low voltage plates along the ionised track left in the wake of a passing charged particle – illuminating its trajectory with a sudden arc of light (fig 2.1a). Though solid state devices have become the research tool of choice, the spark chamber has now assumed an educational role. In an ongoing outreach project for Cambridge High Energy Physics, we seek to construct a portable spark chamber to visualise the passage of cosmic rays in real time, highlighting the frequency and distribution of this “rain” of charged particles. For both particle physicist and non-physicist alike the spark chamber brings to life both these extra-terrestrial particles and an ingenious tool from the history of detector physics.
Transcript of Construction and Evaluation of a Fast Switching Trigger...

1
Construction and Evaluation of a Fast Switching Trigger Circuit for a Cosmic Ray Detection Spark Chamber Candidate Number: 8261R Project Supervisor: Dr. Lester 1. ABSTRACT A pulsing circuit is designed and constructed capable of raising up to +6.7kV between plates of a small (~50cm side length) spark chamber. The device is triggered by the ~2V output of a cosmic ray detection device, and its overall gain of ~1:3000 is achieved by a sequence of amplifiers and fast switching devices – namely a Bipolar Junction Transistor (BJT), Insulated Gate Bipolar Transistor (IGBT), 1:53 gain pulsed transformer and a triggered spark gap. The qualitative response of each component is assessed with respect to its response and relaxation time. The overall delay time between electronic input and this 6.7kV pulse is found to be as short as 580±100ns. The response of the electronics is investigated under a range of square input pulse amplitudes and durations, simulating input pulses expected from the cosmic ray detector. A pulse shape of 200ns and depth of 2V or more is found to minimise rise times within limits set by adjacent components. The majority (over 60%) of the overall rise time is identified with the LC charging of the step-up transformer. The 55.7±2ms RC recharge time of the capacitor driving the transformer input limits the system’s maximum repetition rate to ~10Hz. It is found that the assembled system is compatible with operation of a small spark chamber, and recommendations are made regarding further fine tuning and potential future challenges. 2. INTRODUCTION
Though the era of the spark chamber as the workhorse in particle detection of the 1960s has passed, it is remembered for its elegant design and dramatic visual impact. The device discharges a sequence of alternating high and low voltage plates along the ionised track left in the wake of a passing charged particle – illuminating its trajectory with a sudden arc of light (fig 2.1a). Though solid state devices have become the research tool of choice, the spark chamber has now assumed an educational role. In an ongoing outreach project for Cambridge High Energy Physics, we seek to construct a portable spark chamber to visualise the passage of cosmic rays in real time, highlighting the frequency and distribution of this “rain” of charged particles. For both particle physicist and non-physicist alike the spark chamber brings to life both these extra-terrestrial particles and an ingenious tool from the history of detector physics.

2
(a) (b)
Fig 2.1 (a) Photograph of sparking in Vienna’s Technisches Museum’s spark chamber, alongside a simple cartoon (b) illustrating the track formation process. The cosmic particle ionises gas as it passes, providing a path of least resistance for discharge between adjacent plates.
~8kV
The discharge between adjacent plates which ultimately illuminates the cosmic track (fig 2.1b) is of course the final stage of a sequence of key operations required for successful chamber operation. Crucially, to prevent continuous discharge between chamber plates (arcing) a triggering device must be included to apply 8kV only immediately after an ionising particle has traversed the chamber. The complete operational sequence therefore includes an event counter and pulsing circuit as illustrated below (fig 2.2), which operate as follows: (1) scintillator counters above and below the chamber detect passing charged particles; (2) coincident arrivals are isolated electronically; (3) the coincidence signal is amplified, triggering discharge across a spark gap; (4) shorting at the spark gap discharges capacitor C and drives chamber plates to high voltage; sparking in the chamber grounds all the plates and C recharges through choking resistors R1 and R2.
Fig 2.2 The simplest equivalent circuit completely describing the operation of a spark chamber.
For simplicity only two plates are included. Labels (1) to (4) indicate the location of the processes detailed in the text above leading from detected particle to successful sparking.

3
In this report I shall assemble and evaluate the triggering electronics to connect stages (2) and (3) of existing hardware. The circuit is tuned to achieve the fastest overall switch on time, since high voltage must be applied to the chamber plates before the residual ionisation introduced by the cosmic particle becomes too diffuse to nucleate successful sparking. Previous work with chambers of similar dimensions to our ‘table-top’ design ([1], [2]) suggests that 100% efficient sparking can be expected if the total electronic delay between detection of a cosmic particle and application of an ~8kV pulse to the chamber is below 500ns, falling to 85% by 600ns. Assuming the coincidence circuit can be tuned to achieve <100ns rise times [3] we therefore aim to limit the overall delay time introduced by our pulsing system - which will ultimately activate the chamber plates - to better than 500ns. We will also consider carefully the relaxation time of our system to ensure that a sparking repetition rate of >10Hz is attainable – achieving a resolution of <0.1s between individual sparks. This threshold is selected as it is at the limit of the human eye and hence a sensible target rate for our demonstration chamber. 3. THE SYSTEM 3.1 Triggering a Spark Chamber Triggering a fast rise time ~500ns, high voltage ~8kV pulse across plates in a spark chamber is often achieved using a cascade of fast switching devices as shown in fig 3.1. At each stage in the circuit a switching device holds off a high voltage plate of a capacitor, which becomes shorted to ground when a triggering pulse stimulates breakdown of the device. This voltage step is conveyed across the capacitor to the input of the following switching device, and ultimately to the plates of a spark chamber. Traditionally thyratrons or triggered spark gaps are selected as switches, combining high breakdown voltages and ‘instant’ ~20ns [4] turn on time. Today solid state devices are also able to switch high voltages suitably swiftly and are preferentially used where possible due to their superior durability.
Fig 3.1 A generalised fast switching, high voltage circuit suitable for pulsing a small spark chamber. A small trigger
pulse breaks down S1, discharging C1 to ground. This ~ -300V step is transferred across the capacitor C1 and triggers S2, repeating the process at higher voltages. When C2 is fully discharged conduction in S2 is extinguished and C2 recharges rapidly through R4 – switching off the ~8kV pulse that is delivered to the spark chamber.

4
The choice of switching device will critically affect the overall delay time of our pulsing circuit. The strength of the spark gap approach to triggering is its speed – in a research grade chamber four or five spark gaps are typical, with overall delay times as little as 100ns [4]. However both spark gaps and thyratrons are prone to deterioration on inconveniently short timescales1 - of order 105 pulses, equivalent only to ~5 days of 1Hz pulsing typical of small spark chambers. Although solid state alternatives are considerably more rugged, they too have distinct disadvantages. Even the fastest BEHLKE devices have delay times of >120ns [5], so a cascade of such devices is clearly unfeasible. To custom design a single device for the process is course expensive (~£1000). The commercially popular high voltage switching Insulated Gate Bipolar Transistor (IGBT) is both cheap and fast – capable of switching a 1kV pulse in a few tens of nanoseconds – but readily available models are limited to below <2kV operation [6]. 3.2 Our Design Appropriate hardware for our pulsing circuit must meet the following criteria:
The circuit should deliver >8kV within <500ns of an input signal, and accommodate a 10Hz repetition rate.
Equipment must be compact, lightweight and durable to allow for easy transportation.
Construction costs must be minimised where possible. Ultimately we must deliver a higher voltage output than possible using cheap solid state devices alone but we wish to avoid maintenance heavy spark gaps where possible. We therefore select a compound design tested successfully in a similar educational spark chamber designed by the Dutch Institute for High Energy Physics, NIKHEF [7]. The system uses a spark gap to ultimately deliver a ~8kV pulse to the chamber, which is itself triggered at ‘low’ (~100V) voltages by an IGBT device. In the interests of durability and ease of maintenance, our spark gap is to be triggered by a simple commercial spark plug for the automotive industry. The spark plug must be triggered at high voltage (~4kV) to ensure reliable operation, and so a pulsed transformer is used to step-up the ~100V output voltage of the IGBT. Finally, the IGBT must be triggered at above its ~6V threshold voltage, and so the ~1V output of a coincidence circuit is amplified by a simple Bipolar Junction Transistor (BJT) driven amplifier. A simplified circuit diagram is illustrated below (fig 3.2):
____________________________________________ 1. The triggering electrode for spark gaps collects particulates and the noble gas within the thyratron is gradually polluted by air intrusion.
5
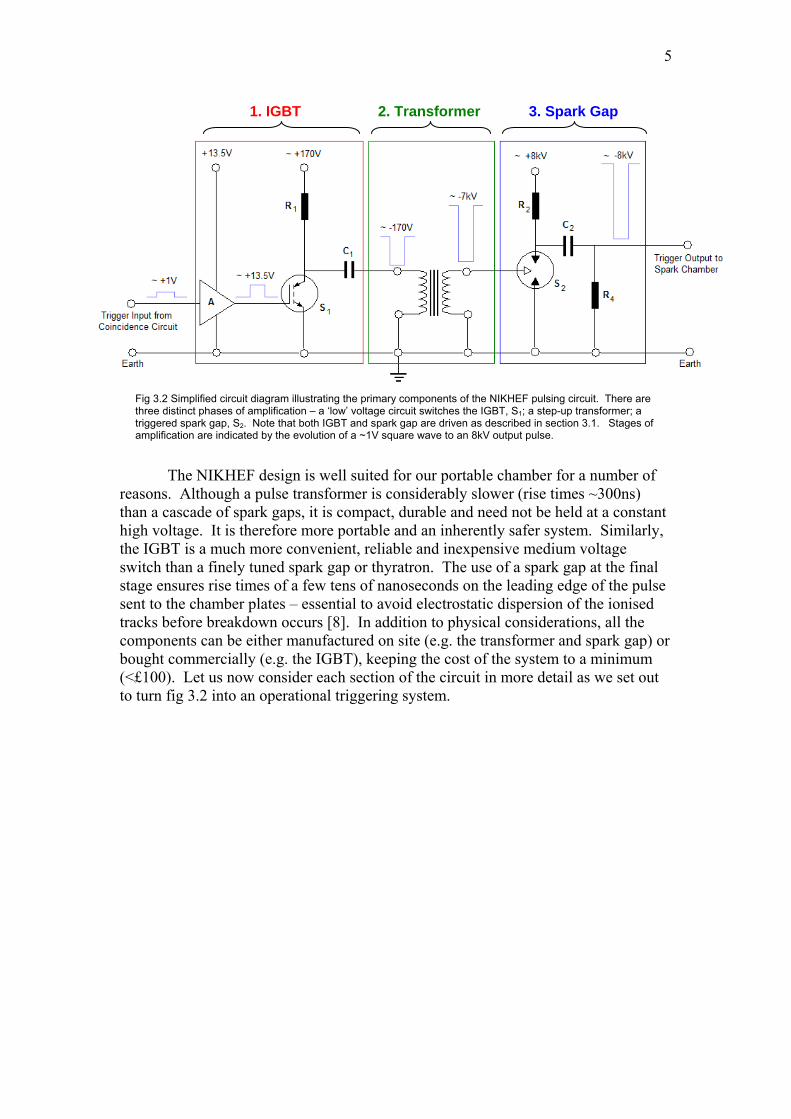
1. IGBT 2. Transformer 3. Spark Gap
Fig 3.2 Simplified circuit diagram illustrating the primary components of the NIKHEF pulsing circuit. There are three distinct phases of amplification – a ‘low’ voltage circuit switches the IGBT, S1; a step-up transformer; a triggered spark gap, S2. Note that both IGBT and spark gap are driven as described in section 3.1. Stages of amplification are indicated by the evolution of a ~1V square wave to an 8kV output pulse.
The NIKHEF design is well suited for our portable chamber for a number of reasons. Although a pulse transformer is considerably slower (rise times ~300ns) than a cascade of spark gaps, it is compact, durable and need not be held at a constant high voltage. It is therefore more portable and an inherently safer system. Similarly, the IGBT is a much more convenient, reliable and inexpensive medium voltage switch than a finely tuned spark gap or thyratron. The use of a spark gap at the final stage ensures rise times of a few tens of nanoseconds on the leading edge of the pulse sent to the chamber plates – essential to avoid electrostatic dispersion of the ionised tracks before breakdown occurs [8]. In addition to physical considerations, all the components can be either manufactured on site (e.g. the transformer and spark gap) or bought commercially (e.g. the IGBT), keeping the cost of the system to a minimum (<£100). Let us now consider each section of the circuit in more detail as we set out to turn fig 3.2 into an operational triggering system.

6
4. THE IGBT AMPLIFIER As we set out to construct the first phase of our pulsing circuit, let us consider briefly the anatomy of electronics successfully operated in the NIKHEF design - introducing the components by which initial amplification will be achieved. A good understanding will be crucial as we tune the circuit to our specific requirements. 4.1 Theoretical Background Switching Operation of a BJT The fundamental property of a Bipolar Junction Transistor (BJT) is that of a current amplifier. BJTs come in two flavours depending on their internal doping, but only the pnp type relevant in this investigation will be discussed here (see [9] for a detailed introduction to the BJT). Its electrical symbol is shown in fig 4.1. The device is designed such that current flow from emitter to collector pins is larger than the emitter to base current by a roughly constant factor β i.e. IE/C = β IE/B. This property may be used as an amplifying switch in the following way.
When both base and emitter sit at equal potential VB = VE (fig 4.1a), no current flows from emitter to base, and hence there is no current flow from emitter to collector – the switch is ‘off’.
If the base voltage falls to lower than VE by ΔV a base current is initiated - the switch is now ‘on’. In the ‘on’ state an ideal BJT will drop the full VE across the load resistance at the collector.
Note that the emitter to base current path is a pn junction and hence behaves as a diode – it will only conduct when VB is lower than VE i.e. when ΔV is a negative step. (a) BJT Switch ‘Off’ state (b) BJT Switch ‘On’ state +VE
VB = +VE
VC
= 0
Fig 4.1 Cartoon illustrating the anatomy of BJT and its operation as a switching device. In the ‘off’ state, in the absence of potential difference between emitter and base pins no current flows in the device and hence no voltage falls across the load RL. When the base voltage VB is pulled below that of the emitter VE a small base current prompts a larger collector current (indicated by orange arrows), and the VE is dropped across the load.
VC = VE
+VE
VB =+VE - ΔV

7
Switching Operation of an IGBT Although the Insulated Gate Bipolar Transistor (IGBT) is a single silicon device, its switching mechanism may be modelled qualitatively by the equivalent circuit shown in fig 4.2 [10]. The device combines the high voltage resilience of a MOSFET (Metal Oxide Semiconductor Field Effect Transistor; see [11]) with the high current capacity of a BJT. Unlike BJTs, MOSFETs are controlled by voltage on an input terminal – the gate – which is electrically isolated from the remainder of the circuit. Below a threshold gate voltage (typically ~5V) the remaining terminals – ‘source’ and ‘drain’ - are insulated from one another, but a conducting path is formed once the gate threshold is exceeded. In the IGBT this behaviour is exploited to switch high voltages as follows:
When the gate voltage VG is below threshold, the MOSFET is insulating and no voltage is dropped across the BJT base/emitter junction – no current flows and the switch is ‘off’
When VG exceeds threshold, the MOSFET becomes conducting and the drain, and hence the base of the BJT, are pulled to ground. Base current now flows and so a large collector current flows to ground – the switch is ‘on’
VG < Vcritical
VS
VD (a) IGBT ‘Off’ state
VG > Vcritical
VD - VS
VS = VD
VD (b) IGBT ‘On’ state
Fig 4.2 Simple IGBT equivalent circuit. The box distinguishes between the physical pins of the IGBT and the model we use to rationalise its behaviour. In the ‘off’ state the source/drain of the MOSFET are open circuit, and so the full (VD - VS) falls across the device. In the ‘on’ state the electrically insulated gate circuit triggers conduction in the MOSFET and hence current flows through the BJT. The large collector current facilitated by the BJT behaviour enables IGBTs to behave as short circuits even under very high (kV) voltages.
4.2 Circuit Design and Construction As illustrated in fig 3.2 the NIKHEF design combines a BJT and IGBT to facilitate an overall voltage gain of ~100 with an input pulse of a few Volts. The complete circuit diagram used in the NIKHEF system is shown below (fig 4.3).

8
Fig 4.3 Complete circuit diagram of the NIKHEF IGBT amplifier. The active components –BJT and IGBT – are denoted S1 and S2 respectively and switch voltages V1 and V2 to the input of the following stage of the circuit. Regions of the circuit highlighted in blue are surge protection features designed to hold the circuit within the 0 to V1 operational range of the transistor or 0 to V2 range of the IGBT.
This circuit operates as follows. In steady state both base and emitter of the BJT sit at equal potential V1 and, as described in Section 4.1, S1 is therefore ‘off’. When the negative triggering pulse depresses the base voltage the switch is activated and the BJT will drop V1 across resistors at the collector. This voltage step is incident on the gate of the IGBT, S2, which switches to its ‘on’ state if the threshold voltage is exceeded. The IGBT now discharges C4, transferring a step change in voltage to the load RL. When the input square pulse returns to its off state BJT base current is extinguished and both devices return to their ‘off’ states. The successful execution of this process depends crucially on the resistances and capacitances across the circuit, as well as the voltages at which we operate the system. Clearly components are selected with suitable tolerance levels, and provisions made to ensure unwanted voltage and current spikes are damped quickly. To this end two diodes are included at the IGBT collector to ensure it is never lifted significantly above the supply voltage or below ground. Similarly, large (~10μF) capacitors C2 and C3 are connected to protect the supplies from rapid voltage spiking characteristic of pulsed electronics. Low value resistors are chosen, R1 and R2, to limit the inrush current to the BJT and IGBT. Most importantly however, large (kΩ) choking resistors, R4 and R5, prevent the supplies from shorting to ground when the switches become conducting. To ensure fast switching, BJT and IGBT are selected with appropriately short rise times – ~40ns [12] and ~20ns [13] respectively. This IGBT has a rated gate threshold voltage of 5.6V and the BJT must be able to switch well in excess of this value. Finally the BJT datasheet [12] indicates that 0.02A is a comfortable collector current. Resistors R2, R3 and R6 are therefore selected to total 500Ω to permit a 0.02A collector current at 10V and we will power the BJT at just above this threshold.

9
4.3 Assembly and Testing Armed with a good understanding of the NIKHEF electronics I set about assembling the circuit. Using a copper track ferroboard and taking care to isolate regions of the board at ~100V from those of the ~10V by removing several copper tracks, the circuit was assembled in a compact but accessible arrangement to allow for ease of transport and simple access for maintenance and experimentation. The finished circuit board (fig 4.4b) is mounted within a plastic box to provide adequate insulation and resist physical damage.
Probe points
~1V
~-60V
Vi Vo
(a)
(1) (2)
(3)
(4)
Signal Input from signal generator
(b) +13.5V
+60V
To Load
Fig 4.4 The completed IGBT circuit (b) is pictured alongside its circuit diagram (a). Key components, the two voltage supply rails and input/output terminals are highlighted. Note that components along the same vertical strip are connected by printed copper tracks on the reverse of the board. The +13.5V rail is isolated from the 60V region of the board by three vertical rows, each of which has its copper track removed to prevent unwanted sparking when the secondary rail is ultimately operated at ~180V. Probe points are indicated and numbered in (a), covering the complete signal path indicated in (b) by the blue trace. Grounded tracks are indicated in green.

10
With the hardware in place a sequence of experiments were undertaken to assess the general response of the system. The relevant experimental setup is shown above (fig 4.4a). The input pulse - which will ultimately arrive from the coincidence circuitry (fig 2.2) - is simulated using a signal generator and the circuit is pulsed at 1Hz – a typical sparking rate for a small spark chamber. For simplicity a purely resistive load was selected and a low value of 1Ω chosen to simulate the low resistance of the transformer primary which will ultimately load this circuit. Care was taken to select appropriately thick load leads (visible in fig. 4.4b) as we expect instantaneous currents of tens of amps as C4 discharges through this 1Ω. Suitable voltage supplies were selected and the lower voltage rail set at +13.5V – a trade-off between faster transistor switching time [12] and the 16V voltage rating of capacitor C2. The higher voltage rail will be operated at +60V – significantly larger than 13.5V but ‘safe’ for tabletop experimentation. The circuit will be probed at four key locations shown in fig 4.4 to image the pulse evolution. High impedance 1MΩ probes were selected and operated at maximum attenuation to minimise their influence on the circuit behaviour. The input pulse width is selected at 100ns – a desirable upper limit for the total rise time of this circuit. Preliminary work suggests a 0.5-2V range of input amplitudes will be sufficient to observe behaviour between BJT operational threshold and saturation - i.e. when the full supply voltage is switched - within the crucial 100ns.
4.4 Observations and Discussion Threshold Voltages and Rise Times With both amplifying rails held at constant potential (+13.5V and +60V) the amplitude of our 100ns input pulse was varied continuously across the 0.5-2V range of interest. Two important thresholds are identified, corresponding to the switch on voltages of the two amplifying components – the BJT and the IGBT. Images of the behaviour at probe points (1)-(4) are shown below (fig 4.5 and 4.6), illustrating behaviour around these thresholds. Note that in these figures each trace is AC coupled and so although true changes in voltage are observed, no absolute voltages are recorded.

11
Fig 4.5 System response at low (<1.2V) pulsing amplitude
1.2V
6V
0.9V
130ns
0.8V
0.6V
3. IGBT Input
4. IGBT Output
2. BJT Base
1. Input Signal
(a) At low amplitude Vi <0.8V pulsing at the input, although a small 0.6V signal appears at the BJT base, it remains inactivate and the remainder of the circuit is undisturbed.
(b) At input voltages 0.8V<Vi <1.2V the BJT turn-on threshold is exceeded and voltage is dropped across the IGBT gate. Up to 6V at the gate fails to activate the IGBT.
A cursory glance at fig 4.5 instantly offers some general insights into the performance of our system. Firstly, notice that the ‘square’ wave applied to the circuit by the signal generator is significantly distorted, and becomes even more so by the BJT input. Between voltage steps this distortion is exponential in form, and can be related to the parasitic capacitance of our components, as will be discussed shortly. In addition to these general observations, fig 4.5a images the BJT switch on voltage at ΔVb = -0.6±0.05V, where the uncertainty is determined by variation observed in consecutive experiments. Above this threshold, the BJT drops voltage at the IGBT input (fig 4.5b) which increases with increasing ΔVb, consistent with our BJT theory (section 4.1). Note that at these low input voltages the BJT rise time is a relatively long 130ns. Further increase in input pulse is imaged below (fig 4.6): Fig 4.6 System response at high (>1.2V) pulsing amplitude
80ns
2V
60V 10V
3. IGBT Input
4. IGBT Output
2. BJT Base
1. Input Signal
1.5V
6V
(a) At Vi > 1.2V the BJT raises the IGBT gate above its 6V threshold voltage, and we see a brief 20ns IGBT output response.
(b) At Vi >2V the BJT rises to saturation within the 100ns input pulse. The IGBT is successfully activated within this rise time, switching -60V after 80ns. Note that the BJT remains saturated for a few 100ns before relaxing towards its unperturbed potential.
12
We see IGBT response for the first time in fig 4.6a. The 6±0.5V peak observed at the IGBT input in fig 4.5b therefore indicates a switch-on voltage, and the uncertainty is estimated by comparison with fig 4.6a and b and reflects the natural variability of the device. It is interesting to note (fig 4.6a) that activity at the IGBT output is relaxes after only ~20ns – a good 50ns before the input voltage has fallen beneath this 6V threshold, indicating more complex semiconductor physics than is considered here. Finally we see in fig 4.6b that further increase of potential difference at the BJT base, raises the BJT output to saturation at 10V - reduced somewhat from the expected 13.5V supply by the internal resistance of the device and the potential divider circuit at the collector. Crucially, the IGBT is now switches the full 60V dropped across it by the supply as predicted in Section 4.1. The overall switch on time of the system is now reduced to 80ns as indicated in fig 4.6b, and this operation demands an input pulse of 2V. The sequence of thresholds identified above indicates that this 80ns delay is acquired in two distinct phases. The first is a rise time associated with the base of the BJT at it falls to beneath its 0.6V threshold. On careful inspection of fig 4.5b and 4.6 we find that, although this delay decreases as input pulse amplitude increases, the gains are only a few ns and the BJT rise is always initiated within 30ns. Larger gains are made in the BJT rise time. We observe that the threshold voltage of the IGBT, attained 100ns after BJT activation in fig 4.6a, is reduced to 60ns in fig 4.6b as the input pulse is increased from 1.2V to 2V. As discussed in Section 4.1 the amount of collector current delivered by a BJT is roughly proportional to the amount of base current flowing in the device. The observed improvement in rise times with increasing input pulse may therefore be understood qualitatively – as the larger input pulse drives the base voltage lower, more base current flows in the BJT, releasing larger collector current to charge the IGBT input to the 6V threshold more rapidly. Though we will satisfy ourselves with 80ns IGBT activation time for now, it is worth noting that there is still room for fine tuning here – indeed the BJT data sheet [12] suggests that under ideal conditions the rise time may be reduced to <20ns. Relaxation Time, Repetition Rate and the RC time
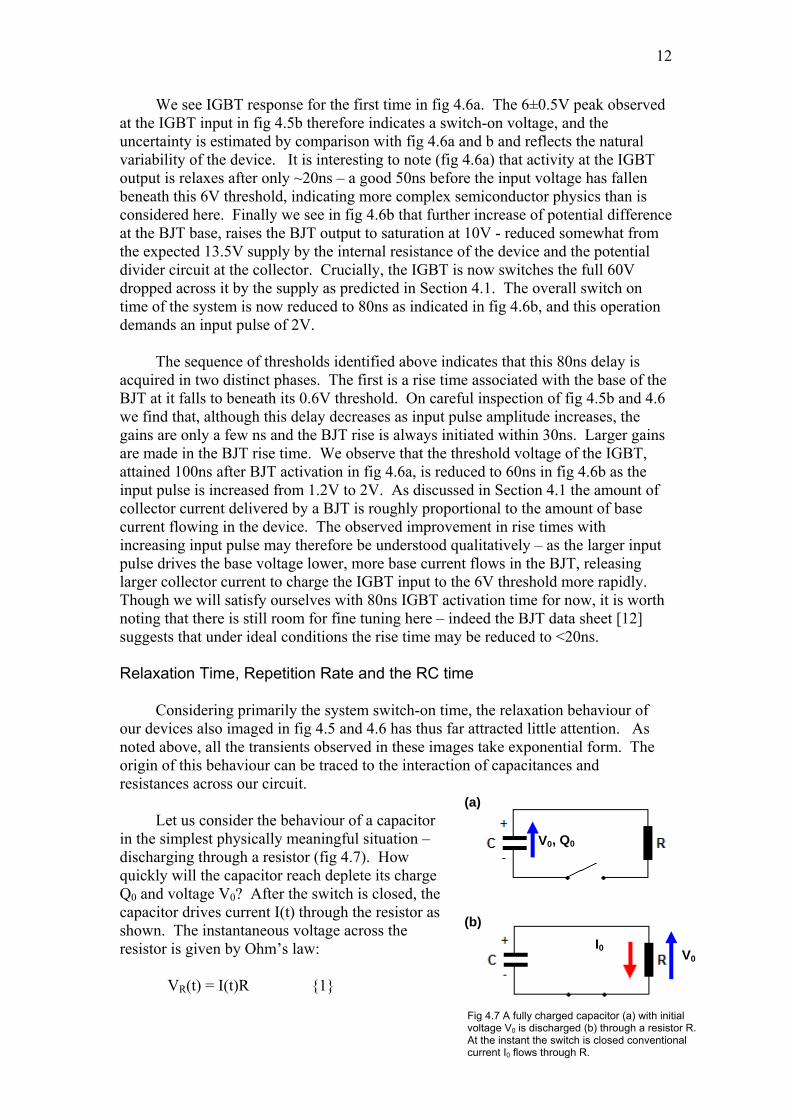
Fig 4.7 A fully charged capacitor (a) with initial voltage V0 is discharged (b) through a resistor R. At the instant the switch is closed conventional current I0 flows through R.
(b)
V0
V0 I0
(a)
Considering primarily the system switch-on time, the relaxation behaviour of our devices also imaged in fig 4.5 and 4.6 has thus far attracted little attention. As noted above, all the transients observed in these images take exponential form. The origin of this behaviour can be traced to the interaction of capacitances and resistances across our circuit. Let us consider the behaviour of a capacitor in the simplest physically meaningful situation – discharging through a resistor (fig 4.7). How quickly will the capacitor reach deplete its charge Q0 and voltage V0? After the switch is closed, the capacitor drives current I(t) through the resistor as shown. The instantaneous voltage across the resistor is given by Ohm’s law:
, Q0
VR(t) = I(t)R {1}

13
The instantaneous voltage across a capacitor is given by the familiar relation:
VC(t) = Q(t)/C {2} where the capacitance C is a constant depending only on the device geometry. Using {1} and {2} we apply Kirchhoff’s law – that the algebraic sum of the voltages around a circuit must be zero - and make the substitution I(t) = dQ(t)/dt:
VR(t) + VC(t) = 0
I(t)R + Q(t)/C = 0
1 dQ = - t dt Q(t) RC
This simple differential equation has an exponential solution which may be expressed in terms of instantaneous charge or (applying {2}) voltage across the capacitor: Q(t) = Q0 e{-t/RC} or V(t) = V0 e{-t/RC} {3} We have therefore identified an exponential decay with a characteristic timescale τ = RC, after which any capacitor will be discharged to 1/e of its initial charge and voltage. It is straightforward to show that charging a capacitor through a resistor using an ideal voltage source returns the same time constant.
All the exponential transients of fig 4.5 and 4.6 may be understood in terms of
this powerful, simple physical insight. Let us take the clearest example – the relaxation rate of the IGBT input in fig 4.6a. Although the IGBT data sheet fails to specify an input capacitance, a range of commercial IGBTs of similar specifications have rated input capacitances between Ci=3nF and Ci = 500pF across their gate and source pins. Careful inspection of our circuit diagram (fig 4.3) indicates that once the BJT switches off an RC circuit is established across R3= 560Ω as shown in fig 4.8a. We thus expect an e-folding time τ = RC between 1.7μs and 280ns. Comparison with experimentally observed 520ns (fig 4.8b) is favourable - this decay time indicates an IGBT input capacitance of ~0.9nF, towards the lower end of the suggested values, but clearly a reasonable figure.
VGate
520ns
Fig 4.8 (a) Diagram indicating the RC circuit formed by the IGBT input capacitance Ci and the Ω resistance R3. (b) The delay time required for the IGBT input voltage (green trace) to y to 1/e of its full value is measured at 520ns.
(a) (b) IGBT
560deca

14
We can helpfully apply the RC theory to identify the slowest transient response in our system – behaviour which ultimately limits the maximum repetition rate of our system. Looking over our circuit (fig 4.3) we expect the 82kΩ of R5 and the 680nF of C4 to have the largest RC time as C4 is recharged by the supply. We find that the 55.7±2ms - limited by the few percent uncertainties of our components values - is completely consistent with the 55.7±1ms ms recharge time of the IGBT determined by careful probing, and imaged below (fig 4.9).
~ 56ms
Fig 4.9 Observations at the IGBT output reveal that the relaxation behaviour of the system is ultimately limited by the recharge rate of capacitor C4. At the pulsing rate of 5Hz shown here, it recharges almost completely before each pulse. However, with an e-folding time of ~50ms we might expect a limiting repetition rate of ~20Hz.
Not only is fig 4.9 a fine example of the predictive power of RC theory, that the relaxation time of the system is >50ms is an important observation for two reasons. Firstly, this figure suggests an upper limit on the system repetition rate of 20Hz – assuming a single e-folding time is adequate to restore sufficient charge for successful sparking. After further experiment we find the true limiting rate to be ~10Hz, equivalent to two e-folding times of the RC recharge – at higher rates pulses are missed in plots similar to fig 4.9. The second important conclusion we may draw from this 50ms relaxation time is that similar relaxation behaviour elsewhere in the circuit (e.g. those observed in fig 4.6 and 4.7) occurs effectively instantaneously - 520ns relaxation of the IGBT gate is over 100,000 times faster than this 56ms recharge time. This observation is consistent with the RC times of all other capacitor and resistor pairs in the circuit, and is a reassuring indication that the circuit will be completely at rest before each pulse, if operated at <10Hz.

15
5. THE TRANSFORMER With an functional amplifier capable of switching >60V within 80ns of a 2V square input pulse let us now consider the transformer which will further amplify the pulse (recall fig 3.2). 5.1 Theoretical Background The non-ideal Transformer There various equivalent circuits by which a non-ideal transformer may be modelled. We will consider (fig 5.1) the ‘textbook’ non-ideal transformer (see [11]), to select an appropriate transformer design for maximal voltage gain and minimal rise time.
Fig 5.1 treats the non-ideal transformer as an ideal transformer with a selection of parasitic inductances and resistances associated with each coil and a ‘magnetising’ inductance Lm which determines the amount of back e.m.f. dropped across the primary of the (notional) ideal transformer. Additionally, the multiple adjacent windings of the secondary introduce a finite ‘winding’ capacitance Cw across the secondary output. The parasitic (‘leakage’) resistances are associated with the finite resistance of the coil wires, and the leakage inductances reflect flux generation in either coil that fails to link its partner successfully. Simple application of Kirchhoff’s law to both primary and secondary circuits allows us to define the input voltage of the ideal transformer V'i and the output voltage Vo.
V'i = Vi – I1R1 – L1(dI1/dt) {4}
Vo = V'o - I2R2 – L2(dI2/dt) {5}
Ideal Transformer
Non Ideal Transformer
V'i V'o
Vi
Vo
R1
L1
Lm
R2
L2
N1 N2
I2
I1
Cw
Fig 5.1 A common non-ideal transformer equivalent circuit. Series resistors R1 and R2 account for Ohmic losses in the coils, and inductances L1 and L2 represent their ‘leakage’ inductances – where induced flux fails to link both coils. Lm, the ‘magnetising inductance’ determines the voltage V'i across the primary of the ideal transformer region as input current I1 varies. Charging of the secondary windings is accounted for by a ‘winding capacitance, Cw, across the output.
16
Note that all voltage and current terms vary with time, though subscripts are dropped for convenience. The input and output voltages across the ideal transformer can be related by the familiar expression:
V'o = V'i (N2/N1) {6}
Substituting {6} into {5} we find:
Vo = V'i (N2/N1) - I2R2 – L2(dI2/dt)
We may in turn apply {4} to this expression and relate Vo to Vi as follows:
Vo = [Vi – I1R1 – L1(dI1/dt) ](N2/N1) - I2R2 – L2(dI2/dt) Vo = Vi(N2/N1) – [I1R1 + L1(dI1/dt) ](N2/N1) - I2R2 – L2(dI2/dt) {7}
Notice that the form of {7} at any instant suggests a linear relationship between input and output voltages:
Vo = Vi(N2/N1) + A(t) {8} where A(t) is a constant that will vary in time according to the relative dominance of each leakage term in {7}. This expression is identical to that of an ideal transformer, {6} when leakage terms are zero – i.e. A(t) = 0 – as expected. In seeking to reach a threshold output voltage to discharge a spark plug (see Section 3) within our 500ns ideal response time we will consider both the magnitude of this ‘leaked’ voltage A(t) and also the resonant behaviour of the non-ideal transformer of fig 5.1. 5.2 Transformer Design and Fabrication
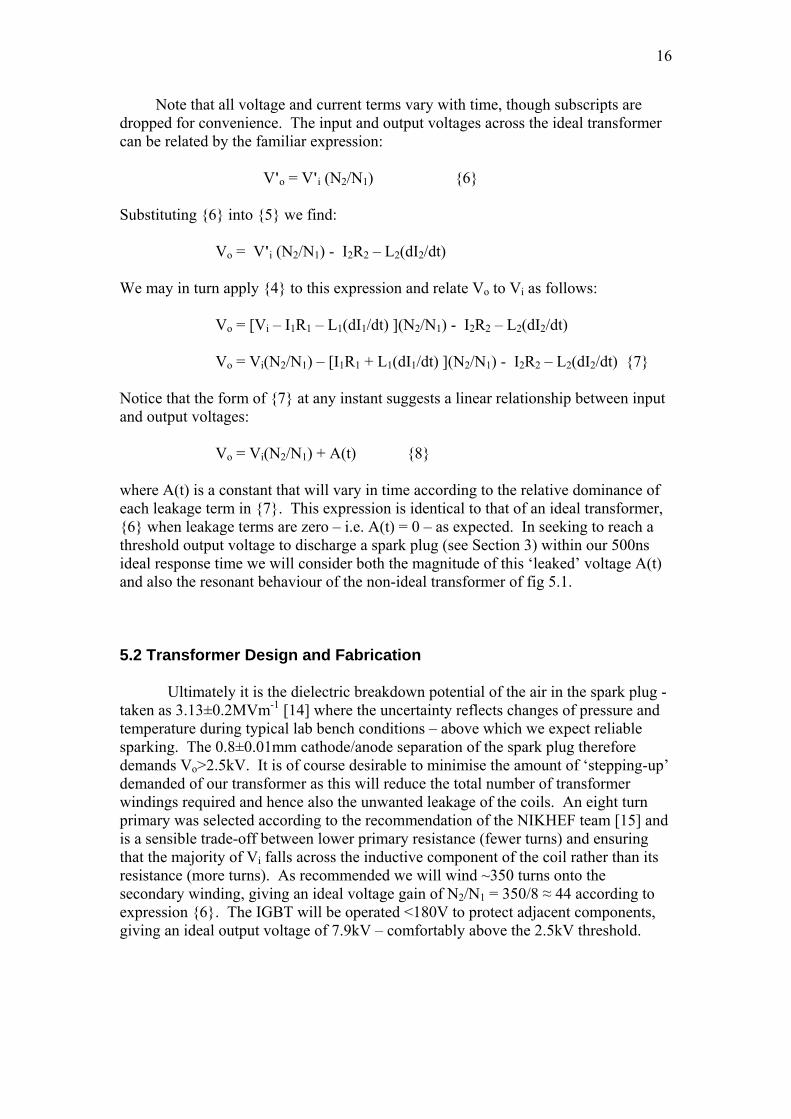
Ultimately it is the dielectric breakdown potential of the air in the spark plug - taken as 3.13±0.2MVm-1 [14] where the uncertainty reflects changes of pressure and temperature during typical lab bench conditions – above which we expect reliable sparking. The 0.8±0.01mm cathode/anode separation of the spark plug therefore demands Vo>2.5kV. It is of course desirable to minimise the amount of ‘stepping-up’ demanded of our transformer as this will reduce the total number of transformer windings required and hence also the unwanted leakage of the coils. An eight turn primary was selected according to the recommendation of the NIKHEF team [15] and is a sensible trade-off between lower primary resistance (fewer turns) and ensuring that the majority of Vi falls across the inductive component of the coil rather than its resistance (more turns). As recommended we will wind ~350 turns onto the secondary winding, giving an ideal voltage gain of N2/N1 = 350/8 ≈ 44 according to expression {6}. The IGBT will be operated <180V to protect adjacent components, giving an ideal output voltage of 7.9kV – comfortably above the 2.5kV threshold.

17
We choose to hand wind our transformer, selecting the device materials and geometry to most successfully limit flux leakage, and hence leakage inductances. Simple features – addition of a flux shaping ferrite core and use of low resistivity copper wire – are complimented by careful consideration of device geometry, which places the following constraints on our design (fig 5.2):
1) Linear design
The primary coil is completely enclosed by the secondary such that the majority of flux naturally links the secondary windings.
2) Adjacent winding Both coils will be wound carefully by hand to ensure no gaps are left between adjacent windings through which flux can leak.
3) Coil bed matching
Primary and secondary solenoids will have approximately equivalent lengths, h, minimising the amount of flux leakage between primary and secondary layers.
In addition to flux leakage considerations our device must be compact and robust. We settle on a bed length of h = 10mm. Choosing primary and secondary wire diameters at 0.85mm and 0.19mm diameter the primary will fall slightly shorter than the full bed length (6.8mm), but the secondary can be wound as 7 layers of 53 secondary windings, totalling 371 turns – a 1:46 ratio ideal for our purposes. Raising 180V at the primary to ~8kV, the far ends of adjacent beds of the secondary coil will therefore experience potential differences of a few kV (see fig 5.3) and so each layer is bound with several layers of insulating ‘Kapton’ tape. The complete schematic of this design is shown below (fig 5.3).
Fig 5.2 Cartoon illustrating how transformer design cbe adjusted to limit flux leakage.
an
Leakage flux between primary windings
Leakage flux around primary windings
Flux successfully linking both coils
Secondary windings
Primary windings
(c)
(b)
(a)
h
Coil-former

18
0V
0V
180V ~8kV
Secondary windings; 7 layers; 53 windings per layer
Primary windings; 8 windings indicated individually
Retractable ferrite core
Each layer accommodates ~1.1kV. Thus adjacent layer endings are at potential differences of ~2.2kV
Highly insulating ‘Kapton’ tape prevents internal sparking between secondary layers
Layer of stiff card to support secondary windings
h = 10±0.1mm
w ≈ 8mm t ≈ 4mm
Coil former machined from insulating (plastic) material
Fig 5.3 Schematic detailing the design of our fast switching transformer. Note that the primary windings are laid adjacent to one another, and the coil placed centrally – both designed to minimise the leakage inductance as much as possible, according to the qualitative reasoning illustrated in fig 5.2.
5.3 Construction and Experimental Setup Working from fig 5.3 the transformer was assembled and mounted as shown in fig 5.4. Following a failed first attempt, great care was taken to completely isolate adjacent layer ends using 3-4 layers of insulating tape. A spark gap was added to the output of the secondary to ensure that accidental triggering of an unloaded transformer will discharge safely rather than by internal sparking. The sense of the windings is chosen such that the negative pulse expected on the primary will produce a positive pulse on the secondary – the spark plug will be held within a positive potential in the spark gap and so we require excess positive voltage to exceed the breakdown threshold. Short, thick external leads were selected to minimise unwanted external inductance and resistance of the connecting circuit which may add to the device rise time, and high voltage resistant cable was used as appropriate.

19
Primary Windings
Plastic coil-former
Secondary Windings
Primary Ground
Primary Input; -180V pulse
Secondary Output; ~ +2.2kV pulse
Insulating tape
Failsafe Spark Gap
Secondary Ground
Retractable Ferrite core
Fig 5.4 The completed transformer, indicating the position of components shown schematically in fig 5.3
A series of experiments was undertaken to assess the behaviour of the device. Our interests are primarily the device gain – whether we can successfully exceed the breakdown voltage required to trigger the spark plug – and its rise time – whether this breakdown will occur fast enough to ensure our overall delay time is held beneath our target 500ns. Using the experimental arrangement shown in fig 5.5 probes were placed across primary and secondary transformer windings, measuring Vi and Vo respectively, and our pulsing circuit constructed in Section 4 drives the circuit for a few hundred nanoseconds and at varying input voltages. Attaching the transformer output to the spark plug we will examine the system response below and above the discharge threshold. Note that probing the output’s high voltage spikes is no easy task and we are limited to below the 5kV maximum voltage rating of our most robust probe.
Spark Plug 0.84±0.01mm
IGBT Circuit
Fig 5.5 Experimental arrangement used to assess transformer behaviour. The system is probed at transformer input (1) and output (2) to observe the relationship between Vi and Vo. The leakage resistances and inductances are lumped together for the purposes of this investigation.
During preliminary testing we find that the V0 only attains its maximum value if the IGBT is open for 800ns. This is achieved by ensuring the input pulse duration is increased to >200ns – 600ns will be used for the following experiments.

20
5.4 Results and Discussion Pulse Distortion, Finite Rise time and LC oscillation
The first crucial insight into the behaviour of our transformer is in the elegant profile of the output voltage. Typical behaviour is shown in fig 5.6 below for below threshold output voltages (fig 5.6a) and including sparking (fig 5.6b):
~800ns ~700ns
600ns 64V
3.9kV 3.7kV
(a) (b)
Fig 5.6 Probing the voltage at the transformer primary (blue trace) and secondary (purple trace) coils. Though the system is driven at identical primary voltages we observe either (a) voltage oscillation but no breakdown or (b) breakdown before peak voltage. Note that this breakdown occurs around 4±1kV, where this large spread reflects the complex and chaotic physics of discharge occurring in the spark plug.
The most striking thing about fig 5.6 is the relatively long, >700ns rise time of the secondary voltage. By comparison, the IGBT switching time of <20ns (exactly as suggested by [13]) applies the primary voltage almost instantaneously. Already we observe significant deviation from ideal transformer behaviour - where we would expect such a step change to drive a step change in secondary voltage. In fact we observe zero secondary voltage when the primary is activated – highlighted by the red vertical line in fig 5.6a. We then see up to 800ns of finite, sinusoidal rise time during which comparatively little voltage variation is observed across the primary. It is imperative for us to rationalise this behaviour, since sparking is observed only when the output attains a threshold voltage – see fig 5.6b – at which point the spark plug is discharged. It is interesting to observe that this threshold is highly variable, occurring at 4±1kV – we see sparking in 5.6b at 3.7kV but no sparking in 5.6a despite higher output voltages. This variation is too large to be simply attributed to 5% daily changes in atmospheric pressure, and must reflect more complex discharge physics within the spark plates.
Fortunately during the first 700ns after the input pulse - of most interest in our quest to minimise secondary voltage rise time - the primary voltage changes little (fig 5.6a). In this approximation a ~-60V step function is applied to the primary and passes onto the secondary coil undistorted. Careful inspection of our non-ideal transformer equivalent circuit (fig 5.1) indicates that the inductances associated with the secondary windings, Ls, experience this step voltage increase in a situation analogous to closing the switch in fig 5.7.

21
At the instant voltage V'o appears across the secondary windings Vo is zero – though there is voltage across the primary none is observed because we are probing across an empty winding capacitance. As the situation to evolves (i.e. we close the switch), current begins to flow onto the winding capacitance Cw which gradually acquires charge Q(t) and hence voltage V(t) = Q(t)/Cw. Applying Kirchhoff once again we see: Ls(dI/dt) - Q(t)/Cw = 0 Since the current I = dQ/dt this expression may be written, Ls (d2Q/dt2) - Q(t)/Cw = 0 which has a simple sinusoidal solution Q(t) α sin(ωt) α V(t), with a characteristic frequency ω = (L2Cw)-1/2 and thus time period, T = 2π/ω, of
T = 2π(LsCw)1/2 {4}
This highly simplified analysis goes far to rationalising the sinusoidal output voltage rise time observed in fig 5.6. The LC model’s prediction of zero amplitude secondary voltage at the instant of voltage appearing across the primary, followed by sinusoidal oscillation is consistent with the behaviour observed during the rise time of our system. Furthermore, the model provides several powerful predictions which will aid us in reducing the 800ns rise time to below 500ns. Firstly, we observe that expression {4} suggests that the period of our oscillation should be independent of pulse amplitude. We therefore expect a pulse of double the amplitude of that shown in fig 5.6b to reach sparking threshold voltages in half the time – reducing the rise time to 350ns which is within the our 500ns budget. Optimising the Rise time
After encouraging preliminary work indicating that the 700ns rise time observed in fig 5.6a is indeed independent of peak output voltage in the range <5kV (limited by the voltage rating of our probe) it was decided to double the input voltage from the -68V to -136V and observe the spark formation time. At these primary voltages the secondary could leap to well in excess of the 5kV which we can safely probe, and so we will observe sparking using a magnetically coupled probe. Due to the variability of the sparking threshold voltage discussed above, we will observe the system for 1000 pulses at 1Hz (i.e. ~17mins continuous operation), collecting a statistical distribution of sparking delay times. The variability in spark times is observed to be of order 100ns and so we will bin the delay times in 10ns intervals. An example of the oscilloscope traces across primary and secondary circuits is shown below (fig 5.8) along with the histogram illustrating the observed distribution of spark delay times across 1000 sparks.
V'o Cw
Fig 5.7 Simplest equivalent circuit for the transformer output.
Ls
22
386ns
200ns 1.8V
Input Pulse from signal generator
Inductive Probe
i
n p h a
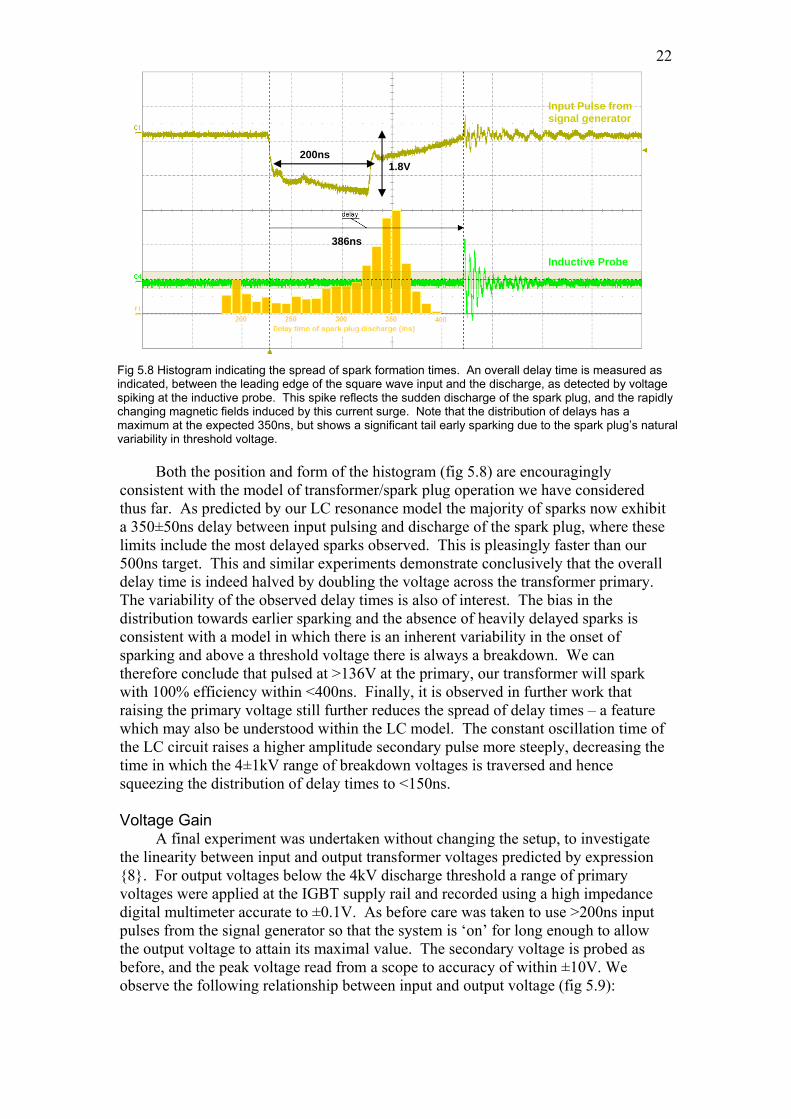
F g 5.8 Histogram indicating the spread of spark formation times. An overall delay time is measured as i dicated, between the leading edge of the square wave input and the discharge, as detected by voltage s iking at the inductive probe. This spike reflects the sudden discharge of the spark plug, and the rapidly c anging magnetic fields induced by this current surge. Note that the distribution of delays has a maximum at the expected 350ns, but shows a significant tail early sparking due to the spark plug’s natural v riability in threshold voltage.
Both the position and form of the histogram (fig 5.8) are encouragingly consistent with the model of transformer/spark plug operation we have considered thus far. As predicted by our LC resonance model the majority of sparks now exhibit a 350±50ns delay between input pulsing and discharge of the spark plug, where these limits include the most delayed sparks observed. This is pleasingly faster than our 500ns target. This and similar experiments demonstrate conclusively that the overall delay time is indeed halved by doubling the voltage across the transformer primary. The variability of the observed delay times is also of interest. The bias in the distribution towards earlier sparking and the absence of heavily delayed sparks is consistent with a model in which there is an inherent variability in the onset of sparking and above a threshold voltage there is always a breakdown. We can therefore conclude that pulsed at >136V at the primary, our transformer will spark with 100% efficiency within <400ns. Finally, it is observed in further work that raising the primary voltage still further reduces the spread of delay times – a feature which may also be understood within the LC model. The constant oscillation time of the LC circuit raises a higher amplitude secondary pulse more steeply, decreasing the time in which the 4±1kV range of breakdown voltages is traversed and hence squeezing the distribution of delay times to <150ns. Voltage Gain
A final experiment was undertaken without changing the setup, to investigate the linearity between input and output transformer voltages predicted by expression {8}. For output voltages below the 4kV discharge threshold a range of primary voltages were applied at the IGBT supply rail and recorded using a high impedance digital multimeter accurate to ±0.1V. As before care was taken to use >200ns input pulses from the signal generator so that the system is ‘on’ for long enough to allow the output voltage to attain its maximal value. The secondary voltage is probed as before, and the peak voltage read from a scope to accuracy of within ±10V. We observe the following relationship between input and output voltage (fig 5.9):

23
Fig 5.9 Relationship between input and output voltages across our non-ideal transfomer
y = 53.0x - 150
0
500
1000
1500
2000
2500
3000
3500
4000
4500
0 10 20 30 40 50 60 70 80 90
Vi, Max. input volage (/V)
Vo, M
ax. o
utpu
t vol
tage
(/V)
This striking tight linear relationship is consistent with all eight tested voltages
to within experimental uncertainties (which are of the same scale as the data points). Let us recall expression {8} with which the non-ideal transformer output is theoretically related to its input voltage:
Vo = Vi(N2/N1) + A(t) {8}
In probing Vi and Vo at a constant delay time – at their maximal values – we fix
the constant term A(t) and so we observe a linear relationship between the two as suggested by {8}. Furthermore, we expect the gradient of this plot to reflect the turns ratio with which our transformer was constructed. Somewhat surprisingly, the N2 = 373 secondary and N1 = 8 turns recorded during the winding process returns a lower value of (N2/N1) = 46.6. Since the coil winding machine is assumed to count the number of secondary turns to within ±1turn and the non-ideal transformer model suggests that only the turns ratio can affect the gradient of fig 5.9 this discrepancy is traced to the primary windings. In threading the stiff primary wire out of the coil former it is certainly possible that one of the end turns has become significantly uncoiled. Losing a single primary turn in this way introduces a ±7 uncertainty into the turns ratio which becomes (N2/N1) = 46.6±7 - now consistent with the much more tightly constrained value of 53 determined experimentally by the gradient of fig 5.9.
The non-ideality of our transformer is imaged in fig 5.9 by its -150V offset. For an ideal transformer the non-ideality factor A(t) is zero, and an input vs output voltage plot would pass through the origin, as we would intuitively expect. This -150V can be treated using expression {7} but this more detailed analysis exceeds the scope of this report. Let us content ourselves with the ‘rule of thumb’ observation that our transformer will deliver peak output voltages of 150V short of that predicted for an ideal transformer of the same turns ratio. Considering the operational 4kV maximum output voltage during sparking, this 4% effect is pleasingly small.

24
6. THE SPARK GAP
Thus far our pulsing circuit now discharges a spark plug within a characteristic time of <350ns. This spark will be used to discharge a prefabricated spark gap (recall fig 3.2) which will eventually raise the ~8kV across plates in a spark chamber. It is suggested in the literature that the break down time of such a triggered spark gap is ~20ns [4] and we therefore aim to discharge our spark gap within <400ns. The following sequence of experiments will assess whether we can achieve such delay times. Crucially, we will investigate the range of voltages that the spark gap can defend in steady state, as this limits the maximum potential difference that can ultimately be delivered to our spark chamber plates. Though the theory of spark formation in a gaseous medium is fascinating and of clear importance to the wider goal of constructing a successful spark chamber, it is complex and falls beyond the scope of this report. The following experiments will therefore be analysed only qualitatively, but their empirical results have profound implications for the operation of our triggering system. a. Experimental Setup
Introduced in Section 3, the spark gap performs the same high voltage switching function as the IGBT, with the benefit of increased speed and higher breakdown voltages. Our ‘home-made’ device is shown below (fig 6.1) along with the relevant circuit diagram for this sequence of experiments. It is constructed such that the anode/cathode separation distance d can be adjusted over a ~4mm range, to allow a range of different voltages to be defended by a variable air gap.
~12cm d
~10cm
Adjustable Anode Pin
Grounded Plate
Triggering Electrode
Probe point
Input from Transformer
~ +6kV
Fig 6.1 An annotated image of our rudimentary spark gap and the circuit constructed to assess its performance. Note that the anode/ground plate distance d can be adjusted by up to 4mm in the current design, though a full 1cm range is possible with a different anode pin. A 1:1000 potential divider, highlighted in blue, is used to probe the circuit at safe voltages.
Output to Spark Chamber
25
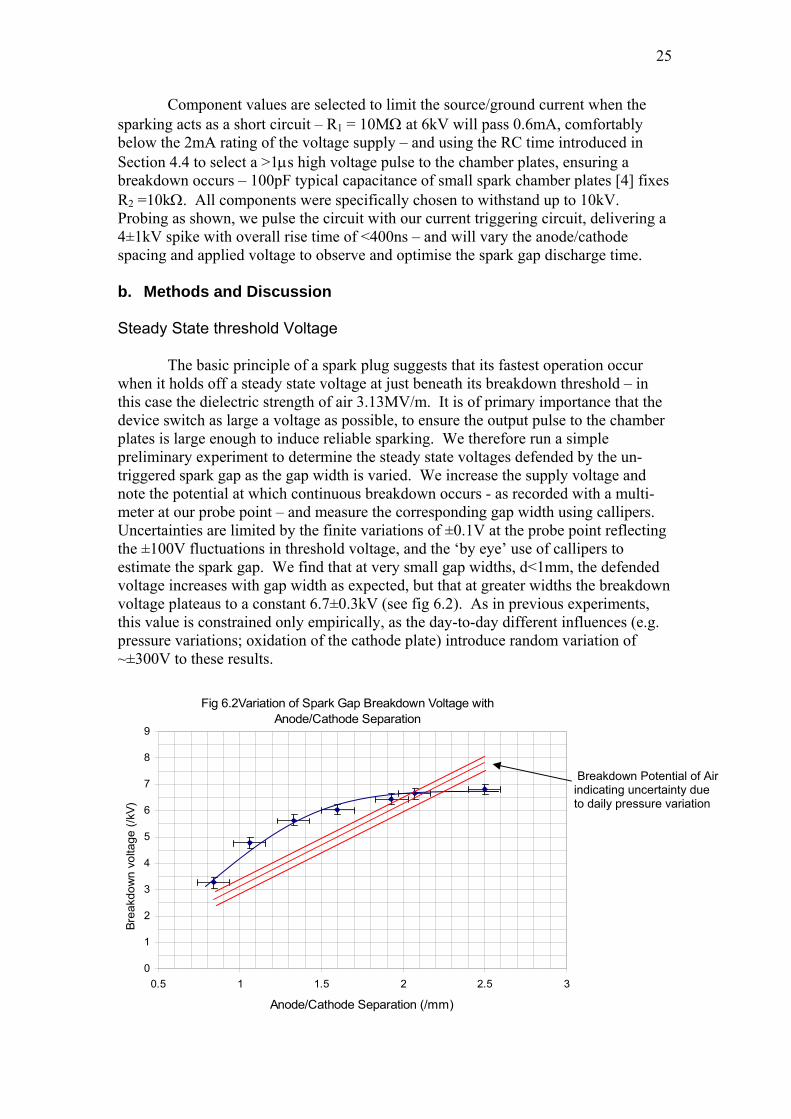
Component values are selected to limit the source/ground current when the sparking acts as a short circuit – R1 = 10MΩ at 6kV will pass 0.6mA, comfortably below the 2mA rating of the voltage supply – and using the RC time introduced in Section 4.4 to select a >1μs high voltage pulse to the chamber plates, ensuring a breakdown occurs – 100pF typical capacitance of small spark chamber plates [4] fixes R2 =10kΩ. All components were specifically chosen to withstand up to 10kV. Probing as shown, we pulse the circuit with our current triggering circuit, delivering a 4±1kV spike with overall rise time of <400ns – and will vary the anode/cathode spacing and applied voltage to observe and optimise the spark gap discharge time. b. Methods and Discussion Steady State threshold Voltage The basic principle of a spark plug suggests that its fastest operation occur when it holds off a steady state voltage at just beneath its breakdown threshold – in this case the dielectric strength of air 3.13MV/m. It is of primary importance that the device switch as large a voltage as possible, to ensure the output pulse to the chamber plates is large enough to induce reliable sparking. We therefore run a simple preliminary experiment to determine the steady state voltages defended by the un-triggered spark gap as the gap width is varied. We increase the supply voltage and note the potential at which continuous breakdown occurs - as recorded with a multi-meter at our probe point – and measure the corresponding gap width using callipers. Uncertainties are limited by the finite variations of ±0.1V at the probe point reflecting the ±100V fluctuations in threshold voltage, and the ‘by eye’ use of callipers to estimate the spark gap. We find that at very small gap widths, d<1mm, the defended voltage increases with gap width as expected, but that at greater widths the breakdown voltage plateaus to a constant 6.7±0.3kV (see fig 6.2). As in previous experiments, this value is constrained only empirically, as the day-to-day different influences (e.g. pressure variations; oxidation of the cathode plate) introduce random variation of ~±300V to these results.
Fig 6.2Variation of Spark Gap Breakdown Voltage with Anode/Cathode Separation
0
1
2
3
4
5
6
7
8
9
0.5 1 1.5 2 2.5 3
Anode/Cathode Separation (/mm)
Breakdown Potential of Air indicating uncertainty due to daily pressure variation
e (/k
V)ag
wn
volt
kdo
Brea

26
The increasing breakdown potential of air between two smooth parallel plates – 3.13±0.3V/m – is included alongside the observed variation of breakdown potential of air with electrode separation. Although our threshold voltages exceed this theoretical limit by up to 1kV this is attributed to the curved geometry of our electrodes (see fig 6.1) and surface effects. Similarly the observed breakdown threshold falls beneath the parallel plate value as the gap width is increased – as the electrodes become less like plates and more like discrete points. Without further analysis at this stage let us exploit the form of this breakdown curve and select a gap width of 2mm for further delay time experiments, as it is at this point represents the ideal compromise between high threshold voltage – we require as large voltages as possible to be switched to the spark chamber – and narrow electrode separation – which we expect to favour faster switching times. Delay time Using an identical experimental arrangement (fig 6.1) but now imaging at the probe point with an oscilloscope and selecting a constant 2mm gap width, the supply voltage was decreased from the threshold voltage for continuous breakdown - 6.7±0.3V – until no spark developed. Delay times were recorded at the scope as illustrated below (fig 6.3):
Fig 6.3 Recording the spark formation time by probing the spark gap electronics. The 200ns, 1.8V input pulse is shown in gold, and the 1000x attenuated supply voltage to the spark gap in blue. The 4V collapse after 680ns therefore reflects the shorting of the ~4kV voltage as the spark gap discharges. The initial rise and 320ns decay at the spark plug reflects magnetic coupling of the system to the transformer flux, and its discharge when the spark plug discharges. The physical appearance of the discharge is inset – note that the spark jumps the gap at its narrowest point.
320ns
640ns ~4V
Spark gap discharge
Spark plug discharge
Let us briefly consider the form of behaviour observed across the spark plug in fig 6.3, noting that it is this signal that will also be output to the spark chamber. In this example only a modest 4kV is dropped across the output, but the overall rise time, although not yet within our 500ns target, is nonetheless a pleasing 640ns. At such rise times we might expect to see 85% efficient sparking [1] if we can ultimately apply 8kV to our chamber. Also encouraging is the observed spark plug decay within 350ns as expected for our optimised pulsing circuit (see fig 5.8).

27
Let us look now at how this decay time reacts as we vary the supply voltage to the spark gap (fig 6.4). As before, the natural variation in delay times at any given voltage is accounted for by observing 1000 sparks and taking the delay time around which the distribution peaks. The <±500ns half-width of the majority of these distributions (e.g. fig. 5.8) is a negligible source of uncertainty compared to the ±0.1kV fluctuations observed at our potential divider and probe.
Fig 6.4 Decreasing Spark Formation Time with Increasing Supply Voltage
0
5
10
15
20
25
30
35
40
45
50
4 4.5 5 5.5 6 6.5 7
Supply voltage across the spark gap (/kV)
Spa
rk fo
rmat
ion
time
(/μs
)
The elegant trend of fig 6.4 linking increasing spark gap voltage with shorter formation times hints at some of the detail of the spark formation process that I am sadly unable to enter into here1. However, several immediate features provide useful direction for further refinement of our completed pulsing circuit. Firstly, there is a smooth transition in the overall spark formation times across several orders of magnitude that is perhaps surprising given the relatively minor changes in supply voltages – between the threshold for spark formation at ~4.4kV and continuous breakdown at ~6.7kV indicated by red lines in fig 6.4. This range of spark formation times from 500ns to 50μs perhaps reflects the exponential multiplicative process by which high electric fields generate the free ion cascades which seed the conductive pathway along which discharge occurs (see [18]). The practical implications of the strong dependence of formation times on supply voltage are twofold. Firstly our assumption that the fastest switching times will occur when the system is held almost at its breakdown voltage (here 6.7kV) is emphatically vindicated. Secondly, the fastest overall delay time achieved in this experiment is 580±100ns where the 100ns is the approximate half width of the observed distribution of sparking times. Ultimately therefore, we find our complete system to be within striking distance of the 500ns overall rise time which is suggested to produce 100% efficient sparking in a small spark chamber [1] [2]. 1. See [17] for a general introduction and [18] for a more practical summary for drift chambers.

28
5. CONCLUSIONS
Not only have we successfully assembled an operation pulsing circuit for our demonstration spark chamber, but with a range of experiments we have produced the following set of interesting and useful results. We have seen how initial pulsing of the circuit with a square wave of >2V is sufficient to activate the IGBT within <80ns (fig 4.6b). Furthermore, a general appreciation of the operation of a BJT suggests that this overall rise time may be reduced to as low as 50ns if the collector resistance is decreased (fig 4.3 R2, R3 and R6) and/or the 13.5V primary voltage supply raised to increase the current switched by the device. We have shown in Section 5 that operation of the IGBT at >136V from the secondary supply and applying 2V, >200ns input pulses, is sufficient to ensure 100% efficient spark plug discharge within 350ns (fig 5.8). Further increasing this voltage is found to reduce this time further, though it is recommended to operate below 180V as this is the specification to which the transformer has been fabricated (Section 5).
Components across the circuit are seen to obey several key physical theories.
Relaxation rates are associated with recharging/discharging capacitances around the circuit – whether dedicated components or parasitic capacitances e.g. the high input capacitance of the IGBT imaged experimentally in fig 4.8b. This theory is usefully applied to identify the limiting 55.7±2ms charge time of the IGBT circuit’s 680nF capacitor (fig 4.9) responsible for the observed ~10Hz maximum repetition rate of our complete system. The largest single source of delay in our circuit is identified as the transformer rise time, which can be understood in terms of LC charge oscillation (Section 5.4). This theory is exploited to reduce overall spark plug discharge times to <400ns. Finally, the non-ideal transformer modelled discussed in Section 5.1 not only rationalises the tight linear relationship between input and output voltage (fig 5.9) but indicates that, at operational voltages, our transformer delivers output voltages only 4% shy of ideal values – reflecting the care taken during construction.
Finally, pulsing our ‘home-made’ spark gap with the complete circuit suggests
that our electronics can currently achieve overall delay times of 580ns with a distribution of ±100ns (fig 6.4) and a switched voltage of 6.7kV (fig 6.2). Ultimately this result is highly encouraging – when coupled to the ~100ns delay introduced by the coincidence circuit, we may ultimately achieve overall delay between cosmic ray detection and high voltage pulsing of the chamber plates of <600ns, for which [1] suggests a small chamber with deliver 85% efficient sparking. Furthermore, over the course of these investigations several areas have been highlighted where further fine tuning could reduce this delay time still further – the rise time of the BJT and the spark gap threshold voltage. It is the latter consideration which is of greatest concern as this report closes – we find (fig 6.2) that our spark gap can currently defend only <6.7kV. This falls short of the >8kV with which small spark chambers are traditionally pulsed e.g. [1], [19] and further work will be required to assess the implications of this limit for our system.

29
Electronics charging the spark gap anode plate
IGBT amplifier electronics (Section 4)
Spark Plug Transformer (Section 5)
Spark Gap (Section 6)
Fig 7.1 The complete pulsing system. Note its portable size – the field of view is ~30cm by ~50cm. In fact, the voltage supplies are by far the chunkiest aspect of the current design.
Ultimately however, we have constructed a fully functional triggering device
to connect our existing particle detector to a spark chamber, still to be fabricated. The circuit is durable, and although not yet portable (see fig 7.1) it is compact enough to envisage easy attachment to a table-top spark chamber. In conclusion, not only has this project broadened my understanding of the electronics of the spark chamber, it has provided a taste of the visual excitement of a spark chamber in the successful triggering of our spark gap - I look forward to the completed chamber.

30
5. REFERENCES [1] D. Meyer, K. Terwilliger, A 14x14x7 Inch Thin Plate Spark Chamber, Review of Scientific Instruments, March 1961 [2] P. Rice-Evans, Spark and Streamer Chambers, Journal of Scientific Instruments, 1969 Vol 2 [3] M. Goodrick, B. Hommels, Cavendish Laboratory, Cambridge University, Private correspondence [4] J. W. Cronin, Spark Chambers, Palmer Physical Laboratory, Princeton University, 1967 [5] See http://www.behlke.de/separations/separation_c5.htm for a selection of solid state fast switching devices [6] See http://uk.farnell.com/ for a selection of commercially available electronic components [7] For an overview of the NIKHEF chamber see http://eppog.web.cern.ch/eppog/Resources/SparkChamber.html [8] Grupen, Particle Detectors, Cambridge University Press, 1996 [9] P. Horowitz, W. Hill, The Art of Electronics, Cambridge University Press, 1980 [10] J. Dodge, J. Hess, IGBT Tutorial, Advanced Power Technology, July 2002 [11] Mohan, Undeland, Robbins, Power Electronics, John Wiley & Sons, 1989 [12] Zetex Semiconductors, ZTX750 Datasheet [13] Fairchild Semiconductor, HGTG12N60A4D Datasheet [14] M. de Podesta, Understanding the Properties of Matter, UCL Press, 1996 [15] Ing. C. Brouwer, Private correspondence, EHEP Nijmegen, Netherlands [17] A.Fridman, Plasma Chemistry, Cambridge University Press, 2008 [18] F. Sauli, Principles of Operation of Multi-wire Proportional and Drift Chambers, CERN Academic Training Programme 1975-76 [19] W.A. Wenzel, Spark Chambers, Annual review of Nuclear and Particle Sciences, 1964