Constructing Phylogenetic Trees - Calvin College |...
37
Constructing Phylogenetic Trees Gloria Rendon SC’11 - Education June, 2011
Transcript of Constructing Phylogenetic Trees - Calvin College |...

Constructing Phylogenetic Trees
Gloria RendonSC’11 - Education
June, 2011
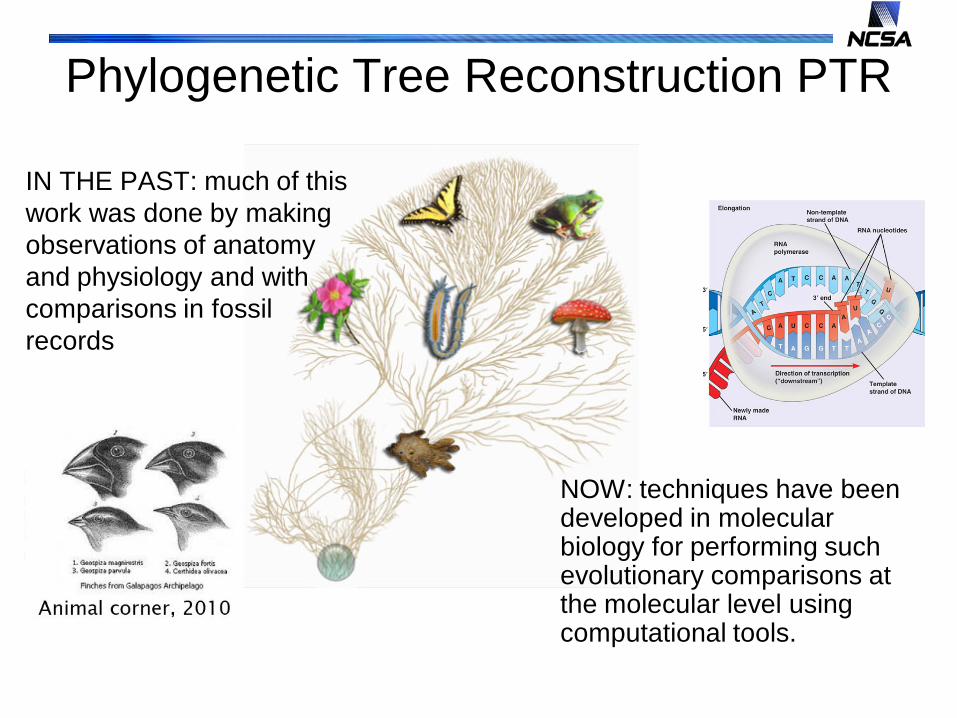
IN THE PAST: much of this work was done by making observations of anatomy and physiology and with comparisons in fossil records
NOW: techniques have been developed in molecular biology for performing such evolutionary comparisons at the molecular level using computational tools.
Phylogenetic Tree Reconstruction PTR

Phylogenetic Tree Reconstruction is an (Inference) Problem
• Given – n species– m characters– For each species, the values for all characters is known
• Goal: a fully labeled phylogenetic tree that ‘best’ explains the given data (i.e. maximize a target function (score))
• Assumptions:– Characters are mutually independent– After two species diverged, their further evolution is independent of each
other
• Solution: exhaustive search of the tree space to find the best possible solution is unfeasible. Heuristic approach to finding an approximate solution that is close enough to the best solution.

Desired Properties of the data used in (Species) Phylogenetic Tree Reconstruction
An ideal choice is a genomic region that:
• appears exactly once in every species• has evolutionary history “identical” to that of the species• exhibits a rate of change that is both fast enough to
distinguish between closely related species and slow enough so that they resemble each other on any pair of distantly related species
• Small ribosomal subunit rRNA, called 16s ribosomal RNA in prokaryotes and 18s ribosomal RNA in eukaryotes, has been found to be the best genomic segment for this type of analysis.

Many Possible PhylotreesThe number of possible rooted phylogenetic trees that can be constructed with n sequences grows exponentially.
(2n)!/n!*(n+1)!
Where n is the number of nodes (internal and leaf nodes)
For example, with five sequences and four internal nodes (so n=9); we have 4,862 possibilities; 98 of which are structurally different, seven of them are illustrated here.
Many Possible Phylotrees
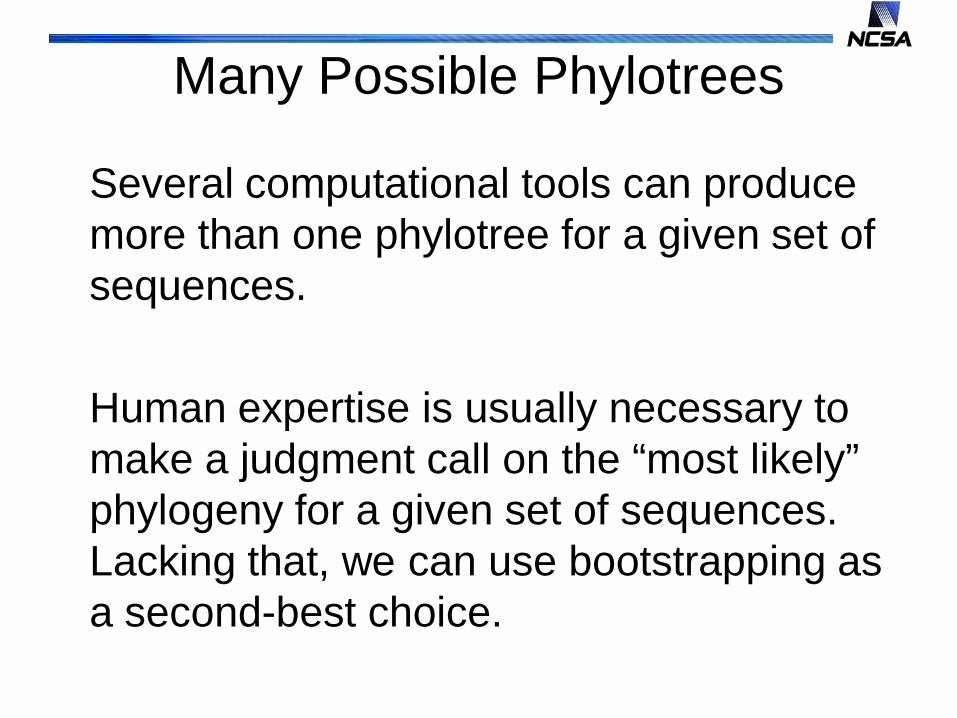
Several computational tools can produce more than one phylotree for a given set of sequences.
Human expertise is usually necessary to make a judgment call on the “most likely” phylogeny for a given set of sequences. Lacking that, we can use bootstrapping as a second-best choice.

Is the phylotree correct?
Bootstrapping techniques have been developed to test if not the correctness at least the reliability of the phylogeny calculated by a program
Bootstrap quantifies the degree of support within the data for a particular branch given the evolutionary model and tree reconstruction method

Basic Procedure for building biological trees:ONE TWIG AT A TIME
1.Start with any TWO sequences and add the rest of the sequences one at a time.
2. Each new sequence becomes a leaf of the tree (meaning, nothing further can be attached to this point).
3. Use a particular model of evolution and method to choose the place where the new sequence ought to go, It should be closer to the sequence in the tree that it is most similar to than to any other sequence already in the tree.
4. Repeat steps 2 and 3 until all sequences have been inserted into the tree
5. Stop

Choice of a PTR Method• Two broad categories exist: distance-based methods
and sequence-based methods
• Distance-based methods first compute pairwise distances from the sequences and then use those distances to calculate the phylotree
• Sequence-based methods use the MSA of all the sequences and search for the best tree according to optimality criterion defined by a model

Properties of the PRT Methods
Method Type of method
Tree type Single tree?
Tree score?
Tree test?
UPGMA distance ultrametric Yes No No
Neighbor joining distance additive Yes No No
Fitch-Margolish distance additive Yes No No
Minimum evolution distance additive No Yes Yes
Maximum parsimony sequence additive No Yes Yes
Maximum likelihood sequence additive No Yes Yes
Bayesian sequence additive No Yes Yes

Choice of a Model of EvolutionModel Base
compositionR=1? Identical
transition rates?
Identical transversion
rates?
Reference
JC 1:1:1:1 No Yes Yes Jukes and Cantor (1969)
F81 Variable No Yes Yes Felsenstein(1981)
K2P 1:1:1:1 Yes Yes Yes Kimura(1980)
HKY85 Variable Yes No No Hasegawa et al.(1985)
TN Variable Yes No Yes Tamura and Nei(1993)
K3P Variable Yes No Yes Kimura(1981)
SYM 1:1:1:1 Yes No No Zharkikh(1994)
GTR Variable Yes No No Rodriguez et al.(1990)

Which Model to Use?

Illustrating the procedure manually with a toy example
1.Start with any TWO sequences and add the rest of the sequences one at a time.
2. Each new sequence becomes a leaf of the tree (meaning, nothing further can be attached to this point).
3. Use a particular model of evolution and method to choose the place where the new sequence ought to go, It should be closer to the sequence in the tree that it is most similar to than to any other sequence already in the tree.
4. Repeat steps 2 and 3 until all sequences have been inserted into the tree
5. Stop
Illustrating the procedure manually with a toy example
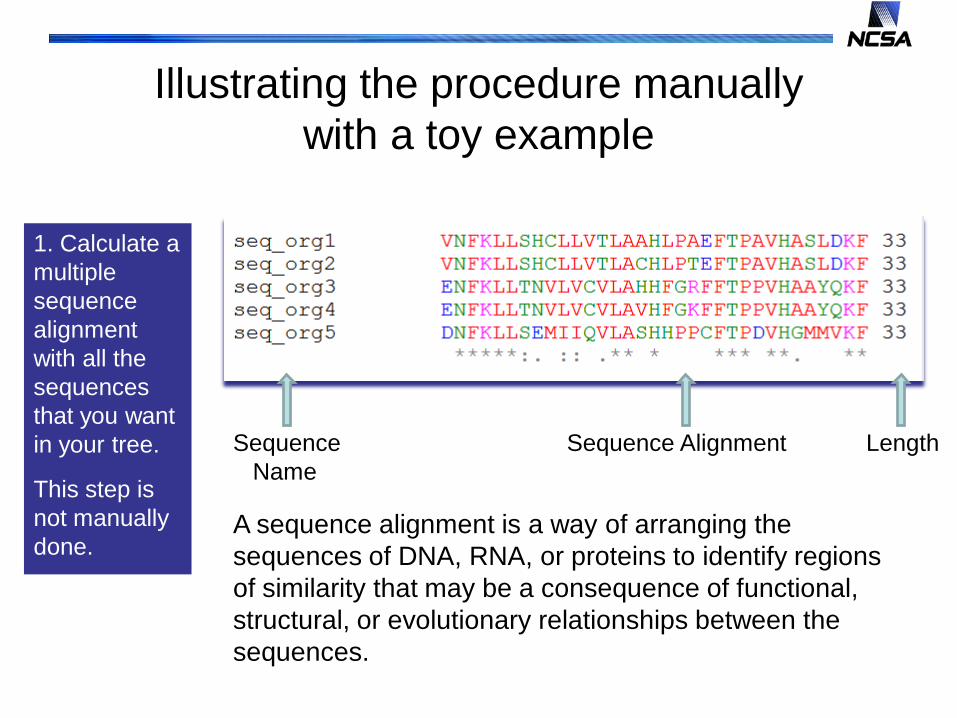
1. Calculate a multiple sequence alignment with all the sequences that you want in your tree.
This step is not manually done.
Sequence Sequence Alignment LengthName
A sequence alignment is a way of arranging the sequences of DNA, RNA, or proteins to identify regions of similarity that may be a consequence of functional, structural, or evolutionary relationships between the sequences.
Illustrating the procedure manually with a toy example
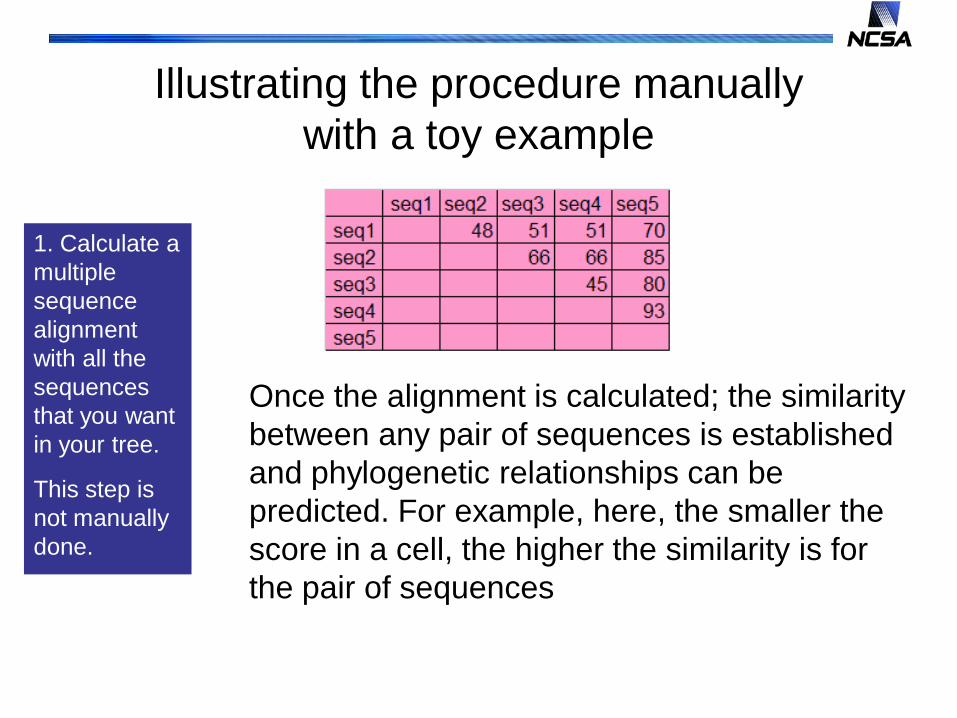
1. Calculate a multiple sequence alignment with all the sequences that you want in your tree.
This step is not manually done.
Once the alignment is calculated; the similarity between any pair of sequences is establishedand phylogenetic relationships can be predicted. For example, here, the smaller the score in a cell, the higher the similarity is for the pair of sequences

For this toy example we start with the alignment results
start with 2 sequences,
for instance
seq3 and seq4
add seq1…
If next to seq3, consider Score(seq1,seq3)=51
If next to seq4, consider Score(seq1,seq4)=51
So seq1 goes in another branch
add seq2…
If next to seq1, consider Score(seq2,seq1)=48
If next to seq3, considerScore(seq2,seq3)=66
…
So seq2 goes in seq1’s branch
add seq5…
If next to seq1, consider Score(seq5,seq1)=70
If next to seq2, considerScore(seq5,seq2)=85
…
So, seq5 goes in another branch

Using tools to reconstruct a Phylogenetic Tree

Example2: Phylogeny of Proteobacteria
• 16s ribosomal RNA sequences from 38 species in these families: alphaproteobacteria, betaproteobacteria, gammaproteobacteria, deltaproteobacteria, and epsilonproteobacteria
• Tree 1: generated using ML and GTR• Tree 2: generated using ML• Tree 3: generated using UPGMA and JR correction,
removing gaps• Tree 4: generated using UPGMA and JR correction,
no gaps were removed• Tree 5: condense Tree 3 obtained by a bootstrap
analysis; branches with bootstrap value below 75% have been contracted

Tree1: Delta and Epsilon branched off early from the rest of the family
Tree2: Gamma and Beta branched off early from the rest of the family

Trees 3 and 4 calculated with UPGMA, a distance-based method, have the branching off of Epsilon happening earlier than in Trees 1 and 2, which were calculated using maximum likelihood.

As a result of bootstrapping, we may end up with a non-binary tree like in this case.

Where are the Phylogeny Tools in the Mobyle Web Server?

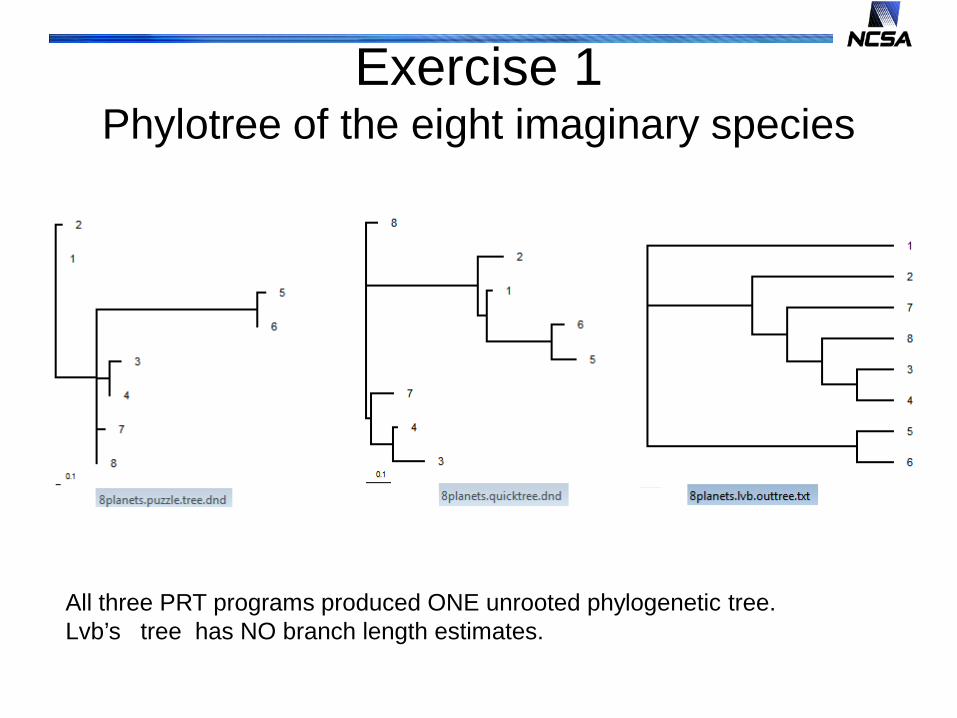
Exercise 1Phylotree of the eight imaginary species
We are going to revisit the example we used in the previous lesson.
Up until this point, we have aligned the sequences of the eight imaginary species of the solar system with a multiple sequence alignment tool: ClustalW.
Let us go back to the results of ClustalW for the set containing the sequences of the eight imaginary species and use those results to reconstruct a likely phylogeny of the species.
Since it is possible to end up with different phylotrees; we are going to actually tweak the parameters of the tool and see what phylotree it produces each time.
In real life we would need to be guided by the expert opinion of a taxonomist as to which tree is the most likely phylogeny for the species.

Exercise 1Phylotree of the eight imaginary species
•Open the browser again and go back to the results of ClustalW for the set containing the sequences of the eight imaginary species
•Click on the pull-down menu next to the button ‘further analysis located in the alignment frame
•Select PUZZLE from the pull down menu first;
•Then click on ‘further analysis’
[the alignment is loaded into the input frame of the puzzle tool]
Note: PUZZLE is a phylogenetic tool that uses ML and NJ; suitable for large trees.

Exercise 1Phylotree of the eight imaginary species
[the alignment is loaded into the input frame of the puzzle tool]
How can you check?
The name of the current tool should read “Tree-Puzzle ..”
The frame for alignment file should contain the result that ClustalW produced.
Leave all the other parameters unchanged with their default values and click on RUN

Exercise 1Phylotree of the eight imaginary species
The output page of PUZZLE consists of several frames as indicated in this figure with numbers 1-4.
1. Is the output file with everything
2. Is the output tree in Newick format
3. Is the output distance file
4. Is the standard output report.
We are just interested in the tree.
Click on ‘view with archaeopteryx’ to see the tree in graphical form

Exercise 1Phylotree of the eight imaginary species
Close the window that shows the tree.
Now, we are going to repeat the same steps changing only the parameters of the PUZZLE tool
Go back to the ClustalW results page and start all over.
When you get to the puzzle page; scroll down to the “Quartet puzzling options” and change AT LEAST the value of the last entry that reads
Display as outgroup? N
N should be a number [1-8]; the default value is 1
Then press RUN and check the tree

Exercise 1Phylotree of the eight imaginary species
Now, let’s try lvb, a phylogeny tool that uses parsimony to calculate trees from dna sequences.
Go back to the ClustalW results page and start all over.
From the pull-down menu close to the further analysis button; choose lvb.
Then click on ‘further analysis’
[wait for the results to get loaded onto the input box of the lvb page]
Then press RUN and check the tree.

Exercise 1Phylotree of the eight imaginary species
Now, let’s try quicktree, a phylogeny tool that uses least-squre distances to calculate trees.
Go back to the ClustalW results page and start all over.
From the pull-down menu close to the further analysis button; choose quicktree.
Then click on ‘further analysis’
[wait for the results to get loaded onto the input box of the quicktree page]
Then press RUN and check the tree.
Exercise 1Phylotree of the eight imaginary species
All three PRT programs produced ONE unrooted phylogenetic tree.Lvb’s tree has NO branch length estimates.

Exercise 2: Produce the phylogeny of the three kingdom of Carl Woese
The first kingdom, Eukaryotes, is made up of sequences 1-3
The second kingdom, bacteria, is made up of sequences 4-9
The third kingdom, Archaea, is made up of sequences 10-13
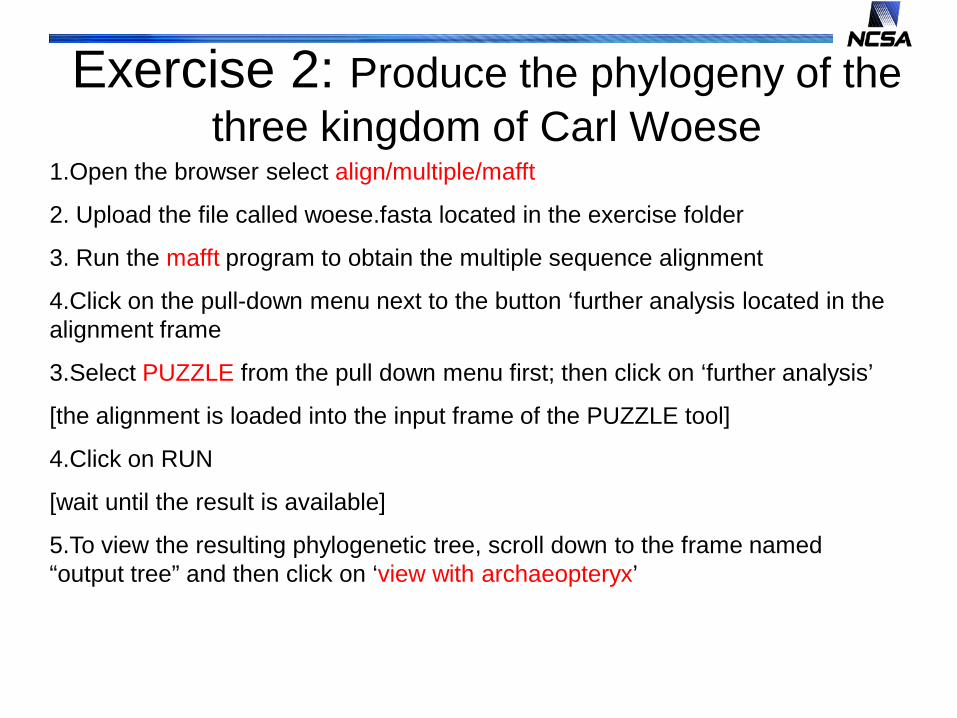
Exercise 2: Produce the phylogeny of the three kingdom of Carl Woese
1.Open the browser select align/multiple/mafft
2. Upload the file called woese.fasta located in the exercise folder
3. Run the mafft program to obtain the multiple sequence alignment
4.Click on the pull-down menu next to the button ‘further analysis located in the alignment frame
3.Select PUZZLE from the pull down menu first; then click on ‘further analysis’
[the alignment is loaded into the input frame of the PUZZLE tool]
4.Click on RUN
[wait until the result is available]
5.To view the resulting phylogenetic tree, scroll down to the frame named “output tree” and then click on ‘view with archaeopteryx’

Exercise 2: Produce the phylogeny of the three kingdom of Carl Woese
6. Repeat steps 3-5 using lvb instead of PUZZLE to obtain a tree using parsimony
7. Repeat steps 3-5 using Quicktree instead of PUZZLE to obtain a tree using distances.
8. Compare the trees
Q:The dataset contains a sequence that proves to be a ‘challenge’ for computational PTR tools, which sequence is that?
Q:Are the trees identical? If not, which tree seems to be more accurate?

Exercise 2: Produce the phylogeny of the three kingdom of Carl Woese

Exercise 3: Produce the phylogeny of the Eukaryotic species
1.Open the browser select align/multiple/mafft
2. Upload the file called 18s.rRNA.seqs.fasta located in the exercise folder
3. Run the mafft program to obtain the multiple sequence alignment
4.Click on the pull-down menu next to the button ‘further analysis located in the alignment frame
3.Select PUZZLE from the pull down menu first; then click on ‘further analysis’
[the alignment is loaded into the input frame of the PUZZLE tool]
4.Click on RUN
[wait until the result is available]
5.To view the resulting phylogenetic tree, scroll down to the frame named “output tree” and then click on ‘view with archaeopteryx’

Additional Readings•Enumerating binary trees: http://www.durangobill.com/BinTrees.html
•Nei, M. and Kumar, S. Molecular evolution and phylogenetics. Oxford University Press. 2000. Chapter 5
•Bodoroski, M and Ekisheva, S. Problems and solutions in biological sequence analysis. Cambridge University Press, 2006. Chapter 7
•Gusfield, D. Algorithms on strings, trees, and sequences: computer science and computational biology. Cambridge University Press, 1997. Chapter 17
•Pevsner, J. Bioinformatics and functional genomics. Hoboken, N.J. : Wiley-Blackwell, 2009. pp 215-278.
•Tateno, Y, M. Nei, AND F. Tajima. Accuracy of estimated phylogenetic trees from molecular data. J Mol Evol. 1982;18(6):387-404