Constructing 3D Geological Model for Tertiary Reservoir in ...
22
No.27- (6) 2020 Journal of Petroleum Research & Studies (JPRS) E54 Constructing 3D Geological Model for Tertiary Reservoir in Khabaz Oil Field by using Petrel software. Yousif N. Abdul Majeed * , Dr. Ahmad A. Ramadhan * , Dr. Ahmed J. Mahmood ** * Univ. of Technology/ Pet. Dept. Tech., ** Al-Farabi Univ. college/Pet. Eng. Dep. Corresponding Author E-mail: [email protected] Abstract: A 3D Geological model for tertiary reservoir in khabaz oil field had been constructed by using petrel software. Seven wells have been selected in this study in order to design Petrophysical properties (porosity, water saturation, and permeability). Structural model can be clarified tertiary reservoir in term of geological structures is a symmetrical small anticline fold with four faults. Tertiary reservoir consist of six units are (Jeribe, UnitA, UnitA', UnitB, UnitBE, and UnitE). According to Petrophysical properties, layering had been constructed for each tertiary units. Petrophysical model has been designed using the sequential Gaussian simulation algorithm as a geostatistical method. The results illustrates that Unit B and Unit BE have the best petrophysical properties and the big amount of oil. Keywords: Tertiary reservoir, 3D geological model, Khabaz oil field, Petrophysical properties. ﺑﻨﺎء ﻣﻮﺩﻳﻞ ﺍﻟﺠﻴﻮﻟﻮﺟﻲ ﺛﻼﺛﻲ ﺍﻻﺑﻌﺎﺩ ﻟﻠﻤﻜﻤﻦ ﺍﻟﺜﻼﺛﻲ ﻓﻲ ﺣﻘﻞ ﺧﺒﺎﺯ ﺍﻟﻨﻔﻄﻲ، ﺷﻤﺎﻝ ﺍﻟﻌﺮﺍﻕ ﺑﻮﺍﺳﻄﺔ ﺑﺮﻧﺎﻣﺞ ﺑﺘﺮﺍﻝ ﺍﻟﺤﺎﺳﻮﺑﻲ ﺍﻟﺨﻼﺻﺔ: ﺗﻀﻤﻦ ﻫﺬﺍ ﺍﻟﺒﺤﺚ ﺑﻨﺎء ﻣﻮﺩﻳﻞ ﺟﻴﻮﻟﻮﺟﻲ ﺛﻼﺛﻲ ﺍﻻﺑﻌﺎﺩ ﻟﻠﻤﻜﻤﻦ ﺍﻟﺜﻼﺛﻲ ﻓﻲ ﺣﻘﻞ ﺧﺒﺎﺯ ﺍﻟﻨﻔﻄﻲ ﺍﻟﺬﻱ ﺗﻢ ﺑﻨﺎﺅﻩ ﺑﻮﺍﺳﻄﻪ ﺑﺮﻧﺎﻣﺞ ﺑﺘﺮﺍﻝ ﺍﻟﺤﺎﺳﻮﺑﻲ . ﺗﻢ ﺍﺧﺘﻴﺎﺭ ﺳﺒﻌﺔ ﺍﺑﺎﺭ ﻟﻬﺬﺓ ﺍﻟﺪ ﺭﺍ ﺳﺔ ﻻﻧﺸﺎء ﻣﻮﺩﻳﻞ ﺍﻟﺘﺮﻛﻴﺒﻲ ﻭﺍﻟﺒﺘﺮﻭﻓﻴﺮﻳﺎﺋﻲﻣﺴﺎﻣﻴﺔ) ، ﺗﺸﺒﻊ ﺍﻟﻤﺎﺋﻲ، . ﻳﻮﺿﺢ ﺍﻟﻤﻮﺩﻳﻞ ﺍﻟﺘﺮﻛﻴﺒﻲ ﺑﺄﻥ ﺍﻟﻤﻜﻤﻦ ﺍﻟﺜﻼﺛﻲ ﻓﻲ ﻣﺼﻄﻠﺢ ﺍﻟﺠﻴﻮﻟﻮﺟﻲ ﻫﻮ ﻁﻴﺔ( ﺍﻟﻨﻔﺎﺫﻳﺔ ﻣﺤﺪﺑﺔ ﺻﻐﻴﺮﺓ ﻣﺘﻤﺎﺛﻠﺔ ﺍﻟﺸﻜﻞ ﻣﻊ ﺍﺭﺑﻌﺔ ﻓﻮﺍﻟﻖ ﻭﺍﺿﺤﺔ ﻓﻲ ﺍﻟﺘﻜﻮﻳﻦ. ﺍﻟﻤﻜﻤﻦ ﺍﻟﺜﻼﺛﻲ ﻳﺘﻜﻮﻥ ﻣﻦ ﺳﺘﺔ ﻭﺣﺪﺍﺕ ﻣﻜﻤﻨﻴﺔ
Transcript of Constructing 3D Geological Model for Tertiary Reservoir in ...

No.27- (6) 2020 Journal of Petroleum Research & Studies (JPRS)
E54
Constructing 3D Geological Model for Tertiary Reservoir in Khabaz Oil
Field by using Petrel software.
Yousif N. Abdul Majeed*, Dr. Ahmad A. Ramadhan*, Dr. Ahmed J. Mahmood** *Univ. of Technology/ Pet. Dept. Tech., **Al-Farabi Univ. college/Pet. Eng. Dep.
Corresponding Author E-mail: [email protected]
Abstract:
A 3D Geological model for tertiary reservoir in khabaz oil field had been constructed by
using petrel software. Seven wells have been selected in this study in order to design
Petrophysical properties (porosity, water saturation, and permeability). Structural model
can be clarified tertiary reservoir in term of geological structures is a symmetrical small
anticline fold with four faults. Tertiary reservoir consist of six units are (Jeribe, UnitA,
UnitA', UnitB, UnitBE, and UnitE). According to Petrophysical properties, layering had
been constructed for each tertiary units. Petrophysical model has been designed using the
sequential Gaussian simulation algorithm as a geostatistical method. The results illustrates
that Unit B and Unit BE have the best petrophysical properties and the big amount of oil.
Keywords: Tertiary reservoir, 3D geological model, Khabaz oil field, Petrophysical
properties.
شمال العراق بواسطة برنامج بترال ،بناء موديل الجيولوجي ثلاثي الابعاد للمكمن الثلاثي في حقل خباز النفطي
الحاسوبي
الخلاصة:
الثلاثي في حقل خباز النفطي الذي تم بناؤه تضمن هذا البحث بناء موديل جيولوجي ثلاثي الابعاد للمكمن
سة لانشاء موديل التركيبي والبتروفيريائي را. تم اختيار سبعة ابار لهذة الدبواسطه برنامج بترال الحاسوبي
النفاذية ). يوضح الموديل التركيبي بأن المكمن الثلاثي في مصطلح الجيولوجي هو طية ، تشبع المائي ، (مسامية
متماثلة الشكل مع اربعة فوالق واضحة في التكوين. المكمن الثلاثي يتكون من ستة وحدات مكمنية محدبة صغيرة

No.27- (6) 2020 Journal of Petroleum Research & Studies (JPRS)
E55
). بالاعتماد على موديل البتروفيزيائي تم بناء Eووحدة BEوحدة ،B وحدة، 'Aوحدة ،Aوحدة ،هي (جريبي
واسطة احد طرق عدد من طبقات ضمن كل وحدات المكمن الثلاثي. الموديل بتروفيزيائي تم تصميمه ب
وحدةالذي تم بناؤه تبين ان لبعد تحليل ومناقشة نتائج المودي الجيواحصائية وهي الدوال المحاكاة اللوغارتمية.
B ،ةوحدBE رة من نفط الخام في هذة تمتلك افضل الخواص البتروفيزيائية وهذا يعطي دليل لوجود كميات كبي
الوحدات.
.والخواص البتروفيزيائية ،حقل خباز النفطي ،موديل جيولوجي ثلاثي الابعاد ،الثلاثي المكمن الكلمات الرئيسية:
Introduction:
In most of operations field, 3D geological model means to get best description for reservoir
properties and quantities subsurface through information related to reservoir characteristics.
Through description reservoir properties needed to understanding and covering most of
geological features pertain to porosity, permeability, water saturation, types of rocks and
barrels (faults and folds) and then knowledge some limitations of subsurface data in order
to calculate distribution these features [1].
In general, the geological model includes four mainly stages: structure modeling,
stratigraphic modeling, Petrophysical modeling and lithological modelling. The
applications and technique are more complicated. Quantifying and improving hydrocarbon
bearing zones needed to more accuracy at import data obtained and high resolution for
geological model for reservoir Constructing 3D Petrophysical model for tertiary reservoir
in khabaz field. Usually, the basic data can be used in 3D geological model in terms of
sources, type of data, scales and more stages to clarify conduct of geologic modeling [2].
Area of study:
khabaz oil field is represent one of more importantly north Iraqi oil fields having many pay
zones contain great amount of oil and gas, which is located North West (NW) of Kirkuk
city and (12 km) far away from center of Kirkuk city. It's encircled by three oil fields Bai
Hassan from North West and Baba dome exist in Kirkuk field from north east and Jumbour
field from South east. Structurally represents a single symmetrical and anticline dome at
subsurface consist of about (18 km) length and about (4 km) width. Approximately (42
wells) were penetrated Khabaz oil field, although these wells were targeted to tertiary

No.27- (6) 2020 Journal of Petroleum Research & Studies (JPRS)
E56
reservoir more than half of wells were penetrated (cretaceous age), and a smaller number of
wells were reached Shu'aiba formation. Actually, seven wells (Kz-1, Kz-2, Kz-3, Kz-4, Kz-
9, Kz-14, Kz-15) used for this study in Khabaz oil field as shown in Figure (1). Generally,
the section direction from North West to south east and denoted by A (NW) – B (SE). First
well for Khabaz oil field (Kz-1) was drilled in 1976 [3].
Fig. (1) Location map of khabaz oil field.
Methodology:
Petrel 2007 software has been employed for constructing 3D geological model for tertiary
reservoir. There are many steps beginning as necessary data for constructing this type of
model .These data are:
1- Well heads: - consist of position of each wells of khabaz field especially northern,
eastern and Kelly bushing (RTKB)
2- Well tops: - clarified all reservoir zones or formations in Khabaz field and measured
depth for each wells.
3- Well logs: - Includes reservoir properties (PHI, K, Sw, and facies) and CPI value which
is obtained from IP (Interactive petrophycics V. 3.5), then imported to petrel.

No.27- (6) 2020 Journal of Petroleum Research & Studies (JPRS)
E57
Finally, a number of works have been done by volumetric method. Other reservoir data
related to Khabaz field are provided from reports such as (final well reports (FWR), final
geological reports (FGR), and core data analysis reports). The methodology is illustrated in
the flow work diagram in Figure (2).
Fig. (2) The 3D geological model by Petrel software in work flow diagram.
Start
Data processed
End
Import data in to petrel software
Well heads Well Tops Well logs Contour map
Make Boundary
Make surface for units
3D grid model
Stratigraphic modeling
Structural modeling
Property modeling
Make fluid contacts
Well correlation Simple
grid model
Make horizons
Make zones
Make layers
Scale up well logs
Petrophysical modeling
PHI modeling
K modeling
NTG modeling
SW modeling
Volume calculations
Run simulation

No.27- (6) 2020 Journal of Petroleum Research & Studies (JPRS)
E58
Import Data:
There are various types of available data which introduced as input data. This data consists
of well logs, cores and fluid analysis, which is prepared in folder or for each data folder are
organized and imported files by petrel software for constructing 3D-geological modelling
in khabaz field. Different types of data are briefly explained as the following:
1. Well Heads
Represent one of necessary data for geo-modelling and well head that is obtained for seven
wells in khabaz field to show position of wells, Total Measured Depth (TMD) along path
for all wells, name of wells and their symbol.
2. Well Tops
Well tops are considering noticeable points along well path with several geological units.
Normally well tops are essential for structure model in order to construct contour map for
all units for tertiary reservoir.
3. Structure Contour Map
Contour map can be generated from the surface and correlated borehole. Structural map for
geologic units in tertiary reservoirs are constructed depending on well tops as well as top of
Jeribe formation was obtained from 2D-seismic data.
4. Well Logs Data and Core Data
Well log attached to all wells of khabaz oil field to provide Petrophysical properties for
reservoir rocks such as porosity, permeability, water saturation, and thickness of formation.
Core data includes core porosity and core permeability. A various type of input data for the
petrel software is explained below.
Well Correlation:
Basically regards good correlation of well log data. Most of important step in the 3D
geological model in petrel software. Well correlation can be used to classify and arrange
well logs data as 2D simple visualization. Generally, to make comparison between new

No.27- (6) 2020 Journal of Petroleum Research & Studies (JPRS)
E59
wells which bring up to well section and wells which already correlated. Well correlation
has been performed in this study to show changes in thickness and changes in reservoir
properties for various geological units of Tertiary reservoir [4].
There are two cross sections in Figures 3and 4 explained thickness of tertiary units and
changes of Petrophysical properties along reservoir units of tertiary reservoir. Figure (3)
represents vertical section includes (Kz-4, Kz-14, and Kz-3) and Figure (4) represents
horizontal section consist of (Kz-15, Kz-1, and Kz-2). As it can be seen from Figures (3
and 4) each wells involved by gamma ray (GR), porosity, water saturation (Sw),
permeability and net to gross. Well tops have been selected and Jeribe represent as top for
each units of tertiary. Through correlation between wells presented unit (B) represent high
thickness in well (Kz-3) as compared with other units and have good Petrophysical
properties. So considered interest zone at tertiary reservoir. Thickness of units (A, A', BE,
E) is increase at south east more than units at North West along vertical section.

No.27- (6) 2020 Journal of Petroleum Research & Studies (JPRS)
E60
Fig. (3) Vertical section for (Kz-3), (Kz-4), and (Kz-14).

No.27- (6) 2020 Journal of Petroleum Research & Studies (JPRS)
E61
Fig. (4) Horizontal section for (Kz-1), (Kz-2), and (Kz-15).

No.27- (6) 2020 Journal of Petroleum Research & Studies (JPRS)
E62
Structural Model:
Structural modeling can be used to introduce and clarify special geologic properties inside
the geo-model, which is normally consisted of fault model, and geologic constructions.
Obtaining best structure model for reservoir has considered more complex for petroleum
engineer due to unorganized input data and more geometrical obstructions [5].
Structural modeling was subdivided in to three operations: fault model, pillar gridding and
layering zones. All these steps were applied are after other from single value of data to
structure 3D grids [6].
Six structures contour maps for (Jeribe, unit A, unit A', unit B, unit BE, and unit E) have
been constructed includes tertiary reservoir in khabaz oil field which represented as 3D
structures contour map in Figure (5).
Fig. (5) 3D structures contour maps for tertiary reservoir units in khabaz oil field.

No.27- (6) 2020 Journal of Petroleum Research & Studies (JPRS)
E63
Fault Model:
Fault modelling is representing most essential process in structural model. Faults made
includes vertical, inverse, and curved fault. The system of faults contains truncated fault (Y
fault), series fault, conjugate fault, crossing fault, stair case fault, etc. The fault plane is a
plane between top of surface and base surface and base surface of intersection lines. These
lines are display as three dimensions in order to generate 3D fault in the structure model
[7].
There are four faults which made geometrically and structurally in khabaz oil field
represent with layers as three dimensional in Figure (6).
Fig. (6) 3D structure fault model for tertiary reservoir.
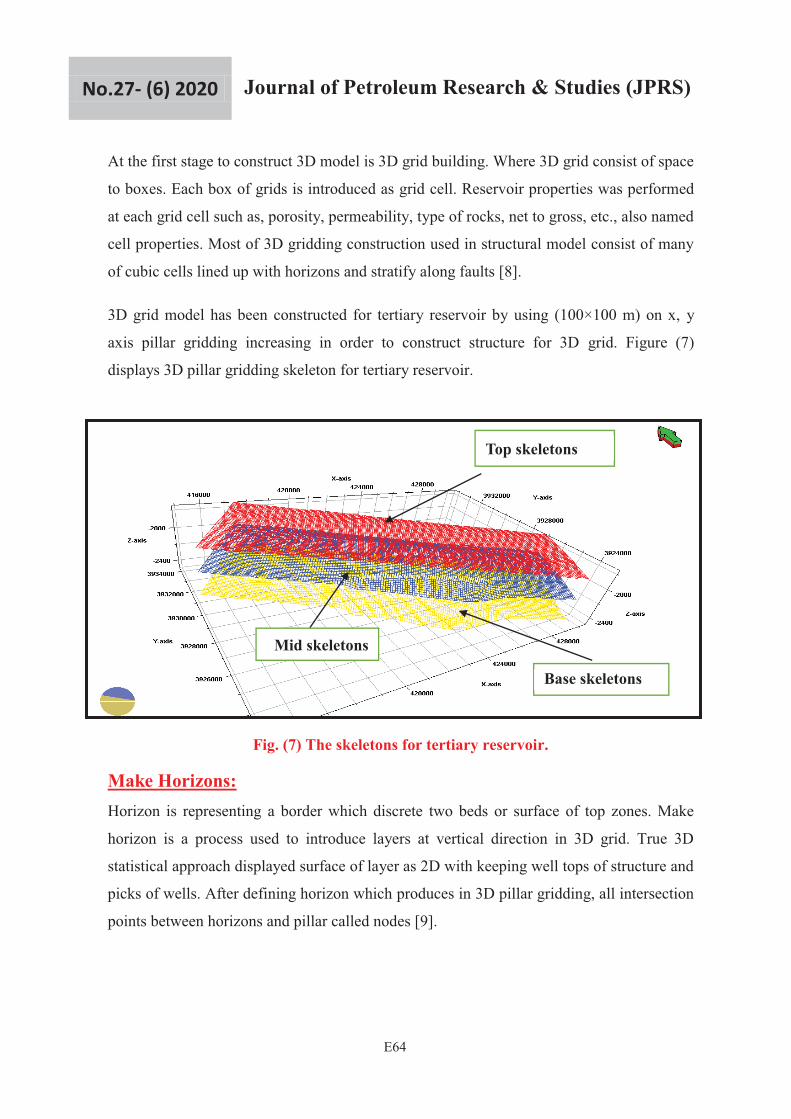
Pillar Gridding:
Pillar gridding is the operation which applied to generate skeleton framework are known as
surface for (x, y, and z) locations to create a 3D structure. The skeleton is represent grid
divided to top, mid, and base skeleton grids. These skeletons were connected to the points
clarified faults.
No.27- (6) 2020 Journal of Petroleum Research & Studies (JPRS)
E64
Top skeletons
Mid skeletons
Base skeletons
At the first stage to construct 3D model is 3D grid building. Where 3D grid consist of space
to boxes. Each box of grids is introduced as grid cell. Reservoir properties was performed
at each grid cell such as, porosity, permeability, type of rocks, net to gross, etc., also named
cell properties. Most of 3D gridding construction used in structural model consist of many
of cubic cells lined up with horizons and stratify along faults [8].
3D grid model has been constructed for tertiary reservoir by using (100×100 m) on x, y
axis pillar gridding increasing in order to construct structure for 3D grid. Figure (7)
displays 3D pillar gridding skeleton for tertiary reservoir.
Fig. (7) The skeletons for tertiary reservoir.
Make Horizons: Horizon is representing a border which discrete two beds or surface of top zones. Make
horizon is a process used to introduce layers at vertical direction in 3D grid. True 3D
statistical approach displayed surface of layer as 2D with keeping well tops of structure and
picks of wells. After defining horizon which produces in 3D pillar gridding, all intersection
points between horizons and pillar called nodes [9].

No.27- (6) 2020 Journal of Petroleum Research & Studies (JPRS)
E65
Layering:
The 3D grid cell has several vertical layers as main horizon in to the pillar gridding.
Reservoir properties were defined for each units, permeability, porosity, etc. These
properties are considered essential for fluid flow calculation and IOIP estimation. Make
horizon and layering operation represent final two steps can be used to introduce the
decision of vertical direction in 3D grid depending on number or thickness of cell layers.
The top and base of geological units can be identified in grid cell and well top which
required to be represented in section of well [10].
Table (1) Number of layers and average thickness for each zones of tertiary reservoir.
Tertiary units in khabaz oil field have been divided to many layers depending on reservoir
properties and how much hydrocarbon content in the units. Best geological unit divided
more than once as compared other units due to have good Petrophysical properties as
tabulated in Table (1).
The Scale up of Well Log:
Scale up of well log is a process average values of well log in grid cell by using statistical
approaches. Each cell 3D grid is penetrated by number of wells. Each cell has unity value
for each Petrophysical properties. Where results of final 3D grid are only specified value
grid cells through its penetration. The well log can be used in Petrophysical modeling after
this operation is scaled up. When reservoir properties are modeled by dividing area which
modeled to 3D grid. Grid cells are normally much bigger than density of samples taken
from logs. Before any modeling operation depends on well log should be scaled up for well
log to provide definition 3D grids that is called blocking of well logs [11].
Zones No. of layers Average thickness (m) Jeribe 4 14.85 Unit A 6 15.35 Unit A' 8 21.75 Unit B 25 68.87
Unit BE 15 44.78 Unit E 4 56.28

No.27- (6) 2020 Journal of Petroleum Research & Studies (JPRS)
E66
There are a lot of statistical techniques used to scale up well log such as harmonic,
arithmetic average and geometric methods. Average Petrophysical such as porosity, and
water saturation value is scaled up by arithmetic average, while permeability is scaled by
geometric method. Figure 8 shows ( , Sw, and K) used for scaling up Kz-3.
Quality Control:
Quality control is considered a sensitive and necessary process after up scaling process for
well logs in order to visualize tertiary units. This process depends on layering which
specifies thickness of layers. If thickness of layers is very small may be too much data will
be lost. Therefore, it is necessary to make some adjustments for thickness of layers.
Histogram clarify properties are up scaling with original log data [12]. Figures (9, 10, and
11) show histogram for porosity, water saturation and permeability.

No.27- (6) 2020 Journal of Petroleum Research & Studies (JPRS)
E67
Fig. (8) Scale up for (Kz-3) in tertiary reservoir.

No.27- (6) 2020 Journal of Petroleum Research & Studies (JPRS)
E68
Fig. (9) Quality histogram for PHI in well (Kz-3).
Fig. (10) Quality histogram for Sw in well (Kz-3)
Fig. (11) Quality histogram for K in well (Kz-3).

No.27- (6) 2020 Journal of Petroleum Research & Studies (JPRS)
E69
Petrophysical Modelling:
The Petrophysical modelling is a distribution reservoir properties in 3D grids cell at static
model. Petrophysical model was constructed by Sequential Gaussian Simulation Algorithm
(SGS) was performed as statistical method to agree with magnitude data available
[13].These properties are consist of:
Porosity Model:
Porosity model was constructed based on porosity logs (density, neutron and sonic) logs
have been corrected to 3D grid cells. One of famous method in geo-statistics which is used
as statistical method to construct porosity model is (SGS). Histogram window has been
applied to recognize Petrophysical properties of original log data and up scaling log data in
order to check accuracy of the final 3D porosity model. Figure (12) shows 3D
representation of porosity model for tertiary reservoir.
Fig. (12) 3D porosity model for khabaz field.
Permeability Model:
FZI method has been used to estimate permeability in cored well by well log records.
Permeability model has been constructed by geo-statistical technique which is used as
statistical method is (SGS) to get best permeability distribution in geological model.

No.27- (6) 2020 Journal of Petroleum Research & Studies (JPRS)
E70
Histogram window has been applied to recognize physical properties of original log data
and up scaling log data in order to check accuracy of the final 3D porosity model. Figure
(13) shows 3D presentation of permeability model for tertiary reservoir.
Water Saturation Model:
After up scaling well logs for water saturation, water saturation model has been constructed
for tertiary units in khabaz oil field. Geo-statistical method is the same that used in porosity
model (SGS) and in Sw model. Histogram window has been applied to recognize
Petrophysical properties of original log data and up scaling log data in order to check the
accuracy of water saturation model. Figure (14) shows 3D representation water saturation
model for khabaz field.
Fig. (13) 3D permeability model for khabaz field.

No.27- (6) 2020 Journal of Petroleum Research & Studies (JPRS)
E71
Fig. (14) 3D water saturation model for khabaz field.
: Net to Gross Modeling
Net pay is extremely essential parameter in the reservoir characteristics due to the
clarification of the penetrated geologic section which contains rich hydrocarbon content
and best reservoir quality to apply for producing intervals in the reservoir. Net pay
illustrates facilities reservoir simulation because non- reservoir rocks does not take into
consideration. Net pay zone can be assessed by using cutoff applications on Petrophysical
well logs. Cutoff has specific value for formation parameters and producing zones is not
considered[14]. Figure (15) represents 3D net to gross (NTG) model for tertiary reservoir.

No.27- (6) 2020 Journal of Petroleum Research & Studies (JPRS)
E72
Fig. (15) 3D Net to gross for tertiary reservoir.
Results and Discussions
Depending on reservoir characterization, tertiary reservoir is divided into different reservoir
units. These are (Jeribe, Unit A, Unit A', Unit B, Unit BE, and Unit E). These Units are
characterized by Petrophysical properties (porosity, water saturation, and permeability).
1. Jeribe and Unit A are located at top of tertiary reservoir in khabaz oil field, characterized
by lowest porosity rate about (3%) and lowest rate of hydrocarbon content except in some
region in zone, where rate of permeability in Jeribe formation is too low nearly (0.1 md)
and Unit A rate pf permeability predicated about (2md).
2. Unit A' is second unit of tertiary reservoir after (Jeribe and Unit A). This unit
characterized with good rate of porosity about (5.3%) and permeability rate about (1md).
This Unit has less amount of hydrocarbon with big amount of water saturation range
between (40-65) percent.
3. Unit B has best Petrophysical properties and consider an active unit include tertiary
units, having high rate porosity about (20-26)% and this rate increased toward crest , high
permeability rate estimated about (24md) , also rate of water saturation in this rate about
(10-24)%. So, it represents an active zone.
4. Unit BE is second active zone includes tertiary reservoir units, consider porous and
permeable zone about (9.5-18) % especially top region of this unit and (10-20) md.

No.27- (6) 2020 Journal of Petroleum Research & Studies (JPRS)
E73
Hydrocarbon content concentrated at upper part of this unit with water saturation estimated
(20-40) %.
5. Unit E is represented worst Petrophysical properties and consider water zone, where rate
of water saturation estimated 100%. Also rate of permeability less than (0.1 md).
Conclusions:
1. Depending on structure model which constructed by petrel, Tertiary reservoir in khabaz
oil field clarify a symmetrical small anticline fold with four faults.
2. Layering were constructed for each zone of tertiary reservoir according to reservoir
characterization. Jeribe (4 layers), Unit A (6 layers), Unit A' (8 layers), Unit B (25 layers),
Unit BE (15 layers), and Unit E (4 layers).
3. Unit B and Unit BE are regarded an active zone which have best Petrophysical
properties (sw, phi, and k) and contain big amounts of hydrocarbon.
No.27- (6) 2020 Journal of Petroleum Research & Studies (JPRS)
E74
References:
1. J. D. Doyle and M. L. Sweet, "Three-Dimensional Distribution of Lithofacies, Bounding
Surfaces, Porosity, and Permeability in a Fluvial Sandstone-Gypsy", Sandstone of
Northern Oklahoma, AAPG Bulletin, V. 79, No.2, pp.(70–96), (1995).
2. W.H. Ferti, "Open hole Cross plot Concepts-A Powerful Technique in Well Log
Analysis", pp. (535-498), (1981).
3. Minstry of Oil, “Geological and Petrophysical study for Tertiary reservoir and Shiranish
formation in Bai-Hassan”. Kirkuk: unpulished study.pp.(6-18), (1985).
4. Schlumberger Workshop, "Structural Modeling in Petrel", London, (2010).
5. Schlumberger, “Petrel Manual and applications”, (2008).
6. 6. Z. O. Opafunso, " 3D Formation Evaluation of an Oil Field in the Niger Delta Area of
Nigeria Using Schlumberger Petrel Workflow Tool", Med well Journals. pp.(1651-1660),
(2007).
7. S. Mei., " Digital Mapping and 3D Visualization/Modeling of Subsurface Geology Using
ArcGIS 9.2 and Well Log Data", Energy Resources Conservation Board, ERCB/AGS,
pp. (43- 136), (1984).
8. Jean-Claude Dulac, " Advances Improve Reservoir Modeling", American Oil and Gas
Reporter, (2008).
9. Morten Bendiksen, "Rapid Modeling of Geology", master’s degree Thesis, (2013).
10. Mubarak Matlak Al-Hajeri, "Basin and Petroleum System Modeling, Oilfield", Review
Schlumberger, pp. (14-29), (2009).
11. Denns Denney, "Scaling Up a 900-Million-Cell Static Model to a Dynamic Model", JPT,
pp. (82-85), (2013).
12. K. Bora, A. carrillat, S. sharma, C. Jordan, R. schatzinger, B.L. lohar, K. Muraliharam, S.
K. Patel, R. Bhanja, A. suha, and T. friedel, "Understanding complex fluid contact
distribution in a Brown carbonate field – Mumbai", AAPG, search and discovery #90118,
(2011).
13. Schlumberger, "Petrel Introduction Course", (2007).
14. Paul F. Worthington, "Net pay: what is it? What does it do? How do we quantify it‘?
How do we use it?”, Gaffney, SPE, paper ID,123561-PA, (2009).

No.27- (6) 2020 Journal of Petroleum Research & Studies (JPRS)
E75
List of Symbols:
NW: North West.
FWR: Final well reports.
FGR: Final geological reports.
TMD: Total measured depth.
SGS: Sequential Gaussian simulation algorithm.
FZI: flow zone indicator.
NTG: Net to gross.
IOIP: Initial oil in place.
Kz: Khabaz oil field.