Constitutive response of welded HSLA 100 steelmeyersgroup.ucsd.edu/papers/journals/Meyers...
14
Constitutive response of welded HSLA 100 steel Q. Xue a , D. Benson a , M.A. Meyers a , V.F. Nesterenko a , E.A. Olevsky b, * a Department of Mechanical and Aerospace Engineering, University of California, San Diego, CA 92093-0411, USA b Department of Mechanical Engineering, College of Engineering, San Diego State University, 5500 Campanile Drive, San Diego, CA 92182-1323, USA Received 5 August 2002; received in revised form 12 December 2002 Abstract The dynamic mechanical behavior of a welded joint of high-strength, low alloy (HSLA) 100 steel was investigated by both quasi- static (103 s 1 ) and high strain rate (103 s 1 ) tension loadings at ambient and low temperatures. The constitutive responses for the microstructurally different weld and base steels, along with the interface, which included the heat-affected zone (HAZ), were analyzed and compared. This response is successfully modeled by the mechanical threshold stress (MTS) constitutive equation for different regions of the welded joint, which shows qualitatively different behavior. The necking and failure occurred uniformly within the weld metal but not in the HAZ. The main mechanism for the failure of the welded joints is void growth. Microstructural characterization revealed that the nucleation of voids occurred mainly at the interface between the base and the weld metal, and initiated at inclusions. Measurements of damage distributions across HAZ were made to evaluate the contribution of porosity variation to the constitutive response. In both the quasi-static and dynamic tests, the deformation localization in the form of necking first appeared in the weld metal. Fractographic observation demonstrates that void evolution is a dominant factor in the macroscopic mechanical response. The Gurson /Tvergaard model was included in the modeling effort to incorporate the effect of void opening on the mechanical response as well as tensile instability. The MTS constitutive model was successfully implemented to the tensile regime of loading. # 2003 Elsevier Science B.V. All rights reserved. Keywords: Welding; Constitutive behavior; Failure mechanism 1. Introduction and objectives High-strength, low alloy (HSLA) steels have been widely used in the construction of buildings, pipelines and ships [1 /5]. The principal advantages of these materials are not only their good combination of strength and toughness, but also their good weldability. Therefore, the HSLA steel is suitable for applications in large-scale welded steel structures. Such structures, e.g. submarine hulls (or other naval vessels), may be subjected to dynamic loading from impact or explosion. Failure initiation is frequently found in the heat-affected and welded zones [6], and is principally caused by tensile stresses. HSLA 100 is a special structural steel in the HSLA family, with composition providing a yield stress of up to 100 ksi (690 MPa). Its good weldability and lack of preheat requirement provide a great convenience for the construction of large-scale structures, and significantly reduce the processing costs. A considerable number of investigations on the properties of HSLA steels and their welding have been carried out in the past 30 years [7,8]. The main concern in these studies is the quasi- static mechanical response, fracture behavior and the metallurgical properties and characteristics of welded joints [9,10]. However, very limited results can be found on the mechanical response of welded joints under dynamic loading. Among these results, the main method to evaluate dynamic properties of a weldment is the pre- cracked Charpy V-notch impact test. Logsdon [11] and Hahn and Kanninen [12] investigated the weldment integrity of structural steels using this method. They evaluated the dynamic fracture behavior through the measurement and analysis of dynamic fracture tough- ness. Rajanna et al. [13] carried out a series of Charpy tests to examine the fracture toughness for the base, * Corresponding author. Tel.: /1-619-594-6329; fax: /1-619-594- 3599. E-mail address: olev[email protected] (E.A. Olevsky). Materials Science and Engineering A354 (2003) 166 /179 www.elsevier.com/locate/msea 0921-5093/03/$ - see front matter # 2003 Elsevier Science B.V. All rights reserved. doi:10.1016/S0921-5093(03)00007-8
Transcript of Constitutive response of welded HSLA 100 steelmeyersgroup.ucsd.edu/papers/journals/Meyers...

Constitutive response of welded HSLA 100 steel
Q. Xue a, D. Benson a, M.A. Meyers a, V.F. Nesterenko a, E.A. Olevsky b,*a Department of Mechanical and Aerospace Engineering, University of California, San Diego, CA 92093-0411, USA
b Department of Mechanical Engineering, College of Engineering, San Diego State University, 5500 Campanile Drive, San Diego, CA 92182-1323, USA
Received 5 August 2002; received in revised form 12 December 2002
Abstract
The dynamic mechanical behavior of a welded joint of high-strength, low alloy (HSLA) 100 steel was investigated by both quasi-
static (103 s�1) and high strain rate (103 s�1) tension loadings at ambient and low temperatures. The constitutive responses for the
microstructurally different weld and base steels, along with the interface, which included the heat-affected zone (HAZ), were
analyzed and compared. This response is successfully modeled by the mechanical threshold stress (MTS) constitutive equation for
different regions of the welded joint, which shows qualitatively different behavior. The necking and failure occurred uniformly
within the weld metal but not in the HAZ. The main mechanism for the failure of the welded joints is void growth. Microstructural
characterization revealed that the nucleation of voids occurred mainly at the interface between the base and the weld metal, and
initiated at inclusions. Measurements of damage distributions across HAZ were made to evaluate the contribution of porosity
variation to the constitutive response. In both the quasi-static and dynamic tests, the deformation localization in the form of necking
first appeared in the weld metal. Fractographic observation demonstrates that void evolution is a dominant factor in the
macroscopic mechanical response. The Gurson�/Tvergaard model was included in the modeling effort to incorporate the effect of
void opening on the mechanical response as well as tensile instability. The MTS constitutive model was successfully implemented to
the tensile regime of loading.
# 2003 Elsevier Science B.V. All rights reserved.
Keywords: Welding; Constitutive behavior; Failure mechanism
1. Introduction and objectives
High-strength, low alloy (HSLA) steels have been
widely used in the construction of buildings, pipelines
and ships [1�/5]. The principal advantages of these
materials are not only their good combination of
strength and toughness, but also their good weldability.
Therefore, the HSLA steel is suitable for applications in
large-scale welded steel structures. Such structures, e.g.
submarine hulls (or other naval vessels), may be
subjected to dynamic loading from impact or explosion.
Failure initiation is frequently found in the heat-affected
and welded zones [6], and is principally caused by tensile
stresses.
HSLA 100 is a special structural steel in the HSLA
family, with composition providing a yield stress of up
to 100 ksi (690 MPa). Its good weldability and lack of
preheat requirement provide a great convenience for the
construction of large-scale structures, and significantly
reduce the processing costs. A considerable number of
investigations on the properties of HSLA steels and
their welding have been carried out in the past 30 years
[7,8]. The main concern in these studies is the quasi-
static mechanical response, fracture behavior and the
metallurgical properties and characteristics of welded
joints [9,10]. However, very limited results can be found
on the mechanical response of welded joints under
dynamic loading. Among these results, the main method
to evaluate dynamic properties of a weldment is the pre-
cracked Charpy V-notch impact test. Logsdon [11] and
Hahn and Kanninen [12] investigated the weldment
integrity of structural steels using this method. They
evaluated the dynamic fracture behavior through the
measurement and analysis of dynamic fracture tough-
ness. Rajanna et al. [13] carried out a series of Charpy
tests to examine the fracture toughness for the base,
* Corresponding author. Tel.: �/1-619-594-6329; fax: �/1-619-594-
3599.
E-mail address: [email protected] (E.A. Olevsky).
Materials Science and Engineering A354 (2003) 166�/179
www.elsevier.com/locate/msea
0921-5093/03/$ - see front matter # 2003 Elsevier Science B.V. All rights reserved.
doi:10.1016/S0921-5093(03)00007-8

weld areas as well as the HAZ, and correlated the
fracture behavior to the grain size. The dynamic crack
propagation in the weld area was also addressed [14].
Although the Charpy test can provide importantinformation about dynamic fracture, it is hard to obtain
the exact dynamic response and microstructural evolu-
tion during the dynamic loading process.
The heat-affected zone (HAZ), which is cooled at
different rates and includes different regions of micro-
structure, is often considered the source of failure in a
welded joint. During the welding thermal cycle, base
steel close to the fusion area will transform to austenite,martensite, ferrite and/or bainite, depending on the
cooling rate [15,16] and steel composition. These differ-
ent phase microstructures correspond to different me-
chanical properties [6,17,18]. A weld joint consists of
fusion weld area, the HAZ and base area (unwelded).
Even though some phases in the HAZ show their
brittleness and sensitivity to the microcracks, one cannot
assume that the initiation of the failure is always in theHAZ. The source and mechanisms of failure for a weld
joint without pre-defects under uniform dynamic load-
ing still need to be investigated and the strain rate
sensitivity of fracture mechanism cannot be excluded.
The simpler empirical constitutive equations that
realistically predict the material behavior in the model-
ing of the response in engineering applications under
different strain rate (such as the Johnson�/Cook [19]),have successfully been replaced by dislocation-based
equations, such as the Zerilli�/Armstrong [20,21] and the
mechanical threshold stress (MTS) [22,23]. For a
comparison of the characteristics and performance of
these equations, see Ref. [24]. These equations are
implemented into large-scale computational codes to
model the structural response. This approach does not
incorporate effects of defects and damage accumulationinside the materials, and these influences have to be
separately dealt with. An analytical treatment for defects
was developed by Gurson [25], which involves the
formation of voids and their weakening effect. The
Gurson model was modified by Tvergaard [26]. Fyfe [27]
discussed the application of the Gurson model to
dynamic failure. Essentially, the Gurson�/Tvergaard
model involves the opening of voids inside the metaland the attendant loss of load-bearing ability, leading at
a sufficient strain, to total fracture.
The objective of this investigation is to characterize
the mechanical response of HSLA 100 steel in the
temperature range encountered by naval vessels. Of
particular importance is the response to underwater
explosions, which generate large pressure pulses. There-
fore, only ambient- and low-temperature tests werecarried out. Low- and high- strain rate tensile tests
were carried out in order to provide the parameters for
implementation into the MTS constitutive equation.
The differences in response among the base, interface
and weld regions are interpreted in terms of micro-
structural characteristics and are incorporated into the
constitutive equation. The mechanism of failure for the
weld joint was analyzed and explained with thesemicrostructural characteristics.
2. Experimental
2.1. Material
The material for the weldment used in these experi-
ments is an HSLA 100 steel, although some of its alloy
components do not remain at the low alloy level. The
chemical compositions of the HSLA 100 steel plate and
the wire electrodes are provided by Naval Surface
Warfare Center and are shown in Table 1. The HSLA100 steel plates with 1 in. (25 mm) thickness were welded
at Carderock Navy Laboratory with single V-shape of
weld pool by the manual arc-welding technique. The
microstructural overview of the weldment is given in
Fig. 1. The microstructure exhibits three distinguishing
areas: the fusion weld area, the HAZ and the base metal
area. Nineteen weld passes were applied to complete the
Table 1
Compositions of HSLA 100 base steel and electrode 100S-1
Material Composition
HSLA 100 C 0.06
Mn 0.75�/1.05
P 0.020
S 0.060
Si 0.40
Ni 1.50�/2.00
Cr 0.45�/0.75
Mo 0.30�/0.55
Cu 1.00�/1.30
Al 0.010
Cb 0.02�/0.06
V 0.03
Ti 0.02
Sn 0.030
As 0.025
Sb 0.025
N
Electrode 100S-1 C 0.08
Mn 1.25�/1.80
P 0.012
S 0.008
Si 0.20�/0.55
Ni 1.40�/2.10
Cr 0.30
Mo 0.25�/0.55
Cu *
Al 0.05
Cb 0.10
V 0.10
Ti 0.10
Q. Xue et al. / Materials Science and Engineering A354 (2003) 166�/179 167
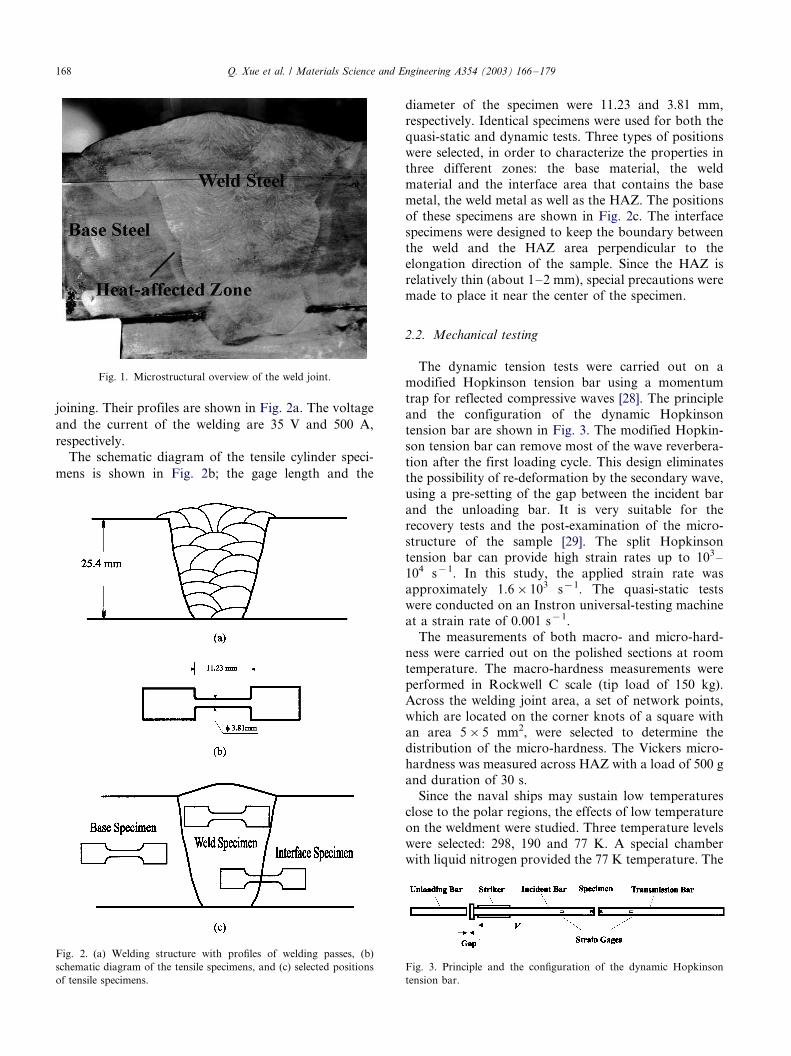
joining. Their profiles are shown in Fig. 2a. The voltage
and the current of the welding are 35 V and 500 A,
respectively.
The schematic diagram of the tensile cylinder speci-
mens is shown in Fig. 2b; the gage length and the
diameter of the specimen were 11.23 and 3.81 mm,
respectively. Identical specimens were used for both the
quasi-static and dynamic tests. Three types of positions
were selected, in order to characterize the properties inthree different zones: the base material, the weld
material and the interface area that contains the base
metal, the weld metal as well as the HAZ. The positions
of these specimens are shown in Fig. 2c. The interface
specimens were designed to keep the boundary between
the weld and the HAZ area perpendicular to the
elongation direction of the sample. Since the HAZ is
relatively thin (about 1�/2 mm), special precautions weremade to place it near the center of the specimen.
2.2. Mechanical testing
The dynamic tension tests were carried out on a
modified Hopkinson tension bar using a momentum
trap for reflected compressive waves [28]. The principle
and the configuration of the dynamic Hopkinson
tension bar are shown in Fig. 3. The modified Hopkin-
son tension bar can remove most of the wave reverbera-
tion after the first loading cycle. This design eliminatesthe possibility of re-deformation by the secondary wave,
using a pre-setting of the gap between the incident bar
and the unloading bar. It is very suitable for the
recovery tests and the post-examination of the micro-
structure of the sample [29]. The split Hopkinson
tension bar can provide high strain rates up to 103�/
104 s�1. In this study, the applied strain rate was
approximately 1.6�/103 s�1. The quasi-static testswere conducted on an Instron universal-testing machine
at a strain rate of 0.001 s�1.
The measurements of both macro- and micro-hard-
ness were carried out on the polished sections at room
temperature. The macro-hardness measurements were
performed in Rockwell C scale (tip load of 150 kg).
Across the welding joint area, a set of network points,
which are located on the corner knots of a square withan area 5�/5 mm2, were selected to determine the
distribution of the micro-hardness. The Vickers micro-
hardness was measured across HAZ with a load of 500 g
and duration of 30 s.
Since the naval ships may sustain low temperatures
close to the polar regions, the effects of low temperature
on the weldment were studied. Three temperature levels
were selected: 298, 190 and 77 K. A special chamberwith liquid nitrogen provided the 77 K temperature. The
Fig. 1. Microstructural overview of the weld joint.
Fig. 2. (a) Welding structure with profiles of welding passes, (b)
schematic diagram of the tensile specimens, and (c) selected positions
of tensile specimens.
Fig. 3. Principle and the configuration of the dynamic Hopkinson
tension bar.
Q. Xue et al. / Materials Science and Engineering A354 (2003) 166�/179168
temperature of 190 K was obtained by adding liquid
nitrogen into pure methanol to freeze it. A thermo-
couple was used to monitor the temperature. The goal of
the experiments was beyond simply trying to reproducethe experimental conditions that ships experience.
Rather, it was to develop a robust constitutive descrip-
tion of the mechanical response of HSLA 100 over a
broad range of temperature and strain rates.
2.3. Metallography
The microstructure for the base metal, the weldedmaterial and the HAZ were examined before and after
the tests. The normal metallurgical analysis process was
applied through mounting, grinding and polishing. The
specimens, etched with 2% nital solution, were examined
by both optical and scanning electron microscopies.
Damage evolution, especially for the void nucleation,
growth and coalesce, was the main concern. In order to
reveal the details of the voids and their distribution, thepolished samples, without etching, were examined. The
void distribution was analyzed by using the image
analysis technique.
3. Results
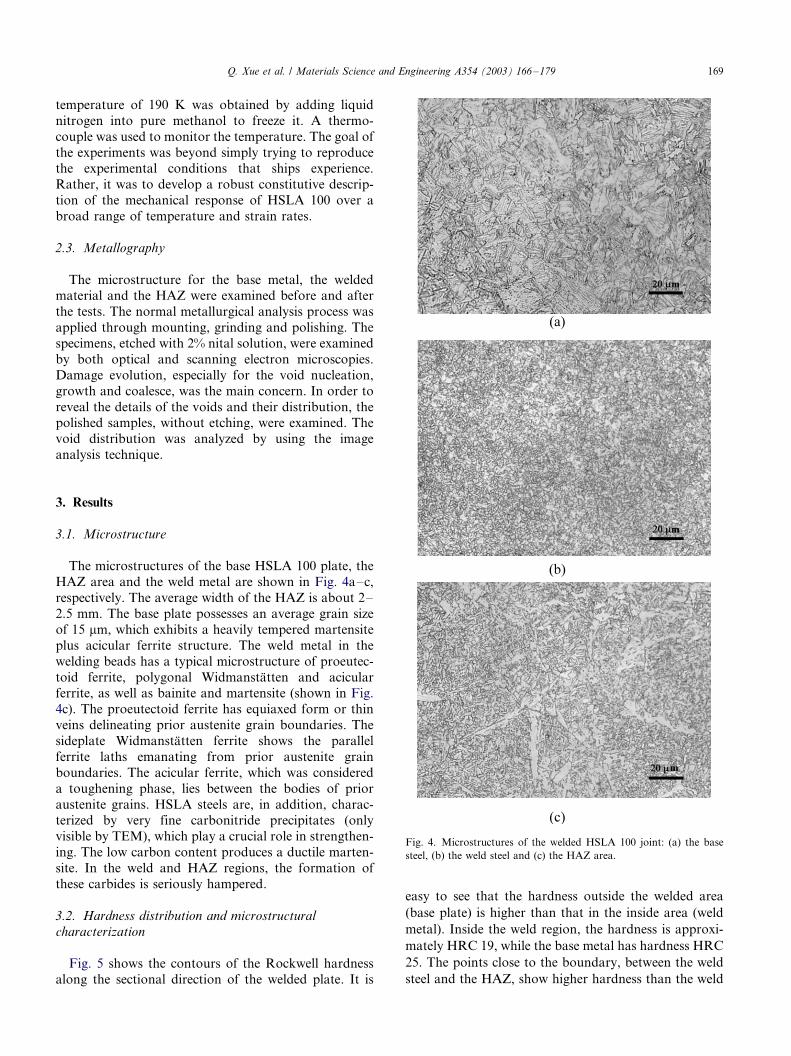
3.1. Microstructure
The microstructures of the base HSLA 100 plate, the
HAZ area and the weld metal are shown in Fig. 4a�/c,
respectively. The average width of the HAZ is about 2�/
2.5 mm. The base plate possesses an average grain size
of 15 mm, which exhibits a heavily tempered martensite
plus acicular ferrite structure. The weld metal in the
welding beads has a typical microstructure of proeutec-
toid ferrite, polygonal Widmanstatten and acicularferrite, as well as bainite and martensite (shown in Fig.
4c). The proeutectoid ferrite has equiaxed form or thin
veins delineating prior austenite grain boundaries. The
sideplate Widmanstatten ferrite shows the parallel
ferrite laths emanating from prior austenite grain
boundaries. The acicular ferrite, which was considered
a toughening phase, lies between the bodies of prior
austenite grains. HSLA steels are, in addition, charac-terized by very fine carbonitride precipitates (only
visible by TEM), which play a crucial role in strengthen-
ing. The low carbon content produces a ductile marten-
site. In the weld and HAZ regions, the formation of
these carbides is seriously hampered.
3.2. Hardness distribution and microstructural
characterization
Fig. 5 shows the contours of the Rockwell hardness
along the sectional direction of the welded plate. It is
easy to see that the hardness outside the welded area
(base plate) is higher than that in the inside area (weld
metal). Inside the weld region, the hardness is approxi-
mately HRC 19, while the base metal has hardness HRC
25. The points close to the boundary, between the weld
steel and the HAZ, show higher hardness than the weld
Fig. 4. Microstructures of the welded HSLA 100 joint: (a) the base
steel, (b) the weld steel and (c) the HAZ area.
Q. Xue et al. / Materials Science and Engineering A354 (2003) 166�/179 169

center area. Although this map indicates the approx-
imate distribution, it should be pointed out that the
variation inside the weld area is not accurately de-
scribed. A comparison with the microstructural pattern
of the sectional welded area reveals that the weld area
consists of 19 welding passes (see Fig. 2a). Some tested
points are located at the center of the bead and some arelocated at the boundary between two beads. This
measurement may lead to the oversight of the hardness
distribution details. Therefore, the hardness measured in
the welded area only provides an average distribution
and shows the general trends. In addition, the change of
the hardness in the HAZ area, approximately 2�/2.5 mm
in thickness, cannot be described by contour lines,
either. So the map only shows that hardness in thewelded area is less than that in base plate material. The
hardness value close to the right boundary between the
weld steel and base steel in Fig. 5 reaches HRC 28,
which is much higher than those in both sides. This
point is located within the HAZ.
In order to obtain a more detailed view of the material
resistance to plastic flow, microindentation hardness
measurements were made across the interface. Fig. 6shows the distribution of Vickers micro-hardness in the
HAZ. In the base metal, the hardness remains at HVN
2609/10. The hardness rises as the HAZ is approached
from the direction toward the center of the weld area. It
reaches the peak value of about 320 HVN at the
boundary between the HAZ and the weld metal but in
the side of the HAZ. Once the boundary is crossed, the
hardness drops down dramatically to HVN 227 andthen increases slowly toward the center of the weld bead.
3.3. Mechanical response of the welded material
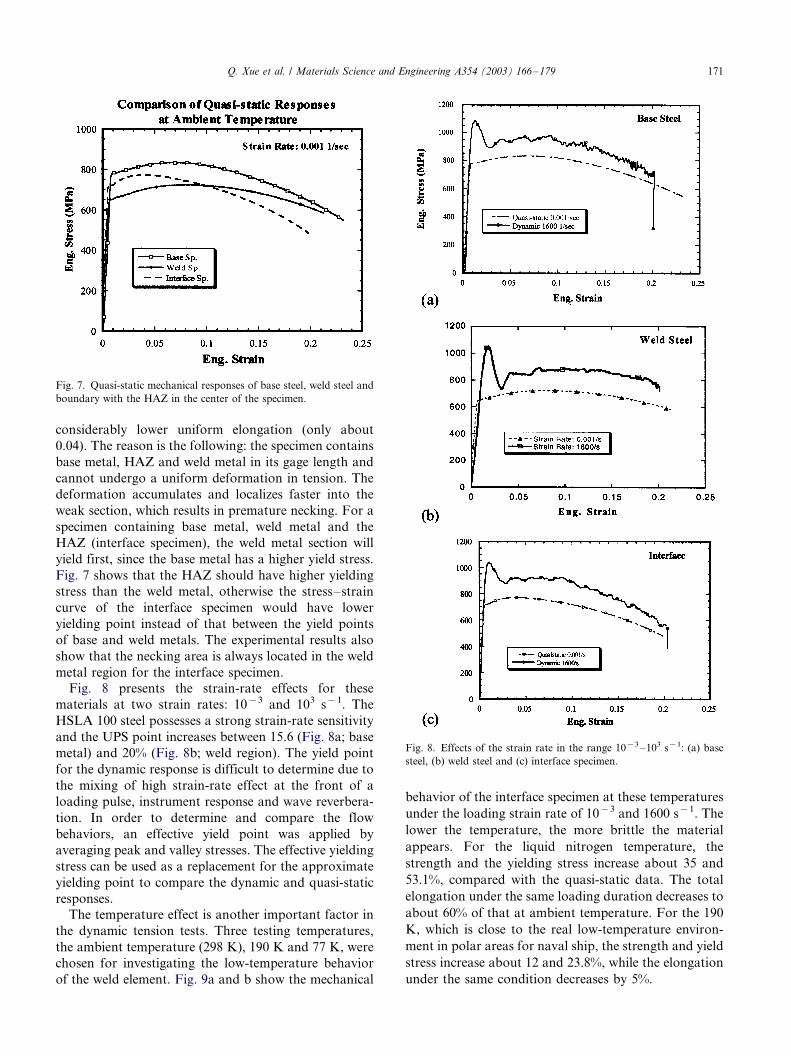
The three quasi-static stress�/strain curves in Fig. 7
represent the mechanical responses of the materials fromthe base metal, the weld metal and their boundary with
the HAZ in the center of the specimen. The base metal
shows the highest yield stress, while the weld metal gives
the lowest one. This is consistent with the hardness
measurements. One can also obtain approximate hard-
ness values from the yield stress, and vice versa, by the
conversion H /3�/sy . From the micro-hardness, one
obtains yield stresses of 860 and 750 MPa for the base
and weld areas, respectively. These are fairly close to the
flow stresses at a plastic strain of 0.08 in Fig. 7. It is
important to emphasize that the tensile test does not
capture the small fluctuations in yield stress; the speci-
men flows in its softest region. It is possible to map the
local fluctuations more exactly with hardness measure-
ments. The necking stress is considered to be close to the
ultimate peak stress (UPS) point, which gives the
transition point from uniform deformation to unstable
deformation. The corresponding plastic strain at neck-
ing initiation (uniform elongation) is about 0.085 for the
weld metal and 0.076 for the base metal. However, the
specimen taken from the boundary area shows a
Fig. 5. Rockwell hardness contour map of the measurement in C scale.
Fig. 6. Detailed distribution of Vickers micro-hardness along the
HAZ.
Q. Xue et al. / Materials Science and Engineering A354 (2003) 166�/179170
considerably lower uniform elongation (only about
0.04). The reason is the following: the specimen contains
base metal, HAZ and weld metal in its gage length and
cannot undergo a uniform deformation in tension. The
deformation accumulates and localizes faster into the
weak section, which results in premature necking. For a
specimen containing base metal, weld metal and the
HAZ (interface specimen), the weld metal section will
yield first, since the base metal has a higher yield stress.
Fig. 7 shows that the HAZ should have higher yielding
stress than the weld metal, otherwise the stress�/strain
curve of the interface specimen would have lower
yielding point instead of that between the yield points
of base and weld metals. The experimental results also
show that the necking area is always located in the weld
metal region for the interface specimen.
Fig. 8 presents the strain-rate effects for these
materials at two strain rates: 10�3 and 103 s�1. The
HSLA 100 steel possesses a strong strain-rate sensitivity
and the UPS point increases between 15.6 (Fig. 8a; base
metal) and 20% (Fig. 8b; weld region). The yield point
for the dynamic response is difficult to determine due to
the mixing of high strain-rate effect at the front of a
loading pulse, instrument response and wave reverbera-
tion. In order to determine and compare the flow
behaviors, an effective yield point was applied by
averaging peak and valley stresses. The effective yielding
stress can be used as a replacement for the approximate
yielding point to compare the dynamic and quasi-static
responses.
The temperature effect is another important factor in
the dynamic tension tests. Three testing temperatures,
the ambient temperature (298 K), 190 K and 77 K, were
chosen for investigating the low-temperature behavior
of the weld element. Fig. 9a and b show the mechanical
behavior of the interface specimen at these temperatures
under the loading strain rate of 10�3 and 1600 s�1. The
lower the temperature, the more brittle the material
appears. For the liquid nitrogen temperature, the
strength and the yielding stress increase about 35 and
53.1%, compared with the quasi-static data. The total
elongation under the same loading duration decreases to
about 60% of that at ambient temperature. For the 190
K, which is close to the real low-temperature environ-
ment in polar areas for naval ship, the strength and yield
stress increase about 12 and 23.8%, while the elongation
under the same condition decreases by 5%.
Fig. 7. Quasi-static mechanical responses of base steel, weld steel and
boundary with the HAZ in the center of the specimen.
Fig. 8. Effects of the strain rate in the range 10�3�/103 s�1: (a) base
steel, (b) weld steel and (c) interface specimen.
Q. Xue et al. / Materials Science and Engineering A354 (2003) 166�/179 171

3.4. Microstructure and failure characteristics
All interface specimens under different strain rates
and temperatures show that the necking happened inside
the welding area. Fig. 10 exhibits a typical sectional view
of an interface specimen. The HAZ is marked, and the
base metal region and the weld metal region show
different metallurgical characters. The deformation
quickly localizes into the necking area once the critical
stress reached. Within the necking area, the grains were
elongated and micro-voids appeared in the inclusion-
matrix boundary.
The analysis of fracture surface provides rich infor-
mation for the failure process. The SEM fractograph of
the weld metal after the dynamic deformation is shown
Fig. 9. Temperature effect on the tensile stress�/strain behavior (interface): (a) quasi-static mechanical response and (b) dynamic mechanical
response.
Fig. 10. Failure configuration of the interface specimen. The necking
always happens in the weld metal region.
Q. Xue et al. / Materials Science and Engineering A354 (2003) 166�/179172
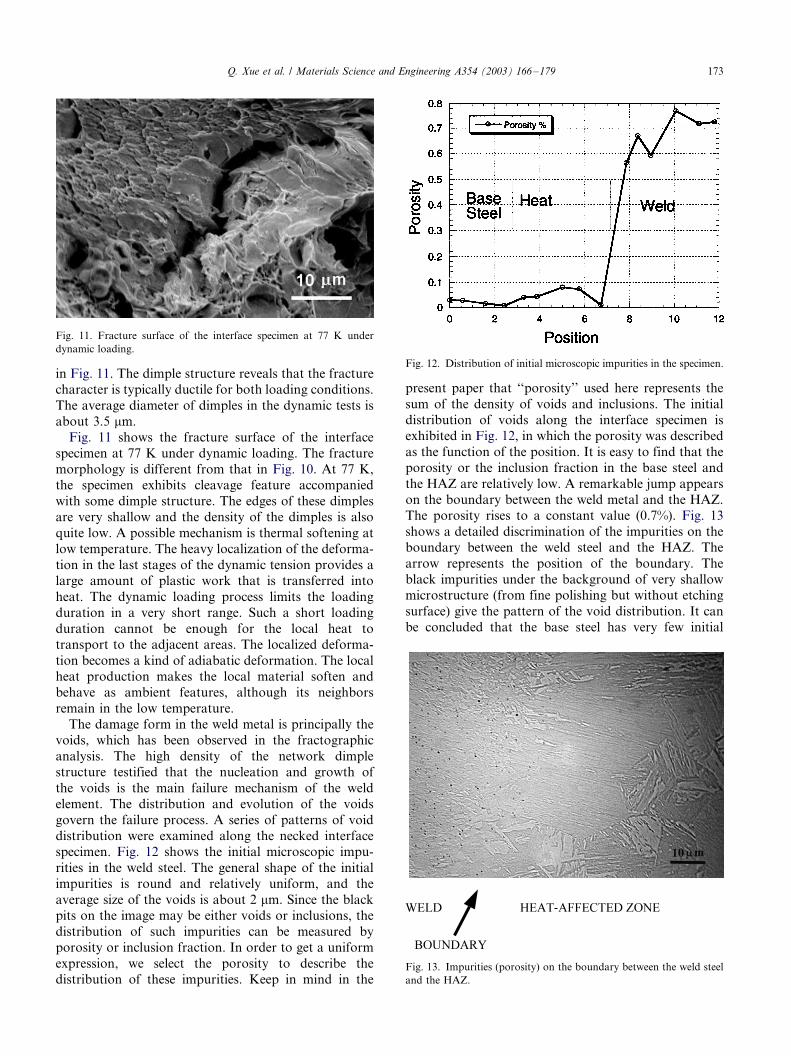
in Fig. 11. The dimple structure reveals that the fracture
character is typically ductile for both loading conditions.
The average diameter of dimples in the dynamic tests is
about 3.5 mm.
Fig. 11 shows the fracture surface of the interface
specimen at 77 K under dynamic loading. The fracture
morphology is different from that in Fig. 10. At 77 K,
the specimen exhibits cleavage feature accompanied
with some dimple structure. The edges of these dimples
are very shallow and the density of the dimples is also
quite low. A possible mechanism is thermal softening at
low temperature. The heavy localization of the deforma-
tion in the last stages of the dynamic tension provides a
large amount of plastic work that is transferred into
heat. The dynamic loading process limits the loading
duration in a very short range. Such a short loading
duration cannot be enough for the local heat to
transport to the adjacent areas. The localized deforma-
tion becomes a kind of adiabatic deformation. The local
heat production makes the local material soften and
behave as ambient features, although its neighbors
remain in the low temperature.
The damage form in the weld metal is principally the
voids, which has been observed in the fractographic
analysis. The high density of the network dimple
structure testified that the nucleation and growth of
the voids is the main failure mechanism of the weld
element. The distribution and evolution of the voids
govern the failure process. A series of patterns of void
distribution were examined along the necked interface
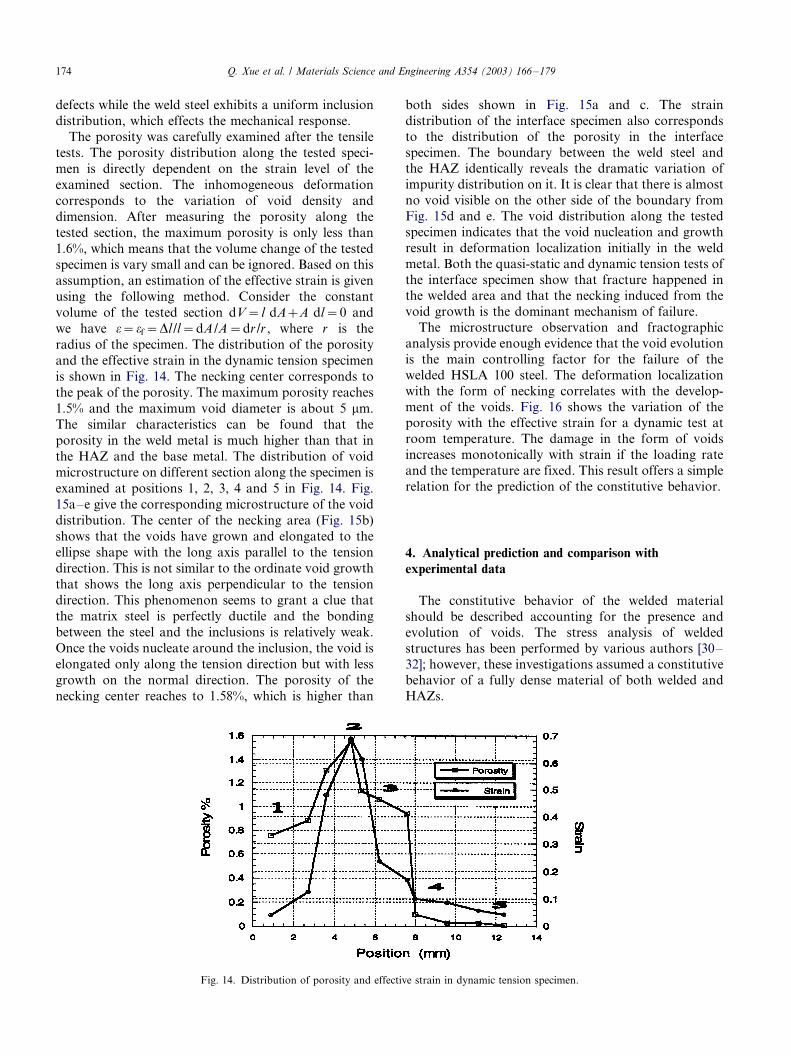
specimen. Fig. 12 shows the initial microscopic impu-
rities in the weld steel. The general shape of the initial
impurities is round and relatively uniform, and the
average size of the voids is about 2 mm. Since the black
pits on the image may be either voids or inclusions, the
distribution of such impurities can be measured by
porosity or inclusion fraction. In order to get a uniform
expression, we select the porosity to describe the
distribution of these impurities. Keep in mind in the
present paper that ‘‘porosity’’ used here represents the
sum of the density of voids and inclusions. The initial
distribution of voids along the interface specimen is
exhibited in Fig. 12, in which the porosity was described
as the function of the position. It is easy to find that the
porosity or the inclusion fraction in the base steel and
the HAZ are relatively low. A remarkable jump appears
on the boundary between the weld metal and the HAZ.
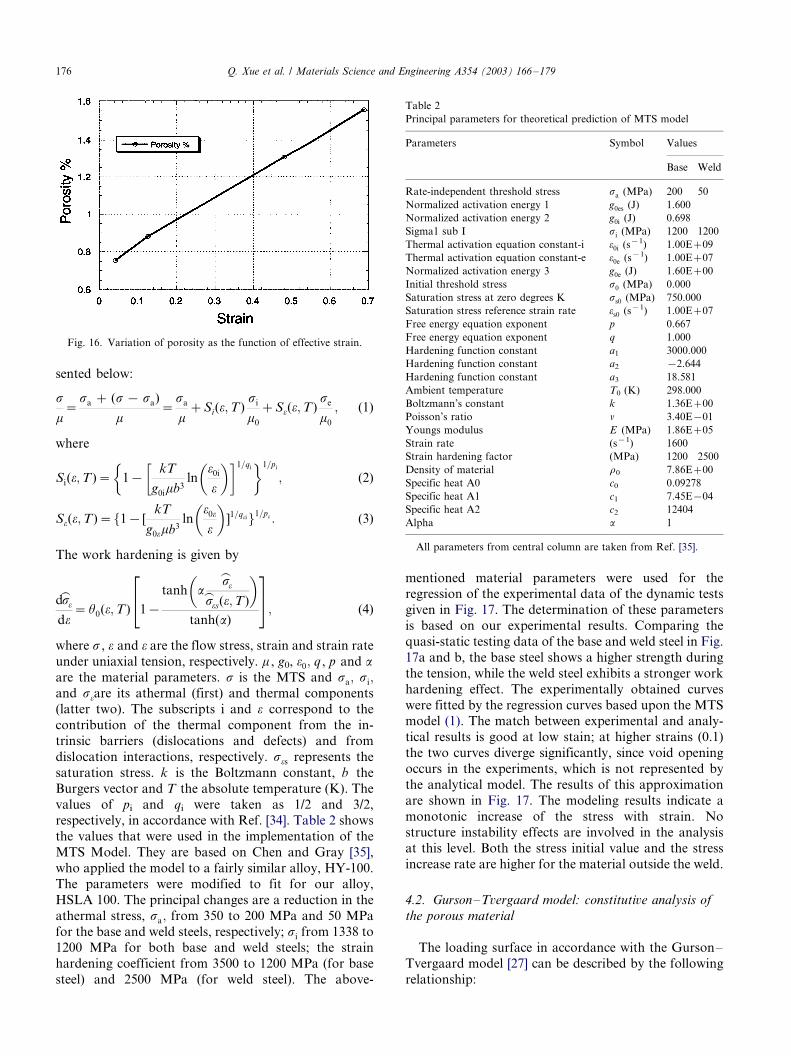
The porosity rises to a constant value (0.7%). Fig. 13
shows a detailed discrimination of the impurities on the
boundary between the weld steel and the HAZ. The
arrow represents the position of the boundary. The
black impurities under the background of very shallow
microstructure (from fine polishing but without etching
surface) give the pattern of the void distribution. It can
be concluded that the base steel has very few initial
Fig. 11. Fracture surface of the interface specimen at 77 K under
dynamic loading.
Fig. 12. Distribution of initial microscopic impurities in the specimen.
Fig. 13. Impurities (porosity) on the boundary between the weld steel
and the HAZ.
Q. Xue et al. / Materials Science and Engineering A354 (2003) 166�/179 173
defects while the weld steel exhibits a uniform inclusion
distribution, which effects the mechanical response.
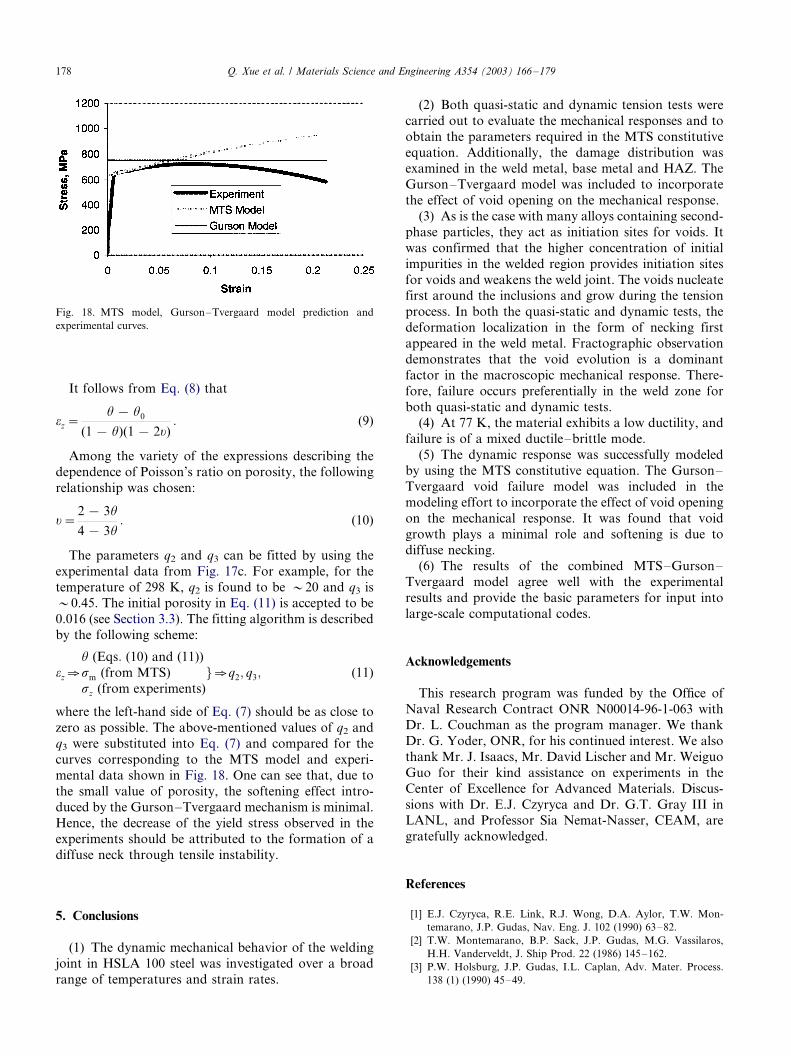
The porosity was carefully examined after the tensile
tests. The porosity distribution along the tested speci-
men is directly dependent on the strain level of the
examined section. The inhomogeneous deformation
corresponds to the variation of void density and
dimension. After measuring the porosity along the
tested section, the maximum porosity is only less than
1.6%, which means that the volume change of the tested
specimen is vary small and can be ignored. Based on this
assumption, an estimation of the effective strain is given
using the following method. Consider the constant
volume of the tested section dV�/l dA�/A dl�/0 and
we have o�/of�/Dl /l�/dA /A�/dr /r , where r is the
radius of the specimen. The distribution of the porosity
and the effective strain in the dynamic tension specimen
is shown in Fig. 14. The necking center corresponds to
the peak of the porosity. The maximum porosity reaches
1.5% and the maximum void diameter is about 5 mm.
The similar characteristics can be found that the
porosity in the weld metal is much higher than that in
the HAZ and the base metal. The distribution of void
microstructure on different section along the specimen is
examined at positions 1, 2, 3, 4 and 5 in Fig. 14. Fig.
15a�/e give the corresponding microstructure of the void
distribution. The center of the necking area (Fig. 15b)
shows that the voids have grown and elongated to the
ellipse shape with the long axis parallel to the tension
direction. This is not similar to the ordinate void growth
that shows the long axis perpendicular to the tension
direction. This phenomenon seems to grant a clue that
the matrix steel is perfectly ductile and the bonding
between the steel and the inclusions is relatively weak.
Once the voids nucleate around the inclusion, the void is
elongated only along the tension direction but with less
growth on the normal direction. The porosity of the
necking center reaches to 1.58%, which is higher than
both sides shown in Fig. 15a and c. The strain
distribution of the interface specimen also corresponds
to the distribution of the porosity in the interface
specimen. The boundary between the weld steel andthe HAZ identically reveals the dramatic variation of
impurity distribution on it. It is clear that there is almost
no void visible on the other side of the boundary from
Fig. 15d and e. The void distribution along the tested
specimen indicates that the void nucleation and growth
result in deformation localization initially in the weld
metal. Both the quasi-static and dynamic tension tests of
the interface specimen show that fracture happened inthe welded area and that the necking induced from the
void growth is the dominant mechanism of failure.
The microstructure observation and fractographic
analysis provide enough evidence that the void evolution
is the main controlling factor for the failure of the
welded HSLA 100 steel. The deformation localization
with the form of necking correlates with the develop-
ment of the voids. Fig. 16 shows the variation of theporosity with the effective strain for a dynamic test at
room temperature. The damage in the form of voids
increases monotonically with strain if the loading rate
and the temperature are fixed. This result offers a simple
relation for the prediction of the constitutive behavior.
4. Analytical prediction and comparison with
experimental data
The constitutive behavior of the welded material
should be described accounting for the presence and
evolution of voids. The stress analysis of welded
structures has been performed by various authors [30�/
32]; however, these investigations assumed a constitutivebehavior of a fully dense material of both welded and
HAZs.
Fig. 14. Distribution of porosity and effective strain in dynamic tension specimen.
Q. Xue et al. / Materials Science and Engineering A354 (2003) 166�/179174

4.1. Mechanical threshold stress model: constitutive
analysis of the solid material
The constitutive response of high-strength steels has
been successfully described by the Zerilli�/Armstong and
MTS models. Armstrong et al. [33] used the Z�/A model
to model the response of HY-80, HY-100 and HY-130
steels; good correspondence was obtained with experi-
mental results, yielding a rationalization of the ductile-
to-brittle transition. For the description of the stress�/
strain relationships of the steel, the MTS model [22,23] is
employed. The corresponding expressions are repre-
Fig. 15. The corresponding microstructure of the void distribution: (a�/e) positions 1�/5 on the specimen in Fig. 14.
Q. Xue et al. / Materials Science and Engineering A354 (2003) 166�/179 175
sented below:
s
m�
sa � (s� sa)
m�
sa
m�Si(o;T)
si
m0
�So(o;T)se
m0
; (1)
where
Si(o;T)��
1��
kT
g0imb3ln
�o0i
o
��1=qi�1=pi
; (2)
So(o;T)�f1� [kT
g0omb3ln
�o0o
o
�]1=qoig1=po : (3)
The work hardening is given by
d
Þ
so
do�u0(o;T)
�1�
tanh
�a
Þ
so
Þ
sos(o;T)
�tanh(a)
�; (4)
where s , o and o are the flow stress, strain and strain rate
under uniaxial tension, respectively. m , g0, o0; q , p and a
are the material parameters. s is the MTS and sa; si;and so/are its athermal (first) and thermal components
(latter two). The subscripts i and o correspond to the
contribution of the thermal component from the in-
trinsic barriers (dislocations and defects) and from
dislocation interactions, respectively. sos represents the
saturation stress. k is the Boltzmann constant, b the
Burgers vector and T the absolute temperature (K). The
values of pi and qi were taken as 1/2 and 3/2,respectively, in accordance with Ref. [34]. Table 2 shows
the values that were used in the implementation of the
MTS Model. They are based on Chen and Gray [35],
who applied the model to a fairly similar alloy, HY-100.
The parameters were modified to fit for our alloy,
HSLA 100. The principal changes are a reduction in the
athermal stress, sa; from 350 to 200 MPa and 50 MPa
for the base and weld steels, respectively; si from 1338 to1200 MPa for both base and weld steels; the strain
hardening coefficient from 3500 to 1200 MPa (for base
steel) and 2500 MPa (for weld steel). The above-
mentioned material parameters were used for theregression of the experimental data of the dynamic tests
given in Fig. 17. The determination of these parameters
is based on our experimental results. Comparing the
quasi-static testing data of the base and weld steel in Fig.
17a and b, the base steel shows a higher strength during
the tension, while the weld steel exhibits a stronger work
hardening effect. The experimentally obtained curves
were fitted by the regression curves based upon the MTSmodel (1). The match between experimental and analy-
tical results is good at low stain; at higher strains (0.1)
the two curves diverge significantly, since void opening
occurs in the experiments, which is not represented by
the analytical model. The results of this approximation
are shown in Fig. 17. The modeling results indicate a
monotonic increase of the stress with strain. No
structure instability effects are involved in the analysisat this level. Both the stress initial value and the stress
increase rate are higher for the material outside the weld.
4.2. Gurson�/Tvergaard model: constitutive analysis of
the porous material
The loading surface in accordance with the Gurson�/
Tvergaard model [27] can be described by the following
relationship:
Fig. 16. Variation of porosity as the function of effective strain.
Table 2
Principal parameters for theoretical prediction of MTS model
Parameters Symbol Values
Base Weld
Rate-independent threshold stress /sa (MPa) 200 50
Normalized activation energy 1 /g0es (J) 1.600
Normalized activation energy 2 /g0i (J) 0.698
Sigma1 sub I /si (MPa) 1200 1200
Thermal activation equation constant-i /o0i (s�1) 1.00E�/09
Thermal activation equation constant-e /o0e (s�1) 1.00E�/07
Normalized activation energy 3 /g0e (J) 1.60E�/00
Initial threshold stress /s0 (MPa) 0.000
Saturation stress at zero degrees K /ss0 (MPa) 750.000
Saturation stress reference strain rate /os0 (s�1) 1.00E�/07
Free energy equation exponent p 0.667
Free energy equation exponent q 1.000
Hardening function constant a1 3000.000
Hardening function constant a2 �/2.644
Hardening function constant a3 18.581
Ambient temperature T0 (K) 298.000
Boltzmann’s constant k 1.36E�/00
Poisson’s ratio n 3.40E�/01
Youngs modulus E (MPa) 1.86E�/05
Strain rate (s�1) 1600
Strain hardening factor (MPa) 1200 2500
Density of material r0 7.86E�/00
Specific heat A0 c0 0.09278
Specific heat A1 c1 7.45E�/04
Specific heat A2 c2 12404
Alpha a 1
All parameters from central column are taken from Ref. [35].
Q. Xue et al. / Materials Science and Engineering A354 (2003) 166�/179176

s2e
s2m
�2q1 cosh
�q2
2
skk
sm
��(1�q3u
2)�0; (5)
where se and skk are the deviatoric and hydrostatic
stresses, respectively, sm is a matrix (porous body) yield
stress, u is the porosity, and q1, q2, q3 are the Tvergaard
parameters. For q1�/q2�/q3�/1, the Gurson�/Tver-
gaard model [27] reduces itself to the Gurson model [28].
For the description of a uniaxial-loading test, the
dependencies between the stress tensor invariants andaxial stress are used in the form (sz is the stress along
the loading direction):
skk�sz
3; se�
ffiffiffi2
3
ssz: (6)
Substituting Eq. (6) into Eq. (5), one obtains
q3u2�
�2q1 cosh
�q2
6
sz
sm
��u�1�
2s2z
3s2m
�0: (7)
In the Gurson�/Tvergaard model, the value of q1 is
fixed: q1�/1.5. The other two parameters q2 and q3 can
be determined using the experimental data represented
in Fig. 17c and d. Eq. (7) describes the relationship
between the axial stress and porosity under conditions
of uniaxial testing. In order to derive the stress�/strain
relationship, one needs to incorporate axial strain as
another independent variable (instead of porosity) in
Eq. (7). The following expressions enable the solution of
the above-mentioned problem:
DV
V�
u� u0
1 � u�oz�2or; (8)
where DV /V is volume shrinkage, u0 the initial porosity,
oz and or are the axial and radial strains, respectively, n
(�/�/or /oz) the Poisson ratio.
Fig. 17. Comparison between the experimental and the calculated (MTS) stress�/strain curves for quasi-static and dynamic results: (a, b) base steel;
(c, d) welded region.
Q. Xue et al. / Materials Science and Engineering A354 (2003) 166�/179 177
It follows from Eq. (8) that
oz�u� u0
(1 � u)(1 � 2y): (9)
Among the variety of the expressions describing the
dependence of Poisson’s ratio on porosity, the following
relationship was chosen:
y�2 � 3u
4 � 3u: (10)
The parameters q2 and q3 can be fitted by using the
experimental data from Fig. 17c. For example, for the
temperature of 298 K, q2 is found to be �/20 and q3 is�/0.45. The initial porosity in Eq. (11) is accepted to be
0.016 (see Section 3.3). The fitting algorithm is described
by the following scheme:
oz[u (Eqs: (10) and (11))
sm (from MTS)
sz (from experiments)
g[q2; q3; (11)
where the left-hand side of Eq. (7) should be as close to
zero as possible. The above-mentioned values of q2 and
q3 were substituted into Eq. (7) and compared for the
curves corresponding to the MTS model and experi-
mental data shown in Fig. 18. One can see that, due to
the small value of porosity, the softening effect intro-
duced by the Gurson�/Tvergaard mechanism is minimal.
Hence, the decrease of the yield stress observed in theexperiments should be attributed to the formation of a
diffuse neck through tensile instability.
5. Conclusions
(1) The dynamic mechanical behavior of the welding
joint in HSLA 100 steel was investigated over a broad
range of temperatures and strain rates.
(2) Both quasi-static and dynamic tension tests were
carried out to evaluate the mechanical responses and to
obtain the parameters required in the MTS constitutive
equation. Additionally, the damage distribution wasexamined in the weld metal, base metal and HAZ. The
Gurson�/Tvergaard model was included to incorporate
the effect of void opening on the mechanical response.
(3) As is the case with many alloys containing second-
phase particles, they act as initiation sites for voids. It
was confirmed that the higher concentration of initial
impurities in the welded region provides initiation sites
for voids and weakens the weld joint. The voids nucleatefirst around the inclusions and grow during the tension
process. In both the quasi-static and dynamic tests, the
deformation localization in the form of necking first
appeared in the weld metal. Fractographic observation
demonstrates that the void evolution is a dominant
factor in the macroscopic mechanical response. There-
fore, failure occurs preferentially in the weld zone for
both quasi-static and dynamic tests.(4) At 77 K, the material exhibits a low ductility, and
failure is of a mixed ductile�/brittle mode.
(5) The dynamic response was successfully modeled
by using the MTS constitutive equation. The Gurson�/
Tvergaard void failure model was included in the
modeling effort to incorporate the effect of void opening
on the mechanical response. It was found that void
growth plays a minimal role and softening is due todiffuse necking.
(6) The results of the combined MTS�/Gurson�/
Tvergaard model agree well with the experimental
results and provide the basic parameters for input into
large-scale computational codes.
Acknowledgements
This research program was funded by the Office of
Naval Research Contract ONR N00014-96-1-063 with
Dr. L. Couchman as the program manager. We thank
Dr. G. Yoder, ONR, for his continued interest. We also
thank Mr. J. Isaacs, Mr. David Lischer and Mr. Weiguo
Guo for their kind assistance on experiments in the
Center of Excellence for Advanced Materials. Discus-
sions with Dr. E.J. Czyryca and Dr. G.T. Gray III inLANL, and Professor Sia Nemat-Nasser, CEAM, are
gratefully acknowledged.
References
[1] E.J. Czyryca, R.E. Link, R.J. Wong, D.A. Aylor, T.W. Mon-
temarano, J.P. Gudas, Nav. Eng. J. 102 (1990) 63�/82.
[2] T.W. Montemarano, B.P. Sack, J.P. Gudas, M.G. Vassilaros,
H.H. Vanderveldt, J. Ship Prod. 22 (1986) 145�/162.
[3] P.W. Holsburg, J.P. Gudas, I.L. Caplan, Adv. Mater. Process.
138 (1) (1990) 45�/49.
Fig. 18. MTS model, Gurson�/Tvergaard model prediction and
experimental curves.
Q. Xue et al. / Materials Science and Engineering A354 (2003) 166�/179178

[4] S.W. Thompson, D.J. Colvin, G. Krauss, Metall. Mater. Trans. A
27 (1996) 1557�/1571.
[5] M. Manganello, in: Proceedings of the International Conference
on Processing, Microstructure and Properties of Microalloyed
and other Modern HSLA Steels, ISS-AIME, Warrendale, PA,
1992, pp. 331�/343.
[6] G. Spanos, R.W. Fonda, R.A. Vandermeer, A. Matuszeski,
Metall. Mater. Trans. A 26 (1995) 3277�/3293.
[7] K. Hulka, F. Heisterkamp, Mater. Sci. Forum 284�/286 (1998)
343�/350.
[8] L. Parilak, J. Dojcak, Int. J. Pressure Vessels and Piping 73 (7�/8)
(1993) T761�/T765.
[9] G.E. Hicho, S. Singhal, L.C. Smith, R.J. Fields, in: Proceedings of
the International conference on Tech. and Appl. of HSLA Steels,
American Society for Metals, Metals Park, OH, 1984, pp. 705�/
713.
[10] P.E. Denney, E.A. Metzbower, in: Proceedings of the Interna-
tional Conference on Tech. and Appl. of HSLA Steels, American
Society for Metals, Metals Park, OH, 1984, pp. 689�/696.
[11] W.A. Logsdon, Eng. Fracture Mech. 16 (1982) 757�/767.
[12] G.T. Hahn, M.F. Kanninen, Eng. Fracture Mech. 14 (1981) 725�/
740.
[13] K. Rajanna, S.K. Bhambri, D.R.G. Achar, Eng. Fracture Mech.
29 (4) (1988) 387�/399.
[14] Y.W. Shi, Z.X. Han, N.N. Zhou, J. Li, Eng. Fracture Mech. 41
(1) (1992) 143�/151.
[15] M. Mujahid, A.K. Lis, C.I. Garcia, A.J. DeArdo, in: Proceedings
of the International Conference on Processing, Microstructure
and Properties of Microalloyed and other Modern HSLA Steels,
ISS-AIME, Warrendale, PA, 1992, pp. 345�/356.
[16] O. Grong, D.K. Matlock, Int. Mater. Rev. 31 (1) (1986) 27�/48.
[17] P.L. Harrison, R.A. Farrar, Int. Mater. Rev. 34 (1) (1989) 35�/51.
[18] G. Thewlis, Mater. Sci. Technol. 10 (1994) 110�/125.
[19] G.R. Johnson, W.H. Cook, in: Proceedings of the Seventh
International Symposium on Ballistics, Am. Def. Prep. Org.
(ADPA), The Netherlands, 1983.
[20] F.J. Zerilli, R.W. Armstrong, J. Appl. Phys. 61 (1987) 1816�/1825.
[21] F.J. Zerilli, R.W. Armstrong, J. Appl. Phys. 68 (1990) 1580�/1591.
[22] P.S. Follansbee, in: L.E. Murr, K.P. Staudhammer, M.A. Meyers
(Eds.), Metallurgical Applications of Shock-wave and High-strain
Rate Phenomena, Dekker, New York, 1986, pp. 451�/479.
[23] P.S. Follansbee, U.F. Kocks, Acta Met. 36 (1988) 81�/93.
[24] M.A. Meyers, Dynamic Behavior of Materials, Wiley, New York,
1994, pp. 318�/323.
[25] A.L. Gurson, J. Eng. Mater. Technol. 99 (1977) 2�/15.
[26] V. Tvergaard, Ductile fracture by cavity nucleation between large
voids, Report 210, Danish Center for Appl. Math. and Mech.,
1981.
[27] I.M. Fyfe, in: J. Mescall, V. Weiss (Eds.), Material Behavior
under High Stress and Ultrahigh Loading Rates, 1983, pp. 309�/
318.
[28] S. Nemat-Nasser, J.B. Isaacs, J.E. Starrett, Proc. R. Soc. London
A 435 (1991) 371�/391.
[29] A. Thakur, S. Nemat-Nasser, K.S. Vecchio, Acta Mater. 44
(1996) 2797�/2807.
[30] J. Ronda, G.J. Oliver, Comput. Meth. Appl. Mech. Eng. 153 (3�/
4) (1998) 195�/221.
[31] Z. Wang, T. Inoue, Mater. Sci. Technol. 1 (10) (1985) 899�/903
(Calculation of Internal Stresses in Heat treatment of Metallic
Materials, Linkoping, Sweden, 23�/25 May 1984).
[32] G. Horhoianu, D.R. Moscalu, I.A. Popescu, Nucl. Eng. Des. 168
(1�/3) (1997) 319�/323.
[33] R.W. Armstong, F.J. Zerilli, W.H. Holt, W. Mock Jr., in: S.C.
Schmidt, et al. (Eds.), High-pressure Science and Technology*/
1993, AIP Conference Proceedings, Vol. 309, Part 2, AIP Press,
New York, 1994, pp. 1001�/1004.
[34] L.W. Meyer, in: M.A. Meyers, L.E. Murr, K.P. Staudhammer
(Eds.), Shock-wave and High-strain-rate Phenomena in Materials,
Dekker, New York, 1992, pp. 49�/68.
[35] S.R. Chen, G.T. Gray III, Comparison between the Mechanical
Threshold Stress (Strength) Model and the New Zerilli�/Arm-
strong Model, Los Alamos National Laboratory, Report LA-
UR-96-3594, October 1996.
Q. Xue et al. / Materials Science and Engineering A354 (2003) 166�/179 179