
Constitutive modeling of solid propellant materials with ... · PDF fileConstitutive modeling...
24
Journal of the Mechanics and Physics of Solids 56 (2008) 2050–2073 Constitutive modeling of solid propellant materials with evolving microstructural damage F. Xu a , N. Aravas b , P. Sofronis a, a Department of Mechanical Science and Engineering, University of Illinois at Urbana-Champaign, 1206 West Green Street, Urbana, IL 618011, USA b Department of Mechanical and Industrial Engineering, University of Thessaly, Pedion Areos, 38334 Volos, Greece Received 26 April 2007; received in revised form 25 October 2007; accepted 31 October 2007 Abstract Solid propellants are composite materials with complex microstructure. In a generic form, the material consists of polymeric binder, crystal oxidizer (e.g., ammonium perchlorate), and fuel particles (e.g., aluminum). Severe stressing and extreme temperatures induce damage which is manifested in particle cracking, dewetting along particle/polymer interfaces, void nucleation and growth. Damage complicates the overall constitutive response of a solid propellant over and above the complexities associated with the differing constitutive properties of the particle and binder phases. Using rigorous homogenization theory for composite materials, we propose a general 3-D nonlinear macroscopic constitutive law that models microstructural damage evolution upon straining through continuous void formation and growth. The law addresses the viscous deformation rate within the framework of additive decomposition of the deformation rate and the concept of back stress is used to improve the model performance in stress relaxation. No restriction is placed on the magnitude of the strains. Experimental data from the standard relaxation and uniaxial tension tests are used to calibrate the model parameters in the case of a high elongation solid propellant. It is emphasized that the model parameters are descriptors of individual phase constitutive response and criticality conditions for particle decohesion which can systematically be determined through experiment. The model is used to predict the response of the material under more complex loading paths and to investigate the effect of crack tip damage on the mechanical behavior of a compact tension fracture specimen. r 2007 Elsevier Ltd. All rights reserved. Keywords: Viscoelastic; Homogenization; Constitutive law; Void; Particle dewetting 1. Introduction The microstructure of a typical solid propellant material consists of polymeric binder, oxidizer, metal fuel, and some other additives for improved bonding and burning (Sutton, 1986; O ¨ zu¨ pek and Becker, 1992). From a mechanical behavior perspective, each of these phases exhibits a complex constitutive response that varies with temperature and load. ARTICLE IN PRESS www.elsevier.com/locate/jmps 0022-5096/$ - see front matter r 2007 Elsevier Ltd. All rights reserved. doi:10.1016/j.jmps.2007.10.013 Corresponding author. Fax: +1 217 244 6534. E-mail address: [email protected] (P. Sofronis).
Transcript of Constitutive modeling of solid propellant materials with ... · PDF fileConstitutive modeling...
ARTICLE IN PRESS
0022-5096/$ - se
doi:10.1016/j.jm
�CorrespondE-mail addr
Journal of the Mechanics and Physics of Solids 56 (2008) 2050–2073
www.elsevier.com/locate/jmps
Constitutive modeling of solid propellant materials withevolving microstructural damage
F. Xua, N. Aravasb, P. Sofronisa,�
aDepartment of Mechanical Science and Engineering, University of Illinois at Urbana-Champaign, 1206 West Green Street,
Urbana, IL 618011, USAbDepartment of Mechanical and Industrial Engineering, University of Thessaly, Pedion Areos, 38334 Volos, Greece
Received 26 April 2007; received in revised form 25 October 2007; accepted 31 October 2007
Abstract
Solid propellants are composite materials with complex microstructure. In a generic form, the material consists of
polymeric binder, crystal oxidizer (e.g., ammonium perchlorate), and fuel particles (e.g., aluminum). Severe stressing and
extreme temperatures induce damage which is manifested in particle cracking, dewetting along particle/polymer interfaces,
void nucleation and growth. Damage complicates the overall constitutive response of a solid propellant over and above the
complexities associated with the differing constitutive properties of the particle and binder phases. Using rigorous
homogenization theory for composite materials, we propose a general 3-D nonlinear macroscopic constitutive law that
models microstructural damage evolution upon straining through continuous void formation and growth. The law
addresses the viscous deformation rate within the framework of additive decomposition of the deformation rate and the
concept of back stress is used to improve the model performance in stress relaxation. No restriction is placed on the
magnitude of the strains. Experimental data from the standard relaxation and uniaxial tension tests are used to calibrate
the model parameters in the case of a high elongation solid propellant. It is emphasized that the model parameters are
descriptors of individual phase constitutive response and criticality conditions for particle decohesion which can
systematically be determined through experiment. The model is used to predict the response of the material under more
complex loading paths and to investigate the effect of crack tip damage on the mechanical behavior of a compact tension
fracture specimen.
r 2007 Elsevier Ltd. All rights reserved.
Keywords: Viscoelastic; Homogenization; Constitutive law; Void; Particle dewetting
1. Introduction
The microstructure of a typical solid propellant material consists of polymeric binder, oxidizer, metal fuel,and some other additives for improved bonding and burning (Sutton, 1986; Ozupek and Becker, 1992). Froma mechanical behavior perspective, each of these phases exhibits a complex constitutive response that varieswith temperature and load.
e front matter r 2007 Elsevier Ltd. All rights reserved.
ps.2007.10.013
ing author. Fax: +1217 244 6534.
ess: [email protected] (P. Sofronis).
ARTICLE IN PRESSF. Xu et al. / J. Mech. Phys. Solids 56 (2008) 2050–2073 2051
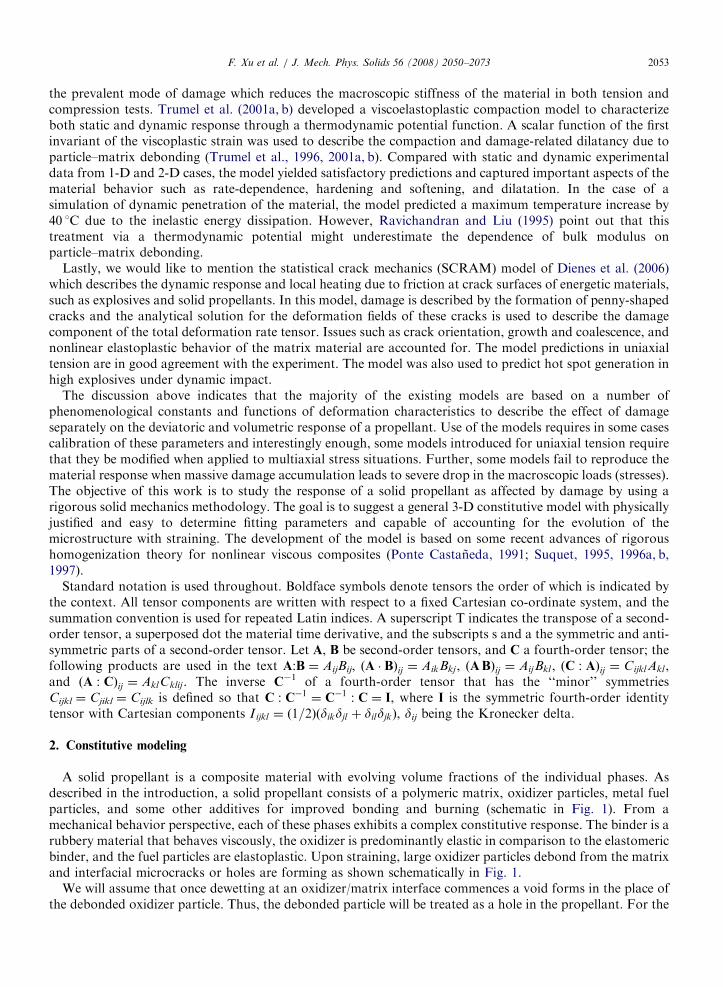
The binder is a rubbery material, e.g., polybutadiene-acrylonitrile-acrylic acid (PBAN) or hydroxy-terminated polybutadiene (HTPB), that behaves viscoelastically and serves as a cushion for the oxidizer, e.g.,ammonium perchlorate, which is an organic crystal with response predominantly elastic in comparison to theelastomeric binder. The fuel, e.g., powdered aluminum, is elastoplastic owing to its metallic nature. Thecharacterization of the overall constitutive response of such a composite material under load poses challengingproblems as it requires the coupling of deformation of the constituent phases in entirely different regimes,namely, elastic and viscous. The problem becomes even more complex (Ozupek and Becker, 1992), if oneconsiders the evolution of the microstructure as large oxidizer particles debond from the matrix, a processcalled dewetting (Farris, 1968; Cornwell and Schapery, 1975; Vratsanos and Farris, 1993a, b), during strainingand interfacial microcracks or holes are forming as shown schematically in Fig. 1. In fact, this microstructuraldamage is a sufficient reason for the material to exhibit a strong nonlinear macroscopic response.
For a thorough review of the previous work in the area of propellant constitutive modeling, one may look atthe work of Schapery and his co-workers (e.g., Park and Schapery, 1997; Ha and Schapery, 1998) who haveinvestigated the elastic and viscoelastic response of damaged composite propellant materials over the last 25years. Briefly reviewing their most recent work, one may refer to the constitutive theory for elastic media withdamage (Schapery, 1990) and to the potential theory approach to modeling the effect of damage on the elasticconstitutive response of particle-filled rubber on the basis of an internal damage parameter (Schapery, 1991).Later, Park and Schapery (1997) addressed the effect of time-dependent damage (e.g., microcracking) on theviscoelastic axisymmetric response of a solid propellant through two state variables corresponding to thedissipated work associated with the elastic and viscous character of the propellant, respectively. Ha andSchapery (1998) modified the model of Park and Schapery to address three-dimensional (3-D) stress states.While the theoretical predictions agree with the experimental results on the ascending part of theload–displacement response, they fail to address the descending part of the curve. Hinterhoelzl and Schapery(2004) modified the model of Ha and Schapery (1998) to account for the evolution of the material from theundamaged, compressible, and isotropic state before deformation to one with damage-induced anisotropyupon straining in a small-strain framework. In addition, they modified the parameters involved in theconstitutive relationship between stresses and pseudo-strains to improve convergence in the finite elementimplementation of the model.
Characterization of the constitutive response of solid propellant materials in the presence of damage has beenthe objective of several other investigations in the past 30 years. The model of Simo (1987) is a rigorous3-D finite-strain approach to the study of damage in a viscoelastic medium from a continuum mechanicsviewpoint. Swanson and Christensen (1983) presented a constitutive model in which a strain softening functionwas used to describe the viscoelastic response of a high elongation solid propellant expressed in the form of ahereditary integral. Francis and Thompson (1984) used the same softening function approach as Swanson andChristensen (1983) in order to address complex loading and unloading situations, but their constitutive modelrequires a large number (four) of calibration experiments. Ozupek and Becker (1992) combined these two modelsto simulate finite-strain uniaxial response of a high elongation polyethyleneglycol/nitroglycerin (PEG/NG) solid
oxidizer particle
void
fuel particle
binder
Fig. 1. Schematic of a solid propellant microstruture. Voids can form by dewetting at oxidizer particles.
ARTICLE IN PRESSF. Xu et al. / J. Mech. Phys. Solids 56 (2008) 2050–20732052
propellant. The model employs a softening function, determined experimentally, to account for the effect ofdamage on the deviatoric response of the propellant and requires assumptions on the material compressibility.Following the damage approach of Schapery (1981, 1989), Ganzonas (1993) proposed a one-dimensional (1-D)nonlinear viscoelastic constitutive model to describe the mechanical behavior of a solid propellant in thepresence of microcrack growth. To address the issue of volume dilatation upon straining, the effect ofsuperposed pressure, and the cyclic response of propellants in multiaxial stressing for the Space Shuttleredesigned solid rocket motor, Ozupek and Becker (1997) introduced a new version of their constitutiveviscoelastic model based on phenomenological descriptions of dilatation and free energy functions to account fordamage. A calibration of a number of parameters is required prior to using the model for numerical simulationpredictions. A modification of this model in order to be used in finite element simulations was done by Cangaet al. (2001). These researchers considered that the presence of voids affected the volumetric response byreducing the bulk modulus, softened the deviatoric response which was described by means of a damagefunction, and affected the dissipation work on cyclic loading through another cyclic loading function.A constitutive model based on the work of Simo (1987) and similar to that of Ozupek and Becker (1992, 1997)was introduced by Jung and Youn (1999). This model accounts for dewetting by allowing for a decrease in theviscoelastic modulus due to dewetting. Jung et al. (2000) extended this model by modifying the damage functionparameters in order to better describe cyclic loading. In the last two models, the critical condition for dewettingand hence the calculation of the related modulus softening response is based on the work of Farber and Farris(1987) and Vratsanos and Farris (1993a, b) which addresses dewetting in pure elastic media and withoutconsidering the complex deformation fields upon dewetting.
Studying the response of solid propellants (e.g., HTPB/ammonium perchlorate) under high strain-ratesranging between 103 and 104 s�1, Ho (2002) used a softening pre-multiplier to describe 1-D nonlinearviscoelastic response. He assumed that this parameter was a function of strain rate and recoverabledeformation energy which he determined from loading/unloading data in uniaxial tension. Ho claims that hisrecoverable energy approach is better than the Swanson and Christensen (1983) and Francis and Thompson(1984) approaches in which damage was introduced in the constitutive law as a function of stress. Based onextensive experiments, Matheson and Nguyen (2005) developed a viscoelastic damage model to simulate thenonlinear behavior of a solid propellant material under different loading conditions. The model is basically aMaxwell-type one in which the constitutive parameters are treated as functions of time and damage. Themodel predicts successfully tensile response under both high and low strain rates and quite well the Taylor test.A constitutive law for the small-strain response of a porous viscoelastic solid under 3-D triaxial stress stateshas been proposed recently by Xu et al. (2007). The model was calibrated through the shear relaxation test andused to predict the response of a solid propellant whose damage during straining was simulated by thepresence of changing porosity. For the behavior under cycling loading, the model reproduces the loadingresponse observed in the experiments of Ozupek and Becker (1997), but it does not capture the nonlinearfeatures of the response upon unloading.
Matous and Geubelle (2006) studied particle dewetting at a unit cell comprising of one or four hyperelasticparticles embedded in a hyperelastic particle-reinforced matrix whose constitutive behavior was foundby the Mori–Tanaka homogenization scheme. The particle–matrix interface was described by a cohesivelaw. The simulations indicated that even after complete debonding the presence of the particles continue toimpart stiffness in the material. Tan et al. (2005a) devised an experimental method to analyze a compacttension specimen and extract the microscale cohesive law for the particle/matrix interface of high explosivePBX9501 by using the extended Mori–Tanaka method (Mori and Tanaka, 1973) to homogenize the compositematerial response. The cohesive law was then used to study the effect of interfacial debonding on themechanical behavior of particulate composites under hydrostatic tension and uniaxial tension conditions (Tanet al., 2005b, 2007). The results show that small particles tend to stiffen the composite wehereas large particlescause softening. The research also identified a critical particle radius that separates these two regimes ofbehavior.
An interesting piece of work that couples experimental measurements with a modeling approach thataccounts for the underlying phenomenological mechanisms of deformation and material constitution is thework by Trumel et al. (2001a, b). Investigating the response of a solid propellant in compression under variouspaths of static and dynamic loading, Trumel et al. (2001a) found that particle dewetting and crushed grains is
ARTICLE IN PRESSF. Xu et al. / J. Mech. Phys. Solids 56 (2008) 2050–2073 2053
the prevalent mode of damage which reduces the macroscopic stiffness of the material in both tension andcompression tests. Trumel et al. (2001a, b) developed a viscoelastoplastic compaction model to characterizeboth static and dynamic response through a thermodynamic potential function. A scalar function of the firstinvariant of the viscoplastic strain was used to describe the compaction and damage-related dilatancy due toparticle–matrix debonding (Trumel et al., 1996, 2001a, b). Compared with static and dynamic experimentaldata from 1-D and 2-D cases, the model yielded satisfactory predictions and captured important aspects of thematerial behavior such as rate-dependence, hardening and softening, and dilatation. In the case of asimulation of dynamic penetration of the material, the model predicted a maximum temperature increase by40 1C due to the inelastic energy dissipation. However, Ravichandran and Liu (1995) point out that thistreatment via a thermodynamic potential might underestimate the dependence of bulk modulus onparticle–matrix debonding.
Lastly, we would like to mention the statistical crack mechanics (SCRAM) model of Dienes et al. (2006)which describes the dynamic response and local heating due to friction at crack surfaces of energetic materials,such as explosives and solid propellants. In this model, damage is described by the formation of penny-shapedcracks and the analytical solution for the deformation fields of these cracks is used to describe the damagecomponent of the total deformation rate tensor. Issues such as crack orientation, growth and coalescence, andnonlinear elastoplastic behavior of the matrix material are accounted for. The model predictions in uniaxialtension are in good agreement with the experiment. The model was also used to predict hot spot generation inhigh explosives under dynamic impact.
The discussion above indicates that the majority of the existing models are based on a number ofphenomenological constants and functions of deformation characteristics to describe the effect of damageseparately on the deviatoric and volumetric response of a propellant. Use of the models requires in some casescalibration of these parameters and interestingly enough, some models introduced for uniaxial tension requirethat they be modified when applied to multiaxial stress situations. Further, some models fail to reproduce thematerial response when massive damage accumulation leads to severe drop in the macroscopic loads (stresses).The objective of this work is to study the response of a solid propellant as affected by damage by using arigorous solid mechanics methodology. The goal is to suggest a general 3-D constitutive model with physicallyjustified and easy to determine fitting parameters and capable of accounting for the evolution of themicrostructure with straining. The development of the model is based on some recent advances of rigoroushomogenization theory for nonlinear viscous composites (Ponte Castaneda, 1991; Suquet, 1995, 1996a, b,1997).
Standard notation is used throughout. Boldface symbols denote tensors the order of which is indicated bythe context. All tensor components are written with respect to a fixed Cartesian co-ordinate system, and thesummation convention is used for repeated Latin indices. A superscript T indicates the transpose of a second-order tensor, a superposed dot the material time derivative, and the subscripts s and a the symmetric and anti-symmetric parts of a second-order tensor. Let A, B be second-order tensors, and C a fourth-order tensor; thefollowing products are used in the text A:B ¼ AijBij, ðA � BÞij ¼ AikBkj , ðABÞij ¼ AijBkl , ðC : AÞij ¼ CijklAkl ,and ðA : CÞij ¼ AklCklij. The inverse C�1 of a fourth-order tensor that has the ‘‘minor’’ symmetriesCijkl ¼ Cjikl ¼ Cijlk is defined so that C : C�1 ¼ C�1 : C ¼ I, where I is the symmetric fourth-order identitytensor with Cartesian components I ijkl ¼ ð1=2Þðdikdjl þ dildjkÞ, dij being the Kronecker delta.
2. Constitutive modeling
A solid propellant is a composite material with evolving volume fractions of the individual phases. Asdescribed in the introduction, a solid propellant consists of a polymeric matrix, oxidizer particles, metal fuelparticles, and some other additives for improved bonding and burning (schematic in Fig. 1). From amechanical behavior perspective, each of these phases exhibits a complex constitutive response. The binder is arubbery material that behaves viscously, the oxidizer is predominantly elastic in comparison to the elastomericbinder, and the fuel particles are elastoplastic. Upon straining, large oxidizer particles debond from the matrixand interfacial microcracks or holes are forming as shown schematically in Fig. 1.
We will assume that once dewetting at an oxidizer/matrix interface commences a void forms in the place ofthe debonded oxidizer particle. Thus, the debonded particle will be treated as a hole in the propellant. For the
ARTICLE IN PRESSF. Xu et al. / J. Mech. Phys. Solids 56 (2008) 2050–20732054
case of ‘‘pop-loose’’ decohesion, the replacement of an oxidizer particle by a void is not an unrealisticassumption as dewetting takes place over almost the entire interface. Of course, the presence of the oxidizerparticle inside the void does restrain the subsequent growth of the void, but we will assume in our model thatthe void is capable of growing as if no oxidizer particle were present. Thus, from the constitutive modelingpoint of view, the material is essentially a three-phase composite that consists of (i) the polymeric bindermatrix, (ii) the particles (fuel and oxidizer), and (iii) the voids. For the purposes of modeling, the matrix isassumed to be incompressible linear-elastic viscoplastic, and the particles rigid. Although we do notdistinguish between oxidizer and fuel particles, we assume that voids nucleate only at oxidizer particles whosevolume fraction is smaller than the total volume fraction of particles. Once nucleated, the voids can grow orclose in accordance with the viscous deformation of the surrounding material.
We consider a ‘‘representative volume element’’ (RVE) of the composite with total volume V, and let(Vm, Vp, Vv) denote the volumes of the matrix, particles, and voids in the RVE so that V ¼ Vm+Vp+Vv. Thevolume fractions of the matrix, particles, and voids are, respectively,
cm ¼Vm
V; cp ¼ r ¼
V p
V; cv ¼ f ¼
V v
V, (1)
so that f+r+cm ¼ 1. We also define the volume fraction of the particles relative to the matrix as
r0 ¼V p
V m þ V p
¼r
1� f. (2)
The parameter r0 denotes the volume fraction of particles in the particle-reinforced binder.The total deformation rate in the composite is written as the sum of an elastic and a viscous part:
D ¼ De þDv. (3)
The additive split of Eq. (3) is based on the assumption that the elastic and viscous parts can be treatedindependently and its mechanical analog is the well-known Maxwell model of a spring and a dashpot in series.It must be emphasized though that this is, in general, only an approximation for composite materials. Forexample, Suquet (1985) demonstrated rigorously that the macroscopic deformation rate of a composite madeof nonlinear Maxwell-type phases has a ‘‘long memory’’ term, i.e., the deformation rate of the homogenizedmedium cannot be written in the form of Eq. (3), even though the response of the individual phases isconsistent with Eq. (3). In fact, as we discuss in Section 2.4, we believe that this is one of the reasons that a‘‘back stress’’ is required to improve the predictions of our model, which is based on the Maxwell-type additivesplit of Eq. (3).
In the following we discuss in detail the constitutive equations for the individual parts of D, and theevolution equations of the volume fractions cm, r, f of the phases as the microstructure evolves upon straining.
2.1. Elastic constitutive relations
The elastic response of the incompressible matrix phase is described by a hypoelastic equation of the form
Dem ¼Me
m : rr; Me
m ¼1
2mm
K; J ¼1
3d d; K ¼ I� J, (4)
where r is the true (Cauchy) stress tensor, rr¼ _rþ r �W�W � r is Jaumann or co-rotational derivative,W the
spin tensor, mm the elastic shear modulus of the matrix, d and I are the second- and symmetric fourth-orderidentity tensors, with Cartesian components dij (the Kronecker delta) and I ijkl ¼ ð1=2Þðdikdjl þ dildjkÞ.
The elastic homogenization process is carried out in two successive steps (Bonnenfant et al., 1998):
(i)
effective behavior of the matrix containing rigid particles; (ii) effective behavior of the homogenized particle-reinforced matrix in (i) above containing voids.Step I: The Hashin–Shtrikman (1963) lower bound is known to provide an accurate estimate for two-phasecomposites with the most compliant material occupying the matrix phase. When phase ‘‘1’’ is designated as the
ARTICLE IN PRESSF. Xu et al. / J. Mech. Phys. Solids 56 (2008) 2050–2073 2055
compliant phase, the corresponding estimates take the form
mhom ¼P2
i¼1ðcimiÞ=ð6miðk1 þ 2m1Þ þ m1ð9k1 þ 8m1ÞÞP2j¼1ðcjÞ=ð6mjðk1 þ 2m1Þ þ m1ð9k1 þ 8m1ÞÞ
; khom ¼P2
i¼1ðcikiÞ=ð3ki þ 4m1ÞP2j¼1cj=ð3kj þ 4m1Þ
, (5)
where (mhom, khom) are the shear and bulk moduli of the homogenized material, ci the volume fractions,and (mi,ki) the shear and bulk moduli of the phases. In our case, m1 ¼ mm, k1 ¼ k2 ¼ m2 ¼N, c1 ¼ 1� r0 ¼ð1� f � rÞ=ð1� f Þ, and c2 ¼ r0 ¼ r=ð1� f Þ, so that
mhom ¼2� 2f þ 3r2ð1� f � rÞ
mm; khom ¼ 1. (6)
Step II: The Hashin–Shtrikman (1963) upper bound is known to provide an accurate estimate for two-phasecomposites with the stiffest material occupying the matrix phase. When phase ‘‘2’’ is the stiffest one, thecorresponding estimates take the form
m ¼P2
i¼1cimi=ð6miðk2 þ 2m2Þ þ m2ð9k2 þ 8m2ÞÞP2j¼1cj=ð6mjðk2 þ 2m2Þ þ m2ð9k2 þ 8m2ÞÞ
; k ¼P2
i¼1ciki=ð3ki þ 4m2ÞP2j¼1cj=ð3kj þ 4m2Þ
, (7)
where ðm; kÞ are the shear and bulk moduli of the homogenized material. In our case, phase ‘‘1’’ is the voids,and phase ‘‘2’’ is the homogenized particle-reinforced matrix in Step I, so that m1 ¼ k1 ¼ 0, m2 ¼ mhom,k2 ¼ khom ¼N, c1 ¼ f, and c2 ¼ 1�f. Then, Eq. (7) imply that
k ¼ amm; m ¼ bmm (8)
with
a ¼2ð1� f Þð2� 2f þ 3rÞ
3f ð1� f � rÞ; b ¼
9f
4ð3þ 2f Þa. (9)
The elastic part of the constitutive law for the three-phase composite is of the form
De ¼Me : rr; Me ¼
1
2mKþ
1
3kJ. (10)
It should be noted that the hypoelastic form (10) is consistent, to leading order, with hyperelastic behaviorbecause the elastic strains are small relative to the plastic strains (Needleman, 1985). Note that, even thoughthe matrix material is incompressible ðk2 ¼ khom ¼ 1Þ, due to the presence of the voids, the homogenizedcontinuum is compressible, i.e., k takes a finite value.
2.2. Viscous constitutive equations
In order to determine the viscous response of the solid propellant material, we use a homogenizationtechnique for nonlinear composite materials introduced by Ponte Castaneda (1991, 1992, 1996).
We proceed with a brief description of the variational procedure. Consider a representative volume element(RVE) V of the composite material, where the size of the inhomogeneities is small compared to that of V. Thecomposite is made up of N homogenous phases V(r), r ¼ 1,y,N with volume fractions c(r). The mechanicalbehavior of each phase ‘‘r’’ is described by a viscous potential of the form cðrÞ ¼ cðrÞðseÞ, so that
DvðrÞ ¼qcðrÞ
qr¼ _�
vðrÞN ¼
1
2yðrÞs (11)
with
N ¼3
2se
s; _�vðrÞ¼
qcðrÞ
qse
; yðrÞ ¼1
mðrÞ¼
3_�vðrÞ
se
¼3
se
qcðrÞ
qse
, (12)
where DvðrÞ is the viscous part of the deformation rate of phase r, s the deviatoric part of the stress tensor r,yðrÞ ¼ 1=mðrÞ the viscous shear compliance that depends on the von Mises equivalent stress se ¼
ffiffiffiffiffiffiffiffiffiffiffiffiffiffiffiffiffiffiffið3=2Þs : s
p,
m(r) is the viscous shear modulus, and �vðrÞ the equivalent viscous strain.
ARTICLE IN PRESSF. Xu et al. / J. Mech. Phys. Solids 56 (2008) 2050–20732056
For a given stress state r, the variational procedure involves three steps (deBotton and Ponte Castaneda,1993; Suquet, 1995, 1996a, b):
1.
1
the
A linear theory providing an expression for MhomðyÞ ¼ ð1=3kðyÞÞJþ ð1=2mðyÞÞK and its partial derivativeswith respect to y(r), where y is the collection y ¼ (y(1),y, y(N)) and y(r) ¼ 1/m(r).1 The compliance tensorMhom (y) defined above corresponds to a linear composite with given phase compliances y ¼ (y(1),y, y(N)).
2.
The resolution of 2N nonlinear problems for the 2N unknowns (y(r), se(r)):yðrÞ ¼3
sðrÞe
qcðrÞðsðrÞeq Þ
qsðrÞe
; sðrÞe ¼
ffiffiffiffiffiffiffiffiffiffiffiffiffiffiffiffiffiffiffiffiffiffiffiffiffiffiffiffiffiffiffiffiffiffiffiffiffiffiffiffi3
cðrÞs :
qMhomðyÞ
qyðrÞ: s
s. (13)
3.
Once the 2N nonlinear problems (13) are solved and ðyðrÞ;sðrÞe Þ are found, MhomðyÞ is evaluated and theoverall deformation rate is finally given byDv ¼MhomðyÞ : r ¼p
3kðyÞdþ
1
2mðyÞs, (14)
where p ¼ skk=3 is the hydrostatic stress. It should be noted that if all N phases are incompressible, thenk ¼ 1 and MhomðyÞ ¼ ð1=2mðyÞÞK; however, if one of the phases corresponds to ‘‘void’’ space, then k isfinite and the composite is compressible.
Suquet (1995, 1996a, b) made the observation that the term on the right-hand side of Eq. (13b) could beidentified with the second moment of the stress field in the so-called ‘‘linear comparison composite.’’ Thisprovided a new interpretation of the variational method of Ponte Castaneda in terms of a modification of theearlier ‘‘secant method,’’ which made use of the first moment of the stress field in the above-mentioned linearcomparison composite (Ponte Castaneda and Suquet, 1998).
In our three-phase composite material the values of mðyÞ and kðyÞ to be used in Eq. (14) are given by Eqs. (8)and (9) derived for the corresponding linear material in Section 2.1.
The viscous shear moduli to be used in Eqs. (8) and (9) for the rigid (particles) and void phases take thevalues N and 0, respectively, and one needs to determine only the proper value of mm to be used in Eqs. (8)and (9). This value of mm is determined from Eq. (13) as follows: Substitution of Eqs. (8) and (9) in Eq. (14)yields
Dv ¼1
mm
p
3adþ
1
2bs
� �. (15)
Equation (13) takes now the form
sðmÞe ¼
ffiffiffiffiffiffiffiffiffiffiffiffiffiffiffiffiffiffiffiffiffiffiffiffiffiffiffiffiffiffiffiffiffiffiffiffiffiffiffiffiffiffiffi3
1� r� f
p2
aþ
s2e3b
� �s;
1
mm
¼3
sðmÞe
qcmðsðmÞe Þ
qsðmÞe
, (16)
where a superscript or a subscript m refers to the matrix material. When the viscous potential Cm for thematrix material is known, Eqs. (14) and (16) define the viscous deformation rate Dv for a given stress state r.
For our problem, we choose for the matrix Cm(r) so that
_�m ¼qcm
qse
¼ _�0 AsðmÞe
s0þ B
sðmÞ2
e
s20
!p
ð�mÞ�q, (17)
where A, B, p, and q are material constants, and �m ¼R t
0_�m dt, t being time. The special case in which the strain
rate _�m in Eq. (17) is independent of the accumulated viscous strain em (i.e., q ¼ 0) corresponds to what isknown as ‘‘stationary’’ creep. Note that at a given state of the material the homogenization procedure relates
If all N phases are incompressible, then k ¼ 1 and MhomðyÞ ¼ ð1=2mðyÞÞK; however, if one of the phases corresponds to ‘‘void’’ space,
n k is finite and the composite is compressible.
ARTICLE IN PRESSF. Xu et al. / J. Mech. Phys. Solids 56 (2008) 2050–2073 2057
Dv to the current stress r; the equivalent viscous strain in the matrix em enters the homogenization procedureas a parameter that defines the hardening/softening state of the material.
Summarizing, we note that the constitutive equation for Dv can be written as
Dv ¼1
3_�vdþ _�eN; N ¼
3
2se
s, (18)
where
_�v ¼p
amm
; _�e ¼se
3bmm
; a ¼2ð1� f Þð2� 2f þ 3rÞ
3f ð1� f � rÞ; b ¼
9f
4ð3þ 2f Þa, (19)
mm ¼sðmÞe
3_�m
; sðmÞe ¼
ffiffiffiffiffiffiffiffiffiffiffiffiffiffiffiffiffiffiffiffiffiffiffiffiffiffiffiffiffiffiffiffiffiffiffiffiffiffiffiffiffiffiffi3
1� r� f
p2
aþ
s2e3b
� �s; _�m ¼ _�0 A
sðmÞe
s0þ B
sðmÞ2
e
s20
!p
ð�mÞ�q. (20)
2.3. Evolution of the phase volume fractions
In the absence of particle dewetting ð _V p ¼ 0Þ, the definition of r ¼ Vp=V yields _r ¼ �ðV p_V=V 2Þ ¼ �rDkk.
Similarly, f ¼ Vv=V implies that _f ¼ ð _Vv=V Þ � ðVv_V=V2Þ ¼ ð1� f ÞDkk. Since the presence of porosity can be
viewed as some kind of ‘‘damage’’ in the material and any changes in porosity and the volume of the matrixdue to elastic deformations are small and fully recoverable, it is assumed that changes in f and r are due to thevolumetric viscous deformation rate Dv
kk ¼ _�v only (as opposed to the total Dkk). Therefore, in the absence ofparticle dewetting, the evolution equations for f and r can be written as
_r ¼ �r_�v; _f ¼_V v
V�
V v_V
V2¼ ð1� f Þ_�v. (21)
However, as the material deforms, new voids nucleate by dewetting, thus increasing the void volumefraction (porosity) and decreasing the particle volume fraction as particles are turned into voids. To accountfor this void nucleation from the existing particles, equations for the void and particle volume fraction rates inEq. (21) are written as
_f ¼ ð1� f Þ_�v þ Zð�eÞ_�e; _r ¼ �r_�v � Zð�eÞ_�e, (22)
where the parameter Z denotes the amount of particles turned into voids per unit viscous strain ee and is sochosen that the nucleation strain follows a normal distribution with mean value eN and standard deviation sN
(Chu and Needleman, 1980) that controls the nucleation strain range:
Zð�eÞ ¼rN
sN
ffiffiffiffiffiffi2pp exp �
1
2
�e � �N
sN
� �2" #
, (23)
where rN being the volume fraction of void nucleating particles, i.e., the initial volume fraction of oxidizerparticles. Equation (23) dictates that the total volume fraction of particles that can decohere and turn intovoids during any straining course equals the amplitude of the Gaussian r0 which is the oxidizer volumefraction. It should be mentioned that Eq. (23) describes a strain-controlled nucleation process in ductile metalsat the interface of hard inclusions or particles. The adoption of such an approach in the present work is basedon the SEM study of microcracked solid propellants of Cornwell and Schapery (1975) who maintain thatcavities in a solid propellant are not unlike those seen around hard particles in a metal–matrix just beforefailure.
2.4. A viscous model with back stress
As will be demonstrated in Section 4.1, the constitutive model developed in Section 2.2 cannot describeaccurately the mechanical behavior of solid propellants in uniaxial tension at different strain rates. In order to
ARTICLE IN PRESSF. Xu et al. / J. Mech. Phys. Solids 56 (2008) 2050–20732058
improve the model, we introduce a ‘‘deviatoric back stress’’ a and replace the stress deviator in Eqs. (18)–(20)by the difference s�a.
The constitutive model presented in the following has formal similarities with the ‘‘kinematic hardening’’models used in the time-independent idealization of plasticity in order to describe the behavior of the materialunder reversed or cyclic loading. It is emphasized though that in the present model the motivation for theintroduction of the back stress a is not the modeling of the Bauschinger effect or the response under cyclicloads; instead, a is introduced in order to describe accurately the ‘‘transient’’ (or ‘‘non-stationary’’) viscousresponse of the material (see Section 4.1 below). A similar approach has been used successfully in the past inorder to model the non-stationary creep of metal–matrix composites reinforced by continuous elastic fibers, inwhich a is identified with the stress carried by the fibers (e.g., McLean, 1985; Cheng and Aravas, 1997). Theuse of back stress models in viscoplasticity is discussed in detail by Rice (1970), who shows that the usualviscoelastic laws that involve hereditary integrals can be stated equivalently in terms of a back stress model.
The modified model now reads as follows:
Dv ¼1
3_�vdþ _�eN; N ¼
3
2Se
R; R ¼ s� a; Se ¼
ffiffiffiffiffiffiffiffiffiffiffiffiffiffi3
2SijSij
r, (24)
where
_�v ¼p
amm
; _�e ¼Se
3bmm
; a ¼2ð1� f Þð2� 2f þ 3rÞ
3f ð1� f � rÞ; b ¼
9f
4ð3þ 2f Þa, (25)
mm ¼sðmÞe
3_�m; _�m ¼ _�0 A
sðmÞe
s0þ B
sðmÞ2
e
s20
!p
ð�mÞ�q; sðmÞe ¼
ffiffiffiffiffiffiffiffiffiffiffiffiffiffiffiffiffiffiffiffiffiffiffiffiffiffiffiffiffiffiffiffiffiffiffiffiffiffiffiffiffiffiffi3
1� r� f
p2
aþ
S2e
3b
� �s. (26)
The evolution equation for a is
ar¼ Hð�eÞD
v0 � Rð�eÞ_�ea (27)
with
Hð�eÞ ¼ H0 1þ�e
�0
� �n
(28)
and
Rð�eÞ ¼ R0 1þ�e
�0
� �m
, (29)
where Dv0 ¼ _�eN is the deviatoric part of Dv, the two power-law functions H and R control the magnitude ofthe ‘‘hardening’’ and ‘‘dynamic recovery’’ terms, respectively, e0 is a reference strain, and n and m are,respectively, the corresponding powers of hardening and recovery terms.
2.5. The plastic spin
When a back stress is used in a viscoplastic model, one has to distinguish between the continuum spin W
and the substructural spin x ¼W�Wp, where Wp is the so-called ‘‘plastic spin,’’ i.e., the spin of thesubstructure relative to the continuum (Dafalias, 1987, 1988, 1990). In back stress models, the orientation ofthe substructure is defined by the eigenvectors of a (Lee et al., 1983) and a constitutive equation for thesubstructural spin x (or, equivalently, for the plastic spin Wp) is provided (Aravas, 1994; Dafalias, 1998).A common expression for the plastic spin in such problems is
Wp ¼ hð�eÞða � s� s � aÞ. (30)
Note that the plastic spin is a measure of the non-co-axiality of s and a, in the sense that Wp vanishes if andonly is s and a are co-axial (same principal directions). The physical reasoning behind assigning constitutiveequations for the plastic spin for back stress models is discussed in detail by Aravas (1994).
ARTICLE IN PRESSF. Xu et al. / J. Mech. Phys. Solids 56 (2008) 2050–2073 2059
The rate used in the hypoelastic equation (10) and the evolution equation of the back stress (27) is now co-rotational with the substructure, i.e.,
De ¼Me : ro; a
o¼ Hð�eÞD
v0 � Rð�eÞ_�ea, (31)
where the notation Ao
¼ _Aþ A � x� x � A is used, and x ¼W�Wp. The last equations can be written interms of the Jaumann derivatives as follows:
De ¼Me : rr�Me : ðr �Wp �Wp � rÞ (32)
or
rr¼ Le : De þ r �Wp �Wp � r, (33)
where Le ¼ ðMeÞ�1, and
ar¼ Hð�eÞD
v0 � Rð�eÞ_�eaþ a �Wp �Wp � a. (34)
3. Numerical implementation
In a finite element environment, the solution is developed incrementally and the constitutive equations areintegrated numerically at the element Gauss integration points. In a displacement-based finite elementformulation the solution is deformation driven. Let F denote the deformation gradient tensor. At a givenGauss point, the solution ðFn;rn;an; f n;rn; �mjnÞ at time tn as well as the deformation gradient Fn+1 at timetnþ1 ¼ tn þ Dt are known and the problem is to determine ðrnþ1;anþ1; f nþ1; rnþ1; �mjnþ1Þ.
The time variation of the deformation gradient F during the time increment ½tn; tnþ1� can be written as
FðtÞ ¼ DFðtÞ � Fn ¼ RðtÞ �UðtÞ � Fn; tnptptnþ1, (35)
where R(t) and U(t) are the rotation and right stretch tensors associated with DF(t). The correspondingdeformation rate D(t) and spin W(t) tensors can be written as
DðtÞ � ½ _FðtÞ � F�1ðtÞ�s ¼ ½D _FðtÞ � DF�1ðtÞ�s, (36)
WðtÞ � ½ _FðtÞ � F�1ðtÞ�a ¼ ½D _FðtÞ � DF�1ðtÞ�a, (37)
where the subscripts s and a denote the symmetric and anti-symmetric parts, respectively, of a tensor.If it is assumed that the Lagrangian triad associated with DF(t) (i.e., the eigenvectors of U(t)) remains fixed
in the time interval [tn, tn+1], it can be shown readily that
DðtÞ ¼ RðtÞ � _EðtÞ � RTðtÞ; WðtÞ ¼ _RðtÞ � RTðtÞ (38)
and
rrðtÞ ¼ RðtÞ � _rðtÞ � RTðtÞ; a
rðtÞ ¼ RðtÞ � _aðtÞ � RTðtÞ, (39)
where EðtÞ ¼ ln UðtÞ is the logarithmic strain associated with the increment, and
rðtÞ ¼ RTðtÞ � rðtÞ � RðtÞ; aðtÞ ¼ RTðtÞ � aðtÞ � RðtÞ. (40)
It is noted that at the start of the increment (t ¼ tn):
DFn ¼ Rn ¼ Un ¼ d; rn ¼ rn; an ¼ an; En ¼ 0, (41)
whereas at the end of the increment (t ¼ tn+1):
DFnþ1 ¼ Fnþ1 � F�1n ¼ Rnþ1 �Unþ1 ¼ known; Enþ1 ¼ ln Unþ1 ¼ known: (42)
Then, over the time interval [tn, tn+1], the constitutive equations can be written in the form:
_E ¼ _Eeþ _E
v, (43)
ARTICLE IN PRESSF. Xu et al. / J. Mech. Phys. Solids 56 (2008) 2050–20732060
_r ¼ Le : _Eeþ hð2r � a � r� r2
� a� a � r2Þ, (44)
_Ev¼
1
3_�vdþ _�eN; N ¼
3
2Se
R; R ¼ s� a; Se ¼
ffiffiffiffiffiffiffiffiffiffiffiffiffiffi3
2SijSij
r, (45)
_a ¼ Hð�eÞ _Ev0
� Rð�eÞ_�eaþ hða2� sþ s � a2
� 2a � s � aÞ, (46)
where
_�v ¼p
amm
; _�e ¼Se
3bmm
; a ¼2ð1� f Þð2� 2f þ 3rÞ
3f ð1� f � rÞ; b ¼
9f
4ð3þ 2f Þa, (47)
mm ¼sðmÞe
3_�m; _�m ¼ _�0 A
sðmÞe
s0þ B
sðmÞ2
e
s20
!p
ð�mÞ�q; sðmÞe ¼
ffiffiffiffiffiffiffiffiffiffiffiffiffiffiffiffiffiffiffiffiffiffiffiffiffiffiffiffiffiffiffiffiffiffiffiffiffiffiffiffiffiffiffi3
1� r� f
p2
aþ
S2e
3b
� �s. (48)
The evolution of the volume fractions of the phases is given by
_f ¼ ð1� f Þ_�v þ Zð�eÞ_�e; _r ¼ �r_�v � Zð�eÞ_�e. (49)
The co-rotational rates rrand a
rin the original equations are now replaced by the usual material time
derivatives _r and _a. This is a consequence of the assumption that the Lagrangian triad associated with DF
remains fixed in the time interval [tn, tn+1] so that W ¼ _R � RT, which implies in turn that rr¼ R � _r � RT. It
should be noted that the aforementioned assumption on the Lagrangian triad is less ‘‘severe’’ than the usualassumption of ‘‘constant strain rate’’ over the time increment.
Equation (43) can be integrated exactly:
DE ¼ DEe þ DEv, (50)
where the notation DA ¼ Anþ1 � An is used.In order to simplify the calculations, we use a forward Euler scheme for the numerical integration of the
evolution equations of the volume fractions Eq. (49):
f nþ1 ¼ f n þ ð1� f nÞD�vjn þ Zð�ejnÞD�ejn � f ¼ known, (51)
rnþ1 ¼ rn � rnD�vjn � Zð�ejnÞD�ejn � r ¼ known, (52)
cmjnþ1 ¼ 1� rnþ1 � f nþ1 ¼ known (53)
with
D�vjn ¼ Dtp
amm
� �n
; D�ejn ¼ DtSe
3bmm
� �n
. (54)
We also determine
anþ1 ¼2ð1� f nþ1Þð2� 2f nþ1 þ 3rnþ1Þ
3f nþ1ð1� f nþ1 � rnþ1Þ¼ known; bnþ1 ¼
9f nþ1
4ð3þ 2f nþ1Þanþ1 ¼ known: (55)
For the numerical integration of the elasticity Eq. (44), and the evolution equation for the back stressequation (46), a forward Euler scheme is used in the form
rnþ1 ¼ re � Len : DE
v þ hnð2rn � an � rn � r2n � an � an � rnÞDt, (56)
where re ¼ rn þ Len : DE ¼ known is the ‘‘elastic predictor,’’ and
anþ1 ¼ an þHnDEv0 � RnD�ean � hnð2an � sn � an � a2n � sn � sn � a
2nÞ. (57)
ARTICLE IN PRESSF. Xu et al. / J. Mech. Phys. Solids 56 (2008) 2050–2073 2061
A backward Euler scheme is used for the integration of the flow rule, and the evolution equation of em:
DEv ¼1
3D�v dþ D�e Nnþ1;
D�m
Dt¼ _�0 A
sðmÞe
s0
����nþ1
þ BsðmÞe
s0
����2
nþ1
!r
ð�mjn þ D�mÞ�q (58)
with
Nnþ1 ¼3
2Sejnþ1Snþ1; Snþ1 ¼ snþ1 � anþ1; Sejnþ1 ¼
ffiffiffiffiffiffiffiffiffiffiffiffiffiffiffiffiffiffiffiffiffiffiffiffiffiffiffiffiffiffi3
2Sijjnþ1Sijjnþ1
r, (59)
D�v ¼pnþ1
ammjnþ1Dt; D�e ¼
Sejnþ1
3bmmjnþ1Dt; mmjnþ1 ¼
sðmÞe jnþ1
3_�mjnþ1, (60)
sðmÞe jnþ1 ¼
ffiffiffiffiffiffiffiffiffiffiffiffiffiffiffiffiffiffiffiffiffiffiffiffiffiffiffiffiffiffiffiffiffiffiffiffiffiffiffiffiffiffiffiffiffiffiffiffi3
cmjnþ1
p2nþ1
anþ1þ
Sej2nþ1
3bnþ1
� �s. (61)
It should be noted that both the forward and backward Euler schemes are ‘‘first-order’’ methods. However,use of the forward Euler method for the integration of the ‘‘flow rule’’ limits the size of the time increment thatcan be used, especially in problems where the principal directions of stress rotate substantially over anincrement. Integration of the flow rule via the backward Euler method allows for the use of more reasonabletime increments (Kailasam et al., 2000; Aravas and Ponte Castaneda, 2004).
We treat DEv as the primary unknown, and use the flow rule as the basic equation for its determination:
FðDEvÞ ¼ DEv �pnþ1
3anþ1mmjnþ1dþ
1
2bnþ1mmjnþ1ðsnþ1 � anþ1Þ
� �Dt ¼ 0. (62)
In the last equation, all quantities on the right-hand side are determined in terms of DEv:
rnþ1ðDEvÞ ¼ re � Len : DE
v þ hn½rn � ðan � sn � sn � anÞ � ðan � sn � sn � anÞ � rn�Dt, (63)
pnþ1ðDEvÞ ¼ 1
3rnþ1 : d; snþ1ðDEvÞ ¼ rnþ1 � pnþ1d, (64)
DEv0 ðDEvÞ ¼ DEv � 13ðDEv : dÞd; D�eðDEvÞ ¼
ffiffiffiffiffiffiffiffiffiffiffiffiffiffiffiffiffiffiffiffiffiffiffiffi23DEv0 : DEv0
q, (65)
anþ1ðDEvÞ ¼ an þHnDEv0 � Rn D�e an � hnð2an � sn � an � a2n � sn � sn � a
2nÞ, (66)
Sejnþ1ðDEvÞ ¼
ffiffiffiffiffiffiffiffiffiffiffiffiffiffiffiffiffiffiffiffiffiffiffiffiffiffiffiffiffiffiffiffiffiffiffiffiffiffiffiffiffiffiffiffiffiffiffiffiffiffiffiffi3
2ðsij � aijÞnþ1ðsij � aijÞnþ1
r; sðmÞe jnþ1ðDE
vÞ ¼
ffiffiffiffiffiffiffiffiffiffiffiffiffiffiffiffiffiffiffiffiffiffiffiffiffiffiffiffiffiffiffiffiffiffiffiffiffiffiffiffiffiffiffiffiffiffiffi3
cmjnþ1
p2nþ1
anþ1þ
Sej2nþ1
3bnþ1
� �s, (67)
D�mðDEvÞ
Dt¼ _�0 A
sðmÞe
s0
����nþ1
þ BsðmÞe
s0
����2
nþ1
!r
ð�mjn þ D�mðDEvÞÞ�q, (68)
�mjnþ1ðDEvÞ ¼ �mjn þ D�mðDEvÞ; _�mjnþ1ðDE
vÞ ¼D�m
Dt; mmjnþ1ðDE
vÞ ¼sðmÞe
��nþ1
3_�mjnþ1. (69)
Equation (62) is solved for DEv by using Newton’s method. In the process of iteration for a given DEv, alocal Newton loop is used to solve Eq. (68) for D�m.
Once DEv is found, rn+1 and an+1 are computed from
rnþ1 ¼ Rnþ1 � rnþ1 � RTnþ1; anþ1 ¼ Rnþ1 � anþ1 � R
Tnþ1, (70)
which completes the integration process.

ARTICLE IN PRESSF. Xu et al. / J. Mech. Phys. Solids 56 (2008) 2050–20732062
4. Applications
The constitutive model developed in the previous sections is implemented in the ABAQUS general purposefinite element program (Hibbitt, 1977). This code provides a general interface so that a particular constitutivemodel can be introduced as a ‘‘user interface.’’ The integration of the constitutive equations is carried outusing the algorithm presented in Section 3. The finite element formulation is based on the weak form of themomentum balance, the solution is carried out incrementally, and the discretized nonlinear equations aresolved using Newton’s method. The Jacobian of the equilibrium Newton-loop requires the so-called‘‘linearization moduli’’ of the algorithm, which are reported in Xu (2008).
Since there are no available experimental data yet for stress states in which the stress tensor is not co-axialwith the back stress, we assume in the following that h ¼ 0 in Eq. (30), i.e., Wp
¼ 0. It is emphasized thoughthat, when such data become available, the effects of the plastic spin can be accounted for as described inSection 2.5.
4.1. Uniaxial tension and shear relaxation
As specific data from a real-world solid propellant were not available, we assumed that the initial value ofthe volume fraction of particles (oxidizer and fuel) was r0 ¼ 0.715 and the initial volume fraction of theoxidizer particles, i.e., those particles in the model that could turn into voids upon straining, was rN ¼ 0.615.These numbers correspond to an initial volume fraction for the fuel equal to 0.100. We also assumed that thepropellant had a small amount of an initial porosity f0 ¼ 0.01 which in a real-world material can be attributedto long-term chemical reactions. It is well known that propellants stored for a long time experiencedegradation from chemical changes in their microstructure (Sutton, 1986).
The viscous model for the uniaxial strain rate-stress equation (17) for the matrix, the two parameters eN, andsN in the statistical model of Eq. (23) for particle dewetting, and the ‘‘hardening’’ and ‘‘recovery’’ functions inthe back stress evolution Eq. (27) were calibrated by matching the model predictions with experimental data ofOzupek and Becker (1992) from solid propellant uniaxial tension tests under constant strain rate and shearrelaxation tests. This calibration yielded mm ¼ 0.39MPa for the elastic shear modulus of the matrix;_�0 ¼ 1:0 s�1, s0 ¼ 1:0MPa, A ¼ 0.1, B ¼ 7.5, p ¼ 3.75, q ¼ 2.5 for the matrix viscous response; eN ¼ 0.3, andsN ¼ 0.2 for the characteristics of particle dewetting; and two sets of constants for the ‘‘hardening’’ and‘‘recovery’’ rate parameters in the evolution of the back stress: (i) H0 ¼ 0.22MPa, e0 ¼ 1.0, n ¼ 0.3, R0 ¼ 5,and m ¼ 0, (ii) H0 ¼ 0.22MPa, e0 ¼ 1.0, n ¼ 0, R0 ¼ 0, and m ¼ 0. Set (i) represents nonlinear ‘‘hardening’’rate with constant ‘‘recovery’’ rate and set (ii) constant ‘‘hardening’’ rate with no ‘‘recovery.’’ These choicesfor the hardening and recovery forms which are discussed below gave the best fit to the experimental data.
Fig. 2 compares the model predictions with the data of Ozupek and Becker (1992) in uniaxial tension atseveral strain rates. The stress S in response to four constant applied engineering strain rates is plotted as afunction of the logarithmic strain E. Given the wide range of loading rates, one may deem the predictionsquite acceptable for both sets of hardening and recovery parameters.
It should be emphasized that, if no back stress is used (H0 ¼ 0, R0 ¼ 0), then the predictions of the model donot agree with the experimental data. One of the reasons for this difficulty is the use of the additive split of Eq.(3), which is based on the assumption that the elastic and viscous deformation rates can be treatedindependently. Use of the back stress improves substantially the predictions of the model and accounts, in asense, for the evolution of the microstructure as the material deforms. As mentioned in Section 2.4 above, theuse of the back stress in this case is not related to the Bauschinger effect of any cyclic loading; instead, it is usedto model the ‘‘transient’’ (non-‘‘steady-state’’) creep of the composite.
Fig. 3 shows the comparison of the model performance in shear with shear relaxation data. The shear stressS12 was calculated in response to an imposed constant shear strain E12 on the element. The modelunderestimates the shear relaxation modulus GðtÞ ¼ S12ðtÞ=E12 at small times t and overestimates it for large t.The source of this difference is identified again with the additive Maxwell-type decomposition D ¼ De+Dv
and the creep Eq. (17) used to describe the nonlinear viscous response of the matrix material. The experimentaldata (Ozupek and Becker, 1992) show that G(t) approaches a constant value at large times, whereas allMaxwell-type models are such that G(t) vanishes asymptotically as t-N.
ARTICLE IN PRESS
Time (s)
Sh
ea
r re
lax
ati
on
mo
du
lus
(M
Pa
)
10-5 10-4 10-3 10-2 10-1 100 101 102 103 1040.5
1
1.5
2
2.5
3
Σ12, E12
2
1a
a
Fig. 3. Comparison of model predictions in shear relaxation with back stress characterized by (a) H0 ¼ 0.22MPa, n ¼ 0.3, R0 ¼ 5.0, and
m ¼ 0.0 (dash line); (b) H0 ¼ 0.22MPa, n ¼ 0.0, R0 ¼ 0.0, and m ¼ 0.0 (solid line). Superposed data points are corresponding
experimental data.
Strain
Str
es
s (
MP
a)
0 0.1 0.2 0.3 0.4 0.50
0.2
0.4
0.6
105/min
3.7/min
0.25/min
0.025/min
Σ, E
L
Fig. 2. Comparison of model predictions in uniaxial tension tests at constant strain rates of 105, 3.7, 0.25, and 0.025min�1 with back
stress characterized by (a) H0 ¼ 0.22MPa, n ¼ 0.3, R0 ¼ 5.0, and m ¼ 0.0 (solid lines); (b) H0 ¼ 0.22MPa, n ¼ 0.0, R0 ¼ 0.0, and m ¼ 0.0
(dash lines). Superposed data points are corresponding experimental data.
F. Xu et al. / J. Mech. Phys. Solids 56 (2008) 2050–2073 2063
The interplay between the relative magnitudes of the hardening and recovery terms in the evolution of theback stress and its effect on the uniaxial tension response is explored in Figs. 4 and 5 under constant strain rateof 105min�1. For a given constant recovery rate described by m ¼ 0 and R0 ¼ 5.0, Fig. 4 clearly shows thatthe hardening exponent n in Eq. (28) controls the hardening response at large strains, as expected. As n
increases from 0 to 1, the hardening rate varies from constant, H0, to linear, H0ð1þ �e=�0Þ. It seems that the

ARTICLE IN PRESS
Strain
Str
ess (
MP
a)
0 0.1 0.2 0.3 0.40
0.1
0.2
0.3
0.4
0.5
0.6
0.7
0.8 Lines are model predictions
Data points are experimental results
n=1.0
n=0.0
n=0.3
n=0.5
Σ, E
Fig. 4. Parametric study of the effect of hardening exponent n on the stress response in uniaxial tension test at constant strain rate of
105min�1: H0 ¼ 0.22MPa, R0 ¼ 5.0, and m ¼ 0.
Strain
Str
es
s (
MP
a)
0 0.1 0.2 0.3 0.40
0.2
0.4
0.6
0.8 Lines are model predictions
Data points are experimental results
m=1.0
m=0.5
m=0.2
m=0.0
Σ, E
Fig. 5. Parametric study of the effect of recovery exponent m on the stress response in uniaxial tension test at constant strain rate of
105min�1: H0 ¼ 0.22MPa, n ¼ 0.3, and R0 ¼ 5.0.
F. Xu et al. / J. Mech. Phys. Solids 56 (2008) 2050–20732064
combination of constant hardening and recovery rates does well in reproducing the experimental data exceptat very large strains (40.35) at which it seems that it cannot continue to successfully counter the softening dueto dewetting. Thus the combination of the nonlinear hardening rate, H0 ¼ 0.22MPa, n ¼ 0.3, with constantrecovery is deemed as a better choice for the overall response. Fig. 5 shows the effect of recovery rate on theuniaxial response under the given nonlinear hardening rate: H0 ¼ 0.22MPa, n ¼ 0.3. Clearly, at large strains,large recovery exponents are associated with predictions that are markedly softer than the experimental ones,
ARTICLE IN PRESS
Strain
Str
es
s (
MP
a)
Ba
ck
str
es
s (
MP
a)
0 0.1 0.2 0.3 0.4
0
0.2
0.4
0.6
0
0.05
0.1
0.15
0.2
Stress curves
Back stress curves
Σ,E,�
(�)
(�)
(�)
(�)
(�+�)
(�+�)
Complete model
Fig. 6. Predictions in uniaxial tension as influenced by the strain-dependent part of the matrix viscous response (cf. Eq. (17)) and the back
stress: curves (a) denote predictions in the presence of back stress but with no strain-dependent term; curves (e) predictions with strain-
dependent term and no back stress; curves (a+e) with strain-dependent term and back stress, that is, complete model. The simulations
were carried out with H0 ¼ 0.22MPa, n ¼ 0.0, R0 ¼ 0.0, and m ¼ 0.0. Superposed are experimental data under constant strain rate of
105min�1.
F. Xu et al. / J. Mech. Phys. Solids 56 (2008) 2050–2073 2065
and this is the reason that the choice of set (i) with constant recovery (m ¼ 0, R0 ¼ 5.0) was made for thecalibration of the model. Interestingly, as shown in Fig. 6, another calibration, that is, of constant hardeningrate with no recovery at all (n ¼ 0, H0 ¼ 0.22MPa, R0 ¼ 0) also does well in reproducing the experimentalresponse. For this reason and because of its simplicity, we adopted set (ii) of a constant hardening rate with no
recovery (n ¼ 0, H0 ¼ 0.22MPa, R0 ¼ 0) for the description of the evolution law for the back stress in all
subsequent calculations.
As has been discussed in Sections 2.2 and 2.4, two important ingredients of the present constitutive law are:(i) the suggested model of Eq. (17) for the viscous response of the matrix and (ii) the presence of a back stress,Eq. (27), to describe the change of the propellant microstructure with straining. In Eq. (17) the viscous strainrate of the matrix _�m depends on stress and is proportional to ð�mÞ
�q with q40. This type of dependence of _�mon em is known in the literature as ‘‘strain softening creep’’, since, for a given stress level, _�m decreases as em
increases. The results presented in Fig. 6 for the case of uniaxial tension response of the propellant at strainrate (105min�1) make it clear that, if no back stress is used, the predicted response at strains larger than 0.25 issofter than the experimentally observed, (curve (e) in Fig. 6). For this reason the back stress was incorporatedto impart the necessary counteracting hardening in the response at large strains. Introduction of the backstress brings the response of the propellant in line with the experiment for strains up to 0.4 (curve (a+e) inFig. 6). On the other hand, one cannot reproduce the experimental response through a constitutive law inwhich the strain-dependent term (em)
q in the response of the matrix is neglected altogether. Clearly, thepresence of a back stress alone in the constitutive law produces too stiff a response in particular at the earlystages of the deformation (curve (a) in Fig. 6).
The associated evolution of porosity f, particle volume fraction r, and dilatation ev upon straining predictedby the model in uniaxial tension is shown in Fig. 7. In Fig. 7a, f and r are plotted against the macroscopicstrain E at strain rates _E ¼ 105, 3.7, 0.25, and 0.025min�1. Before straining, the sum of the volume fractionsof particles and voids is r0 þ f 0 ¼ 0:725. At strain 0.4 and strain rate 0.025min�1, the corresponding sum r+f
is equal to 0.74. This difference of about 3% indicates that the porosity increase is mainly due to particledewetting (void nucleation) and is only slightly due to the enlargement of the voids by viscous deformation.Fig. 7b shows the macroscopic dilatation ev as a function of E and _E. At small strains (Eo0.1), the dilatation
ARTICLE IN PRESS
StrainD
ilata
tio
n
0 0.1 0.2 0.3 0.40
0.01
0.02
0.03
0.04
0.05
0.06
0.07
0.025/min
0.25/min
3.7/min
105/min
Strain
Vo
lum
e F
racti
on
0 0.1 0.2 0.3 0.40
0.1
0.2
0.3
0.4
0.5
0.6
0.7
0.8
0.025/min
105/min
3.7/min
0.25/min
Particle volume fraction ρ
Void volume fraction f
Σ, EΣ, E
Fig. 7. (a) Plot of the void volume fraction f and particle volume fraction r as a function of applied macroscopic strain in uniaxial tension
at various applied strain rates; (b) plot of the macroscopic dilatation. For both (a) and (b) the model parameters were: H0 ¼ 0.22MPa,
n ¼ 0.0, R0 ¼ 0.0, and m ¼ 0.0.
Time (sec)
Str
es
s (
MP
a)
0 500 1000 1500 2000 2500 30000
0.1
0.2
0.3
0.4
Model prediction
Experimental data
Σ, E
Fig. 8. Comparison of model prediction with experimental data in uniaxial tension under a complex loading path: the specimen was first
strained to macroscopic strain of 0.03 at constant strain rate 0.25min�1, then relaxed under strain 0.03 for 35min, then re-loaded to strain
0.5 at a constant strain rate of 0.25min�1, and lastly relaxed under strain 0.5 for 13min. The material data were: H0 ¼ 0.22MPa, n ¼ 0.0,
R0 ¼ 0.0, and m ¼ 0.0.
F. Xu et al. / J. Mech. Phys. Solids 56 (2008) 2050–20732066
is small because the void volume fraction is quite small and the propellant is nearly incompressible. At largerstrains, void growth induces macroscopic compressibility and this is also manifested in the strain ratedependence of the macroscopic dilatation.
Having explored the characteristics of the present model in uniaxial tension and shear relaxation, weinvestigated the model performance in more complex uniaxial straining situations. Fig. 8 shows the model
ARTICLE IN PRESS
Time (min)
Str
es
s (
MP
a)
0 50 100 1500
0.05
0.1
0.15
0.2
0.25
Model prediction
Experimental data
Σ,E
Fig. 9. Comparison of model prediction with experimental data in uniaxial tension under a complex loading path: The specimen was first
strained to macroscopic strain of 0.3 at constant strain rate 0.005min�1, then relaxed under strain 0.3 for 73min, and lastly unloaded at a
constant strain rate of 0.05min�1. The material data were: H0 ¼ 0.22MPa, n ¼ 0.0, R0 ¼ 0.0, and m ¼ 0.0.
F. Xu et al. / J. Mech. Phys. Solids 56 (2008) 2050–2073 2067
predictions compared with the experimental data of Ozupek and Becker (1992) over a path that involves:(i) application of a strain 0.03 at a constant strain rate 0.25min�1, (ii) stress relaxation under strain 0.03 for2100 s, (iii) re-straining to a strain 0.5 at a constant strain rate 0.25min�1, (iv) stress relaxation under strain0.5. Similarly Fig. 9 shows the comparison of the model predictions with the experiment under a path of:(i) application of a strain 0.3 at a rate 0.005min�1, (ii) stress relaxation under strain 0.3 for 73min, and(iii) complete unloading at a constant strain rate of 0.05min�1. Both Figs. 8 and 9 show that the modelpredictions compare with the experimental data of Ozupek and Becker (1992) satisfactorily. Again, during therelaxation stage, the presence of the strain-dependent term in the matrix response assists the relaxation processwhile the presence of the back stress holds the specimen from over-relaxing. The synergistic effect brings aboutthe optimum relaxation response as shown by the two figures.
4.2. Mechanical response of a compact tension fracture specimen
Measurement of the fracture toughness of solid propellant materials is a complex and yet unresolvedproblem. This is partly due to the lack of an adequate constitutive theory for the calculation of the stress andstrain fields ahead of a crack tip. Owing to the lack of such a theory, no parameters potentially descriptive ofthe crack tip fields have been identified. In fact, the open literature does not show a systematic attempt by thescientific community to come up with experimentally validated criteria for fracture of solid propellants underlarge straining. In other words, no intensive fracture mechanics effort similar to that made in the 70 and 80 sfor the establishment of the J-integral as a criterion for ductile fracture of metals and alloys has been mountedfor solid propellant materials. Also, specific testing details such as the identification of the location of a naturalcrack tip in a damaged solid propellant should not be overlooked as sources for the slow development offracture theories for solid propellant materials. Unlike the case of metallic systems in which a natural crack iseasily inserted through fatigue pre-cracking, propellant test-pieces may fail completely under such a similarprocess.
In this section, we use the constitutive theory we developed in this work to study the response of a compacttension fracture mechanics specimen. We demonstrate that the macroscopic response of the specimen maydepend on the loading path. The underlying issue here is the effect of pre-loading, possibly arising from crackintroduction, on the fracture response of solid propellant materials (Little and Rice, 2004). Through our
ARTICLE IN PRESS
w = 38 mm
a = 19 mm
δ
δ P
h =
23
mm
P
0rr
46 m
m A
P (N
/m)
B
C D
Time (h)
50
0 200 224
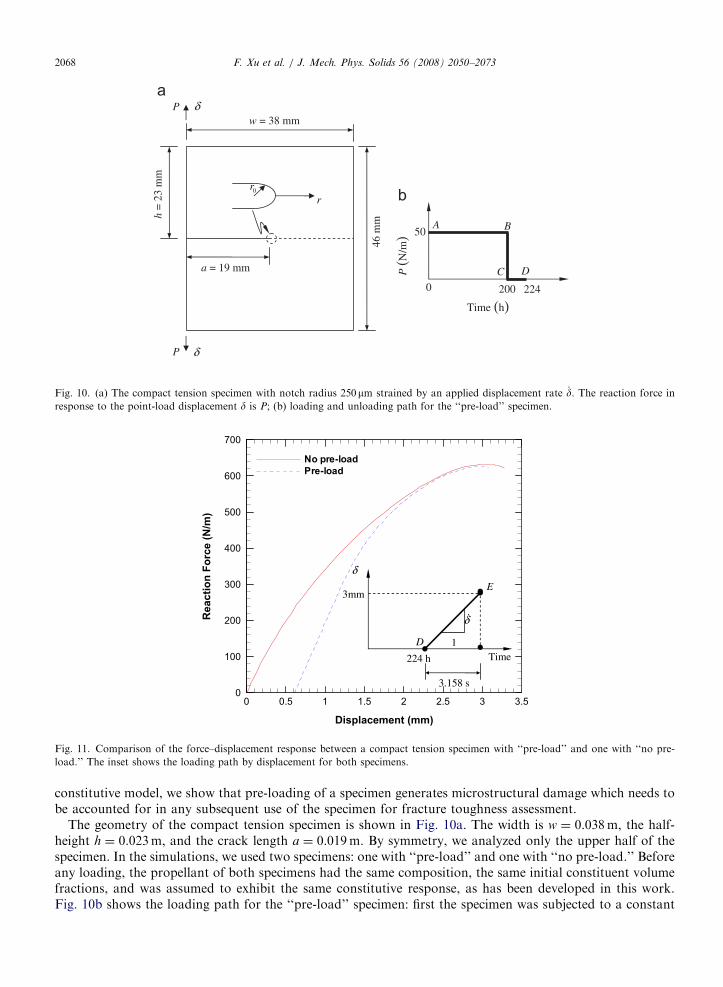
Fig. 10. (a) The compact tension specimen with notch radius 250mm strained by an applied displacement rate _d. The reaction force in
response to the point-load displacement d is P; (b) loading and unloading path for the ‘‘pre-load’’ specimen.
0 0.5 1 1.5 2 2.5 3 3.50
100
200
300
400
500
600
700
No pre-load
Pre-load
D
224 h
3.158 s
Time
3mm
1
δ &
δ E
Re
ac
tio
n F
orc
e (
N/m
)
Displacement (mm)
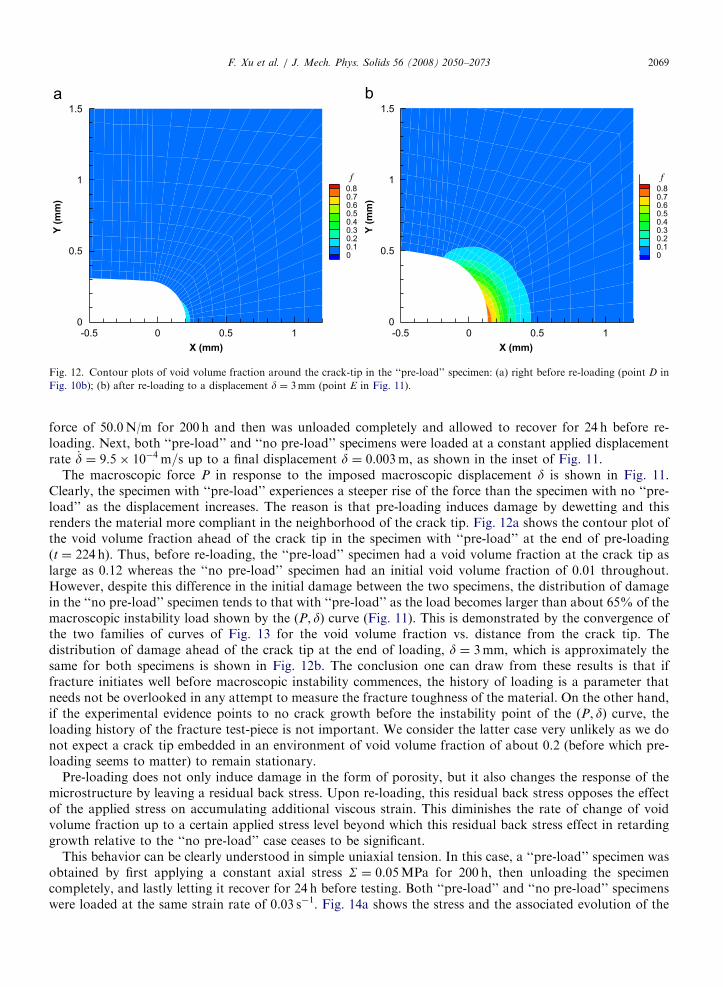
Fig. 11. Comparison of the force–displacement response between a compact tension specimen with ‘‘pre-load’’ and one with ‘‘no pre-
load.’’ The inset shows the loading path by displacement for both specimens.
F. Xu et al. / J. Mech. Phys. Solids 56 (2008) 2050–20732068
constitutive model, we show that pre-loading of a specimen generates microstructural damage which needs tobe accounted for in any subsequent use of the specimen for fracture toughness assessment.
The geometry of the compact tension specimen is shown in Fig. 10a. The width is w ¼ 0.038m, the half-height h ¼ 0.023m, and the crack length a ¼ 0.019m. By symmetry, we analyzed only the upper half of thespecimen. In the simulations, we used two specimens: one with ‘‘pre-load’’ and one with ‘‘no pre-load.’’ Beforeany loading, the propellant of both specimens had the same composition, the same initial constituent volumefractions, and was assumed to exhibit the same constitutive response, as has been developed in this work.Fig. 10b shows the loading path for the ‘‘pre-load’’ specimen: first the specimen was subjected to a constant
ARTICLE IN PRESS
X (mm) X (mm)
Y (
mm
)
-0.5 0 0.5 1 -0.5 0 0.5 10
0.5
1
1.5
Y (
mm
)
0
0.5
1
1.5
f0.80.70.60.50.40.30.20.10
f0.80.70.60.50.40.30.20.10
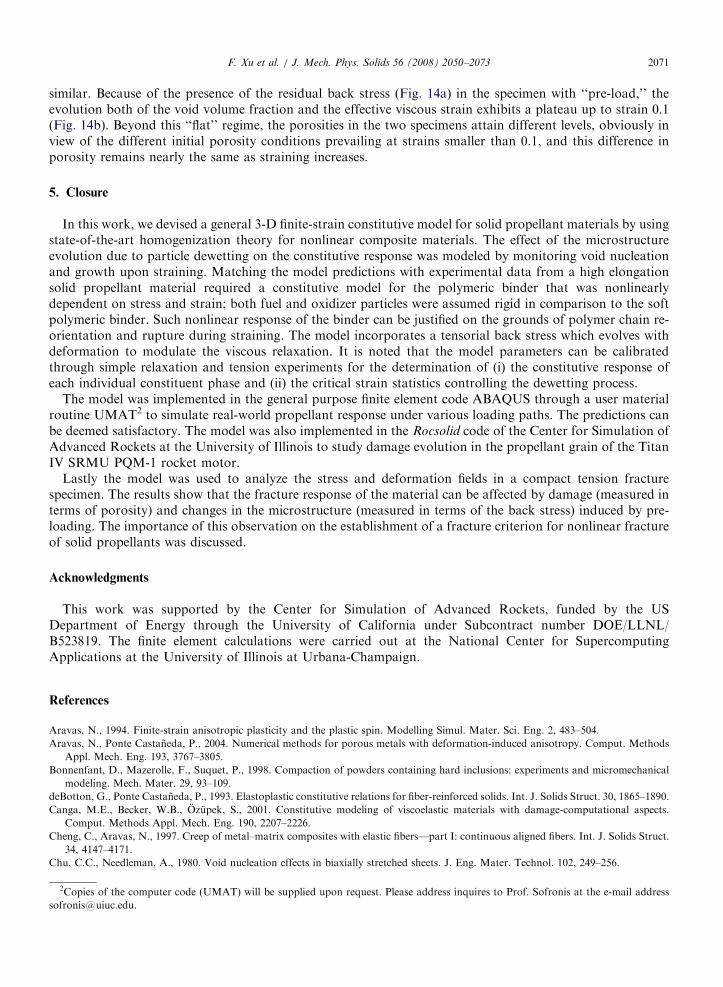
Fig. 12. Contour plots of void volume fraction around the crack-tip in the ‘‘pre-load’’ specimen: (a) right before re-loading (point D in
Fig. 10b); (b) after re-loading to a displacement d ¼ 3mm (point E in Fig. 11).
F. Xu et al. / J. Mech. Phys. Solids 56 (2008) 2050–2073 2069
force of 50.0N/m for 200 h and then was unloaded completely and allowed to recover for 24 h before re-loading. Next, both ‘‘pre-load’’ and ‘‘no pre-load’’ specimens were loaded at a constant applied displacementrate _d ¼ 9:5� 10�4 m=s up to a final displacement d ¼ 0.003m, as shown in the inset of Fig. 11.
The macroscopic force P in response to the imposed macroscopic displacement d is shown in Fig. 11.Clearly, the specimen with ‘‘pre-load’’ experiences a steeper rise of the force than the specimen with no ‘‘pre-load’’ as the displacement increases. The reason is that pre-loading induces damage by dewetting and thisrenders the material more compliant in the neighborhood of the crack tip. Fig. 12a shows the contour plot ofthe void volume fraction ahead of the crack tip in the specimen with ‘‘pre-load’’ at the end of pre-loading(t ¼ 224 h). Thus, before re-loading, the ‘‘pre-load’’ specimen had a void volume fraction at the crack tip aslarge as 0.12 whereas the ‘‘no pre-load’’ specimen had an initial void volume fraction of 0.01 throughout.However, despite this difference in the initial damage between the two specimens, the distribution of damagein the ‘‘no pre-load’’ specimen tends to that with ‘‘pre-load’’ as the load becomes larger than about 65% of themacroscopic instability load shown by the (P, d) curve (Fig. 11). This is demonstrated by the convergence ofthe two families of curves of Fig. 13 for the void volume fraction vs. distance from the crack tip. Thedistribution of damage ahead of the crack tip at the end of loading, d ¼ 3mm, which is approximately thesame for both specimens is shown in Fig. 12b. The conclusion one can draw from these results is that iffracture initiates well before macroscopic instability commences, the history of loading is a parameter thatneeds not be overlooked in any attempt to measure the fracture toughness of the material. On the other hand,if the experimental evidence points to no crack growth before the instability point of the (P, d) curve, theloading history of the fracture test-piece is not important. We consider the latter case very unlikely as we donot expect a crack tip embedded in an environment of void volume fraction of about 0.2 (before which pre-loading seems to matter) to remain stationary.
Pre-loading does not only induce damage in the form of porosity, but it also changes the response of themicrostructure by leaving a residual back stress. Upon re-loading, this residual back stress opposes the effectof the applied stress on accumulating additional viscous strain. This diminishes the rate of change of voidvolume fraction up to a certain applied stress level beyond which this residual back stress effect in retardinggrowth relative to the ‘‘no pre-load’’ case ceases to be significant.
This behavior can be clearly understood in simple uniaxial tension. In this case, a ‘‘pre-load’’ specimen wasobtained by first applying a constant axial stress S ¼ 0.05MPa for 200 h, then unloading the specimencompletely, and lastly letting it recover for 24 h before testing. Both ‘‘pre-load’’ and ‘‘no pre-load’’ specimenswere loaded at the same strain rate of 0.03 s�1. Fig. 14a shows the stress and the associated evolution of the

ARTICLE IN PRESSS
tre
ss
(M
Pa
)
Ba
ck
str
es
s (
MP
a)
Eff
ecti
ve v
isco
us s
train
0
0.05
0.1
0.15
0.2
0.25
0.3
0.35
0
0.05
0.1
0.15
0.2
0.25
0.3
0
0.05
0.04
0.03
0.02
0.01
Strain
Vo
id v
olu
me f
racti
on
0 0.05 0.1 0.15 0.2
Strain
0 0.05 0.1 0.15 0.20
0.08
0.06
0.04
0.02
0.1
0.12
Back stress �
Stress
f
�e
Σ, E, �
Σ, E
Fig. 14. Comparison of the uniaxial tension response between a specimen with ‘‘pre-load’’ (dash lines) and a specimen with ‘‘no pre-load’’
(solid lines): (a) applied stress S and back stress a; (b) void volume fraction f and effective viscous strain ee.
r (m)
Vo
id v
olu
me
fra
cti
on
0 0.0002 0.0004 0.0006 0.0008 0.001-0.1
0
0.1
0.2
0.3
0.4
0.5
0.6
0.7
0.8
at D
at � = 1.6mm
at E 224Hrs
3.158 s
time
3mm
1D
E
�
�
Fig. 13. Plot of the void volume fraction along the axis of symmetry ahead of the crak tip as a function of distance from the tip. The solid
line is for the specimen with ‘‘no pre-load’’ and the dash line is for the specimen with ‘‘pre-load.’’
F. Xu et al. / J. Mech. Phys. Solids 56 (2008) 2050–20732070
back stress in response to an applied strain. The corresponding effective viscous strain and void volumefraction are shown in Fig. 14b. Clearly the specimen with ‘‘pre-load’’ has a residual back stress which causesthe applied stress to differ (Fig. 14a) from that of the specimen with ‘‘no pre-load.’’ In fact, for strains greaterthan 0.1, the back stresses in the two microstructures equalize and the corresponding stresses tend to be
ARTICLE IN PRESSF. Xu et al. / J. Mech. Phys. Solids 56 (2008) 2050–2073 2071
similar. Because of the presence of the residual back stress (Fig. 14a) in the specimen with ‘‘pre-load,’’ theevolution both of the void volume fraction and the effective viscous strain exhibits a plateau up to strain 0.1(Fig. 14b). Beyond this ‘‘flat’’ regime, the porosities in the two specimens attain different levels, obviously inview of the different initial porosity conditions prevailing at strains smaller than 0.1, and this difference inporosity remains nearly the same as straining increases.
5. Closure
In this work, we devised a general 3-D finite-strain constitutive model for solid propellant materials by usingstate-of-the-art homogenization theory for nonlinear composite materials. The effect of the microstructureevolution due to particle dewetting on the constitutive response was modeled by monitoring void nucleationand growth upon straining. Matching the model predictions with experimental data from a high elongationsolid propellant material required a constitutive model for the polymeric binder that was nonlinearlydependent on stress and strain; both fuel and oxidizer particles were assumed rigid in comparison to the softpolymeric binder. Such nonlinear response of the binder can be justified on the grounds of polymer chain re-orientation and rupture during straining. The model incorporates a tensorial back stress which evolves withdeformation to modulate the viscous relaxation. It is noted that the model parameters can be calibratedthrough simple relaxation and tension experiments for the determination of (i) the constitutive response ofeach individual constituent phase and (ii) the critical strain statistics controlling the dewetting process.
The model was implemented in the general purpose finite element code ABAQUS through a user materialroutine UMAT2 to simulate real-world propellant response under various loading paths. The predictions canbe deemed satisfactory. The model was also implemented in the Rocsolid code of the Center for Simulation ofAdvanced Rockets at the University of Illinois to study damage evolution in the propellant grain of the TitanIV SRMU PQM-1 rocket motor.
Lastly the model was used to analyze the stress and deformation fields in a compact tension fracturespecimen. The results show that the fracture response of the material can be affected by damage (measured interms of porosity) and changes in the microstructure (measured in terms of the back stress) induced by pre-loading. The importance of this observation on the establishment of a fracture criterion for nonlinear fractureof solid propellants was discussed.
Acknowledgments
This work was supported by the Center for Simulation of Advanced Rockets, funded by the USDepartment of Energy through the University of California under Subcontract number DOE/LLNL/B523819. The finite element calculations were carried out at the National Center for SupercomputingApplications at the University of Illinois at Urbana-Champaign.
References
Aravas, N., 1994. Finite-strain anisotropic plasticity and the plastic spin. Modelling Simul. Mater. Sci. Eng. 2, 483–504.
Aravas, N., Ponte Castaneda, P., 2004. Numerical methods for porous metals with deformation-induced anisotropy. Comput. Methods
Appl. Mech. Eng. 193, 3767–3805.
Bonnenfant, D., Mazerolle, F., Suquet, P., 1998. Compaction of powders containing hard inclusions: experiments and micromechanical
modeling. Mech. Mater. 29, 93–109.
deBotton, G., Ponte Castaneda, P., 1993. Elastoplastic constitutive relations for fiber-reinforced solids. Int. J. Solids Struct. 30, 1865–1890.
Canga, M.E., Becker, W.B., Ozupek, S., 2001. Constitutive modeling of viscoelastic materials with damage-computational aspects.
Comput. Methods Appl. Mech. Eng. 190, 2207–2226.
Cheng, C., Aravas, N., 1997. Creep of metal–matrix composites with elastic fibers—part I: continuous aligned fibers. Int. J. Solids Struct.
34, 4147–4171.
Chu, C.C., Needleman, A., 1980. Void nucleation effects in biaxially stretched sheets. J. Eng. Mater. Technol. 102, 249–256.
2Copies of the computer code (UMAT) will be supplied upon request. Please address inquires to Prof. Sofronis at the e-mail address
ARTICLE IN PRESSF. Xu et al. / J. Mech. Phys. Solids 56 (2008) 2050–20732072
Cornwell, L.R., Schapery, R.A., 1975. SEM study of microcracking in strained solid propellant. Metallography 8, 445–452.
Dafalias, Y.F., 1987. Issues on the constitutive formulation at large elastoplastic deformations, part 1: kinematics. Acta Mech. 69,
119–138.
Dafalias, Y.F., 1988. Issues on the constitutive formulation at large elastoplastic deformations, part 2: kinetics. Acta Mech. 73, 121–146.
Dafalias, Y.F., 1990. The plastic spin in viscoplasticity. Int. J. Solids Struct. 26, 149–163.
Dafalias, Y.F., 1998. Plastic spin: necessity or redundancy? Int. J. Plasticity 14, 909–931.
Dienes, J.K., Zuo, Q.H., Kershner, J.D., 2006. Impact initiation of explosives and propellants via statistical crack mechanics. J. Mech.
Phys. Solids 54, 1237–1275.
Farber, J.N., Farris, R.J., 1987. Model for prediction of the elastic response of reinforced materials over wide ranges of concentration. J.
Appl. Pol. Sci. 34, 2093–2104.
Farris, R.J., 1968. The influence of vacuole formation on the response and failure of filled elastomers. Trans. Soc. Rheol. 12, 315–334.
Francis, E.C., Thompson, R.E., 1984. Nonlinear structural modeling of solid propellants. In: Proceedings of the AIAA/SAE/ASME joint
Propulsion Conference. AIAA, New York, pp. 1–5.
Ganzonas, G., 1993. A uniaxial nonlinear viscoelastic constitutive model with damage for M30 gun propellant. Mech. Mater. 15, 323–335.
Ha, K., Schapery, R.A., 1998. Three-dimensional viscoelastic constitutive model for particulate composites with growing damage and its
experimental validation. Int. J. Solids Struct. 35, 3497–3517.
Hashin, Z., Shtrikman, S., 1963. A variational approach to the theory of the elastic behavior of multiphase materials. J. Mech. Phys. Solids
11, 127–140.
Hibbitt, H.D., 1977. ABAQUS/EPGEN—a general purpose finite element code with emphasis in nonlinear problems. Nucl. Eng. 7,
271–297.
Hinterhoelzl, R.M., Shapery, R.A., 2004. FEM implementation of a three-dimensional viscoelastic constitutive model for particulate
composites with damage growth. Mech. Time-Dependent. Mater. 8, 65–94.
Ho, S.-Y., 2002. High strain-rate constitutive models for solid rocket propellants. J. Prop. Power 18, 1106–1111.
Jung, G-D., Youn, S-K., 1999. A nonlinear viscoelastic constitutive model of solid propellant. Int. J. Solids Struct. 36, 3755–3777.
Jung, G-D., Youn, S-K., Kim, B-K., 2000. A three-dimensional nonlinear viscoelastic constitutive model of solid propellant. Int. J. Solids
Struct. 37, 4715–4732.
Kailasam, M., Aravas, N., Ponte Castaneda, P., 2000. Porous metals with developing anisotropy: constitutive models, computational
issues and applications to deformation processing. Comput. Model. Eng. Sci. 1, 105–118.
Lee, E.H., Mallett, R.L., Wertheimer, T.B., 1983. Stress analysis for anisotropic hardening in finite-deformation plasticity. J. Appl. Mech.
50, 554–560.
Little, R.R., Rice, J.R., 2004. Further studies in solid propellant fracture toughness testing. In: Proceedings of the JANNAF 36th
Structures and Mechanical Behavior Subcommittee Meeting, CD-ROM, New Orleans, LA.
Matheson, E.R., Nguyen, D.Q., 2005. A rate-dependent viscoelastic damage model for simulation of solid propellant impacts. In: Furnish,
Elert, Rusell, White (Eds.), Shock Compression of Condensed Matter. American Institute of Physics, pp. 913–916.
Matous, K., Geubelle, P.H., 2006. Multiscale modeling of particle debonding in reinforced elastomers subjected to finite deformation. Int.
J. Numer. Mech. Eng. 65, 190–223.
McLean, M., 1985. Creep deformation of metal–matrix composites. Compos. Sci. Technol. 23, 37–52.
Mori, T., Tanaka, K., 1973. Average stress in matrix and average elastic energy of materials with misfitting inclusions. Acta Metall. 21,
571–574.
Needleman, A., 1985. On finite element formulations for large elastic–plastic deformations. Comput. Struct. 20, 247–257.
Ozupek, S., Becker, E.B., 1992. Constitutive modeling of high-elongation solid propellants. J. Eng. Mater. Technol. 114, 111–115.
Ozupek, S., Becker, E.B., 1997. Constitutive equations for solid propellants. J. Eng Mater. Technol. 119, 125–132.
Park, S.W., Schapery, R.A., 1997. A viscoelastic constitutive model for particulate composites with growing damage. Int. J. Solids Struct.
34, 931–947.
Ponte Castaneda, P., 1991. The effective mechanical properties of nonlinear isotropic solids. J. Mech. Phys. Solids 39, 45–71.
Ponte Castaneda, P., 1992. New variational principles in plasticity and their application to composite materials. J. Mech. Phys. Solids 40,
1757–1788.
Ponte Castaneda, P., 1996. Exact second-order estimates for the effective mechanical properties of nonlinear composites materials. J.
Mech. Phys. Solids 44, 827–862.
Ponte Castaneda, P., Suquet, P., 1998. Nonlinear composites. Adv. Appl. Mech. 34, 171–302.
Ravichandran, G., Liu, C.T., 1995. Modeling constitutive behavior of particulate composites undergoing damage. Int. J. Solids Struct. 32,
979–990.
Rice, J.R., 1970. On the structure of stress–strain relations for timed-dependent plastic deformation in metals. J. Appl. Mech. 37, 728–737.
Schapery, R.A., 1981. On viscoelastic deformation and failure behavior of composite materials with distributed flaws. In: Wang, S.S.,
Renton, W.L. (Eds.), 1981 Advances in Aerospace Structures and Materials. ASME, AD-01, New York, pp. 5–20.
Schapery, R.A., 1989. Models for the deformation of viscoelastic media with distributed damage and their applicability to ice. In:
Proceedings of the IUTAM/IAJR Symposium on Ice/Structure Interaction, Memorial University of Newfoundland, St John’s.
Schapery, R.A., 1990. Theory of mechanical behavior of elastic media with growing damage and other changes in structure. J. Mech. Phys.
Solids 38, 215–253.
Schapery, R.A., 1991. Analysis of damage growth in particulate composites using a work potential. Compos. Eng. 1, 167–182.
Simo, J.C., 1987. On a fully three-dimensional finite-strain viscoelastic damage model: formulation and computational aspects. Comput.
Methods Appl. Mech. Eng. 60, 153–173.
ARTICLE IN PRESSF. Xu et al. / J. Mech. Phys. Solids 56 (2008) 2050–2073 2073
Suquet, P., 1985. Elements of homogenization for inelastic solid mechanics. In: Sanchez–Palencia, Zaoui, A. (Eds.), Lecture Notes in
Physics, No 272, Homogenization Techniques for Composite Media. Springer–Verlag, New York, pp. 193–278.
Suquet, P., 1995. Overall properties of nonlinear composites: a modified secant moduli theory and its link with Ponte Castaneda’s
nonlinear variational procedure. C.R. Acad. Sci. Paris II b 320, 563–571.
Suquet, P., 1996a. Overall properties of nonlinear composites: remarks on secant and incremental formulations. In: Pineau, A., Zaoui, A.
(Eds.), Micromechanics of Plasticity and Damage of Multiphase Materials (IUTAM Symposium). Kluwer, Dordrecht, The
Netherlands, pp. 149–156.
Suquet, P., 1996b. Overall properties of nonlinear composites: secant moduli theories and variational bounds. In: Markov, K.Z. (Ed.),
Continuum Models of Discrete Systems (CMDS8 Symposium). World Scientific, Singapore, pp. 290–299.
Suquet, P., 1997. Effective properties of nonlinear composites. In: Suquet, P. (Ed.), ContinuumMicromechanics, ICMS No. 377. Springer,
Wien, New York, pp. 197–264.
Sutton, G.P., 1986. Rocket Propulsion Elements. Wiley, New York.
Swanson, S.R., Christensen, L.W., 1983. A constitutive formulation for high-elongation propellants. J. Spacecrafts Rockets 20, 559–566.
Tan, H., Liu, C., Huang, Y., Geubelle, P.H., 2005a. The cohesive law for the particle/matrix interfaces in high explosives. J. Mech. Phys.
Solids 53, 1892–1917.
Tan, H., Huang, Y., Liu, C., Geubelle, P.H., 2005b. The Mori–Tanaka method for composite materials with nonlinear interface
debonding. Int. J. Plasticity 21, 1890–1918.
Tan, H., Huang, Y., Liu, C., Ravichandran, G., Inglis, H.M., Geubelle, P.H., 2007. The uniaxial tension of particulate composite
materials with nonlinear interface debonding. Int. J. Solids Struct. 44, 1809–1822.
Trumel, H., Dragon, A., Fanget, A., 1996. A finite-strain elastic–plastic model for the quasi-static behavior of particulate composites. Int.
J. Eng. Sci. 34, 677–698.
Trumel, H., Dragon, A., Fanget, A., Lambert, P., 2001a. A constitutive model for the dynamic and high strain-pressure behavior of a
propellant-like material: Part I: experimental background and general structure of the model. Int. J. Numer. Anal. Methods Geomech.
25, 551–579.
Trumel, H., Dragon, A., Fanget, A., Lambert, P., 2001b. A constitutive model for the dynamic and high strain-pressure behavior of a
propellant-like material: Part II: model development and applications. Int. J. Numer. Anal. Methods Geomech. 25, 581–603.
Vratsanos, L.A., Farris, R.J., 1993a. A predictive model for the mechanical behavior of particulate composites, Part I: model derivation.
Pol. Eng. Sci. 33, 1458–1465.
Vratsanos, L.A., Farris, R.J., 1993b. A predictive model for the mechanical behavior of particulate composites, Part II: comparison of
model predictions to literature data. Pol. Eng. Sci. 33, 1466–1474.
Xu, F., 2008. Micromechanics approach to the study of constitutive response and fracture of solid propellant materials. Ph.D. Thesis,
University of Illinois at Urbana-Champaign, 2008.
Xu, F., Sofronis, P., Aravas, N., Meyer, S., 2007. Constitutive modeling of porous viscoelastic materials. Eur. J. Mech./A Solids 26,
936–955.


![Solid Propellant Autonomous DE-Orbit System [SPADES]](https://static.fdocuments.in/doc/165x107/620280c02fda4a4c6d4aa41e/solid-propellant-autonomous-de-orbit-system-spades.jpg)