Constantinos Balaras - Institute for Environmental Research & Sustainable Development, NOA
19
Building Refurbishment for Energy Efficiency - A Cost Effective National Energy Resource Group Energy Conservation, Institute for Environmental Research & Sustainable Development, National Observatory of Athens, Greece XX www.facebook.com/GRoupEnergyConservation Institute for Environmental Research & Sustainable Development www.meteo.noa.gr Group Energy conservation www.energycon.org National Observatory of Athens www.noa.gr C.A. Balaras Dr Mechanical Engineer, Research Director [email protected] E.G. Dascalaki, K.G. Droutsa, S. Kontoyiannidis Int. Symposium ERFC «Social Cooperatives for Energy Cost Reduction», REMIDA, Athens, 31 March, 2015
-
Upload
erfc -
Category
Environment
-
view
46 -
download
0
Transcript of Constantinos Balaras - Institute for Environmental Research & Sustainable Development, NOA

Building Refurbishment for Energy Efficiency - A Cost Effective National Energy Resource
Group Energy Conservation, Institute for Environmental Research & Sustainable Development, National Observatory of Athens, Greece
XX www.facebook.com/GRoupEnergyConservation
Institute for Environmental Research & Sustainable Development www.meteo.noa.gr
Group Energy conservation
www.energycon.org
National Observatory of Athens www.noa.gr
C.A. Balaras Dr Mechanical Engineer, Research Director
E.G. Dascalaki, K.G. Droutsa, S. Kontoyiannidis
Int. Symposium ERFC «Social Cooperatives for Energy Cost Reduction», REMIDA, Athens, 31 March, 2015

2
Final Energy Consumption: 1104.5 Mtoe
Buildings: 437.9 Mtoe (39.6%)
Residential: 289.2 Mtoe (26.2%)
Non-Residential: 148.7 Mtoe (13.5%)
Final Energy Consumption: 17.13 Mtoe
Buildings: 7.27 Mtoe (42.4%)
Residential : 5.04 Mtoe (29.4%)
Non-Residential: 2.23 Mtoe (13.0%)
Source: Eurostat pocketbooks, 2014
Int. Symposium ERFC «Social Cooperatives for Energy Cost Reduction», REMIDA, Athens, 31 March, 2015
Directives: Energy Efficiency (27/2012)
EPBD (31/2010)
RES (28/2009)
ECODESIGN (125/2009)
High energy-efficiency
Low carbon economy
Reduce energy import dependency
Increase security of supply
Targets:
2020 Reduce GHGs by 20%, Increase to 20% share of RES in
energy mixture, Increase by 20% energy savings
2030 Reduce GHGs by 40%, Increase to 27% share of RES in
energy mixture, Increase by 27% energy savings

Int. Symposium ERFC «Social Cooperatives for Energy Cost Reduction», REMIDA, Athens, 31 March, 2015 3

4 Int. Symposium ERFC «Social Cooperatives for Energy Cost Reduction», REMIDA, Athens, 31 March, 2015
?
INITIAL
PHASE
INITIAL
EVALUATION
DETAILED
EVALUATION
WORKS
DEFINITION
WORKS
PHASE
FINAL
PHASE
PROJECT
PHASE
PREPARATION
PHASE
The building is broken down to 50 structural and functional elements, with one or more types. For
each element, common deteriorations are grouped in four diagnosis codes; “a” (best condition,
no retrofit action needed) to code “d” (worst condition, replacement is necessary). Each code is
associated with specific renovation or refurbishment works.

5
TOBUS
XENIOS
EPIQR
Diagnosis, Deterioration of
building elements, Retrofit
scenarios, Assessment of IEQ &
Energy, Cost of refurbishment
INVESTIMMO
Deterioration & lifespan of different building
elements, environmental impact (e.g. use of
natural resources, pollutants) and indicators,
quality of life, total value of building
www.meteo.noa.gr/xenios
Int. Symposium ERFC «Social Cooperatives for Energy Cost Reduction», REMIDA, Athens, 31 March, 2015

Energy Conservation Measures (ECMs) Total CO2
emissions
savings in (kt)
#1. Thermal insulation of external walls 3573.6
#13. Solar collectors for sanitary hot water production 2709.7
#3. Weather proofing (sealing) of openings 1712.2
#4. Double glazing 1539.2
#5. Maintenance of central heating installations 951.4
#14. Energy efficient lamps 817.3
#2. Thermal insulation of roof 549.6
#6. Replacement of inefficient oil-boilers 438.6
#12. Replacement of old and inefficient local AC units 240.9
#8. Temperature balance controls for central space heating 156.8
#9. Space thermostats 146.9
#7. Replacement of inefficient oil-boilers with gas-boilers 144.0
#10. External shading 78.2
#11. Ceiling fans 93.0
CO2 emissions savings (kt)
ECM O/C H S HC
#1. Thermal insulation of external walls 54.1 48.7 54.0 52.8
#2. Thermal insulation of roof 10.9 12.0 9.5 10.5
#3. Double glazing 46.9 21.1 21.6 26.6
#4. Maintenance of central heating installations 137.5 59.5 23.4 34.8
#5. Replacement of inefficient oil-boilers 49.2 23.1 23.5 29.6
#6. Replacement of oil- boilers with gas-boilers 16.4 5.4 -- 18.7
#7. Temperature balance controls for central space heating 26.0 5.7 9.0 7.5
#8. Space thermostats 18.4 2.6 6.3 5.3
#9. External shading 49.6 21.1 21.6 26.6
#10. Ceiling fans 488.5 292.9 28.3 38.8
#11: Night ventilation. 53.9 -- -- --
#12: Solar collectors for sanitary hot water 15.3 133.4 1.5 45.9
#13: Energy efficient lamps. 713.1 369.0 148.2 106.2
#14: BMS - Building Management System. 815.1 423.5 -- 59.7
Offices/Commercial Hotels
Residential
Health Care Schools
HIGH
POTENTIAL
Source:
C.A. Balaras et al, European Residential Buildings and Empirical Assessment of the Hellenic Building Stock, Energy Consumption, Emissions & Potential Energy Savings, Building and Environment, Vol. 42, No 3, p. 1298-1314, 2007.
A.G. Gaglia et al, Empirical Assessment of the Hellenic Non-Residential Building Stock, Energy Consumption, Emissions and Potential Energy Savings, Energy Conversion and Management, Vol. 48, No 4, p. 1160-1175 , 2007. 6

7 Source:
K.G. Droutsa, et al., Ranking cost effective energy conservation measures for heating in Hellenic residential buildings, Energy & Buildings, Vol. 65, p. 318-332, (2014)
HIGH
POTENTIAL
Max Primary Energy Savings
EN
VE
LO
PE
E
/M S
YS
TE
MS
MFH SFH
Min Payback Period
SFH
Energy Savings & Payback Period
MFH

Challenges & Opportunities
How can we quantify them ?
Operational Energy
Performance Database
Calculations -
Simulations
Energy Balance
Sheets
9 Int. Symposium ERFC «Social Cooperatives for Energy Cost Reduction», REMIDA, Athens, 31 March, 2015

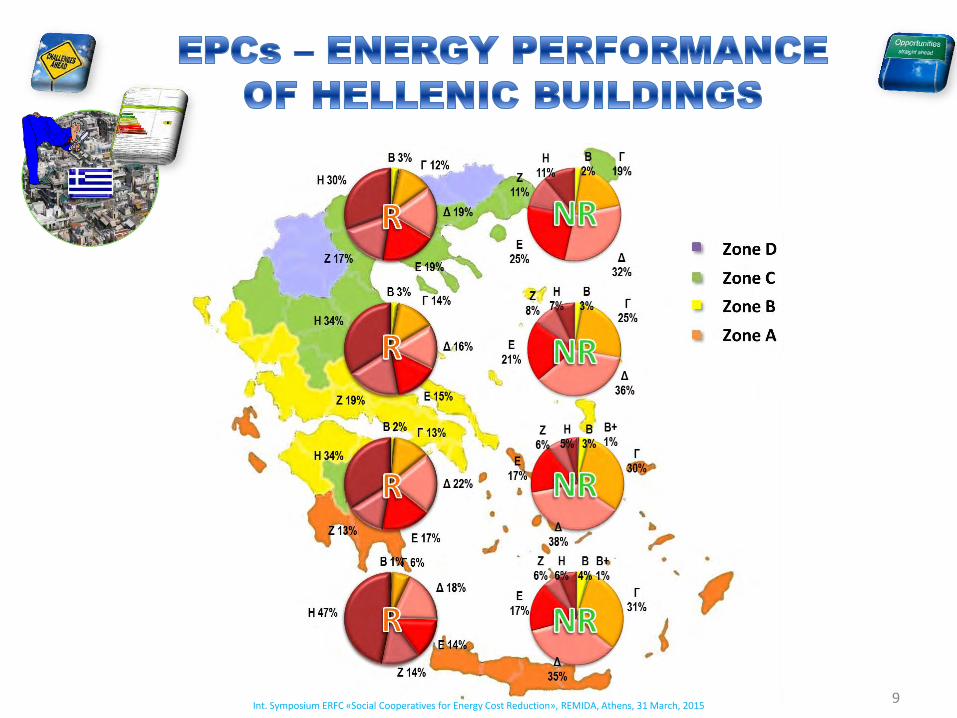
10
Energy Performance Indicator Tracking Schemes
for the Continuous Optimisation of Refurbishment Processes
in European Housing Stocks
www.episcope.eu
National building typologies
Indicators for rates of refurbishment
Indicators for the effectiveness of ECMs
Realistic models for assessing ECMs Methodology for
continuous monitoring of
energy performance
National Pilot Actions
Tool
Realistic assessment of
potential energy savings
Closing the gap between DESIGN - BUILT - REFURBISH - OPERATE
building performance
www.building-typology.eu
Int. Symposium ERFC «Social Cooperatives for Energy Cost Reduction», REMIDA, Athens, 31 March, 2015

11
Energy Performance Indicator Tracking Schemes
for the Continuous Optimisation of Refurbishment Processes
in European Housing Stocks
www.episcope.eu
ENERGY & BUILDINGS
BUILDING TYPOLOGIES
Int. Symposium ERFC «Social Cooperatives for Energy Cost Reduction», REMIDA, Athens, 31 March, 2015

12
Energy Performance Indicator Tracking Schemes
for the Continuous Optimisation of Refurbishment Processes
in European Housing Stocks
National Brochures-Energy advice
TABULA WEBTOOL http://webtool.building-typology.eu/webtool/tabula.html?c=all
EPISCOPE WEBTOOL New & Updated versions to be released soon
http://episcope.eu/building-typology/webtool
EPISCOPE BROCHURES New & Updated versions
http://episcope.eu/communication/download/
Int. Symposium ERFC «Social Cooperatives for Energy Cost Reduction», REMIDA, Athens, 31 March, 2015
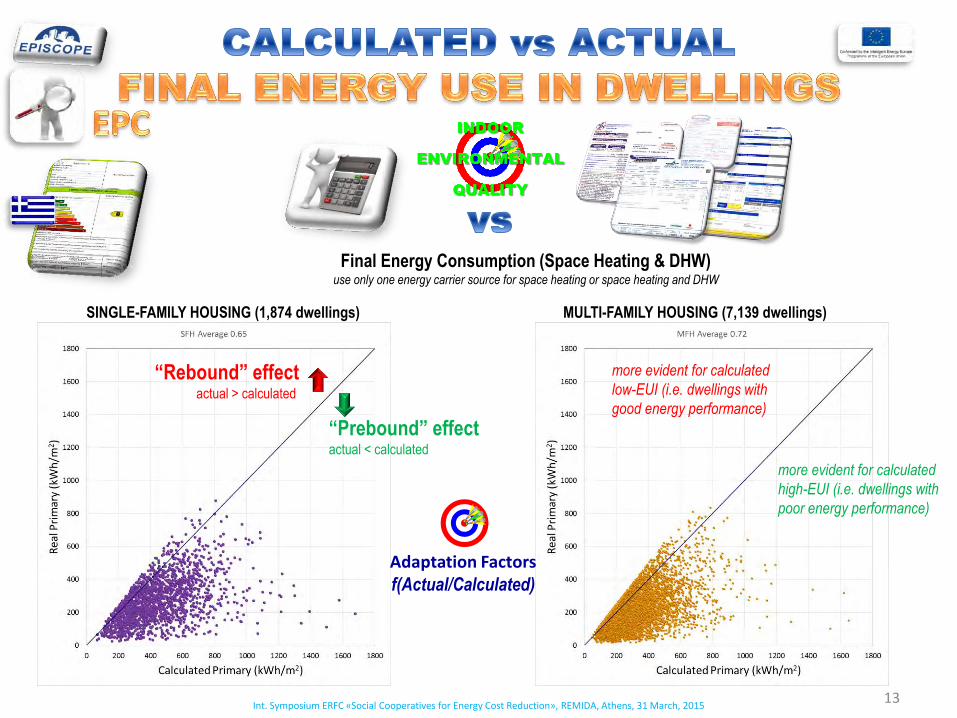
13
Final Energy Consumption (Space Heating & DHW) use only one energy carrier source for space heating or space heating and DHW
MULTI-FAMILY HOUSING (7,139 dwellings) SINGLE-FAMILY HOUSING (1,874 dwellings)
“Prebound” effect actual < calculated
“Rebound” effect actual > calculated
more evident for calculated
high-EUI (i.e. dwellings with
poor energy performance)
more evident for calculated
low-EUI (i.e. dwellings with
good energy performance)
Adaptation Factors f(Actual/Calculated)
Int. Symposium ERFC «Social Cooperatives for Energy Cost Reduction», REMIDA, Athens, 31 March, 2015

14
Adaptation Factors f(Actual/Calculated)
<8 hrs/day (71% SFH, 82% MFH)
Continuous (11% SFH, 8% MFH) Entire heated floor area (7% SFH, 17% MFH) 27% Dissatisfied
Int. Symposium ERFC «Social Cooperatives for Energy Cost Reduction», REMIDA, Athens, 31 March, 2015

15
2009 vs 08 2010 vs 09 2011 vs 10 2012 vs 11 2013 vs 12 Electricity -1.6% -3.1% -1.4% -0.5% +1.2% Natural Gas +27.6% +15.4% -0.9% -2.1% -3.2% Oil -20.4% -8.0% -10.1% -14.7% -46.1% Solid Fuels -17.9% +5.3% +1.1% +46.4% +20.7%
HDD 1434 1445 1342 1790 1655 1481
Int. Symposium ERFC «Social Cooperatives for Energy Cost Reduction», REMIDA, Athens, 31 March, 2015

16 Int. Symposium ERFC «Social Cooperatives for Energy Cost Reduction», REMIDA, Athens, 31 March, 2015
Calculated Primary (kWh/m2)
Esti
mat
ed A
ctu
al P
rim
ary
(kW
h/m
2)

17
BUILDING ENVELOPE Double Glazing Thermal insulation
PEU: Primary Energy Use; HDDR: Reference values; HDDA: Actual period of consumption
HEATING SYSTEMS & DHW Oil to Natural gas Oil to Heat pumps Replace burner Solar collectors
Adaptation Factors f(After/Before)
Int. Symposium ERFC «Social Cooperatives for Energy Cost Reduction», REMIDA, Athens, 31 March, 2015

Final energy: 5 Mtoe (2012) Savings 469ktoe (2016), 1933ktoe (cumulative 2015-20) (1% for 2014 & 2015, 1.25% for 2016 & 2017, 1.5% for 2018, 2019, 2020)
18
CO2 emissions: 12.3Mt (2005) -4% of 2005=11.8Mt (2020), -30% of 2005=8.6Mt(2030)
Int. Symposium ERFC «Social Cooperatives for Energy Cost Reduction», REMIDA, Athens, 31 March, 2015

19
It is time to Unleash the potential of energy conservation in buildings
Plan a realistic path forward (Use proper financing schemes, Inform-Engage-Facilitate stakeholders)
Int. Symposium ERFC «Social Cooperatives for Energy Cost Reduction», REMIDA, Athens, 31 March, 2015