Consortium Meeting Rotterdam 26 October 2012 - raingain.eu fileof the central wastewater treatment...
12
Leuven case study Consortium Meeting Rotterdam 26 October 2012 Johan Van Assel (Aquafin)
Transcript of Consortium Meeting Rotterdam 26 October 2012 - raingain.eu fileof the central wastewater treatment...
Leuven case study
Consortium Meeting Rotterdam 26 October 2012
Johan Van Assel (Aquafin)
Pilot location description: LEUVEN
- Location and environmental settings
- Urban pluvial flood risk problems and management objectives
- Characteristics of the drainage and monitoring systems.
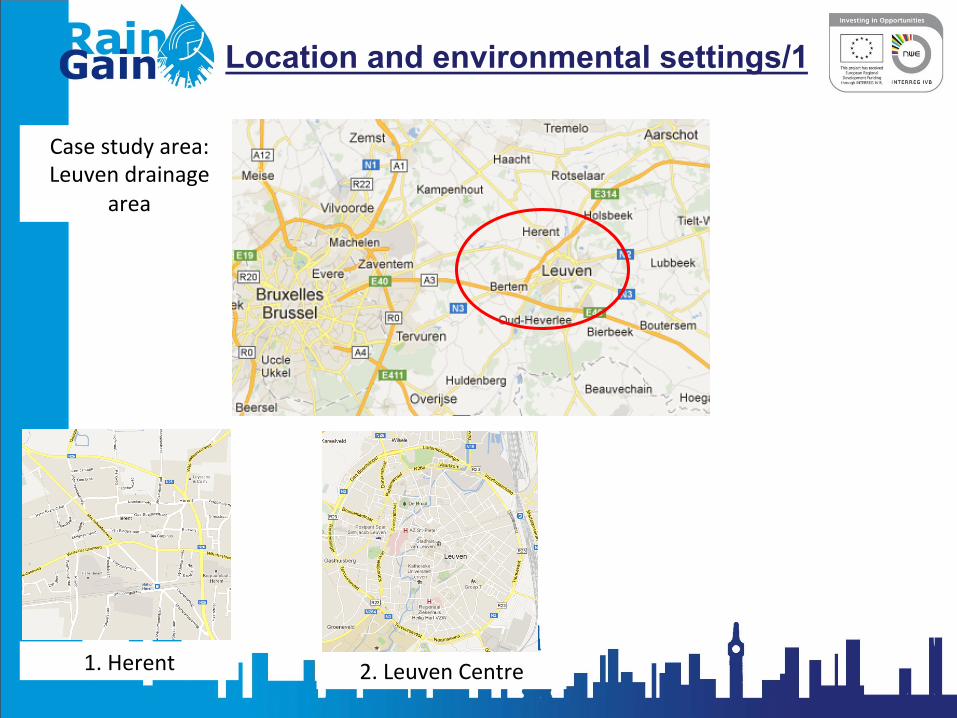
Location and environmental settings/1
2. Leuven Centre 1. Herent
Case study area: Leuven drainage
area
Location and environmental settings/2
• Situated about 20 km east of Brussels • Total area : approx. 120 km² • Total population : 120000-150000 • Spread over 6 municipalities (mainly Leuven,
Herent and Bertem) • First phase : only northern part (mainly Herent)
– Approx. Population : 25000 • Leuven City Centre dominated by several
branches of Dijle River • Herent : rural in outer areas • Bertem : narrow valley of Voer River
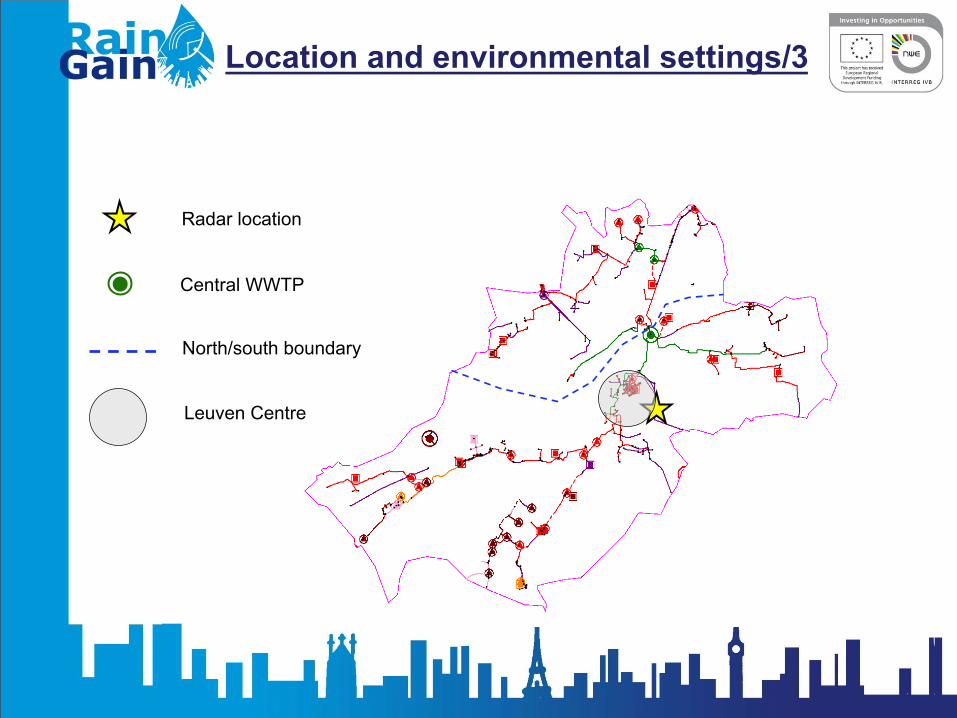
Location and environmental settings/3
Radar location
Central WWTP
North/south boundary
Leuven Centre
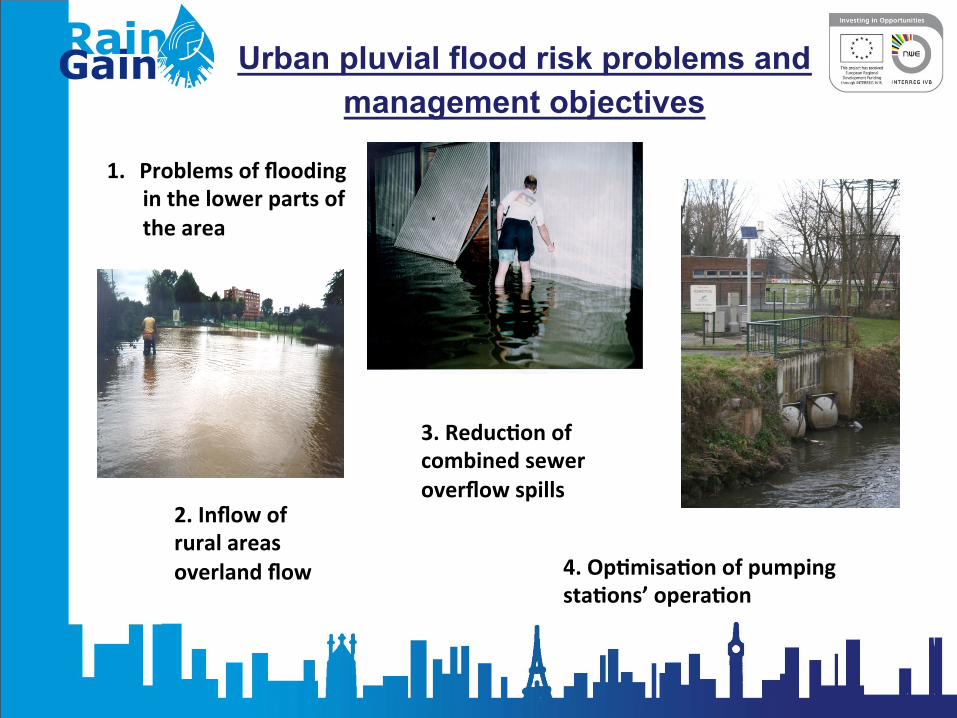
Urban pluvial flood risk problems and management objectives
4. Op&misa&on of pumping sta&ons’ opera&on
1. Problems of flooding in the lower parts of the area
2. Inflow of rural areas overland flow
3. Reduc&on of combined sewer overflow spills
Drainage/1 and monitoring systems
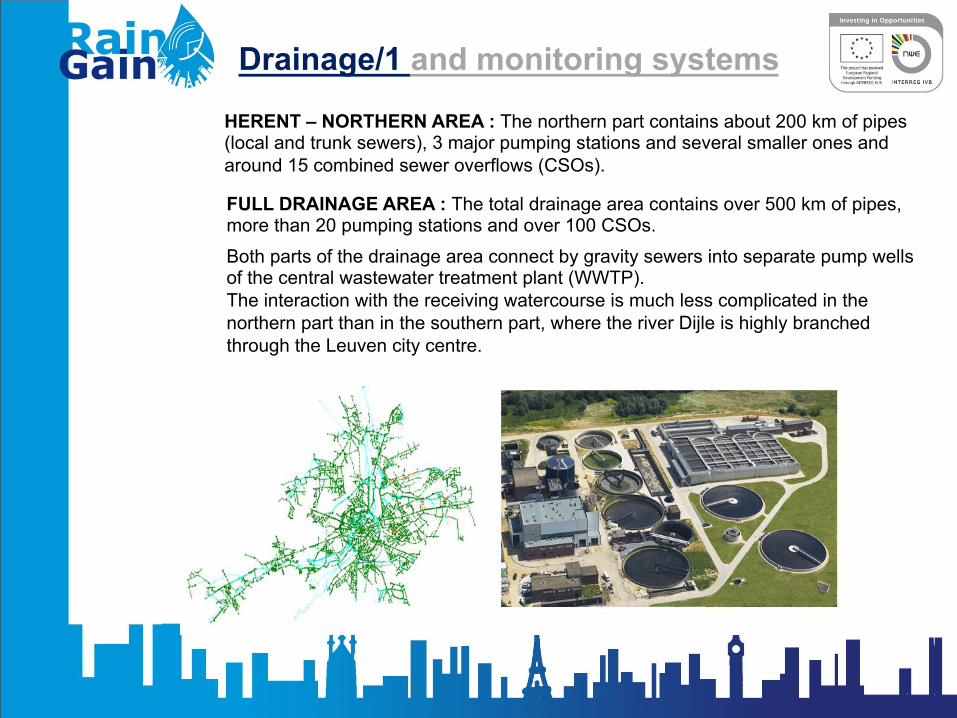
HERENT – NORTHERN AREA : The northern part contains about 200 km of pipes (local and trunk sewers), 3 major pumping stations and several smaller ones and around 15 combined sewer overflows (CSOs). FULL DRAINAGE AREA : The total drainage area contains over 500 km of pipes, more than 20 pumping stations and over 100 CSOs. Both parts of the drainage area connect by gravity sewers into separate pump wells of the central wastewater treatment plant (WWTP). The interaction with the receiving watercourse is much less complicated in the northern part than in the southern part, where the river Dijle is highly branched through the Leuven city centre.
Drainage/3 and monitoring systems
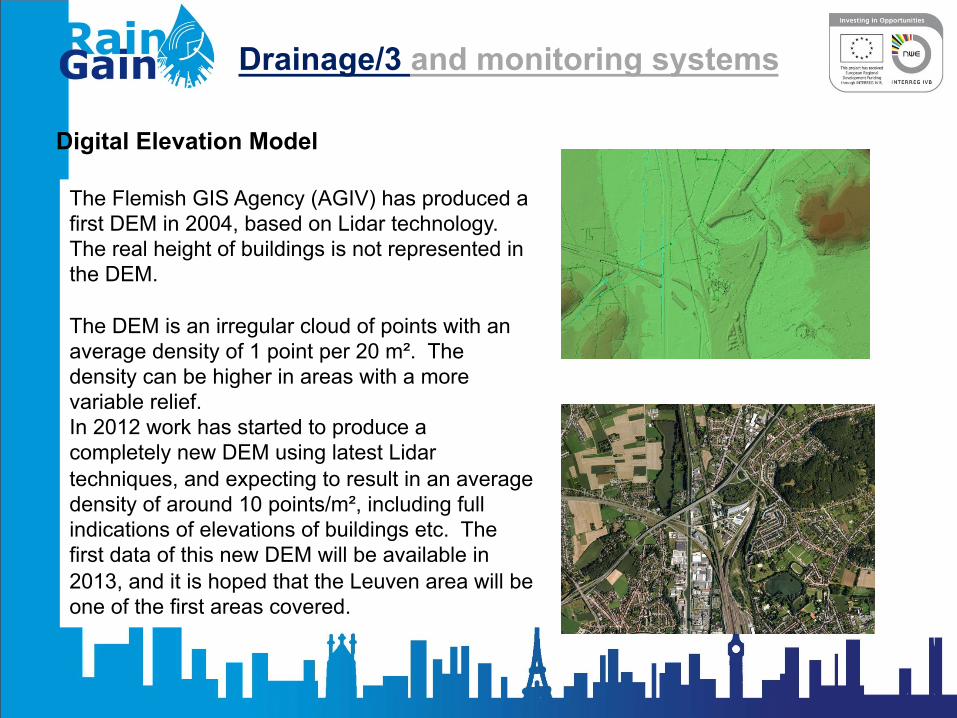
Digital Elevation Model
The Flemish GIS Agency (AGIV) has produced a first DEM in 2004, based on Lidar technology. The real height of buildings is not represented in the DEM. The DEM is an irregular cloud of points with an average density of 1 point per 20 m². The density can be higher in areas with a more variable relief. In 2012 work has started to produce a completely new DEM using latest Lidar techniques, and expecting to result in an average density of around 10 points/m², including full indications of elevations of buildings etc. The first data of this new DEM will be available in 2013, and it is hoped that the Leuven area will be one of the first areas covered.
Drainage and monitoring systems/1
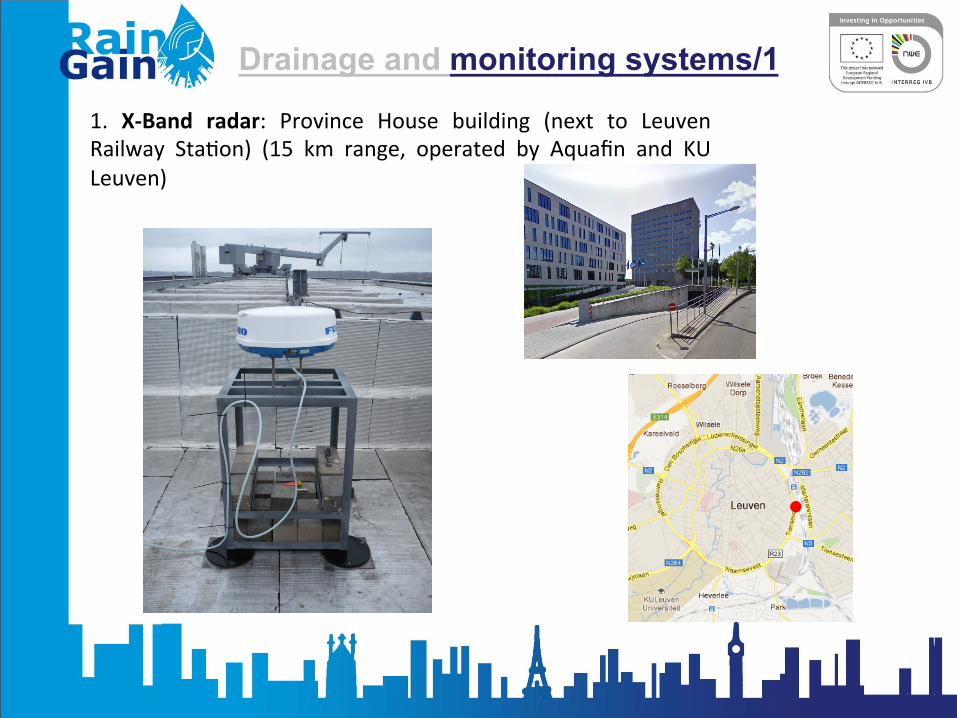
1. X-‐Band radar: Province House building (next to Leuven Railway Sta?on) (15 km range, operated by Aquafin and KU Leuven)
Drainage and monitoring systems/2
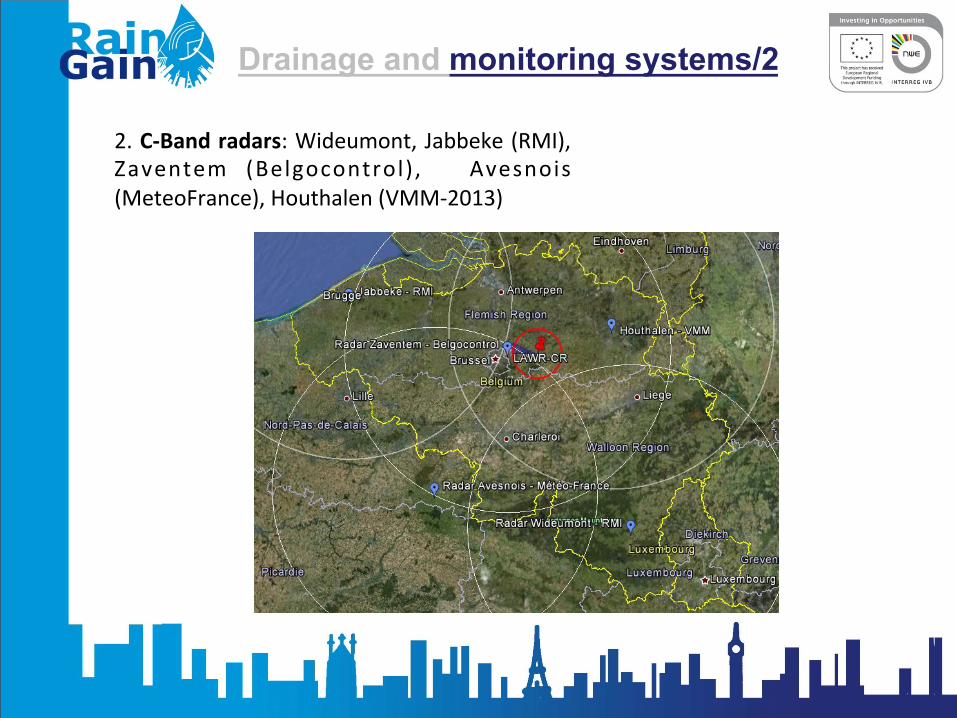
2. C-‐Band radars: Wideumont, Jabbeke (RMI), Zaventem (Belgocontrol) , Avesnois (MeteoFrance), Houthalen (VMM-‐2013)
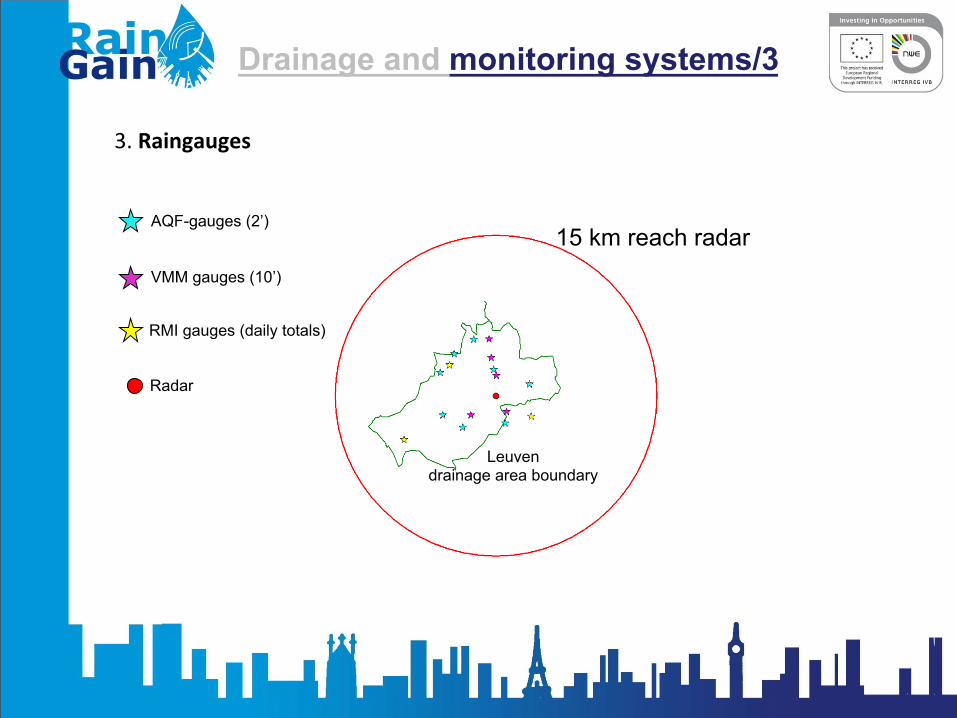
Drainage and monitoring systems/3
3. Raingauges
AQF-gauges (2’)
RMI gauges (daily totals)
VMM gauges (10’)
Radar
Leuven drainage area boundary
15 km reach radar
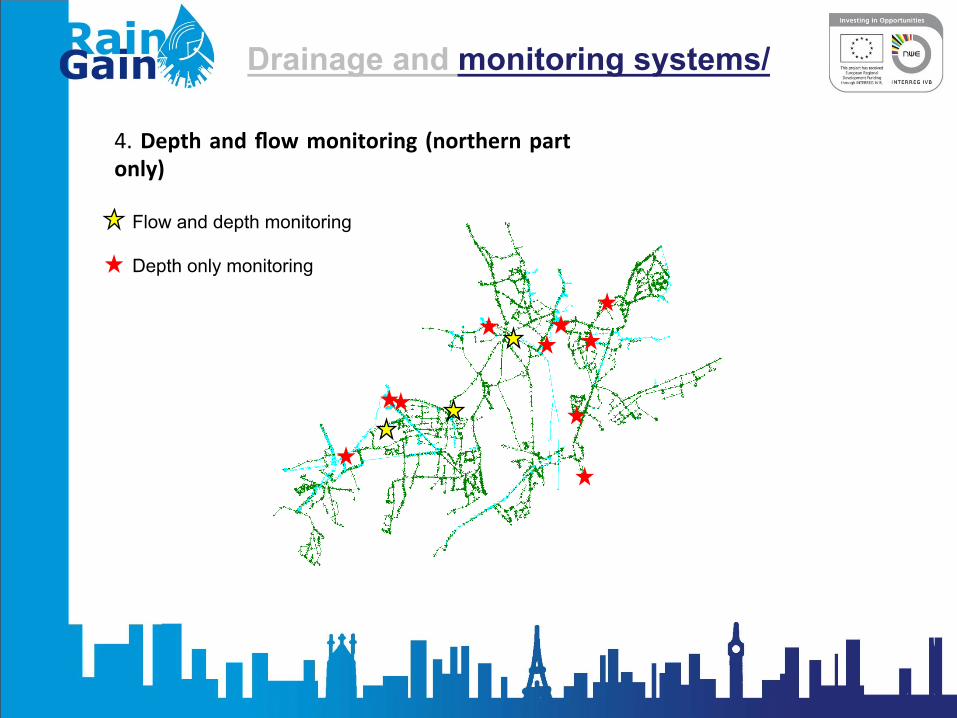
Drainage and monitoring systems/
4. Depth and flow monitoring (northern part only)
Flow and depth monitoring
Depth only monitoring