CONSORT 2010 Flow Diagram - Clinical … · Resting metabolic rate (RMR) was collected using an...
20
SUPPLEMENTARY MATERIAL SUBJECTS AND METHODS Study design The study was a prospective, randomized controlled, feasibility trial of an 8-week diet counseling intervention for veterans enrolled in the MOVE! program with continued assessment to week 24, between November 2012 to March 2014. The MOVE! program is an 8-week, evidence-based weight management program for overweight and obese veterans that is established in all Veterans Administration hospitals. 29 The study took place through Veterans Administration of San Diego Healthcare System (VASDHS) and its community clinics. This study received IRB approval (protocol # H130174). It was also registered with ClinicalTrials.gov (NCT01859403). All authors had access to the study data and had reviewed and approved the final manuscript. Participants Veterans with a physician’s referral to weight management clinic and a BMI ≥ 30.0 were recruited from those enrolled in the VASDHS MOVE! program. Inclusion criteria for this study were willingness to purchase and consume two Healthy Choice meals per day, keep a food log, have no known food allergies, have access to a freezer and microwave, understand and consent to the study, and attend the MOVE! program during the initial 8 weeks. Subjects were excluded if they drank 6 or more caffeinated beverages per day; had an active substance abuse or dependence disorder within the past year; had a surgical gastrointestinal procedure, with exception of distal appendectomy; had acute infections or use of antibiotic therapy; had a cognitive disorder or psychiatric hospitalization in the past 6 months, or suicidal ideation
-
Upload
nguyenhuong -
Category
Documents
-
view
213 -
download
0
Transcript of CONSORT 2010 Flow Diagram - Clinical … · Resting metabolic rate (RMR) was collected using an...
SUPPLEMENTARY MATERIAL
SUBJECTS AND METHODS
Study design
The study was a prospective, randomized controlled, feasibility trial of an 8-week diet
counseling intervention for veterans enrolled in the MOVE! program with continued assessment
to week 24, between November 2012 to March 2014. The MOVE! program is an 8-week,
evidence-based weight management program for overweight and obese veterans that is
established in all Veterans Administration hospitals.29 The study took place through Veterans
Administration of San Diego Healthcare System (VASDHS) and its community clinics. This
study received IRB approval (protocol # H130174). It was also registered with
ClinicalTrials.gov (NCT01859403). All authors had access to the study data and had reviewed
and approved the final manuscript.
Participants
Veterans with a physician’s referral to weight management clinic and a BMI ≥ 30.0 were
recruited from those enrolled in the VASDHS MOVE! program. Inclusion criteria for this study
were willingness to purchase and consume two Healthy Choice meals per day, keep a food log,
have no known food allergies, have access to a freezer and microwave, understand and consent
to the study, and attend the MOVE! program during the initial 8 weeks. Subjects were excluded
if they drank 6 or more caffeinated beverages per day; had an active substance abuse or
dependence disorder within the past year; had a surgical gastrointestinal procedure, with
exception of distal appendectomy; had acute infections or use of antibiotic therapy; had a
cognitive disorder or psychiatric hospitalization in the past 6 months, or suicidal ideation
identified in the past year; ≤GFR of 30 ml/min; New York Heart Association functional
classification of congestive heart failure above class I; edema requiring diuretics (not including
hydrochlorothiazide); abnormal EKG reading, high dose oral corticosteroids; abnormal TSH,
sodium or potassium concentrations; fasting LDLs > 190 mg/dL; triglycerides ≥ 1000 mg/dL; or
hemoglobin ≤ 10 g/dL. All participants provided written informed consent.
Diet Assignment
Participants entered the study on their normal diet. The baseline visit was 3-4 weeks prior
to start of MOVE! program initiation. After baseline measurements were taken, participants
provided saliva for genetic analysis (Pathway Genomics, Inc., San Diego, CA; Figure S1).
Participants were then randomly assigned to either the genetics-guided therapy (GT) group or
standard therapy (ST) groups. Randomization, which was performed prior to receipt of
nutrigenetic report, was non-stratified, two-group, concealed allocation, using the Research
Randomizer website.30
In the GT group, participants and researchers were unblinded to the diet match and
participants were informed of their nutrigenetic report. GT participants were matched to one of
four possible diet types: balanced, low-carbohydrate, low-fat, or Mediterranean based on their
report. They received a meal plan, lists of foods to incorporate in the plan, and samples of
menus (similar to the MOVE! packet of literature given to ST group) to assist adherence to their
diet and to obtain their caloric goal (Online Material: Meal Plan). The macronutrient
guidelines of the different diets for the GT participants are shown in Table S2.
In the ST group, participants and researchers were blinded to the nutrigenetic report.
These participants were given the balanced diet plan. To aid in simplicity and adherence, all diet

plans (for both ST and GT participants) incorporated Healthy Choice (ConAgra Foods®, Inc.)
entrees at lunch and dinner (Online Material: Sample Menu) for the first 8 weeks of the study,
for which participants were fully reimbursed upon delivery of receipts. At the conclusion of the
study, ST participants were provided their nutrigenetic reports.
The macronutrient composition of each diet plan was based on a compilation of research
studies that showed the benefit of that particular diet plan on patients with a high risk
polymorphism. For example, the macronutrient composition of the Mediterranean diet plan was
based on refs 17-19 and 20-22 (see Table S1). All participants were provided access to a website
to track their diet and exercise (fatsecret.com). This website also displayed detailed
macronutrient data to enable the study dietitian to track dietary adherence and provide
individualized counseling to participants at weekly group visits. To ensure macro- and micro-
nutrients were within USDA guidelines and fit each diet’s macronutrient requirements, all diet
plans were analyzed with The Food Processor ® version 10.12 (ESHA Research, Salem, OR).
During weeks 1-8, all participants received weekly face-to-face group counseling based
on their diet match. During weeks 9-24 participants were asked to continue to report dietary
intake into the food log. To encourage use of the diet tracking website, participants were paid
one dollar per day of entry, which was tallied weekly and paid in one lump sum at week 24. No
further formal dietary counseling was given during this time.
In the first 8 weeks of the study, macronutrient composition was assessed by food diaries
(via website as described in methods) and weekly in-person counseling and review of diet.
Macronutrient data was reviewed with every patient during these in-person visits. During weeks
9-24 participants were reimbursed for use of self-reported dietary intake food logs. However,
besides receipts from Healthy Choice Meals, we did not have any additional evidence that
patients were compliant with the self-reported diets in their food logs.
Anthropometric, Energy, and Impedance Assessments
At baseline, week 8, and week 24 each participant underwent measurements of height,
weight, calculated BMI, waist circumference, hip circumference, and had a physical exam. Body
weight was measured to the nearest 0.1 kg via a Weight-Tronix Scale (Scale Electronics
Development, New York, NY, USA) by trained nursing staff. Resting metabolic rate (RMR)
was collected using an indirect calorimeter system (MedGem®; Microlife Medical Home
Solutions, Inc., Golden, CO, USA) to calculate each participant’s daily caloric requirement.
Bioelectrical impedance analysis (BIA) measurements was acquired using the Tanita® leg-to-leg
system (model TBF – 300A; Arlington Heights, IL; USA) at baseline, week 8, and week 24. An
EKG was performed to evaluate for bradycardia, rapid heart rate or other arrhythmia or active
ischemia at the baseline visit.
Laboratory Measurements
Fasting blood samples were collected at baseline, week 8, and week 24. A CBC, basic
chemistry panel, 25-hydroxy vitamin D, thyroid stimulating hormone, alanine transaminase, lipid
panel, ultra-sensitive C reactive protein (US-CRP) and insulin were drawn. Individual lab values
that were 2.5 standard deviations from the mean were considered erroneous and were not
included in further analysis. Fasting homeostatic model assessment of insulin resistance
(HOMA-IR) was calculated based on fasting serum glucose and insulin concentrations.
Salivary Nutrigenomics Testing
Salivary samples from participants were sent to Pathway Genomics and the Pathway Fit
Test® (a genomic array) was performed. Based on the SNP alleles for seven genes, and using a
proprietary algorithm, Pathway Fit Test® makes a recommendation to a specific diet (Figure
S1). The genes (and reference SNP [rs] number) used to make these dietary recommendations
were APOA2 (rs5082), ADIPOQ (rs17300539), FTO (rs9939609), KCTD10 (rs10850219),
LIPC (rs1800588), MMAB (rs2241201), and PPARG (rs1801282); (Table S1).
Statistics
The primary, pre-specified study goal was to compare the percentage of participants
achieving ≥5% weight loss in the GT vs. ST groups at 8 weeks. This is mainly because a
patient’s success in the MOVE! program is assessed at the end of their 8 week enrollment.
However, since most of those studying obesity are concerned with long-term outcomes of an
intervention, the secondary outcome was the percentage of participants in each group achieving
≥5% weight loss at 24 weeks.
Given paucity of data, a pre-specified power and sample size analysis was not done.
Since the aim was to understand the direction and magnitude of differences in GT vs. ST, 50
participants were recruited in this single site recruitment structure. Participants were recruited in
batches prior to starting the MOVE! program. This trial was completed due to meeting
enrollment goal of at least 50 participants. Based on a 25 participants per group assumption, this
study had the ability to detect a 30% absolute difference in the proportion of individuals
achieving ≥ 5% weight loss 24 weeks after randomization, assuming 80% power, and a two-
sided alpha of 0.05. For this calculation, it was assumed that the control group rate would be
similar to previous publications on MOVE! program (~18% success rate [28]).
Since this was a feasibility study, per protocol analyses for all participants was performed
(Figure S2). Analyses were performed using the Statistical Package for Social Science (SPSS)
version 20.0 (SPSS, Inc., Chicago, IL) and GraphPad Prism 5 (GraphPad Software, La Jolla,
CA). A two-sided alpha of 0.05 was used for declaring statistical significance. Differences in
means were evaluated utilizing student t-tests when comparing two primary groups, or a one-way
analysis of variance (ANOVA), if comparing multiple subclasses, with Dunns multiple
comparison post-hoc test. For comparisons of categorical variables, Fisher Exact test was used.
The Wilson procedure with a correction for continuity was used to assess the confidence interval
for the difference between two independent proportions. For adherence data, a Pearson’s
correlation was performed. In order to assess whether this genotype is a good prognosticator of
weight loss from dietary/behavioral intervention, the sensitivity, specificity, positive predictive
value, and negative predictive value were calculated for different weight loss thresholds. The
threshold with the best results is reported but other thresholds are shown in the supplementary
table (Table S3).
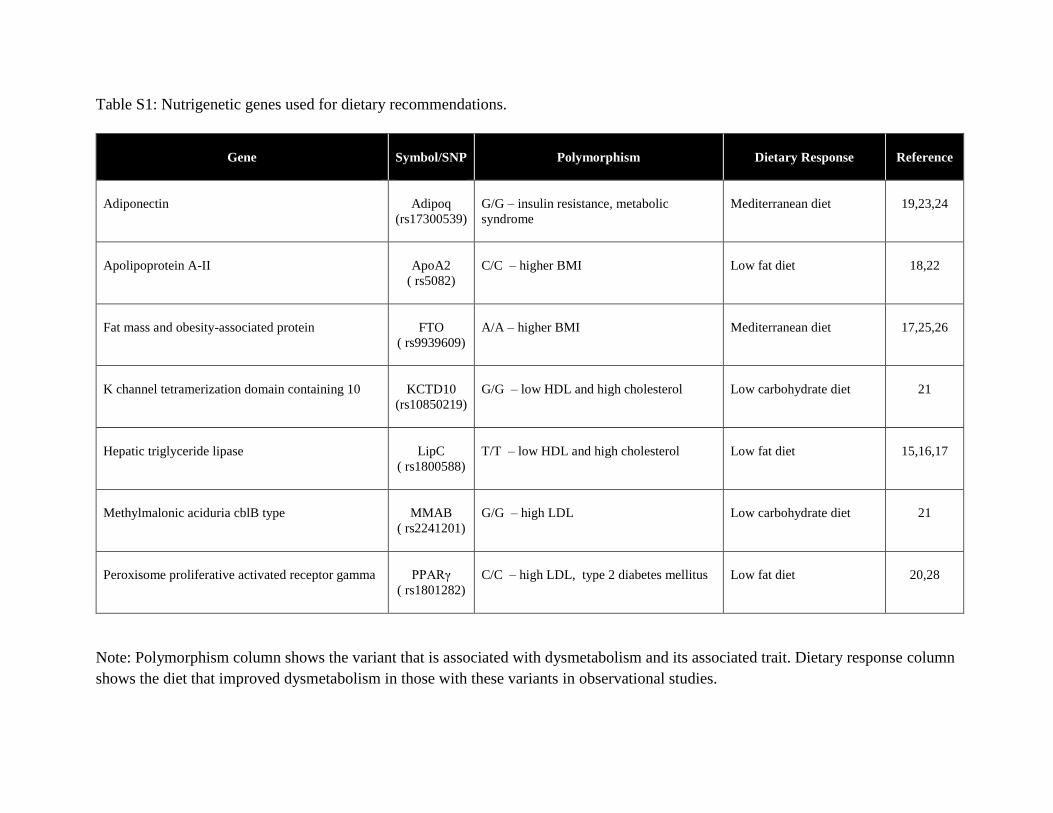
Table S1: Nutrigenetic genes used for dietary recommendations.
Note: Polymorphism column shows the variant that is associated with dysmetabolism and its associated trait. Dietary response column
shows the diet that improved dysmetabolism in those with these variants in observational studies.
Gene
Symbol/SNP
Polymorphism
Dietary Response
Reference
Adiponectin
Adipoq
(rs17300539)
G/G – insulin resistance, metabolic
syndrome
Mediterranean diet
19,23,24
Apolipoprotein A-II
ApoA2
( rs5082)
C/C – higher BMI
Low fat diet
18,22
Fat mass and obesity-associated protein
FTO
( rs9939609)
A/A – higher BMI
Mediterranean diet
17,25,26
K channel tetramerization domain containing 10
KCTD10
(rs10850219)
G/G – low HDL and high cholesterol
Low carbohydrate diet
21
Hepatic triglyceride lipase
LipC
( rs1800588)
T/T – low HDL and high cholesterol
Low fat diet
15,16,17
Methylmalonic aciduria cblB type
MMAB
( rs2241201)
G/G – high LDL
Low carbohydrate diet
21
Peroxisome proliferative activated receptor gamma
PPARγ
( rs1801282)
C/C – high LDL, type 2 diabetes mellitus
Low fat diet
20,28
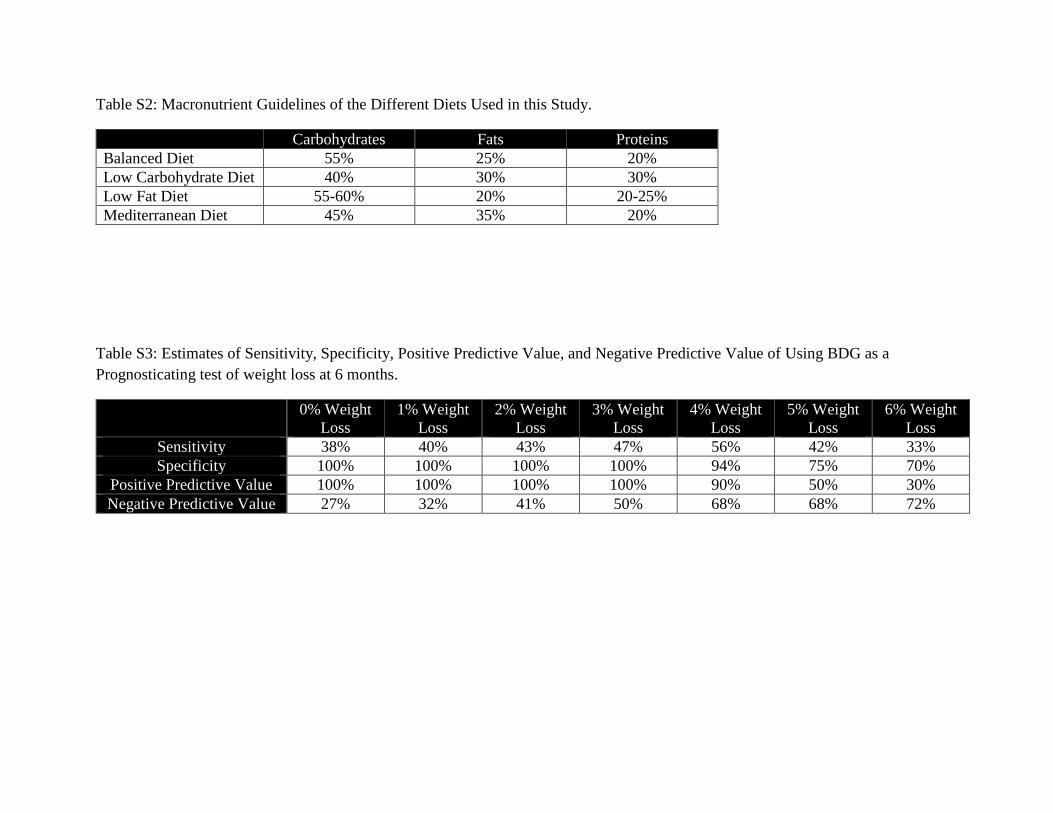
Table S2: Macronutrient Guidelines of the Different Diets Used in this Study.
Carbohydrates Fats Proteins
Balanced Diet 55% 25% 20%
Low Carbohydrate Diet 40% 30% 30%
Low Fat Diet 55-60% 20% 20-25%
Mediterranean Diet 45% 35% 20%
Table S3: Estimates of Sensitivity, Specificity, Positive Predictive Value, and Negative Predictive Value of Using BDG as a
Prognosticating test of weight loss at 6 months.
0% Weight
Loss
1% Weight
Loss
2% Weight
Loss
3% Weight
Loss
4% Weight
Loss
5% Weight
Loss
6% Weight
Loss
Sensitivity 38% 40% 43% 47% 56% 42% 33%
Specificity 100% 100% 100% 100% 94% 75% 70%
Positive Predictive Value 100% 100% 100% 100% 90% 50% 30%
Negative Predictive Value 27% 32% 41% 50% 68% 68% 72%
Supplemental Figures
Figure S1: Sample report from Pathway Genomics. Through a proprietary algorithm, Pathway
Genomics makes a recommendation of the most appropriate diet for each participant (A) on the
basis of their genotype for 6 genes (B). In this case, the participant is recommended to go on a
low fat diet.
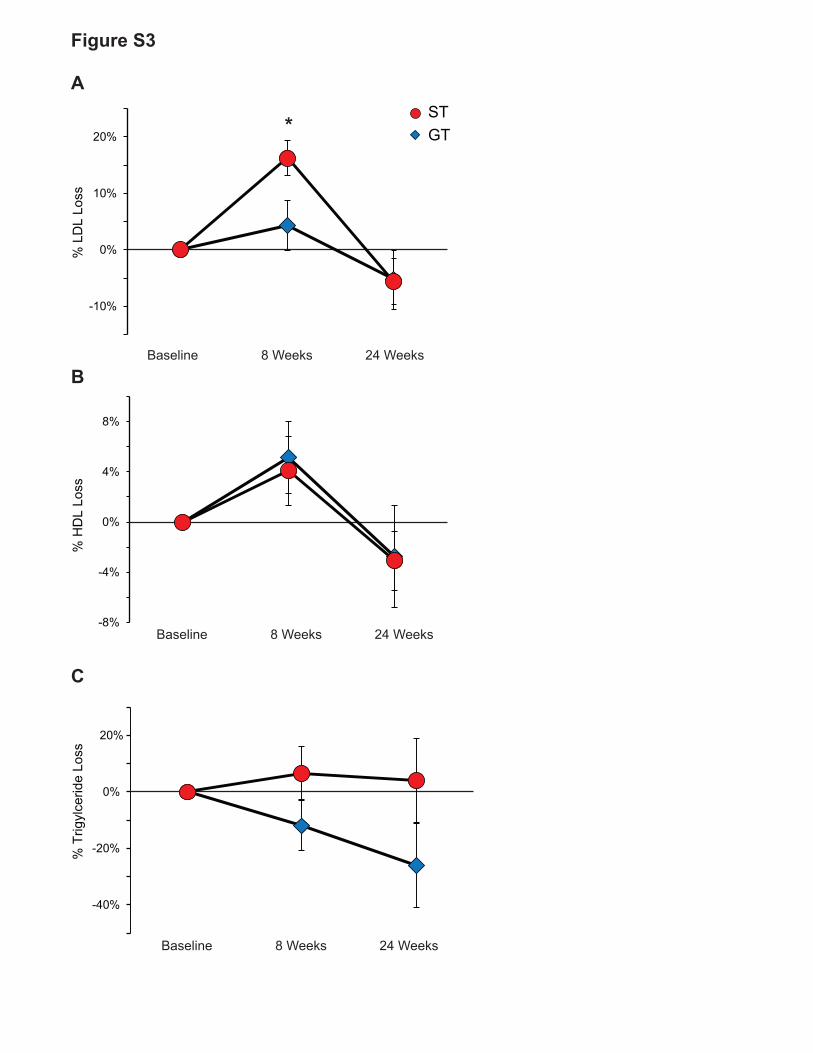
Figure S3: Lipid profile changes in the genotype guided therapy (GT) and the standard therapy
(ST) groups. (A) Percentage LDL loss by participants at 8 and 24 weeks. Though this was
significant at 8 weeks, it was no longer so at 24 weeks. Note that a negative number on this
graph implies that LDL levels in serum went up. (B) Percentage HDL loss by participants at 8
and 24 weeks. (C) Triglycerides loss by participants at 8 and 24 weeks. (* p <0.05).
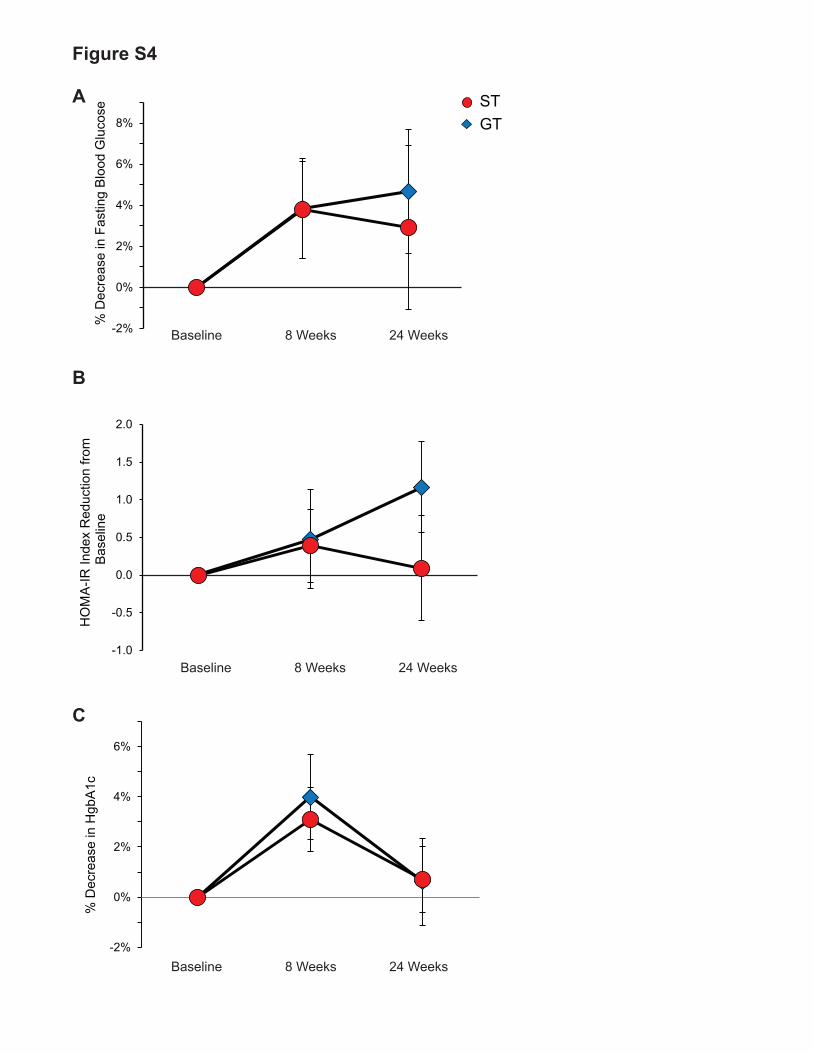
Figure S4: Glucose homeostasis and Insulin resistance in the genotype guided therapy (GT) and
the standard therapy (ST) groups. (A) Percentage decrease in fasting blood glucose by
participants at 8 and 24 weeks. (B) HOMA-IR reduction from baseline by participants at 8 and
24 weeks. (C) Percentage decrease in glycated hemoglobin by participants at 8 and 24 weeks.
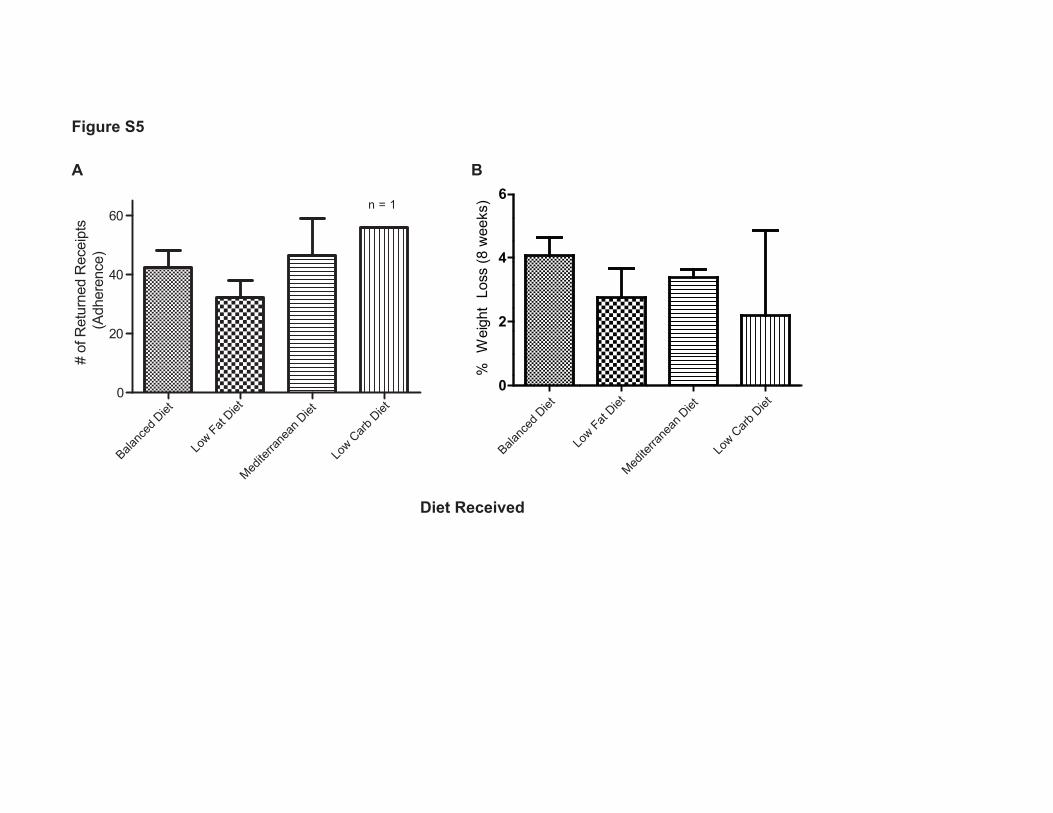
Figure S5: Adherence and weight loss by diet received. (A) There was no significant difference
in adherence by diet received (p = 0.52, one-way ANOVA). (B) There was no significant
difference in weight loss by diet received (p = 0.52, one-way ANOVA). Please note that in this
graph, diet received refers to the dietary intervention the patient received, NOT their genotype.
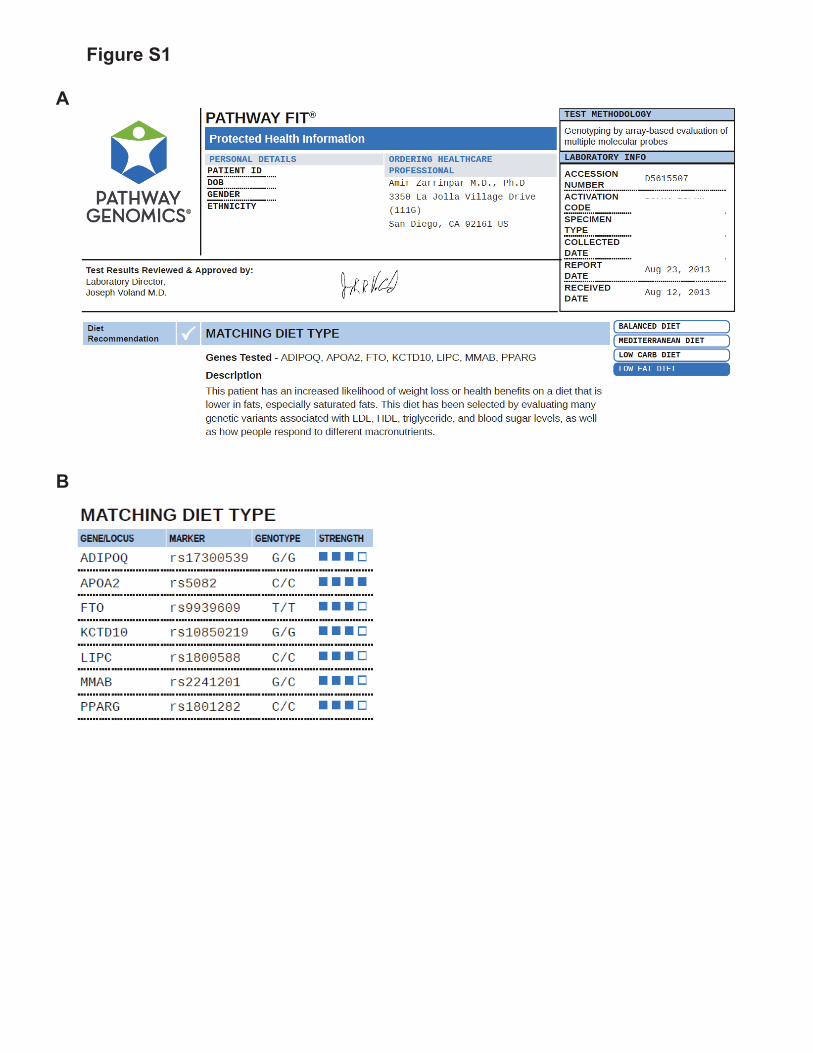
Figure S1
A
B
-10%
0%
10%
20%
% L
DL
Loss
A
Figure S3
8 Weeks 24 WeeksBaseline
*STGT
B
-8%
-4%
0%
4%
8%
% H
DL
Loss
8 Weeks 24 WeeksBaseline
C
-40%
-20%
0%
20%
8 Weeks 24 WeeksBaseline
% T
rigyl
cerid
e Lo
ss
A
Figure S4
-2%
0%
2%
4%
6%
8%
% D
ecre
ase
in F
astin
g B
lood
Glu
cose
8 Weeks 24 WeeksBaseline
STGT
-1.0
-0.5
0.0
0.5
1.0
1.5
2.0
HO
MA
-IR In
dex
Red
uctio
n fro
m
Bas
elin
e
B
8 Weeks 24 WeeksBaseline
C
% D
ecre
ase
in H
gbA
1c
8 Weeks 24 WeeksBaseline-2%
0%
2%
4%
6%
Balanc
ed D
iet
Low Fat
Diet
Medite
rrane
an D
iet
Low C
arb D
iet0
20
40
60n = 1
# of
Ret
urne
d R
ecei
pts
(Adh
eren
ce)
Figure S5
A B
0
2
4
6
% W
eigh
t Lo
ss (8
wee
ks)
Balanc
ed D
iet
Low Fat
Diet
Medite
rrane
an D
iet
Low C
arb D
iet
Diet Received
1
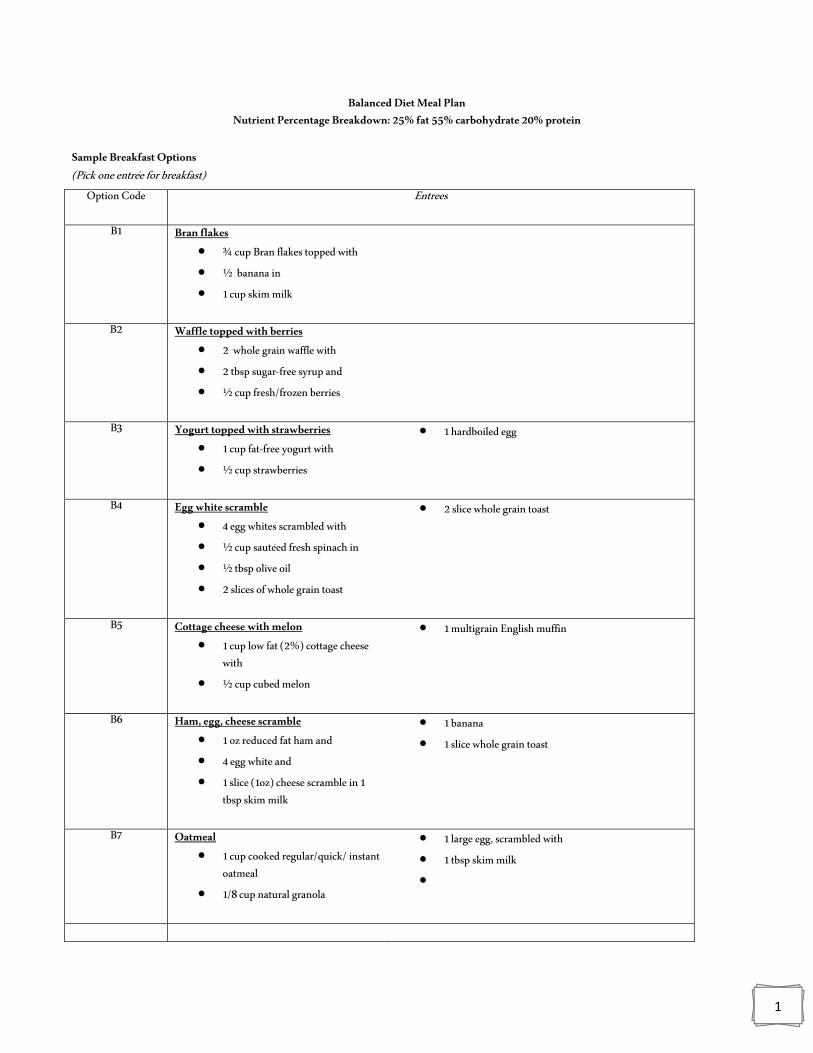
Balanced Diet Meal Plan Nutrient Percentage Breakdown: 25% fat 55% carbohydrate 20% protein
Sample Breakfast Options (Pick one entrée for breakfast)
Option Code Entrees
B1 Bran flakes ¾ cup Bran flakes topped with
½ banana in
1 cup skim milk
B2 Waffle topped with berries 2 whole grain waffle with
2 tbsp sugarfree syrup and
½ cup fresh/frozen berries
B3 Yogurt topped with strawberries 1 cup fatfree yogurt with
½ cup strawberries
1 hardboiled egg
B4 Egg white scramble 4 egg whites scrambled with
½ cup sautéed fresh spinach in
½ tbsp olive oil
2 slices of whole grain toast
2 slice whole grain toast
B5 Cottage cheese with melon 1 cup low fat (2%) cottage cheese
with
½ cup cubed melon
1 multigrain English muffin
B6 Ham, egg, cheese scramble 1 oz reduced fat ham and
4 egg white and
1 slice (1oz) cheese scramble in 1 tbsp skim milk
1 banana
1 slice whole grain toast
B7 Oatmeal 1 cup cooked regular/quick/ instant
oatmeal
1/8 cup natural granola
1 large egg, scrambled with
1 tbsp skim milk
2
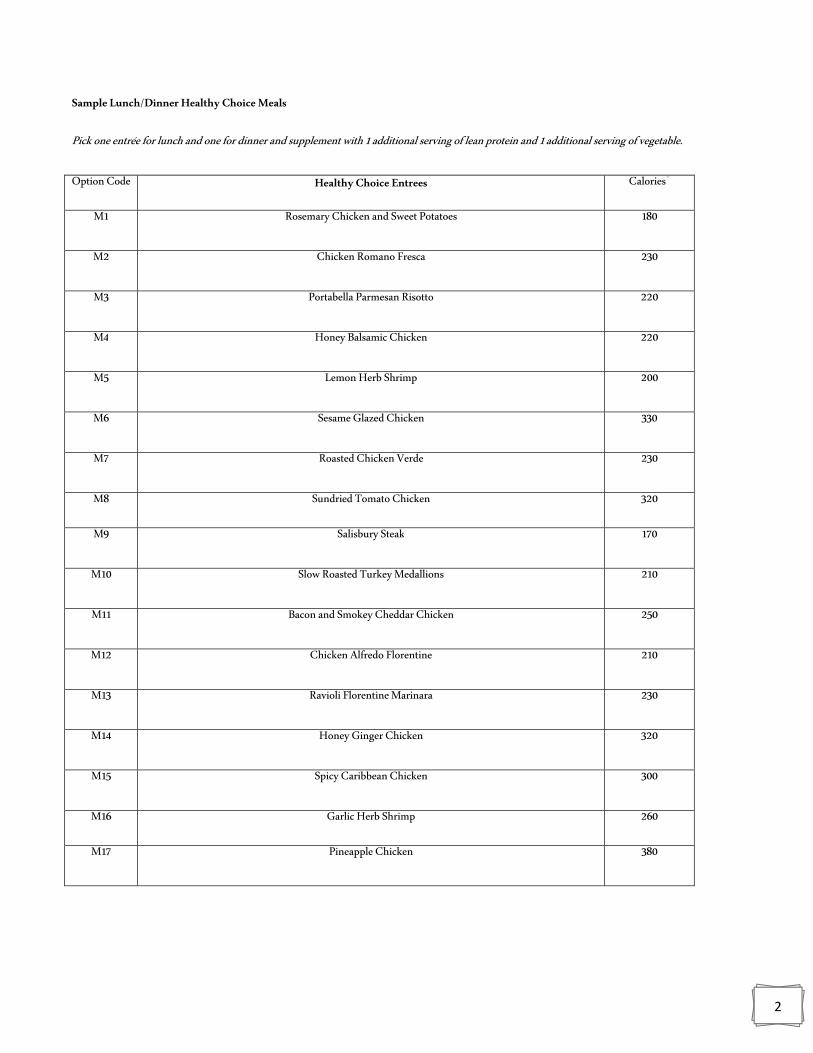
Sample Lunch/Dinner Healthy Choice Meals Pick one entrée for lunch and one for dinner and supplement with 1 additional serving of lean protein and 1 additional serving of vegetable.
Option Code Healthy Choice Entrees
Calories*
M1 Rosemary Chicken and Sweet Potatoes
180
M2 Chicken Romano Fresca
230
M3 Portabella Parmesan Risotto
220
M4 Honey Balsamic Chicken
220
M5 Lemon Herb Shrimp
200
M6 Sesame Glazed Chicken
330
M7 Roasted Chicken Verde
230
M8
Sundried Tomato Chicken 320
M9 Salisbury Steak
170
M10 Slow Roasted Turkey Medallions
210
M11 Bacon and Smokey Cheddar Chicken
250
M12 Chicken Alfredo Florentine
210
M13 Ravioli Florentine Marinara
230
M14 Honey Ginger Chicken
320
M15 Spicy Caribbean Chicken
300
M16 Garlic Herb Shrimp 260
M17 Pineapple Chicken
380
3
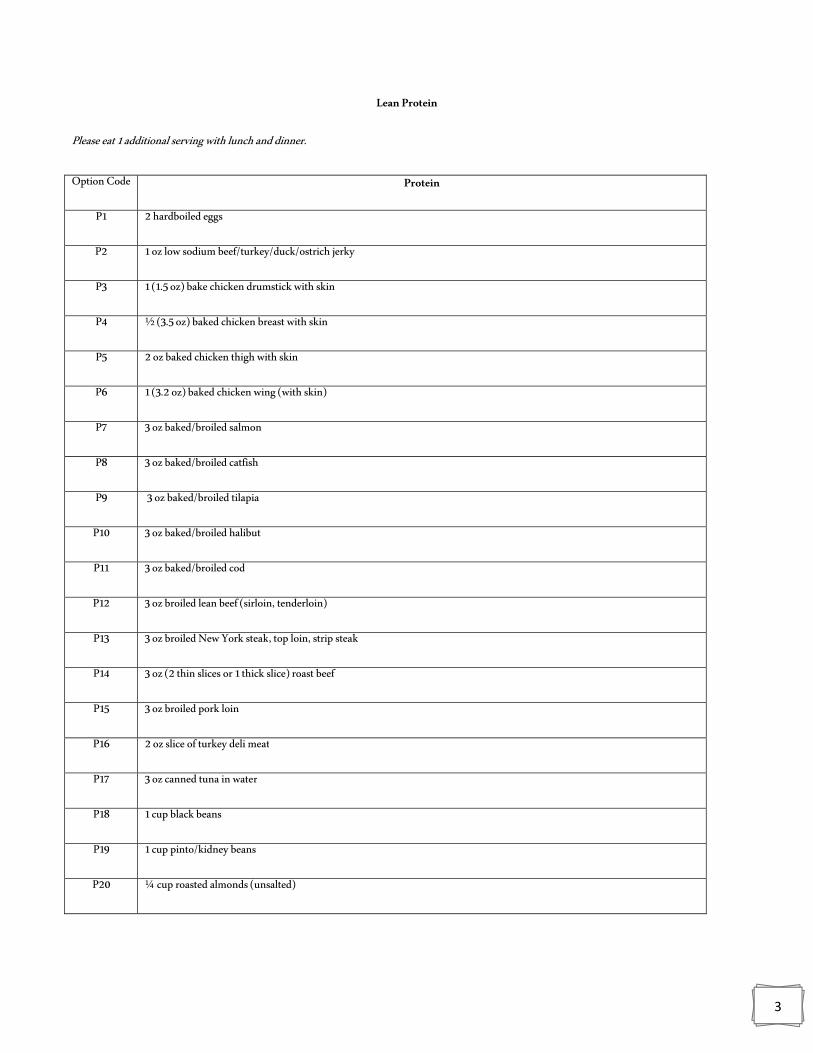
Lean Protein
Please eat 1 additional serving with lunch and dinner.
Option Code
Protein
P1 2 hardboiled eggs
P2 1 oz low sodium beef/turkey/duck/ostrich jerky
P3 1 (1.5 oz) bake chicken drumstick with skin
P4 ½ (3.5 oz) baked chicken breast with skin
P5 2 oz baked chicken thigh with skin
P6 1 (3.2 oz) baked chicken wing (with skin)
P7 3 oz baked/broiled salmon
P8 3 oz baked/broiled catfish
P9 3 oz baked/broiled tilapia
P10 3 oz baked/broiled halibut
P11 3 oz baked/broiled cod
P12 3 oz broiled lean beef (sirloin, tenderloin)
P13 3 oz broiled New York steak, top loin, strip steak
P14 3 oz (2 thin slices or 1 thick slice) roast beef
P15 3 oz broiled pork loin
P16 2 oz slice of turkey deli meat
P17 3 oz canned tuna in water
P18 1 cup black beans
P19 1 cup pinto/kidney beans
P20 ¼ cup roasted almonds (unsalted)
4
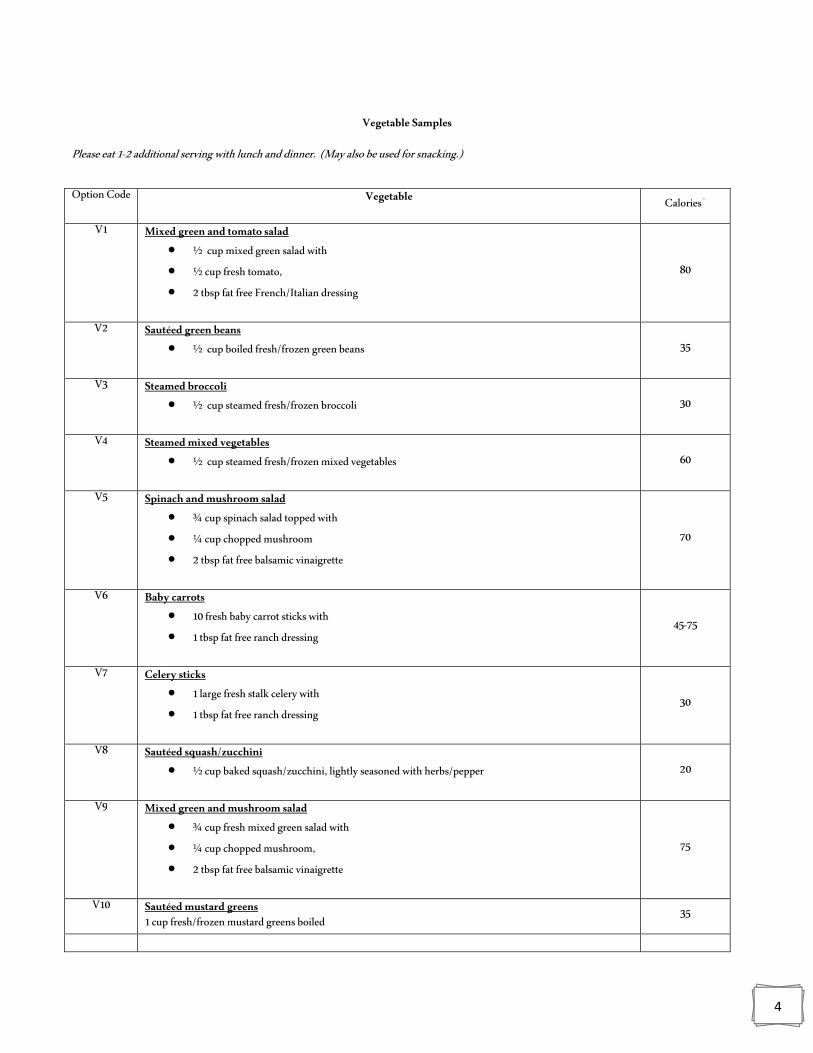
Vegetable Samples
Please eat 12 additional serving with lunch and dinner. (May also be used for snacking.)
Option Code
Vegetable Calories*
V1 Mixed green and tomato salad ½ cup mixed green salad with
½ cup fresh tomato,
2 tbsp fat free French/Italian dressing
80
V2 Sautéed green beans ½ cup boiled fresh/frozen green beans
35
V3 Steamed broccoli ½ cup steamed fresh/frozen broccoli
30
V4 Steamed mixed vegetables ½ cup steamed fresh/frozen mixed vegetables
60
V5 Spinach and mushroom salad ¾ cup spinach salad topped with
¼ cup chopped mushroom
2 tbsp fat free balsamic vinaigrette
70
V6 Baby carrots 10 fresh baby carrot sticks with
1 tbsp fat free ranch dressing
4575
V7 Celery sticks 1 large fresh stalk celery with
1 tbsp fat free ranch dressing
30
V8 Sautéed squash/zucchini ½ cup baked squash/zucchini, lightly seasoned with herbs/pepper
20
V9 Mixed green and mushroom salad ¾ cup fresh mixed green salad with
¼ cup chopped mushroom,
2 tbsp fat free balsamic vinaigrette
75
V10 Sautéed mustard greens 1 cup fresh/frozen mustard greens boiled
35
5
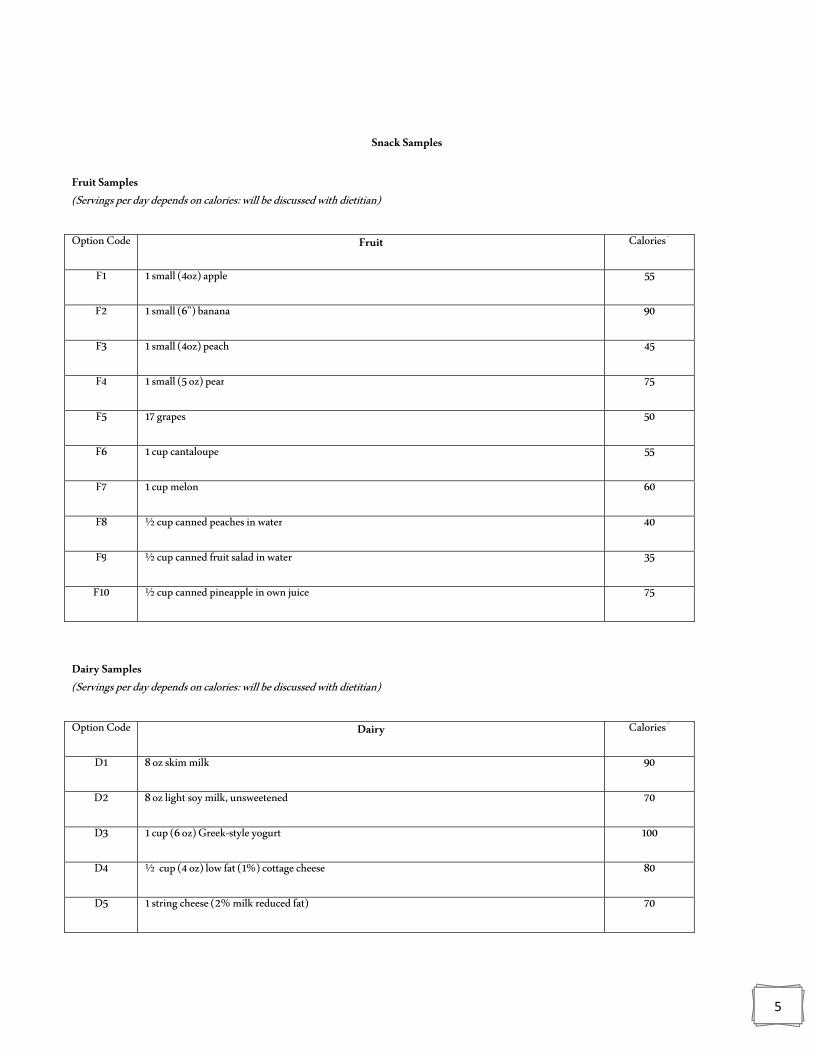
Snack Samples
Fruit Samples (Servings per day depends on calories: will be discussed with dietitian)
Option Code Fruit
Calories*
F1 1 small (4oz) apple
55
F2 1 small (6”) banana
90
F3 1 small (4oz) peach
45
F4 1 small (5 oz) pear
75
F5 17 grapes
50
F6 1 cup cantaloupe
55
F7 1 cup melon
60
F8 ½ cup canned peaches in water
40
F9 ½ cup canned fruit salad in water
35
F10 ½ cup canned pineapple in own juice
75
Dairy Samples (Servings per day depends on calories: will be discussed with dietitian)
Option Code Dairy
Calories*
D1 8 oz skim milk
90
D2 8 oz light soy milk, unsweetened
70
D3 1 cup (6 oz) Greekstyle yogurt
100
D4 ½ cup (4 oz) low fat (1%) cottage cheese
80
D5 1 string cheese (2% milk reduced fat)
70
6
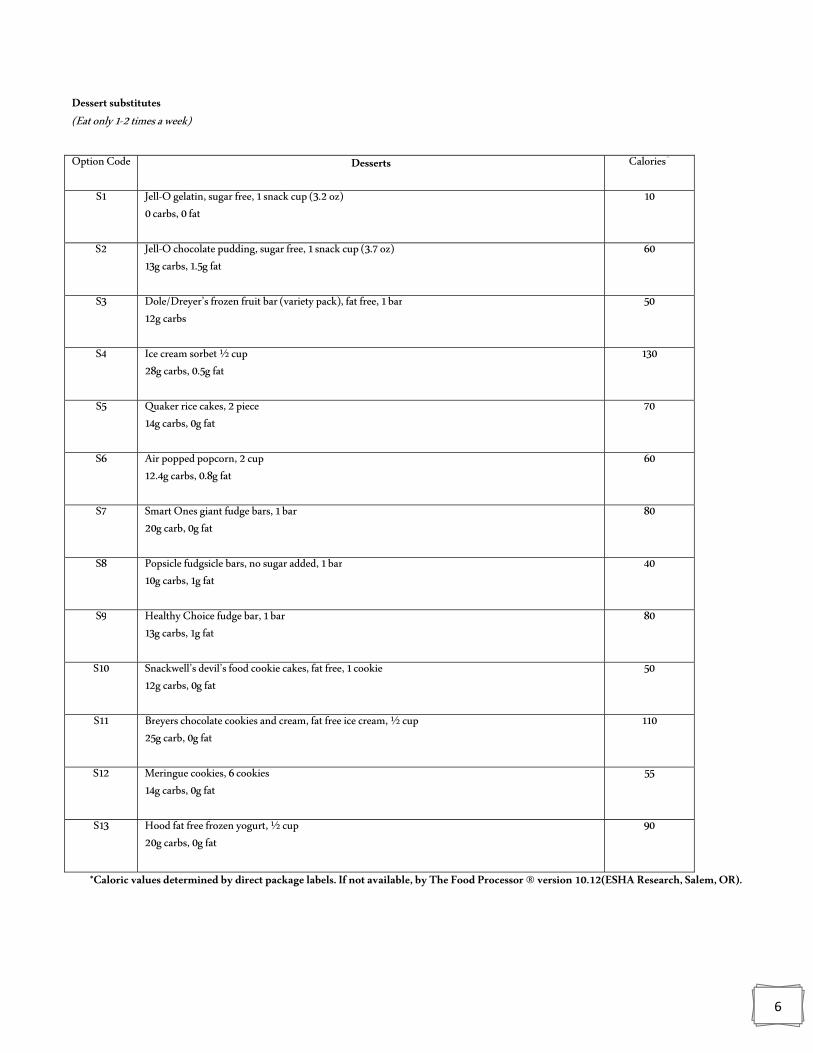
Dessert substitutes (Eat only 12 times a week)
Option Code Desserts
Calories*
S1
JellO gelatin, sugar free, 1 snack cup (3.2 oz)0 carbs, 0 fat
10
S2 JellO chocolate pudding, sugar free, 1 snack cup (3.7 oz)13g carbs, 1.5g fat
60
S3 Dole/Dreyer’s frozen fruit bar (variety pack), fat free, 1 bar12g carbs
50
S4 Ice cream sorbet ½ cup 28g carbs, 0.5g fat
130
S5 Quaker rice cakes, 2 piece 14g carbs, 0g fat
70
S6 Air popped popcorn, 2 cup 12.4g carbs, 0.8g fat
60
S7 Smart Ones giant fudge bars, 1 bar 20g carb, 0g fat
80
S8 Popsicle fudgsicle bars, no sugar added, 1 bar10g carbs, 1g fat
40
S9 Healthy Choice fudge bar, 1 bar 13g carbs, 1g fat
80
S10 Snackwell’s devil’s food cookie cakes, fat free, 1 cookie12g carbs, 0g fat
50
S11 Breyers chocolate cookies and cream, fat free ice cream, ½ cup25g carb, 0g fat
110
S12 Meringue cookies, 6 cookies 14g carbs, 0g fat
55
S13 Hood fat free frozen yogurt, ½ cup 20g carbs, 0g fat
90
*Caloric values determined by direct package labels. If not available, by The Food Processor ® version 10.12(ESHA Research, Salem, OR).
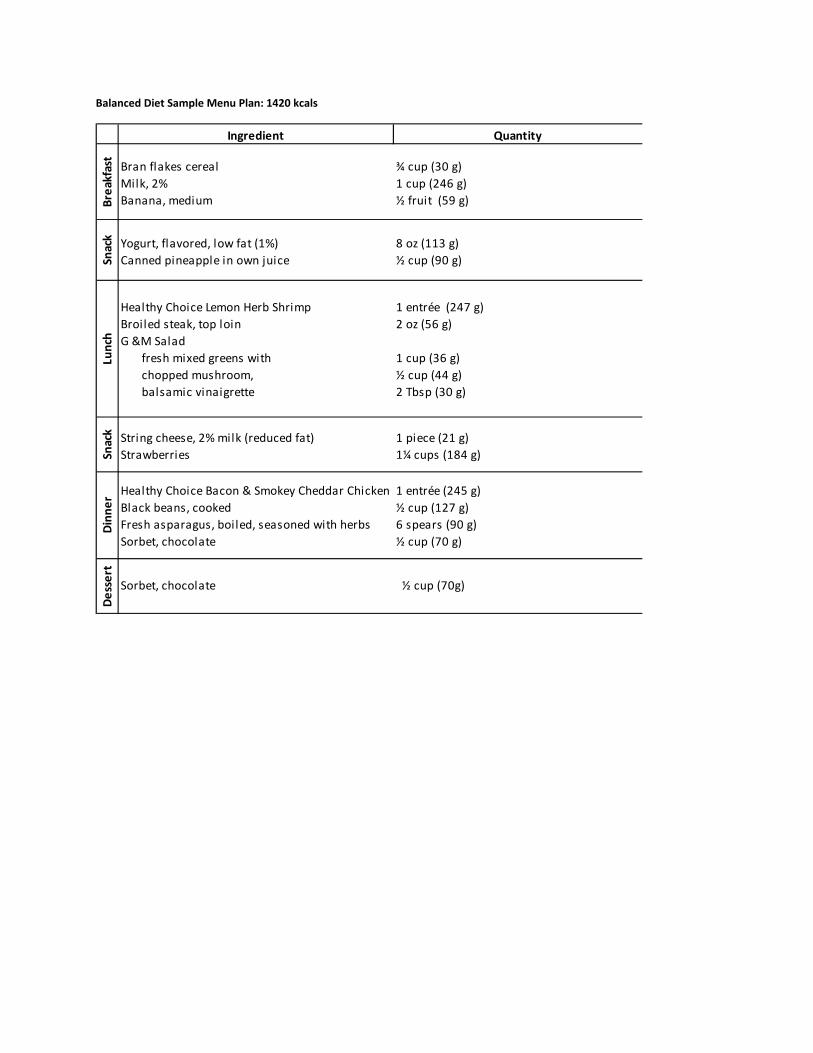
Balanced Diet Sample Menu Plan: 1420 kcals
Ingredient Quantity
Breakfast Bran flakes cereal
Milk, 2%
Banana, medium
¾ cup (30 g)
1 cup (246 g)
½ fruit (59 g)
Snack Yogurt, flavored, low fat (1%)
Canned pineapple in own juice
8 oz (113 g)
½ cup (90 g)
Lunch
Healthy Choice Lemon Herb Shrimp
Broiled steak, top loin
G &M Salad
fresh mixed greens with
chopped mushroom,
balsamic vinaigrette
1 entrée (247 g)
2 oz (56 g)
1 cup (36 g)
½ cup (44 g)
2 Tbsp (30 g)
Snack String cheese, 2% milk (reduced fat)
Strawberries
1 piece (21 g)
1¼ cups (184 g)
Dinner
Healthy Choice Bacon & Smokey Cheddar Chicken
Black beans, cooked
Fresh asparagus, boiled, seasoned with herbs
Sorbet, chocolate
1 entrée (245 g)
½ cup (127 g)
6 spears (90 g)
½ cup (70 g)
Dessert
Sorbet, chocolate ½ cup (70g)