Consolidation Committee Briefing Orange County Utilities Department August 23, 2005.
66
Consolidation Committee Briefing Orange County Utilities Department August 23, 2005
-
Upload
akira-eaker -
Category
Documents
-
view
214 -
download
1
Transcript of Consolidation Committee Briefing Orange County Utilities Department August 23, 2005.

Consolidation Committee Briefing
Orange County Utilities Department
August 23, 2005

Orange County Utilities Department
Water
Water Reclamation
Solid Waste
Engineering
Construction
Customer Service
Fiscal & Administrative Support

D e pu ty D irec to rT e re sa R em ud o -F r ies , P .E .
E ng in ee ringM an ag er
R ich ard D . W ilso n , P .E .
C o ns truc tionM an ag er
T roy La yton
D e pu ty D irec to rD a n ie l L . A llen , P .E .
F isca l & A d m in is tra tive S u p po rtM an ag er
R o n N ie lsen
W a te rM an ag er
Ja ck ie T o rb e rt
W a te r R e c la m ationM an ag er
R a y H a nso n , P .E .
S o lid W a s teM an ag er
J im B ecker
C u sto m e r S e rv iceM an ag er
R o se m ary W h ita c re
D irec to rM ich ae l L . C ha n d le r
ORGANIZATION CHART

Water and Wastewater Utilities - Summary
• Over 158,000 water and wastewater customers
• FY2004 O & M Budget - $ 89.4M• Annual CIP Budget - $70M to $100M• Annual growth past two years – 8,000 new
connections per year

Water Reclamation Division

• 1957: Martin Plant purchased (SWRF)• 1972-1980: Purchased 47 systems • 1979: EPA and DEP consent orders• 1983: Building moratorium• 1984: Constructed EWRF• 1987: Conserv II completed• 1987: Constructed NWRF• 2000: Reclaimed water rates initiated• 2004: SWRF expanded to 43 mgd
History

• Three (3) regional water reclamation facilities• 18.5 billion gallons treated annually• Average daily flow = 51 mgd• 100% reuse of effluent
Wastewater Treatment

South Water Reclamation Facility
Permitted to treat 43 mgd Reclaimed water to:
– Conserv II – Commercial and residential irrigation– RIBs

Eastern Water Reclamation Facility
Permitted to treat 19 MGD Reclaimed water to:
– Industrial cooling– RIBs– Wetlands

Northwest Water Reclamation Facility
Permitted to treat 7.5 MGD Reclaimed water to:
– RIBs– Lake augmentation

Wastewater Collections
1,069 miles of gravity main 509 miles of force main Asset management 121,600 connections
Number of Service Connections
800
0 20,000 40,000 60,000 80,000 100,000 120,000
1994
1995
1996
1997
1998
1999
2000
2001
2002
2003
2004

645 wastewater pump stations 31 odor control systems 40 stationary emergency generators 27 portable emergency generators
Wastewater Pumping

Industrial Pretreatment Program Surcharge Program Oil and Grease Prevention Program
Environmental Compliance

Reclaimed Water ProgramAgricultural
Irrigation
Wetlands
Industrial Use
RIBs
Residential & Commercial
Irrigation
0
2
4
6
8
10
12
14
MG
D

Residential & Commercial Irrigation
• 248 miles of reclaimed water mains• 91 commercial reclaimed water customers• 2,200 residential reclaimed water customers

Water Conserv II• Jointly owned by the
City of Orlando and Orange County
• Largest agricultural water reuse project in the world
• First reuse program in Florida permitted to irrigate crops intended for human consumption

Water Division

History
• Water utility since 1973
• Operated and maintained over 100 facilities during the 70’s
• During the 80’s and 90’s facilities were upgraded, consolidated and interconnected for more reliable service

History
• Today– Two (2) regional water treatment
facilities
– Eleven (11) smaller facilities
– 121,200 customers

Water Production
• Thirteen (13) treatment facilities
• Produced more than 20 billion gallons of water in 2004
• Purchased water through interconnections with other utilities 0
5
10
15
20
25
1994 1996 1998 2000 2002 2004
Annual Water Production (Billion Gallons)

Water Distribution
Number of Service Connections
800
0 20,000 40,000 60,000 80,000 100,000 120,000
1994
1995
1996
1997
1998
1999
2000
2001
2002
2003
2004
• 1,652 miles of water transmission and distribution mains
• Over 121,200 potable water connections
• Connection Growth– Average 8,000 per year
over past two years

Laboratory Overview
• Full service lab performing over 250,000 analyses/year
• Certified by DOH and EPA for >1,000 parameters
• Provide analytical services to other utilities
Numbers of Analyses Performed
0
50,000
100,000
150,000
200,000
250,000
300,000

Water Quality
• Maintain compliance monitoring for our drinking water systems
• Assess emerging issues in anticipation of future water supply needs and regulations
• Cross-Connection Program that monitors 5,200 commercial and 32,000 residential backflow devices

Water Conservation
• Educational programs– Blue Thumb Jr. Detective– Florida Friendly Landscaping Workshops– Mobile Irrigation Lab Audits
• Water Watch Program

Water Supply Challenges
• Water demands expected to double by 2025
• Limited groundwater resource• 13 municipalities• 19 water suppliers• Two water management districts
– SJRWMD and SFWMD

Water SupplyApproach
• Maximize use of groundwater for potable use
• Maximize beneficial use of reclaimed water for irrigation an recharge
• Expand and enforce water conservation
• Develop alternate water supplies– Integrated Water Resource Project

Water Supply
• Regional partnerships– Partnership with City of Cocoa, Toho
Authority and RCID– St. Johns River/Taylor Creek Reservoir
Project w/ five partners– Other municipalities

Engineering Division

Planning, GIS and Development Review
• Utilities planning
• Computer hydraulic modeling
• Mapping of utilities infrastructure
• Development Review– Subdivision plans– Commercial development– Capital Charges
• Manual of Standards and Specifications

• 375 projects over the next 5 years
• 5 Year Budget Water $148.6 Million
Wastewater $248.8 Million Support projects $ 36.1 Million
Total $433.5 Million
Average per year $ 87 Million
Capital Improvement Program

Capital Improvement Program Program
Management• Programs
– Integrated Water Resources (IWRP)– Water Distribution Rehab– Wastewater Collection Rehab
• Resource Management– Consultant Contracts– Project Managers

• Water supply issues– Consumptive Use Permitting (CUP)
• Water supply and treatment– Eastern Regional WSF Expansion– Southern Regional WSF– CR 535 WSF
• Water system improvements
Capital Improvement Program Water

• Wastewater treatment• Collection systems• Pumping stations• Reclaimed water supply• Biosolids treatment and reuse
Capital Improvement Program Water Reclamation

• Road construction utility improvements– FDOT– Municipalities– Orange County Public Works– Expressway Authority
• Special projects– Administration Building
Capital Improvement Program Transportation Related and Special Projects

Construction Division

Construction Division• Capital Improvements Program
– Constructibility review– Construction observation– Start-up– Close-out
• Development– Inspection– Project acceptance
Customer Service Division

Customer Service DivisionDevelopment and Customer Accounts
• Development– Capital charges– Transfers and refunds– Service availability
• Customer Accounts– New account set up– Customer research and adjustments – Deposit management

Customer Service DivisionField Services
• Meter Reading – 142,000 meters per month– 450 meters per reader per day
• Field Representatives– 3,500 meter turn ons and offs each month– 1,500 disconnects and restores each month
• Billing Analysts– Field customer service– 200 water audits monthly

Customer Service Division
• Call Center– 24,000 calls monthly
• Billing and Payments
• Delinquent Accounts
• Dispatch – 24 Hours– 3,000 calls monthly

Customer Service DivisionTechnical
• Project team for the Customer Information System (CIS)
• Support current systems including:– Interactive Voice Response– Itron Meter Reading– Bank lockbox files– Credit card validation software– Addressing– Mandatory Refuse and Environmental Billing files

Utilities Fiscal & Administrative
Support Division

Financial Management
• Financial planning, analysis and reporting• Revenue projections• Coordination of annual budget submissions • Rate studies • Capital financing and acquisition efforts
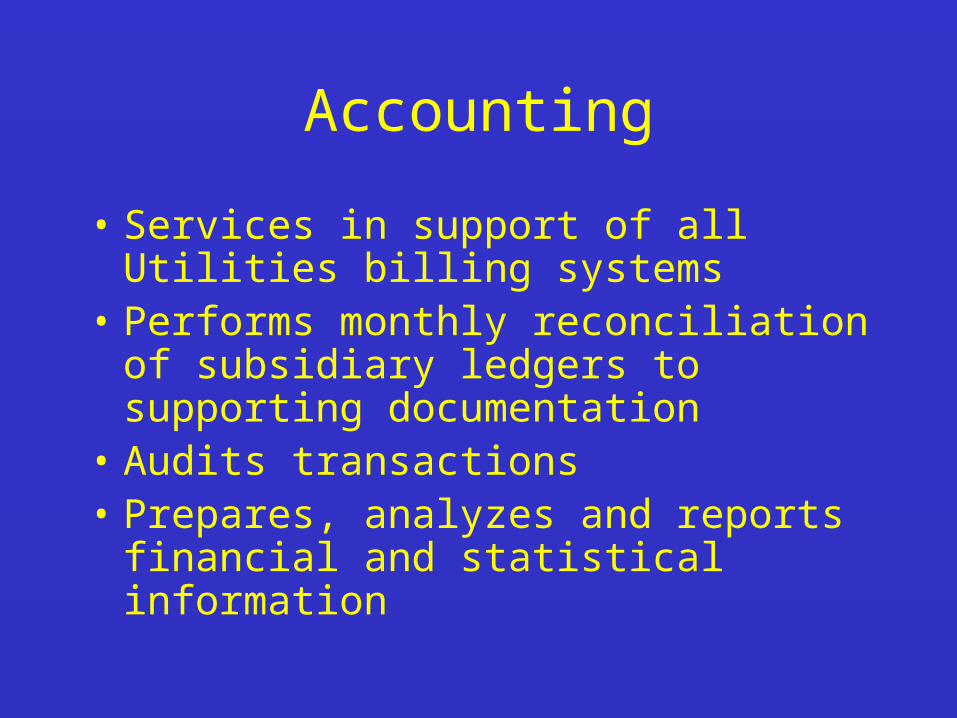
Accounting
• Services in support of all Utilities billing systems
• Performs monthly reconciliation of subsidiary ledgers to supporting documentation
• Audits transactions • Prepares, analyzes and reports financial
and statistical information

Information Technologies
• Supports Department’s technology requirements
• Coordinates development and operation of new programs and systems
• Supports and maintains Department’s LAN / WAN for over 300 users

Support Operations
• Warehouse operations
• Procurement services• Facilities management – Presidents
Drive

Administrative Services

Human Resources
• Recruitment
• Retention
• Compensation
• Training
• Employee relations

Safety Administration
• Administers Utilities safety programs and initiatives
• Coordinates safety training and emergency management efforts
• Performs safety inspections

Utilities Finances

Water and Wastewater Finances
• Enterprise Fund
• Self-sufficient from system revenues
• Outstanding Revenue Bonds– Covenant restrictions

Utilities Finances
• FY 05 O&M Budget (Millions)
– Water & Wastewater $ 89.4– Solid Waste $
20.7– Mandatory Refuse $ 25.0– Recycling $ 3.4
• Total O&M Budget $138.5

7% 3%6%
17%
31%
36%
Utilities FinancesOperating Budget by Division
FY 04 - 05 Operating Budget: $138,518,241
Solid Waste
Fiscal & Admin Support
Engineering & Construction
Customer Service
Water
Wastewater
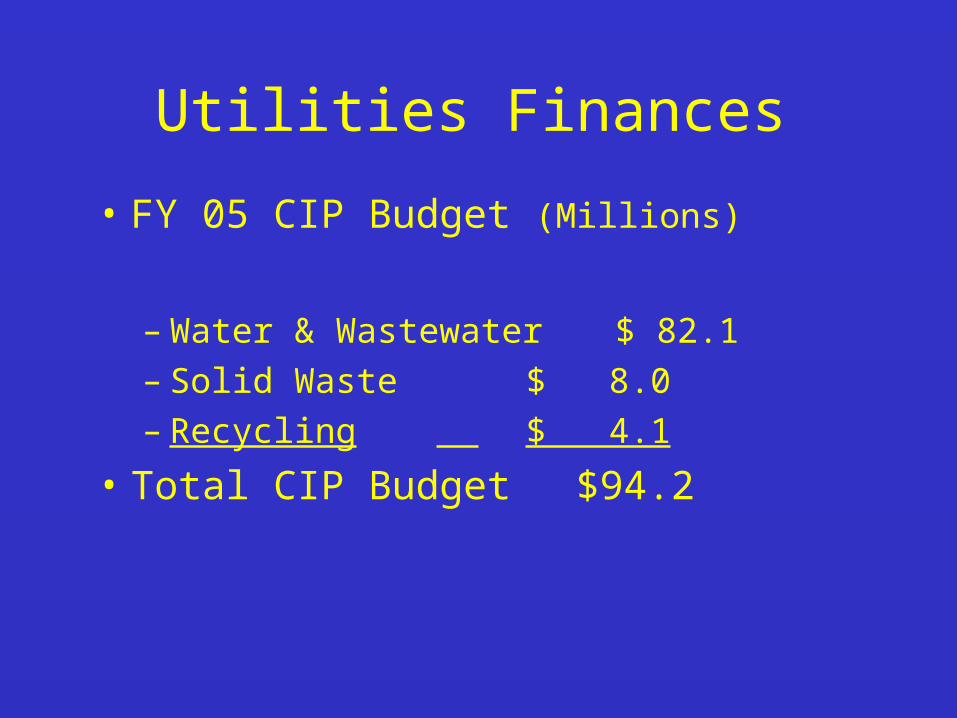
Utilities Finances
• FY 05 CIP Budget (Millions)
– Water & Wastewater $ 82.1– Solid Waste $ 8.0– Recycling $ 4.1
• Total CIP Budget $94.2
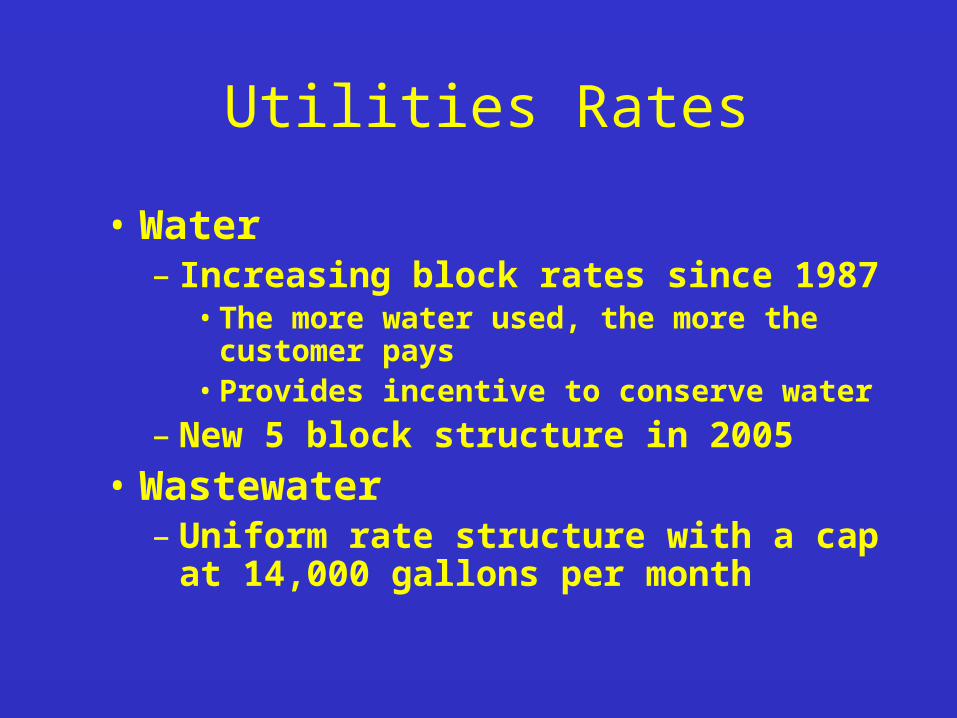
Utilities Rates
• Water– Increasing block rates since 1987
• The more water used, the more the customer pays
• Provides incentive to conserve water
– New 5 block structure in 2005
• Wastewater– Uniform rate structure with a cap at
14,000 gallons per month

Water Rate Structure
• Fixed Monthly Charge $5.47• Volume Charge
0 – 3,000 gallons $0.89 per 1,000 4,000 – 10,000 gallons $1.19 per 1,000
11,000 – 20,000 Gallons $2.38 per 1,000 21,000 – 30,000 gallons $3.57 per 1,000
Above 30,000 gallons $5.35 per 1,000
• Average Monthly Water Bill at 10,000 gallons remains – $16.47

Wastewater Rates
• Fixed Monthly Charge $13.96
• Uniform Rate Structure– Volume Charge
0 – 14,000 gallons $3.17 per 1,000– Volume Charge Cap at 14,000 Gallons
• Average Monthly Wastewater Bill at 10,000 gallons - $45.66

Reclaimed Water Rates
• Fixed Monthly Charge $3.14
• Uniform Rate Structure– Volume Charge
Usage over 4,000 gallons $0.84 per 1,000
• Commercial/Wholesale Rates– Varies by usage type and meter size

Utilities Rate History
Orange County Water Rates
0.00%
5.00%
10.00%
15.00%
20.00%
25.00%
30.00%
35.00%
FY83
FY84
FY85
FY86
FY87
FY88
FY89
FY90
FY91
FY92
FY93
FY94
FY95
FY96
FY97
FY98
FY99
FY00
FY01
FY02
FY03
FY04
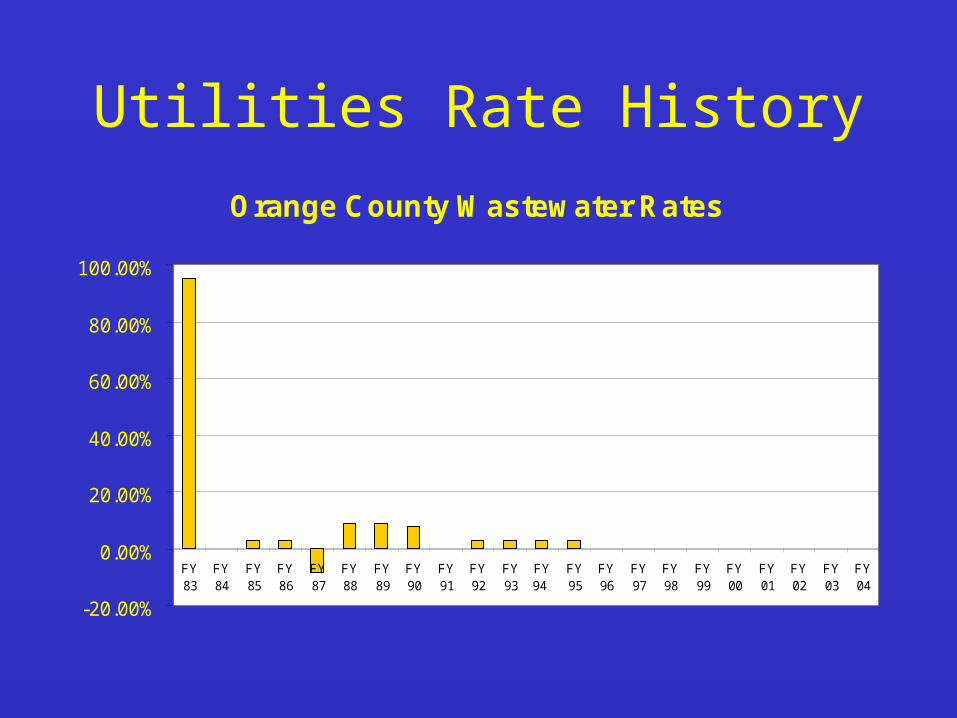
Utilities Rate HistoryOrange County Wastewater Rates
-20.00%
0.00%
20.00%
40.00%
60.00%
80.00%
100.00%
FY83
FY84
FY85
FY86
FY87
FY88
FY89
FY90
FY91
FY92
FY93
FY94
FY95
FY96
FY97
FY98
FY99
FY00
FY01
FY02
FY03
FY04

Capital Charges
Current May 1, 2006
Water $1522.50 $1,950.00
Wastewater $3077.50 $3,668.00

TerTerritorial Agreements

Territorial Agreements
• OUC Water Service Territorial Agreement– May 1994 – 1st Amendment – April 2005
• City of Orlando Wastewater Service Territorial Agreement– April 1994– 1st Amendment - May 2003– 2nd Amendment - January 2004

Territorial Agreements
• Clearly defined service areas and customer base
• Eliminate duplication of efforts– Planning for service areas– Conflicting and parallel mains– Treatment facilities near each other
• Eliminate wasteful expenditures

Territorial Agreements
• Basis for cooperation
– Temporary, permanent and emergency interconnects
– Flexibility to transfer service areas based on effectiveness of service

Consolidation Committee Briefing
Orange County Utilities Department
August 23, 2005