CONSOLIDATED STATE PERFORMANCE REPORT: Parts … · CONSOLIDATED STATE PERFORMANCE REPORT: Parts I...
74
CONSOLIDATED STATE PERFORMANCE REPORT: Parts I and II for STATE FORMULA GRANT PROGRAMS under the ELEMENTARY AND SECONDARY EDUCATION ACT As amended in 2001 For reporting on School Year 2011-12 NEW MEXICO PART I DUE THURSDAY, DECEMBER 20, 2012 PART II DUE FRIDAY, FEBRUARY 15, 2013 U.S. DEPARTMENT OF EDUCATION WASHINGTON, DC 20202
Transcript of CONSOLIDATED STATE PERFORMANCE REPORT: Parts … · CONSOLIDATED STATE PERFORMANCE REPORT: Parts I...

CONSOLIDATED STATE PERFORMANCE REPORT:
Parts I and II
for STATE FORMULA GRANT PROGRAMS
under the ELEMENTARY AND SECONDARY EDUCATION ACT
As amended in 2001
For reporting on
School Year 2011-12
NEW MEXICO
PART I DUE THURSDAY, DECEMBER 20, 2012 PART II DUE FRIDAY, FEBRUARY 15, 2013
U.S. DEPARTMENT OF EDUCATION
WASHINGTON, DC 20202

OMB NO. 1810-0614 Page 2
INTRODUCTION
Sections 9302 and 9303 of the Elementary and Secondary Education Act (ESEA), as amended in 2001 provide to States the option of applying for and reporting on multiple ESEA programs through a single consolidated application and report. Although a central, practical purpose of the Consolidated State Application and Report is to reduce "red tape" and burden on States, the Consolidated State Application and Report are also intended to have the important purpose of encouraging the integration of State, local, and ESEA programs in comprehensive planning and service delivery and enhancing the likelihood that the State will coordinate planning and service delivery across multiple State and local programs. The combined goal of all educational agencies–State, local, and Federal–is a more coherent, well-integrated educational plan that will result in improved teaching and learning. The Consolidated State Application and Report includes the following ESEA programs:
Title I, Part A – Improving Basic Programs Operated by Local Educational Agencies
Title I, Part B, Subpart 3 – William F. Goodling Even Start Family Literacy Programs
Title I, Part C – Education of Migratory Children (Includes the Migrant Child Count)
Title I, Part D – Prevention and Intervention Programs for Children and Youth Who Are Neglected, Delinquent, or At-Risk
Title II, Part A – Improving Teacher Quality State Grants (Teacher and Principal Training and Recruiting Fund)
Title III, Part A – English Language Acquisition, Language Enhancement, and Academic Achievement Act
Title IV, Part A, Subpart 1 – Safe and Drug-Free Schools and Communities State Grants
Title IV, Part A, Subpart 2 – Safe and Drug-Free Schools and Communities National Activities (Community Service Grant Program)
Title V, Part A – Innovative Programs
Title VI, Section 6111 – Grants for State Assessments and Related Activities
Title VI, Part B – Rural Education Achievement Program
Title X, Part C – Education for Homeless Children and Youths

OMB NO. 1810-0614 Page 3
The ESEA Consolidated State Performance Report (CSPR) for school year (SY) 2011-12 consists of two Parts, Part I and
Part II. PART I
Part I of the CSPR requests information related to the five ESEA Goals, established in the June 2002 Consolidated State Application, and information required for the Annual State Report to the Secretary, as described in Section 1111(h)(4) of the ESEA. The five ESEA Goals established in the June 2002 Consolidated State Application are:
Performance Goal 1: By SY 2013-14, all students will reach high standards, at a minimum attaining
proficiency or better in reading/language arts and mathematics.
Performance Goal 2: All limited English proficient students will become proficient in English and reach high
academic standards, at a minimum attaining proficiency or better in reading/language arts and mathematics.
Performance Goal 3: By SY 2005-06, all students will be taught by highly qualified teachers.
Performance Goal 4: All students will be educated in learning environments that are safe, drug free, and conducive to learning.
Performance Goal 5: All students will graduate from high school
Beginning with the CSPR SY 2005-06 collection, the Education of Homeless Children and Youths was added. The Migrant Child count was added for the SY 2006-07 collection.
PART II
Part II of the CSPR consists of information related to State activities and outcomes of specific ESEA programs. While the
information requested varies from program to program, the specific information requested for this report meets the following criteria:
1. The information is needed for Department program performance plans or for other program needs. 2. The information is not available from another source, including program evaluations pending full implementation of
required EDFacts submission. 3. The information will provide valid evidence of program outcomes or results.

OMB NO. 1810-0614 Page 4
GENERAL INSTRUCTIONS AND TIMELINES All States that received funding on the basis of the Consolidated State Application for the SY 2011-12 must respond to this Consolidated State Performance Report (CSPR). Part I of the Report is due to the Department by Thursday, December 20,
2012. Part II of the Report is due to the Department by Friday, February 15, 2013. Both Part I and Part II should reflect data
from the SY 2011-12, unless otherwise noted.
The format states will use to submit the Consolidated State Performance Report has changed to an online submission starting with SY 2004-05. This online submission system is being developed through the Education Data Exchange Network (EDEN) and will make the submission process less burdensome. Please see the following section on transmittal instructions for more information on how to submit this year's Consolidated State Performance Report.
TRANSMITTAL INSTRUCTIONS
The Consolidated State Performance Report (CSPR) data will be collected online from the SEAs, using the EDEN web site. The EDEN web site will be modified to include a separate area (sub-domain) for CSPR data entry. This area will utilize EDEN formatting to the extent possible and the data will be entered in the order of the current CSPR forms. The data entry screens will include or provide access to all instructions and notes on the current CSPR forms; additionally, an effort will be made to design the screens to balance efficient data collection and reduction of visual clutter.
Initially, a state user will log onto EDEN and be provided with an option that takes him or her to the "SY 2011-12 CSPR". The main CSPR screen will allow the user to select the section of the CSPR that he or she needs to either view or enter data. After selecting a section of the CSPR, the user will be presented with a screen or set of screens where the user can input the data for that section of the CSPR. A user can only select one section of the CSPR at a time. After a state has included all available data in the designated sections of a particular CSPR Part, a lead state user will certify that Part and transmit it to the Department. Once a Part has been transmitted, ED will have access to the data. States may still make changes or additions to the transmitted data, by creating an updated version of the CSPR. Detailed instructions for transmitting the SY 2011-12 CSPR will be found on the main CSPR page of the EDEN web site (https://EDEN.ED.GOV/EDENPortal/).

OMB NO. 1810-0614 Page 5
OMB Number: 1810-0614
Expiration Date: 11/30/2013
Consolidated State Performance Report For
State Formula Grant Programs under the
Elementary And Secondary Education Act as amended in 2001
Check the one that indicates the report you are submitting: X Part I, 2011-12 Part II, 2011-12
Name of State Educational Agency (SEA) Submitting This Report: New Mexico Public Education Department
Address: 300 Don Gaspar Avenue Santa Fe, NM 87501
Person to contact about this report:
Name: Lisa Hamilton
Telephone: 505-827-7931
Fax: 505-827-1826
e-mail: [email protected]
Name of Authorizing State Official: (Print or Type): Lisa Hamilton
Friday, March 8, 2013, 4:03:37 PM Signature

OMB NO. 1810-0614 Page 6
CONSOLIDATED STATE PERFORMANCE REPORT PART I
For reporting on
School Year 2011-12
PART I DUE DECEMBER 20, 2012 5PM EST

OMB NO. 1810-0614 Page 7
1.1 STANDARDS AND ASSESSMENT DEVELOPMENT
STANDARDS OF ASSESSMENT DEVELOPMENT
This section requests descriptions of the State's implementation of the Elementary and Secondary Education Act, as amended (ESEA) academic content standards, academic achievement standards and assessments to meet the requirements of Section 1111(b)(1) of ESEA.
1.1.1 Academic Content Standards
Indicate below whether your state has made or is planning to make revisions to or change the State's academic content standards in mathematics, reading/language arts or science since the State's content standards were most recently approved through ED's peer review process for State assessment systems. If yes, indicate specifically in what school year your State implemented or will implement the revisions or changes.
No Revisions or changes
No revisions or changes to academic content standards in mathematics, reading/language arts or science made or planned.
State has revised or changed its academic content standards in mathematics, reading/language arts or science or is planning to make revisions to or change its academic content standards in mathematics, reading/language arts or science. Indicate below the year these changes were or will be implemented or “Not Applicable” to indicate that changes were not made or will not be made in the subject area.
Acceptable responses are a school year (e.g., 2011-12) or Not Applicable.
Mathematics Reading/Language Arts Science
Academic Content Standards Not Applicable Not Applicable Not Applicable
If the responses above do not fully describe revisions or changes to your State's academic achievement standards, describe the revisions or changes below. The response is limited to 1,000 characters
Not Applicable

OMB NO. 1810-0614 Page 8
1.1.1.1 Academic Achievement Standards in Mathematics, Reading/Language Arts and Science
Indicate below whether your state has changed or is planning to change the State's academic achievement standards in mathematics, reading/language arts or science since the State's academic achievement standards were most recently approved through ED's peer review process for State assessment systems. If yes, indicate specifically in what school year your State implemented or will implement the changes.
As applicable, include changes to academic achievement standards based on any assessments (e.g., alternate assessments based on alternate achievement standards, alternate assessments based on modified achievement standards, native language assessments, or others) implemented to meet the assessment requirements under Section 1111(b)(3) of ESEA.
No Revisions or changes
No revisions or changes to academic content standards in mathematics, reading/language arts or science made or planned.
State has changed its academic achievement standards or is planning to change its academic achievement standards in mathematics, reading/language arts or science. Indicate below either the school year in which these changes were or will be implemented or “Not Applicable” to indicate that changes were not made or will not be made in the subject area.
Acceptable responses are a school year (e.g., 2011-12) or Not Applicable.
Academic Achievement Standards for Mathematics Reading/Language Arts Science
Regular Assessments in Grades 3-8 Not Applicable Not Applicable Not Applicable
Regular Assessments in High School Not Applicable Not Applicable Not Applicable
Alternate Assessments Based on Grade-Level Achievement Standards (if applicable)
Not Applicable
Not Applicable
Not Applicable
Alternate Assessments Based on Modified Achievement Standards (if applicable)
Not Applicable
Not Applicable
Not Applicable
Alternate Assessments Based on Alternate Achievement Standards
Not Applicable
Not Applicable
Not Applicable
If the responses above do not fully describe revisions or changes to your State's academic achievement standards, describe the revisions or changes below. The response is limited to 1,000 characters
Not Applicable

OMB NO. 1810-0614 Page 9
1.1.2 Assessments in Mathematics and Reading/Language Arts and Science
Indicate below whether your state has changed or is planning to change the State's academic assessments in mathematics, reading/language arts or science since the State's academic assessments were most recently approved through ED's peer review process for State assessment systems. If yes, indicate specifically in what school year your State implemented or will implement the changes.
As applicable, include any assessments (e.g., alternate assessments based on alternate achievement standards, alternate assessments based on modified achievement standards, native language assessments, or others) implemented to meet the assessment requirements under Section 1111(b)(3) of ESEA.
No Revisions or changes
No changes to assessments in mathematics, reading/language arts or science made or planned.
State has changed or is planning to change its assessments in mathematics, reading/language arts or science. Indicate below the year these changes were implemented or “Not Applicable” to indicate that changes were not made or will not be made in the subject area.
Acceptable responses are a school year (e.g., 2011-12) or Not Applicable.
Academic Assessments Mathematics Reading/Language Arts Science
Regular Assessments in Grades 3-8 Not Applicable Not Applicable Not Applicable
Regular Assessments in High School Not Applicable Not Applicable Not Applicable
Alternate Assessments Based on Grade-Level Achievement Standards (if applicable)
Not Applicable
Not Applicable
Not Applicable
Alternate Assessments Based on Modified Achievement Standards (if applicable)
Not Applicable
Not Applicable
Not Applicable
Alternate Assessments Based on Alternate Achievement Standards
Not Applicable
Not Applicable
Not Applicable
If the responses above do not fully describe revisions or changes to your State's academic achievement standards, describe the revisions or changes below. The response is limited to 1,000 characters
Not Applicable

OMB NO. 1810-0614 Page 10
1.1.3 Grants for State Assessments and Related Activities
1.1.3.1 Percentages of Funds Used for Standards and Assessment Development and Other Purposes
For funds your State had available under ESEA section 6111 (Grants for State Assessments and Related Activities) during
SY 2011-12, estimate what percentage of the funds your State used for the following (round to the nearest ten percent).
Purpose
Percentage (rounded to
the nearest ten percent)
To pay the costs of the development of the State assessments and standards required by section 1111(b)
90.00
To administer assessments required by section 1111(b) or to carry out other activities described in section 6111 and other activities related to ensuring that the State's schools and local educational agencies are held accountable for the results
10.00
Comments: The response is limited to 4,000 characters. Not Applicable
1.1.3.2 Uses of Funds for Purposes Other than Standards and Assessment Development
For funds your State had available under ESEA section 6111 (Grants for State Assessments and Related Activities) during SY 2011-12 that were used for purposes other than the costs of the development of the State assessments and standards required by section 1111(b), for what purposes did your State use the funds? (Enter "yes" for all that apply and "no" for all that do not apply).
Purpose
Used for
Purpose
(yes/no)
Administering assessments required by section 1111(b) Yes
Developing challenging State academic content and student academic achievement standards and aligned assessments in academic subjects for which standards and assessments are not required by section 1111 (b)
No
Developing or improving assessments of English language proficiency necessary to comply with section 1111(b)(7)
Yes
Ensuring the continued validity and reliability of State assessments, and/or refining State assessments to ensure their continued alignment with the State's academic content standards and to improve the alignment of curricula and instructional materials
Yes
Developing multiple measures to increase the reliability and validity of State assessment systems Yes
Strengthening the capacity of local educational agencies and schools to provide all students the opportunity to increase educational achievement, including carrying out professional development activities aligned with State student academic achievement standards and assessments
Yes
Expanding the range of accommodations available to students with limited English proficiency and students with disabilities (IDEA) to improve the rates of inclusion of such students, including professional development activities aligned with State academic achievement standards and assessments
No
Improving the dissemination of information on student achievement and school performance to parents and the community, including the development of information and reporting systems designed to identify best educational practices based on scientifically based research or to assist in linking records of student achievement, length of enrollment, and graduation over time
Yes
Other No
Comments: The response is limited to 4,000 characters. Not Applicable

OMB NO. 1810-0614 Page 11
1.2 PARTICIPATION IN STATE ASSESSMENTS
This section collects data on the participation of students in the State assessments. Note: States are not required to report these data by the seven (7) racial/ethnic groups; instead, they are required to report these data by the major racial and ethnic groups that are identified in their Accountability Workbooks. The charts below display racial/ethnic data that has been mapped back from the major racial and ethnic groups identified in their workbooks, to the 7 racial/ethnic groups to allow for the examination of data across states.
1.2.1 Participation of all Students in Mathematics Assessment
In the table below, provide the number of students enrolled during the State's testing window for mathematics assessments required under Section 1111(b)(3) of ESEA (regardless of whether the students were present for a full academic year) and the number of students who participated in the mathematics assessment in accordance with ESEA. The percentage of students who were tested for mathematics will be calculated automatically.
The student group "children with disabilities (IDEA)" includes children who participated in the regular assessments with or without accommodations and alternate assessments. Do not include former students with disabilities (IDEA). Do not include students only covered under Section 504 of the Rehabilitation Act of 1973.
The student group "limited English proficient (LEP) students" includes recently arrived students who have attended schools in the United Sates for fewer than 12 months. Do not include former LEP students.
Student Group
# Students
Enrolled # Students Participating
Percentage of Students
Participating
All students S 172,976 >=99
American Indian or Alaska Native S 17,452 >=99
Asian S 2,525 >=99
Black or African American S 3,928 >=99
Hispanic or Latino S 104,091 >=99
Native Hawaiian or other Pacific Islander
White S 44,980 >=99
Two or more races Children with disabilities (IDEA) S 22,631 >=99
Limited English proficient (LEP) students
S
26,832
>=99
Economically disadvantaged students
S
120,914
>=99
Migratory students S 205 >=98
Male S 88,003 >=99
Female S 84,973 >=99
Comments: The response is limited to 4,000 characters. Native Hawaiian and Two or More Races categories are not
recognized by New Mexico's accountability system. They will not be reported.

OMB NO. 1810-0614 Page 12
1.2.2 Participation of Students with Disabilities in Mathematics Assessment
In the table below, provide the number of children with disabilities (IDEA) participating during the State's testing window in mathematics assessments required under Section 1111(b)(3) of ESEA (regardless of whether the children were present for a full academic year) by the type of assessment. The percentage of children with disabilities (IDEA) who participated in the mathematics assessment for each assessment option will be calculated automatically. The total number of children with disabilities (IDEA) participating will also be calculated automatically.
The data provided below should include mathematics participation data from all students with disabilities as defined under the Individuals with Disabilities Education Act(IDEA). Do not include former students with disabilities (IDEA). Do not include students only covered under Section 504 of the Rehabilitation Act of 1973.
Type of Assessment
# Children with
Disabilities (IDEA)
Participating
Percentage of Children with Disabilities
(IDEA) Participating, Who Took the
Specified Assessment
Regular Assessment without Accommodations 7,585 33.52
Regular Assessment with Accommodations 13,446 59.41
Alternate Assessment Based on Grade-Level Achievement Standards
Alternate Assessment Based on Modified Achievement Standards
Alternate Assessment Based on Alternate Achievement Standards
1,600
7.07
Total 22,631 ///////////////////////////////////////////////
/////////////// Comments: The response is limited to 4,000 characters.

OMB NO. 1810-0614 Page 13
1.2.3 Participation of All Students in the Reading/Language Arts Assessment
This section is similar to 1.2.1 and collects data on the State's reading/language arts assessment.
Student Group
# Students
Enrolled # Students Participating
Percentage of Students
Participating
All students S 173,074 >=99
American Indian or Alaska Native S 17,487 >=99
Asian S 2,512 >=99
Black or African American S 3,922 >=99
Hispanic or Latino S 104,150 >=99
Native Hawaiian or other Pacific Islander
White S 45,003 >=99
Two or more races Children with disabilities (IDEA) S 22,629 >=99
Limited English proficient (LEP) students
S
26,795
>=99
Economically disadvantaged students
S
120,995
>=99
Migratory students S 205 >=98
Male S 88,057 >=99
Female S 85,017 >=99
Comments: The response is limited to 4,000 characters. Native Hawaiian and Two or More Races categories are not
recognized by New Mexico's accountability system. They will not be reported.
1.2.3.1 Recently Arrived LEP Students Taking ELP Assessments in Lieu of Reading/Language Arts Assessment
In the table below, provide the number of recently arrived LEP students (as defined in 34 C.F.R. Part 200.6(b)(4)) included in the participation counts in 1.2.3 and 1.3.2.1 who took an assessment of English language proficiency in lieu of the State's reading/language arts assessment, as permitted under 34 C.F.R. Part 200.20.
Recently arrived LEP students who took an assessment of English language proficiency in lieu of the State's reading/language arts assessment
56

OMB NO. 1810-0614 Page 14
1.2.4 Participation of Students with Disabilities in Reading/Language Arts Assessment
This section is similar to 1.2.2 and collects data on the State's reading/language arts assessment.
The data provided should include reading/language arts participation data from all students with disabilities as defined under the Individuals with Disabilities Education Act (IDEA). Do not include former students with disabilities (IDEA). Do not include students only covered under Section 504 of the Rehabilitation Act of 1973. Note: For this question only, report on students with disabilities (IDEA) who are also LEP students in the U.S. less than 12 months who took the ELP in lieu of the statewide reading/language arts assessment.
Type of Assessment
# Children with
Disabilities (IDEA)
Participating
Percentage of Children with Disabilities
(IDEA) Participating, Who Took the
Specified Assessment
Regular Assessment without Accommodations 17,333 76.60
Regular Assessment with Accommodations 3,671 16.22
Alternate Assessment Based on Grade-Level Achievement Standards
Alternate Assessment Based on Modified Achievement Standards
Alternate Assessment Based on Alternate Achievement Standards
1,625
7.18
LEP < 12 months, took ELP Total 22,629 //////////////////////////////////////////////
//////////////// Comments: The response is limited to 4,000 characters.
OMB NO. 1810-0614 Page 15
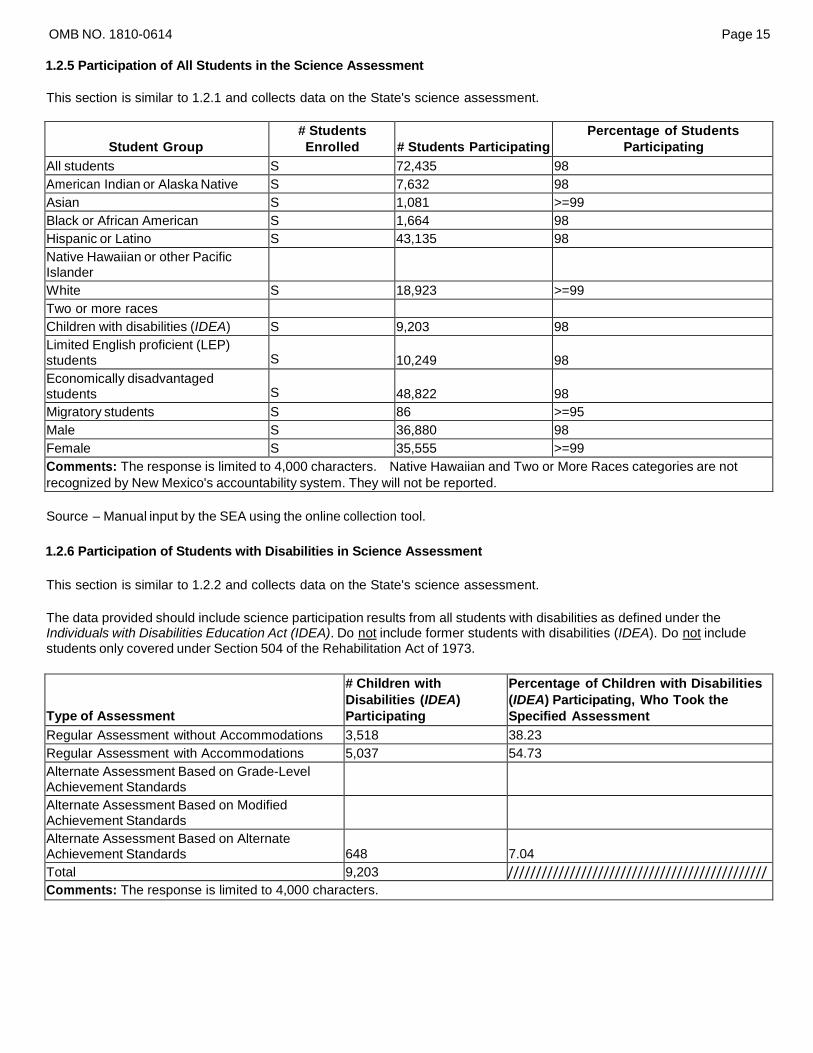
1.2.5 Participation of All Students in the Science Assessment
This section is similar to 1.2.1 and collects data on the State's science assessment.
Student Group
# Students
Enrolled # Students Participating
Percentage of Students
Participating
All students S 72,435 98
American Indian or Alaska Native S 7,632 98
Asian S 1,081 >=99
Black or African American S 1,664 98
Hispanic or Latino S 43,135 98
Native Hawaiian or other Pacific Islander
White S 18,923 >=99
Two or more races Children with disabilities (IDEA) S 9,203 98
Limited English proficient (LEP) students
S
10,249
98
Economically disadvantaged students
S
48,822
98
Migratory students S 86 >=95
Male S 36,880 98
Female S 35,555 >=99
Comments: The response is limited to 4,000 characters. Native Hawaiian and Two or More Races categories are not
recognized by New Mexico's accountability system. They will not be reported.
Source – Manual input by the SEA using the online collection tool.
1.2.6 Participation of Students with Disabilities in Science Assessment
This section is similar to 1.2.2 and collects data on the State's science assessment.
The data provided should include science participation results from all students with disabilities as defined under the Individuals with Disabilities Education Act (IDEA). Do not include former students with disabilities (IDEA). Do not include students only covered under Section 504 of the Rehabilitation Act of 1973.
Type of Assessment
# Children with
Disabilities (IDEA)
Participating
Percentage of Children with Disabilities
(IDEA) Participating, Who Took the
Specified Assessment
Regular Assessment without Accommodations 3,518 38.23
Regular Assessment with Accommodations 5,037 54.73
Alternate Assessment Based on Grade-Level Achievement Standards
Alternate Assessment Based on Modified Achievement Standards
Alternate Assessment Based on Alternate Achievement Standards
648
7.04
Total 9,203 //////////////////////////////////////////////
//////////////// Comments: The response is limited to 4,000 characters.
OMB NO. 1810-0614 Page 16
1.3 STUDENT ACADEMIC ACHIEVEMENT
This section collects data on student academic achievement on the State assessments. Note: States are not required to report these data by the seven (7) racial/ethnic groups; instead, they are required to report these data by the major racial and ethnic groups that are identified in their Accountability Workbooks. The charts below display racial/ethnic data that has been mapped back from the major racial and ethnic groups identified in their workbooks, to the 7 racial/ethnic groups to allow for the examination of data across states.
1.3.1 Student Academic Achievement in Mathematics
In the format of the table below, provide the number of students who received a valid score on the State assessment(s) in mathematics implemented to meet the requirements of Section 1111(b)(3) of ESEA (regardless of whether the students were present for a full academic year) and for whom a proficiency level was assigned, and the number of these students who scored at or above proficient, in grades 3 through 8 and high school. The percentage of students who scored at or above proficient is calculated automatically.
The student group "children with disabilities (IDEA)" includes children who participated, and for whom a proficiency level was assigned in the regular assessments with or without accommodations and alternate assessments. Do not include former students with disabilities (IDEA). The student group "limited English proficient (LEP) students" does include recently arrived students who have attended schools in the United States for fewer than 12 months. Do not include former LEP students.

OMB NO. 1810-0614 Page 17
1.3.1.1 Student Academic Achievement in Mathematics - Grade 3
Grade 3
# Students Who Received a
Valid Score and for Whom a
Proficiency
Level Was Assigned
# Students
Scoring at or
Above Proficient
Percentage of
Students
Scoring at or
Above Proficient
All students 25,438 S 53
American Indian or Alaska Native 2,473 S 37
Asian 406 S 77
Black or African American 564 S 47
Hispanic or Latino 15,543 S 48
Native Hawaiian or other Pacific Islander White 6,452 S 69
Two or more races Children with disabilities (IDEA) 3,215 S 24
Limited English proficient (LEP) students 5,626 S 31
Economically disadvantaged students 18,880 S 45
Migratory students 27 S 33
Male 12,824 S 52
Female 12,614 S 53
Comments: The response is limited to 4,000 characters. New Mexico does not report Native Hawaiian or other Pacific
Islander, or Two or More Races for accountability.
1.3.2.1 Student Academic Achievement in Reading/Language Arts - Grade 3
Grade 3
# Students Who Received a
Valid Score and for Whom a
Proficiency
Level Was Assigned
# Students
Scoring at or
Above Proficient
Percentage of
Students
Scoring at or
Above Proficient
All students 25,431 S 52
American Indian or Alaska Native 2,474 S 36
Asian 400 S 75
Black or African American 561 S 48
Hispanic or Latino 15,547 S 48
Native Hawaiian or other Pacific Islander White 6,449 S 68
Two or more races Children with disabilities (IDEA) 3,209 S 21
Limited English proficient (LEP) students 5,615 S 28
Economically disadvantaged students 18,878 S 45
Migratory students 27 S 44
Male 12,822 S 47
Female 12,609 S 57
Comments: The response is limited to 4,000 characters. New Mexico does not report Native Hawaiian or other Pacific
Islander, or Two or More Races for accountability.
OMB NO. 1810-0614 Page 18
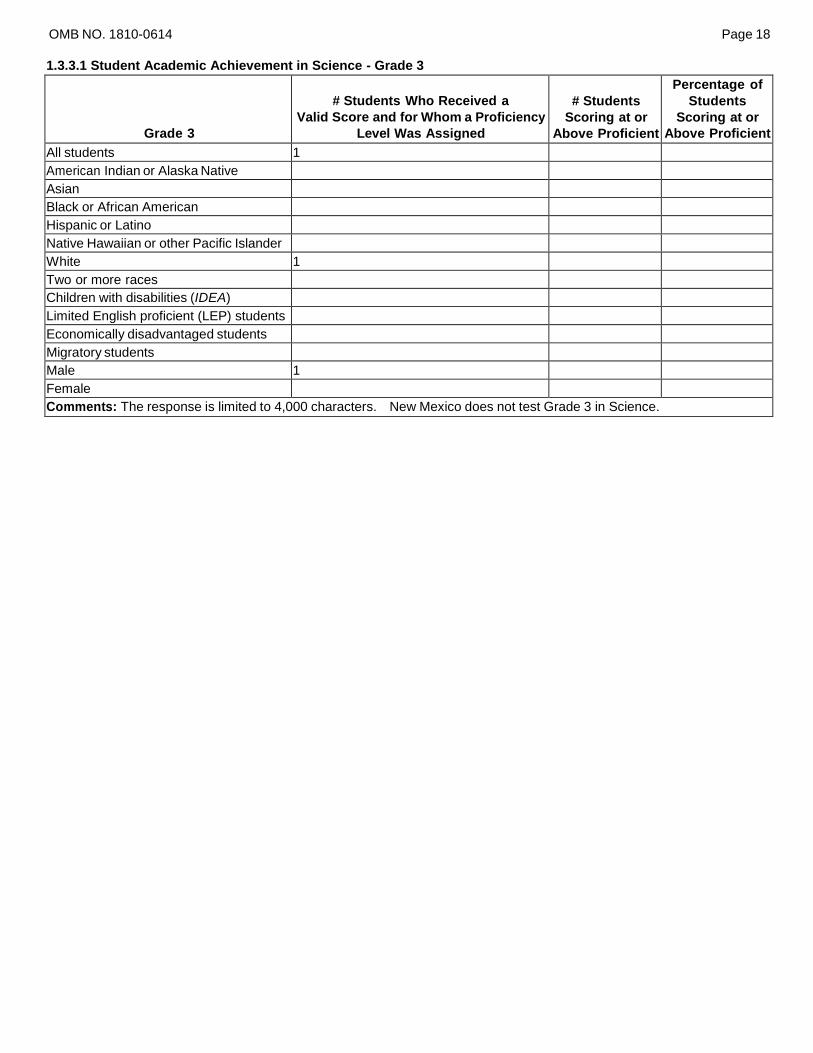
1.3.3.1 Student Academic Achievement in Science - Grade 3
Grade 3
# Students Who Received a
Valid Score and for Whom a Proficiency
Level Was Assigned
# Students
Scoring at or
Above Proficient
Percentage of
Students
Scoring at or
Above Proficient
All students 1 American Indian or Alaska Native Asian Black or African American Hispanic or Latino Native Hawaiian or other Pacific Islander White 1 Two or more races Children with disabilities (IDEA) Limited English proficient (LEP) students Economically disadvantaged students Migratory students Male 1 Female Comments: The response is limited to 4,000 characters. New Mexico does not test Grade 3 in Science.

OMB NO. 1810-0614 Page 19
1.3.1.2 Student Academic Achievement in Mathematics - Grade 4
Grade 4
# Students Who Received a
Valid Score and for Whom a
Proficiency
Level Was Assigned
# Students
Scoring at or
Above Proficient
Percentage of
Students
Scoring at or
Above Proficient
All students 25,545 S 44
American Indian or Alaska Native 2,508 S 30
Asian 381 S 74
Black or African American 571 S 40
Hispanic or Latino 15,689 S 38
Native Hawaiian or other Pacific Islander White 6,396 S 62
Two or more races Children with disabilities (IDEA) 3,527 S 16
Limited English proficient (LEP) students 4,585 S 19
Economically disadvantaged students 18,885 S 36
Migratory students 28 S 25
Male 12,991 S 44
Female 12,554 S 44
Comments: The response is limited to 4,000 characters. New Mexico does not report Native Hawaiian or other Pacific
Islander, or Two or More Races for accountability.
1.3.2.2 Student Academic Achievement in Reading/Language Arts - Grade 4
Grade 4
# Students Who Received a
Valid Score and for Whom a
Proficiency
Level Was Assigned
# Students
Scoring at or
Above Proficient
Percentage of
Students
Scoring at or
Above Proficient
All students 25,555 S 50
American Indian or Alaska Native 2,517 S 34
Asian 377 S 75
Black or African American 572 S 50
Hispanic or Latino 15,695 S 45
Native Hawaiian or other Pacific Islander White 6,394 S 67
Two or more races Children with disabilities (IDEA) 3,525 S 17
Limited English proficient (LEP) students 4,577 S 18
Economically disadvantaged students 18,892 S 42
Migratory students 28 S 43
Male 13,001 S 44
Female 12,554 S 56
Comments: The response is limited to 4,000 characters. New Mexico does not report Native Hawaiian or other Pacific
Islander, or Two or More Races for accountability.

OMB NO. 1810-0614 Page 20
1.3.3.2 Student Academic Achievement in Science - Grade 4
Grade 4
# Students Who Received a
Valid Score and for Whom a
Proficiency
Level Was Assigned
# Students
Scoring at or
Above Proficient
Percentage of
Students
Scoring at or
Above Proficient
All students 25,513 S 47
American Indian or Alaska Native 2,510 S 25
Asian 380 S 70
Black or African American 571 S 46
Hispanic or Latino 15,666 S 41
Native Hawaiian or other Pacific Islander White 6,386 S 69
Two or more races Children with disabilities (IDEA) 3,522 S 20
Limited English proficient (LEP) students 4,571 S 17
Economically disadvantaged students 18,860 S 39
Migratory students 29 S 28
Male 12,982 S 48
Female 12,531 S 46
Comments: The response is limited to 4,000 characters. New Mexico does not report Native Hawaiian or other Pacific
Islander, or Two or More Races for accountability.

OMB NO. 1810-0614 Page 21
1.3.1.3 Student Academic Achievement in Mathematics - Grade 5
Grade 5
# Students Who Received a
Valid Score and for Whom a
Proficiency
Level Was Assigned
# Students
Scoring at or
Above Proficient
Percentage of
Students
Scoring at or
Above Proficient
All students 25,557 S 44
American Indian or Alaska Native 2,451 S 30
Asian 364 S 71
Black or African American 565 S 34
Hispanic or Latino 15,597 S 38
Native Hawaiian or other Pacific Islander White 6,580 S 61
Two or more races Children with disabilities (IDEA) 3,623 S 15
Limited English proficient (LEP) students 4,127 S 15
Economically disadvantaged students 18,776 S 36
Migratory students 38 S 32
Male 13,054 S 42
Female 12,503 S 45
Comments: The response is limited to 4,000 characters. New Mexico does not report Native Hawaiian or other Pacific
Islander, or Two or More Races for accountability.
1.3.2.3 Student Academic Achievement in Reading/Language Arts - Grade 5
Grade 5
# Students Who Received a
Valid Score and for Whom a
Proficiency
Level Was Assigned
# Students
Scoring at or
Above Proficient
Percentage of
Students
Scoring at or
Above Proficient
All students 25,569 S 55
American Indian or Alaska Native 2,456 S 36
Asian 365 S 78
Black or African American 564 S 49
Hispanic or Latino 15,607 S 50
Native Hawaiian or other Pacific Islander White 6,577 S 73
Two or more races Children with disabilities (IDEA) 3,623 S 18
Limited English proficient (LEP) students 4,127 S 19
Economically disadvantaged students 18,786 S 47
Migratory students 38 S 42
Male 13,064 S 49
Female 12,505 S 61
Comments: The response is limited to 4,000 characters. New Mexico does not report Native Hawaiian or other Pacific
Islander, or Two or More Races for accountability.

OMB NO. 1810-0614 Page 22
1.3.3.3 Student Academic Achievement in Science - Grade 5
Grade 5
# Students Who Received a
Valid Score and for Whom a Proficiency
Level Was Assigned
# Students
Scoring at or
Above Proficient
Percentage of
Students
Scoring at or
Above Proficient
All students American Indian or Alaska Native Asian Black or African American Hispanic or Latino Native Hawaiian or other Pacific Islander White Two or more races Children with disabilities (IDEA) Limited English proficient (LEP) students Economically disadvantaged students Migratory students Male Female Comments: The response is limited to 4,000 characters. New Mexico does not test Science in grade 5.

OMB NO. 1810-0614 Page 23
1.3.1.4 Student Academic Achievement in Mathematics - Grade 6
Grade 6
# Students Who Received a
Valid Score and for Whom a
Proficiency
Level Was Assigned
# Students
Scoring at or
Above Proficient
Percentage of
Students
Scoring at or
Above Proficient
All students 24,926 S 37
American Indian or Alaska Native 2,415 S 25
Asian 327 S 64
Black or African American 605 S 32
Hispanic or Latino 14,994 S 32
Native Hawaiian or other Pacific Islander White 6,585 S 53
Two or more races Children with disabilities (IDEA) 3,532 S 13
Limited English proficient (LEP) students 3,623 S 10
Economically disadvantaged students 17,598 S 29
Migratory students 30 S 20
Male 12,678 S 36
Female 12,248 S 38
Comments: The response is limited to 4,000 characters. New Mexico does not report Native Hawaiian or other Pacific
Islander, or Two or More Races for accountability.
1.3.2.4 Student Academic Achievement in Reading/Language Arts - Grade 6
Grade 6
# Students Who Received a
Valid Score and for Whom a
Proficiency
Level Was Assigned
# Students
Scoring at or
Above Proficient
Percentage of
Students
Scoring at or
Above Proficient
All students 24,928 S 48
American Indian or Alaska Native 2,418 S 31
Asian 327 S 67
Black or African American 605 S 48
Hispanic or Latino 14,987 S 43
Native Hawaiian or other Pacific Islander White 6,591 S 66
Two or more races Children with disabilities (IDEA) 3,532 S 16
Limited English proficient (LEP) students 3,618 S 12
Economically disadvantaged students 17,601 S 40
Migratory students 30 S 33
Male 12,681 S 44
Female 12,247 S 52
Comments: The response is limited to 4,000 characters. New Mexico does not report Native Hawaiian or other Pacific
Islander, or Two or More Races for accountability.

OMB NO. 1810-0614 Page 24
1.3.3.4 Student Academic Achievement in Science - Grade 6
Grade 6
# Students Who Received a
Valid Score and for Whom a Proficiency
Level Was Assigned
# Students
Scoring at or
Above Proficient
Percentage of
Students
Scoring at or
Above Proficient
All students American Indian or Alaska Native Asian Black or African American Hispanic or Latino Native Hawaiian or other Pacific Islander White Two or more races Children with disabilities (IDEA) Limited English proficient (LEP) students Economically disadvantaged students Migratory students Male Female Comments: The response is limited to 4,000 characters. New Mexico does not test science in grade 6.

OMB NO. 1810-0614 Page 25
1.3.1.5 Student Academic Achievement in Mathematics - Grade 7
Grade 7
# Students Who Received a
Valid Score and for Whom a
Proficiency
Level Was Assigned
# Students
Scoring at or
Above Proficient
Percentage of
Students
Scoring at or
Above Proficient
All students 24,728 S 42
American Indian or Alaska Native 2,523 S 30
Asian 368 S 76
Black or African American 570 S 34
Hispanic or Latino 14,944 S 36
Native Hawaiian or other Pacific Islander White 6,323 S 60
Two or more races Children with disabilities (IDEA) 3,262 S 14
Limited English proficient (LEP) students 3,576 S 13
Economically disadvantaged students 17,162 S 33
Migratory students 33 S 33
Male 12,671 S 40
Female 12,057 S 44
Comments: The response is limited to 4,000 characters. New Mexico does not report Native Hawaiian or other Pacific
Islander, or Two or More Races for accountability.
1.3.2.5 Student Academic Achievement in Reading/Language Arts - Grade 7
Grade 7
# Students Who Received a
Valid Score and for Whom a
Proficiency
Level Was Assigned
# Students
Scoring at or
Above Proficient
Percentage of
Students
Scoring at or
Above Proficient
All students 24,742 S 50
American Indian or Alaska Native 2,528 S 31
Asian 367 S 72
Black or African American 569 S 47
Hispanic or Latino 14,953 S 45
Native Hawaiian or other Pacific Islander White 6,325 S 70
Two or more races Children with disabilities (IDEA) 3,259 S 17
Limited English proficient (LEP) students 3,571 S 13
Economically disadvantaged students 17,176 S 41
Migratory students 33 S 49
Male 12,684 S 46
Female 12,058 S 54
Comments: The response is limited to 4,000 characters. New Mexico does not report Native Hawaiian or other Pacific
Islander, or Two or More Races for accountability.
OMB NO. 1810-0614 Page 26
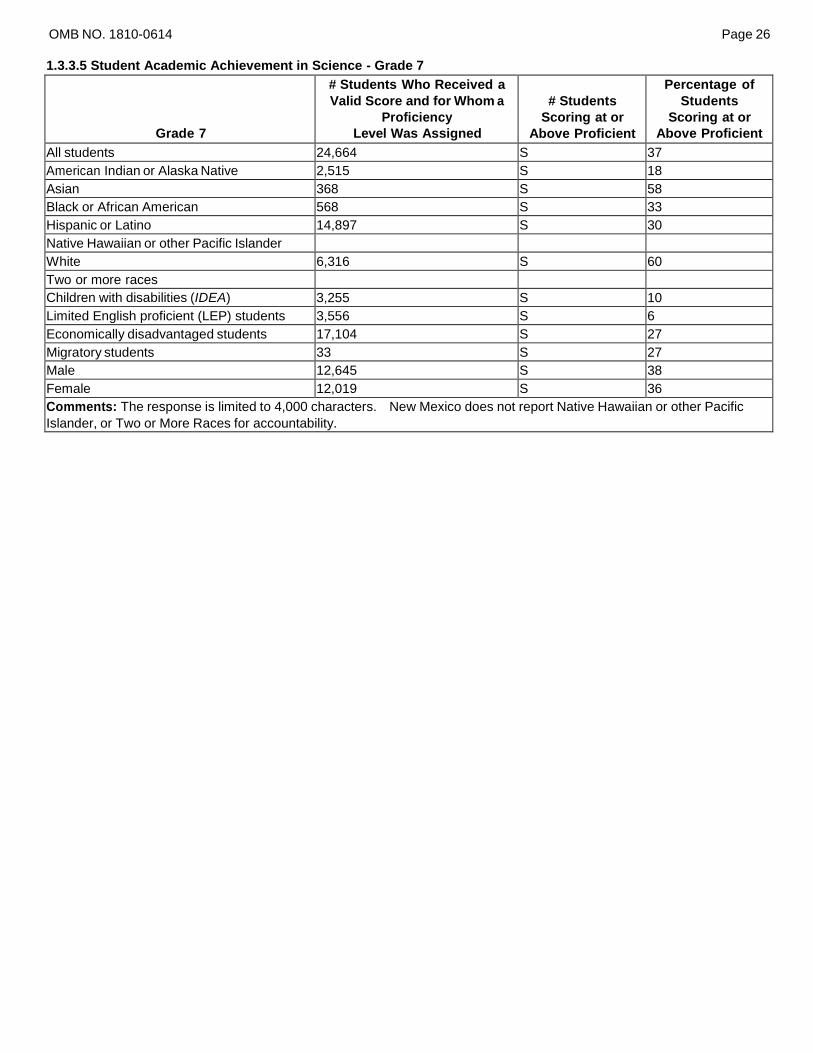
1.3.3.5 Student Academic Achievement in Science - Grade 7
Grade 7
# Students Who Received a
Valid Score and for Whom a
Proficiency
Level Was Assigned
# Students
Scoring at or
Above Proficient
Percentage of
Students
Scoring at or
Above Proficient
All students 24,664 S 37
American Indian or Alaska Native 2,515 S 18
Asian 368 S 58
Black or African American 568 S 33
Hispanic or Latino 14,897 S 30
Native Hawaiian or other Pacific Islander White 6,316 S 60
Two or more races Children with disabilities (IDEA) 3,255 S 10
Limited English proficient (LEP) students 3,556 S 6
Economically disadvantaged students 17,104 S 27
Migratory students 33 S 27
Male 12,645 S 38
Female 12,019 S 36
Comments: The response is limited to 4,000 characters. New Mexico does not report Native Hawaiian or other Pacific
Islander, or Two or More Races for accountability.

OMB NO. 1810-0614 Page 27
1.3.1.6 Student Academic Achievement in Mathematics - Grade 8
Grade 8
# Students Who Received a
Valid Score and for Whom a
Proficiency
Level Was Assigned
# Students
Scoring at or
Above Proficient
Percentage of
Students
Scoring at or
Above Proficient
All students 23,939 S 42
American Indian or Alaska Native 2,377 S 28
Asian 339 S 71
Black or African American 509 S 38
Hispanic or Latino 14,403 S 36
Native Hawaiian or other Pacific Islander White 6,311 S 59
Two or more races Children with disabilities (IDEA) 2,952 S 12
Limited English proficient (LEP) students 3,089 S 12
Economically disadvantaged students 16,339 S 33
Migratory students 25 S 20
Male 12,187 S 42
Female 11,752 S 41
Comments: The response is limited to 4,000 characters. New Mexico does not report Native Hawaiian or other Pacific
Islander, or Two or More Races for accountability.
1.3.2.6 Student Academic Achievement in Reading/Language Arts - Grade 8
Grade 8
# Students Who Received a
Valid Score and for Whom a
Proficiency
Level Was Assigned
# Students
Scoring at or
Above Proficient
Percentage of
Students
Scoring at or
Above Proficient
All students 23,965 S 54
American Indian or Alaska Native 2,382 S 42
Asian 336 S 75
Black or African American 507 S 52
Hispanic or Latino 14,420 S 49
Native Hawaiian or other Pacific Islander White 6,320 S 71
Two or more races Children with disabilities (IDEA) 2,955 S 19
Limited English proficient (LEP) students 3,082 S 18
Economically disadvantaged students 16,360 S 46
Migratory students 25 S 40
Male 12,196 S 51
Female 11,769 S 58
Comments: The response is limited to 4,000 characters. New Mexico does not report Native Hawaiian or other Pacific
Islander, or Two or More Races for accountability.

OMB NO. 1810-0614 Page 28
1.3.3.6 Student Academic Achievement in Science - Grade 8
Grade 8
# Students Who Received a
Valid Score and for Whom a Proficiency
Level Was Assigned
# Students
Scoring at or
Above Proficient
Percentage of
Students
Scoring at or
Above Proficient
All students American Indian or Alaska Native Asian Black or African American Hispanic or Latino Native Hawaiian or other Pacific Islander White Two or more races Children with disabilities (IDEA) Limited English proficient (LEP) students Economically disadvantaged students Migratory students Male Female Comments: The response is limited to 4,000 characters. New Mexico does not test science in grade 8.

OMB NO. 1810-0614 Page 29
1.3.1.7 Student Academic Achievement in Mathematics - High School
High School
# Students Who Received a
Valid Score and for Whom a
Proficiency
Level Was Assigned
# Students
Scoring at or
Above Proficient
Percentage of
Students
Scoring at or
Above Proficient
All students 22,843 S 39
American Indian or Alaska Native 2,705 S 27
Asian 340 S 68
Black or African American 544 S 31
Hispanic or Latino 12,921 S 32
Native Hawaiian or other Pacific Islander White 6,333 S 59
Two or more races Children with disabilities (IDEA) 2,520 S 11
Limited English proficient (LEP) students 2,206 S 8
Economically disadvantaged students 13,274 S 28
Migratory students 24 S 25
Male 11,598 S 41
Female 11,245 S 37
Comments: The response is limited to 4,000 characters. New Mexico does not report Native Hawaiian or other Pacific
Islander, or Two or More Races for accountability.
1.3.2.7 Student Academic Achievement in Reading/Language Arts - High School
High School
# Students Who Received a
Valid Score and for Whom a
Proficiency
Level Was Assigned
# Students
Scoring at or
Above Proficient
Percentage of
Students
Scoring at or
Above Proficient
All students 22,884 S 46
American Indian or Alaska Native 2,712 S 30
Asian 340 S 62
Black or African American 544 S 43
Hispanic or Latino 12,941 S 39
Native Hawaiian or other Pacific Islander White 6,347 S 65
Two or more races Children with disabilities (IDEA) 2,526 S 14
Limited English proficient (LEP) students 2,205 S 8
Economically disadvantaged students 13,302 S 35
Migratory students 24 S 17
Male 11,609 S 41
Female 11,275 S 51
Comments: The response is limited to 4,000 characters. New Mexico does not report Native Hawaiian or other Pacific
Islander, or Two or More Races for accountability.

OMB NO. 1810-0614 Page 30
1.3.3.7 Student Academic Achievement in Science - High School
High School
# Students Who Received a
Valid Score and for Whom a
Proficiency
Level Was Assigned
# Students
Scoring at or
Above Proficient
Percentage of
Students
Scoring at or
Above Proficient
All students 22,257 S 38
American Indian or Alaska Native 2,607 S 20
Asian 333 S 59
Black or African American 525 S 35
Hispanic or Latino 12,572 S 29
Native Hawaiian or other Pacific Islander White 6,220 S 61
Two or more races Children with disabilities (IDEA) 2,426 S 10
Limited English proficient (LEP) students 2,122 S 4
Economically disadvantaged students 12,858 S 25
Migratory students 24 S 17
Male 11,252 S 42
Female 11,005 S 33
Comments: The response is limited to 4,000 characters. New Mexico does not report Native Hawaiian or other Pacific
Islander, or Two or More Races for accountability. We also administered science to only a single HS grade.

OMB NO. 1810-0614 Page 31
1.4 SCHOOL AND DISTRICT ACCOUNTABILITY
This section collects data on the Adequate Yearly Progress (AYP) status of schools and districts.
1.4.1 All Schools and Districts Accountability
In the table below, provide the total number of public elementary and secondary schools and districts in the State, including charters, and the total number of those schools and districts that made AYP based on data for SY 2011-12. The percentage that made AYP will be calculated automatically.
Entity
Total #
Total # that Made AYP
in SY 2011-12
Percentage that Made
AYP in SY 2011-12
Schools 866 Districts 135 Comments: The response is limited to 4,000 characters. The number of LEAs increased because of newly authorized
State Charters. New Mexico was granted a waiver from AYP and will no longer be reporting this information.
1.4.2 Title I School Accountability
In the table below, provide the total number of public Title I schools by type and the total number of those schools that made AYP based on data for SY 2011-12 . Include only public Title I schools. Do not include Title I programs operated by local educational agencies in private schools. The percentage that made AYP will be calculated automatically.
Title I School
# Title I Schools
# Title I Schools that Made
AYP
in SY 2011-12
Percentage of Title I Schools that
Made
AYP in SY 2011-12
All Title I schools 616 Schoolwide (SWP) Title I schools 604 Targeted assistance (TAS) Title I schools
12
Comments: The response is limited to 4,000 characters. New Mexico was granted a waiver from AYP and will no longer
be reporting this information.
1.4.3 Accountability of Districts That Received Title I Funds
In the table below, provide the total number of districts that received Title I funds and the total number of those districts that made AYP based on data for SY 2011-12. The percentage that made AYP will be calculated automatically.
# Districts That
Received Title I Funds
in SY 2011-12
# Districts That Received Title I Funds
and Made AYP in SY 2011-12
Percentage of Districts That Received Title I
Funds and Made AYP in SY 2011-12
116 Comments: The response is limited to 4,000 characters. New Mexico was granted a waiver from AYP and will no longer
be reporting this information.
1.4.4.3 Corrective Action
In the table below, for schools in corrective action, provide the number of schools for which the listed corrective actions under ESEA were implemented in SY 2011-12 (based on SY 2010-11 assessments under Section 1111 of ESEA).
Corrective Action
# of Title I Schools in Corrective Action in Which the
Corrective Action was Implemented in SY 2011-12
Required implementation of a new research-based curriculum or instructional program
14
Extension of the school year or school day 4
Replacement of staff members relevant to the school's low performance
8

OMB NO. 1810-0614 Page 32
Corrective Action
# of Title I Schools in Corrective Action in Which the
Corrective Action was Implemented in SY 2011-12
Significant decrease in management authority at the school level
2
Replacement of the principal 6
Restructuring the internal organization of the school 8
Appointment of an outside expert to advise the school 9
Comments: The response is limited to 4,000 characters.
1.4.4.4 Restructuring – Year 2
In the table below, for schools in restructuring – year 2 (implementation year), provide the number of schools for which the listed restructuring actions under ESEA were implemented in SY 2011-12 (based on SY 2010-11 assessments under Section 1111 of ESEA).
Restructuring Action
# of Title I Schools in Restructuring in Which Restructuring
Action Is Being Implemented
Replacement of all or most of the school staff (which may include the principal)
1
Reopening the school as a public charter school Entering into a contract with a private entity to operate the school
Takeover the school by the State Other major restructuring of the school governance 75
Comments: The response is limited to 4,000 characters.
In the space below, list specifically the "other major restructuring of the school governance" action(s) that were implemented.
The response is limited to 8,000 characters.

OMB NO. 1810-0614 Page 33
1.4.5.2 Actions Taken for Districts That Received Title I Funds and Were Identified for Improvement
In the space below, briefly describe the measures being taken to address the achievement problems of districts identified for improvement or corrective action. Include a discussion of the technical assistance provided by the State (e.g., the number of districts served, the nature and duration of assistance provided, etc.).
The response is limited to 8,000 characters.
New Mexico was granted a waiver from AYP and will no longer be reporting this information. We require all ditricts to focus their efforts on five strategic levers for improvement:
Smarter Return on NM Investment -All New Mexico districts will align proven strategies for student success with expenditures in education.
Effective Options for Parents -Offering parents multiple educational opportunities for their children that meet their learning needs.
Ready for Success -To prepare students to succeed throughout their academic careers, districts will place a command- focus on literacy by prioritizing research-based strategies for reading interventions. This will ultimately lead to college success and career readiness. All New Mexico Districts will reduce the percentage of students retained in third grade due to literacy level.
Rewarding Effective Educators and Leaders -Identify objective criteria that establish a multi-tiered evaluation based to include regular feedback to teachers and aligned professional development.
Real Accountability, Real Results - Real Accountability, Real Results: A-F School Grade Accountability System is a transparent school-grading system that allows parents, teachers, students, and the community to understand the quality of education in our classrooms, creating a culture of higher expectations and greater achievement. Within one year, the percentage of all students that are proficient or on track to proficiency (within 3 years) equals the Reading SGT of 52.3%. Within one year, the percentage of all students that are proficient or on track to proficiency (within 3 years) equals the Math SGT of 45%.
OMB NO. 1810-0614 Page 34
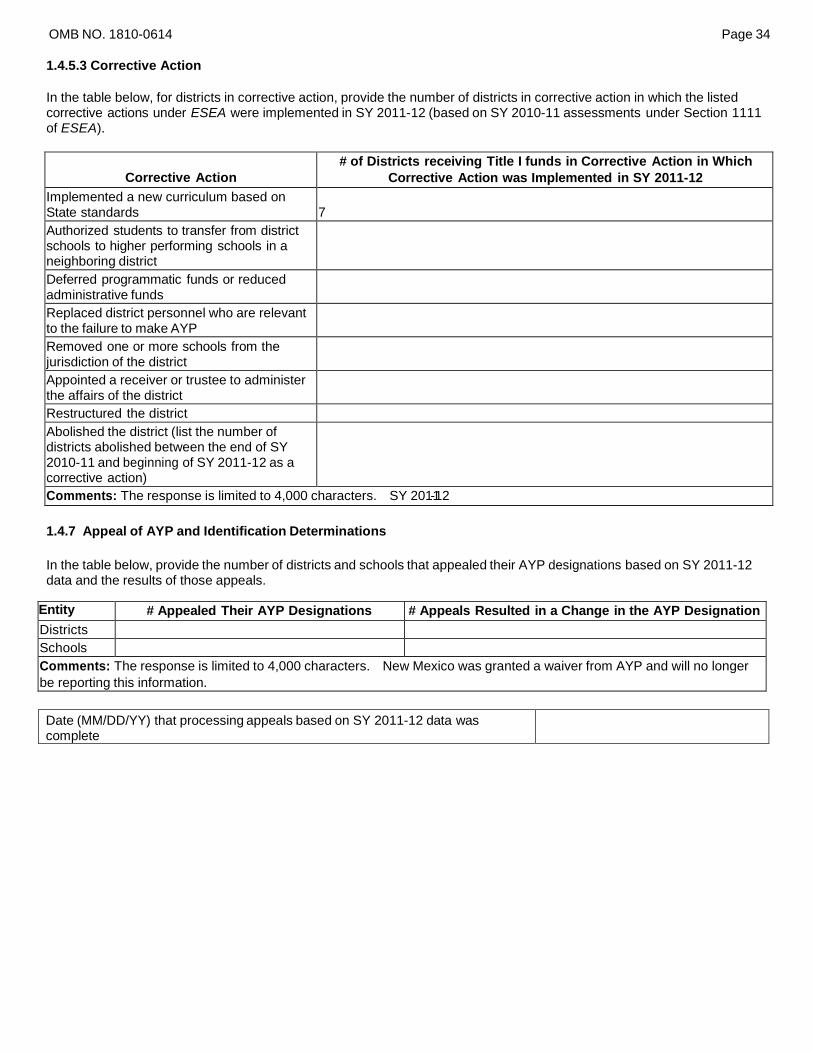
1.4.5.3 Corrective Action
In the table below, for districts in corrective action, provide the number of districts in corrective action in which the listed corrective actions under ESEA were implemented in SY 2011-12 (based on SY 2010-11 assessments under Section 1111 of ESEA).
Corrective Action
# of Districts receiving Title I funds in Corrective Action in Which
Corrective Action was Implemented in SY 2011-12
Implemented a new curriculum based on State standards
7
Authorized students to transfer from district schools to higher performing schools in a neighboring district
Deferred programmatic funds or reduced administrative funds
Replaced district personnel who are relevant to the failure to make AYP
Removed one or more schools from the jurisdiction of the district
Appointed a receiver or trustee to administer the affairs of the district
Restructured the district Abolished the district (list the number of districts abolished between the end of SY 2010-11 and beginning of SY 2011-12 as a corrective action)
Comments: The response is limited to 4,000 characters. SY 201-112
1.4.7 Appeal of AYP and Identification Determinations
In the table below, provide the number of districts and schools that appealed their AYP designations based on SY 2011-12 data and the results of those appeals.
Entity # Appealed Their AYP Designations # Appeals Resulted in a Change in the AYP Designation
Districts Schools Comments: The response is limited to 4,000 characters. New Mexico was granted a waiver from AYP and will no longer
be reporting this information.
Date (MM/DD/YY) that processing appeals based on SY 2011-12 data was complete

OMB NO. 1810-0614 Page 35
1.4.8 Sections 1003(a) and (g) School Improvement Funds
In the section below, "schools in improvement" means Title I schools identified for improvement, corrective action, or restructuring under Section 1116 of ESEA for SY 2011-12.
1.4.8.5.1 Section 1003(a) State Reservations
In the space provided, enter the percentage of the FY 2011 (SY 2011-12) Title I, Part A allocation that the SEA reserved in accordance with Section 1003(a) of ESEA and §200.100(a) of ED's regulations governing the reservation of funds for school improvement under Section 1003(a) of ESEA: 2.90%
Comments: The response is limited to 4,000 characters.

OMB NO. 1810-0614 Page 36
1.4.8.5.2 Section 1003(a) and 1003(g) Allocations to LEAs and Schools
For SY 2011-12 there is no need to upload a spreadsheet to answer this question in the CSPR.
1.4.8.5.2 will be answered automatically using data submitted to EDFacts in Data Group 694, School improvement funds
allocation table, from File Specification N/X132. You may review data submitted to EDFacts using the report named "Section
1003(a) and 1003(g) AIIocations to LEAs and Schools- CSPR 1.4.8.5.2 (EDEN012)" from the EDFacts Reporting System.

OMB NO. 1810-0614 Page 37
1.4.8.5.3 Use of Section 1003(g)(8) Funds for Evaluation and Technical Assistance
Section 1003(g)(8) of ESEA allows States to reserve up to five percent of Section 1003(g) funds for administration and to
meet the evaluation and technical assistance requirements for this program. In the space below, identify and describe the
specific Section 1003(g) evaluation and technical assistance activities that your State conducted during SY 2011-12.
This response is limited to 8, 000 characters.
!This section was inadvertently overlooked by program. They will respond during the re-open phase.

OMB NO. 1810-0614 Page 38
1.4.8.6 Actions Taken for Title I Schools Identified for Improvement Supported by Funds Other than Those of
Section 1003(a) and 1003(g).
In the space below, describe actions (if any) taken by your State in SY 2011-12 that were supported by funds other than
Section 1003(a) and 1003(g) funds to address the achievement problems of schools identified for improvement, corrective
action, or restructuring under Section 1116 of ESEA.
The response is limited to 8,000 characters.
Under the Basic grant provided by Title I, Part A Schools that received grades D or F under our new accountability system focused efforts on the following: Transformation -Transformational strategies that provide the foundational work required to meet the challenges of school reform.

OMB NO. 1810-0614 Page 39
1.4.9 Public School Choice and Supplemental Educational Services
This section collects data on public school choice and supplemental educational services.
1.4.9.1 Public School Choice
This section collects data on public school choice. FAQs related to the public school choice provisions are at the end of this section.
1.4.9.1.2 Public School Choice – Students
In the table below, provide the number of students who were eligible for public school choice, the number of eligible students who applied to transfer, and the number who transferred under the provisions for public school choice under Section 1116 of ESEA. The number of students who were eligible for public school choice should include:
1. All students currently enrolled in a school Title I identified for improvement, corrective action or restructuring. 2. All students who transferred in the current school year under the public school choice provisions of Section 1116, and 3. All students who previously transferred under the public school choice provisions of Section 1116 and are continuing
to transfer for the current school year under Section 1116.
The number of students who applied to transfer should include:
1. All students who applied to transfer in the current school year but did not or were unable to transfer. 2. All students who transferred in the current school year under the public school choice provisions of Section 1116; and 3. All students who previously transferred under the public school choice provisions of Section 1116 and are continuing
to transfer for the current school year under Section 1116.
For any of the respective student counts, States should indicate in the Comment section if the count does not include any of the categories of students discussed above.
Public School Choice # Students
Eligible for public school choice 46,411
Applied to transfer 260
Transferred to another school under the Title I public school choice provisions 153
Comments: The response is limited to 4,000 characters.

OMB NO. 1810-0614 Page 40
1.4.9.1.3 Funds Spent on Public School Choice
In the table below, provide the total dollar amount spent by LEAs on transportation for public school choice under Section
1116 of ESEA.
Transportation for Public School Choice
Amount
Dollars spent by LEAs on transportation for public school choice $ 934,668
1.4.9.1.4 Availability of Public School Choice Options
In the table below provide the number of LEAs in your State that are unable to provide public school choice to eligible students due to any of the following reasons:
1. All schools at a grade level in the LEA are in school improvement, corrective action, or restructuring. 2. LEA only has a single school at the grade level of the school at which students are eligible for public school choice. 3. LEA's schools are so remote from one another that choice is impracticable.
Unable to Provide Public School Choice # LEAs
LEAs Unable to Provide Public School Choice 109
FAQs about public school choice:
a. How should States report data on Title I public school choice for those LEAs that have open enrollment and
other choice programs? For those LEAs that implement open enrollment or other school choice programs in addition to public school choice under Section 1116 of ESEA, the State may consider a student as having
applied to transfer if the student meets the following:
Has a "home" or "neighborhood" school (to which the student would have been assigned, in the
absence of a school choice program) that receives Title I funds and has been identified, under the statute, as in need of improvement, corrective action, or restructuring; and
Has elected to enroll, at some point since July 1, 2002 (the effective date of the Title I choice provisions), and after the home school has been identified as in need of improvement, in a school that has not been so identified and is attending that school; and
Is using district transportation services to attend such a school.
In addition, the State may consider costs for transporting a student meeting the above conditions towards the funds spent by an LEA on transportation for public school choice if the student is using district transportation services to attend the non-identified school.
b. How should States report on public school choice for those LEAs that are not able to offer public school choice? In
the count of LEAS that are not able to offer public school choice (for any of the reasons specified in 1.4.9.1.4), States should include those LEAs that are unable to offer public school choice at one or more grade levels. For instance, if an LEA is able to provide public school choice to eligible students at the elementary level but not at the secondary level, the State should include the LEA in the count. States should also include LEAs that are not able to provide public school choice at all (i.e., at any grade level). States should provide the reason(s) why public school choice was not possible in these LEAs at the grade level(s) in the Comment section. In addition, States may also include in the Comment section a separate count just of LEAs that are not able to offer public school choice at any grade level.
For LEAs that are not able to offer public school choice at one or more grade levels, States should count as eligible for public school choice (in 1.4.9.1.2) all students who attend identified Title I schools regardless of whether the LEA is able to offer the students public school choice.
Comments: The response is limited to 4,000 characters. Due to our waiver we believe that the dollar amount spent by LEA for School Choice was not required.
3 Adapted from OESE/OII policy letter of August 2004. The policy letter may be found on the Department's Web page at
http://www.ed.gov/policy/elsec/guid/stateletters/choice/choice081804.html.

OMB NO. 1810-0614 Page 41
1.4.9.2 Supplemental Educational Services
This section collects data on supplemental educational services.
1.4.9.2.2 Supplemental Educational Services – Students
In the table below, provide the number of students who were eligible for, who applied for, and who received supplemental educational services under Section 1116 of ESEA.
Supplemental Educational Services
# Students
Eligible for supplemental educational services 155,427
Applied for supplemental educational services 9,299
Received supplemental educational services 8,096
Comments: The response is limited to 4,000 characters.
1.4.9.2.3 Funds Spent on Supplemental Educational Services
In the table below, provide the total dollar amount spent by LEAs on supplemental educational services under Section 1116 of ESEA.
Spending on Supplemental Educational Services Amount
Dollars spent by LEAs on supplemental educational services $ 2,566,751
Comments: The response is limited to 4,000 characters. Due to our waiver we believe that the dollar amount spent by LEA
for SES was not required.

OMB NO. 1810-0614 Page 42
1.5 TEACHER QUALITY
This section collects data on "highly qualified" teachers as the term is defined in Section 9101(23) of ESEA.
1.5.1 Core Academic Classes Taught by Teachers Who Are Highly Qualified
In the table below, provide the number of core academic classes for the grade levels listed, the number of those core academic classes taught by teachers who are highly qualified, and the number taught by teachers who are not highly qualified. The percentage of core academic classes taught by teachers who are highly qualified and the percentage taught by teachers who are not highly qualified will be calculated automatically. Below the table are FAQs about these data.
All classes
Number of
Core
Academic
Classes
(Total)
Number of Core
Academic Classes
Taught by
Teachers Who Are
Highly Qualified
Percentage of Core
Academic Classes
Taught by Teachers
Who Are Highly
Qualified
Number of Core
Academic Classes
Taught by Teachers
Who Are NOT Highly
Qualified
Percentage of Core
Academic Classes
Taught by Teachers
Who Are NOT Highly
Qualified
59,418 58,789 98.94 629 1.06
All elementary classes
16,361
16,207
99.06
154
0.94
All secondary classes
43,057
42,582
98.90
475
1.10
Do the data in Table 1.5.1 above include classes taught by special education teachers who provide direct instruction core academic subjects?
Data table includes classes taught by special education teachers who
provide direct instruction core academic subjects.
Yes
If the answer above is no, please explain below. The response is limited to 8,000 characters.
Does the State count elementary classes so that a full-day self-contained classroom equals one class, or does the State use a departmentalized approach where a classroom is counted multiple times, once for each subject taught?
The response is limited to 8,000 characters.
Yes, New Mexico counts elementary classes so that a fu-ldl ay self-contained classroom equals one class.

OMB NO. 1810-0614 Page 43
FAQs about highly qualified teachers and core academic subjects:
a. What are the core academic subjects? English, reading/language arts, mathematics, science, foreign
languages, civics and government, economics, arts, history, and geography [Title IX, Section 9101(11)]. While the statute includes the arts in the core academic subjects, it does not specify which of the arts are core academic subjects; therefore, States must make this determination.
b. How is a teacher defined? An individual who provides instruction in the core academic areas to kindergarten,
grades 1 through 12, or ungraded classes, or individuals who teach in an environment other than a classroom setting (and who maintain daily student attendance records) [from NCES, CCD, 2001-02]
c. How is a class defined? A class is a setting in which organized instruction of core academic course content
is provided to one or more students (including cross-age groupings) for a given period of time. (A course may be offered to more than one class.) Instruction, provided by one or more teachers or other staff members, may be delivered in person or via a different medium. Classes that share space should be considered as separate classes if they function as separate units for more than 50% of the time [from NCES Non-fiscal Data Handbook for Early Childhood, Elementary, and Secondary Education, 2003].
d. Should 6th-, 7th-, and 8th-grade classes be reported in the elementary or the secondary category? States are
responsible for determining whether the content taught at the middle school level meets the competency requirements for elementary or secondary instruction. Report classes in grade 6 through 8 consistent with how teachers have been classified to determine their highly qualified status, regardless of whether their schools are configured as elementary or middle schools.
e. How should States count teachers (including specialists or resource teachers) in elementary classes?
States that count self-contained classrooms as one class should, to avoid over-representation, also count subject-area specialists (e.g., mathematics or music teachers) or resource teachers as teaching one class. On the other hand, States using a departmentalized approach to instruction where a self-contained classroom is counted multiple times (once for each subject taught) should also count subject-area specialists or resource teachers as teaching multiple classes.
f. How should States count teachers in self-contained multiple-subject secondary classes? Each core
academic subject taught for which students are receiving credit toward graduation should be counted in the numerator and the denominator. For example, if the same teacher teaches English, calculus, history, and science in a self-contained classroom, count these as four classes in the denominator. If the teacher is Highly Qualified to teach English and history, he/she would be counted as Highly Qualified in two of the four subjects in the numerator.
g. What is the reporting period? The reporting period is the school year. The count of classes must include
all semesters, quarters, or terms of the school year. For example, if core academic classes are held in summer sessions, those classes should be included in the count of core academic classes. A state determines into which school year classes fall.

OMB NO. 1810-0614 Page 44
1.5.2 Reasons Core Academic Classes Are Taught by Teachers Who Are Not Highly Qualified
In the tables below, estimate the percentages for each of the reasons why teachers who are not highly qualified teach core academic classes. For example, if 900 elementary classes were taught by teachers who are not highly qualified, what percentage of those 900 classes falls into each of the categories listed below? If the three reasons provided at each grade level are not sufficient to explain why core academic classes at a particular grade level are taught by teachers who are not highly qualified, use the row labeled "other" and explain the additional reasons. The total of the reasons is calculated automatically for each grade level and must equal 100% at the elementary level and 100% at the secondary level.
Note: Use the numbers of core academic classes taught by teachers who are not highly qualified from 1.5.1 for both
elementary school classes (1.5.2.1) and for secondary school classes (1.5.2.2) as your starting point.
Elementary School Classes
Percentage
Elementary School Classes
Elementary school classes taught by certified general education teachers who did not pass a subject- knowledge test or (if eligible) have not demonstrated subject-matter competency through HOUSSE
21.00
Elementary school classes taught by certified special education teachers who did not pass a subject- knowledge test or have not demonstrated subject-matter competency through HOUSSE
7.00
Elementary school classes taught by teachers who are not fully certified (and are not in an approved alternative route program)
72.00
Other (please explain in comment box below) Total 100.00
The response is limited to 8,000 characters.
Secondary School Classes Percentage
Secondary School Classes
Secondary school classes taught by certified general education teachers who have not demonstrated subject-matter knowledge in those subjects (e.g., out-of-field teachers)
43.00
Secondary school classes taught by certified special education teachers who have not demonstrated subject-matter competency in those subjects
18.00
Secondary school classes taught by teachers who are not fully certified (and are not in an approved alternative route program)
39.00
Other (please explain in comment box below) Total 100.00
The response is limited to 8,000 characters.

OMB NO. 1810-0614 Page 45
1.5.3 Poverty Quartiles and Metrics Used
In the table below, provide the number of core academic classes for each of the school types listed and the number of those core academic classes taught by teachers who are highly qualified. The percentage of core academic classes taught by teachers who are highly qualified will be calculated automatically. The percentages used for high- and low-poverty schools and the poverty metric used to determine those percentages are reported in the second table. Below the tables are FAQs about these data.
NOTE: No source of classroom-level poverty data exists, so States may look at school-level data when figuring poverty
quartiles. Because not all schools have traditional grade configurations, and because a school may not be counted as both
an elementary and as a secondary school, States may include as elementary schools all schools that serve children in
grades K through 5 (including K through 8 or K through 12 schools).
This means that for the purpose of establishing poverty quartiles, some classes in schools where both elementary and secondary classes are taught would be counted as classes in an elementary school rather than as classes in a secondary school in 1.5.3. This also means that such a 12th grade class would be in a different category in 1.5.3 than it would be in
1.5.1.
School Type
Number of Core Academic
Classes (Total)
Number of Core Academic
Classes
Taught by Teachers Who
Are
Highly Qualified
Percentage of Core Academic
Classes
Taught by Teachers Who Are
Highly Qualified
Elementary Schools
High Poverty Elementary Schools
5,191
5,100
98.25
Low-poverty Elementary Schools
3,806
3,793
99.66
Secondary Schools
High Poverty secondary Schools
7,258
7,220
99.48
Low-Poverty secondary Schools
16,486
16,332
99.07
1.5.3.1 Poverty Quartile Breaks
In the table below, provide the poverty quartiles breaks used in determining high- and low-poverty schools and the poverty metric used to determine the poverty quartiles. Below the table are FAQs about the data collected in this table.
High-Poverty Schools
(more than what %)
Low-Poverty Schools
(less than what %)
Elementary schools 60.00 35.00
Poverty metric used Free and Reduced Priced Meals (USDA) This data is correct.
Secondary schools 75.00 50.00
Poverty metric used Free and Reduced Priced Meals (USDA) This data is correct.

OMB NO. 1810-0614 Page 46
FAQs on poverty quartiles and metrics used to determine poverty
a. What is a "high-poverty school"? Section 1111(h)(1)(C)(viii) defines "high-poverty" schools as schools
in the top quartile of poverty in the State.
b. What is a "low-poverty school"? Section 1111(h)(1)(C)(viii) defines "low-poverty" schools as schools in the bottom quartile of poverty in the State.
c. How are the poverty quartiles determined? Separately rank order elementary and secondary schools from
highest to lowest on your percentage poverty measure. Divide the list into four equal groups. Schools in the first (highest group) are high-poverty schools. Schools in the last group (lowest group) are the low-poverty schools. Generally, States use the percentage of students who qualify for the free or reduced-price lunch program for this calculation.
d. Since the poverty data are collected at the school and not classroom level, how do we classify schools as
either elementary or secondary for this purpose? States may include as elementary schools all schools that serve children in grades K through 5 (including K through 8 or K through 12 schools) and would therefore include as secondary schools those that exclusively serve children in grades 6 and higher.

OMB NO. 1810-0614 Page 47
1.6 TITLE III AND LANGUAGE INSTRUCTIONAL PROGRAMS
This section collects annual performance and accountability data on the implementation of Title III programs.
1.6.1 Language Instruction Educational Programs
In the table below, place a check next to each type of language instruction educational programs implemented in the State, as defined in Section 3301(8), as required by Sections 3121(a)(1), 3123(b)(1), and 3123(b)(2).
Table 1.6.1 Definitions:
1. Types of Programs = Types of programs described in the subgrantee's local plan (as submitted to the State or as
implemented) that is closest to the descriptions in
http://www.ncela.gwu.edu/files/rcd/BE021775/Glossary_of_Terms.pdf. 2. Other Language = Name of the language of instruction, other than English, used in the programs.
Check Types of
Programs
Type of Program
Other Language
Yes
Dual language Spanish; Native American Languages
No Two-way immersion Yes
Transitional bilingual programs Spanish; Native American Languages
Yes
Developmental bilingual Spanish; Native American Languages
Yes
Heritage language Spanish; Native American languages
Yes Sheltered English instruction ///////////////////////////////////// Yes Structured English immersion ///////////////////////////////////// Yes
Specially designed academic instruction delivered in English (SDAIE)
/////////////////////////////////////
Yes Content-based ESL ///////////////////////////////////// Yes Pull-out ESL ///////////////////////////////////// Yes Other (explain in comment box below) /////////////////////////////////////
The response is limited to 8,000 characters.
New Mexico provides funding to support five different bilingual multicultural programs: dual language, maintenance (development), transitional, heritage and enrichment (not listed above as an option). These may be provided in combination with Title III-funded programs, any many school districts do. LEAs that apply for and receive Title III funds do not provide the state-supported programs mentioned above, provide ELD/SDAIE courses and/or pull-out ESL programs to address the learning needs of LEP/ELL students.

OMB NO. 1810-0614 Page 48
1.6.2 Student Demographic Data
1.6.2.1 Number of ALL LEP Students in the State
In the table below, provide the unduplicated number of ALL LEP students in the State who meet the LEP definition under Section 9101(25).
Include newly enrolled (recent arrivals to the U.S.) and continually enrolled LEP students, whether or not they receive
services in a Title III language instruction educational program.
Do not include Former LEP students (as defined in Section 200.20(f)(2) of the Title I regulation) and monitored Former LEP students (as defined under Section 3121(a)(4) of Title III) in the ALL LEP student count in this table.
Number of ALL LEP students in the State 59,188 Comments: The response is limited to 4,000 characters.
1.6.2.2 Number of LEP Students Who Received Title III Language Instruction Educational Program Services
In the table below, provide the unduplicated number of LEP students who received services in Title III language instructional education programs.
LEP Students Receiving Services #
LEP students who received services in a Title III language instruction educational program in grades K through 12 for this reporting year.
54,724
Comments: The response is limited to 4,000 characters.
1.6.2.3 Most Commonly Spoken Languages in the State
In the table below, provide the five most commonly spoken languages, other than English, in the State (for all LEP students, not just LEP students who received Title III Services). The top five languages should be determined by the highest number of students speaking each of the languages listed.
Language # LEP Students
Spanish; Castilian 42,211
Navajo; Navaho 7,535
Nias 1,165
Caucasian (Other) 859
Vietnamese 321
Report additional languages with significant numbers of LEP students in the comment box below.
The response is limited to 8,000 characters.

OMB NO. 1810-0614 Page 49
1.6.3 Student Performance Data
This section collects data on LEP students' English language proficiency, as required by Sections 1111(h)(4)(D) and 3121 (a)(2).
1.6.3.1.1 All LEP Students Tested on the State Annual English Language Proficiency Assessment
In the table below, please provide the number of ALL LEP students tested and not tested on annual State English language proficiency (ELP) assessment (as defined in 1.6.2.1).
All LEP Testing
#
Number tested on State annual ELP assessment 53,789
Number not tested on State annual ELP assessment 150
Total 53,939
Comments: The response is limited to 4,000 characters. The State Annual ELP Assessment and the number of students
enrolled come from 2 separate data sources. In the future NMPED will ensure that the data sources are crossed referenced
to ensure that the counts correlate.
1.6.3.1.2 ALL LEP Student English Language Proficiency Results
All LEP Results #
Number attained proficiency on State annual ELP assessment 6,909
Percent attained proficiency on State annual ELP assessment 12.84
Comments: The response is limited to 4,000 characters.

OMB NO. 1810-0614 Page 50
1.6.3.2.1 Title III LEP Students Tested on the State Annual English Language Proficiency Assessment
In the table below, provide the number of Title III LEP students tested on annual State English language proficiency assessment.
Title III LEP Testing
#
Number tested on State annual ELP assessment 53,789
Number not tested on State annual ELP assessment 150
Total 53,939
Comments: The response is limited to 4,000 characters. The number of title III students who took the state annual ELP
assessment for the time is not 24,664 as listed below. The correct number is 12635.
In the table below, provide the number of Title III students who took the State annual ELP assessment for the first time and
whose progress cannot be determined and whose results were not included in the calculation for AMAO 1. Report this number
ONLY if the State did not include these students in establishing AMAO 1/ making progress target and did not include them in the
calculations for AMAO 1/ making progress (# and % making progress).
Title III First Time Tested
#
Number of Title III students who took the State annual ELP assessment for the first time whose progress cannot be determined and whose results were not included in the calculation for AMAO 1.
24,664
1.6.3.2.2 Title III LEP English Language Proficiency Results
This section collects information on Title III LEP students' development of English and attainment of English proficiency.
Table 1.6.3.2.2 Definitions:
1. Annual Measureable Achievement Objectives (AMAOs) = State targets for the number and percent of students
making progress and attaining proficiency. 2. Making Progress = Number and percent of Title III LEP students that met the definition of "Making Progress" as
defined by the State and submitted to ED in the Consolidated State Application (CSA), or as amended. 3. Attained Proficiency = Number and percent of Title III LEP students that met the State definition of "Attainment" of
English language proficiency submitted to ED in the Consolidated State Application (CSA), or as amended. 4. Results = Number and percent of Title III LEP students that met the State definition of "Making Progress" and the
number and percent that met the State definition of "Attainment" of English language proficiency.
In the table below, provide the State targets for the number and percent of students making progress and attaining English proficiency for this reporting period. Additionally, provide the results from the annual State English language proficiency assessment for Title III-served LEP students who participated in a Title III language instruction educational program in grades K through 12. If your State uses cohorts, provide us with the range of targets, (i.e., indicate the lowest target among the cohorts, e.g., 10% and the highest target among a cohort, e.g., 70%).
Title III Results Results #
Results %
Targets #
Targets %
Making progress 18,122 62.22 17,962 46.00
Attained proficiency 6,909 12.84 4,841 9.00
Comments: The response is limited to 4,000 characters. The Making Progress and Attained Proficiency Results are
incorrect. The correct numbers are: Making Progress Results # 21051 % 51 Attained Proficiency Results # 6901 % 13 EDEN file N164 was resubmitted on 3/8/2013 after the submission deadline.

OMB NO. 1810-0614 Page 51
1.6.3.5 Native Language Assessments
This section collects data on LEP students assessed in their native language (Section 1111(b)(6)) to be used for AYP
determinations.
1.6.3.5.1 LEP Students Assessed in Native Language
In the table below, check "Yes" if the specified assessment is used for AYP purposes.
State offers the State reading/language arts content tests in the students' native language(s). Yes
State offers the State mathematics content tests in the students' native language(s). Yes
State offers the State science content tests in the students' native language(s). Yes
Comments: The response is limited to 4,000 characters.
1.6.3.5.2 Native Language of Mathematics Tests Given
In the table below, report the language(s) in which native language assessments are given for ESEA accountability determinations for mathematics.
Language(s)
Spanish
Comments: The response is limited to 4,000 characters.
1.6.3.5.3 Native Language of Reading/Language Arts Tests Given
In the table below, report the language(s) in which native language assessments are given for ESEA accountability determinations for reading/language arts.
Language(s)
Spanish
Comments: The response is limited to 4,000 characters.
1.6.3.5.4 Native Language of Science Tests Given
In the table below, report the language(s) in which native language assessments are given for ESEA accountability determinations for science.
Language(s)
Spanish
Comments: The response is limited to 4,000 characters.

OMB NO. 1810-0614 Page 53
1.6.3.6 Title III Served Monitored Former LEP (MFLEP) Students
This section collects data on the performance of former LEP students as required by Sections 3121(a)(4) and 3123(b)(8).
1.6.3.6.1 Title III Served MFLEP Students by Year Monitored
In the table below, report the unduplicated count of monitored former LEP students during the two consecutive years of monitoring, which includes both MFLEP students in AYP grades and in non-AYP grades.
Monitored Former LEP (MFLEP) students include:
Students who have transitioned out of a language instruction educational program.
Students who are no longer receiving LEP services and who are being monitored for academic content achievement for 2 years after the transition.
Table 1.6.3.6.1 Definitions:
1. # Year One = Number of former LEP students in their first year of being monitored. 2. # Year Two = Number of former LEP students in their second year of being monitored. 3. Total = Number of monitored former LEP students in year one and year two. This is automatically calculated.
# Year One # Year Two Total
3,781 2,790 6,571
Comments: The response is limited to 4,000 characters.
1.6.3.6.2 MFLEP Students Results for Mathematics
In the table below, report the number of MFLEP students who took the annual mathematics assessment. Please provide data only for those students who transitioned out of language instruction educational programs and who no longer received services under Title III in this reporting year. These students include both students who are monitored former LEP students in their first year of monitoring, and those in their second year of monitoring.
Table 1.6.3.6.2 Definitions:
1. # Tested = State-aggregated number of MFLEP students who were tested in mathematics in all AYP grades. 2. # At or Above Proficient = State-aggregated number of MFLEP students who scored at or above proficient on the
State annual mathematics assessment. 3. % Results = Automatically calculated based on number who scored at or above proficient divided by the number
tested. 4. # Below proficient = State-aggregated number of MFLEP students who did not score proficient on the State annual
mathematics assessment. This will be automatically calculated.
# Tested # At or Above Proficient % Results # Below Proficient
5,442 S 38 S
Comments: The response is limited to 4,000 characters.

OMB NO. 1810-0614 Page 54
1.6.3.6.3 MFLEP Students Results for Reading/Language Arts
In the table below, report results for MFLEP students who took the annual reading/language arts assessment. Please provide data only for those students who transitioned out of language instruction educational programs and who no longer received services under Title III in this reporting year. These students include both students who are monitored former LEP students in their first year of monitoring, and those in their second year of monitoring.
Table 1.6.3.6.3 Definitions:
1. # Tested = State-aggregated number of MFLEP students who were tested in reading/language arts in all AYP grades. 2. # At or Above Proficient = State-aggregated number of MFLEP students who scored at or above proficient on the
State annual reading/language arts assessment. 3. % Results = Automatically calculated based on number who scored at or above proficient divided by the total number
tested. This will be automatically calculated. 4. # Below proficient = State-aggregated number MFLEP students who did not score proficient on the State annual
reading/language arts assessment.
# Tested # At or Above Proficient % Results # Below Proficient
5,443 S 44 S
Comments: The response is limited to 4,000 characters.
1.6.3.6.4 MFLEP Students Results for Science
In the table below, report results for MFLEP students who took the annual science assessment. Please provide data only for those students who transitioned out of language instruction educational programs and who no longer received services under Title III in this reporting year. These students include both students who are MFLEP students in their first year of monitoring, and those in their second year of monitoring.
Table 1.6.3.6.4 Definitions:
1. # Tested = State-aggregated number of MFLEP students who were tested in science. 2. # At or Above Proficient = State-aggregated number of MFLEP students who scored at or above proficient on the
State annual science assessment. 3. % Results = Automatically calculated based on number who scored at or above proficient divided by the total number
tested. This will be automatically calculated. 4. # Below proficient = State-aggregated number MFLEP students who did not score proficient on the State annual
science assessment.
# Tested # At or Above Proficient % Results # Below Proficient
2,249 S 32 S
Comments: The response is limited to 4,000 characters.

OMB NO. 1810-0614 Page 55
1.6.4 Title III Subgrantees
This section collects data on the performance of Title III subgrantees.
1.6.4.1 Title III Subgrantee Performance
In the table below, report the number of Title III subgrantees meeting the criteria described in the table. Do not leave items blank. If there are zero subgrantees who met the condition described, put a zero in the number (#) column. Do not double count subgrantees by category.
Note: Do not include number of subgrants made under Section 3114(d)(1) from funds reserved for education programs and
activities for immigrant children and youth. (Report Section 3114(d)(1) subgrants in 1.6.5.1 ONLY.)
Title III Subgrantees
#
# - Total number of subgrantees for the year 56
/////////////////////////////////////////////////////////////////////////////////////////////////////////////////////////////// # - Number of subgrantees that met all three Title III AMAOs 1
# - Number of subgrantees who met AMAO 1 42
# - Number of subgrantees who met AMAO 2 52
# - Number of subgrantees who met AMAO 3 1
/////////////////////////////////////////////////////////////////////////////////////////////////////////////////////////////// # - Number of subgrantees that did not meet any Title III AMAOs 5
/////////////////////////////////////////////////////////////////////////////////////////////////////////////////////////////// # - Number of subgrantees that did not meet Title III AMAOs for two consecutive years (SYs 2010-11 and 2011-12) 55
# - Number of subgrantees implementing an improvement plan in SY 2011-12 for not meeting Title III AMAOs for two consecutive years
55
# - Number of subgrantees that have not met Title III AMAOs for four consecutive years (SYs 2008-09, 2009-10, 2010- 11, and 2011-12)
0
Provide information on how the State counted consortia members in the total number of subgrantees and in each of the numbers in table 1.6.4.1.
The response is limited to 4,000 characters. Comments: The response is limited to 4,000 characters. There are 60 total districts receiving Title III funds, but due to low numbers of ELL in a few districts the districts were combined into consortia rusulting in 56 subgrantees.
1.6.4.2 State Accountability
In the table below, indicate whether the State met all three Title III AMAOs.
Note: Meeting all three Title III AMAOs means meeting each State-set target for each objective: Making Progress, Attaining
Proficiency, and Making AYP for the LEP subgroup. This section collects data that will be used to determine State AYP, as
required under Section 6161. State met all three Title III AMAOs No Comments: The response is limited to 4,000 characters.
1.6.4.3 Termination of Title III Language Instruction Educational Programs
This section collects data on the termination of Title III programs or activities as required by Section 3123(b)(7).
Were any Title III language instruction educational programs or activities terminated for failure to reach program goals?
N
If yes, provide the number of language instruction educational programs or activities for immigrant children and youth terminated.
Comments: The response is limited to 4,000 characters.

OMB NO. 1810-0614 Page 56
1.6.5 Education Programs and Activities for Immigrant Students
This section collects data on education programs and activities for immigrant students.
Note: All immigrant students are not LEP students.
1.6.5.1 Immigrant Students
In the table below, report the unduplicated number of immigrant students enrolled in schools in the State and who participated in qualifying educational programs under Section 3114(d)(1).
Table 1.6.5.1 Definitions:
1. Immigrant Students Enrolled = Number of students who meet the definition of immigrant children and youth under
Section 3301(6) and enrolled in the elementary or secondary schools in the State. 2. Students in 3114(d)(1) Program = Number of immigrant students who participated in programs for immigrant
children and youth funded under Section 3114(d)(1), using the funds reserved for immigrant education
programs/activities. This number should not include immigrant students who only receive services in Title III language
instructional educational programs under Sections 3114(a) and 3115(a). 3. 3114(d)(1)Subgrants = Number of subgrants made in the State under Section 3114(d)(1), with the funds reserved for
immigrant education programs/activities. Do not include Title III Language Instruction Educational Program (LIEP)
subgrants made under Sections 3114(a) and 3115(a) that serve immigrant students enrolled in them.
# Immigrant Students Enrolled # Students in 3114(d)(1) Program # of 3114(d)(1) Subgrants
6,425 1
If state reports zero (0) students in programs or zero (0) subgrants, explain in comment box below.
The response is limited to 8,000 characters.
One subgrantee received $25,000 to meet the educational needs of 84 students.

OMB NO. 1810-0614 Page 57
1.6.6 Teacher Information and Professional Development
This section collects data on teachers in Title III language instruction educational programs as required under Section 3123 (b)(5).
1.6.6.1 Teacher Information
This section collects information about teachers as required under Section 3123 (b)(5).
In the table below, report the number of teachers who are working in the Title III language instruction educational programs are not paid with Title III funds.
Note: Section 3301(8) v The term µLanguage instruction educational program' means an instruction course v (A) in which a
limited English proficient child is placed for the purpose of developing and attaining English proficiency, while meeting challenging State academic content and student academic achievement standards, as required by Section 1111(b)(1); and (B) that may make instructional use of both English and a child's native language to enable the child to develop and attain
English proficiency and may include the participation of English proficient children if such course is designed to enable all participating children to become proficient in English as a second language.
Title III Teachers #
Number of all certified/licensed teachers currently working in Title III language instruction educational programs. 2,534
Estimate number of additional certified/licensed teachers that will be needed for Title III language instruction
educational programs in the next 5 years*.
500
Explain in the comment box below if there is a zero for any item in the table above.
The response is limited to 8,000 characters.
* This number should be the total additional teachers needed for the next 5 years, not the number needed for each year. Do not include the number of teachers currently working in Title III English language instruction educational programs.

OMB NO. 1810-0614 Page 58
1.6.6.2 Professional Development Activities of Subgrantees Related to the Teaching and Learning of LEP Students
In the tables below, provide information about the subgrantee professional development activities that meet the requirements of Section 3115(c)(2).
Table 1.6.6.2 Definitions:
1. Professional Development Topics = Subgrantee professional development topics required under Title III. 2. #Subgrantees = Number of subgrantees who conducted each type of professional development activity. A
subgrantee may conduct more than one professional development activity. (Use the same method of counting
subgrantees, including consortia, as in 1.6.1 and 1.6.4.) 3. Total Number of Participants = Number of teachers, administrators and other personnel who participated in each
type of the professional development activities reported. 4. Total = Number of all participants in professional development (PD) activities.
Type of Professional Development Activity # Subgrantees ////////////////////
///// Instructional strategies for LEP students 56 ////////////////////
///// Understanding and implementation of assessment of LEP students 56 ////////////////////
///// Understanding and implementation of ELP standards and academic content standards for LEP students
56
////////////////////
//////////////////// Alignment of the curriculum in language instruction educational programs to ELP standards
56
////////////////////
//////////////////// Subject matter knowledge for teachers 56 ////////////////////
///// Other (Explain in comment box) 56 ////////////////////
//////////////////// Participant Information # Subgrantees # Participants
PD provided to content classroom teachers 56 810
PD provided to LEP classroom teachers 56 534
PD provided to principals 56 309
PD provided to administrators/other than principals 56 285
PD provided to other school personnel/non-administrative 56 117
PD provided to community based organization personnel 56 377
Total 336 2,432
The response is limited to 8,000 characters.

OMB NO. 1810-0614 Page 59
1.6.7 State Subgrant Activities
This section collects data on State grant activities.
1.6.7.1 State Subgrant Process
In the table below, report the time between when the State receives the Title III allocation from ED, normally on July 1 of each year for the upcoming school year, and the time when the State distributes these funds to subgrantees for the intended school year. Dates must be submitted using the MM/DD/YY format.
Table 1.6.7.1 Definitions:
1. Date State Received Allocation = Annual date the State receives the Title III allocation from US Department of
Education (ED). 2. Date Funds Available to Subgrantees = Annual date that Title III funds are available to approved subgrantees. 3. # of Days/$$ Distribution = Average number of days for States receiving Title III funds to make subgrants to
subgrantees beginning from July 1 of each year, except under conditions where funds are being withheld.
Example: State received SY 2011-12 funds July 1, 2011, and then made these funds available to subgrantees on August 1,
2011, for SY 2011-12 programs. Then the "# of days/$$ Distribution" is 30 days.
Date State Received Allocation Date Funds Available to Subgrantees # of Days/$$ Distribution
07/01/12 07/01/12 0
Comments: The response is limited to 4,000 characters.
1.6.7.2 Steps To Shorten the Distribution of Title III Funds to Subgrantees
In the comment box below, describe how your State can shorten the process of distributing Title III funds to subgrantees.
The response is limited to 8,000 characters.
The date we receive the allocation is the date the funds are made available to sub grantees.

OMB NO. 1810-0614 Page 60
1.7 PERSISTENTLY DANGEROUS SCHOOLS
In the table below, provide the number of schools identified as persistently dangerous, as determined by the State, by the start of the school year. For further guidance on persistently dangerous schools, refer to Section B "Identifying Persistently Dangerous Schools" in the Unsafe School Choice Option Non-Regulatory Guidance, available at: http://www.ed.gov/policy/elsec/guid/unsafeschoolchoice.pdf.
Persistently Dangerous Schools #
Persistently Dangerous Schools 0
Comments: The response is limited to 4,000 characters.

OMB NO. 1810-0614 Page 61
1.9 EDUCATION FOR HOMELESS CHILDREN AND YOUTHS PROGRAM
This section collects data on homeless children and youths and the McKinney-Vento grant program.
In the table below, provide the following information about the number of LEAs in the State who reported data on homeless children and youths and the McKinney-Vento program. The totals will be will be automatically calculated.
LEAs # # LEAs Reporting Data
LEAs without subgrants 116 116
LEAs with subgrants 19 19
Total 135 135
Comments: The response is limited to 4,000 characters. The PED Homeless bureau intends to have all districts accounte
for in the CSPR Part I reopen.

OMB NO. 1810-0614 Page 62
1.9.1 All LEAs (with and without McKinney-Vento subgrants)
The following questions collect data on homeless children and youths in the State.
1.9.1.1 Homeless Children And Youths
In the table below, provide the number of homeless children and youths by grade level enrolled in public school at any time during the regular school year. The totals will be automatically calculated:
Age/Grade
# of Homeless Children/Youths Enrolled in
Public School in LEAs Without Subgrants
# of Homeless Children/Youths Enrolled in
Public School in LEAs With Subgrants
Age 3 through 5 (not Kindergarten)
13
113
K 42 1,017
1 60 1,075
2 62 1,059
3 63 1,082
4 64 1,033
5 49 1,025
6 55 971
7 53 835
8 37 763
9 54 851
10 54 632
11 46 431
12 50 372
Ungraded 0 720
Total 702 11,979
Comments: The response is limited to 4,000 characters.
1.9.1.2 Primary Nighttime Residence of Homeless Children and Youths
In the table below, provide the number of homeless children and youths by primary nighttime residence enrolled in public school at any time during the regular school year. The primary nighttime residence should be the student's nighttime residence when he/she was identified as homeless. The totals will be automatically calculated.
Primary Nighttime Residence # of Homeless Children/Youths -
LEAs Without Subgrants
# of Homeless Children/Youths -
LEAs With Subgrants
Shelters, transitional housing, awaiting foster care
54
962
Doubled-up (e.g., living with another family) 381 8,724
Unsheltered (e.g., cars, parks, campgrounds, temporary trailer, or abandoned buildings)
60
728
Hotels/Motels 20 545
Total 515 10,959
Comments: The response is limited to 4,000 characters. In 201-12012 the reporting of Homeless data moved from a
manual collection, in prior years, to the use of a centralized warehouse. During 2011-2012 the homeless data reported in
the warehouse was not properly audited. This allowed a discrepancy between grade count and primary night time
residence. In 2012-2013 PED started a strict verification of warehouse data and intends to eliminate this issue in the 2012- 2013 CSPR.
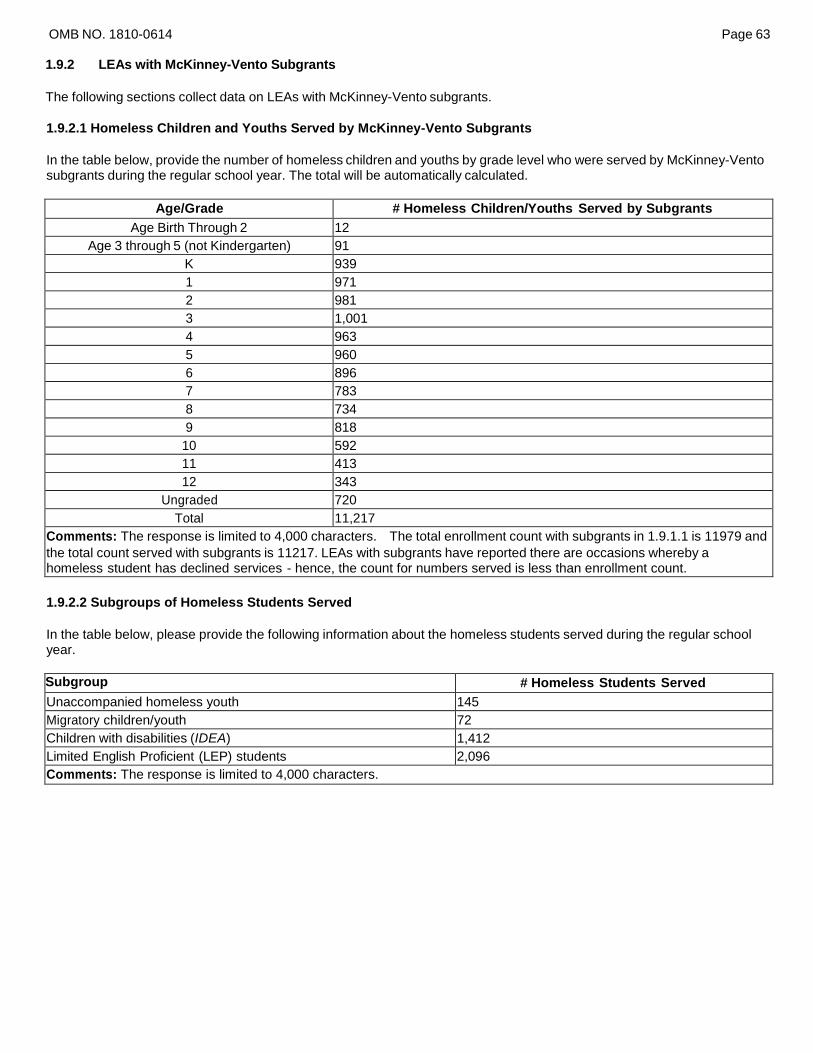
OMB NO. 1810-0614 Page 63
1.9.2 LEAs with McKinney-Vento Subgrants
The following sections collect data on LEAs with McKinney-Vento subgrants.
1.9.2.1 Homeless Children and Youths Served by McKinney-Vento Subgrants
In the table below, provide the number of homeless children and youths by grade level who were served by McKinney-Vento subgrants during the regular school year. The total will be automatically calculated.
Age/Grade # Homeless Children/Youths Served by Subgrants
Age Birth Through 2 12
Age 3 through 5 (not Kindergarten) 91
K 939
1 971
2 981
3 1,001
4 963
5 960
6 896
7 783
8 734
9 818
10 592
11 413
12 343
Ungraded 720
Total 11,217
Comments: The response is limited to 4,000 characters. The total enrollment count with subgrants in 1.9.1.1 is 11979 and
the total count served with subgrants is 11217. LEAs with subgrants have reported there are occasions whereby a homeless student has declined services - hence, the count for numbers served is less than enrollment count.
1.9.2.2 Subgroups of Homeless Students Served
In the table below, please provide the following information about the homeless students served during the regular school year.
Subgroup # Homeless Students Served
Unaccompanied homeless youth 145
Migratory children/youth 72
Children with disabilities (IDEA) 1,412
Limited English Proficient (LEP) students 2,096
Comments: The response is limited to 4,000 characters.

OMB NO. 1810-0614 Page 64
1.9.3 Academic Achievement of Homeless Students
The following questions collect data on the academic achievement of enrolled homeless children and youths.
1.9.3.1 Reading Assessment
In the table below, provide the number of enrolled homeless children and youths who were tested on the State ESEA reading/language arts assessment and the number of those tested who scored at or above proficient. Provide data for grades 9 through 12 only for those grades tested for ESEA.
Grade
# Homeless Children/Youth Who Received a Valid Score and
for Whom a Proficiency Level Was Assigned
# Homeless Children/Youth Scoring at
or above Proficient
3 628 186
4 590 167
5 592 189
6 546 135
7 493 144
8 448 170
High School 283 84
Comments: The response is limited to 4,000 characters.
1.9.3.2 Mathematics Assessment
This section is similar to 1.9.3.1. The only difference is that this section collects data on the State mathematics assessment.
Grade
# Homeless Children/Youth Who Received a Valid Score and
for Whom a Proficiency Level Was Assigned
# Homeless Children/Youth Scoring at
or above Proficient
3 623 182
4 587 122
5 590 122
6 544 102
7 491 107
8 445 93
High School 285 46
Comments: The response is limited to 4,000 characters.
1.9.3.3 Science Assessment
This section is similar to 1.9.3.1. The only difference is that this section collects data on the State science assessment.
Grade
# Homeless Children/Youth Who Received a Valid Score and
for Whom a Proficiency Level Was Assigned
# Homeless Children/Youth Scoring at
or above Proficient
3 4 586 163
5 6 7 484 85
8 High School 266 43
Comments: The response is limited to 4,000 characters. Only grades 4,7 and 11 were tested.

OMB NO. 1810-0614 Page 65
1.10 MIGRANT CHILD COUNTS This section collects the Title I, Part C, Migrant Education Program (MEP) child counts which States are required to provide and may be used to determine the annual State allocations under Title I, Part C. The child counts should reflect the reporting period of September 1, 2011 through August 31, 2012. This section also collects a report on the procedures used by States to produce true, accurate, and valid child counts.
To provide the child counts, each SEA should have sufficient procedures in place to ensure that it is counting only those children who are eligible for the MEP. Such procedures are important to protecting the integrity of the State's MEP because they permit the early discovery and correction of eligibility problems and thus help to ensure that only eligible migrant children are counted for funding purposes and are served. If an SEA has reservations about the accuracy of its child counts, it must inform the Department of its concerns and explain how and when it will resolve them under Section 1.10.3.4 Quality Control Processes.
Note: In submitting this information, the Authorizing State Official must certify that, to the best of his/her knowledge, the child
counts and information contained in the report are true, reliable, and valid and that any false Statement provided is subject to
fine or imprisonment pursuant to 18 U.S.C. 1001.
FAQs on Child Count:
a. How is "out-of-school" defined? Out-of-school means youth up through age 21 who are entitled to a free
public education in the State but are not currently enrolled in a K-12 institution. This could include students who have dropped out of school, youth who are working on a GED outside of a K-12 institution, and youth who are "here-to-work" only. It does not include preschoolers, who are counted by age grouping.
b. How is "ungraded" defined? Ungraded means the children are served in an educational unit that has no
separate grades. For example, some schools have primary grade groupings that are not traditionally graded, or ungraded groupings for children with learning disabilities. In some cases, ungraded students may also include special education children, transitional bilingual students, students working on a GED through a K-12 institution, or those in a correctional setting. (Students working on a GED outside of a K-12 institution are counted as out-of-school youth.)

OMB NO. 1810-0614 Page 66
1.10.1 Category 1 Child Count
In the table below, enter the unduplicated statewide number by age/grade of eligible migrant children age 3 through 21 who,
within 3 years of making a qualifying move, resided in your State for one or more days during the reporting period of September 1, 2011 through August 31, 2012. This figure includes all eligible migrant children who may or may not have
participated in MEP services. Count a child who moved from one age/grade level to another during the reporting period only once in the highest age/grade that he/she attained during the reporting period. The unduplicated statewide total count is
calculated automatically.
Do not include:
Children age birth through 2 years
Children served by the MEP (under the continuation of services authority) after their period of eligibility has expired when other services are not available to meet their needs
Previously eligible secondary-school children who are receiving credit accrual services (under the continuation of services authority).
Age/Grade
12-Month Count of Eligible Migrant Children Who Can Be Counted for
Funding Purposes
Age 3 through 5 (not Kindergarten) 34
K 34
1 51
2 42
3 35
4 35
5 45
6 42
7 50
8 34
9 35
10 26
11 21
12 20
Ungraded 0
Out-of-school 9
Total 513
Comments: The response is limited to 4,000 characters. Our file C121 was submitted to EDEN yesterday. We had some
submission errors that have prevented the data from pre-populating the CSPR.

OMB NO. 1810-0614 Page 67
1.10.1.1 Category 1 Child Count Increases/Decreases
In the space below, explain any increases or decreases from last year in the number of students reported for Category 1
greater than 10 percent.
The response is limited to 8,000 characters.
our data did not change = or- 10 percent.

OMB NO. 1810-0614 Page 68
1.10.2 Category 2 Child Count
In the table below, enter by age/grade the unduplicated statewide number of eligible migrant children age 3 through 21 who,
within 3 years of making a qualifying move, were served for one or more days in a MEP-funded project conducted during
either the summer term or during intersession periods that occurred within the reporting period of September 1, 2011 through August 31, 2012. Count a child who moved from one age/grade level to another during the reporting period only once in the highest age/grade that he/she attained during the reporting period. Count a child who moved to different schools within the State and who was served in both traditional summer and year-round school intersession programs only once. The unduplicated statewide total count is calculated automatically.
Do not include:
Children age birth through 2 years
Children served by the MEP (under the continuation of services authority) after their period of eligibility has expired when other services are not available to meet their needs
Previously eligible secondary-school children who are receiving credit accrual services (under the continuation of services authority).
Age/Grade
Summer/Intersession Count of Eligible Migrant Children Who Are Participants and
Who Can Be Counted for Funding Purposes
Age 3 through 5 (not Kindergarten)
1
K 1
1 0
2 3
3 4
4 1
5 3
6 5
7 2
8 0
9 3
10 1
11 0
12 0
Ungraded 0
Out-of-school 0
Total 24
Comments: The response is limited to 4,000 characters. C122 was submitted without submission errors early on
December 20. We cannot account for the absence of data here.

OMB NO. 1810-0614 Page 69
1.10.2.1 Category 2 Child Count Increases/Decreases
In the space below, explain any increases or decreases from last year in the number of students reported for Category 2
greater than 10 percent.
The response is limited to 8,000 characters.
we did not have a decrease or increase in Category 2 students that was greater than 10 percent.

OMB NO. 1810-0614 Page 70
1.10.3 Child Count Calculation and Validation Procedures
The following question requests information on the State's MEP child count calculation and validation procedures.
1.10.3.1 Student Information System
In the space below, respond to the following questions: What system(s) did your State use to compile and generate the Category 1 and Category 2 child count for this reporting period (e.g., NGS, MIS 2000, COEStar, manual system)? Were child counts for the last reporting period generated using the same system(s)? If the State's Category 2 count was generated using a different system from the Category 1 count, please identify each system.
The response is limited to 8,000 characters.
Our State uses the ERTC MAPS system for Category 1 and Category 2 counts.

OMB NO. 1810-0614 Page 71
1.10.3.2 Data Collection and Management Procedures
In the space below, respond to the following questions: How was the child count data collected? What data were collected? What activities were conducted to collect the data? When were the data collected for use in the student information system? If the data for the State's Category 2 count were collected and maintained differently from the Category 1 count, please describe each set of procedures.
The response is limited to 8,000 characters.
The ERTC MAPS system is used at the local level, by Migrant Program Coordinators to enter COE data as well as data that is required to answer CSPR questions for Category 1, Category 2, Summer/Intercession Data, student demographics, assessment data, program data, qualifying moves, priority for service, age and grade level. The ERTC MAPS data is collected and verified through out the year as needed. In addition, Migrant students are reported by districts in the state's longitudinal data system during five state required reporting periods; which occur in October, December, February, June, and July or August depending on when the district's school year begins. For category 1, how does the SEA identify and locate migrant children for the MEP? The local sites enlist the assistance of recruiters. Does NM conduct face-to-face interviews or telephone interviews? The sites do face to face interviews. Does NM use employees or contractors for recruitment? We use both employees and contractors.
How does NM confirm or verify residency for children who were identified in previous years? We go out to re-enroll each year. Does NM collect all data elements and use all data sections as required by OME's national COE? Yes
Does NM use a paper or electronic COE? We use paper COEs when we go out for the interview and then upload that data to an electronic version in MAPS. For category 2, how does NM determine if an eligible migratory child received summer/intersession services? It is reported in MAPS.
In the space below, describe how the child count data are inputted, updated, and then organized by the student information system for child count purposes at the State level.
The response is limited to 8,000 characters.
The ERTC MAPS system collects MEP student data through forms that collect student and family data. The State Level Migrant Program Director and the NMPED Data Quality and Analysis Manager reviews the data. They notify local MEP staff to correct any errors in the ERTC MAPS system. The system generates reports that are available to the state administrator that returns values that map to the complete MEP data set for CSPR parts I and II. Please describe how data from COEs are entered into MAPS. The recruiters input the data from the paper COE's into MAPS. Please describe how data regarding children served during summer/intersession periods are entered into the system. Through summer participation check boxes in the MAPS system. Please explain how NM eliminates duplicates in the student information system. MAPS and the State Longitudinal Data System does not allow children with the same ID to be entered. Each child is given a unique state ID from 0-2 through OSY if they are going to be placed on a COE.
If the data for the State's Category 2 count were collected and maintained differently from the Category 1 count, please describe each set of procedures.
The response is limited to 8,000 characters.
This section does not apply to New Mexico.

OMB NO. 1810-0614 Page 72
1.10.3.3 Methods Used To Count Children
In the space below, respond to the following question: How was each child count calculated? Please describe the compilation process and edit functions that are built into your student information system(s) specifically to produce an accurate child count. In particular, describe how your system includes and counts only:
Children who were between age 3 through 21
Children who met the program eligibility criteria (e.g., were within 3 years of a last qualifying move, had a qualifying activity)
Children who were resident in your State for at least 1 day during the eligibility period (September 1 through August 31)
Children who–in the case of Category 2–received a MEP-funded service during the summer or intersession term
Children once per age/grade level for each child count category.
The response is limited to 8,000 characters.
As previously stated the ERTC MAPS system collects student level demographic data, QAD data, program data(regular school year or Summer/Intercession), general eligibility and eligibility for Priority for Services. The queries that are written against the data account for the criteria requested for each element of the CSPR. Box 1: Please describe the compilation process and edit functions that are built into your student information system(s) specifically to produce an accurate child count. In particular, describe how your system includes and counts only: l Children who were between age 3 through 21 l Children who met the program eligibility criteria (e.g., were within 3 years of a last qualifying move, had a qualifying activity) l Children who were resident in your State for at least 1 day during the eligibility period (September 1 through August 31) l Children who-in the case of Category 2-received a MEP-funded service during the summer or intersession term l Children once per age/grade level for each child count category. How do you know that the student was in the State? How do you know that the count is unduplicated? The ERTC MAPS system where the MEP student information is collected includes many data elements that address your primary and follow-up questions that are entered above:
• The date of birth determines the age range. • The arrival date contextually determines if it is within the eligibility period. • Summer/Intercession students are flagged with a check box as well as have service types identified in associated
fields • The Unique State Student ID prevents children from being counted twice within age/grade level • The COE determines if the student was in the state. • The Unique State Student ID prevents duplication
If your State's Category 2 count was generated using a different system from the Category 1 count, please describe each system separately.
The response is limited to 8,000 characters.
This section does not apply to New Mexico.

1.10.3.4 Quality Control Processes
In the space below, respond to the following question: What steps are taken to ensure your State properly determines and verifies the eligibility of each child included in the child counts for the reporting period of September 1 through August 31 before that child's data are included in the student information system(s)?
The response is limited to 8,000 characters.
The Certificates of Eligibility(COE)for eaach migrant family are entered in ERTC MAPS. These are verified locally and approved by the State Migrant Program Coordinator. If the COE is not verified and approved the data for these students is not included in the data files created for the CSPR. Does NM use national COE approved by OME? Yes.
Does NM base eligibility determinations on personal interviews?
Yes. Who "verifies" COEs locally? Local migrant director.
Who is the State Migrant Program Coordinator and what is his/her role? Louie R. Torrez. His responsibilities include all MEP programming and services, approve Title I, Part C applications, liason with USED OME, provide training and technical assistance for coordinators and recruiters, review all migrant data for accuracy and reasonableness, prepare reports for USED, state ID & R administrator, fiscal. Are recruiters trained at least annually on eligibility requirements? Yes.
What does training include? Review of eligibility requirements, review COE's.
Is there a formal process for reviewing COEs? I review each COE at the state level.
Is there a process for returning incomplete or questionable COEs to the recruiter for correction? Yes. When I have questions about COE's I put a note on the COE in question and deny the COE so the local district can work on my questions and then resubmit the COE. I also call them by phone to work on them together. Does NM provide recruiters with written eligibility guidance, such as a handbook?
Yes. Does NM review COEs as part of regular monitoring? Yes.
Does the SEA review student attendance at summer projects? I am new since January 01 and have not gone through a summer program yet. Does NM have both local and State-level processes for resolving eligibility questions? Yes. Does the SEA periodically evaluate the effectiveness of recruitment efforts and revise procedures accordingly? We are currently working on a system to do this. Does NM provide records personnel with training at least annually on how to review summer site records, input data, and run reports for child counts? We are planning to implement this as we move forward.
In the space below, describe specifically the procedures used and the results of any re-interview processes used by the SEA during the reporting period to test the accuracy of the State's MEP eligibility determinations. In this description, please include the number of eligibility determinations sampled, the number for which a test was completed, and the number found eligible.
The response is limited to 8,000 characters.
In August 2012, NM MEP contracted to provide re-interviewer training for NM MEP re-interviews. PED's Division of Information Tehnology pulled COE sample and the list for names for re-interviews was approved by the State MEP Director. Recommendation from the OME monitor for New Mexico was to conduct re-interaviews in two NM MEP sites. To date reinterviews conducted confirmed all re-interviews were eligible MEP families. Report is in process of being completed. The number of eligibility determinations in the sample. 35 families

The number of eligibility determinations for which a re-interview was completed. All families in Deming and Hagerman. The number of eligibility determinations in the sample for which a re-interview was completed and the student found eligible. All were completed and found eligible
The response rate, and reasons for non-response. 100%
Was the sample random? No. Frances Moran said because of our numbers we could use a different system.
What was the sampling replacement method? Since our state currently has 8 sites we are rotating through the sites over the next few years to cover all of the state.
Was the sample statewide or stratified by group/area? We sample by area.
Was the sample at least 50 re-interviews or otherwise sufficient to provide an early warning of problems that may be developing? Again, because our numbers are less than larger states we were given permission to do less than 50.
Were re-interviews conducted face-to-face? Yes
Was a standard instrument used? Yes
Did it contain all items used in making the original eligibility determination? Yes
Were the re-interviewers trained and provided guidance? Yes Did the SEA conduct independent re-interviews this year? No If so, how did you ensure that the process was independent? Does the SEA have a process in place to conduct prospective re-interviews annually? Not currently.
Additional detailed information is available about this topic in our November 16, 2012 report to OME that has a reinterview report of 16 pages.
In the space below, respond to the following question: Throughout the year, what steps are taken by staff to check that child count data are inputted and updated accurately (and–for systems that merge data–consolidated accurately)?
The response is limited to 8,000 characters. The ERTC data is reviewed twice a month by program and the Office of Data Quality and Analysis. Data errors are identified to local MEP Program staff and they are required to revise the data.
Does the SEA have written procedures to ensure that child count data are inputted and updated? Yes
Does the SEA provide LEAs with student lists periodically to check for accuracy? They have access to lists that are generated from reports they can produce from the state data system and the migrant data system.
Does the SEA conduct audits of COEs using random samples? Yes
Does the SEA audit other child count records using random samples? Yes
What is "ERTC data"? This is our MAPS data
In the space below, respond to the following question: What final steps are taken by State staff to verify the child counts produced by your student information system(s) are accurate counts of children in Category 1 and Category 2 prior to their submission to ED?
The response is limited to 8,000 characters.
The individual student data from ERTC are cross referenced with the State's Longitudinal data system. (STARS) The Data Quality and Analysis Manager reviewed the individual record of all migrant students included here. The STARS report used; "Student Display" provides a complete overview of student demographic, programmatic and assessment data for a student over time. For a migrant student the student display will show their mobility within the state across districts over years and the associated demographic and programmatic data for the student at each district. The dates of qualifying moves, demographic data points, and program/service data can be cross refernced to the student record in ERTC MAPS.

Does the MEP State Director review final child counts, comparing counts to previous years, expectations for the current year, and /or other data tables in CSPR to assess reasonableness of the count? I have only been the state director since January 01, 2013 and am looking to do periodic checks for the accuracy of child counts in the migrant program.
Please explain the process of "cross-referencing" data from MAPS with STARS. How does this help verify child counts of eligible migrant children? I run a report from both programs and compare that the data is the same in both places.
In the space below, describe those corrective actions or improvements that will be made by the SEA to improve the accuracy of its MEP eligibility determinations in light of the prospective re-interviewing results.
The response is limited to 8,000 characters.
NMMEP will improve the re-interview process by determining the most appropriate times to conduct re-interviews in order to ensure families are still present when re-interviews are conducted. Re-interviews will be conducted throughout the year including seasonal work times. NMMEP has contracted and conducted two ID&R trainings and is working with the contractor to develop a comprehensive plan for conducting re-interviews and analyzing data to ensure high quality ID&R
processes in NM.
In the space below, discuss any concerns about the accuracy of the reported child counts or the underlying eligibility determinations on which the counts are based.
The response is limited to 8,000 characters.
We do not have any profound concerns about the data. But, we are always engaged in data quality and improvement. Therefore we are looking to IT innovations, such as Sharepoint to support, faciliate, and improve the data collection process.