
Consolidated Results of Operations (US GAAP) · PDF fileConsolidated Results of Operations (US...
37
Consolidated Results of Operations (US GAAP) First quarter, year ending March 2012 Nomura Holdings, Inc. July 2011
Transcript of Consolidated Results of Operations (US GAAP) · PDF fileConsolidated Results of Operations (US...

Consolidated Results of Operations (US GAAP)First quarter, year ending March 2012
Nomura Holdings, Inc.
July 2011

This document is produced by Nomura Holdings, Inc. (“Nomura”). Copyright 2011 Nomura Holdings, Inc. All rights reserved. Nothing in this document shall be considered as an offer to sell or solicitation of an offer to buy any security, commodity or other
instrument, including securities issued by Nomura or any affiliate thereof. Offers to sell, sales, solicitations to buy, or purchases ofany securities issued by Nomura or any affiliate thereof may only be made or entered into pursuant to appropriate offeringmaterials or a prospectus prepared and distributed according to the laws, regulations, rules and market practices of thejurisdictions in which such offers or sales may be made.
No part of this document shall be reproduced, stored in a retrieval system or transmitted in any form or by any means, electronic,mechanical, photocopying, recording or otherwise, without the prior written permission of Nomura.
The information and opinions contained in this document have been obtained from sources believed to be reliable, but nof
2
representations or warranty, express or implied, are made that such information is accurate or complete and no responsibility orliability can be accepted by Nomura for errors or omissions or for any losses arising from the use of this information.
This document contains statements that may constitute, and from time to time our management may make "forward-lookingstatements" within the meaning of the safe harbor provisions of The Private Securities Litigation Reform Act of 1995. Any suchstatements must be read in the context of the offering materials pursuant to which any securities may be offered or sold in theUnited States. These forward-looking statements are not historical facts but instead represent only our belief regarding futureevents, many of which, by their nature, are inherently uncertain and outside our control. Important factors that could cause actualresults to differ from those in specific forward-looking statements include, without limitation, economic and market conditions,political events and investor sentiments, liquidity of secondary markets, level and volatility of interest rates, currency exchangerates, security valuations, competitive conditions and size, and the number and timing of transactions.
The consolidated financial information in this document is unaudited.

Highlights (P4) Executive summary (P5) Overview of results (P6) Business segment results (P7) Retail (P8-9) Asset Management (P10-11) Wholesale (P12-16)
Outline
Presentation Financial Supplement
Consolidated balance sheet (p. 20) Value at risk (p. 21) Consolidated financial highlights (p. 22) Consolidated income (p. 23) Main revenue items (p. 24) Adjustment of consolidated results and segment results:
Income (loss) before income taxes (p. 25) Segment “Others” (p 26)
3
Non-interest expenses(P17) Robust financial position(P18)
Segment “Others” (p. 26) Retail related data (p. 27-31) Asset Management related data (p. 32-33) Wholesale related data (p. 34-35) Number of employees (p. 36)

Highlights Ninth consecutive quarter of profitability despite uncertain macro-
economic environment
Domestic businesses performed well: Retail and Asset Management reported higher pretax income QoQ
Very challenging quarter for Wholesale businesses as markets remained highly volatile, severely impacted by sovereign crisis in
4
g y , y p y gEurope and earthquake in Japan; However, proportion of international revenues in Wholesale increased further
US build out continues: Global Markets and Investment Banking US revenues increased QoQ
Converted Nomura Land and Building into a subsidiary to centralize thegroup’s dispersed holdings
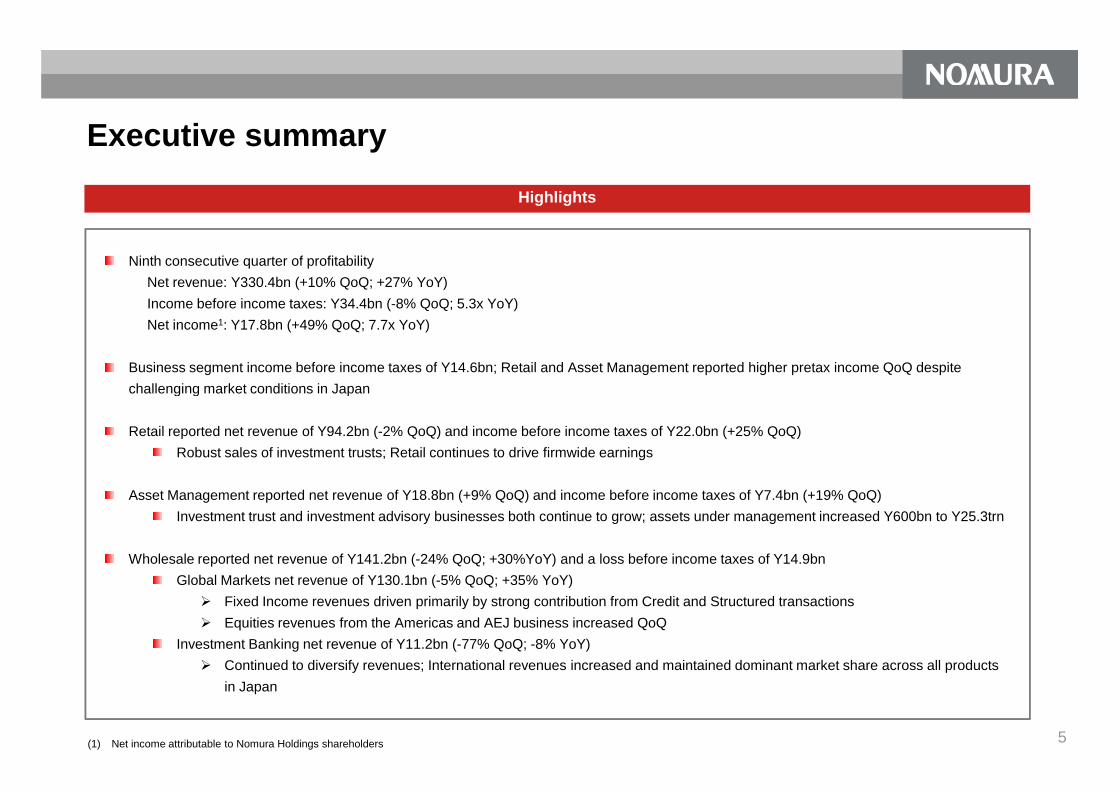
Ninth consecutive quarter of profitabilityNet revenue: Y330.4bn (+10% QoQ; +27% YoY)Income before income taxes: Y34.4bn (-8% QoQ; 5.3x YoY)Net income1: Y17.8bn (+49% QoQ; 7.7x YoY)
Business segment income before income taxes of Y14.6bn; Retail and Asset Management reported higher pretax income QoQ despite challenging market conditions in Japan
Highlights
Executive summary
5
g g p
Retail reported net revenue of Y94.2bn (-2% QoQ) and income before income taxes of Y22.0bn (+25% QoQ)Robust sales of investment trusts; Retail continues to drive firmwide earnings
Asset Management reported net revenue of Y18.8bn (+9% QoQ) and income before income taxes of Y7.4bn (+19% QoQ)Investment trust and investment advisory businesses both continue to grow; assets under management increased Y600bn to Y25.3trn
Wholesale reported net revenue of Y141.2bn (-24% QoQ; +30%YoY) and a loss before income taxes of Y14.9bnGlobal Markets net revenue of Y130.1bn (-5% QoQ; +35% YoY) Fixed Income revenues driven primarily by strong contribution from Credit and Structured transactions Equities revenues from the Americas and AEJ business increased QoQ
Investment Banking net revenue of Y11.2bn (-77% QoQ; -8% YoY) Continued to diversify revenues; International revenues increased and maintained dominant market share across all products
in Japan
(1) Net income attributable to Nomura Holdings shareholders
Highlights
FY2011/12 1Q1
FY2010/114Q
QoQ(%)
FY2010/111Q
YoY(%)
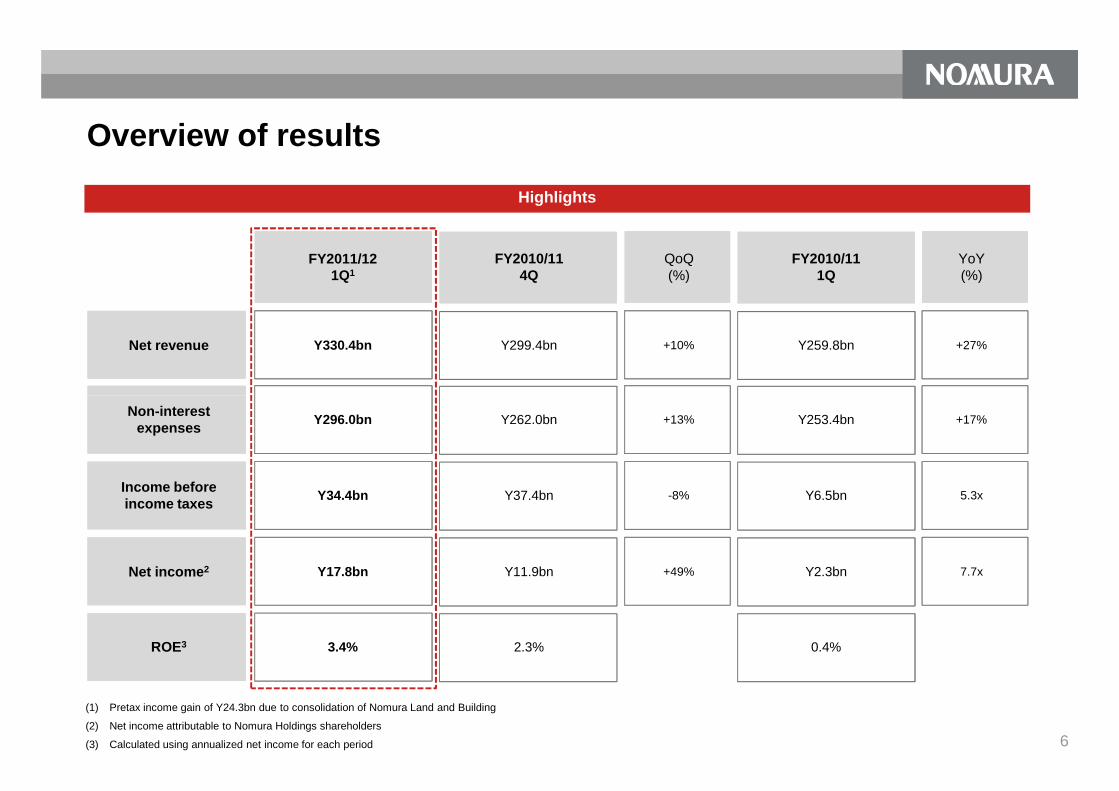
Net revenue Y330.4bn Y299.4bn +10% Y259.8bn +27%
Overview of results
6
(1) Pretax income gain of Y24.3bn due to consolidation of Nomura Land and Building
(2) Net income attributable to Nomura Holdings shareholders
(3) Calculated using annualized net income for each period
Non-interest expenses Y296.0bn Y262.0bn +13% Y253.4bn +17%
Income before income taxes Y34.4bn Y37.4bn -8% Y6.5bn 5.3x
Net income2 Y17.8bn Y11.9bn +49% Y2.3bn 7.7x
ROE3 3.4% 2.3% 0.4%

Business segment results
FY2011/12 1Q
FY2010/11 4Q % FY2010/11
1Q %
Revenue
Retail Y94.2bn Y96.2bn -2% Y111.0bn -15%
Asset Management Y18.8bn Y17.3bn +9% Y15.8bn +20%
Wholesale Y141.2bn Y186.3bn -24% Y108.6bn +30%
Segment total Y254.3bn Y299.9bn -15% Y235.3bn +8%
Other1 Y77 4bn Y2 5bn 30 4x Y35 1bn 2 2x
Net revenue and income (loss) before income tax
7(1) FY2011/12 1Q “Other” includes fair value loss on own debt of Y7.1bn(2) Nomura Bank (Luxembourg) S.A. in Asset Management was integrated into Other in April 2011. Reclassifications of previously reported amounts for Asset Management and Other have been
made to conform to the current presentation.
Other Y77.4bn Y2.5bn 30.4x Y35.1bn 2.2x
Unrealized gain (loss) on investments in equity securities held for operating purposes (Y1.3bn) (Y3.0bn) - (Y10.6bn) -
Net revenue Y330.4bn Y299.4bn +10% Y259.8bn +27%
Income (loss) before income taxes
Retail Y22.0bn Y17.7bn +25% Y37.7bn -42%
Asset Management Y7.4bn Y6.3bn +19% Y4.0bn +86%
Wholesale (Y14.9bn) Y29.4bn - (Y41.1bn) -
Segment total Y14.6bn Y53.4bn -73% Y0.6bn 24.6x
Other1 Y21.0bn (Y12.9bn) - Y16.5bn +28%
Unrealized gain (loss) on investments in equity securities held for operating purposes (Y1.3bn) (Y3.0bn) - (Y10.6bn) -
Income (loss) before income tax Y34.4bn Y37.4bn -8% Y6.5bn 5.3x

Net revenue and income before income taxes Key points
Retail
(billions of yen)
FY2010/11 FY11/ 12QoQ YoY
1Q 2Q 3Q 4Q 1Q
Net revenue 111.0 87.8 97.5 96.2 94.2 -2% -15%
Non-interest expenses 73.2 65.0 74.5 78.6 72.2 -8% -1%
Net revenue: Y94.2bn (-2% QoQ; -15% YoY)
Income before income taxes: Y22bn (+25% QoQ; -42% YoY)
Despite the difficult environment, Retail client asset inflows were positive for the fifth straight quarter as we delivered investment trusts, foreign bonds, and insurance products tailored to client needs
Client franchise
8
Retail client assets
FY2010/11 FY2011/121Q 2Q 3Q 4Q 1Q
Income before income taxes 37.7 22.8 23.0 17.7 22.0 +25% -42%
Client franchise– Retail client assets Y70.4trn– Accounts with balance 4.94m
– Net asset inflow Y847.3bn
Sales of main investment trusts
– Nomura Global Trend Fund Y200.6bn– Nomura Global High Yield Bond Fund Y140.8bn– Nomura Global CB Fund Y137.8bn
– Nomura DB High Dividend Infrastructure Stock Fund Y128.1bn
Other sales (1Q total)
– IPOs and public offerings Y15.3bn– Foreign bonds Y414bn
Key performance indicator(trillions of yen)
68.4 68.1 72.3 70.6 70.4

Retail: Consulting based approach
Total sales(billions of yen)
Total sales declined amid challenging market conditions, but our diverse product offering met the needs of retail investorsTrading value on Tokyo Stock Exchange dropped by 25% QoQ, resulting in an 11% QoQ decline in total sales; However, we maintained our consulting based approach and continued to deliver investment trust and foreign currency denominated products matched to the needs of retail investorsInvestment trusts
Net inflows into investment trusts increased as we responded accurately to client needs with diverse product lineup including monthly distribution funds, equity funds, and thematic funds
BondsInflows from sales of Australian dollar and Brazilian real denominated bonds
1,000
2,000
3,000
4,000 Stocks Bonds Investment Trusts Others
99
FY2010/11 FY2011/121Q 2Q 3Q 4Q 1Q
FY2010/11 FY2011/121Q 2Q 3Q 4Q 1Q
Sales of foreign bondsNet inflows into investment trusts
411.0 437.6
328.7
388.2 414.0
0
100
200
300
400
500
FY2010/11 FY2011/121Q 2Q 3Q 4Q 1Q
denominated bondsOther products
New foreign currency denominated products drove growth in insurance products
(billions of yen)
438
248 268
197
320
0
100
200
300
400
500
0
(billions of yen)

Net revenue and income before income taxes1 Key points
Asset Management
(billions of yen)
FY2010/11 FY11/ 12QoQ YoY
1Q 2Q 3Q 4Q 1Q
Net revenue 15.8 16.2 17.3 17.3 18.8 +9% +20%
Non-interestexpenses 11.8 12.0 11.7 11.0 11.4 +3% -3%
Net revenue: Y18.8bn (+9% QoQ; +20% YoY)
Income before income taxes: Y7.4bn (+19% QoQ; +86% YoY)
Assets under management increased by Y600bn from the end of March to Y25.3trn as of June 30, 2011
Inflows into public stock investment trusts (excluding ETFs) totaled Y310bn, primarily from the East Japan Revival Support Bond Fund,
10
Assets under management
FY2010/11 FY2011/121Q 2Q 3Q 4Q 1Q
Income before income taxes 4.0 4.2 5.6 6.3 7.4 +19% +86%
Key performance indicator(trillions of yen)
, p y p pp ,currency selection-type funds, and Japanese equity funds; New fund inflows from Nomura Securities and bank channels
Increased mandates from pension funds and Asian and Middle East government institutions and SWFs in investment advisory business, mainly for Asian equity products
Listed ETFs in Japan that track Thailand’s SET50 Index and Malaysia’s FTSE Bursa Malaysia KLCI; Nomura Asset Management’s NEXT FUNDS lineup of ETFs now consists of 37 products
Converted fund of private equity funds management company into a wholly owned subsidiary and renamed it Nomura Private Equity Capital; Aiming to enhance capabilities in Asia and further develop product offering
22.223.3
24.1 24.7 25.3
(1) Nomura Bank (Luxembourg) S.A. in Asset Management was integrated into Other in April 2011. Certain reclassifications of previously reported amounts have been made to conform to the current presentation.

Inflows into investment trusts, increased market share
Asset Management: Investment trust and investment advisorybusinesses both performed well
Winning mandates from institutional investors
(billions of yen)
Net inflow in public stock investment trusts (excl. ETFs)1 Investment advisory assets under management3
(trillions of yen)
555
438400
344311
200
400
600
2.9 3.7 4.6 5.3 5.7
4.0
6.0
8.0
10.0
12.0
Non-Japan
Japan
11
Enhanced capabilities in Asia Share of Japan public investment trust market1, 2
(1) Nomura Asset Management only(2) Source: Nomura, based on data from The Investment Trusts Association, Japan(3) Based on reporting standard for Japan Securities Investment Advisers Association
Enhanced expertise on Asia by building up local research presence
Research presence in four offices across Singapore, Hong Kong, and Malaysia
Commenced asset management business in India following launch of LIC Nomura Mutual Fund Asset Management in March 2011
Opened a representative office in Shanghai in July and commenced research on companies based in mainland China
FY2010/11 FY2011/121Q 2Q 3Q 4Q 1Q
04.4 4.5 4.5 4.4 4.9
0.0
2.0
Jun-10 Sep-10 Dec-10 Mar-11 Jun-11
20.7%21.2%
21.7% 21.8% 21.9%
18.0%
20.0%
22.0%
Jun-10 Sep-10 Dec-10 Mar-11 Jun-11
Wholesale
(billions of yen) (billions of yen)
FY2010/11 FY11/12QoQ YoY
1Q 2Q 3Q 4Q 1Q
Net revenue 108.6 163.4 172.2 186.3 141.2 -24% +30%
Non-interest expenses 149.8 155.8 161.4 156.9 156.1 -1% +4%
Income (loss) before income taxes -41.1 7.6 10.8 29.4 -14.9 - -
36 7 50.9 58.8 70.840 1
36.255.5 52.5
57.8
40.1
25.2
35.3 40.338.9
41.710.5
21.7 20.618.8
19.4
50.0
100.0
150.0
200.0AEJ
Americas
EMEA
Japan
Net revenue and income (loss) before income taxes Net revenue by region
12
FY2010/11 FY2011/121Q 2Q 3Q 4Q 1Q
36.7 40.10.0
Net revenue: Y141.2bn (-24% QoQ; +30% YoY) Loss before income taxes: Y14.9bn
Americas and AEJ revenues steadily increasing
Global Markets impacted by challenging environment from subdued client activity
Diversified business portfolio and disciplined risk management kept overall revenue decline to a minimum under the challenging market conditions
In Investment Banking, the proportion of international revenues increased while Japan revenues were essentially unchanged from 1Q last year
Key points
Japan34%
EMEA33%
Americas23%
AEJ10%
FY2010/11 1Q
Japan28%
EMEA28%
Americas30%
AEJ14%
FY2011/12 1Q

Wholesale: Global MarketsNet revenue and income (loss) before income taxes
(billions of yen)
Key points
Net revenue: Y130.1bn (-5% QoQ; +35% YoY) Income before income taxes: Y5.7bn (-50% QoQ)
Fixed Income Revenues of Y67.6bn down only slightly QoQ as higher revenues from
Credit and FX products offset an industry-wide decline in Rates revenues from macro uncertainties
Credit revenues increased versus last quarter, primarily driven by rise in appetite for Non-Yen bonds among Japan investors
d i k i t t d dit t ti i EMEA d AEJ
FY2010/11 FY11/12QoQ YoY
1Q 2Q 3Q 4Q 1Q
Fixed Income 41.0 77.8 71.7 69.4 67.6 -3% +65%
13
and pick-up in structured credit transactions in EMEA and AEJ FX delivered best quarter in last two years tapping into growth
opportunities in LatAm currencies
Equities Market volumes dropped significantly due to weaker investor risk
appetite on concerns over political instability mainly in Europe as well as the economic outlook in Japan following the earthquake. Despite this, Equities net revenue was Y56.7bn, down only 12% QoQ
Revenues increased in the Americas and AEJ, offset by subdued results in Japan and EMEA
Americas revenues have continued to trend upwards since launch of Cash platform last October; Program trading and derivatives robust in 1Q
AEJ client revenues grew in both cash and derivatives businesses
Conducted Japan equity campaign under extremely difficult environment in Japan
Equities 46.3 55.2 61.5 64.3 56.7 -12% +22%
Others 9.2 11.4 7.8 3.3 5.8 +77% -37%
Net revenue 96.4 144.4 141.0 137.0 130.1 -5% +35%
Non-interest expenses 122.8 123.2 127.8 125.5 124.3 -1% +1%
Income (loss) before incometaxes -26.3 21.1 13.2 11.5 5.7 -50% -

Global Markets: Americas build out
Fixed Income
Remained in top 10 for CMO2 underwriting in the US with FY2011/12 1Q market share of 4.2%
Top 10 ranking in Q1 for mortgage backed trading3
US Treasuries primary dealer market share in FY2011/12 1Q of 4.1%
FX global ranking increased to number 14, up from 18 last year4, also reflecting stronger presence in the US market
Americas’ share of total revenues increasing Market share and presence increasing
21%
23%
Americas share of total revenue
14
Equities
also reflecting stronger presence in the US market
Client penetration increased from 8% to 22% in the Americas in 2011 survey by a leading third-party
Market share on NYSE and Nasdaq continuing to grow following launch of US Equities cash business in October 2010 (Sales, Trading, Research)
Derivative client business also growing, making steady contributions to revenues
Top 10 rankings for two straight quarters in third-party surveysRanking 1Q share 4Q share
Program trading #5 9 7.4% 5.6%Convertible Bonds #7 7 7.0% 5.2%Listed options #8 9 6.4% 5.7%
(1) Excluding Instinet (3) Per MBS Clearing Corporation; Monthly rankings by volume: April #8, May #8, June #10(2) Collateralized Mortgage Obligations (4) Euromoney
5%
13%
FY2010/11Full year
FY2011/121Q
Americas1 share of total revenue
FY2010/11Full year
FY2011/121Q

Wholesale: Investment BankingNet revenue and income (loss) before income taxes
(billions of yen)
Key points
FY2010/11 FY11/12QoQ YoY
1Q 2Q 3Q 4Q 1Q
Investment Banking (gross)1 29.0 39.7 61.9 54.4 32.3 -41% +11%
Gross revenue1 of Y32.3bn (-41% QoQ; +11% YoY) Loss before income taxes: Y20.6bn
Continued to diversify revenue base: Revenue growth in international businesses, particularly in the US; Significant revenue generated from pull-through (multi-product) M&A deals with products such as leveraged finance, derivatives and other solutions; Expansion of solutions business
Japan Corporate activity dropped off following the earthquake, but recent
signs indicate that more corporates are starting to look at M&A; DCM
15(1) Gross revenues in Investment Banking excluding “Other”.
Allocation to otherdivisions 13.2 18.7 25.6 25.1 13.4 -47% +1%
Investment Banking (net) 15.8 21.1 36.2 29.3 18.9 -35% +20%
Other -3.6 -2.0 -5.1 20.1 -7.7 - -
Net revenue 12.2 19.0 31.1 49.4 11.2 -77% -8%
Non-interest expenses 27.0 32.5 33.5 31.5 31.8 +1% +18%
Income (loss) before income taxes -14.8 -13.5 -2.4 17.9 -20.6 - -
g p gmarket for overseas issuers is picking up
Revenues also driven by high-profile, cross-border M&A deals that closed during the quarter
EMEA Continued to maximize M&A pull-through revenue from multiple
products including leveraged finance Solutions businesses generated significant revenues led by Insurance
Solutions on the back of tighter capital requirements Sponsor activity remained robust
AEJ M&A revenues driven by cross-border deals Increased presence in AEJ ECM through bookrunning several large
CB issuances including Lotte Shopping CB (largest ever CB deal in AEJ consumer / retail sector)
Americas Revenue steadily expanded during the quarter: Booked revenues
from sponsors related deals and solutions business; Pull-through revenue from M&A deals with leveraged finance component (including Vestar Capital’s acquisition of Triton)

Investment Banking: Further diversification of revenue baseInternational expansion helping to diversify revenues
EMEA/Americas M&AGrifols acquisition of Talecris ($4.0bn)
AmericasBusiness platform expansion
Multi-product M&A deals
JapanJapan-related league table1
shares increased YoY, maintained #1 rankings
EMEAPull-through revenue from M&A multi-product deals
= Announced in1Q
= Deal closed/Booked revenues in 1Q
Japan/EMEA M&A Japan/Americas M&A
Stable platform
16
Japan/AEJ M&ADai-Ichi Life acquisition of TowerAustralia Group (A$1.2bn)
Growth in sponsors businessSolutions-related business
maintained #1 rankingsdealsSolutions business remains a strength with revenues from financial institutions (insurers) and other clients
AEJBookrunner on major CB transactions for Asian issuers for three straight months (Ranked #2)2
(1) Source: M&A and ECM from Thomson Reuters; DCM from Thomson DealWatch (Jan – Jun 2011)M&A includes real-estate related acquisitions; DCM includes self-funded
(2) Source: Thomson Reuters (Apr-Jun 2011); Ranking for International CB for Asia Pacific Issuers
M&A (29.5%49.1%)ECM (28.7%35.8%)DCM (21.9%28.7%)
Takeda Pharmaceutical acquisition of Nycomed (€9.6bn)
Japan/Americas M&AItochu acquisition of Drummond ($1.5bn)
Americas/AEJ M&AFila Korea & Mirae Asset acquisition of Acushnet Company ($1.2bn)
EMEA M&ABain Capital and Hellman &Friedman acquisition of Securitas Direct (€2.3bn)
Itochu acquisition of Kwik-Fit (£637m)
Kansai Paint acquisition of Freeworld Coatings (ZAR2.5bn)
AEJ M&ASale of Daewoo Engineering & Construction by Kumho Industrial ($1.9bn)
Malayan Bank acquisition of Kim Eng ($1.4bn)

Non-interest expensesQuarterFull year
(billions of yen) (billions of yen) Non-interest expenses increased 13% QoQ to
Y296bn, mainly due to an increase in
consolidated entities following the conversion
of Nomura Land and Building into a subsidiary
(Main increases related to other expenses,
compensation and benefits, and business
development expenses)
772.6852.2
1,092.91,045.6 1,037.4
800
1,000
Other
Business development expenses
Occupancy and related depreciation
253.4 254.0 268.1 262.0
296.0
200
300
17
FY06/07 FY07/08 FY08/09 FY09/10 FY10/11 FY2010/11 FY11/12 QoQ1Q 2Q 3Q 4Q 1Q
Compensation and benefits 345.9 366.8 491.6 526.2 519.0 122.1 126.7 143.1 127.1 136.3 7.3%Commissions and floor brokerage 50.8 90.2 73.7 86.1 92.1 23.7 21.4 24.0 23.0 24.1 4.4%
Information processing and communications 110.0 135.0 155.0 175.6 182.9 44.3 46.7 44.2 47.8 43.5 -8.9%
Occupancy and related depreciation 61.3 64.8 78.5 87.8 87.8 22.5 23.1 20.5 21.7 20.7 -4.8%
Business development expenses 38.1 38.1 31.6 27.3 30.2 7.2 6.8 7.4 8.8 9.3 6.3%
Other 166.5 157.2 262.6 142.5 125.4 33.7 29.4 28.8 33.5 62.1 85.1%Total 772.6 852.2 1,092.9 1,045.6 1,037.4 253.4 254.0 268.1 262.0 296.0 13.0%
Although compensation and benefits increased
QoQ, we continue to implement a pay for
performance culture
0
200
400
600 Information processing and communications
Commissions and floor brokerage
Compensation and benefits
0
100
200

Robust financial position
Total assets Y39.7trn Shareholders’ equity Y2.1trn Gross leverage 18.9x
Net leverage1 11.6x Level 3 assets (net)2 Y0.8trn
Balance sheet related indicators
Financial indicators Gross leverage and net leverage1
Capital ratio Leverage ratio
(x)
18.9
11.610.0
14.0
18.0
22.0
Gross leverage ratioNet leverage ratio
18
Liquidity Y5.8trn
(billions of yen)(Preliminary) Mar 31 Jun 30
Tier 1 1,915 2,134
Tier 2 651 453
Tier 3 139 146
Total capital 2,584 2,610
RWA 11,629 13,119
Tier 1 ratio 16.4% 16.2%
Tier 1 common ratio3 16.4% 13.8%
Total capital ratio 22.2% 19.8%
(1) Net leverage: Total assets minus securities purchased under agreements to resell and securities borrowed, divided by Nomura Holdings shareholders’ equity(2) Preliminary (before review). Level 3 assets (net) is on net basis after netting off derivative assets and liabilities(3) Tier 1 common ratio is defined as Tier 1 capital minus hybrid capital and minority interest divided by risk-weighted assets
Level 3 assets2 and net level 3 assets/Tier 1 capital
Level 3 assets2
(billions of yen)
46% 44% 43%37% 35%
0%
80%
0
500
1,000
1,500
2,000
FY2010/111Q
2Q 3Q 4Q FY2011/121Q
Level 3 assetsNet Level 3 AssetsNet Level 3 Assets / Tier 1 Capital
6.0FY2010/11
1Q 2Q 3Q 4QFY2011/12
1Q
Financial Supplement

(billions of yen)
Mar. 31, 2011
Jun. 31, 2011
Increase(Decrease)
Mar. 31, 2011
Jun. 31, 2011
Increase(Decrease)
C h d h d it 2 150 1 388 (762) Sh t t b i 1 167 1 090 (77)
Assets Liabilities
Consolidated balance sheet
Consolidated balance sheet
Cash and cash deposits 2,150 1,388 (762) Short-term borrow ings 1,167 1,090 (77)
Payables and deposits 2,104 2,092 (11)
Loans and receivables 2,228 2,628 401 Collateralized f inancing 13,686 15,998 2,312
Trading liabilities 8,689 7,788 (901)
Collateralized agreements 15,156 15,310 153 Other liabilities 552 1,064 512
Long-term borrow ings 8,403 9,266 863
15,242 16,606 1,364 Total liabilities 34,601 37,298 2,697
Other assets 1,916 3,781 1,865 Equity
Total Nomura shareholders' equity 2,083 2,102 19
Noncontrolling interest 9 313 305
36,693 39,713 3,020 36,693 39,713 3,020Total assets
Trading assets1 andprivate equity investments
Total liabilities and shareholders' equity
1. Including securities pledged as collateral.
20

Value at risk
Definition 99% confidence level (2.33 standard dev.) 1-day time horizon for outstanding portfolio Inter-product price fluctuations considered
From April 1 to June 30, 2011 (billions of yen) Maximum: 7.7 Minimum: 5.9 Average: 6.6
Mar. 31,2009
Mar. 31,2010(billions of yen) Mar. 31,
2008Mar. 31,
2007Jun. 30,
2011Mar. 31,
2011
21
Equity 4.7 4.2 3.8 2.6 1.8 1.6
Interest rate 3.7 4.7 6.7 4.4 4.1 4.3
Foreign exchange 1.4 8.0 8.7 10.5 4.5 3.8
Sub-total 9.8 16.9 19.2 17.5 10.4 9.7
-3.6 -6.8 -7.5 -5.0 -4.1 -3.7
6.2 10.1 11.7 12.6 6.3 6.0VaR
Diversification benefit

175.8
-67.8
67.8 28.7
8.3%
3.7%1.4%
-20%
-10%
0%
10%
20%
-400
-200
0
200
400
Net income(loss)
ROE (%)
13.411.9
17.8
3.4%
2%
3%
4%
10
15
20
Consolidated financial highlights
Full year Quarter(billions of yen) (billions of yen)
FY2012.3
1Q 2Q 3Q 4Q 1Q
Net revenue 1,091.1 787.3 312.6 1,150.8 1,130.7 259.8 275.6 295.9 299.4 330.4
Income (loss) before income taxes 318.5 -64.9 -780.3 105.2 93.3 6.5 21.6 27.8 37.4 34.4
Net income (loss) attributable to NomuraHoldings, Inc. ("NHI") shareholders
175.8 -67.8 -708.2 67.8 28.7 2.3 1.1 13.4 11.9 17.8
Total Nomura shareholders' equity 2,185.9 1,988.1 1,539.4 2,126.9 2,082.8 2,101.8 2,051.6 2,061.5 2,082.8 2,101.7
ROE (%)1 8.3% - - 3.7% 1.4% 0.4% 0.3% 1.1% 1.4% 3.4%
Basic-Net income (loss) attributable to NHIshareholders per share(yen)
92.25 -35.55 -364.69 21.68 7.90 0.63 0.29 3.72 3.30 4.93
Shareholders' equity per share (yen) 1,146.23 1,042.60 590.99 579.70 578.40 572.10 569.97 572.57 578.40 583.27
FY2011.3FY2007.3 FY2011.3FY2008.3 FY2009.3 FY2010.3
-708.2 -40%
-30%
%
-800
-600 2.31.1
0.4% 0.3%
1.1% 1.4%
0%
1%
0
5
1. Quarterly ROE is calculated using annualized year-to-date net income.Note: Net income (loss) attributable to Nomura Holdings was previously reported as Net income (loss).
22

Consolidated incomeFY2012.3
1Q 2Q 3Q 4Q 1Q
Commissions 337.5 404.7 306.8 395.1 405.5 118.1 83.5 100.0 103.8 96.8
Fees from investment banking 99.3 85.1 55.0 121.3 107.0 20.4 24.9 34.0 27.8 13.8
Asset management and portfolio service fees 146.0 189.7 140.2 132.2 143.9 34.9 33.7 37.1 38.3 39.1
Net gain on trading 290.0 61.7 -128.3 417.4 336.5 60.0 103.0 104.9 68.7 67.5
Gain (loss) on private equity investments 47.6 76.5 -54.8 11.9 19.3 -0.9 -1.0 -2.4 23.6 -6.0
Interest and dividends 981.3 796.5 331.4 235.3 346.1 75.8 70.0 106.9 93.5 133.1
Gain (loss) on investments in equity securities -20 1 -48 7 -25 5 6 0 -16 7 -10 3 -5 7 2 1 -2 8 -0 6
FY2011.3FY2011.3
FY2008.3 FY2010.3
Revenue
FY2007.3 FY2009.3(billions of yen)
Note: Certain reclassifications of previously reported amounts have been made to conform to the current year presentation.
23
Gain (loss) on investments in equity securities -20.1 -48.7 -25.5 6.0 -16.7 -10.3 -5.7 2.1 -2.8 -0.6
Private equity entities product sales 100.1 - - - - - - - - -
Other 67.4 28.2 39.9 37.5 43.9 16.3 12.0 3.4 12.2 83.4
2,049.1 1,593.7 664.5 1,356.8 1,385.5 314.0 320.4 386.0 365.0 427.0
958.0 806.5 351.9 205.9 254.8 54.2 44.8 90.2 65.6 96.6
1,091.1 787.3 312.6 1,150.8 1,130.7 259.8 275.6 295.9 299.4 330.4
772.6 852.2 1,092.9 1,045.6 1,037.4 253.4 254.0 268.1 262.0 296.0
Income (loss) before income taxes 318.5 -64.9 -780.3 105.2 93.3 6.5 21.6 27.8 37.4 34.4
Net income (loss) 175.8 -67.8 -708.2 67.8 28.7 2.3 1.1 13.4 11.9 17.8
Total revenue
Net revenue
Non-interest expenses
Interest expense

Main revenue items
Commissions
FY2012.31Q 2Q 3Q 4Q 1Q
Stock brokerage commissions (retail) 98.3 75.1 50.8 55.3 51.4 13.7 8.7 12.7 16.3 8.7Stock brokerage commissions (other) 73.2 166.6 144.7 140.3 144.6 40.3 30.7 35.9 37.7 34.2Other brokerage commissions 6.8 9.3 7.9 8.0 11.5 2.2 1.8 2.3 5.3 2.5
Commissions for distribution of investment trusts 120.5 121.2 75.9 165.9 166.4 55.7 36.1 39.8 34.8 43.1Other 38.6 32.4 27.5 25.5 31.6 6.2 6.2 9.5 9.7 8.2Total 337.5 404.7 306.8 395.1 405.5 118.1 83.5 100.0 103.8 96.8
(billions of yen) FY2007.3 FY2010.3 FY2011.3FY2008.3 FY2009.3 FY2011.3
Fees from Investment
Banking
Asset Management and portfolio service fees
24
Equity underwriting and distribution 56.6 32.1 13.2 74.9 49.8 8.1 10.1 21.8 9.8 2.7Bond underwriting and distribution 15.3 13.4 11.9 16.6 26.3 6.0 8.7 4.8 6.8 3.4M&A / financial advisory fees 26.7 37.8 26.7 29.2 27.1 6.2 5.7 6.8 8.4 7.3Other 0.7 1.8 3.1 0.5 3.9 0.1 0.4 0.6 2.8 0.3Total 99.3 85.1 55.0 121.3 107.0 20.4 24.9 34.0 27.8 13.8
Asset management fees 106.3 150.3 104.1 97.6 106.7 25.1 25.1 27.8 28.7 29.5Administration fees 24.0 21.7 21.3 19.4 21.0 5.7 5.4 5.0 4.9 4.8Custodial fees 15.7 17.7 14.7 15.3 16.3 4.0 3.2 4.3 4.7 4.7Total 146.0 189.7 140.2 132.2 143.9 34.9 33.7 37.1 38.3 39.1

Adjustment of consolidated results and segment results: Income (loss) before income taxes
(billions of yen) FY2012.3
1Q 2Q 3Q 4Q 1Q
160.9 122.3 18.2 113.4 101.2 37.7 22.8 23.0 17.7 22.0
36.3 31.1 4.1 15.2 20.0 4.0 4.2 5.6 6.3 7.4
156.0 -150.1 -717.3 175.2 6.7 -41.1 7.6 10.8 29.4 -14.9
353.2 3.3 -695.0 303.8 127.9 0.6 34.6 39.4 53.4 14.6
FY2011.3FY2011.3
FY2009.3
Retail
Asset Management
Wholesale
FY2007.3 FY2008.3
Three Business segments total
FY2010.3
Note:1. Gain (loss) on investments in equity securities, our share of equity in the earnings (losses) of affiliates, impairment losses on long-lived assets, corporate items and other financial
adjustments are included as “Other” operating results outside business segments in our segment information. 2. Certain reclassifications of previously reported amounts have been made to conform to the current year presentation. 3. The defined contribution pension plan business in Asset Management was integrated to Other business in the second quarter of the fiscal year ended March 31, 2009. Certain
reclassifications of previously reported amounts have been made to conform to the current presentation.4. Nomura Bank (Luxembourg) S.A. in Asset Management was integrated into Other in April 2011. Reclassifications of previously reported amounts for Asset Management and Other have
been made to conform to the current presentation. 25
353.2 3.3 695.0 303.8 127.9 0.6 34.6 39.4 53.4 14.6
24.0 -18.1 -62.1 -207.9 -17.8 16.5 -8.0 -13.3 -12.9 21.0
377.3 -14.7 -757.1 95.8 110.2 17.1 26.6 26.1 40.5 35.6
-38.2 -50.2 -23.1 9.4 -16.9 -10.6 -5.0 1.7 -3.0 -1.3
-21.5 - - - - - - - - -
318.5 -64.9 -780.3 105.2 93.3 6.5 21.6 27.8 37.4 34.4Total
Unrealized gain (loss) on investments inequity securities held for operating
purposes
Effect of consolidation/deconsolidation ofcertain private equity investee companies
Three Business segments total
Segments total
Other

24.0
-18.1
-62.1
-17.8
-160
-120
-80
-40
0
40 16.5
-8.0 -13.3 -12.9
21.0
160
-120
-80
-40
0
40
QuarterFull year
Segment “Other”Income (loss) before income taxes
(billions of yen) (billions of yen)
FY2012.3
1Q 2Q 3Q 4Q 1QNet gain (loss) related to economic hedging transactions -30.0 11.4 28.0 3.3 2.3 5.2 -6.0 5.2 -2.1 -1.5
Realized gain on investments in equitysecurities held for operating purposes 18.1 1.5 -2.4 -3.4 0.2 0.3 -0.7 0.4 0.3 0.7
Equity in earnings of aff iliates 53.2 4.7 -0.7 7.8 9.0 0.4 2.0 1.4 5.3 3.5
Corporate items -11.1 -13.4 -70.5 -83.3 -33.3 -2.5 5.5 -15.7 -20.7 12.8Others* -6.2 -22.3 -16.5 -132.3 4.0 13.1 -8.8 -4.6 4.3 5.6
Income (Loss) before income taxes 24.0 -18.1 -62.1 -207.9 -17.8 16.5 -8.0 -13.3 -12.9 21.0
FY2008.3FY2007.3 FY2011.3FY2011.3
FY2010.3FY2009.3
-207.9 -240
-200
160
-240
-200
-160
26
* Businesses not included in the three business divisions (Nomura Trust & Banking, etc.) are included in others.Note: 1: The defined contribution pension plan business in Asset Management was integrated to Other business in the second quarter of the fiscal year ended March 31, 2009. Certain reclassifications of previously reported
amounts have been made to conform to the current presentation.2: Net income (loss) is net income (loss) before subtracting net income attributable to non-controlling interest. Certain reclassifications of previously reported amounts have been made to conform to the current year
presentation.3: Net gain (loss) on trading related to economic hedging transactions was reclassified as “Net gain (loss) related to economic hedging transactions” from the fourth quarter of the fiscal year ended March 2010 and includes net
gain (loss) related to economic hedging transactions not included in net gain (loss) on trading. In addition, net gain (loss) on trading from the change in own credit of certain structured notes issued, which was previously classified as “Net gain (loss) on trading related to economic hedging transactions”, has been included in “Others”. The reclassifications of previously reported amounts have been made to conform to the current year presentation.
4: Nomura Bank (Luxembourg) S.A. in Asset Management was integrated into Other in April 2011. Reclassifications of previously reported amounts for Asset Management and Other have been made to conform to the current presentation.
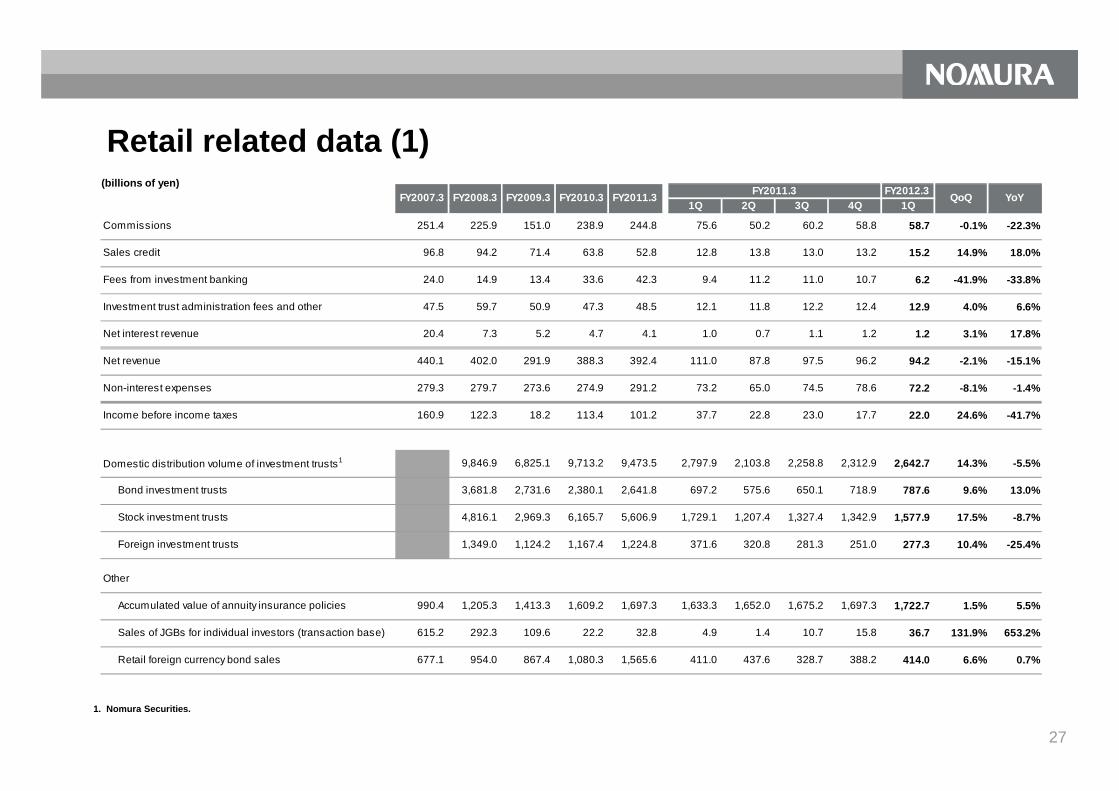
Retail related data (1)(billions of yen)
FY2012.3 1Q 2Q 3Q 4Q 1Q
Commissions 251.4 225.9 151.0 238.9 244.8 75.6 50.2 60.2 58.8 58.7 -0.1% -22.3%
Sales credit 96.8 94.2 71.4 63.8 52.8 12.8 13.8 13.0 13.2 15.2 14.9% 18.0%
Fees from investment banking 24.0 14.9 13.4 33.6 42.3 9.4 11.2 11.0 10.7 6.2 -41.9% -33.8%
Investment trust administration fees and other 47.5 59.7 50.9 47.3 48.5 12.1 11.8 12.2 12.4 12.9 4.0% 6.6%
Net interest revenue 20.4 7.3 5.2 4.7 4.1 1.0 0.7 1.1 1.2 1.2 3.1% 17.8%
Net revenue 440.1 402.0 291.9 388.3 392.4 111.0 87.8 97.5 96.2 94.2 -2.1% -15.1%
Non-interest expenses 279.3 279.7 273.6 274.9 291.2 73.2 65.0 74.5 78.6 72.2 -8.1% -1.4%
YoYFY2007.3 FY2008.3 QoQFY2010.3 FY2011.3 FY2011.3 FY2009.3
1. Nomura Securities.
27
Income before income taxes 160.9 122.3 18.2 113.4 101.2 37.7 22.8 23.0 17.7 22.0 24.6% -41.7%
Domestic distribution volume of investment trusts1 9,846.9 6,825.1 9,713.2 9,473.5 2,797.9 2,103.8 2,258.8 2,312.9 2,642.7 14.3% -5.5%
Bond investment trusts 3,681.8 2,731.6 2,380.1 2,641.8 697.2 575.6 650.1 718.9 787.6 9.6% 13.0%
Stock investment trusts 4,816.1 2,969.3 6,165.7 5,606.9 1,729.1 1,207.4 1,327.4 1,342.9 1,577.9 17.5% -8.7%
Foreign investment trusts 1,349.0 1,124.2 1,167.4 1,224.8 371.6 320.8 281.3 251.0 277.3 10.4% -25.4%
Accumulated value of annuity insurance policies 990.4 1,205.3 1,413.3 1,609.2 1,697.3 1,633.3 1,652.0 1,675.2 1,697.3 1,722.7 1.5% 5.5%
Sales of JGBs for individual investors (transaction base) 615.2 292.3 109.6 22.2 32.8 4.9 1.4 10.7 15.8 36.7 131.9% 653.2%
Retail foreign currency bond sales 677.1 954.0 867.4 1,080.3 1,565.6 411.0 437.6 328.7 388.2 414.0 6.6% 0.7%
Other

120
150
180
50
60
70
Quarter
Retail related data (2)
Stock brokerage commissions and commissions for distribution of investment trusts1
Full year(billions of yen) (billions of yen)
FY2012.3 1Q 2Q 3Q 4Q 1Q
Stock brokerage commissions 98.3 75.1 50.8 55.3 51.4 13.7 8.7 12.7 16.3 8.7 -46.3% -36.5%
Commissions for distribution of investment trusts1 124.7 124.5 79.8 168.8 170.1 56.7 37.0 40.7 35.7 44.1 23.3% -22.3%
1. Nomura Securities
YoYQoQFY2007.3 FY2009.3 FY2010.3 FY2011.3 FY2011.3 FY2008.3
0
30
60
90
Stock brokerage commissions
Commissions for distribution of investment trusts
0
10
20
30
40
28

85.2
72.2
59.3
73.5 70.6
60
80
100
Other
Overseas mutual funds
Bond investment trusts
St k i t t t t
70.4
Retail related data (3)
Retail client assetsQuarter Full year
(trillions of yen)
Mar. 31, 2007 Mar. 31, 2008 Mar. 31, 2009 Mar. 31, 2010 Mar. 31, 2011 Jun. 30, 2011
Equities 48.5 37.2 28.6 39.2 35.8 35.4Foreign currency bonds 3.3 2.7 5.5 5.6 5.9 5.9Domestic bonds 16.4 16.5 13.0 13.4 12.8 12.8Stock investment trusts 7.4 7.3 5.0 7.3 8.3 8.5Bond investment trusts 4.7 4.4 4.0 4.0 4.1 4.2Overseas mutual funds 2.0 1.7 1.4 1.6 1.5 1.5Other 2.9 2.5 1.9 2.2 2.3 2.2
Total 85.2 72.2 59.3 73.5 70.6 70.4
0
20
40
Stock investment trusts
Domestic bonds
Foreign currency bonds
Equities
3
2
1
1. Euroyen bonds have been moved from domestic bonds to foreign currency bonds from the third quarter of the fiscal year ended March 31, 2009.2. Includes CBs and warrants.3. Includes annuity insurance. 29

5,975 6 000
8,000
5,000
6,000
Retail related data (4)
Retail client assets: Net asset inflow1
Full year Quarter
(billions of yen) (billions of yen)
FY2012.3
1Q 2Q 3Q 4Q 1QFY2008.3FY2007.3
FY2011.3 FY2011.3 FY2009.3 FY2010.3
4,868 4,928 5,279
3,942
0
2,000
4,000
6,000
847
72
2,122
458
1,289
0
1,000
2,000
3,000
4,000
1. Retail client assets exclude portion from regional financial institutions.Note: Net asset inflow = asset inflow – asset outflow. 30

Retail related data (5)
Number of accounts / IT share1
Mar. 31, 2007 Mar. 31, 2008 Mar. 31, 2009 Mar. 31, 2010 Mar. 31, 2011 Jun. 30, 2011
(thousands)
Accounts with balance 3,953 4,165 4,467 4,883 4,936 4,945
Equity holding accounts 1,853 2,027 2,347 2,572 2,695 2,696
Nomura Home Trade (online trading accounts) 2 243 2 765 3 095 3 189 3 328 3 348
1. IT share is the%age of trades via Nomura Home Trade and our Telephone Answer service comprising the total of cash stock transactions and kabushiki-mini-toshi (odd lot stock investment).
Quarter Full year
31
FY2012.31Q 2Q 3Q 4Q 1Q
New individual accounts (thousands) 417 580 608 336 326 93 84 81 69 69
IT share1
No. of orders 55% 57% 59% 58% 53% 57% 52% 43% 58% 58%
Transaction value 27% 29% 29% 29% 27% 30% 26% 19% 31% 32%
FY2011.3FY2008.3 FY2010.3FY2009.3FY2007.3 FY2011.3
Nomura Home Trade (online trading accounts) 2,243 2,765 3,095 3,189 3,328 3,348

Asset Management related data (1)
Total assets under management1
Full year Quarter
Note1:The defined contribution pension plan business in Asset Management was integrated to other business in the second quarter of the fiscal year ended March 31, 2009. Certain reclassifications of previously reported amounts have been made to conform to the current presentation.
2: Nomura Bank (Luxembourg) S.A. in Asset Management was integrated into Other in April 2011. Certain reclassifications of previously reported amounts have been made to conform to the current presentation.
(billions of yen)
FY2012.31Q 2Q 3Q 4Q 1Q
Net revenue 80.7 81.1 51.9 62.1 66.5 15.8 16.2 17.3 17.3 18.8 8.9% 19.5%Non-interest expenses 44.4 50.0 47.8 46.8 46.5 11.8 12.0 11.7 11.0 11.4 3.4% -3.2%Income before income taxes 36.3 31.1 4.1 15.2 20.0 4.0 4.2 5.6 6.3 7.4 18.6% 86.3%
FY2010.3FY2011.3
FY2011.3 QoQFY2007.3 FY2008.3 YoYFY2009.3
Mar. 31, 2007 Mar. 31, 2008 Mar. 31, 2009 Mar. 31, 2010 Mar. 31, 2011 Jun. 30, 2011
27.0 25.8
20.2
23.4 24.7
0
5
10
15
20
25
30
35
25.3
1. Total assets under management of Nomura Asset Management, Nomura Corporate Research and Asset Management, Nomura Funds Research and Technologies, Nomura Asset Management Deutschland KAG , and Nomura Funds Research and Technologies America, Nomura Private Equity Capital. Adjusted for asset overlap amongst group companies. Nomura Funds Research and Technologies America data as of end of May 2011.
(trillions of yen)
32

Asset Management related data (2)
Nomura Asset Management assets under management1
Domestic public investment trust market and Nomura Asset Management market share
(trillions of yen) (trillions of yen)Mar. 31,2007
Mar. 31,2008
Mar. 31,2009
Mar. 31,2010
Mar. 31,2011
Jun. 30,2011
Public stock investment trusts 10.8 9.8 6.5 8.1 9.4 9.5
Public bond investment trusts 5.8 5.3 4.8 4.8 4.8 4.8
Privately placed investment trusts 2.2 2.0 1.6 1.7 1.7 1.7
18.8 17.2 13.0 14.7 15.9 16.0Investment trusts
Mar. 31,2007
Mar. 31,2008
Mar. 31,2009
Mar. 31,2010
Mar. 31,2011
Jun. 30,2011
Domestic public stock investment trusts
Market 59.4 57.7 40.4 52.6 54.2 54.6
Nomura's share (%) 18% 17% 16% 15% 17% 17%
Domestic public bond investment trusts
Nomura Asset Management net asset inflow1
Full year Quarter
(trillions of yen)
33
Nomura Asset Management investment advisory assets1
1. Based on reporting standards for The Investment Trusts Association, Japan and the Japan Securities Investment Advisers Association.
(trillions of yen) Mar. 31,2007
Mar. 31,2008
Mar. 31,2009
Mar. 31,2010
Mar. 31,2011
Jun. 30,2011
Domestic investment advisory 3.7 4.6 4.3 4.7 4.4 4.9
Overseas investment advisory 3.4 2.4 1.7 2.6 5.3 5.7
7.1 7.1 6.0 7.3 9.7 10.6Investment advisory
FY2012.3
1Q 2Q 3Q 4Q 1Q
3.8 2.0 0.0 -0.2 1.7 0.5 0.8 0.1 0.3 0.3
Exclude ETF 3.7 1.8 -0.4 0.0 1.7 0.6 0.4 0.4 0.3 0.3
0.2 -0.5 -0.5 -0.0 0.0 -0.2 -0.0 0.3 -0.1 0.0
0.7 0.2 0.1 -0.2 0.0 -0.0 -0.0 0.1 -0.0 -0.0
4.6 1.7 -0.4 -0.4 1.7 0.3 0.7 0.5 0.3 0.4
FY2009.3
FY2011.3
FY2011.3FY2010.3
FY2007.3
FY2008.3
Public stock investment trusts
Privately placed investmenttrustsNet asset inflow
Public bond investment trusts
Market 13.2 12.0 11.1 11.1 11.1 11.1
Nomura's share (%) 44% 44% 43% 43% 43% 43%Source: Investment Trusts Association, Japan
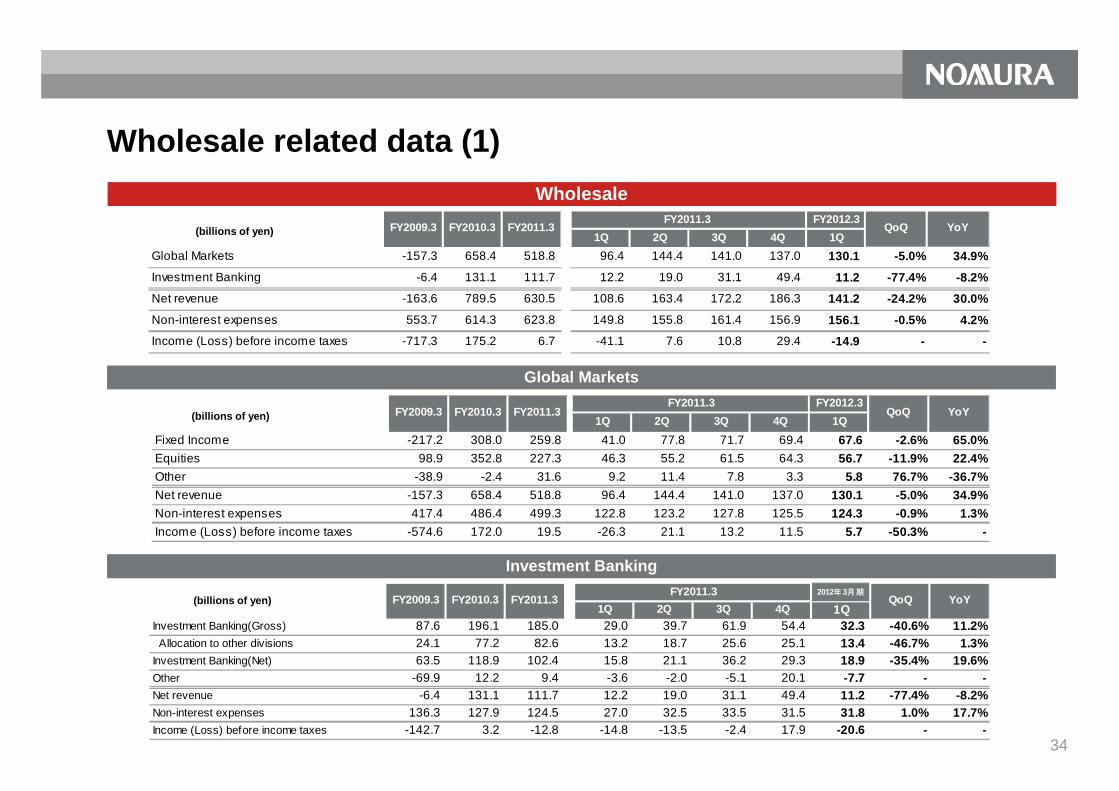
Wholesale related data (1)Wholesale
Global Markets
(billions of yen)FY2012.3
1Q 2Q 3Q 4Q 1QGlobal Markets -157.3 658.4 518.8 96.4 144.4 141.0 137.0 130.1 -5.0% 34.9%Investment Banking -6.4 131.1 111.7 12.2 19.0 31.1 49.4 11.2 -77.4% -8.2%Net revenue -163.6 789.5 630.5 108.6 163.4 172.2 186.3 141.2 -24.2% 30.0%Non-interest expenses 553.7 614.3 623.8 149.8 155.8 161.4 156.9 156.1 -0.5% 4.2%Income (Loss) before income taxes -717.3 175.2 6.7 -41.1 7.6 10.8 29.4 -14.9 - -
FY2011.3 FY2009.3 FY2010.3 FY2011.3 QoQ YoY
34
Investment Banking
(billions of yen)
(billions of yen)2012年3月期
1Q 2Q 3Q 4Q 1QInvestment Banking(Gross) 87.6 196.1 185.0 29.0 39.7 61.9 54.4 32.3 -40.6% 11.2% Allocation to other divisions 24.1 77.2 82.6 13.2 18.7 25.6 25.1 13.4 -46.7% 1.3%Investment Banking(Net) 63.5 118.9 102.4 15.8 21.1 36.2 29.3 18.9 -35.4% 19.6%Other -69.9 12.2 9.4 -3.6 -2.0 -5.1 20.1 -7.7 - -Net revenue -6.4 131.1 111.7 12.2 19.0 31.1 49.4 11.2 -77.4% -8.2%Non-interest expenses 136.3 127.9 124.5 27.0 32.5 33.5 31.5 31.8 1.0% 17.7%Income (Loss) before income taxes -142.7 3.2 -12.8 -14.8 -13.5 -2.4 17.9 -20.6 - -
YoYQoQFY2011.3
FY2011.3FY2009.3 FY2010.3
FY2012.31Q 2Q 3Q 4Q 1Q
Fixed Income -217.2 308.0 259.8 41.0 77.8 71.7 69.4 67.6 -2.6% 65.0%Equities 98.9 352.8 227.3 46.3 55.2 61.5 64.3 56.7 -11.9% 22.4%Other -38.9 -2.4 31.6 9.2 11.4 7.8 3.3 5.8 76.7% -36.7%Net revenue -157.3 658.4 518.8 96.4 144.4 141.0 137.0 130.1 -5.0% 34.9%Non-interest expenses 417.4 486.4 499.3 122.8 123.2 127.8 125.5 124.3 -0.9% 1.3%Income (Loss) before income taxes -574.6 172.0 19.5 -26.3 21.1 13.2 11.5 5.7 -50.3% -
FY2010.3FY2009.3FY2011.3
QoQ YoYFY2011.3
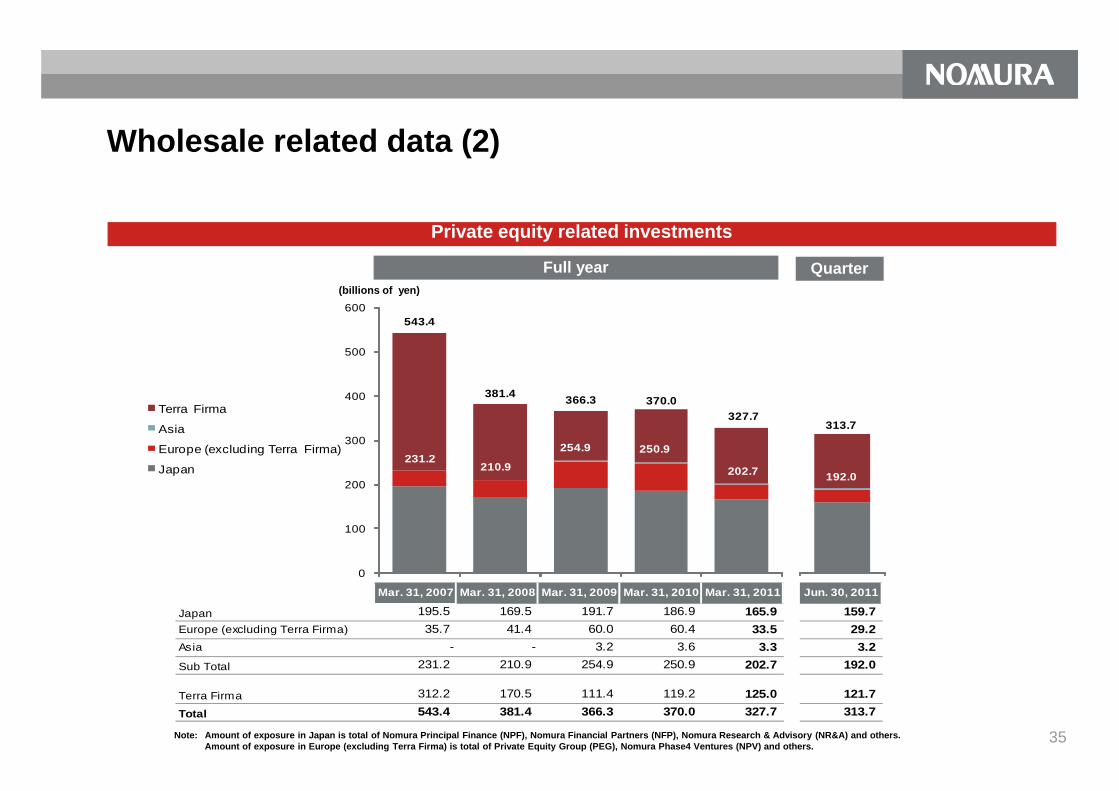
543.4
381.4400
500
600
Private equity related investments
Full year Quarter (billions of yen)
Wholesale related data (2)
Mar. 31, 2007 Mar. 31, 2008 Mar. 31, 2009 Mar. 31, 2010 Mar. 31, 2011 Jun. 30, 2011
Japan 195.5 169.5 191.7 186.9 165.9 159.7Europe (excluding Terra Firma) 35.7 41.4 60.0 60.4 33.5 29.2Asia - - 3.2 3.6 3.3 3.2Sub Total 231.2 210.9 254.9 250.9 202.7 192.0
Terra Firma 312.2 170.5 111.4 119.2 125.0 121.7Total 543.4 381.4 366.3 370.0 327.7 313.7
381.4 366.3 370.0 327.7
231.2 210.9
254.9 250.9
202.7
0
100
200
300
400 Terra Firma
Asia
Europe (excluding Terra Firma)
Japan 192.0
313.7
35Note: Amount of exposure in Japan is total of Nomura Principal Finance (NPF), Nomura Financial Partners (NFP), Nomura Research & Advisory (NR&A) and others.Amount of exposure in Europe (excluding Terra Firma) is total of Private Equity Group (PEG), Nomura Phase4 Ventures (NPV) and others.
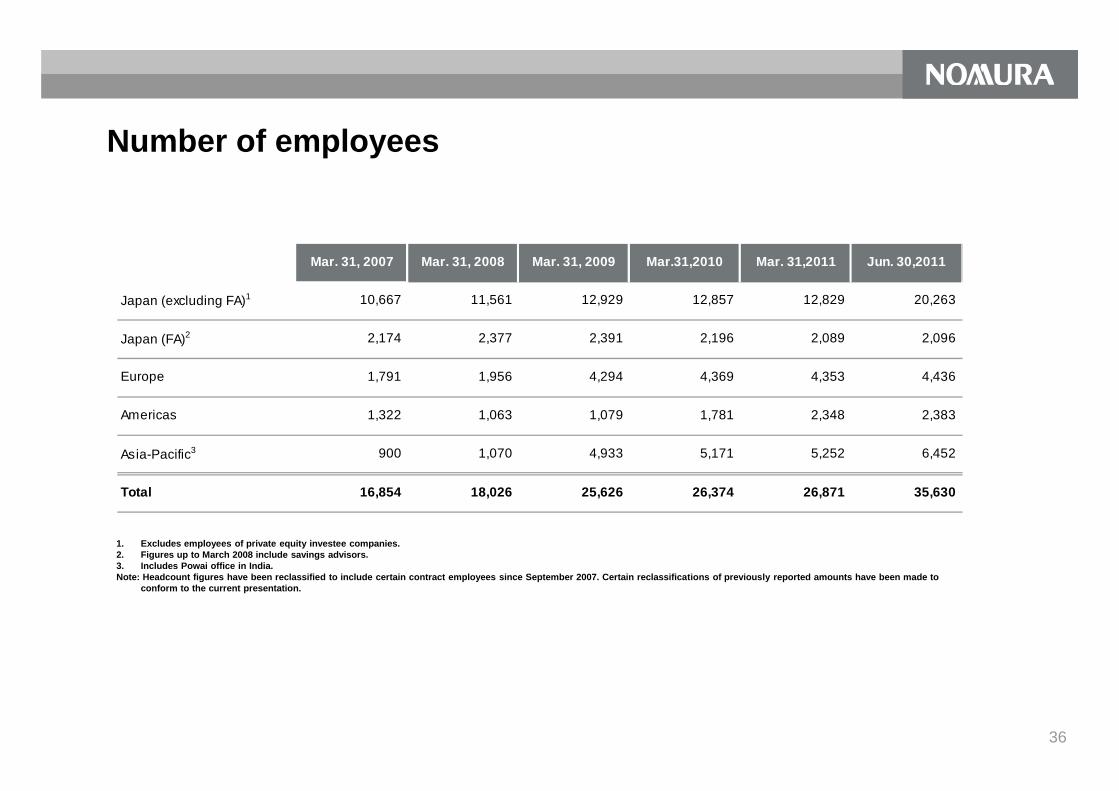
Number of employees
Mar. 31, 2007 Mar. 31, 2008 Mar. 31, 2009 Mar.31,2010 Mar. 31,2011 Jun. 30,2011
Japan (excluding FA)1 10,667 11,561 12,929 12,857 12,829 20,263
Japan (FA)2 2,174 2,377 2,391 2,196 2,089 2,096
Europe 1,791 1,956 4,294 4,369 4,353 4,436
1. Excludes employees of private equity investee companies.2. Figures up to March 2008 include savings advisors.3. Includes Powai office in India.Note: Headcount figures have been reclassified to include certain contract employees since September 2007. Certain reclassifications of previously reported amounts have been made to
conform to the current presentation.
36
Americas 1,322 1,063 1,079 1,781 2,348 2,383
Asia-Pacific3 900 1,070 4,933 5,171 5,252 6,452
Total 16,854 18,026 25,626 26,374 26,871 35,630

Nomura Holdings, Inc.Nomura Holdings, Inc.www.nomura.comwww.nomura.com