
Consolidated Financial Summary for FY2016 (1 April 2016 ... · Consolidated Financial Summary for...
30
[English translation from the original Japanese language document] Consolidated Financial Summary for FY2016 (1 April 2016 – 31 March 2017) [Japanese GAAP] 12 May 2017 Company Name : SUZUKI MOTOR CORPORATION Listings : The First Section of Tokyo Stock Exchange Code No. : 7269 URL : http://www.globalsuzuki.com/ Representative : Toshihiro Suzuki, President (CEO&COO) Contact Person : Seiji Kobayashi , General Manager, Corporate Management/IR Dept. Corporate Planning Office TEL 053-440-2030 Date of the Ordinary General Meeting of Shareholders : 29 June 2017 Start of Payment of Cash Dividends : 30 June 2017 Date of Filling Annual Securities Report : 29 June 2017 Preparation of Supplementary Explanatory Materials : Yes Holding of Presentation Meeting on Financial Results : Yes (Amounts less than one million yen are rounded down) 1. Consolidated Operating Results for FY2016 (1 April 2016 – 31 March 2017) (1) Consolidated Management Results (Percentage indicates change from the previous fiscal year) Net sales Operating income Ordinary income Net income attributable to owners of the parent Million Yen % Million Yen % Million Yen % Million Yen % FY 2016 3,169,542 (0.3) 266,685 36.5 286,693 37.1 159,956 37.1 FY 2015 3,180,659 5.5 195,308 8.9 209,109 7.6 116,660 20.4 [Note] Comprehensive income: FY2016 227,158million yen ( -% ) FY2015 (38,304) million yen (-%) Net income per share, Basic Net income per share, Diluted Return on shareholders’ equity Ratio of ordinary income to total assets Ratio of operating income to net sales Yen Yen % % % FY 2016 362.54 362.48 15.4 9.9 8.4 FY 2015 234.98 234.92 9.6 7.0 6.1 [Reference] Equity in earnings (losses) of affiliates: FY2016 2,327million yen FY2015 (2,492) million yen (2) Consolidated Financial Position Total assets Net assets Shareholders’ equity ratio Net assets per share Million Yen Million Yen % Yen FY 2016 3,115,985 1,387,041 35.9 2,538.12 FY 2015 2,702,008 1,187,703 35.4 2,170.73 [Reference] Shareholders’ equity (Net assets excluding non-controlling interests and subscription rights to shares): FY2016 1,119,865 million yen FY2015 957,697 million yen (3) Consolidated Cash Flows Cash flows from operating activities Cash flows from investing activities Cash flows from financing activities Cash and cash equivalents at end of period Million Yen Million Yen Million Yen Million Yen FY 2016 366,315 (288,564) 89,505 614,031 FY 2015 294,095 (242,435) (520,361) 450,088 2. Cash Dividends Cash dividends per share Total amount (Annual) Payout ratio (Consolidated) Ratio of total amount of cash dividends to shareholders’ equity (Consolidated) 1st quarter 2nd quarter 3rd quarter Year-end Annual Yen Yen Yen Yen Yen Million Yen % % FY2015 ― 15.00 ― 17.00 32.00 14,120 13.6 1.3 FY2016 ― 17.00 ― 27.00 44.00 19,416 12.1 1.9 FY2017(Forecast) ― 22.00 ― 22.00 44.00 13.4 3. Forecast of consolidated results for FY 2017 (1 April 2017 – 31 March 2018) (Percentage indicates change from the previous term) Net sales Operating income Ordinary income Net income attributable to owners of the parent Net income per share Million Yen % Million Yen % Million Yen % Million Yen % Yen First Half 1,600,000 6.7 120,000 3.9 125,000 2.6 70,000 (29.9) 158.65 Full year 3,400,000 7.3 240,000 (10.0) 255,000 (11.1) 145,000 (9.4) 328.64
Transcript of Consolidated Financial Summary for FY2016 (1 April 2016 ... · Consolidated Financial Summary for...

[English translation from the original Japanese language document]
Consolidated Financial Summary for FY2016 (1 April 2016 – 31 March 2017) [Japanese GAAP]
12 May 2017 Company Name : SUZUKI MOTOR CORPORATION Listings : The First Section of Tokyo Stock Exchange Code No. : 7269 URL : http://www.globalsuzuki.com/ Representative : Toshihiro Suzuki, President (CEO&COO) Contact Person : Seiji Kobayashi , General Manager, Corporate Management/IR Dept. Corporate Planning Office
TEL 053-440-2030 Date of the Ordinary General Meeting of Shareholders : 29 June 2017 Start of Payment of Cash Dividends : 30 June 2017 Date of Filling Annual Securities Report : 29 June 2017 Preparation of Supplementary Explanatory Materials : Yes Holding of Presentation Meeting on Financial Results : Yes
(Amounts less than one million yen are rounded down) 1. Consolidated Operating Results for FY2016 (1 April 2016 – 31 March 2017)(1) Consolidated Management Results (Percentage indicates change from the previous fiscal year)
Net sales Operating income Ordinary income Net income attributable to owners of the parent
Million Yen % Million Yen % Million Yen % Million Yen %
FY 2016 3,169,542 (0.3) 266,685 36.5 286,693 37.1 159,956 37.1 FY 2015 3,180,659 5.5 195,308 8.9 209,109 7.6 116,660 20.4 [Note] Comprehensive income: FY2016 227,158million yen ( -% ) FY2015 (38,304) million yen (-%)
Net income per share, Basic
Net income per share, Diluted
Return on shareholders’ equity
Ratio of ordinary income to total assets
Ratio of operating income to net sales
Yen Yen % % % FY 2016 362.54 362.48 15.4 9.9 8.4 FY 2015 234.98 234.92 9.6 7.0 6.1 [Reference] Equity in earnings (losses) of affiliates: FY2016 2,327million yen FY2015 (2,492) million yen (2) Consolidated Financial Position
Total assets Net assets Shareholders’ equity ratio Net assets per share Million Yen Million Yen % Yen
FY 2016 3,115,985 1,387,041 35.9 2,538.12 FY 2015 2,702,008 1,187,703 35.4 2,170.73
[Reference] Shareholders’ equity (Net assets excluding non-controlling interests and subscription rights to shares): FY2016 1,119,865 million yen FY2015 957,697 million yen
(3) Consolidated Cash Flows Cash flows from
operating activities Cash flows from
investing activities Cash flows from
financing activities Cash and cash equivalents
at end of period Million Yen Million Yen Million Yen Million Yen
FY 2016 366,315 (288,564) 89,505 614,031 FY 2015 294,095 (242,435) (520,361) 450,088
2. Cash DividendsCash dividends per share
Total amount (Annual)
Payout ratio (Consolidated)
Ratio of total amount of cash
dividends to shareholders’
equity (Consolidated)
1st quarter
2nd quarter
3rd quarter Year-end Annual
Yen Yen Yen Yen Yen Million Yen % %
FY2015 ― 15.00 ― 17.00 32.00 14,120 13.6 1.3 FY2016 ― 17.00 ― 27.00 44.00 19,416 12.1 1.9 FY2017(Forecast) ― 22.00 ― 22.00 44.00 13.4
3. Forecast of consolidated results for FY 2017 (1 April 2017 – 31 March 2018)(Percentage indicates change from the previous term)
Net sales Operating income Ordinary income Net income
attributable to owners of the parent
Net income per share
Million Yen % Million Yen % Million Yen % Million Yen % Yen
First Half 1,600,000 6.7 120,000 3.9 125,000 2.6 70,000 (29.9) 158.65
Full year 3,400,000 7.3 240,000 (10.0) 255,000 (11.1) 145,000 (9.4) 328.64

*Notes(1) Changes in significant subsidiaries during the period
(Changes in specified subsidiaries that accompany with a change in the scope of consolidation): None (2) Changes in Accounting Principles, Changes in Accounting Estimates, and Retrospective Restatements
1) Changes in accounting principles due to the revision of the accounting standards : None 2) Changes in accounting principles other than 1) : None 3) Changes in accounting estimates : None 4) Retrospective restatements : None
(3) Number of outstanding shares (common stock) (Shares) 1) Number of outstanding shares at end of period (Including treasury stock) FY2016 491,000,000 FY2015 491,000,0002) Number of treasury stock at end of period FY2016 49,782,105 FY2015 49,812,829 3) Average number of outstanding shares during period FY2016 441,208,692 FY2015 496,474,207
[Reference] Summary of Non-consolidated Results Non-consolidated Operating Results for FY2016 (1 April 2016 – 31 March 2017) (1) Non-consolidated Management Results (Percentage indicates change from the previous fiscal year)
Net sales Operating income Ordinary income Net income Million Yen % Million Yen % Million Yen % Million Yen %
FY 2016 1,687,836 4.9 106,396 105.4 120,210 57.9 87,671 11.6 FY 2015 1,609,065 (3.3) 51,801 (25.1) 76,151 2.0 78,593 53.4
Net income per share, Basic Net income per share, Diluted Yen Yen
FY 2016 198.68 198.64 FY 2015 158.28 158.25
(2) Non-consolidated Financial Position Total assets Net assets Shareholders’ equity ratio Net assets per share
Million Yen Million Yen % Yen
FY 2016 1,749,592 507,810 29.0 1,150.47 FY 2015 1,519,889 452,701 29.8 1,025.52
[Reference] Shareholders’ equity (Net assets excluding subscription rights to shares): FY2016 507,683million yen FY2015 452,512 million yen
* This financial result is not required to be audited* Explanation regarding the appropriate use of forecasts for operating results, other information
(Caution with respect to forward-looking statement)The forward-looking statements are based on currently available information and assumptions, contain risks and uncertainty, and do not constitute guarantees of future achievement. Please note that the actual results may greatly vary by the changes of various factors. Those factors, which may influence the actual results, include economic conditions and the trend of demand in major markets and the fluctuations of foreign exchange rates (mainly US dollar/Yen rate, Euro/Yen rate and Indian Rupee/Yen rate). Please refer to “Forecasts for Next Fiscal Year” in page 4 of the [Attachment] for detail such as precondition of the above-mentioned forecast.
(Financial Results Supplementary Explanatory Materials) Financial Results Supplementary Explanatory Materials will be available on our website (http://www.globalsuzuki.com/) on 12 May 2017.

[Attachment]
Table of Contents
1. Summary of Management Results, etc................................................................................................................ 2
(1) Summary of Management Results and Financial Positions…………………………………………………………………… 2 (2) Forecasts for the Next Fiscal Year ....................................................................................................................... 4 (3) Dividends for Current and Next Fiscal Year……….……………………………….…………………………….…………………… 4
2. Basic Policy on the Selection of Accounting Standard ........................................................................... 4
3. Consolidated Financial Statements and Significant Notes .................................................................... 5
(1) Consolidated Balance Sheets ............................................................................................................................... 5 (2) Consolidated Statements of Income and Consolidated Statements of Comprehensive Income ........... 7
Consolidated Statements of Income .................................................................................................................. 7 Consolidated Statements of Comprehensive Income ..................................................................................... 8
(3) Consolidated Statements of Changes in Net Assets ........................................................................................ 9 (4) Consolidated Statements of Cash Flows .......................................................................................................... 11 (5) Notes to Consolidated Financial Statements................................................................................................... 13
(Assumption for Going Concern) ....................................................................................................................... 13 (Basic Matters for Preparing Consolidated Financial Statements) ............................................................... 13 (Additional Information)....................................................................................................................................... 13 (Segment Information and Others) ................................................................................................................... 15 (Information about Per Share Amount) ............................................................................................................ 18 (Significant Subsequent Event) .......................................................................................................................... 18
4. Non-consolidated Financial Statements................................................................................................. 19
(1) Non-consolidated Balance Sheets .................................................................................................................... 19 (2) Non-consolidated Statements of Income ........................................................................................................ 22 (3) Non-consolidated Statements of Changes in Net Assets ............................................................................. 23
5. Others .......................................................................................................................................................... 27
(1) Breakdown of Consolidated Net Sales .............................................................................................................. 27 (2) Breakdown of Non-consolidated Net Sales ..................................................................................................... 28
1

1. Summary of Management Results, etc
(1) Summary of Management Results and Financial Positions (Management results of FY2016)
With respect to the management environment of the Group for FY2016, the economy is recovering moderately as a whole. On the other hand, there are concerns about the influence of the policy of US administration, uncertainties about trend of Europe including the issue of the UK leaving the EU, prospects for the economy of developing countries, and others. In India, an important market for the Group, the economy is expanding mainly owing to increase of domestic consumption. Also in Japan, the economy is recovering moderately on the back of various measures introduced by the government. Under these circumstances, the consolidated net sales of this fiscal year (April 2016 to March 2017) decreased by ¥11.2 billion (0.3%) to ¥3,169.5 billion compared to the previous fiscal year. The Japanese domestic net sales decreased by ¥10.4 billion (1.0%) to ¥1,037.5 billion year-on-year mainly owing to decrease in minivehicle and OEM sales, despite increase in compact vehicle sales. The overseas net sales were flat on the year at ¥2,132.0 billion mainly owing to decrease in automobile sales in Indonesia and Pakistan, and the impact of the exchange rate, despite increase in automobile sales in areas including India and Europe. In terms of the consolidated income, although there were impact of the exchange rate, the operating income increased by ¥71.4 billion (36.5%) to ¥266.7 billion year-on-year mainly owing to increase in automobile sales in India and Europe. The ordinary income increased by ¥77.6 billion (37.1%) to ¥286.7 billion year-on-year. The net income attributable to owners of the parent increased by ¥43.3 billion (37.1%) to ¥160.0 billion year-on-year partly owing to increase in gain on sales of investment securities, in addition to increase in the ordinary income, despite accounting impairment loss of ¥39.9 billion for businesses including the automobile business in Thailand as extraordinary losses. <The operating results by business segmentation> (Automobile) The Japanese domestic automobile market achieved annual compact car sales of 100,000 units for the first time ever by launching the all-new Swift, in addition to the Solio and the Ignis. With respect to minivehicle sales, the company made efforts to expand sales by strengthening products such as by introducing the Spacia Custom Z and launching the all-new WagonR. However, the Japanese domestic automobile net sales decreased year-on-year owing to decrease in OEM sales. The overseas automobile net sales increased year-on-year mainly owing to strong sales of models including the Baleno and the Vitara Brezza in India and the Vitara in Europe, despite the impact of the exchange rate. Consequently, the net sales of the automobile business increased by ¥17.1 billion (0.6%) to ¥2,895.6 billion year-on-year. The operating income increased by ¥62.5 billion (32.4%) to ¥255.1 billion year-on-year mainly owing to improvement in sales and model mix in Japan, India, and Europe.
(Motorcycle) The company launched models including the new supersport bike GSX-R1000 for the global market and the sport bike GSX-R150 for emerging countries. Although those models are much appreciated in their respective markets, because their launches occurred toward the fiscal year-end, the net sales remained at ¥206.3 billion and decreased by ¥27.6 billion (11.8%). The operating loss of ¥10.2 billion in the previous fiscal year improved to an operating loss of ¥0.9 billion owing to reduction of expenses such as sundry expenses, despite the impact of the exchange rate. (Marine and Power products, etc.) The net sales decreased by ¥0.7 billion (0.9%) to ¥67.6 billion year-on-year mainly owing to the impact of the exchange rate, despite increase in the sales of the outboard motors in the North America. The operating income decreased by ¥0.4 billion (2.6%) to ¥12.5 billion year-on-year.
2
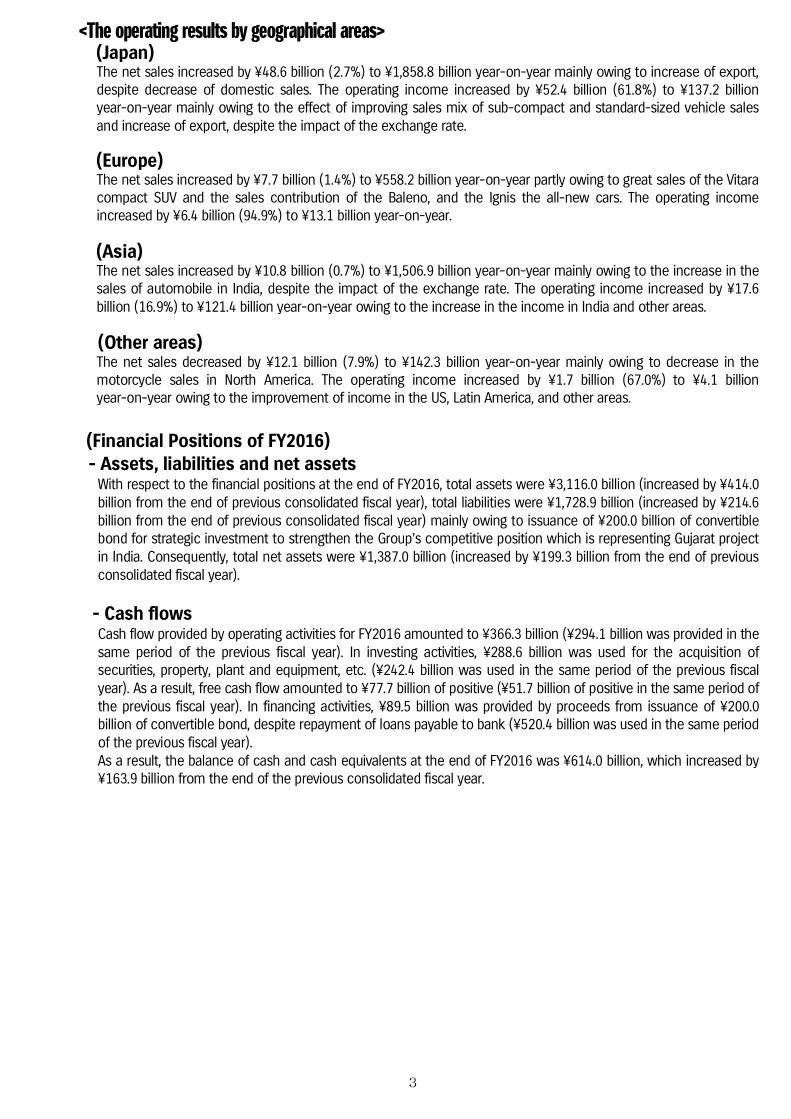
<The operating results by geographical areas> (Japan) The net sales increased by ¥48.6 billion (2.7%) to ¥1,858.8 billion year-on-year mainly owing to increase of export, despite decrease of domestic sales. The operating income increased by ¥52.4 billion (61.8%) to ¥137.2 billion year-on-year mainly owing to the effect of improving sales mix of sub-compact and standard-sized vehicle sales and increase of export, despite the impact of the exchange rate.
(Europe) The net sales increased by ¥7.7 billion (1.4%) to ¥558.2 billion year-on-year partly owing to great sales of the Vitara compact SUV and the sales contribution of the Baleno, and the Ignis the all-new cars. The operating income increased by ¥6.4 billion (94.9%) to ¥13.1 billion year-on-year.
(Asia) The net sales increased by ¥10.8 billion (0.7%) to ¥1,506.9 billion year-on-year mainly owing to the increase in the sales of automobile in India, despite the impact of the exchange rate. The operating income increased by ¥17.6 billion (16.9%) to ¥121.4 billion year-on-year owing to the increase in the income in India and other areas. (Other areas) The net sales decreased by ¥12.1 billion (7.9%) to ¥142.3 billion year-on-year mainly owing to decrease in the motorcycle sales in North America. The operating income increased by ¥1.7 billion (67.0%) to ¥4.1 billion year-on-year owing to the improvement of income in the US, Latin America, and other areas.
(Financial Positions of FY2016) - Assets, liabilities and net assets
With respect to the financial positions at the end of FY2016, total assets were ¥3,116.0 billion (increased by ¥414.0 billion from the end of previous consolidated fiscal year), total liabilities were ¥1,728.9 billion (increased by ¥214.6 billion from the end of previous consolidated fiscal year) mainly owing to issuance of ¥200.0 billion of convertible bond for strategic investment to strengthen the Group’s competitive position which is representing Gujarat project in India. Consequently, total net assets were ¥1,387.0 billion (increased by ¥199.3 billion from the end of previous consolidated fiscal year).
- Cash flows Cash flow provided by operating activities for FY2016 amounted to ¥366.3 billion (¥294.1 billion was provided in the same period of the previous fiscal year). In investing activities, ¥288.6 billion was used for the acquisition of securities, property, plant and equipment, etc. (¥242.4 billion was used in the same period of the previous fiscal year). As a result, free cash flow amounted to ¥77.7 billion of positive (¥51.7 billion of positive in the same period of the previous fiscal year). In financing activities, ¥89.5 billion was provided by proceeds from issuance of ¥200.0 billion of convertible bond, despite repayment of loans payable to bank (¥520.4 billion was used in the same period of the previous fiscal year). As a result, the balance of cash and cash equivalents at the end of FY2016 was ¥614.0 billion, which increased by ¥163.9 billion from the end of the previous consolidated fiscal year.
3

(2) Forecasts for the Next Fiscal Year The next fiscal year is the third year of the New Mid-Term Management Plan SUZUKI NEXT 100 (from FY2015 to FY2019), and the company plans to actively make investments for future growth. The company prospects continued increase in automobile sales in areas including India and Europe, while on the other hand, there will be increase in expenses including research and development expenses and depreciation. Thus, the company forecasts increase in net sales and decrease in income. The Group will work as one to reform in every field and pursue the business activity to accomplish more than the below forecasts for the consolidated operating results. (Forecasts for the consolidated operating results-First Half)
Net Sales ¥1,600.0 billion (up 6.7% year-on-year) Operating income ¥120.0 billion (up 3.9% year-on-year) Ordinary income ¥125.0 billion (up 2.6% year-on-year) Net income attributable to owners of the parent
¥70.0 billion (down 29.9% year-on-year)
(Forecast for the consolidated operating results-Full Year) Net Sales ¥3,400.0 billion (up 7.3% year-on-year) Operating income ¥240.0 billion (down 10.0% year-on-year) Ordinary income ¥255.0 billion (down 11.1% year-on-year) Net income attributable to owners of the parent
¥145.0 billion (down 9.4% year-on-year)
Foreign exchange rates 110 yen/US$, 115 yen/Euro, 1.65 yen/Indian Rupee 0.85 yen/100 Indonesian Rupiah, 3.10 yen/Thai Baht
* The forecasts for next fiscal year mentioned above are based on currently available information and
assumptions, contain risks and uncertainty, and do not constitute guarantees of future achievement. Please note that the actual results may greatly vary by the changes of various factors. Those factors, which may influence the actual results, include economic conditions and the trend of demand in major markets and the fluctuation of foreign exchange rate (mainly US dollar/Yen rate, Euro/Yen rate and Indian Rupee/Yen rate).
(3) Dividends for Current and Next Fiscal Year
Under the New Mid-Term Management Plan SUZUKI NEXT 100 (from FY2015 to FY2019), the Company plans active investments for future growth, which includes accumulated capital investment of 1 trillion yen and research and development expenses of 200 billion yen for FY2019. At the moment, the Company prioritizes investment for growth centered in India, and set the dividend payout ratio target to 15% or more. Also, partly because of large acquisition of treasury shares in the previous fiscal year, shareholder’s equity ratio declined to 35.4% at the end of the previous fiscal year, and the improvement of shareholder’s equity ratio is becoming an urgent issue. Meanwhile, the Company also recognizes that capital efficiency and shareholder return are significant management issue as well. Taking the above-mentioned condition into consideration, as with the previous fiscal year, the Company would like to utilize the gain on sales of investment securities for investment for growth and improvement of shareholder’s equity ratio, and make the year-end dividends based on the net income attributable to owners of the parent excluding the gain on sales of investment securities, which will be ¥27.00 per share, up by ¥10.00 per share from the previous fiscal year. As a result, the annual dividends including interim dividends will be ¥44.00 per share and up by ¥12.00 per share from the previous fiscal year. Dividend payout ratio based on the net income attributable to owners of the parent excluding the gain on sales of investment securities will be 15.2%. With respect to the dividends for the next fiscal year, we plan to distribute ¥44.00 of annual dividends per share (including ¥22.00 of interim dividends per share), same amount to the current fiscal year.
2. Basic Policy on the Selection of Accounting Standard The Group is preparing for implementation of the International Financial Reporting Standards (IFRS) in the future. Concrete timing of the implementation is currently under examination.
4

3. Consolidated Financial Statements and Significant notes (1) Consolidated Balance Sheets
(Amount: Millions of yen)
FY2015 (As of 31 March 2016)
FY2016 (As of 31 March 2017)
Assets
Current assets
Cash and deposits 497,187 693,952
Notes and accounts receivables-trade 335,343 349,224
Short-term investment securities 279,571 338,756
Merchandise and finished goods 190,068 234,730
Work in process 34,311 40,537
Raw materials and supplies 61,921 56,847
Deferred tax assets 116,378 113,845
Other 124,037 133,428
Allowance for doubtful accounts (6,188) (5,349)
Total current assets 1,632,630 1,955,973
Noncurrent assets
Property, plant and equipment
Buildings and structures, net 146,759 154,843
Machinery and equipment, net 260,880 267,951
Tools, furniture and fixtures, net 44,062 24,195
Land 255,013 261,130
Construction in progress 50,361 48,223
Total property, plant and equipment 757,076 756,344
Intangible assets
Goodwill 2,006
339
Other 2,361 2,343
Total intangible assets 4,368 2,683
Investments and other assets
Investment securities 244,573 335,787
Long-term loans receivable 549
798
Assets for retirement benefits 50
44
Deferred tax assets 14,773 21,140
Other 48,764 43,631
Allowance for doubtful accounts (500)
(399)
Allowance for investment loss (280)
(18)
Total investments and other assets 307,932 400,984
Total noncurrent assets 1,069,377 1,160,012
Total assets 2,702,008 3,115,985
5

(Amount: Millions of yen)
FY2015 (As of 31 March 2016)
FY2016 (As of 31 March 2017)
Liabilities
Current liabilities
Accounts payable-trade 402,624 428,063
Electronically recorded obligations 64,055 83,070
Short-term loans payable 201,507 96,643
Current portion of long term loans payable 64,982 119,958
Accrued expenses 183,695 191,068
Income taxes payable 29,486 31,863
Deferred tax liabilities 481 55
Provision for product warranties 66,032 76,995
Provision for directors' bonuses 299 372
Other 132,790 160,030
Total current liabilities 1,145,956 1,188,121
Noncurrent liabilities
Bonds with subscription rights to shares - 200,400
Long-term loans payable 262,797 222,870
Deferred tax liabilities 7,484 1,384
Provision for directors' retirement benefits 1,185 1,164
Provision for disaster 3,056 1,976
Provision for product liabilities 3,835 3,443
Provision for recycling expenses 4,508 6,372
Liabilities for retirement benefits 56,346 63,099
Other 29,134 40,110
Total noncurrent liabilities 368,348 540,822
Total liabilities 1,514,305 1,728,943
Net assets
Shareholders’ equity
Capital stock 138,014 138,014
Capital surplus 144,166 144,035
Retained earnings 913,656 1,058,549
Treasury stock (191,169) (191,051)
Total shareholders’ equity 1,004,668 1,149,548
Accumulated other comprehensive income
Valuation difference on available-for-sale securities 77,624 98,827
Deferred gains or losses on hedges 536 1,269
Foreign currency translation adjustment (115,551) (119,236)
Accumulated adjustment for retirement benefit (9,580) (10,543)
Total accumulated other comprehensive income (46,970) (29,683)
Subscription rights to shares 188 126
Non-controlling interests 229,816 267,049
Total net assets 1,187,703 1,387,041
Total liabilities and net assets 2,702,008 3,115,985
6

(2) Consolidated Statements of Income and Consolidated Statements of Comprehensive Income (Consolidated Statements of Income)
(Amount: Millions of yen)
FY2015 (1 April 2015 – 31 March 2016)
FY2016 (1 April 2016– 31 March 2017)
Net sales 3,180,659 3,169,542 Cost of sales 2,313,779 2,261,914 Gross profit 866,879 907,627 Selling, general and administrative expenses 671,571 640,942 Operating income 195,308 266,685 Non-operating income
Interest income 13,774 13,186 Dividend income 7,111 3,640 Reversal of allowance for doubtful accounts 237 - Rent income on noncurrent assets 1,660 1,493
Foreign exchange gains - 198 Equity in earnings of affiliates - 2,327 Other 14,168 8,813 Total non-operating income 36,952 29,660
Non-operating expenses Interest expenses 6,381 4,771 Loss on valuation of securities 1,337 0 Depreciation of assets for rent 526 461 Provision of allowance for doubtful accounts - 6 Provision of allowance for investment loss 63 97 Foreign exchange losses 499 - Equity in losses of affiliates 2,492 - Other 11,850 4,316 Total non-operating expenses 23,150 9,652
Ordinary income 209,109 286,693 Extraordinary income
Gain on sales of noncurrent assets 1,813 1,022 Gain on sales of investment securities 36,760 47,775 Total extraordinary income 38,574 48,798
Extraordinary loss Loss on sales of noncurrent assets 1,730 355 Impairment loss 322 39,936 Total extraordinary loss 2,052
40,291
Income before income taxes etc. 245,631 295,200 Income taxes-current 87,279 92,263 Income taxes-deferred 5,051 5,319 Income taxes 92,330 97,583 Net income 153,300 197,616 Net income attributable to non-controlling interests 36,640 37,660
Net income attributable to owners of the parent 116,660 159,956
7

(Consolidated Statements of Comprehensive Income) (Amount: Millions of yen)
FY2015 (1 April 2015 – 31 March 2016)
FY2016 (1 April 2016 – 31 March 2017)
Net income 153,300 197,616 Other comprehensive income
Valuation difference on available-for-sale securities (77,011) 28,375
Deferred gains or losses on hedges (29) 505
Foreign currency translation adjustment (100,590) 3,634
Adjustment for retirement benefits (10,562) (655)
Share of other comprehensive income of associates accounted for using equity method (3,411) (2,318)
Total other comprehensive income (191,605) 29,541
Comprehensive income (38,304) 227,158
Comprehensive income attributable to:
Comprehensive income attributable to owners of the parent (51,260) 177,276
Comprehensive income attributable to non-controlling interests 12,955 49,881
8
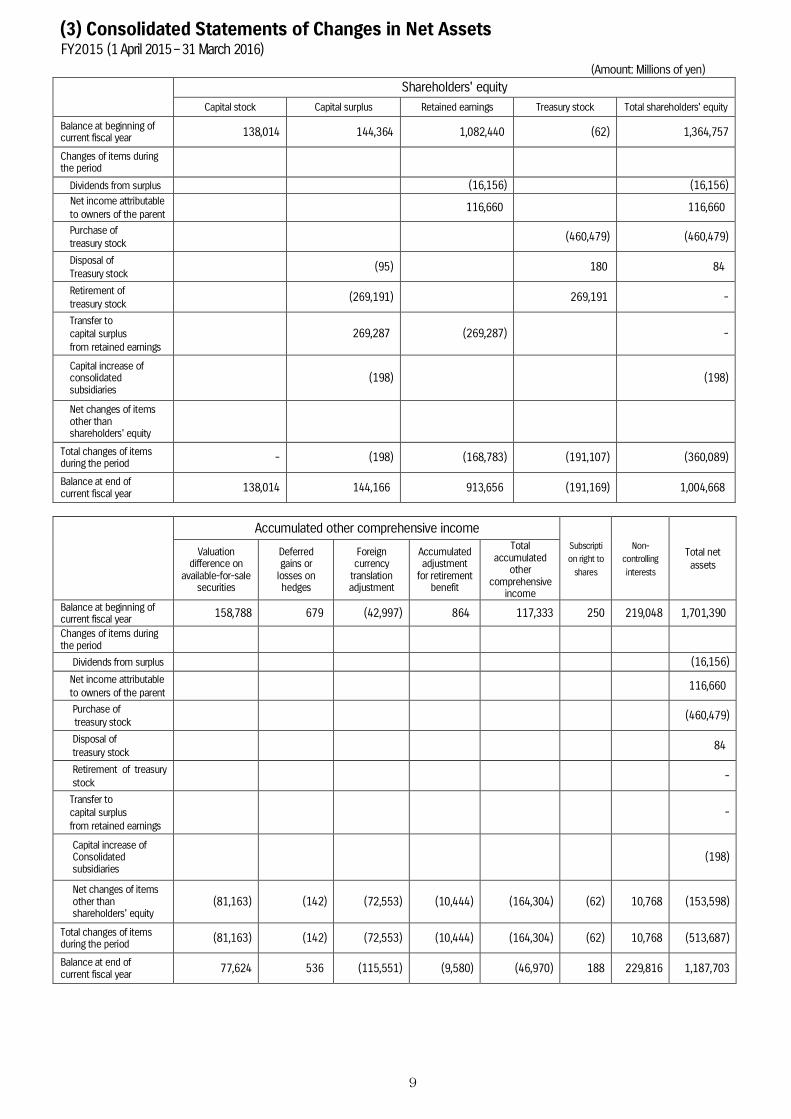
(3) Consolidated Statements of Changes in Net Assets FY2015 (1 April 2015 – 31 March 2016)
(Amount: Millions of yen) Shareholders' equity
Capital stock Capital surplus Retained earnings Treasury stock Total shareholders' equity
Balance at beginning of current fiscal year 138,014 144,364 1,082,440 (62) 1,364,757
Changes of items during the period
Dividends from surplus (16,156) (16,156) Net income attributable to owners of the parent
116,660 116,660
Purchase of treasury stock (460,479) (460,479)
Disposal of Treasury stock
(95) 180 84
Retirement of treasury stock
(269,191) 269,191 -
Transfer to capital surplus from retained earnings
269,287 (269,287) -
Capital increase of consolidated subsidiaries
(198) (198)
Net changes of items other than shareholders' equity
Total changes of items during the period - (198) (168,783) (191,107) (360,089)
Balance at end of current fiscal year 138,014 144,166 913,656 (191,169) 1,004,668
Accumulated other comprehensive income
Subscription right to
shares
Non- controlling interests
Total net assets
Valuation difference on
available-for-sale securities
Deferred gains or
losses on hedges
Foreign currency
translation adjustment
Accumulated adjustment
for retirement benefit
Total accumulated
other comprehensive
income Balance at beginning of current fiscal year 158,788 679 (42,997) 864 117,333 250 219,048 1,701,390
Changes of items during the period
Dividends from surplus (16,156) Net income attributable to owners of the parent
116,660
Purchase of treasury stock (460,479)
Disposal of treasury stock
84
Retirement of treasury stock
-
Transfer to capital surplus from retained earnings
-
Capital increase of Consolidated subsidiaries
(198)
Net changes of items other than shareholders' equity
(81,163) (142) (72,553) (10,444) (164,304) (62) 10,768 (153,598)
Total changes of items during the period (81,163) (142) (72,553) (10,444) (164,304) (62) 10,768 (513,687)
Balance at end of current fiscal year 77,624 536 (115,551) (9,580) (46,970) 188 229,816 1,187,703
9

FY2016 (1 April 2016 – 31 March 2017) (Amount: Millions of yen)
Shareholders' equity Capital stock Capital surplus Retained earnings Treasury stock Total shareholders' equity
Balance at beginning of current fiscal year 138,014 144,166 913,656 (191,169) 1,004,668
Changes of items during the period
Dividends from surplus (15,003) (15,003) Net income attributable to owners of the parent
159,956 159,956
Purchase of treasury stock (4) (4)
Disposal of Treasury stock
(60) 122 62
Transfer to capital surplus from retained earnings
60 (60) -
Capital increase of consolidated subsidiaries
(130) (130)
Net changes of items other than shareholders' equity
Total changes of items during the period - (130) 144,892 118 144,880
Balance at end of current fiscal year 138,014 144,035 1,058,549 (191,051) 1,149,548
Accumulated other comprehensive income
Subscription right to
shares
Non- controlling interests
Total net assets
Valuation difference on
available-for-sale securities
Deferred gains or
losses on hedges
Foreign currency
translation adjustment
Accumulated adjustment
for retirement benefit
Total accumulated
other comprehensive
income Balance at beginning of current fiscal year 77,624 536 (115,551) (9,580) (46,970) 188 229,816 1,187,703
Changes of items during the period
Dividends from surplus (15,003) Net income attributable to owners of the parent
159,956
Purchase of treasury stock
(4)
Disposal of treasury stock
62
Transfer to capital surplus from retained earnings
-
Capital increase of Consolidated subsidiaries
(130)
Net changes of items other than shareholders' equity
21,202 732 (3,685) (962) 17,287 (62) 37,232 54,458
Total changes of items during the period 21,202 732 (3,685) (962) 17,287 (62) 37,232 199,338
Balance at end of current fiscal year 98,827 1,269 (119,236) (10,543) (29,683) 126 267,049 1,387,041
10

(4) Consolidated Statements of Cash Flows (Amount: Millions of yen)
FY2015 (1 April 2015 – 31 March 2016)
FY2016 (1 April 2016 – 31 March 2017)
Net cash provided by (used in) operating activities Income before income taxes etc. 245,631 295,200
Depreciation and amortization 168,315 163,397
Impairment loss 322 39,936
Increase (decrease) in allowance for doubtful accounts (1,029) (812)
Interest and dividends income (20,885) (16,827)
Interest expenses 6,381 4,771
Foreign exchange losses (gains) 4,627 876
Equity in (earnings) losses of affiliates 2,492 (2,327)
Loss (gain) on sales of property, plant and equipment (83) (667)
Loss (gain) on sales of investment securities (36,760) (47,775)
Decrease (increase) in notes and accounts receivable-trade 3,479 (17,023)
Decrease (increase) in inventories 8,298 (50,386)
Increase (decrease) in notes and accounts payable-trade 593 45,218
Increase (decrease) in accrued expenses 14,857 6,473
Other, net (36,630) 20,370
Sub-total 359,610 440,423
Interest and dividends income received 20,328 15,412
Interest expenses paid (7,833) (4,613)
Income taxes paid (78,010) (84,906)
Net cash provided by (used in) operating activities 294,095 366,315
Net cash provided by (used in) investing activities
Payments into time deposits (61,915) (38,552)
Proceeds from withdrawal of time deposits 28,596 8,367
Purchase of short-term investment securities (274,553) (297,947)
Proceeds from sales and redemption of securities 173,478 268,519
Purchases of property, plant and equipment (162,574) (192,054)
Other, net 54,533 (36,898)
Net cash provided by (used in) investing activities (242,435) (288,564)
11

(Amount: Millions of yen)
FY2015 (1 April 2015 – 31 March 2016)
FY2016 (1 April 2016 – 31 March 2017)
Net cash provided by (used in) financing activities Net increase (decrease) in short-term loans payable 27,088 (102,949)
Proceeds from long-term loans payable 45,400 83,172
Repayment of long-term loans payable (108,365) (63,449) Proceeds from issuance of bonds with subscription rights to shares
- 200,500
Purchase of treasury stock (460,479) (4)
Cash dividends paid (16,156) (15,003)
Cash dividends paid to non-controlling interests (7,504) (9,417)
Other, net (344) (3,342)
Net cash provided by (used in) financing activities (520,361) 89,505
Effect of exchange rate changes on cash and cash equivalents (13,471) (3,313)
Net increase (decrease) in cash and cash equivalents (482,172) 163,942
Cash and cash equivalents at beginning of fiscal year 932,261 450,088
Cash and cash equivalents at end of period 450,088 614,031
12
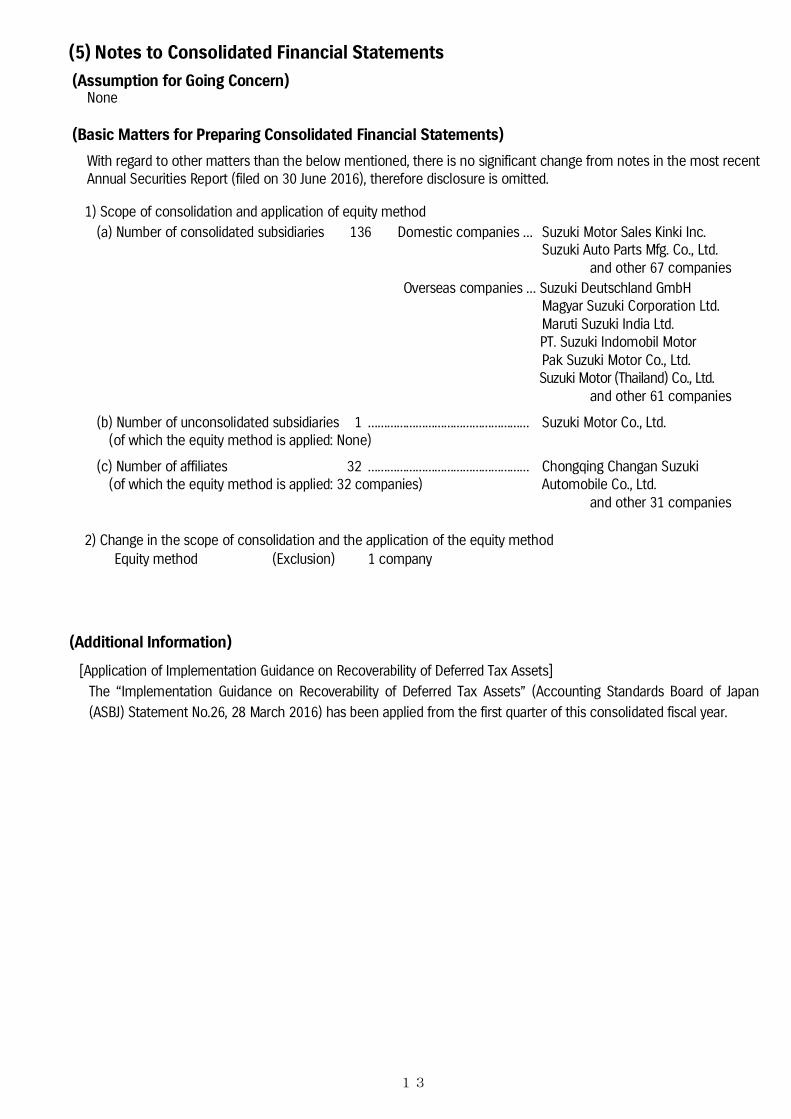
(5) Notes to Consolidated Financial Statements (Assumption for Going Concern)
None
(Basic Matters for Preparing Consolidated Financial Statements) With regard to other matters than the below mentioned, there is no significant change from notes in the most recent Annual Securities Report (filed on 30 June 2016), therefore disclosure is omitted. 1) Scope of consolidation and application of equity method
(a) Number of consolidated subsidiaries 136 Domestic companies … Suzuki Motor Sales Kinki Inc. Suzuki Auto Parts Mfg. Co., Ltd. and other 67 companies
Overseas companies … Suzuki Deutschland GmbH Magyar Suzuki Corporation Ltd. Maruti Suzuki India Ltd.
PT. Suzuki Indomobil Motor Pak Suzuki Motor Co., Ltd. Suzuki Motor (Thailand) Co., Ltd. and other 61 companies
(b) Number of unconsolidated subsidiaries 1 …………………………………………… Suzuki Motor Co., Ltd. (of which the equity method is applied: None)
(c) Number of affiliates 32 …………………………………………… Chongqing Changan Suzuki
(of which the equity method is applied: 32 companies) Automobile Co., Ltd. and other 31 companies
2) Change in the scope of consolidation and the application of the equity method
Equity method (Exclusion) 1 company
(Additional Information)
[Application of Implementation Guidance on Recoverability of Deferred Tax Assets] The “Implementation Guidance on Recoverability of Deferred Tax Assets” (Accounting Standards Board of Japan (ASBJ) Statement No.26, 28 March 2016) has been applied from the first quarter of this consolidated fiscal year.
13

[Impairment Loss] The Group recorded impairment loss in the following group of assets.
(Amount: Millions of yen)
Use Location Classification Amount
Assets for automobile business Thailand
Machinery and equipment,
Tools, furniture and fixtures, etc. 26,346
Asia Machinery and equipment, etc. 296
Assets for motorcycle business Asia Machinery and equipment,
Buildings and structures, etc. 5,192
Assets for other business Japan Land 1,496 Assets for rent Japan Land 6,007 Idle assets Japan Land 597
Total 39,936
The assets are divided into groups of the assets for business and the assets for rent respectively, mainly in units of business facilities. With respect to the assets which are decided to be disposed and idle assets which are not expected to be used in the future, tests of impairment are conducted based on individual assets.
<Assets for business> (Suzuki Motor Thailand)
Suzuki Motor (Thailand) Co., Ltd, a fully owned subsidiary of Suzuki in Thailand commenced its automobile production in Thailand in March 2012, and is exporting its product worldwide, besides sales is the Thai domestic market. However, due to slowdown in the domestic market as well as appreciation of Thai Baht, performance of automotive business in Thailand has remained at low level. In FY2016, Suzuki carried out examination on future recoverability of the business assets of Suzuki Motor (Thailand) Co., Ltd. The examination indicated that the recoverable amount would be fall below the book value of the assets, and the Company has decided to record an impairment loss as an extraordinary loss.
(Others)
The examination indicated that the recoverable amount would be fall below the book value of the assets, and the Company has decided to record an impairment loss as an extraordinary loss.
<Assets for rent and idle assets>
The Company has reduced the book value of the group of the assets whose market value has particularly fallen to the recoverable amount and recorded an impairment loss as an extraordinary loss.
The impairment loss consists of ¥6,696 million for buildings and structures, ¥15,320 million for machinery and equipment, ¥7,294 million for tools, furniture and fixtures, ¥8,101 million for land, and ¥2,523 million for construction in progress. The recoverable amount of the asset group is measured by net selling price or value in use, and the land value is evaluated by price calculated on a rational basis.
14

(Segment Information and Others)
[Segment Information]
1. Outline of Reportable Segments
The reportable segments of the Company are the components of the Company business for which discrete financial information is available, and whose operating results are regularly reviewed by our decision-making body such as Board of Directors to make decisions about resources to be allocated to the segment and to assess its performance. The Company has three reportable segments of “Automobile”, “Motorcycle” and “Marine and Power products, etc.” based on the form of management organization and nature of products and services. Main products and services of each segment are as follows:
Segment Main products and services
Automobile Mini vehicles, Sub-compact vehicles, Standard-sized vehicles Motorcycle Motorcycles, All terrain vehicles
Marine and Power products, etc. Outboard motors, Engines for snowmobiles, etc., Motorized wheelchairs, Electro senior vehicles, Houses
2. Information about Net Sales, Profit or Loss, Assets, Liabilities and Other Items by Reportable Segment
FY2015 (1 April 2015 – 31 March 2016)
(Amount: Millions of yen) Reportable Segments
Adjustment*2 Total Automobile Motorcycle
Marine & Power products, etc.
Total
Net sales 2,878,515 233,889 68,253 3,180,659 - 3,180,659
Segment profit(loss) *1 192,619 (10,198) 12,887 195,308 - 195,308
Segment assets 1,984,591 190,376 46,094 2,221,062 480,945 2,702,008
Other items
Depreciation 158,116 7,992 2,207 168,315 - 168,315
Amortization of goodwill 1,723 184 79 1,988 - 1,988
Impairment loss 292 30 - 322 - 322 The amount of investment in associates accounted for by the equity method
42,193 3,990 67 46,250 - 46,250
Increase in property, plant and equipment and intangible assets
161,679 7,531 2,324 171,535 - 171,535
15

FY2016 (1 April 2016 – 31 March 2017)
(Amount: Millions of yen) Reportable Segments
Adjustment*2 Total Automobile Motorcycle
Marine & Power products, etc.
Total
Net sales 2,895,619 206,289 67,633 3,169,542 - 3,169,542
Segment profit(loss) *1 255,060 (930) 12,555 266,685 - 266,685
Segment assets 2,205,138 204,159 46,375 2,455,673 660,311 3,115,985
Other items
Depreciation 150,475 9,796 3,124 163,397 - 163,397
Amortization of goodwill 1,547 54 0 1,602 - 1,602
Impairment loss 33,077 5,343 1,514 39,936 - 39,936 The amount of investment in associates accounted for by the equity method
48,957 3,796 87 52,841 - 52,841
Increase in property, plant and equipment and intangible assets
181,268 15,814 1,699 198,782 - 198,782
[Notes] *1. Segment profit (loss) is an operating income in the consolidated statements of income.
*2. For segment assets, unallocated company assets (¥480,945 million in FY2015 and ¥660,311 million in FY 2016) included in “Adjustment” are mainly funds for management of surplus funds by the Company (Cash and deposits, Short-term investment securities, etc.) and long-term investment funds (Investment securities).
3. Information about Geographic Areas
FY2015 (1 April 2015 – 31 March 2016) (1) Net sales (Amount: Millions of yen)
Japan India Other areas Total
1,047,883 980,640 1,152,134 3,180,659 [Note] Net sales are counted based on the country location of external customers and divided by countries.
(2) Property, plant and equipment (Amount: Millions of yen) Japan India Other areas Total
397,995 208,689 150,392 757,076
FY2016 (1 April 2016 – 31 March 2017)
(1) Net sales (Amount: Millions of yen) Japan India Other areas Total
1,037,546 1,018,813 1,113,182 3,169,542 [Note] Net sales are counted based on the country location of external customers and divided by countries.
(2) Property, plant and equipment (Amount: Millions of yen) Japan India Other areas Total
411,224 243,862 101,257 756,344
16

(Reference information) As reference information, operating results by geographical areas were as follows: [Operating Results by Geographical Areas]
FY2015 (1 April 2015 – 31 March 2016) (Amount: Millions of yen)
Japan Europe Asia
Other areas
Total Eliminations Consolidated
Net Sales
1) Net sales to external customers 1,301,207 323,309 1,402,285 153,857 3,180,659 - 3,180,659 2) Internal net sales or transfer
among geographical areas 508,962 227,156 93,830 542 830,491 (830,491) -
Total 1,810,169 550,465 1,496,116 154,399 4,011,150 (830,491) 3,180,659
Operating income 84,812 6,721 103,823 2,431 197,789 (2,481) 195,308
FY2016 (1 April 2016 – 31 March 2017) (Amount: Millions of yen)
Japan Europe Asia
Other areas Total Eliminations Consolidated
Net Sales
1) Net sales to external customers 1,293,486 344,591 1,389,743 141,721 3,169,542 - 3,169,542 2) Internal net sales or transfer
among geographical areas 565,322 213,651 117,165 546 896,685 (896,685) -
Total 1,858,809 558,242 1,506,909 142,267 4,066,228 (896,685) 3,169,542
Operating income 137,240 13,101 121,396 4,060 275,799 (9,113) 266,685
[Notes] 1. Classification of countries or areas is based on a geographical adjacency. 2. The major countries or areas belonging to classifications other than Japan: (1) Europe …………… Hungary, Germany, United Kingdom and France (2) Asia ……………… India, Indonesia, Thailand and Pakistan (3) Other areas ……… United States, Australia, Mexico and Colombia
3. Classification is counted based on the location of the Company and its consolidated subsidiaries.
17

(Information about Per Share Amount)
(Yen) FY2015
(1 April 2015 – 31 March 2016) FY2016
(1 April 2016 – 31 March 2017)
Net assets per share 2,170.73 Net assets per share 2,538.12
Net income per share, Basic 234.98 Net income per share, Basic 362.54
Net income per share, Diluted 234.92 Net income per share, Diluted 362.48 [Note] Basis of calculation
1. Net assets per share FY2015
(As of 31 March 2016) FY2016
(As of 31 March 2017) Total net assets (Million Yen) 1,187,703 1,387,041 Amount deducted from total net assets (Million Yen) 230,005 267,175
(of which subscription rights to shares) (188) (126) (of which non-controlling interests) (229,816) (267,049)
Net assets attributable to common stock at end of period (Million Yen) 957,697 1,119,865
Number of outstanding shares (Common stock) 491,000,000 491,000,000 Number of treasury stock (Common stock) 49,812,829 49,782,105 Number of common stock used to calculate net assets per share 441,187,171 441,217,895
2. Net income per share, Basic and Net income per share, Diluted FY2015
(1 April 2015 – 31 March 2016)
FY2016 (1 April 2016
– 31 March 2017) Net income per share, Basic
Net income attributable to owners of the parent (Million Yen) 116,660 159,956
Amount not attributable to common stock shareholders (Million Yen) - -
Net income attributable to owners of the parent attributable to common stock (Million Yen) 116,660 159,956
Average number of outstanding shares during the period (Common stock) 496,474,207 441,208,692
Net income per share, Diluted Amount of Net income attributable to owners of the parent adjustment (Million Yen) - -
Increase in number of common stock 114,724 76,455
Outline of potential common stock not used to calculate Net income per share, Diluted because they do not have dilution effect
-
Euro Yen Zero Coupon (subject to the maximum number of shares to be delivered) Convertible Bond Due 2021 and Euro Yen Zero Coupon (subject to the maximum number of shares to be delivered) Convertible Bond Due 2023
(Significant Subsequent Event)
None
18

4. Non-consolidated Financial Statements
(1) Non-consolidated Balance Sheets (Amount: Millions of yen)
FY2015 (As of 31 March 2016)
FY2016 (As of 31 March 2017)
Assets Current assets
Cash and deposits 316,272 497,960
Notes receivable-trade 1,576 1,287
Accounts receivable-trade 135,858 164,516
Short-term investment securities - 30,000
Merchandise and finished goods 35,056 43,234
Work in process 18,687 22,416
Raw materials and supplies 9,100 9,803
Prepaid expenses 1,165 1,039
Deferred tax assets 91,825 85,830
Other 61,428 76,085
Allowance for doubtful accounts (1,548) (2,576) Total current assets 669,423 929,598
Noncurrent assets Property, plant and equipment
Buildings, net 48,587 52,799
Structures, net 9,795 9,655
Machinery and equipment, net 38,243 44,355
Vehicles, net 493 1,228
Tools, furniture and fixtures, net 13,378 10,316
Land 119,763 125,528
Construction in progress 8,699 6,672
Total property, plant and equipment 238,961 250,556
Intangible assets Right of using facilities 180 295
Total intangible assets 180 295
Investments and other assets Investment securities 164,931 132,369
Stocks of subsidiaries and affiliates 355,794 367,597
Investments in capital 2 3
Investments in capital of subsidiaries and affiliates 31,815 30,291
Long-term loans receivable 377 466
Long-term loans receivable from subsidiaries and affiliates 38,891 17,548
Long-term prepaid expenses 245 366
Deferred tax assets 10,896 19,883
Other 9,416 1,233
Allowance for doubtful accounts (380) (185)
Allowance for investment loss (667) (433)
Total investments and other assets 611,325 569,141
Total noncurrent assets 850,466 819,993
Total assets 1,519,889 1,749,592
19

(Amount: Millions of yen)
FY2015 (As of 31 March 2016)
FY2016 (As of 31 March 2017)
Liabilities
Current liabilities
Accounts payable-trade 311,436 326,267
Electronically recorded obligations 64,055 83,070
Short-term loans payable 164,648 48,084
Current portion of long-term loans payable 22,000 76,000
Accounts payable-other 8,044 10,060
Accrued expenses 73,707 68,604
Income taxes payable 17,563 24,995
Advances received 6,659 6,838
Deposits received 91,234 110,493
Provision for product warranties 54,675 62,376
Provision for directors’ bonuses 210 288
Other 6,918 9,331
Total current liabilities 821,154 826,411
Noncurrent liabilities
Bonds with subscription rights to shares - 200,400
Long-term loans payable 205,000 171,472
Provision for retirement benefits 19,657 20,507
Provision for directors' retirement benefits 1,180 1,161
Provision for disaster 1,808 1,540
Provision for product liabilities 3,835 3,443
Provision for recycling expenses 4,508 6,372
Asset retirement obligations 261 257
Other 9,782 10,214
Total noncurrent liabilities 246,033 415,370
Total liabilities 1,067,187 1,241,781
20
(Amount: Millions of yen)
FY2015 (As of 31 March 2016)
FY2016 (As of 31 March 2017)
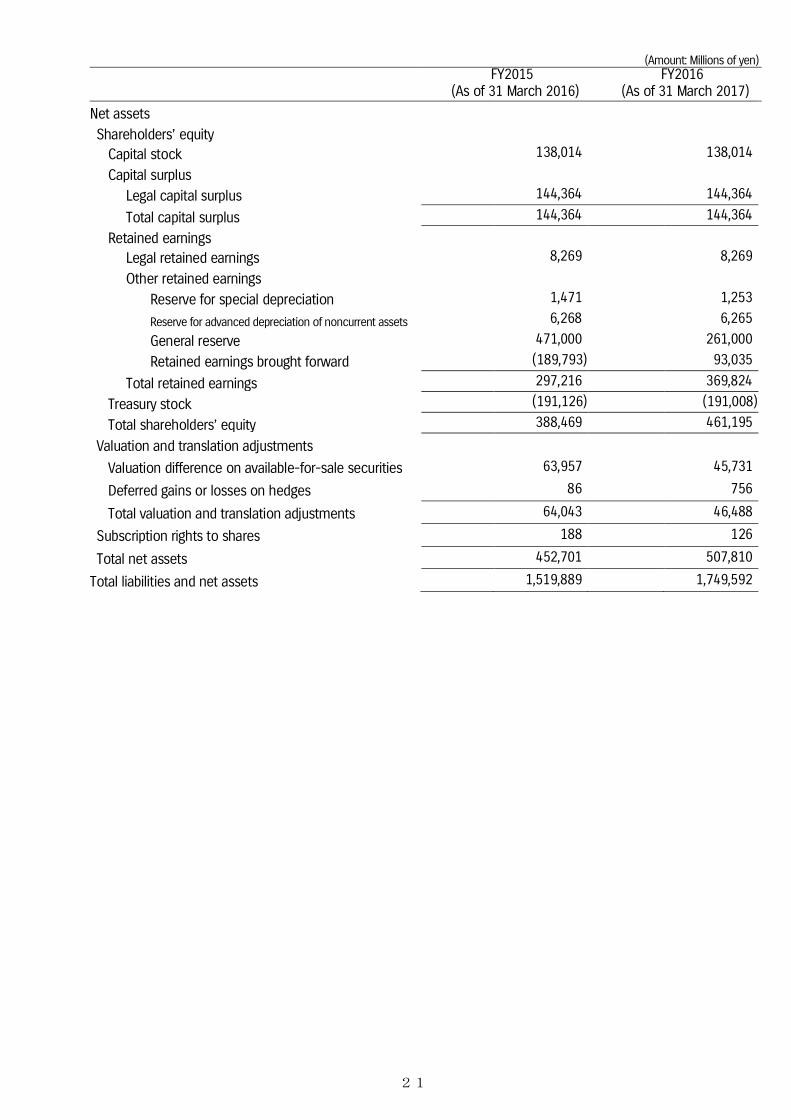
Net assets
Shareholders’ equity Capital stock 138,014 138,014
Capital surplus
Legal capital surplus 144,364 144,364
Total capital surplus 144,364 144,364
Retained earnings Legal retained earnings 8,269 8,269
Other retained earnings
Reserve for special depreciation 1,471 1,253
Reserve for advanced depreciation of noncurrent assets 6,268 6,265
General reserve 471,000 261,000
Retained earnings brought forward (189,793) 93,035
Total retained earnings 297,216 369,824
Treasury stock (191,126) (191,008)
Total shareholders’ equity 388,469 461,195
Valuation and translation adjustments
Valuation difference on available-for-sale securities 63,957 45,731
Deferred gains or losses on hedges 86 756
Total valuation and translation adjustments 64,043 46,488
Subscription rights to shares
188 126
Total net assets 452,701 507,810
Total liabilities and net assets 1,519,889 1,749,592
21

(2) Non-consolidated Statements of Income (Amount: Millions of yen)
FY2015 (1 April 2015 – 31 March 2016)
FY2016 (1 April 2016 – 31 March 2017)
Net sales 1,609,065 1,687,836 Cost of sales
Beginning finished goods 38,993 30,417 Cost of products manufactured 1,211,697 1,282,335 Total 1,250,690 1,312,753 Transfer to other account 1,729 2,226 Ending finished goods 30,417 38,329 Total cost of sales 1,218,542 1,272,197
Gross profit 390,522 415,639 Selling, general and administrative expenses
Selling expenses 216,622 179,351 General and administrative expenses 122,099 129,891 Total selling, general and administrative expenses 338,721 309,242
Operating income 51,801 106,396 Non-operating income
Interest income 1,797 889 Interest on securities 247 4 Dividends income 23,428 14,125 Reversal of loss for doubtful accounts 20 195 Rent income on noncurrent assets 2,838 2,816 Foreign exchange gains 1,894 43 Miscellaneous income 2,248 2,273 Total non-operating income 32,475 20,347
Non-operating expenses Interest expenses 1,705 663 Loss on valuation of securities 1,516 181 Depreciation of assets for rent 1,717 1,666 Provision of allowance for investment loss 1,306 1,018 Miscellaneous expenses 1,878 3,004 Total non-operating expenses 8,124 6,533
Ordinary income 76,151 120,210 Extraordinary income
Gain on sales of noncurrent assets 413 260 Gain on sales of investment securities 36,760 47,773 Gain on sales of shares of subsidiaries and affiliates 2,901 - Total extraordinary income 40,075 48,034
Extraordinary loss Loss on sales of noncurrent assets 204 30 Impairment loss 99 5,590 Loss on valuation of investments in capital and shares of subsidiaries and affiliates
- 34,747
Total extraordinary loss 304 40,367 Income before income taxes etc. 115,922 127,876 Income taxes-current 34,960 35,680 Income taxes-deferred 2,369 4,525 Income taxes 37,329 40,205 Net income 78,593 87,671
22

(3) Non-consolidated Statements of Changes in Net Assets
FY2015 (1 April 2015 – 31 March 2016) (Amount: Millions of yen)
Shareholders' equity
Capital stock
Capital surplus Retained earnings
Legal capital surplus
Other capital surplus
Total capital surplus
Legal retained earnings
Other retained earnings
Reserve for special
depreciation Balance at beginning of current fiscal year 138,014 144,364 - 144,364 8,269 100
Changes of items during the period Provision of reserve for special depreciation 1,416
Reversal of reserve for special depreciation (44)
Provision of reserve for advanced depreciation of noncurrent assets
Reversal of reserve for advanced depreciation of noncurrent assets
Provision of general reserve Dividends from surplus Net income Purchase of treasury stock Disposal of treasury stock (95) (95) Retirement of treasury stock (269,191) (269,191) Transfer to capital surplus from retained earnings
269,287 269,287
Net changes of items other than shareholders' equity
Total changes of item during the period - - - - - 1,371
Balance at end of current fiscal year 138,014 144,364 - 144,364 8,269 1,471
23

(Amount: Millions of yen)
Shareholders' equity
Retained earnings
Treasury Total Other retained earnings Total Reserve for advanced
depreciation of noncurrent assets
General reserve Retained earnings brought forward
retained
earnings
stock
shareholders’
equity
Balance at beginning of current fiscal year 6,170 445,000 44,526 504,067 (19) 786,427
Changes of items during the period Provision of reserve for special depreciation (1,416) - -
Reversal of reserve for special depreciation 44 - -
Provision of reserve for advanced depreciation of noncurrent assets 197 (197) - -
Reversal of reserve for advanced depreciation of noncurrent assets (100) 100 - -
Provision of general reserve 26,000 (26,000) - - Dividends from surplus (16,156) (16,156) (16,156) Net income 78,593 78,593 78,593 Purchase of treasury stock (460,479) (460,479) Disposal of treasury stock 180 84
Retirement of treasury stock 269,191 -
Transfer to capital surplus from retained earnings (269,287) (269,287) -
Net changes of items other than shareholders' equity
Total changes of items during the period 97 26,000 (234,319) (206,850) (191,107) (397,957)
Balance at end of current fiscal year 6,268 471,000 (189,793) 297,216 (191,126) 388,469
Valuation and translation adjustments
Valuation difference on available-for-sale
securities
Deferred gains or losses on hedges
Total valuation and translation
adjustments
Subscription rights to shares
Total net assets
Balance at beginning of current fiscal year 150,310 779 151,089 250 937,767
Changes of items during the period Provision of reserve for special depreciation -
Reversal of reserve for special depreciation -
Provision of reserve for advanced depreciation of noncurrent assets -
Reversal of reserve for advanced depreciation of noncurrent assets -
Provision of general reserve - Dividends from surplus (16,156) Net income 78,593 Purchase of treasury stock (460,479) Disposal of treasury stock 84
Retirement of treasury stock - Transfer to capital surplus from retained earnings -
Net changes of items other than shareholders' equity (86,353) (692) (87,046) (62) (87,108)
Total changes of items during the period (86,353) (692) (87,046) (62) (485,066)
Balance at end of current fiscal year 63,957 86 64,043 188 452,701
24

FY2016 (1 April 2016 – 31 March 2017) (Amount: Millions of yen)
Shareholders' equity
Capital stock
Capital surplus Retained earnings
Legal capital surplus
Other capital surplus
Total capital surplus
Legal retained earnings
Other retained earnings
Reserve for special
depreciation Balance at beginning of current fiscal year 138,014 144,364 - 144,364 8,269 1,471
Changes of items during the period Reversal of reserve for special depreciation (217)
Provision of reserve for advanced depreciation of noncurrent assets
Reversal of reserve for advanced depreciation of noncurrent assets
Reversal of general reserve Dividends from surplus Net income Purchase of treasury stock Disposal of treasury stock (60) (60) Transfer to capital surplus from retained earnings
60 60
Net changes of items other than shareholders' equity
Total changes of item during the period - - - - - (217)
Balance at end of current fiscal year 138,014 144,364 - 144,364 8,269 1,253
25

(Amount: Millions of yen)
Shareholders' equity
Retained earnings
Treasury Total Other retained earnings Total Reserve for advanced
depreciation of noncurrent assets
General reserve Retained earnings brought forward
retained
earnings
stock
shareholders’
equity
Balance at beginning of current fiscal year 6,268 471,000 (189,793) 297,216 (191,126) 388,469
Changes of items during the period Reversal of reserve for special depreciation 217 - -
Provision of reserve for advanced depreciation of noncurrent assets 94 (94) - -
Reversal of reserve for advanced depreciation of noncurrent assets (97) 97 - -
Reversal of general reserve (210,000) 210,000 - - Dividends from surplus (15,003) (15,003) (15,003) Net income 87,671 87,671 87,671 Purchase of treasury stock (4) (4) Disposal of treasury stock 122 62 Transfer to capital surplus from retained earnings (60) (60) -
Net changes of items other than shareholders' equity
Total changes of items during the period (2) (210,000) 282,828 72,607 118 72,726
Balance at end of current fiscal year 6,265 261,000 93,035 369,824 (191,008) 461,195
Valuation and translation adjustments
Valuation difference on available-for-sale
securities
Deferred gains or losses on hedges
Total valuation and translation
adjustments
Subscription rights to shares
Total net assets
Balance at beginning of current fiscal year 63,957 86 64,043 188 452,701
Changes of items during the period Reversal of reserve for special depreciation -
Provision of reserve for advanced depreciation of noncurrent assets -
Reversal of reserve for advanced depreciation of noncurrent assets -
Reversal of general reserve - Dividends from surplus (15,003) Net income 87,671 Purchase of treasury stock (4) Disposal of treasury stock 62 Transfer to capital surplus from retained earnings -
Net changes of items other than shareholders' equity (18,225) 669 (17,555) (62) (17,617)
Total changes of items during the period (18,225) 669 (17,555) (62) 55,108
Balance at end of current fiscal year 45,731 756 46,488 126 507,810
26
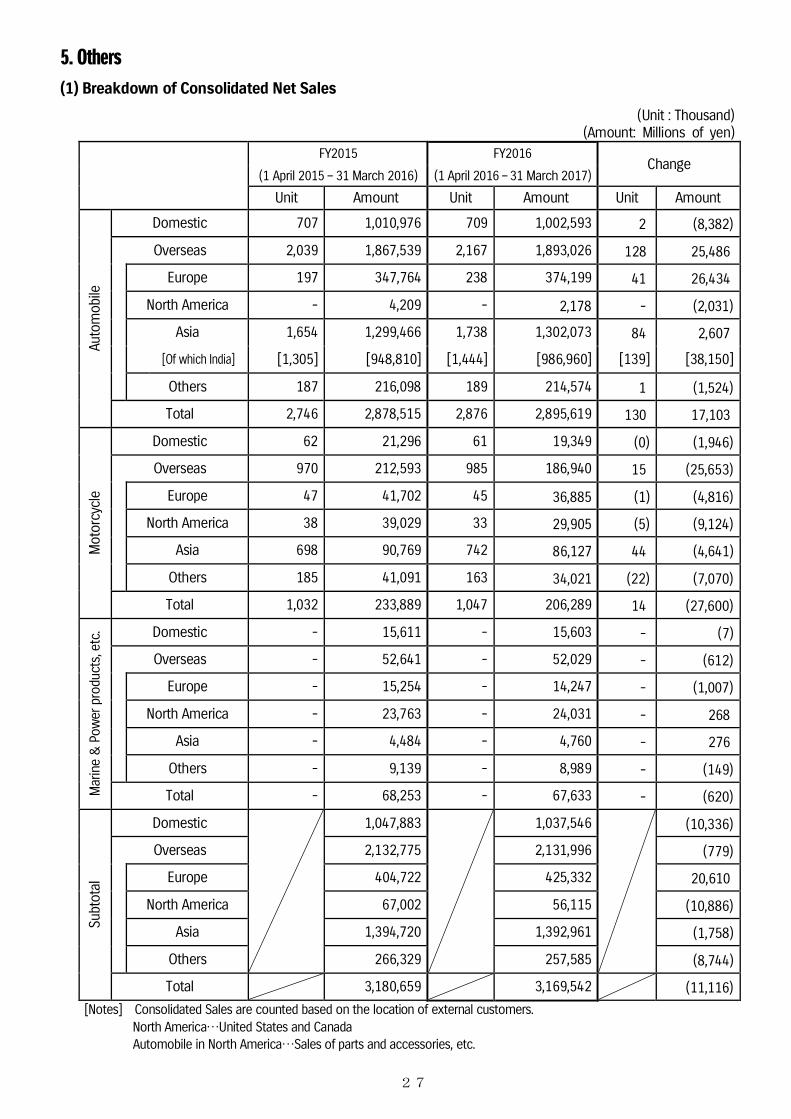
5. Others (1) Breakdown of Consolidated Net Sales
(Unit : Thousand) (Amount: Millions of yen)
FY2015 FY2016 Change
(1 April 2015 – 31 March 2016) (1 April 2016 – 31 March 2017)
Unit Amount Unit Amount Unit Amount
Auto
mob
ile
Domestic 707 1,010,976 709 1,002,593 2 (8,382)
Overseas 2,039 1,867,539 2,167 1,893,026 128 25,486
Europe 197 347,764 238 374,199 41 26,434
North America - 4,209 - 2,178 - (2,031)
Asia 1,654 1,299,466 1,738 1,302,073 84 2,607
[Of which India] [1,305] [948,810] [1,444] [986,960] [139] [38,150]
Others 187 216,098 189 214,574 1 (1,524)
Total 2,746 2,878,515 2,876 2,895,619 130 17,103
Mot
orcy
cle
Domestic 62 21,296 61 19,349 (0) (1,946)
Overseas 970 212,593 985 186,940 15 (25,653)
Europe 47 41,702 45 36,885 (1) (4,816)
North America 38 39,029 33 29,905 (5) (9,124)
Asia 698 90,769 742 86,127 44 (4,641)
Others 185 41,091 163 34,021 (22) (7,070)
Total 1,032 233,889 1,047 206,289 14 (27,600)
Mar
ine
& P
ower
pro
duct
s, et
c. Domestic - 15,611 - 15,603 - (7)
Overseas - 52,641 - 52,029 - (612)
Europe - 15,254 - 14,247 - (1,007)
North America - 23,763 - 24,031 - 268
Asia - 4,484 - 4,760 - 276
Others - 9,139 - 8,989 - (149)
Total - 68,253 - 67,633 - (620)
Subt
otal
Domestic
1,047,883
1,037,546
(10,336)
Overseas 2,132,775 2,131,996 (779)
Europe 404,722 425,332 20,610
North America 67,002 56,115 (10,886)
Asia 1,394,720 1,392,961 (1,758)
Others 266,329 257,585 (8,744)
Total 3,180,659 3,169,542 (11,116) [Notes] Consolidated Sales are counted based on the location of external customers.
North America…United States and Canada Automobile in North America…Sales of parts and accessories, etc.
27

(2) Breakdown of Non-consolidated Net Sales (Unit : Thousand)
(Amount: Millions of yen)
FY2015
(1 April 2015 – 31 March 2016) FY2016
(1 April 2016 – 31 March 2017) Change
Unit Amount Unit Amount Unit Amount
Auto
mob
ile
Dom
estic
Mini Vehicle 662 638,210 621 606,774 (40) (31,436) Sub-compact and Standard-sized Vehicle 85 115,712 115 162,181 30 46,468
Total 747 753,923 737 768,955 (10) 15,032
Expo
rt
General trade 113 309,285 138 331,215 25 21,929
Triangle trade - 305,302 - 339,590 - 34,288
Total 113 614,587 138 670,805 25 56,218 [Of which Overseas
production parts] - [197,300] - [194,028] - [(3,271)]
Total 861 1,368,511 876 1,439,761 14 71,250
Mot
orcy
cle
Domestic 57 11,446 59 10,878 1 (568)
Expo
rt
General trade 88 56,263 97 58,621 9 2,358
Triangle trade - 15,420 - 11,905 - (3,514)
Total 88 71,683 97 70,526 9 (1,156) [Of which Overseas production parts] - [6,906] - [5,719] - [(1,186)]
ATVs
onl
y
General trade 13 5,341 8 3,372 (4) (1,968)
Triangle trade - 638 - 569 - (68)
Total 13 5,979 8 3,942 (4) (2,037) [Of which Overseas production parts] - [1,074] - [976] - [(97)]
Total 146 83,130 157 81,405 11 (1,725)
Mar
ine
& P
ower
pr
oduc
ts
Domestic - 3,211 - 3,282 - 71
Expo
rt
General trade - 30,801 - 31,519 - 718
Triangle trade - 7,914 - 7,690 - (223)
Total - 38,715 - 39,210 - 494
Total - 41,927 - 42,493 - 565
Spar
e pa
rts
and
othe
rs Domestic - 78,198 - 83,457 - 5,258
Export(General trade) - 37,297 - 40,719 - 3,421
Total - 115,496 - 124,176 - 8,680
Subt
otal
Domestic
846,780
866,574
19,793
Expo
rt
General trade 433,647 462,075 28,427
Triangle trade 328,637 359,187 30,549
Total 762,285 821,262 58,977
Total 1,609,065 1,687,836 78,771
28


![Q1 FY2016 Consolidated Earnings Presentation [Company Update]](https://static.fdocuments.in/doc/165x107/577cb29f1a28aba7118c1c53/q1-fy2016-consolidated-earnings-presentation-company-update.jpg)

