CONSOLIDATED FINANCIAL STATEMENTS WITH ...gd57q3q43551jsgiq3jtkdb1-wpengine.netdna-ssl.com/wp...To...
49
ASPIRE PUBLIC SCHOOLS CONSOLIDATED FINANCIAL STATEMENTS WITH INDEPENDENT AUDITOR’S REPORT YEARS ENDED JUNE 30, 2016 AND 2015
Transcript of CONSOLIDATED FINANCIAL STATEMENTS WITH ...gd57q3q43551jsgiq3jtkdb1-wpengine.netdna-ssl.com/wp...To...

ASPIRE PUBLIC SCHOOLS
CONSOLIDATED FINANCIAL STATEMENTS WITH INDEPENDENT AUDITOR’S REPORT
YEARS ENDED
JUNE 30, 2016 AND 2015

ASPIRE PUBLIC SCHOOLS
TABLE OF CONTENTS
PAGE
INDEPENDENT AUDITOR’S REPORT 1
FINANCIAL STATEMENTS
Consolidated Statements of Financial Position 3
Consolidated Statements of Activities 4
Consolidated Statements of Cash Flows 5
Notes to Financial Statements 6
SUPPLEMENTARY INFORMATION
Consolidating Statement of Financial Position, by Region 28
Consolidating Statement of Activities, by Region 30
Consolidating Statement of Financial Position 32
Consolidating Statement of Activities 38
Consolidating Schedule of Functional Expenses 44

1
INDEPENDENT AUDITOR’S REPORT To the Board of Directors Aspire Public Schools Oakland, California
Report on the Financial Statements
We have audited the accompanying consolidated financial statements of Aspire Public Schools, a non-profit public benefit corporation, and affiliates (collectively, the Organization), which comprise the consolidated statements of financial position as of June 30, 2016 and 2015, and the related consolidated statements of activities and cash flows for the years then ended, and the related notes to the consolidated financial statements.
Management’s Responsibility for the Financial Statements
Management is responsible for the preparation and fair presentation of these consolidated financial statements in accordance with accounting principles generally accepted in the United States of America; this includes the design, implementation, and maintenance of internal control relevant to the preparation and fair presentation of consolidated financial statements that are free from material misstatement, whether due to fraud or error.
Auditor’s Responsibility
Our responsibility is to express an opinion on these consolidated financial statements based on our audits. We conducted our audits in accordance with auditing standards generally accepted in the United States of America. Those standards require that we plan and perform the audit to obtain reasonable assurance about whether the consolidated financial statements are free from material misstatement.
An audit involves performing procedures to obtain audit evidence about the amounts and disclosures in the consolidated financial statements. The procedures selected depend on the auditor’s judgment, including the assessment of the risks of material misstatement of the financial statements, whether due to fraud or error. In making those risk assessments, the auditor considers internal control relevant to the entity’s preparation and fair presentation of the consolidated financial statements in order to design audit procedures that are appropriate in the circumstances, but not for the purpose of expressing an opinion on the effectiveness of the entity’s internal control. Accordingly, we express no such opinion. An audit also includes evaluating the appropriateness of accounting policies used and the reasonableness of significant accounting estimates made by management, as well as evaluating the overall presentation of the consolidated financial statements. We believe that the audit evidence we have obtained is sufficient and appropriate to provide a basis for our audit opinion.
PHONE:916.646.6464 FAX:916.929.6836 GilbertCPA.com
2880 GATEWAY OAKS DRIVE, SUITE 100, SACRAMENTO, CA 95833 101 PARKSHORE DRIVE, SUITE 100, FOLSOM, CA 95630
Relax. We got this.Relax. We got this.Relax. We got this.SM

To the Board of Directors Aspire Public Schools Page 2
2
Opinion
In our opinion, the consolidated financial statements referred to above present fairly, in all material respects, the financial position of Aspire Public Schools and affiliates as of June 30, 2016 and 2015, and the changes in its net assets and its cash flows for the years then ended in accordance with accounting principles generally accepted in the United States of America.
Other Matter
Supplementary Information
Our audit was conducted for the purpose of forming an opinion on the consolidated financial statements as a whole. The accompanying Supplementary Information, as listed in the Table of Contents, is presented for purposes of additional analysis and is not a required part of the consolidated financial statements. Such information is the responsibility of management and was derived from and relates directly to the underlying accounting and other records used to prepare the consolidated financial statements. The information has been subjected to the auditing procedures applied in the audit of the consolidated financial statements and certain additional procedures, including comparing and reconciling such information directly to the underlying accounting and other records used to prepare the consolidated financial statements or to the financial statements themselves, and other additional procedures in accordance with auditing standards generally accepted in the United States of America. In our opinion, the information is fairly stated, in all material respects, in relation to the consolidated financial statements as a whole. GILBERT ASSOCIATES, INC. Sacramento, California November 18, 2016

ASSETS2016 2015
CURRENT ASSETS:Cash and cash equivalents 49,191,017$ 39,558,131$ Restricted cash and cash equivalents 2,742,925 3,808,122Accounts receivable 23,921,361 24,296,753Foundation grants receivable, current portion 6,577,551 6,478,348Prepaid expenses and deposits 932,224 656,435
Total current assets 83,365,078 74,797,789
NON-CURRENT ASSETS: Restricted cash and cash equivalents 14,706,417 11,613,493Foundation grants receivable, net 3,856,509 5,229,654Property and equipment, net 156,828,954 147,283,887Other assets, net 473,216 809,184
TOTAL ASSETS 259,230,174$ 239,734,007$
LIABILITIES AND NET ASSETS
CURRENT LIABILITIES:Accounts payable 6,375,853$ 8,623,833$ Accrued expenses 9,527,781 8,734,315Line of credit 700,000 -
Capital lease, current - 655,000Debt, current 2,069,925 2,299,298
Total current liabilities 18,673,559 20,312,446
LONG-TERM LIABILITIES:Deferred rent 797,336 750,083Capital lease, net - 15,335,000Debt, net 137,921,439 110,733,163
Total liabilities 157,392,334 147,130,692
NET ASSETS: Unrestricted 78,493,962 59,742,105Temporarily restricted 23,343,878 32,861,210
Total net assets 101,837,840 92,603,315
TOTAL LIABILITIES AND NET ASSETS 259,230,174$ 239,734,007$
ASPIRE PUBLIC SCHOOLS
CONSOLIDATED STATEMENTS OF FINANCIAL POSITIONJUNE 30, 2016 AND 2015
The accompanying notes are an integral part of these consolidated financial statements. 3

UNRESTRICTED NET ASSETS 2016 2015
SUPPORT AND REVENUE: 4,380,785$ 3,274,440$
Donated equipment, materials, and services 158,925 72,47824,040,242 22,178,697
California state revenue: State aid portion of general purpose funding 78,526,499 64,525,368 All other state revenue 15,587,478 8,995,889
Basic education program funding 9,987,738 9,119,948All other state revenue - 27,150
Local revenue: Cash in-lieu of property taxes 23,660,751 18,409,782 Interest income 27,185 33,455 All other local revenue 2,528,971 1,512,468
Subtotal 158,898,574 128,149,675Net assets released from restrictions 56,353,133 41,599,336
Total support and revenue 215,251,707 169,749,011
Educational programs 153,444,883 126,842,622
Site support 14,325,313 12,365,389Development and expansion 8,156,221 9,377,352
Administration and general 4,819,793 5,818,296
Total supporting services 27,301,327 27,561,037 Total expenses 180,746,210 154,403,659
Loss on debt extinguishment 15,753,640 -
Total expenses and losses 196,499,850 154,403,659
Increase in Unrestricted Net Assets 18,751,857 15,345,352
TEMPORARILY RESTRICTED NET ASSETS: 7,342,993 16,400,543
Federal and state revenue 39,492,808 30,292,061Return of grant funds - (463,543)
Net assets released from restrictions (56,353,133) (41,599,336)
Increase (Decrease) in Temporarily Restricted Net Assets (9,517,332) 4,629,725
INCREASE IN NET ASSETS 9,234,525 19,975,077
NET ASSETS - Beginning of Year 92,603,315 72,628,238
NET ASSETS - End of Year 101,837,840$ 92,603,315$
Tennessee state revenue:
Private grants and contributions
EXPENSES AND LOSSES
PROGRAM EXPENSES:
SUPPORTING SERVICES:
ASPIRE PUBLIC SCHOOLS
CONSOLIDATED STATEMENTS OF ACTIVITIESYEARS ENDED JUNE 30, 2016 AND 2015
Private grants and contributions
Federal revenue
The accompanying notes are an integral part of these consolidated financial statements. 4

2016 2015CASH FLOWS FROM OPERATING ACTIVITIES:
Increase in net assets 9,234,525$ 19,975,077$ Adjustments to reconcile to net cash provided by operating activities:
Depreciation 5,990,909 5,234,095Amortization 335,968 242,610Donated property and equipment (138,007) (79,123) Loss on disposal of property and equipment 47,860 51,196 Loss on unamortized deferred costs upon debt extinguishment 3,249,538 - Forgiveness of debt (700,000) (1,400,000)Donated investments - (2,842,661)Amortization of long-term debt costs 212,040 106,834(Increase) decrease in assets:
Accounts receivable 375,392 184,359Foundation grants receivable 1,273,942 (4,863,203)Cash held at county or district - - Prepaid expenses and deposits (275,789) (399,384)
Increase (decrease) in liabilities:Accounts payable (4,084,981) 538,116Accrued expenses 793,466 124,011Deferred rent 47,253 54,552
Net cash provided by operating activities 16,362,116 16,926,479
CASH FLOWS FROM INVESTING ACTIVITIES:Purchases of property and equipment (13,608,828) (13,925,750)
Net cash used in investing activities (13,608,828) (13,925,750)
CASH FLOWS FROM FINANCING ACTIVITIES:Proceeds from lines of credit 700,000 - Proceeds from debt 124,804,597 4,100,000Payments of debt issuance costs (2,177,936) - Principal payments on capital lease (15,990,000) (635,000)Proceeds from sale of donor restricted investments - 2,842,661Principal payments on debt (98,429,336) (5,172,083)
Net cash provided by financing activities 8,907,325 1,135,578
Net increase in cash and cash equivalents 11,660,613 4,136,307Cash and cash equivalents, beginning of year 54,979,746 50,843,439
Cash and cash equivalents, end of year 66,640,359$ 54,979,746$
Cash and cash equivalents 49,191,017$ 39,558,131$ Restricted cash and cash equivalents 17,449,342 15,421,615
Total 66,640,359$ 54,979,746$
NON-CASH INVESTING ACTIVITIES:Property and equipment financed through accounts payable 1,837,001$ 2,073,635$
NON-CASH FINANCING ACTIVITIES:Forgiveness of debt 700,000$ 1,400,000$
CASH PAID FOR INTEREST (net of capitalized amount) 5,921,488$ 6,797,938$
ASPIRE PUBLIC SCHOOLS
CONSOLIDATED STATEMENTS OF CASH FLOWSYEARS ENDED JUNE 30, 2016 AND 2015
The accompanying notes are an integral part of these consolidated financial statements. 5

ASPIRE PUBLIC SCHOOLS
NOTES TO FINANCIAL STATEMENTS JUNE 30, 2016 AND 2015
6
1. OPERATIONS AND SIGNIFICANT ACCOUNTING POLICIES
Aspire Public Schools, a non-profit public benefit corporation, was formed to manage, guide, direct, and promote charter schools that provide quality education to youth in primary and secondary grades. The Organization was founded in 1998. The Organization's support is derived primarily from public education monies, individual and foundation contributions, and various government agency grants. In addition to managing school operations, Aspire Public Schools controls three affiliated organizations that were created to facilitate ownership of certain school facilities and support development of charter schools. The facilities are owned and managed by two single-member limited liability companies, College for Certain, LLC (CFC LLC), and College for Certain II, LLC (CFC II LLC). The sole member of both LLCs is College for Certain, Inc. (CFC INC) which was created as a supporting organization of Aspire Public Schools to facilitate and support the development of charter schools. CFC INC is controlled by, and for the benefit of, Aspire Public Schools. CFC LLC and CFC II LLC are disregarded entities for federal income tax purposes. Aspire Public Schools TN, LLC (TN LLC) is a Tennessee non-profit limited liability company created in July 2013, whose sole member is Aspire Public Schools. TN LLC incorporated pursuant to the Tennessee Nonprofit Corporation Act and is a disregarded entity for federal income tax purposes. TN LLC was formed to manage, guide, direct, and promote charter schools that provide quality education to Tennessee youth in primary and secondary grades. TN LLC’s support is derived primarily from State of Tennessee public education monies, foundation contributions, and various government agency grants. Aspire University, Inc. (Aspire U) is a California non-profit public benefit corporation created on July 1, 2015. Aspire Public Schools is the sole voting member of Aspire U. Aspire U’s purpose is to develop a high-caliber teacher, principal, and leader pipeline for the Organization and other education organizations. For financial reporting purposes, CFC LLC, CFC II LLC, CFC INC, TN LLC, and Aspire U are consolidated with Aspire Public Schools for the year ended June 30, 2016. CFC LLC, CFC INC, and TN LLC are consolidated for the year ended June 30, 2015. Principles of Consolidation – The accompanying consolidated financial statements include the accounts of Aspire Public Schools and its controlled affiliated organizations, collectively the “Organization”. All significant intercompany accounts and transactions have been eliminated in consolidation. Listed below are the affiliated organizations included in these financial statements:
Aspire Public Schools - Aspire Public Schools operates thirty-five schools in California under
thirty-four charters which are chartered by twelve charter authorizers (sponsoring districts) in six counties. Charters were granted for each school for up to five years, with an opportunity for renewal. Charters may be revoked by the sponsoring district for material violations of the charter, failure to meet or make progress toward student outcomes identified in the charter, failure to meet generally accepted standards of fiscal management, or violation of any provision of the law. As of June 30, 2016, the charter schools operated by Aspire Public Schools were as follows:

ASPIRE PUBLIC SCHOOLS
NOTES TO FINANCIAL STATEMENTS JUNE 30, 2016 AND 2015
7
Charter School Name
Charter School
Number
Sponsoring District
*Charter Granted/ Renewed
Charter Expiration
Aspire Alexander Twilight College Preparatory Academy
1554
San Juan Unified
Nov 2015
6/30/21
Aspire Alexander Twilight Secondary Academy
1555
San Juan Unified
Nov 2015
6/30/21
Aspire Antonio Maria Lugo Academy
694
Los Angeles County Office of Education
April 2014
6/30/19
Aspire APEX Academy 1552 Stockton Unified Nov 2012 6/30/18 Aspire Benjamin Holt College
Preparatory Academy
565
Lodi Unified
Feb 2013
6/30/18
Aspire Berkley Maynard Academy 726 Oakland Unified Jan 2015 6/30/20 Aspire Capitol Heights Academy
598
Sacramento City Unified
Nov 2012
6/30/18
Aspire Centennial College Preparatory Academy
1436
Los Angeles Unified
Apr 2012
6/30/18
Aspire College Academy 1577 Oakland Unified May 2013 6/30/18 Aspire East Palo Alto Charter School 125 Ravenswood City Nov 2013 6/30/19 Aspire ERES Academy 1115 Oakland Unified Feb 2014 6/30/19 Aspire Firestone Academy 1214 Los Angeles Unified Oct 2014 6/30/20 Aspire Gateway Academy 1213 Los Angeles Unified Oct 2014 6/30/20 Aspire Golden State College
Preparatory Academy
1023
Oakland Unified
Dec 2012
6/30/18
Aspire Inskeep Academy 1332 Los Angeles Unified Oct 2015 6/30/21 Aspire Junior Collegiate Academy 1551 Los Angeles Unified Jan 2013 6/30/18 Aspire Langston Hughes Academy 1048 Stockton Unified Dec 2012 6/30/18 Aspire Lionel Wilson College
Preparatory Academy
465
Oakland Unified
Jan 2012
6/30/17
Aspire Monarch Academy 252 Oakland Unified Feb 2014 6/30/19 Aspire Ollin University Prep
693
Los Angeles County Office of Education
April 2014
6/30/19
Aspire Pacific Academy 1230 Los Angeles Unified Oct 2014 6/30/20 Aspire Port City Academy 1553 Stockton Unified Nov 2012 6/30/18 Aspire Richmond California College West Contra Costa Preparatory Academy 1739 Unified Dec 2014 6/30/20 Aspire Richmond Technology West Contra Costa Academy 1740 Unified Dec 2014 6/30/20 Aspire River Oaks Charter School 364 Lodi Unified Feb 2016 6/30/21 Aspire Rosa Parks Academy 554 Stockton Unified Jan 2015 6/30/20 Aspire Slauson Academy 1330 Los Angeles Unified Oct 2015 6/30/21 Aspire Summit Charter Academy 812 Ceres Unified Jan 2016 6/30/21 Aspire Tate Academy 1331 Los Angeles Unified Oct 2015 6/30/21 Aspire Titan Academy 1550 Los Angeles Unified Jan 2013 6/30/18 Aspire Triumph Technology
Academy
1663
Oakland Unified
Jan 2014
6/30/19

ASPIRE PUBLIC SCHOOLS
NOTES TO FINANCIAL STATEMENTS JUNE 30, 2016 AND 2015
8
Aspire University Charter School 1026 Sylvan Union Elem Jan 2013 6/30/18 Aspire Vanguard College Preparatory
Academy
1125
Modesto City Schools
Nov 2013
6/30/19
Aspire Vincent Shalvey Academy 178 Lodi Unified Feb 2014 6/30/19
* Charter issuance date or the most recent renewal date.
All sponsoring districts receive up to 1% of the annual charter revenue for supervisory oversight. Ravenswood City School the sponsoring district for Aspire East Palo Alto Charter receives up to 3% for supervisory oversight because the district provides facilities substantially rent-free.
Through June 30, 2016, the Organization had separately negotiated with all sponsoring districts for administrative fees and other services. Additionally, for some schools, transportation expenses and/or special education encroachment are paid by the Organization to the sponsoring districts.
Aspire Public Schools TN, LLC – TN LLC operates three schools under three charters in Shelby County, Tennessee. Charters were granted for each school for ten years, with an opportunity for renewal. Charters may be revoked by the charter authorizer (sponsoring district) for material violations of the charter, failure to meet or make progress toward student outcomes identified in the charter, failure to meet generally accepted standards of fiscal management, or violation of any provision of the law. As of June 30, 2016, the charter schools operated by TN LLC were as follows:
Charter School Name
Charter School
Number
Sponsoring
District
Charter Granted/ Renewed
Charter Expiration
Aspire Hanley Elementary School #1
8024
TN Achievement
School District
April 2013 6/30/23 Aspire Hanley Elementary School #2
8025
TN Achievement School District
April 2013 6/30/23
Aspire Coleman Elementary School 8050 TN Achievement
School District
May 2014 6/30/24
College for Certain, LLC – CFC LLC holds title to properties that are financed through the CSFA Charter School Revenue Refunding Bonds Series 2016 (2016 Bonds) where Aspire Public Schools operates ten charter schools (seven locations) and manages, operates, and leases the properties.
College for Certain II, LLC – CFC II LLC holds title to properties that are financed through the
CSFA Charter School Revenue Refunding Bonds Series 2015 (2015 Bonds) where Aspire Public Schools operates two charter schools and manages, operates, and leases the properties.
College for Certain, Inc. – CFC INC is a supporting organization of Aspire Public Schools in
that it facilitates and supports the development of charter schools for Aspire Public Schools. CFC INC is the named borrower of the 2015 and 2016 Bonds outstanding.
ASPIRE PUBLIC SCHOOLS
NOTES TO FINANCIAL STATEMENTS JUNE 30, 2016 AND 2015
9
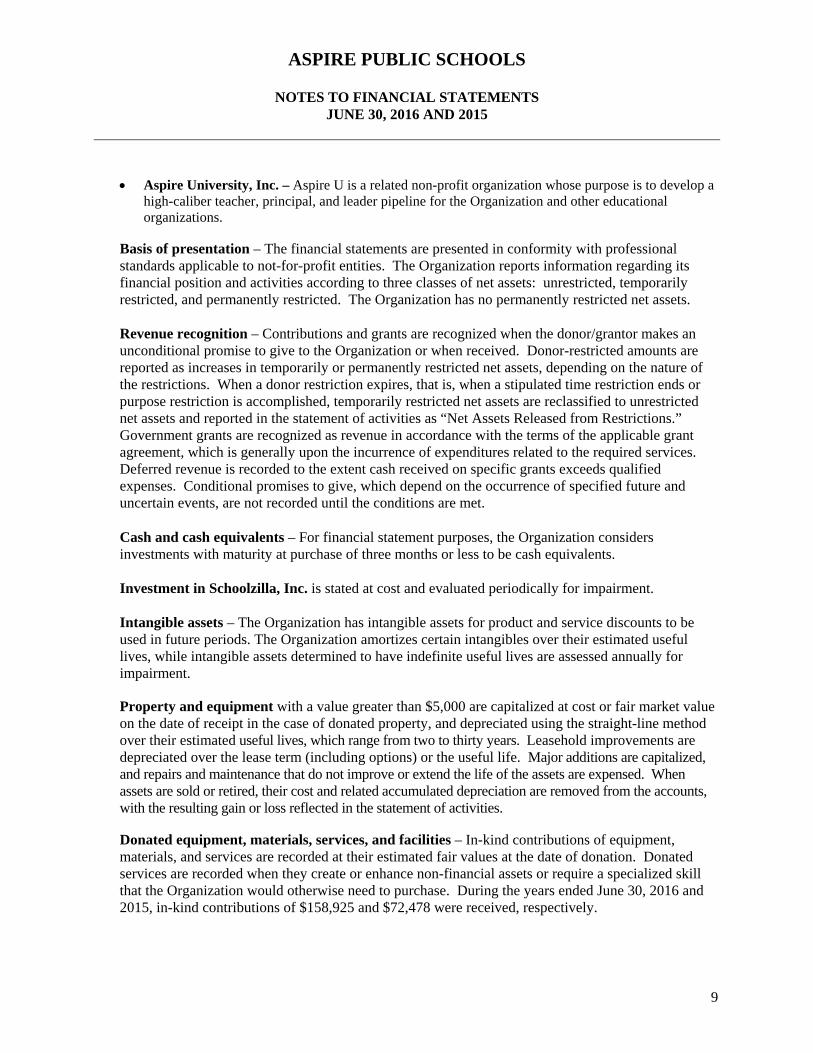
Aspire University, Inc. – Aspire U is a related non-profit organization whose purpose is to develop a high-caliber teacher, principal, and leader pipeline for the Organization and other educational organizations.
Basis of presentation – The financial statements are presented in conformity with professional standards applicable to not-for-profit entities. The Organization reports information regarding its financial position and activities according to three classes of net assets: unrestricted, temporarily restricted, and permanently restricted. The Organization has no permanently restricted net assets. Revenue recognition – Contributions and grants are recognized when the donor/grantor makes an unconditional promise to give to the Organization or when received. Donor-restricted amounts are reported as increases in temporarily or permanently restricted net assets, depending on the nature of the restrictions. When a donor restriction expires, that is, when a stipulated time restriction ends or purpose restriction is accomplished, temporarily restricted net assets are reclassified to unrestricted net assets and reported in the statement of activities as “Net Assets Released from Restrictions.” Government grants are recognized as revenue in accordance with the terms of the applicable grant agreement, which is generally upon the incurrence of expenditures related to the required services. Deferred revenue is recorded to the extent cash received on specific grants exceeds qualified expenses. Conditional promises to give, which depend on the occurrence of specified future and uncertain events, are not recorded until the conditions are met. Cash and cash equivalents – For financial statement purposes, the Organization considers investments with maturity at purchase of three months or less to be cash equivalents. Investment in Schoolzilla, Inc. is stated at cost and evaluated periodically for impairment. Intangible assets – The Organization has intangible assets for product and service discounts to be used in future periods. The Organization amortizes certain intangibles over their estimated useful lives, while intangible assets determined to have indefinite useful lives are assessed annually for impairment.
Property and equipment with a value greater than $5,000 are capitalized at cost or fair market value on the date of receipt in the case of donated property, and depreciated using the straight-line method over their estimated useful lives, which range from two to thirty years. Leasehold improvements are depreciated over the lease term (including options) or the useful life. Major additions are capitalized, and repairs and maintenance that do not improve or extend the life of the assets are expensed. When assets are sold or retired, their cost and related accumulated depreciation are removed from the accounts, with the resulting gain or loss reflected in the statement of activities.
Donated equipment, materials, services, and facilities – In-kind contributions of equipment, materials, and services are recorded at their estimated fair values at the date of donation. Donated services are recorded when they create or enhance non-financial assets or require a specialized skill that the Organization would otherwise need to purchase. During the years ended June 30, 2016 and 2015, in-kind contributions of $158,925 and $72,478 were received, respectively.

ASPIRE PUBLIC SCHOOLS
NOTES TO FINANCIAL STATEMENTS JUNE 30, 2016 AND 2015
10
Income taxes – The Organization has been granted tax-exempt status as provided by Internal Revenue Code Section 501(c)(3) and Section 23701(d) of the California Revenue and Taxation Code. In addition, the Internal Revenue Service has determined the Organization is not a private foundation within the meaning of Section 509(a) of the Internal Revenue Code. Accordingly, no provision for income taxes has been reflected in these financial statements. The Organization applied the accounting principles related to accounting for uncertainty in income taxes and has determined that there is no material impact on the financial statements for June 30, 2016 and 2015. With some exceptions, the Organization is no longer subject to U.S. federal and state income tax examinations by tax authorities for years prior to the year ended June 30, 2012. Functional allocation of expenses – The cost of providing educational programs and other activities has been summarized on a functional basis in the Statement of Activities. Accordingly, certain costs have been allocated based on employees’ time incurred and management’s estimate of the usage of resources. Program development and expansion – The Organization continually explores potential opportunities for expansion and growth; thus costs are incurred to research the possibility of establishing new sites. The Organization capitalizes these preacquisition costs into ‘Construction in progress’ (Note 6) at the time incurred. If it is determined that a formal contractual commitment will not be entered into, the expenses are included in program development and expansion in the period that the determination is made.
Fair value measurements – Fair value is a market-based measurement, not an entity-specific measurement. For some assets and liabilities, observable market transactions or market information might be available. For other assets and liabilities, observable market transactions and market information might not be available. However, the objective of a fair value measurement in both cases is the same—to estimate the price at which an orderly transaction to sell the asset or to transfer the liability would take place between market participants at the measurement date under current market conditions (that is, an exit price at the measurement date from the perspective of a market participant that holds the asset or owes the liability).
In order to increase consistency and comparability in fair value measurements, a fair value hierarchy that prioritizes observable and unobservable inputs is used to measure fair value into three broad levels, as follows:
Level 1 Inputs Unadjusted quoted prices in active markets that are accessible at the measurement date for identical assets or liabilities.
Level 2 Inputs
Inputs other than quoted prices in active markets that are observable either directly or indirectly.
Level 3 Inputs Unobservable inputs for the asset or liability.

ASPIRE PUBLIC SCHOOLS
NOTES TO FINANCIAL STATEMENTS JUNE 30, 2016 AND 2015
11
When a price for an identical asset or liability is not observable, a reporting entity measures fair value using another valuation technique that maximizes the use of relevant observable inputs and minimizes the use of unobservable inputs. Because fair value is a market-based measurement, it is measured using the assumptions that market participants would use when pricing the asset or liability, including assumptions about risk. As a result, a reporting entity’s intention to hold an asset or to settle or otherwise fulfill a liability is not relevant when measuring fair value.
Use of estimates – The preparation of financial statements in conformity with accounting principles generally accepted in the United States of America requires management to make estimates and assumptions that affect certain reported amounts and disclosures. Accordingly, actual results could differ from those estimates. Significant management estimates included in the financial statements are the collectability of the receivables and foundation grants receivables, estimate of net present value of the foundation grants receivable, the estimated useful lives of property and equipment, the functional allocation of expenses, and the net present value of intangibles. Reclassifications – Certain amounts in the prior year financial statements have been reclassified for comparative purposes to conform with presentation of the current-year financial statements. Subsequent events have been reviewed through November 18, 2016, the date the financial statements were available to be issued. Management concluded that no material subsequent events have occurred since June 30, 2016 that require recognition or disclosure in the consolidated financial statements. Recent Accounting Pronouncement – In April 2015, the Financial Accounting Standards Board (FASB) issued Accounting Standards Update (ASU) No. 2015-03 Interest-Imputation of Interest (Subtopic 835-30): Simplifying the Presentation of Debt Issuance Costs. The guidance requires that debt issuance costs be presented in the Statement of Financial Position as a reduction of the carrying amount of the debt rather than as an asset. This ASU is effective for fiscal years beginning after December 15, 2016, but earlier adoption is permitted. The Organization elected to early adopt the ASU in 2016 and has applied the provisions retrospectively to 2015. Long-term debt as of June 30, 2015 was previously reported on the Statement of Financial Position as $114,045,021 with the associated $3,311,858 unamortized debt issuance costs included in other assets.
2. CONCENTRATIONS OF CASH
The Organization maintains its cash in bank deposit accounts that at times may exceed federally insured limits. The Organization has not experienced any losses in such accounts. Management believes the Organization is not exposed to any significant credit risk related to cash.
ASPIRE PUBLIC SCHOOLS
NOTES TO FINANCIAL STATEMENTS JUNE 30, 2016 AND 2015
12
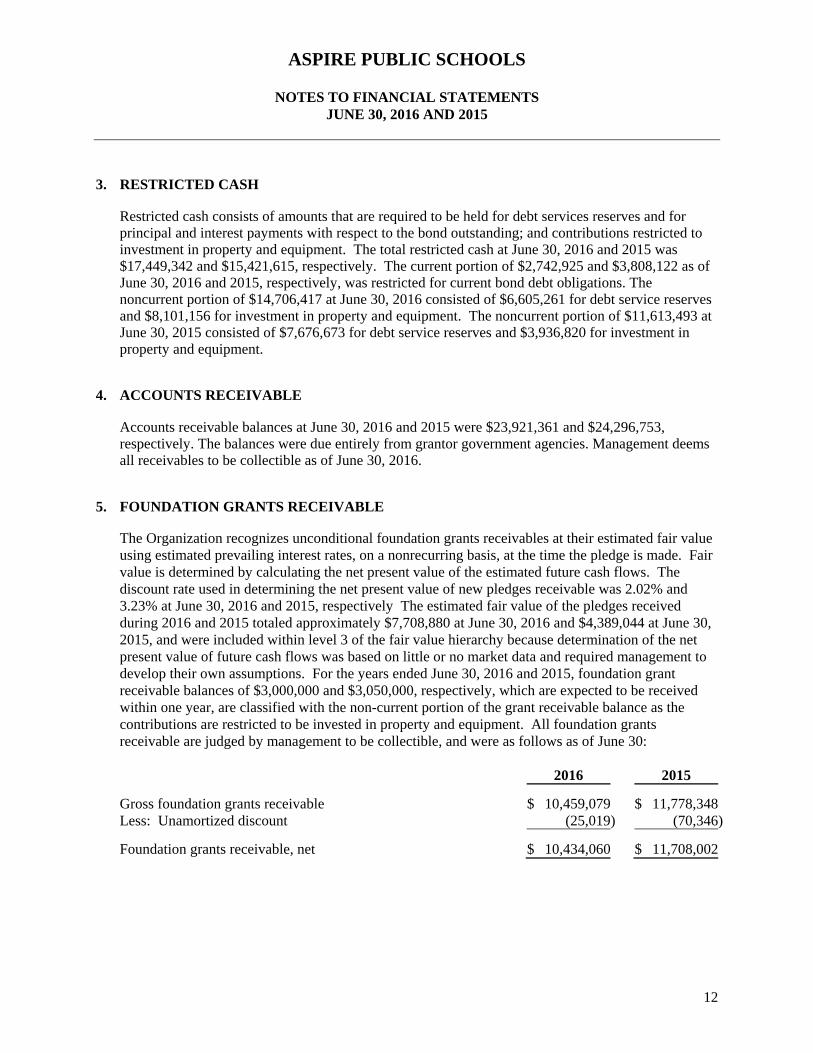
3. RESTRICTED CASH Restricted cash consists of amounts that are required to be held for debt services reserves and for principal and interest payments with respect to the bond outstanding; and contributions restricted to investment in property and equipment. The total restricted cash at June 30, 2016 and 2015 was $17,449,342 and $15,421,615, respectively. The current portion of $2,742,925 and $3,808,122 as of June 30, 2016 and 2015, respectively, was restricted for current bond debt obligations. The noncurrent portion of $14,706,417 at June 30, 2016 consisted of $6,605,261 for debt service reserves and $8,101,156 for investment in property and equipment. The noncurrent portion of $11,613,493 at June 30, 2015 consisted of $7,676,673 for debt service reserves and $3,936,820 for investment in property and equipment.
4. ACCOUNTS RECEIVABLE
Accounts receivable balances at June 30, 2016 and 2015 were $23,921,361 and $24,296,753, respectively. The balances were due entirely from grantor government agencies. Management deems all receivables to be collectible as of June 30, 2016.
5. FOUNDATION GRANTS RECEIVABLE
The Organization recognizes unconditional foundation grants receivables at their estimated fair value using estimated prevailing interest rates, on a nonrecurring basis, at the time the pledge is made. Fair value is determined by calculating the net present value of the estimated future cash flows. The discount rate used in determining the net present value of new pledges receivable was 2.02% and 3.23% at June 30, 2016 and 2015, respectively The estimated fair value of the pledges received during 2016 and 2015 totaled approximately $7,708,880 at June 30, 2016 and $4,389,044 at June 30, 2015, and were included within level 3 of the fair value hierarchy because determination of the net present value of future cash flows was based on little or no market data and required management to develop their own assumptions. For the years ended June 30, 2016 and 2015, foundation grant receivable balances of $3,000,000 and $3,050,000, respectively, which are expected to be received within one year, are classified with the non-current portion of the grant receivable balance as the contributions are restricted to be invested in property and equipment. All foundation grants receivable are judged by management to be collectible, and were as follows as of June 30:
2016 2015
Gross foundation grants receivable $ 10,459,079 $ 11,778,348Less: Unamortized discount (25,019) (70,346)
Foundation grants receivable, net $ 10,434,060 $ 11,708,002

ASPIRE PUBLIC SCHOOLS
NOTES TO FINANCIAL STATEMENTS JUNE 30, 2016 AND 2015
13
Foundation grants receivable are due to be collected as follows:
2016 2015
Within one year $ 9,577,551 $ 9,528,348 One to five years 856,509 2,179,654
Foundation grants receivable, net $ 10,434,060 $ 11,708,002
Conditional promises to give, which depend on the occurrence of specified future and uncertain events, are not recorded until the conditions are met. Approximate outstanding conditional promises to give are as follows and will be recognized as revenue as the conditions are met: Purpose: 2016 2015
Opening schools in specific locations $ 14,000,000 $ 10,650,000 Implementation of blended learning at specific locations 225,000 225,000
Total $ 14,225,000 $ 10,875,000
6. PROPERTY AND EQUIPMENT
Property and equipment consisted of the following at June 30:
2016 2015
Land $ 34,049,639 $ 27,731,414 Buildings 129,051,974 99,585,994 Construction in progress 8,421,229 12,966,189 Leasehold improvements 11,997,341 8,554,732 Equipment 9,310,369 7,403,068 Property under capital lease - 21,845,473
Subtotal 192,830,552 178,086,870 Less accumulated depreciation (36,001,598) (30,802,983)
Property and equipment, net $ 156,828,954 $ 147,283,887
Depreciation expense was $5,990,909 and $5,234,095 for the years ended June 30, 2016 and 2015, respectively. Various components of the land, buildings, and schools under construction shown above are pledged as collateral for the debt disclosed in Note 8. In December 2015, the Organization obtained the 2015 Bonds to pay off the balance of the capital lease with Lodi Unified School District and purchase the property for one dollar. The property that was under capital lease is now classified with land and buildings as of June 30, 2016.

ASPIRE PUBLIC SCHOOLS
NOTES TO FINANCIAL STATEMENTS JUNE 30, 2016 AND 2015
14
7. OTHER ASSETS
Other assets consisted of the following at June 30:
2016 2015
Indefinite-lived intangible assets $ 316,372 $ 316,372 Amortizable intangible assets, net 156,844 262,515 Deferred loss, net - 230,297 Investment in Schoolzilla, Inc. - -
Other assets, net $ 473,216 $ 809,184
Intangible Assets
The Organization holds an indefinite-life intangible asset for product and technology discount benefits valued at $316,372. Management assesses the carrying value of the indefinite-life intangible asset annually, or more often if facts and circumstances suggest it may be impaired. If this review indicates that the carrying value may not be recoverable, then the carrying value would be reduced to its estimated fair value. No impairment losses were recognized as a result of this review for the years ended June 30, 2016 and 2015, respectively.
Amortizable intangible assets consist of the following as of June 30, 2016:
Gross Carrying Amount
Accumulated Amortization
Net
Product and technology discount benefits $ 438,922 $ 300,698 $ 138,224Rights to use certain assets 53,200 34,580 18,620Service discount benefits 14,263 14,263 -
Total $ 506,385 $ 349,542 $ 156,844
Amortizable intangible assets consist of the following as of June 30, 2015:
Gross
Carrying Amount
Accumulated Amortization
Net
Product and technology discount benefits $ 438,922 $ 209,233 $ 229,689Rights to use certain assets 53,200 23,940 29,260Service discount benefits 14,263 10,697 3,566
Total $ 506,385 $ 243,870 $ 262,515

ASPIRE PUBLIC SCHOOLS
NOTES TO FINANCIAL STATEMENTS JUNE 30, 2016 AND 2015
15
The product and technology discount benefits, rights to use certain assets, and service discount benefits are amortized on a straight-line basis over a seven, five, and three year period, respectively. These lives are based on the periods in which the Organization is eligible for such discounts. Amortization expense on intangible assets for the years ended June 30, 2016 and 2015 was $105,672 and $103,176, respectively.
The expected future amortization expense of intangible assets is as follows:
2017 $ 47,500 2018 45,726 2019 36,860 2020 26,758
Total $ 156,844
Deferred Loss In January of 2005, Lodi Unified School District (the District) purchased the Aspire River Oaks Charter School and Aspire Benjamin Holt College Preparatory Academy facilities from the Organization. The Organization concurrently entered into a capital lease obligation with the District effective January 1, 2005 through August 1, 2032. The Organization had the option to purchase the properties for one dollar at the termination of the lease. This transaction was treated as sale-leaseback transaction and a loss on this transaction of $374,660 was to be deferred and amortized over the term of the capital lease. As of June 30, 2015, accumulated amortization was $144,363. Amortization expense of the deferred loss for the year ended June 30, 2015 was $13,748 and the net book value was $230,297. As discussed in Note 10, the Organization obtained the 2015 Bonds and paid off the capital lease in December 2015 and purchased the property for one dollar per the lease agreement. The Organization wrote off the remaining deferred loss balance of $224,421 in 2016 as part of this transaction.
Investment in Schoolzilla, Inc.
The Organization owned 11.408% and 15.325% of the common stock of Schoolzilla, Inc. (Schoolzilla) at June 30, 2016 and 2015, respectively. Schoolzilla is a for-profit company that develops web-based data management platforms allowing teachers to synthesize data from multiple sources and create reports presenting their students’ academic performances. In 2015 although the Organization’s interest in Schoolzilla had dropped below 20%, management determined they still have significant influence over the operations of Schoolzilla through a seat on their board of directors, and maintaining the third largest stake in Schoolzilla, and therefore accounted for this investment under the equity method.
In 2016, ownership was further diluted and management did not have significant influence and therefore accounted for the investment under the cost method. As of June 30, 2016 and 2015, the investment was reflected at $0 value due to losses recognized under the equity method. Schoolzilla did not declare any dividends as of June 30, 2016 and 2015.

ASPIRE PUBLIC SCHOOLS
NOTES TO FINANCIAL STATEMENTS JUNE 30, 2016 AND 2015
16
The condensed unaudited financial information for Schoolzilla, Inc. at June 30, 2015: Total assets $ 3,017,000Total liabilities 2,431,000 Stockholders’ Equity 586,000 Net loss 3,124,000
8. DEBT 2016 2015
College for Certain Series 2016 School Facility Revenue Refunding Bonds (2016 Bonds) in the amount of $83,170,000 were issued effective February 1, 2016; with 4 bonds and bearing interest rates ranging from 2.00% - 5.00%. The bond proceeds were used for the refunding of the outstanding principal of the College for Certain Series 2010 School Facility Revenue Bonds. Associated with this bond is a premium of $10,618,415 and debt issuance costs of $1,410,454. Principal and interest payments are due yearly beginning August 1, 2016. Final maturity is in August 2046. $ 83,170,000 $ -
College for Certain Series 2015 School Facility Revenue Refunding Bonds (2015 Bonds) in the amount of $20,535,000 were issued effective December 1, 2015; with 4 bonds and bearing interest rates ranging from 2.00% - 5.00%. The bond proceeds were used for the payoff of the outstanding balance of the capital lease with Lodi Unified School District described in Note 9. Associated with this bond is a premium of $2,005,317 and debt issuance costs of $767,482. Principal and interest payments are due yearly beginning August 1, 2016. Final maturity is in August 2046. 20,535,000 -
Charter Fund, Inc. $3,500,000 loan, effective October 15, 2012, bearing interest at 1%, to provide general support for the management of the organization. Principal payments of $700,000 are due in 3 annual installments beginning in 2020 through 2022. This loan has the potential to be forgiven annually through 2017, if specific milestones are met. $700,000 and $1,400,000 of this note was forgiven in 2016 and 2015, respectively. 1,400,000 2,100,000
California School Finance Authority $4,758,509 loan, effective June 27, 2007, bearing interest at 2.202%, for the construction of Rosa Parks Academy in Stockton under Proposition 47. Interest only payments of varying amounts are due annually. Principal and interest payments totaling $231,795 are due annually. Final maturity is in 2037. 3,864,039 4,007,587

ASPIRE PUBLIC SCHOOLS
NOTES TO FINANCIAL STATEMENTS JUNE 30, 2016 AND 2015
17
2016 2015 Charter Fund, Inc. $1,000,000 loan, effective January 25, 2009,
bearing interest at 4.1%, to provide general support for the management of the organization. Beginning in 2010 through 2017, interest only payments of $41,000 were due annually. Principal payments of $500,000 were due in both 2016 and 2017. Final maturity was in 2017; however this note was paid in full as of June 30, 2016. - 1,000,000
California Department of Education loans for fifteen schools. Loans range from $150,000 to $250,000 with interest rates from .24% to .55%. Principal is payable in five annual installments ranging from $20,000 to $67,500, per loan. The loans were paid in full as of June 30, 2016. - 402,496
California School Finance Authority $9,834,913 loan ($457,251 issued in 2009/10, $5,262,400 issued in 2010/11, and $4,115,262 issued in 2012/13), bearing interest at 2%, for the construction of Aspire Ollin University College Preparatory campus in Los Angeles under Proposition 55. Beginning July 2014, interest only payments of varying amounts are due annually. In addition, a principal and interest payment of $462,139 is due annually. Final maturity is in 2042. In the year ended June 30, 2016 the Organization returned $508,102 of the outstanding balance as it was not used for the project. 8,790,620 9,569,472
California School Finance Authority $8,229,438 loan ($3,459,764 issued in 2013/14 and $4,769,674 issued in 2015/16), bearing interest at 2%, for the construction of a new campus for Aspire Antonio Maria Lugo Academy in Los Angeles under Proposition 1D. Beginning July 2017, interest and principal payments of $376,730 are due annually. Final Maturity is in 2045. 8,229,438 3,459,764
California School Finance Authority $3,706,191 loan issued in 2015/16, effective date and payment terms to be determined upon conversion to final apportionment for a new campus to be built for Aspire ERES Academy in Oakland under Proposition 1D. The interest rate will be approximately the state's borrowing rate and repayment will commence starting one-year after the new facility is opened. The principal will then be amortized over 30 years. Interest is not charged until the repayment period begins. The school is expected to be completed in the 2017/18 fiscal year. 3,706,191 -
CSGF Revolving Facilities Loan Fund LLC loan up to $3,500,000, executed on April 8, 2015 and $2,500,000 had been issued to date. The loan had an interest rate of 3.75% per annum with interest not due until maturity which was on September 30, 2016, however the loan was paid in full as of June 30, 2016. - 2,500,000

ASPIRE PUBLIC SCHOOLS
NOTES TO FINANCIAL STATEMENTS JUNE 30, 2016 AND 2015
18
2016 2015 Pacific West Communities loan in the amount of $1,500,000
executed on April 8, 2015. The loan had an interest rate of 30-day LIBOR plus 3.5% with a floor of 4.0%. The interest rate at June 30, 2015 was 4.0%. The loan was paid in full as of June 30, 2016. - 1,500,000
College for Certain Series 2010 School Facility Revenue Bonds (2010 Bonds) in the amount of $93,295,000 were issued effective April 1, 2010; with 7 bonds and bearing interest rates ranging from 5.00% - 6.375%. The bond proceeds were used for the construction of new campuses. Principal and interest payments were due yearly beginning July 1, 2014. The 2010 Bonds were defeased via issuance of the College for Certain Series 2016 School Facility Revenue Bonds. - 91,805,000
Subtotal 129,695,288 116,344,319
Unamortized premiums and debt issuance costs 10,296,076 (3,311,858)
Less current portions (2,069,925) (2,070,896)
Total Long-Term Debt $ 137,921,439 $ 110,733,163 On February 25, 2016, the Organization issued $83,170,000 of bonds (2016 Bonds), as mentioned above. The proceeds, in addition to the net premium of $9,207,961, were used to advance refund $83,360,000 of the outstanding 2010 Bonds. The proceeds were deposited in an irrevocable trust with an escrow agent to pay the future debt service on the refunded bonds. As a result, the 2010 Bonds are considered defeased and the liability for those bonds has been removed from the Consolidated Statement of Financial Position. The remaining proceeds were used to fund required reserve accounts. The reacquisition price (amount placed in escrow to repay the 2010 Bonds) exceeded the net carrying amount of those bonds and the unamortized portion of debt issuance costs, by $15,753,640. The loss on this transaction is reflected on the Consolidated Statement of Activities for the year ended June 30, 2016. At June 30, 2016, the outstanding balance of the defeased 2010 Bonds was $95,864,103. The bonds will be redeemed on their January 1, 2019 call date.

ASPIRE PUBLIC SCHOOLS
NOTES TO FINANCIAL STATEMENTS JUNE 30, 2016 AND 2015
19
Future payments relating to debt are as follows as of June 30, 2016:
Year Ending June 30, Principal Interest Total
2017 $ 2,069,925 $ 5,357,520 $ 7,427,4452018 2,383,977 5,546,200 7,830,1772019 2,348,759 5,479,472 7,828,2312020 3,138,844 5,393,789 8,532,6332021 3,244,239 5,295,698 8,539,937
Thereafter 116,609,544 82,164,763 198,774,307
Total $ 129,695,288 $ 109,237,442 $ 238,932,730 Aspire Public Schools (the Obligated Group under the 2015 Bonds and 2016 Bonds) must meet several financial covenants as a requirement of the Bonds, commencing the year ending June 30, 2017. Revolving Line of Credit On October 28, 2014, the Organization obtained a $10,000,000 revolving line of credit, which had a balance of $700,000 and $0 at June 30, 2016 and 2015, respectively. Advances on the credit line are payable on demand and carry an interest rate equal to the greater of the Prime Rate or 3.25%. The interest rate was 3.5% and 3.25% at June 30, 2016 and 2015, respectively. The credit line is secured by substantially all assets of the Organization.
9. CAPITALIZATION OF CONSTRUCTION DEBT INTEREST
While a facility is under construction, a portion of interest is capitalized into its cost. In summary, the capitalization of interest is applicable to the amount of interest that could have been avoided had the Organization not undertaken the building of a capital asset. The Organization evaluates capitalization of interest at the individual site level since the cash from one site would not be used to pay down the debt on another site. The amount of capitalizable interest is determined by applying the debt interest rate to the average amount of accumulated expenditures for the building during the year. Interest costs of $5,398,285 and $6,745,944 were incurred related to debt during the years ended June 30, 2016 and 2015, respectively. During the years ended June 30, 2016 and 2015, $64,574 and $8,912 of interest was capitalized, respectively.

ASPIRE PUBLIC SCHOOLS
NOTES TO FINANCIAL STATEMENTS JUNE 30, 2016 AND 2015
20
10. LEASE COMMITMENTS
Operating leases
The Organization leases buildings for administrative offices in Oakland and Stockton and leases land and buildings for school sites in Berkeley, East Palo Alto, Empire, Los Angeles, Modesto, Oakland, Sacramento, Stockton, and Memphis under various operating leases. The Organization also leases copiers at various school sites. It is unlikely that the Organization will cancel any of these leases before they expire. The aggregate minimum rental payments required under the terms of all operating leases as of June 30, 2016 are as follows:
Year Ending
June 30, Minimum Payments
2017 $ 3,823,912 2018 3,728,804 2019 3,406,946 2020 1,946,138
2021 936,161 Thereafter 10,468,975
Total $ 24,310,936
Rental expense under operating leases was $3,465,715 and $3,480,818 for the years ended June 30, 2016 and 2015, respectively. Capital lease The Organization entered into a capital lease with Lodi Unified School District from January 1, 2005 through August 1, 2032. The leased property was being depreciated over the term of the lease and depreciation expense for the leased property was included in the total depreciation expense. On December 1, 2015, as discussed in Note 6 and 8 the Organization paid the capital lease balance in full and purchased the property for one dollar. The outstanding balance of the capital lease as of June 30, 2015 was $15,990,000.
11. EMPLOYEE BENEFIT PLANS
Qualified employees are covered under multiple-employer defined benefit pension plans maintained by agencies of the State of California and Tennessee. Classified employees in California are members of the California Public Employees’ Retirement System (CalPERS), and certificated employees working at California Schools are members of the California State Teachers’ Retirement System (CalSTRS). Certificated employees working at Tennessee schools are members of the Tennessee Consolidated Retirement System (TCRS). All employees who are not members of these plans must contribute to the federal Social Security system. The Organization also has three 403(b) plans as of the year ended June 30, 2016.
ASPIRE PUBLIC SCHOOLS
NOTES TO FINANCIAL STATEMENTS JUNE 30, 2016 AND 2015
21
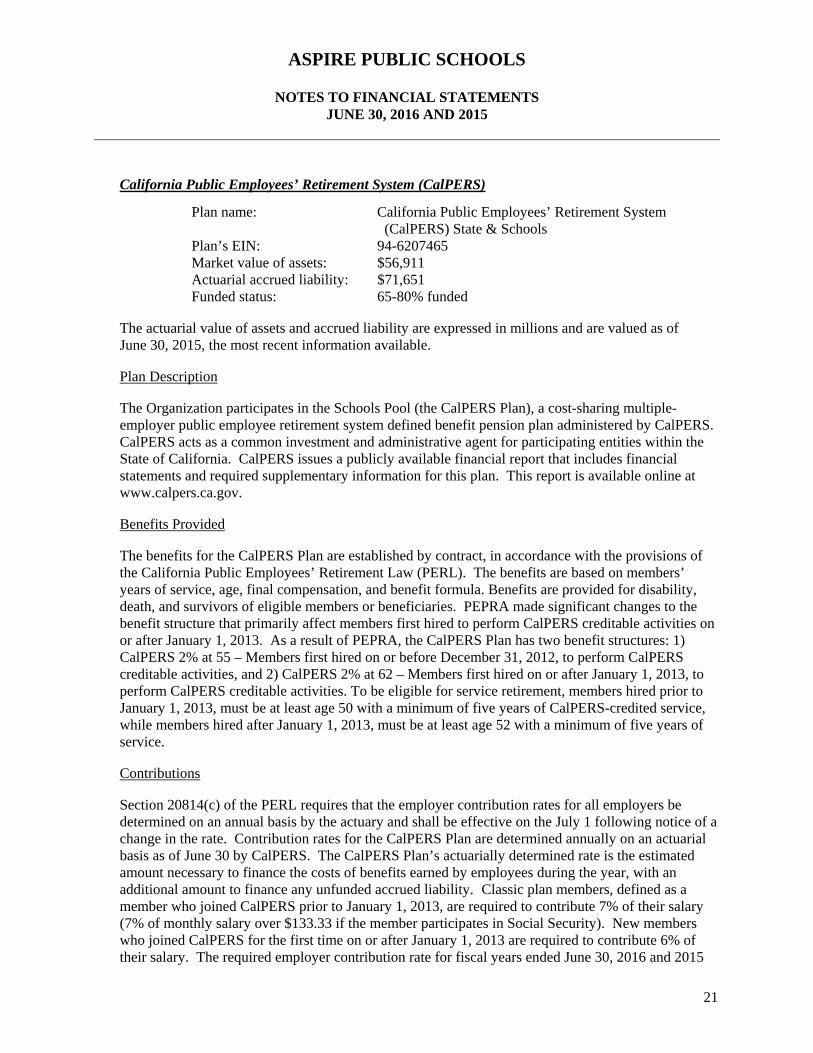
California Public Employees’ Retirement System (CalPERS)
Plan name: California Public Employees’ Retirement System (CalPERS) State & Schools Plan’s EIN: 94-6207465 Market value of assets: $56,911 Actuarial accrued liability: $71,651 Funded status: 65-80% funded
The actuarial value of assets and accrued liability are expressed in millions and are valued as of June 30, 2015, the most recent information available.
Plan Description
The Organization participates in the Schools Pool (the CalPERS Plan), a cost-sharing multiple-employer public employee retirement system defined benefit pension plan administered by CalPERS. CalPERS acts as a common investment and administrative agent for participating entities within the State of California. CalPERS issues a publicly available financial report that includes financial statements and required supplementary information for this plan. This report is available online at www.calpers.ca.gov.
Benefits Provided
The benefits for the CalPERS Plan are established by contract, in accordance with the provisions of the California Public Employees’ Retirement Law (PERL). The benefits are based on members’ years of service, age, final compensation, and benefit formula. Benefits are provided for disability, death, and survivors of eligible members or beneficiaries. PEPRA made significant changes to the benefit structure that primarily affect members first hired to perform CalPERS creditable activities on or after January 1, 2013. As a result of PEPRA, the CalPERS Plan has two benefit structures: 1) CalPERS 2% at 55 – Members first hired on or before December 31, 2012, to perform CalPERS creditable activities, and 2) CalPERS 2% at 62 – Members first hired on or after January 1, 2013, to perform CalPERS creditable activities. To be eligible for service retirement, members hired prior to January 1, 2013, must be at least age 50 with a minimum of five years of CalPERS-credited service, while members hired after January 1, 2013, must be at least age 52 with a minimum of five years of service.
Contributions
Section 20814(c) of the PERL requires that the employer contribution rates for all employers be determined on an annual basis by the actuary and shall be effective on the July 1 following notice of a change in the rate. Contribution rates for the CalPERS Plan are determined annually on an actuarial basis as of June 30 by CalPERS. The CalPERS Plan’s actuarially determined rate is the estimated amount necessary to finance the costs of benefits earned by employees during the year, with an additional amount to finance any unfunded accrued liability. Classic plan members, defined as a member who joined CalPERS prior to January 1, 2013, are required to contribute 7% of their salary (7% of monthly salary over $133.33 if the member participates in Social Security). New members who joined CalPERS for the first time on or after January 1, 2013 are required to contribute 6% of their salary. The required employer contribution rate for fiscal years ended June 30, 2016 and 2015

ASPIRE PUBLIC SCHOOLS
NOTES TO FINANCIAL STATEMENTS JUNE 30, 2016 AND 2015
22
were 11.847% and 11.771% of annual payroll, respectively. The contribution requirements of the plan members are established by state statute. For the fiscal year 2017, the Organization is required to contribute 13.888% of annual payroll.
California State Teachers’ Retirement System (CalSTRS):
Plan name: California State Teachers’ Retirement System (CalSTRS)Plan’s EIN: 94-6291617 Actuarial value of assets: $165,553 Actuarial accrued liability: $241,753 Funded status: 65-80% funded
The actuarial value of assets and accrued liability are expressed in millions and are valued as of June 30, 2015, the most recent actuarial valuation date.
Plan Description
The Organization participates in the State Teachers’ Retirement Plan (the CalSTRS Plan), a cost-sharing multiple-employer public employee retirement system defined benefit pension plan administered by CalSTRS. CalSTRS acts as a common investment and administrative agent for participating entities within the State of California. CalSTRS issues a publicly available financial report that includes financial statements and required supplementary information for this plan. This report is available online at www.calstrs.com.
Benefits Provided
The benefits for the CalSTRS Plan are established by contract, in accordance with the provisions of the State Teachers' Retirement Law. Benefits are based on members’ years of service, age, final compensation, and a benefit formula. Benefits are provided for disability, death, and survivors of eligible members or beneficiaries. The California Public Employees’ Pension Reform Act of 2013 (PEPRA) made significant changes to the benefit structure that primarily affect members first hired to perform CalSTRS creditable activities on or after January 1, 2013. As a result of PEPRA, the CalSTRS Plan has two benefit structures: 1) CalSTRS 2% at 60 – Members first hired on or before December 31, 2012, to perform CalSTRS creditable activities, and 2) CalSTRS 2% at 62 – Members first hired on or after January 1, 2013, to perform CalSTRS creditable activities. The 2 percent, also known as the age factor, refers to the percentage of final compensation received as a retirement benefit for each year of service credit. To be eligible for service retirement, members hired prior to January 1, 2013, must be at least age 60 with a minimum of five years of CalSTRS-credited service, while members hired after January 1, 2013, must be at least age 62 with five years of service. Contributions Assembly Bill 1469 (AB 1469), signed into law as a part of the State of California’s (the State) 2014-15 budget, increases contributions to the CalSTRS Plan from members, employers, and the State over the next seven years, effective July 1, 2014. School employer contributions will increase from 8.25% to a total of 19.1% of covered payroll over the seven-year period. Active plan members are required to contribute 8.56% or 9.2 % of their salary, depending on when they were hired. The required employer contribution rates for the fiscal years ended June 30, 2016 and 2015 were 10.73% and 8.88% of annual payroll, respectively. For the fiscal year 2017, the Organization is required to contribute 12.58% of annual payroll.

ASPIRE PUBLIC SCHOOLS
NOTES TO FINANCIAL STATEMENTS JUNE 30, 2016 AND 2015
23
Tennessee Consolidated Retirement System (TCRS):
Legacy Plan:
Plan name: Tennessee Consolidated Retirement System (TCRS) Legacy Plan: Teachers
Plan’s EIN: 62-6001445 Actuarial value of assets: $21,040 Actuarial accrued liability: $21,309 Funded status: At least 80% funded
The actuarial value of assets and accrued liability are expressed in millions and are valued as of June 30, 2015, the most recent actuarial valuation date.
Plan Description
The Organization contributes to the Tennessee Consolidated Retirement System (TCRS) Legacy Plan, a cost-sharing multiple-employer public employee retirement system defined benefit pension plan for all employees hired on or before June 30, 2014 administered by the Tennessee Department of Treasury. The plan provides retirement, disability, and survivor benefits to beneficiaries. Benefit provisions are established by state statutes, as legislatively amended, within the State Teachers' Retirement Law. TCRS issues a separate comprehensive annual financial report that includes financial statements and required supplementary information. Copies of the TCRS annual financial report may be obtained from the State of Tennessee Treasury Department, 502 Deaderick Street, Nashville, Tennessee, 37243. Funding Policy
Active plan members are required to contribute 5% of their salary and the Organization is required to contribute an actuarially determined rate. The actuarial methods and assumptions used for determining the rate are those adopted by the TCRS Board of Trustees. The required employer contribution rate for the fiscal years ended June 30, 2016 and 2015 was 9.04% of annual payroll. The contribution requirements of the plan members are established by state statute. For the fiscal year 2017, the Organization is required to contribute 9.04% of annual payroll.
Hybrid Plan:
Plan name: TCRS Hybrid Pension Plan with Cost Controls Plan’s EIN: 62-6001445 Actuarial value of assets: $15,745 Actuarial accrued liability: $14,653 Funded status: Over 100% funded
The actuarial value of assets and accrued liability are expressed in millions and are valued as of June 30, 2015, the most recent actuarial valuation date.

ASPIRE PUBLIC SCHOOLS
NOTES TO FINANCIAL STATEMENTS JUNE 30, 2016 AND 2015
24
Plan Description
In the fiscal year ended June 30, 2015, TCRS created a new Hybrid Pension Plan with Cost Controls for all eligible new hires hired on or after July 1, 2014. This plan is a combination of a Defined Benefit and Defined Contribution plan to help provide a sustainable plan going forward, control employer pension cost, and control unfunded liabilities related to pension plans.
Contributions
Under the defined benefit portion of this plan, active plan members are required to contribute 5% of their salary and the Organization is required to contribute 4% of plan member’s annual payroll. Under the defined contribution portion of this plan, employees contribute 2% of their salary, which employees can opt out of if they choose, and the Organization is required to contribute 5% of active member’s annual payroll.
The Organization’s contributions to these employee benefits plans were as follows:
2016 2015
CalPERS $ 2,919,241 $ 2,407,936CalSTRS $ 6,145,506 $ 4,291,551TCRS Legacy $ 301,861 $ 366,599TCRS Hybrid $ 260,408 $ 108,893
Contributions to all plans equal 100% of the required contributions for each year.
Other Defined Contribution Plans:
During the fiscal year ended June 30, 2014, CalPERS informed the Organization that employees at three schools, Aspire Junior Collegiate Academy, Aspire Titan Academy, and Aspire Centennial College Preparatory Academy, would not be eligible for CalPERS benefits. The matter is currently being negotiated; however in October 2014, as a response to this decision from CalPERS, Aspire created a new 403(b) retirement plan, the Aspire Public Schools 403(b) CA Plan (CA Plan) to allow all California employees not eligible for CalPERS or CalSTRS to be eligible to receive discretionary employer contributions. All employees of the Organization are eligible to participate in the CA Plan, but only employees not eligible for any other employee benefit plan may receive employer contributions. The Organization contributed $104,069 and $41,121 to the CA Plan in the years ended June 30, 2016 and 2015, respectively.
The Organization also offers a 403(b) retirement plan for TN LLC employees, the Aspire Public Schools 403(b) TN Plan (TN Plan). All employees who normally work more than 20 hours a week and are not already enrolled in the TCRP retirement plan are eligible to participate in the TN Plan. The Organization will match a discretionary portion of the employers contributions, determined on an annual basis. The Organization contributed $120,560 and $32,859 to the TN Plan for the years ended June 30, 2016 and 2015, respectively.
The Organization also offers a 403(b) plan, the Aspire Public Schools 403(b) Plan, for all employees within the Organization. This plan does not allow employer contributions.

ASPIRE PUBLIC SCHOOLS
NOTES TO FINANCIAL STATEMENTS JUNE 30, 2016 AND 2015
25
12. RESTRICTED NET ASSETS At June 30, 2016 and 2015, temporarily restricted net assets consisted of unexpended grants restricted for various purposes. The Organization accrued a liability for a portion of grant funding that is due to be returned to the grantor, as the Organization did not spend the entire amount of grant funds associated with a specific project that was completed during the year ended June 30, 2015. These funds totaling $463,543 are shown as a reduction of temporarily restricted net assets on the statements of activities for the year ended June 30, 2015.
Temporarily restricted net assets are to be used for the following purposes:
2016 2015
Construction of facilities $ 9,766,190 $ 10,631,102School expansion 4,419,436 7,356,423Clean energy projects 4,145,311 3,268,032Aspire University development 3,553,351 -School improvement programs 1,117,987 4,151,665Other school programs 341,603 453,988Organizational stability - 7,000,000
Total $ 23,343,878 $ 32,861,210
13. JOINT VENTURES
For their California schools, the Organization participates in a joint venture under a joint powers agreement (JPAs) with the California Charter School Joint Powers Authority, doing business as charterSAFE (SAFE).
SAFE arranges for and provides workers’ compensation, property, and liability insurance coverage for their members, respectively. The JPA is governed by boards consisting of a representative from each member. The board controls the operations of the JPA, including selection of management and approval of operating budgets, independent of any influence by the member beyond their representation on the board. Each member pays a premium commensurate with the level of coverage requested and shares surpluses and deficits proportionate to their participation in the JPA.
SUMMARY OF JPA COVERAGE 1. Workers’ Compensation
JPA’s SIR: $1,000,000 Excess Insurance: To statutory limits

ASPIRE PUBLIC SCHOOLS
NOTES TO FINANCIAL STATEMENTS JUNE 30, 2016 AND 2015
26
2. Property
Organization Deductible: $1,000 Coverage: Building: $132,424,679 Contents: $5,186,652 Data processing: $7,303,547 Extra expense: $1,000,000 Business income: $1,000,000 Excess Insurance: None
3. Liability
Organization Deductible: $0 - $5,000
Coverage (SAFE- SIR) $1,000,000 (Insurance Company of the State of PA) $1,000,001 to $5,000,000 (SAFE) $5,000,001 to $25,000,000
Complete separate financial statements for the JPA may be obtained from:
SAFE 250 E. 1st Street, Suite 1000, Los Angeles, California 90012
The latest condensed financial information available for SAFE are as follows:
June 30, 2016 (Unaudited)
Total Assets $ 20,693,056
Total Liabilities $ 16,720,186Net Assets 3,972,870
Total Liabilities and Equity $ 20,693,056
Total Revenues $ 19,000,252Total Expenses 17,545,217
Net Increase in Net Assets $ 1,455,035

ASPIRE PUBLIC SCHOOLS
NOTES TO FINANCIAL STATEMENTS JUNE 30, 2016 AND 2015
27
14. CONTINGENCIES
The Organization has received state and federal funds for specific purposes that are subject to review and audit by the grantor agencies. Although such audits could generate disallowances under terms of the grants, it is believed that any reimbursement, if required, would not be material.
The Organization has various outstanding claims and litigation. However, based on consultation with legal counsel, management believes that the ultimate resolution of these matters will not have a material adverse effect on the Organization’s financial position or results of operations.
15. RELATED-PARTY TRANSACTIONS
The Organization’s CFO was a Board Member of charterSAFE (see Note 13) during the 2014/15 and 2015/16 fiscal year. The Organization paid $1,054,609 and $1,387,211 in premiums to charterSAFE during the years ended June 30, 2016 and 2015, respectively.
The Organization’s Board of Directors and their respective companies contributed $4,025,605 in the year ended June 30, 2015, to support the Organization’s ongoing operations and growth, with the most significant contribution of $3,710,919 in 2015 from the Pyramid Peak Foundation.
The Organization was member of a coalition of Charter Management Organizations (CMO’s) called The College Ready Promise (TCRP) designed to pool resources of schools that share the same objective of graduating all students college ready. TCRP was made up of four partnering CMO’s: Aspire Public Schools, Alliance College-Ready Public Schools, Green Dot Public Schools, and Partnerships to Uplift Communities. TCRP’s board of directors was made up of the top executives from each CMO, including the Organization’s former CEO. TCRP’s goal was to gain funding from foundations across the country, and disburse it to its members in order to assist them in carrying out their common goals. TCRP granted $23,646 in private funding to the Organization in the year ended June 30, 2015. TCRP has dissolved and is no longer a related party to the Organization.

SUPPLEMENTARY INFORMATION

Bay Area Schools
Central Valley Schools LA Schools
Tennessee Schools
Non Active Schools National Office
Total School Activity
CURRENT ASSETS:Cash and cash equivalents 14,308,638$ 16,442,734$ 15,331,334$ 835,305$ 611,128$ 221,138$ 47,750,277$ Restricted cash and cash equivalents - - - - - - - Accounts receivable 7,013,305 6,875,083 6,637,879 2,157,249 157,757 875,277 23,716,550 Foundation grants receivable, current portion - - - 4,000,000 - 156,250 4,156,250 Prepaid expenses and deposits 118,289 130,925 62,249 1,195 17,888 591,378 921,924 Intercompany receivable - 29,893 - 121,125 - 1,092,795 1,243,813
Total current assets 21,440,232 23,478,635 22,031,462 7,114,874 786,773 2,936,838 77,788,814
NON-CURRENT ASSETS:Restricted cash and cash equivalents 4,535,103 - - - - - 4,535,103 Foundation grants receivable, net 3,000,000 - - - - - 3,000,000 Deferred rent 255,084 669,084 152,498 - - - 1,076,666 Property and equipment, net 7,014,592 11,754,411 34,749,461 1,274,485 3,296,444 306,634 58,396,027
Other assets, net - - - - - 473,216 473,216
TOTAL ASSETS 36,245,011$ 35,902,130$ 56,933,421$ 8,389,359$ 4,083,217$ 3,716,688$ 145,269,826$
CURRENT LIABILITIES:Accounts payable 1,594,534$ 1,220,822$ 814,396$ 281,901$ 254,019$ 1,018,206$ 5,183,878$ Accrued expenses 1,488,274 1,349,873 1,844,085 796,518 37,650 2,011,958 7,528,358 Line of credit - - - 700,000 - - 700,000 Debt, current - 146,709 473,216 - - - 619,925 Intercompany payable 206,247 274,505 157,755 40,143 - 121,125 799,775
Total current liabilities 3,289,055 2,991,909 3,289,452 1,818,562 291,669 3,151,289 14,831,936
LONG-TERM LIABILITIES:Deferred rent - - 797,336 - 209,718 - 1,007,054 Debt, net 3,706,191 3,717,330 16,546,842 - - 1,400,000 25,370,363
Total liabilities 6,995,246 6,709,239 20,633,630 1,818,562 501,387 4,551,289 41,209,353
NET ASSETS:Unrestricted 18,070,572 27,200,389 34,405,820 2,151,371 3,581,830 (1,140,036) 84,269,946 Temporarily restricted 11,179,193 1,992,502 1,893,971 4,419,426 - 305,435 19,790,527
Total net assets 29,249,765 29,192,891 36,299,791 6,570,797 3,581,830 (834,601) 104,060,473
TOTAL LIABILITIES AND NET ASSETS 36,245,011$ 35,902,130$ 56,933,421$ 8,389,359$ 4,083,217$ 3,716,688$ 145,269,826$
School Operations Administration
ASPIRE PUBLIC SCHOOLS
CONSOLIDATING STATEMENT OF FINANCIAL POSITION, BY REGIONJUNE 30, 2016
Page 1 of 2
28
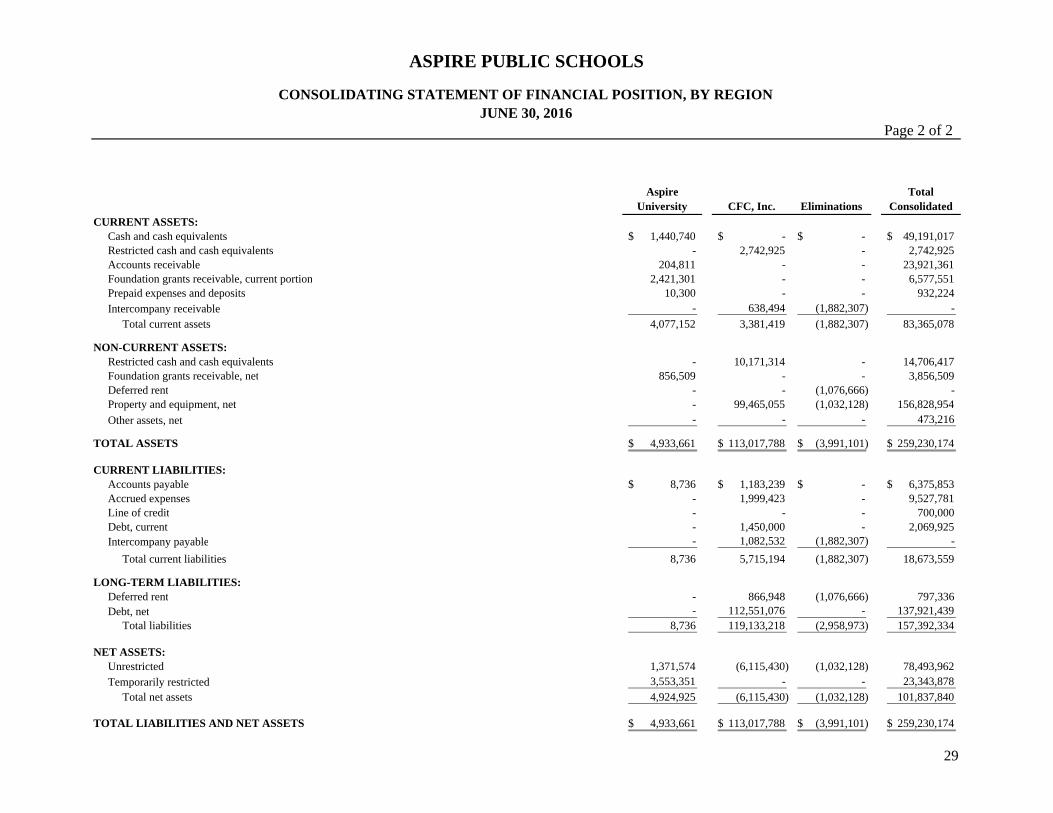
Aspire University CFC, Inc. Eliminations
Total Consolidated
CURRENT ASSETS:Cash and cash equivalents 1,440,740$ -$ -$ 49,191,017$ Restricted cash and cash equivalents - 2,742,925 - 2,742,925 Accounts receivable 204,811 - - 23,921,361 Foundation grants receivable, current portion 2,421,301 - - 6,577,551 Prepaid expenses and deposits 10,300 - - 932,224 Intercompany receivable - 638,494 (1,882,307) -
Total current assets 4,077,152 3,381,419 (1,882,307) 83,365,078
NON-CURRENT ASSETS:Restricted cash and cash equivalents - 10,171,314 - 14,706,417 Foundation grants receivable, net 856,509 - - 3,856,509 Deferred rent - - (1,076,666) - Property and equipment, net - 99,465,055 (1,032,128) 156,828,954
Other assets, net - - - 473,216
TOTAL ASSETS 4,933,661$ 113,017,788$ (3,991,101)$ 259,230,174$
CURRENT LIABILITIES:Accounts payable 8,736$ 1,183,239$ -$ 6,375,853$ Accrued expenses - 1,999,423 - 9,527,781 Line of credit - - - 700,000 Debt, current - 1,450,000 - 2,069,925 Intercompany payable - 1,082,532 (1,882,307) -
Total current liabilities 8,736 5,715,194 (1,882,307) 18,673,559
LONG-TERM LIABILITIES:Deferred rent - 866,948 (1,076,666) 797,336 Debt, net - 112,551,076 - 137,921,439
Total liabilities 8,736 119,133,218 (2,958,973) 157,392,334
NET ASSETS:Unrestricted 1,371,574 (6,115,430) (1,032,128) 78,493,962 Temporarily restricted 3,553,351 - - 23,343,878
Total net assets 4,924,925 (6,115,430) (1,032,128) 101,837,840
TOTAL LIABILITIES AND NET ASSETS 4,933,661$ 113,017,788$ (3,991,101)$ 259,230,174$
ASPIRE PUBLIC SCHOOLS
CONSOLIDATING STATEMENT OF FINANCIAL POSITION, BY REGIONJUNE 30, 2016
Page 2 of 2
29

CHANGES IN UNRESTRICTED NET ASSETSBay Area Schools
Central Valley Schools LA Schools
Tennessee Schools
Non Active Schools National Office
Total School Activity
SUPPORT AND REVENUE: Private grants and contributions 505,718$ 108,727$ 850$ 234,378$ -$ 2,243,579$ 3,093,252$ Donated equipment, materials, and services 147,867 6,000 - - - 5,058 158,925 Federal revenue 6,020,101 4,558,938 6,991,388 2,180,401 232,204 4,705,783 24,688,815 California State revenue
State aid portion of general purpose funding 23,809,620 28,572,249 26,144,630 - - - 78,526,499 All other state revenue 4,667,258 6,694,211 4,223,760 - 2,249 - 15,587,478
Tennessee State revenue Basic education program funding - - - 9,987,738 - - 9,987,738
Local revenue: Cash in-lieu of property taxes 7,751,643 7,443,465 8,465,643 - - - 23,660,751 Interest income 18,318 2,032 - - - (24) 20,326 All other local revenue 414,977 991,457 292,798 363,426 43 1,357,855 3,420,556
Subtotal 43,335,502 48,377,079 46,119,069 12,765,943 234,496 8,312,251 159,144,340 Net assets released from restrictions 14,177,506 10,243,313 15,314,567 3,631,302 - 12,484,699 55,851,387
Total support and revenue 57,513,008 58,620,392 61,433,636 16,397,245 234,496 20,796,950 214,995,727
EXPENSES AND LOSSESPROGRAM EXPENSES:
Educational programs 43,565,091 47,246,374 46,722,326 11,255,639 579,117 - 149,368,547
SUPPORTING SERVICES: Site support 1,023,429 835,076 884,501 3,107,023 - 9,326,261 15,176,290 Development and expansion 349,075 288,676 290,647 1,200,231 - 6,883,921 9,012,550 Administration and general 139,161 125,128 110,926 512,825 - 3,346,901 4,234,941 Cost allocations 1,681,997 4,443,260 586,712 - (3,060,015) (3,651,954) -
Total supporting services 3,193,662 5,692,140 1,872,786 4,820,079 (3,060,015) 15,905,129 28,423,781
Total expenses 46,758,753 52,938,514 48,595,112 16,075,718 (2,480,898) 15,905,129 177,792,328
Loss on debt extinguishment - - - - - - -
Total expenses and losses 46,758,753 52,938,514 48,595,112 16,075,718 (2,480,898) 15,905,129 177,792,328
TRANSFERS BETWEEN AFFILIATES (2,964,662) 186,241 (46,350) - - (5,232,505) (8,057,276)
Increase (Decrease) in Unrestricted Net Assets 7,789,593 5,868,119 12,792,174 321,527 2,715,394 (340,684) 29,146,123
CHANGES IN TEMPORARILY RESTRICTED NET ASSETS: Private grants and contributions 2,041,265 - - 689,525 - 557,106 3,287,896 Federal and state revenue 12,618,176 11,784,439 14,979,134 110,000 1,059 - 39,492,808 Interfund transfers (205,135) (616,565) (846,501) - (1,059) 1,669,260 - Net assets released from restrictions (14,177,506) (10,243,313) (15,314,567) (3,631,302) - (12,484,699) (55,851,387)
Increase (Decrease) in Temporarily Restricted Net Assets 276,800 924,561 (1,181,934) (2,831,777) - (10,258,333) (13,070,683)
INCREASE (DECREASE) IN NET ASSETS 8,066,393 6,792,680 11,610,240 (2,510,250) 2,715,394 (10,599,017) 16,075,440
NET ASSETS - Beginning of Year 21,183,372 22,400,211 24,689,551 9,081,047 866,436 9,764,416 87,985,033
NET ASSETS - End of Year 29,249,765$ 29,192,891$ 36,299,791$ 6,570,797$ 3,581,830$ (834,601)$ 104,060,473$
School Operations Administration
Page 1 of 2YEAR ENDED JUNE 30, 2016
CONSOLIDATING STATEMENT OF ACTIVITIES, BY REGION
ASPIRE PUBLIC SCHOOLS
30

CHANGES IN UNRESTRICTED NET ASSETSAspire
University CFC, Inc. EliminationsTotal
Consolidated
SUPPORT AND REVENUE: Private grants and contributions 2,862,230$ -$ (1,574,697)$ 4,380,785$ Donated equipment, materials, and services - - - 158,925 Federal revenue - - (648,573) 24,040,242 California State revenue
State aid portion of general purpose funding - - - 78,526,499 All other state revenue - - - 15,587,478
Tennessee State revenue Basic education program funding - - - 9,987,738
Local revenue: Cash in-lieu of property taxes - - - 23,660,751 Interest income - 6,859 - 27,185 All other local revenue 1,592,486 3,203,687 (5,687,758) 2,528,971
Subtotal 4,454,716 3,210,546 (7,911,028) 158,898,574 Net assets released from restrictions 501,746 - - 56,353,133
Total support and revenue 4,956,462 3,210,546 (7,911,028) 215,251,707
EXPENSES AND LOSSESPROGRAM EXPENSES:
Educational programs - 7,280,022 (3,203,686) 153,444,883
SUPPORTING SERVICES: Site support 1,409,285 - (2,260,262) 14,325,313 Development and expansion 1,590,751 - (2,447,080) 8,156,221 Administration and general 584,852 - - 4,819,793 Cost allocations - - - -
Total supporting services 3,584,888 - (4,707,342) 27,301,327
Total expenses 3,584,888 7,280,022 (7,911,028) 180,746,210
Loss on debt extinguishment - 15,753,640 - 15,753,640
Total expenses and losses 3,584,888 23,033,662 (7,911,028) 196,499,850
TRANSFERS BETWEEN AFFILIATES - 8,057,276 - -
Increase (Decrease) in Unrestricted Net Assets 1,371,574 (11,765,840) - 18,751,857
CHANGES IN TEMPORARILY RESTRICTED NET ASSETS: Private grants and contributions 4,055,097 - - 7,342,993 Federal and state revenue - - - 39,492,808 Interfund transfers - - - - Net assets released from restrictions (501,746) - - (56,353,133)
Increase (Decrease) in Temporarily Restricted Net Assets 3,553,351 - - (9,517,332)
INCREASE (DECREASE) IN NET ASSETS 4,924,925 (11,765,840) - 9,234,525
NET ASSETS - Beginning of Year - 5,650,410 (1,032,128) 92,603,315
NET ASSETS - End of Year 4,924,925$ (6,115,430)$ (1,032,128)$ 101,837,840$
ASPIRE PUBLIC SCHOOLS
CONSOLIDATING STATEMENT OF ACTIVITIES, BY REGIONYEAR ENDED JUNE 30, 2016
Page 2 of 2
31

Aspire Monarch Academy
Aspire Lionel Wilson
College Prep Academy
Aspire East Palo Alto Charter School
Aspire Triumph
Technology Academy
Aspire Berkley
Maynard Academy
Aspire Richmond California
College Prep Academy *
Aspire Richmond
Technology Academy **
Aspire Golden State College
Prep Academy
AspireERES
Academy
CURRENT ASSETS: Cash and cash equivalents 1,265,272$ 1,566,967$ 3,153,569$ 552,020$ 2,274,060$ 135,149$ 28,571$ 808,272$ 3,884,743$ Restricted cash and cash equivalents - - - - - - - - - Accounts receivable 723,316 1,080,592 1,088,876 463,438 768,699 345,001 587,093 872,365 451,893 Foundation grants receivable, current portion - - - - - - - - - Prepaid expenses and deposits 19,613 - 6,000 12,238 10,819 2,089 3,465 4,765 -
Intercompany receivable - - - - - - - - -
Total current assets 2,008,201 2,647,559 4,248,445 1,027,696 3,053,578 482,239 619,129 1,685,402 4,336,636
Restricted cash and cash equivalents - - 1,952,524 - - - - - 2,582,579 Foundation grants receivable, net - - 1,000,000 1,000,000 - - - - - Deferred rent - 84,839 68,018 - - - - 102,227 - Property and equipment, net 186,281 151,649 1,391,456 189,080 88,674 295,704 282,061 2,978,125 1,187,653 Other assets, net - - - - - - - - -
TOTAL ASSETS 2,194,482$ 2,884,047$ 8,660,443$ 2,216,776$ 3,142,252$ 777,943$ 901,190$ 4,765,754$ 8,106,868$
CURRENT LIABILITIES: Accounts payable 38,036$ 88,009$ 1,028,089$ 23,242$ 52,364$ 29,353$ 122,814$ 43,601$ 40,883$ Accrued expenses 142,446 171,782 234,378 110,788 185,323 162,608 112,368 137,650 74,392 Line of credit - - - - - - - - - Debt, current - - - - - - - - - Intercompany payable - 69,317 55,978 - - - - 80,952 -
Total current liabilities 180,482 329,108 1,318,445 134,030 237,687 191,961 235,182 262,203 115,275
LONG-TERM LIABILITIES: Deferred rent - - - - - - - - - Debt, net - - - - - - - - 3,706,191
Total liabilities 180,482 329,108 1,318,445 134,030 237,687 191,961 235,182 262,203 3,821,466
NET ASSETS: Unrestricted 1,803,602 2,291,496 3,046,722 1,007,753 2,693,617 585,982 619,989 4,293,403 441,074 Temporarily restricted 210,398 263,443 4,295,276 1,074,993 210,948 - 46,019 210,148 3,844,328
Total net assets 2,014,000 2,554,939 7,341,998 2,082,746 2,904,565 585,982 666,008 4,503,551 4,285,402
TOTAL LIABILITIES AND NET ASSETS 2,194,482$ 2,884,047$ 8,660,443$ 2,216,776$ 3,142,252$ 777,943$ 901,190$ 4,765,754$ 8,106,868$
*
** Aspire Richmond Technology Academy was a new charter that opened in the 2015/16 school year. Net assets of $258,889 were transferred from California Non Active Sites to Aspire
ASPIRE PUBLIC SCHOOLS
CONSOLIDATING STATEMENT OF FINANCIAL POSITIONJUNE 30, 2016
Page 1 of 6
NON-CURRENT ASSETS:
Richmond Technology Academy on July 1, 2015.
On June 30, 2015, Aspire California College Prep Academy closed its charter, and on July 1, 2015 students transferred to the newly opened Aspire Richmond California College Prep Academy. Net assets from the former school of $355,134 were transferred to the new school on July 1, 2015.
32

Aspire College Academy
Bay Area Regional
OfficeTotal Bay
Area Region
Aspire Vincent Shalvey
Academy
Aspire University
Charter School
Aspire Summit Charter
Academy
Aspire River Oaks Charter
School
Aspire Benjamin
Holt College Prep
Academy
Aspire Capitol Heights
Academy
CURRENT ASSETS: Cash and cash equivalents 557,030$ 82,985$ 14,308,638$ 1,802,694$ 1,470,464$ 1,224,800$ 559,057$ 1,128,925$ 753,926$ Restricted cash and cash equivalents - - - - - - - - - Accounts receivable 583,732 48,300 7,013,305 482,980 126,151 386,043 519,697 852,441 530,063 Foundation grants receivable, current portion - - - - - - - - - Prepaid expenses and deposits 11,000 48,300 118,289 6,000 8,311 28,696 6,257 8,500 13,765
Intercompany receivable - - - - - - - - -
Total current assets 1,151,762 179,585 21,440,232 2,291,674 1,604,926 1,639,539 1,085,011 1,989,866 1,297,754
NON-CURRENT ASSETS: Restricted cash and cash equivalents - - 4,535,103 - - - - - - Foundation grants receivable, net 1,000,000 - 3,000,000 - - - - - - Deferred rent - - 255,084 - - - 100,759 236,060 - Property and equipment, net 263,909 - 7,014,592 403,982 76,281 324,094 163,590 81,045 89,016 Other assets, net - - - - - - - - -
TOTAL ASSETS 2,415,671$ 179,585$ 36,245,011$ 2,695,656$ 1,681,207$ 1,963,633$ 1,349,360$ 2,306,971$ 1,386,770$
CURRENT LIABILITIES: Accounts payable 57,393$ 70,750$ 1,594,534$ 38,083$ 49,425$ 121,698$ 39,297$ 51,037$ 86,497$ Accrued expenses 94,636 61,903 1,488,274 101,814 58,732 106,411 106,438 119,830 85,418 Line of credit - - - - - - - - - Debt, current - - - - - - - - - Intercompany payable - - 206,247 - - - - - -
Total current liabilities 152,029 132,653 3,289,055 139,897 108,157 228,109 145,735 170,867 171,915
LONG-TERM LIABILITIES: Deferred rent - - - - - - - - - Debt, net - - 3,706,191 - - - - - -
Total liabilities 152,029 132,653 6,995,246 139,897 108,157 228,109 145,735 170,867 171,915
NET ASSETS: Unrestricted 1,240,002 46,932 18,070,572 2,111,719 1,354,651 1,654,340 1,202,459 2,034,058 1,139,210 Temporarily restricted 1,023,640 - 11,179,193 444,040 218,399 81,184 1,166 102,046 75,645
Total net assets 2,263,642 46,932 29,249,765 2,555,759 1,573,050 1,735,524 1,203,625 2,136,104 1,214,855
TOTAL LIABILITIES AND NET ASSETS 2,415,671$ 179,585$ 36,245,011$ 2,695,656$ 1,681,207$ 1,963,633$ 1,349,360$ 2,306,971$ 1,386,770$
ASPIRE PUBLIC SCHOOLS
CONSOLIDATING STATEMENT OF FINANCIAL POSITIONJUNE 30, 2016
Page 2 of 6
33

Aspire Rosa Parks
Academy
Aspire Langston Hughes
AcademyAspire Port
City Academy
Aspire Vanguard
College Prep Academy
Aspire Alexander Twilight
College Prep Academy
Aspire Alexander Twilight
Secondary Academy
Aspire APEX Academy
Central Valley Regional
OfficeTotal Central Valley Region
CURRENT ASSETS: Cash and cash equivalents 2,111,878$ 1,943,025$ 1,908,086$ 636,869$ 1,130,782$ 748,580$ 730,939$ 292,709$ 16,442,734$ Restricted cash and cash equivalents - - - - - - - - - Accounts receivable 466,722 988,352 547,665 248,555 590,351 627,035 468,794 40,234 6,875,083 Foundation grants receivable, current portion - - - - - - - - - Prepaid expenses and deposits 3,368 - 25,000 10,000 9,850 - 11,178 - 130,925
Intercompany receivable - - - - 29,893 - - - 29,893
Total current assets 2,581,968 2,931,377 2,480,751 895,424 1,760,876 1,375,615 1,210,911 332,943 23,478,635
NON-CURRENT ASSETS: Restricted cash and cash equivalents - - - - - - - - - Foundation grants receivable, net - - - - - - - - - Deferred rent - 124,279 74,724 - 73,650 59,612 - - 669,084 Property and equipment, net 9,338,287 159,594 99,902 73,907 366,864 252,799 265,344 59,706 11,754,411 Other assets, net - - - - - - - - -
TOTAL ASSETS 11,920,255$ 3,215,250$ 2,655,377$ 969,331$ 2,201,390$ 1,688,026$ 1,476,255$ 392,649$ 35,902,130$
CURRENT LIABILITIES: Accounts payable 98,884$ 137,772$ 63,832$ 58,757$ 156,152$ 180,244$ 87,295$ 51,849$ 1,220,822$ Accrued expenses 83,041 164,970 103,688 102,439 78,136 89,594 73,773 75,589 1,349,873 Line of credit - - - - - - - - - Debt, current 146,709 - - - - - - - 146,709 Intercompany payable - 100,593 57,363 - 56,549 60,000 - - 274,505
Total current liabilities 328,634 403,335 224,883 161,196 290,837 329,838 161,068 127,438 2,991,909
LONG-TERM LIABILITIES: Deferred rent - - - - - - - - - Debt, net 3,717,330 - - - - - - - 3,717,330
Total liabilities 4,045,964 403,335 224,883 161,196 290,837 329,838 161,068 127,438 6,709,239
NET ASSETS: Unrestricted 7,790,585 2,601,063 2,290,314 730,773 1,718,942 1,173,539 1,133,525 265,211 27,200,389 Temporarily restricted 83,706 210,852 140,180 77,362 191,611 184,649 181,662 - 1,992,502
Total net assets 7,874,291 2,811,915 2,430,494 808,135 1,910,553 1,358,188 1,315,187 265,211 29,192,891
TOTAL LIABILITIES AND NET ASSETS 11,920,255$ 3,215,250$ 2,655,377$ 969,331$ 2,201,390$ 1,688,026$ 1,476,255$ 392,649$ 35,902,130$
ASPIRE PUBLIC SCHOOLS
CONSOLIDATING STATEMENT OF FINANCIAL POSITIONJUNE 30, 2016
Page 3 of 6
34

Aspire Antonio
Maria Lugo Academy
Aspire Ollin University
Preparatory Academy
Aspire Junior Collegiate Academy
Aspire Titan Academy
Aspire Pacific Academy
Aspire Firestone Academy
Aspire Gateway Academy
Aspire Tate Academy
Aspire Inskeep
Academy
CURRENT ASSETS: Cash and cash equivalents 1,618,935$ 1,015,681$ 1,462,760$ 1,319,340$ 1,243,500$ 1,629,486$ 1,660,200$ 835,746$ 1,198,641$ Restricted cash and cash equivalents - - - - - - - - - Accounts receivable 915,412 782,559 621,930 444,194 1,053,088 477,833 506,627 422,362 347,907 Foundation grants receivable, current portion - - - - - - - - - Prepaid expenses and deposits - 14,790 3,245 - 2,225 3,033 3,570 - -
Intercompany receivable - - - - - - - - -
Total current assets 2,534,347 1,813,030 2,087,935 1,763,534 2,298,813 2,110,352 2,170,397 1,258,108 1,546,548
NON-CURRENT ASSETS: Restricted cash and cash equivalents - - - - - - - - - Foundation grants receivable, net - - - - - - - - - Deferred rent - - 59,825 61,313 31,360 - - - - Property and equipment, net 16,209,747 17,623,550 49,139 104,592 163,840 52,529 52,342 30,688 29,868 Other assets, net - - - - - - - - -
TOTAL ASSETS 18,744,094$ 19,436,580$ 2,196,899$ 1,929,439$ 2,494,013$ 2,162,881$ 2,222,739$ 1,288,796$ 1,576,416$
CURRENT LIABILITIES: Accounts payable 94,005$ 197,383$ 75,213$ 164,312$ 51,089$ 46,022$ 44,002$ 24,823$ 25,646$ Accrued expenses 197,590 231,033 123,962 129,128 166,616 138,253 166,848 136,107 116,926 Line of credit - - - - - - - - - Debt, current 212,141 261,075 - - - - - - - Intercompany payable - - 46,066 47,193 64,496 - - - -
Total current liabilities 503,736 689,491 245,241 340,633 282,201 184,275 210,850 160,930 142,572
LONG-TERM LIABILITIES: Deferred rent - - - - - - - - - Debt, net 8,017,297 8,529,545 - - - - - - -
Total liabilities 8,521,033 9,219,036 245,241 340,633 282,201 184,275 210,850 160,930 142,572
NET ASSETS: Unrestricted 10,027,647 10,117,865 1,707,717 1,346,322 2,018,969 1,783,940 1,810,575 966,118 1,268,612 Temporarily restricted 195,414 99,679 243,941 242,484 192,843 194,666 201,314 161,748 165,232
Total net assets 10,223,061 10,217,544 1,951,658 1,588,806 2,211,812 1,978,606 2,011,889 1,127,866 1,433,844
TOTAL LIABILITIES AND NET ASSETS 18,744,094$ 19,436,580$ 2,196,899$ 1,929,439$ 2,494,013$ 2,162,881$ 2,222,739$ 1,288,796$ 1,576,416$
Page 4 of 6
ASPIRE PUBLIC SCHOOLS
CONSOLIDATING STATEMENT OF FINANCIAL POSITIONJUNE 30, 2016
35

Aspire Slauson
Academy
Aspire Centennial
College Preparatory
AcademyLA Regional
OfficeTotal LA Region
California Non Active Sites ***
National Office
Total Aspire Public Schools
Aspire Hanley School #1
Aspire Hanley School #2
CURRENT ASSETS: Cash and cash equivalents 979,553$ 2,007,395$ 360,097$ 15,331,334$ 1,185,677$ 221,138$ 47,489,521$ 87,780$ 37,580$ Restricted cash and cash equivalents - - - - - - - - - Accounts receivable 401,984 663,983 - 6,637,879 128,639 875,277 21,530,183 754,919 859,617 Foundation grants receivable, current portion - - - - - 156,250 156,250 - - Prepaid expenses and deposits - - 35,386 62,249 5,700 591,378 908,541 - -
Intercompany receivable - - - - - 1,092,795 1,122,688 48,951 36,242
Total current assets 1,381,537 2,671,378 395,483 22,031,462 1,320,016 2,936,838 71,207,183 891,650 933,439
NON-CURRENT ASSETS: Restricted cash and cash equivalents - - - - - - 4,535,103 - - Foundation grants receivable, net - - - - - - 3,000,000 - - Deferred rent - - - 152,498 - - 1,076,666 - - Property and equipment, net 28,130 354,224 50,812 34,749,461 2,821,328 306,634 56,646,426 362,901 306,990 Other assets, net - - - - - 473,216 473,216 - -
TOTAL ASSETS 1,409,667$ 3,025,602$ 446,295$ 56,933,421$ 4,141,344$ 3,716,688$ 136,938,594$ 1,254,551$ 1,240,429$
CURRENT LIABILITIES: Accounts payable 32,669$ 35,221$ 24,011$ 814,396$ 235,668$ 1,018,206$ 4,883,626$ 62,086$ 49,201$ Accrued expenses 102,987 235,953 98,682 1,844,085 24,103 2,011,958 6,718,293 163,467 123,566 Line of credit - - - - - - - 350,000 350,000 Debt, current - - - 473,216 - - 619,925 - - Intercompany payable - - - 157,755 - 121,125 759,632 - -
Total current liabilities 135,656 271,174 122,693 3,289,452 259,771 3,151,289 12,981,476 575,553 522,767
LONG-TERM LIABILITIES: Deferred rent - 797,336 - 797,336 209,718 - 1,007,054 - - Debt, net - - - 16,546,842 - 1,400,000 25,370,363 - -
Total liabilities 135,656 1,068,510 122,693 20,633,630 469,489 4,551,289 39,358,893 575,553 522,767
NET ASSETS: Unrestricted 1,111,648 1,922,805 323,602 34,405,820 3,671,855 (1,140,036) 82,208,600 602,723 717,662 Temporarily restricted 162,363 34,287 - 1,893,971 - 305,435 15,371,101 76,275 -
Total net assets 1,274,011 1,957,092 323,602 36,299,791 3,671,855 (834,601) 97,579,701 678,998 717,662
TOTAL LIABILITIES AND NET ASSETS 1,409,667$ 3,025,602$ 446,295$ 56,933,421$ 4,141,344$ 3,716,688$ 136,938,594$ 1,254,551$ 1,240,429$
***
CONSOLIDATING STATEMENT OF FINANCIAL POSITION
As noted on Page 46, beginning net assets of $258,889 associated with Aspire Richmond Technology Academy were included in California Non Active Sites ending net assets at June 30, 2015.Additionally, on June 30, 2015 Aspire Huntington Park Charter School closed its charter and the ending net assets of $886,436 were transferred to California Non Active Sites on July 1, 2015.
Page 5 of 6
ASPIRE PUBLIC SCHOOLS
JUNE 30, 2016
36

Aspire Coleman
Elementary School
Tennessee Non Active
Sites
Tennessee Regional
OfficeTotal Aspire
TN, LLCAspire
University CFC, Inc. EliminationsTotal
Consolidated
CURRENT ASSETS: Cash and cash equivalents 571,697$ (574,549)$ 138,248$ 260,756$ 1,440,740$ -$ -$ 49,191,017$ Restricted cash and cash equivalents - - - - - 2,742,925 - 2,742,925 Accounts receivable 496,117 29,118 46,596 2,186,367 204,811 - - 23,921,361 Foundation grants receivable, current portion - - 4,000,000 4,000,000 2,421,301 - - 6,577,551 Prepaid expenses and deposits 595 12,188 600 13,383 10,300 - - 932,224
Intercompany receivable 7,239 - 28,693 121,125 - 638,494 (1,882,307) -
Total current assets 1,075,648 (533,243) 4,214,137 6,581,631 4,077,152 3,381,419 (1,882,307) 83,365,078
NON-CURRENT ASSETS: Restricted cash and cash equivalents - - - - - 10,171,314 - 14,706,417 Foundation grants receivable, net - - - - 856,509 - - 3,856,509 Deferred rent - - - - - - (1,076,666) - Property and equipment, net 425,927 475,116 178,667 1,749,601 - 99,465,055 (1,032,128) 156,828,954 Other assets, net - - - - - - - 473,216
TOTAL ASSETS 1,501,575$ (58,127)$ 4,392,804$ 8,331,232$ 4,933,661$ 113,017,788$ (3,991,101)$ 259,230,174$
CURRENT LIABILITIES: Accounts payable 88,445$ 18,351$ 82,169$ 300,252$ 8,736$ 1,183,239$ -$ 6,375,853$ Accrued expenses 157,823 13,547 351,662 810,065 - 1,999,423 - 9,527,781 Line of credit - - - 700,000 - - - 700,000 Debt, current - - - - - 1,450,000 - 2,069,925 Intercompany payable - - 40,143 40,143 - 1,082,532 (1,882,307) -
Total current liabilities 246,268 31,898 473,974 1,850,460 8,736 5,715,194 (1,882,307) 18,673,559
LONG-TERM LIABILITIES: Deferred rent - - - - - 866,948 (1,076,666) 797,336 Debt, net - - - - - 112,551,076 - 137,921,439
Total liabilities 246,268 31,898 473,974 1,850,460 8,736 119,133,218 (2,958,973) 157,392,334
NET ASSETS: Unrestricted 211,750 (90,025) 619,236 2,061,346 1,371,574 (6,115,430) (1,032,128) 78,493,962 Temporarily restricted 1,043,557 - 3,299,594 4,419,426 3,553,351 - - 23,343,878
Total net assets 1,255,307 (90,025) 3,918,830 6,480,772 4,924,925 (6,115,430) (1,032,128) 101,837,840
TOTAL LIABILITIES AND NET ASSETS 1,501,575$ (58,127)$ 4,392,804$ 8,331,232$ 4,933,661$ 113,017,788$ (3,991,101)$ 259,230,174$
Page 6 of 6JUNE 30, 2016
CONSOLIDATING STATEMENT OF FINANCIAL POSITION
ASPIRE PUBLIC SCHOOLS
37

CHANGES IN UNRESTRICTED NET ASSETS
Aspire Monarch Academy
Aspire Lionel Wilson
College Prep Academy
Aspire East Palo Alto Charter School
Aspire Triumph
Technology Academy
Aspire Berkley
Maynard Academy
Aspire Richmond California
College Prep Academy *
Aspire Richmond
Technology Academy **
Aspire Golden State College
Prep Academy
Aspire ERES
Academy
SUPPORT AND REVENUE: Private grants and contributions 1,295$ 10,650$ 469,225$ 1,565$ -$ 16,913$ 2,310$ 100$ 2,660$ Donated equipment, materials, and services - - 147,867 - - - - - - Federal revenue 568,663 712,586 966,353 325,786 658,819 760,715 595,176 637,138 386,872 California State revenue:
State aid portion of general purpose funding 2,275,709 3,054,646 4,827,852 1,813,769 2,725,070 1,421,684 1,447,594 3,200,130 1,148,258 All other state revenue 538,138 636,834 768,826 350,259 387,044 303,179 198,066 807,015 278,769
Tennessee State revenue:Basic education program funding - - - - - - - - -
Local revenue: Cash in-lieu of property taxes 779,248 1,040,282 1,099,732 544,592 1,052,564 535,757 572,435 1,131,284 434,445 Interest income - - 17,566 752 - - - - - All other local revenue 9,314 74,726 59,232 11,084 107,445 58,080 34,896 28,134 31,432
Subtotal 4,172,367 5,529,724 8,356,653 3,047,807 4,930,942 3,096,328 2,850,477 5,803,801 2,282,436 Net assets released from restrictions 963,367 1,288,850 1,771,280 504,666 1,037,166 364,334 575,277 6,682,383 633,054
Total support and revenue 5,135,734 6,818,574 10,127,933 3,552,473 5,968,108 3,460,662 3,425,754 12,486,184 2,915,490
EXPENSES AND LOSSESPROGRAM EXPENSES:
Educational programs 4,174,828 5,315,244 8,701,428 2,836,395 4,897,107 3,493,147 2,635,394 6,093,555 2,472,901
SUPPORTING SERVICES: Site support - - - - - - - - - Program development and expansion - - - - - - - - - Administration and general - - - - - - - - - Cost allocations 692,054 877,028 595,428 312,968 599,736 (263,334) 204,260 78,588 200,158
Total supporting services 692,054 877,028 595,428 312,968 599,736 (263,334) 204,260 78,588 200,158
Total expenses 4,866,882 6,192,272 9,296,856 3,149,363 5,496,843 3,229,813 2,839,654 6,172,143 2,673,059 Loss on debt extinguishment - - - - - - - - - Total expenses and losses 4,866,882 6,192,272 9,296,856 3,149,363 5,496,843 3,229,813 2,839,654 6,172,143 2,673,059
TRANSFERS BETWEEN AFFILIATES - (15,450) (15,450) - - - - (2,933,762) - Increase (Decrease) in Unrestricted Net Assets 268,852 610,852 815,627 403,110 471,265 230,849 586,100 3,380,279 242,431
CHANGES IN TEMPORARILY RESTRICTED NET ASSETS: Private grants and contributions 10,000 - 31,265 1,000,000 - - - - - Federal and state revenue 935,736 1,443,129 1,925,684 583,887 1,144,633 330,973 200,791 1,252,419 4,386,633 Interfund transfers (46,792) (1,316) (88,005) (106,970) (63,118) 33,360 195,505 (68,167) (26,110)
Net assets released from restrictions (963,367) (1,288,850) (1,771,280) (504,666) (1,037,166) (364,334) (575,277) (6,682,383) (633,054)
Increase (Decrease) in Temporarily Restricted Net Assets (64,423) 152,963 97,664 972,251 44,349 (1) (178,981) (5,498,131) 3,727,469
INCREASE (DECREASE) IN NET ASSETS 204,429 763,815 913,291 1,375,361 515,614 230,848 407,119 (2,117,852) 3,969,900
NET ASSETS - Beginning of Year 1,809,571 1,791,124 6,428,707 707,385 2,388,951 355,134 258,889 6,621,403 315,502
NET ASSETS - End of Year 2,014,000$ 2,554,939$ 7,341,998$ 2,082,746$ 2,904,565$ 585,982$ 666,008$ 4,503,551$ 4,285,402$
*
**
YEAR ENDED JUNE 30, 2016Page 1 of 6
ASPIRE PUBLIC SCHOOLS
CONSOLIDATING STATEMENT OF ACTIVITIES
Aspire Richmond Technology Academy was a new charter that opened in the 2015/16 school year. Beginning net assets of $258,889 were included in California Non Active Sites ending net assets at June 30, 2015.
On June 30, 2015, Aspire California College Prep Academy closed its charter, and on July 1, 2015 students transferred to the newly opened Aspire Richmond California College Prep Academy. Net assets from the former school of $355,134 were transferred to the new school on July 1, 2015. 38

CHANGES IN UNRESTRICTED NET ASSETSAspire College
Academy
Bay Area Regional
OfficeTotal Bay
Area Region
Aspire Vincent Shalvey
Academy
Aspire University
Charter School
Aspire Summit Charter
Academy
Aspire River Oaks Charter
School
Aspire Benjamin
Holt College Prep
Academy
Aspire Capitol Heights
Academy
SUPPORT AND REVENUE: Private grants and contributions 1,000$ -$ 505,718$ 61,802$ 584$ 1,095$ 21,097$ 8,608$ 5,729$ Donated equipment, materials, and services - - 147,867 - - - - 6,000 - Federal revenue 335,991 72,002 6,020,101 145,157 79,859 384,371 436,763 408,644 328,015 California State revenue:
State aid portion of general purpose funding 1,894,908 - 23,809,620 1,759,014 1,259,390 2,276,340 1,968,041 3,411,507 1,572,769 All other state revenue 399,128 - 4,667,258 491,617 186,419 578,796 547,886 964,975 328,293
Tennessee State revenue: - Basic education program funding - - - - - - - - -
Local revenue: - Cash in-lieu of property taxes 561,304 - 7,751,643 593,834 354,824 327,396 602,016 1,117,302 485,390 Interest income - - 18,318 28 195 303 (54) (52) - All other local revenue 634 - 414,977 90,957 25,112 102,713 63,885 169,107 48,573
Subtotal 3,192,965 72,002 43,335,502 3,142,409 1,906,383 3,671,014 3,639,634 6,086,091 2,768,769 Net assets released from restrictions 357,129 - 14,177,506 546,146 409,390 713,424 926,389 1,024,857 661,364
Total support and revenue 3,550,094 72,002 57,513,008 3,688,555 2,315,773 4,384,438 4,566,023 7,110,948 3,430,133
EXPENSES AND LOSSESPROGRAM EXPENSES:
Educational programs 2,945,092 - 43,565,091 3,054,834 2,092,068 3,618,396 3,623,652 5,420,808 2,858,248
SUPPORTING SERVICES: Site support - 1,023,429 1,023,429 - - - - - - Program development and expansion - 349,075 349,075 - - - - - - Administration and general - 139,161 139,161 - - - - - - Cost allocations 386,498 (2,001,387) 1,681,997 357,449 127,760 523,036 1,388,824 2,783,266 335,752
Total supporting services 386,498 (489,722) 3,193,662 357,449 127,760 523,036 1,388,824 2,783,266 335,752
Total expenses 3,331,590 (489,722) 46,758,753 3,412,283 2,219,828 4,141,432 5,012,476 8,204,074 3,194,000 Loss on debt extinguishment - - - - - - - - - Total expenses and losses 3,331,590 (489,722) 46,758,753 3,412,283 2,219,828 4,141,432 5,012,476 8,204,074 3,194,000
TRANSFERS BETWEEN AFFILIATES - - (2,964,662) - - - 670,765 (422,724) - Increase (Decrease) in Unrestricted Net Assets 218,504 561,724 7,789,593 276,272 95,945 243,006 224,312 (1,515,850) 236,133
CHANGES IN TEMPORARILY RESTRICTED NET ASSETS: Private grants and contributions 1,000,000 - 2,041,265 - - - - - - Federal and state revenue 414,291 - 12,618,176 992,805 613,065 793,292 925,031 1,158,843 721,174 Interfund transfers (33,522) - (205,135) (45,710) (31,777) (48,001) (46,814) (81,896) (33,662)
Net assets released from restrictions (357,129) - (14,177,506) (546,146) (409,390) (713,424) (926,389) (1,024,857) (661,364)
Increase (Decrease) in Temporarily Restricted Net Assets 1,023,640 - 276,800 400,949 171,898 31,867 (48,172) 52,090 26,148
INCREASE (DECREASE) IN NET ASSETS 1,242,144 561,724 8,066,393 677,221 267,843 274,873 176,140 (1,463,760) 262,281
NET ASSETS - Beginning of Year 1,021,498 (514,792) 21,183,372 1,878,538 1,305,207 1,460,651 1,027,485 3,599,864 952,574
NET ASSETS - End of Year 2,263,642$ 46,932$ 29,249,765$ 2,555,759$ 1,573,050$ 1,735,524$ 1,203,625$ 2,136,104$ 1,214,855$
ASPIRE PUBLIC SCHOOLS
CONSOLIDATING STATEMENT OF ACTIVITIESYEAR ENDED JUNE 30, 2016
Page 2 of 6
39

CHANGES IN UNRESTRICTED NET ASSETS
Aspire Rosa Parks
Academy
Aspire Langston Hughes
AcademyAspire Port
City Academy
Aspire Vanguard
College Prep Academy
Aspire Alexander Twilight
College Prep Academy
Aspire Alexander Twilight
Secondary Academy
Aspire APEX Academy
Central Valley
Regional Office
Total Central Valley Region
SUPPORT AND REVENUE: Private grants and contributions 897$ 475$ 288$ -$ 7,004$ 938$ 210$ -$ 108,727$ Donated equipment, materials, and services - - - - - - - - 6,000 Federal revenue 270,595 459,986 269,231 391,586 518,381 476,669 349,447 40,234 4,558,938 California State revenue:
State aid portion of general purpose funding 2,493,277 4,523,837 2,343,212 1,416,963 1,943,764 1,831,781 1,772,354 - 28,572,249 All other state revenue 254,940 986,428 561,311 215,350 616,184 562,698 399,314 - 6,694,211
Tennessee State revenue: - Basic education program funding - - - - - - - - -
Local revenue: Cash in-lieu of property taxes 391,220 726,565 410,606 714,793 735,109 675,260 309,150 - 7,443,465 Interest income 295 547 303 174 59 - 234 - 2,032 All other local revenue 44,156 123,083 102,033 89,567 65,522 41,755 24,994 - 991,457
Subtotal 3,455,380 6,820,921 3,686,984 2,828,433 3,886,023 3,589,101 2,855,703 40,234 48,377,079 Net assets released from restrictions 637,801 1,221,213 1,087,214 616,640 921,531 907,456 569,888 - 10,243,313
Total support and revenue 4,093,181 8,042,134 4,774,198 3,445,073 4,807,554 4,496,557 3,425,591 40,234 58,620,392
EXPENSES AND LOSSESPROGRAM EXPENSES:
Educational programs 3,242,822 6,225,690 3,916,405 2,849,727 3,968,157 3,718,073 2,657,494 - 47,246,374
SUPPORTING SERVICES: Site support - - - - - - - 835,076 835,076 Program development and expansion - - - - - - - 288,676 288,676 Administration and general - - - - - - - 125,128 125,128 Cost allocations 242,344 629,853 345,659 288,263 367,457 155,110 474,649 (3,576,162) 4,443,260
Total supporting services 242,344 629,853 345,659 288,263 367,457 155,110 474,649 (2,327,282) 5,692,140
Total expenses 3,485,166 6,855,543 4,262,064 3,137,990 4,335,614 3,873,183 3,132,143 (2,327,282) 52,938,514 Loss on debt extinguishment - - - - - - - - - Total expenses and losses 3,485,166 6,855,543 4,262,064 3,137,990 4,335,614 3,873,183 3,132,143 (2,327,282) 52,938,514
TRANSFERS BETWEEN AFFILIATES - (15,450) (15,450) - (15,450) (15,450) - - 186,241 Increase (Decrease) in Unrestricted Net Assets 608,015 1,171,141 496,684 307,083 456,490 607,924 293,448 2,367,516 5,868,119
CHANGES IN TEMPORARILY RESTRICTED NET ASSETS: Private grants and contributions - - - - - - - - - Federal and state revenue 710,667 1,353,047 1,220,805 674,430 1,003,968 983,935 633,377 - 11,784,439 Interfund transfers (40,441) (84,553) (44,472) (28,856) (47,915) (46,300) (36,168) - (616,565)
Net assets released from restrictions (637,801) (1,221,213) (1,087,214) (616,640) (921,531) (907,456) (569,888) - (10,243,313)
Increase (Decrease) in Temporarily Restricted Net Assets 32,425 47,281 89,119 28,934 34,522 30,179 27,321 - 924,561
INCREASE (DECREASE) IN NET ASSETS 640,440 1,218,422 585,803 336,017 491,012 638,103 320,769 2,367,516 6,792,680
NET ASSETS - Beginning of Year 7,233,851 1,593,493 1,844,691 472,118 1,419,541 720,085 994,418 (2,102,305) 22,400,211
NET ASSETS - End of Year 7,874,291$ 2,811,915$ 2,430,494$ 808,135$ 1,910,553$ 1,358,188$ 1,315,187$ 265,211$ 29,192,891$
ASPIRE PUBLIC SCHOOLS
CONSOLIDATING STATEMENT OF ACTIVITIESYEAR ENDED JUNE 30, 2016
Page 3 of 6
40

CHANGES IN UNRESTRICTED NET ASSETS
Aspire Antonio
Maria Lugo Academy
Aspire Ollin College Prep
Academy
Aspire Junior
Collegiate Academy
Aspire Titan
AcademyAspire Pacific
Academy
Aspire Firestone Academy
Aspire Gateway Academy
Aspire Tate Academy
Aspire Inskeep
Academy
SUPPORT AND REVENUE: Private grants and contributions -$ -$ 300$ -$ 100$ -$ -$ -$ -$ Donated equipment, materials, and services - - - - - - - - - Federal revenue 1,014,467 594,121 642,783 542,700 958,374 552,408 621,176 484,855 501,293 California State revenue:
State aid portion of general purpose funding 2,340,855 3,519,254 1,689,592 1,820,607 2,898,950 2,263,018 2,259,761 2,002,697 1,824,447 All other state revenue 177,516 404,333 436,502 473,655 659,898 293,790 287,522 249,317 257,843
Tennessee State revenue:Basic education program funding - - - - - - - - -
Local revenue: Cash in-lieu of property taxes 800,397 1,071,613 575,134 615,408 907,697 778,029 774,726 681,372 625,124 Interest income - - - - - - - - - All other local revenue 39,133 29,995 8,807 9,273 70,462 46,104 58,250 5,047 2,709
Subtotal 4,372,368 5,619,316 3,353,118 3,461,643 5,495,481 3,933,349 4,001,435 3,423,288 3,211,416 Net assets released from restrictions 6,729,842 1,310,182 639,336 569,167 1,122,798 1,041,859 938,937 825,954 784,593
Total support and revenue 11,102,210 6,929,498 3,992,454 4,030,810 6,618,279 4,975,208 4,940,372 4,249,242 3,996,009
EXPENSES AND LOSSESPROGRAM EXPENSES:
Educational programs 4,755,974 6,580,956 3,273,136 3,460,024 5,656,279 3,881,878 3,901,396 3,369,590 3,262,285
SUPPORTING SERVICES: Site support - - - - - - - - - Program development and expansion - - - - - - - - - Administration and general - - - - - - - - - Cost allocations (412,551) 314,383 203,681 270,900 328,946 570,927 563,556 474,183 473,157
Total supporting services (412,551) 314,383 203,681 270,900 328,946 570,927 563,556 474,183 473,157
Total expenses 4,343,423 6,895,339 3,476,817 3,730,924 5,985,225 4,452,805 4,464,952 3,843,773 3,735,442 Loss on debt extinguishment - - - - - - - - - Total expenses and losses 4,343,423 6,895,339 3,476,817 3,730,924 5,985,225 4,452,805 4,464,952 3,843,773 3,735,442
TRANSFERS BETWEEN AFFILIATES - - (15,450) (15,450) (15,450) - - - - Increase (Decrease) in Unrestricted Net Assets 6,758,787 34,159 500,187 284,436 617,604 522,403 475,420 405,469 260,567
CHANGES IN TEMPORARILY RESTRICTED NET ASSETS: Private grants and contributions Federal and state revenue 5,692,601 1,423,263 755,529 730,568 1,208,083 1,029,543 983,515 867,388 823,530 Interfund transfers (303,251) (68,941) (85,516) (113,608) (54,708) (48,739) (11,767) (38,629) (40,124)
Net assets released from restrictions (6,729,842) (1,310,182) (639,336) (569,167) (1,122,798) (1,041,859) (938,937) (825,954) (784,593)
Increase (Decrease) in Temporarily Restricted Net Assets (1,340,492) 44,140 30,677 47,793 30,577 (61,055) 32,811 2,805 (1,187)
INCREASE (DECREASE) IN NET ASSETS 5,418,295 78,299 530,864 332,229 648,181 461,348 508,231 408,274 259,380
NET ASSETS - Beginning of Year 4,804,766 10,139,245 1,420,794 1,256,577 1,563,631 1,517,258 1,503,658 719,592 1,174,464
NET ASSETS - End of Year 10,223,061$ 10,217,544$ 1,951,658$ 1,588,806$ 2,211,812$ 1,978,606$ 2,011,889$ 1,127,866$ 1,433,844$
Page 4 of 6YEAR ENDED JUNE 30, 2016
CONSOLIDATING STATEMENT OF ACTIVITIES
ASPIRE PUBLIC SCHOOLS
41

CHANGES IN UNRESTRICTED NET ASSETS
Aspire Slauson
Academy
Aspire Centennial
College Prep Academy
LA Regional Office
Total LA Region
California Non Active
Sites ***National
OfficeTotal Aspire
Public SchoolsAspire Hanley
School #1Aspire Hanley
School #2
SUPPORT AND REVENUE: Private grants and contributions -$ 450$ -$ 850$ -$ 2,243,579$ 2,858,874$ 55,874$ 77,991$ Donated equipment, materials, and services - - - - - 5,058 158,925 - - Federal revenue 465,520 542,805 70,886 6,991,388 148,094 4,705,783 22,424,304 781,065 733,360 California State revenue:
State aid portion of general purpose funding 1,841,518 3,683,931 - 26,144,630 - - 78,526,499 - - All other state revenue 241,043 742,341 - 4,223,760 2,249 - 15,587,478 - -
Tennessee State revenue: - Basic education program funding - - - - - - - 3,509,509 2,897,822
Local revenue: - Cash in-lieu of property taxes 627,133 1,009,010 - 8,465,643 - - 23,660,751 - - Interest income - - - - - (24) 20,326 - - All other local revenue 17,296 5,722 - 292,798 43 1,357,855 3,057,130 10,825 8,639
Subtotal 3,192,510 5,984,259 70,886 46,119,069 150,386 8,312,251 146,294,287 4,357,273 3,717,812 Net assets released from restrictions 796,280 555,619 - 15,314,567 - 12,484,699 52,220,085 598,730 555,000
Total support and revenue 3,988,790 6,539,878 70,886 61,433,636 150,386 20,796,950 198,514,372 4,956,003 4,272,812
EXPENSES AND LOSSESPROGRAM EXPENSES:
Educational programs 3,186,203 5,394,605 - 46,722,326 404,982 - 137,938,773 4,082,957 3,422,490
SUPPORTING SERVICES: Site support - - 884,501 884,501 - 9,326,261 12,069,267 412,052 339,755 Program development and expansion - - 290,647 290,647 - 6,883,921 7,812,319 - - Administration and general - - 110,926 110,926 - 3,346,901 3,722,116 - - Cost allocations 461,371 582,407 (3,244,248) 586,712 (3,060,015) (3,651,954) - 412,650 339,999
Total supporting services 461,371 582,407 (1,958,174) 1,872,786 (3,060,015) 15,905,129 23,603,702 824,702 679,754
Total expenses 3,647,574 5,977,012 (1,958,174) 48,595,112 (2,655,033) 15,905,129 161,542,475 4,907,659 4,102,244 Loss on debt extinguishment - - - - - - - - - Total expenses and losses 3,647,574 5,977,012 (1,958,174) 48,595,112 (2,655,033) 15,905,129 161,542,475 4,907,659 4,102,244
TRANSFERS BETWEEN AFFILIATES - - - (46,350) - (5,232,505) (8,057,276) - - Increase (Decrease) in Unrestricted Net Assets 341,216 562,866 2,029,060 12,792,174 2,805,419 (340,684) 28,914,621 48,344 170,568
CHANGES IN TEMPORARILY RESTRICTED NET ASSETS: Private grants and contributions - 557,106 2,598,371 - - Federal and state revenue 816,356 648,758 - 14,979,134 1,059 39,382,808 55,000 55,000 Interfund transfers (22,365) (58,853) - (846,501) (1,059) 1,669,260 - 500,000 500,000
Net assets released from restrictions (796,280) (555,619) - (15,314,567) - (12,484,699) (52,220,085) (598,730) (555,000)
Increase (Decrease) in Temporarily Restricted Net Assets (2,289) 34,286 - (1,181,934) - (10,258,333) (10,238,906) (43,730) -
INCREASE (DECREASE) IN NET ASSETS 338,927 597,152 2,029,060 11,610,240 2,805,419 (10,599,017) 18,675,715 4,614 170,568
NET ASSETS - Beginning of Year 935,084 1,359,940 (1,705,458) 24,689,551 866,436 9,764,416 78,903,986 674,384 547,094
NET ASSETS - End of Year 1,274,011$ 1,957,092$ 323,602$ 36,299,791$ 3,671,855$ (834,601)$ 97,579,701$ 678,998$ 717,662$
YEAR ENDED JUNE 30, 2016CONSOLIDATING STATEMENT OF ACTIVITIES
ASPIRE PUBLIC SCHOOLS
As noted on Page 46, beginning net assets of $258,889 associated with Aspire Richmond Technology Academy were included in California Non Active Sites ending net assets at June 30, 2015. Additionally, on June 30, 2015 Aspire Huntington Park Charter School closed its charter and net assets of $886,436 were transferred to California Non Active Sites on July 1, 2015.
***
Page 5 of 6
42

CHANGES IN UNRESTRICTED NET ASSETS
Aspire Coleman
Elementary School
Tennessee Non Active
Sites
Tennessee Regional
OfficeTotal Aspire
TN, LLCAspire
University CFC, Inc. EliminationsTotal
Consolidated
SUPPORT AND REVENUE: Private grants and contributions 75,707$ -$ 24,806$ 234,378$ 2,862,230$ -$ (1,574,697)$ 4,380,785$ Donated equipment, materials, and services - - - - - - - 158,925 Federal revenue 420,583 84,110 245,393 2,264,511 - - (648,573) 24,040,242 California State revenue:
State aid portion of general purpose funding - - - - - - - 78,526,499 All other state revenue - - - - - - - 15,587,478
Tennessee State revenue: - Basic education program funding 3,580,407 - - 9,987,738 - - - 9,987,738
Local revenue: Cash in-lieu of property taxes - - - - - - - 23,660,751 Interest income - - - - - 6,859 - 27,185 All other local revenue 13,651 - 330,311 363,426 1,592,486 3,203,687 (5,687,758) 2,528,971
Subtotal 4,090,348 84,110 600,510 12,850,053 4,454,716 3,210,546 (7,911,028) 158,898,574 Net assets released from restrictions 58,537 - 2,419,035 3,631,302 501,746 - - 56,353,133
Total support and revenue 4,148,885 84,110 3,019,545 16,481,355 4,956,462 3,210,546 (7,911,028) 215,251,707
EXPENSES AND LOSSESPROGRAM EXPENSES:
Educational programs 3,750,192 174,135 - 11,429,774 - 7,280,022 (3,203,686) 153,444,883
SUPPORTING SERVICES: Site support 420,764 1,934,452 3,107,023 1,409,285 - (2,260,262) 14,325,313 Program development and expansion - - 1,200,231 1,200,231 1,590,751 - (2,447,080) 8,156,221 Administration and general - - 512,825 512,825 584,852 - 4,819,793 Cost allocations 421,924 - (1,174,573) - - - - -
Total supporting services 842,688 - 2,472,935 4,820,079 3,584,888 - (4,707,342) 27,301,327
Total expenses 4,592,880 174,135 2,472,935 16,249,853 3,584,888 7,280,022 (7,911,028) 180,746,210 Loss on debt extinguishment - - - - - 15,753,640 - 15,753,640 Total expenses and losses 4,592,880 174,135 2,472,935 16,249,853 3,584,888 23,033,662 (7,911,028) 196,499,850
TRANSFERS BETWEEN AFFILIATES - - - - - 8,057,276 - - Increase (Decrease) in Unrestricted Net Assets (443,995) (90,025) 546,610 231,502 1,371,574 (11,765,840) - 18,751,857
CHANGES IN TEMPORARILY RESTRICTED NET ASSETS: Private grants and contributions - - 689,525 689,525 4,055,097 - - 7,342,993 Federal and state revenue - - - 110,000 - - - 39,492,808 Interfund transfers - - (1,000,000) - - - - -
Net assets released from restrictions (58,537) - (2,419,035) (3,631,302) (501,746) - - (56,353,133)
Increase (Decrease) in Temporarily Restricted Net Assets (58,537) - (2,729,510) (2,831,777) 3,553,351 - - (9,517,332)
INCREASE (DECREASE) IN NET ASSETS (502,532) (90,025) (2,182,900) (2,600,275) 4,924,925 (11,765,840) - 9,234,525
NET ASSETS - Beginning of Year 1,757,839 - 6,101,730 9,081,047 - 5,650,410 (1,032,128) 92,603,315
NET ASSETS - End of Year 1,255,307$ (90,025)$ 3,918,830$ 6,480,772$ 4,924,925$ (6,115,430)$ (1,032,128)$ 101,837,840$
Page 6 of 6
ASPIRE PUBLIC SCHOOLS
CONSOLIDATING STATEMENT OF ACTIVITIESYEAR ENDED JUNE 30, 2016
43

Aspire Aspire Aspire Aspire Richmond Aspire Aspire AspireAspire Lionel Wilson East Palo Alto Triumph Berkley California Richmond Golden State Aspire Aspire Total Vincent
Monarch College Prep Charter Technology Maynard College Prep Technology College Prep ERES College Bay Area ShalveyAcademy Academy School Academy Academy Academy Academy Academy Academy Academy Region Academy
Certificated salaries 1,637,082$ 2,066,376$ 3,395,133$ 1,212,208$ 2,238,685$ 1,578,194$ 1,000,141$ 2,296,702$ 1,057,229$ 1,238,656$ 17,720,406$ 1,512,857$
Classified salaries 707,013 720,873 1,367,444 540,928 741,895 435,123 369,311 733,495 420,897 403,809 6,440,788 258,012
Employee benefits 651,995 768,595 1,349,439 460,459 875,414 478,526 302,591 825,807 374,137 458,753 6,545,716 497,256
Books and supplies 627,636 586,044 1,018,021 279,896 521,417 235,160 378,536 447,123 285,704 370,058 4,749,595 280,604
Services and other operating expenses 503,812 1,146,020 1,508,440 299,680 464,525 716,585 523,668 1,666,186 317,425 392,905 7,539,246 390,727
Depreciation and amortization 47,290 27,336 62,951 43,224 55,171 49,559 61,147 124,242 17,509 80,911 569,340 115,378
Total 4,174,828$ 5,315,244$ 8,701,428$ 2,836,395$ 4,897,107$ 3,493,147$ 2,635,394$ 6,093,555$ 2,472,901$ 2,945,092$ 43,565,091$ 3,054,834$
Aspire Aspire Aspire Aspire Aspire Aspire Aspire Aspire Aspire AlexanderUniversity Summit River Oaks Benjamin Holt Capitol Rosa Langston Aspire Vanguard Alexander Twilight Aspire
Charter Charter Charter College Prep Heights Parks Hughes Port City College Prep Twilight Secondary APEXSchool Academy School Academy Academy Academy Academy Academy Academy College Prep Academy Academy
Certificated salaries 974,637$ 1,603,658$ 1,587,547$ 2,146,688$ 1,251,751$ 1,408,786$ 2,505,838$ 1,485,694$ 1,372,430$ 1,529,124$ 1,531,964$ 1,109,150$
Classified salaries 213,608 467,384 431,813 549,603 388,989 398,353 685,257 585,539 222,713 527,409 418,532 351,098
Employee benefits 342,997 584,437 557,895 764,608 497,121 518,171 945,736 633,557 492,114 575,201 581,076 437,259
Books and supplies 192,164 435,425 398,930 454,209 406,916 222,415 615,586 367,766 229,340 545,438 477,828 227,693
Services and other operating expenses 355,609 490,832 579,146 1,013,605 296,718 335,849 1,445,560 818,318 519,128 759,308 690,515 390,476
Depreciation and amortization 13,053 36,660 68,321 492,095 16,753 359,248 27,713 25,531 14,002 31,677 18,158 141,818
Total 2,092,068$ 3,618,396$ 3,623,652$ 5,420,808$ 2,858,248$ 3,242,822$ 6,225,690$ 3,916,405$ 2,849,727$ 3,968,157$ 3,718,073$ 2,657,494$
Program Expenses
Program Expenses
Page 1 of 3
CONSOLIDATING SCHEDULE OF FUNCTIONAL EXPENSES
ASPIRE PUBLIC SCHOOLS
YEAR ENDED JUNE 30, 2016
44

Total Aspire Aspire Aspire AspireCentral Antonio Ollin Junior Aspire Aspire Aspire Aspire Aspire Aspire Aspire CentennialValley Maria Lugo College Prep Collegiate Titan Pacific Firestone Gateway Tate Inskeep Slauson College PrepRegion Academy Academy Academy Academy Academy Academy Academy Academy Academy Academy Academy
Certificated salaries 20,020,124$ 1,871,330$ 2,337,561$ 1,263,617$ 1,320,055$ 2,083,207$ 1,602,206$ 1,701,694$ 1,317,532$ 1,331,040$ 1,306,350$ 2,189,515$
Classified salaries 5,498,310 570,577 1,063,728 472,278 440,974 862,048 695,441 603,841 724,819 643,827 622,664 748,710
Employee benefits 7,427,428 654,816 968,477 431,679 435,467 802,060 651,107 647,287 509,132 527,071 511,231 753,562
Books and supplies 4,854,314 758,803 750,612 445,078 494,011 579,763 545,325 559,994 546,716 474,333 471,123 694,375
Services and other operating expenses 8,085,791 418,374 891,116 643,378 743,822 1,284,676 377,392 378,211 257,546 271,290 260,691 963,746
Depreciation and amortization 1,360,407 482,074 569,462 17,106 25,695 44,525 10,407 10,369 13,845 14,724 14,144 44,697
Total 47,246,374$ 4,755,974$ 6,580,956$ 3,273,136$ 3,460,024$ 5,656,279$ 3,881,878$ 3,901,396$ 3,369,590$ 3,262,285$ 3,186,203$ 5,394,605$
Total Aspire Public Aspire Total AspireTotal California Schools Aspire Aspire Coleman Tennessee TN, LLC
Los Angeles Non Active Program Hanley Hanley Elementary Non Active Program Total
Region Sites Expenses School #1 School #2 School Sites Expenses CFC Inc. Eliminations Expenses
Certificated salaries 18,324,107$ 3,876$ 56,068,513$ 1,792,570$ 1,461,016$ 1,760,787$ 65,124$ 5,079,497$ -$ -$ 61,148,010$
Classified salaries 7,448,907 13,057 19,401,062 443,781 495,839 348,713 20,199 1,308,532 - - 20,709,594
Employee benefits 6,891,889 13,746 20,878,779 774,922 615,809 683,124 27,195 2,101,050 - - 22,979,829
Books and supplies 6,320,133 162,557 16,086,599 319,719 155,883 199,139 32,539 707,280 - - 16,793,879
Services and other operating expenses 6,490,242 221,445 22,336,724 686,808 633,454 700,398 29,078 2,049,738 4,545,189 (3,203,686) 25,727,965
Depreciation and amortization 1,247,048 (9,699) 3,167,096 65,157 60,489 58,031 - 183,677 2,734,833 - 6,085,606
Total 46,722,326$ 404,982$ 137,938,773$ 4,082,957$ 3,422,490$ 3,750,192$ 174,135$ 11,429,774$ 7,280,022$ (3,203,686)$ 153,444,883$
Program Expenses
Page 2 of 3
ASPIRE PUBLIC SCHOOLS
CONSOLIDATING SCHEDULE OF FUNCTIONAL EXPENSESYEAR ENDED JUNE 30, 2016
Program Expenses
45

Total Aspire Total AspireDevelopment Administrative Public Schools Development Administrative TN LLC
Site and and Supporting Site and and Supporting support expansion general Expenses support expansion general Expenses
Certificated salaries 3,361,734$ 1,171,283$ 588,230$ 5,121,247$ 681,797$ 199,982$ 81,851$ 963,630$
Classified salaries 4,146,824 3,056,092 1,267,901 8,470,817 563,031 173,375 42,906 779,312
Employee benefits 2,188,541 1,155,640 512,004 3,856,185 383,342 115,024 38,126 536,492
Books and supplies 582,740 - 582,740 1,165,480 32,623 - 32,623 65,246
Services and other operating expenses 1,717,426 2,358,411 699,239 4,775,076 1,436,496 702,116 307,290 2,445,902
Depreciation and amortization 72,002 70,893 72,002 214,897 9,734 9,734 10,029 29,497
Total 12,069,267$ 7,812,319$ 3,722,116$ 23,603,702$ 3,107,023$ 1,200,231$ 512,825$ 4,820,079$
Total AspireDevelopment Administrative University
Site and and Supporting Totalsupport expansion general Expenses CFC Inc Eliminations Consolidated
Certificated salaries 471,757$ 701,797$ 94,351$ 1,267,905$ -$ -$ 7,352,782$
Classified salaries 341,347 392,388 68,269 802,004 - - 10,052,133
Employee benefits 273,794 295,406 60,157 629,357 - - 5,022,034
Books and supplies 33,192 - 33,192 66,384 - - 1,297,110
Services and other operating expenses 289,195 201,160 328,883 819,238 - (4,707,342) 3,332,874
Depreciation and amortization - - - - - - 244,394
Total 1,409,285$ 1,590,751$ 584,852$ 3,584,888$ -$ (4,707,342)$ 27,301,327$
Aspire University
ASPIRE PUBLIC SCHOOLS
CONSOLIDATING SCHEDULE OF FUNCTIONAL EXPENSESYEAR ENDED JUNE 30, 2016
Aspire Public Schools Aspire TN LLC
Page 3 of 3
Supporting Services
46