CONSOLIDATED FINANCIAL STATEMENTS (IFRS) 2014 · 2015-02-28 · case-by-case basis whether and at...
134
CONSOLIDATED FINANCIAL STATEMENTS (IFRS) 2014
Transcript of CONSOLIDATED FINANCIAL STATEMENTS (IFRS) 2014 · 2015-02-28 · case-by-case basis whether and at...

CONSOLIDATED F INANCIAL STATEMENT S (IFRS)
2014


group management report
oper at ions and bus iness env ironment 0 2
analys is of ne t asse ts , f inanc ial p os i t ion
and results of oper at ions 2 1
outlook and forecast 3 1
shares and the cap i tal marke t 3 5
susta inable bus iness de velopment 39
r isk and opp ortun it y rep ort 47
statement on corp or ate governance and
corp or ate governance rep ort 56
subsequent e vents 7 7
f inanc ial statements
consol idated statement of income ( i frs) 80
consol idated statement of
comprehens ive income ( i frs) 8 1
consol idated bal ance shee t ( i frs) 8 2
consol idated statement changes in
stockholder ’s equ i t y ( i frs) 84
consol idated statement of cash flows ( i frs) 86
notes to the consol idated f inanc ial statements 88
resp ons ib i l i t y statement 1 2 6
aud itor ’s report 1 27
glossary 1 2 8
l ist of f igures and tables 1 3 1
TheContents
01
The Contents

Operations and Business Environment
Strategy and Group Management
STRATEGY AND OBJECTIVESMorphoSys’s goal is to build the most valuable biopharmaceutical pipeline in the biotech industry. Based on its powerful technology for the discovery of therapeutic antibodies, the Company has pro-duced more than 90 drug candidates in development, of which three are currently in pivotal studies. The majority of the develop-ment programs are conducted in partnership with leading phar-maceutical and biotechnology companies. MorphoSys uses the revenues generated from these partnerships to expand its propri-etary portfolio, which now compromises ten programs, two of which are already in clinical phase 2 trials*. Our strategy to de-velop compounds for partners was expanded many years ago to include the proprietary development of drug candidates up until commercialization. We will continue to execute our two-pillar
strategy to develop compounds for partners as well as proprietary drug candidates and to generate added value as we have done in the past.*SEE GL OSSARY page 1 2 8
The Proprietary Development segment first discovers and devel-ops antibody programs based on the Company’s proprietary tech-nology platforms or candidates which were in-licensed from other companies. During clinical development, a decision is made on a case-by-case basis whether and at what point a partnership for the drug candidate’s subsequent development and commercialization will be pursued. The drug candidate can then be either entirely out-licensed or developed further in cooperation with a pharma-ceutical or biotechnology company (co-development). In certain circumstances, individual projects can also be brought to the point of commercialization using internal resources.
During the 2014 financial year, MorphoSys successfully forged ahead with its strategy of building a broad pipeline of biopharmaceutical compounds. Advancing the proprietary portfolio within this pipeline was a key focus for the organization. We succeeded in in-licensing the bi-specific* antibody* MOR209/ES414, an innovative development candidate for the treatment of prostate cancer. The Company presented promising clinical data for its compound MOR208 in non-Hodgkin’s lymphoma. The projects initiated by our partners in the Partnered Discovery business segment also developed well, and the number of active development projects continued to increase. Although our partner Roche stopped a phase 3 study of the Alzheimer’s compound gantenerumab shortly before the end of 2014, two other clinical trials with this development candidate are continuing. This event highlights the strength of MorphoSys’s business model, namely to have a broad pipe-line of development candidates.
02GROUP MANAGEMENT REPORT
Operations and Business Environment

In the Partnered Discovery segment, MorphoSys develops opti-mized therapeutic antibodies, also based on its proprietary tech-nologies, for its partners in the pharmaceutical industry. The con-tractual payments that result include license fees for technologies and funded research as well as success-based payments and royal-ties* on product sales. The funds generated from these partner-ships support our long-term business model and secure a large portion of the funding for our proprietary development activities via the high number of programs in our pipeline.
Both segments are based on the Company’s innovative technolo-gies. The foremost growth drivers in these segments are HuCAL*, the industry’s most successful antibody library* measured by the number of clinical development candidates and the ensuing plat-form, Ylanthia*, which is currently the largest known antibody library based on the antibody Fab fragment. MorphoSys also uses its financial resources to expand and deepen its technological base through in-licensing. During the reporting year, for example, MorphoSys was able to expand its existing technology platform to include a very promising approach by acquiring the lanthipeptide technology from Lanthio Pharma.
In addition to investing in proprietary development and new tech-nologies, MorphoSys secures long-term growth by closely follow-ing the international biotechnology sector for acquisition candi-dates and in-licensing opportunities. The Company’s goal is to increase enterprise value by investing significantly in its propri-etary development activities while maintaining financial disci-pline and strict cost control.
GROUP MANAGEMENT AND PERFORMANCE INDICATORSMorphoSys uses both financial as well as non-financial indicators to manage the Group. These help monitor the success of strategic decisions and allow MorphoSys to promptly take the appropriate countermeasures when necessary. In addition, the management monitors and evaluates selected early indicators to give a thorough assessment of a project’s progress and quickly employs counter-measures if there are any undesirable developments.
FINANCIAL PERFORMANCE INDICATORS
Our financial performance indicators are described in detail in the section entitled “Analysis of Net Assets, Financial Position and Results of Operations.” Revenues and earnings before interest and taxes (EBIT) are the key financial indicators for measuring opera-tional business performance. The performance of both segments is ascertained monthly and budget planning for the current financial year is revised and updated quarterly. We also prepare a medi-um-term plan once a year that covers the following three years. A thorough cost analysis is carried out on an ongoing basis. The Company uses this analysis to monitor its adherence to financial targets and to make comparisons with previous periods.
The MorphoSys business performance is influenced by factors such as milestone and license payments, research and develop-ment (R&D) expenses, other operating cash flows, existing and expected liquidity and working capital. These indicators are also analyzed and evaluated on a routine basis, whereby the main focus is on the statement of income, existing and future liquidity and available investment opportunities. The net present value of in-vestments is determined using discounted cash flow models*.*SEE GL OSSARY page 1 2 8
TAB L E
01Development of
Financial Performance Indicators1
in million € 2014 2013 2012 2011 2010
MORPHOSYS GROUP
Revenues from continuing operations2 64.0 78.0 51.9 82.1 87.0
EBIT (Earnings before interest and taxes) from continuing operations3, 4 (5.9) 9.9 2.4 9.8 9.8
PROPRIETARY DEVELOPMENT
Segment revenues 15.0 26.9 7.0 2.4 1.8
Segment result (18.4) (0.5) (11.0) (32.2) (24.5)
PARTNERED DISCOVERY
Segment revenues 49.0 51.0 44.7 79.3 66.3
Segment result 25.9 25.4 23.0 55.7 42.7
1 Differences due to rounding2 Revenues of discontinued operations 2013 – 2011: 2013: € 0.6 million, 2012: € 17.7 million, 2011: € 18.7 million; 2010 total Group revenues3 2010: profit from operations4 Contains unallocated expenses (see also item 3.4 of the Notes): 2014: € 13.4 million, 2013: € 15.0 million, 2012: € 9.6 million, 2011: € 13.7 million,
2010: € 8.4 million incl. segment result AbD Serotec € +1.2 million
03GROUP MANAGEMENT REPORT
Operations and Business Environment

NON-FINANCIAL PERFORMANCE INDICATORS
Non-financial indicators are used equally for managing the Com-pany. For reporting purposes, MorphoSys uses Sustainable De-velopment Key Performance Indicators (SD KPIs) that are also recommended by the SD KPI standard. These include success in proprietary research and development (SD KPI 1) and achieve-ments in partnered programs as benchmarks for the commercial-ization rate (SD KPI 2). In the last five years, no products have been recalled and no fines or settlements have been imposed as the re-sult of disputes in the areas of product safety and product liability (SD KPI 3).
MorphoSys relies on the consistent progress of its product pipeline to secure its leading position in the market for therapeutics. This refers to both the number of therapeutic antibodies – 94 at the end
of the reporting year – as well as the progress of the development pipeline and the possible market potential. Since successful prod-ucts are based on first-class technologies, the progress of our tech-nology development forms another key performance indicator. Not only the quality of research and development, but also the profes-sional management of partnerships is at the heart of success. This is true for new contracts as well as for the further strategic devel-opment of existing alliances. Details on these performance indica-tors can be found in the section “Research and Development and Business Development” (page 12).
The non-performance indicators described in detail in the chapter “Sustainable Business Development” (page 39) are also used to manage the MorphoSys Group successfully.
TAB L E
02Sustainable Development of Key Performance Indicators
(SD KPIs) at MorphoSys (31 December)
2014 2013 2012 2011 2010
PERFORMANCE IN PROPRIETARY R&D (NUMBER OF INDIVIDUAL ANTIBODIES)
Programs in Discovery 5 3 2 2 5
Programs in Preclinic 2 0 0 0 1
Programs in Phase I 1 1 1 2 1
Programs in Phase II 2 2 2 1 1
TOTAL 10 6 5 5 8
PERFORMANCE IN PARTNERED PROGRAMS (NUMBER OF INDIVIDUAL ANTIBODIES)
Programs in Discovery 40 37 34 30 32
Programs in Preclinic 25 22 20 24 20
Programs in Phase I 8 6 8 9 10
Programs in Phase II 8 8 6 6 4
Programs in Phase III 3 2 1 0 0
TOTAL 84 75 69 69 66
R&D EXPENSES (IN MILLION €)
R&D Expenses on behalf of Partners 19.6 17.5 16.0 19.1 18.9
Proprietary Development Expenses 33.5 27.5 18.1 33.9 25.9
Expenses for Technology Development 2.9 4.2 3.6 2.9 2.1
TOTAL 56.0 49.2 37.7 55.9 46.9
04GROUP MANAGEMENT REPORT
Operations and Business Environment

LEADING INDICATORS
MorphoSys monitors a variety of leading indicators concerning the macroeconomic environment, the industry and the Company itself on a monthly basis. On a company level, economic data on the progress of individual programs is gathered for both segments. For macroeconomic leading indicators, MorphoSys relies on general market data from external financial studies which are reviewed for industry transactions, changes in the legal environment and the availability of research funds.
A joint steering committee meets regularly concerning each active collaboration. The role of this committee is to update and monitor the programs’ progress and the emergence of any potential mile-stone payments. These ongoing reviews give us the opportunity to intervene early on when any negative developments occur and also provide us with information on expected milestone payments at a very early stage. For non-active collaborations, the partner prepares a report that helps MorphoSys track the status of ongoing therapeutic programs.
In the area of business development, market analysis provides early indicators and helps determine the market’s demand for new technologies. Permanent monitoring of the market allows MorphoSys to react to trends and demands at an early stage and initiate its own new activities or partnerships.
Prior to the development of a therapeutic product, a target product profile (TPP) is created and updated continually in the course of the development process. This procedure provides an early indica-tion of the properties a product must have in order to be successful in the market. Important questions are also clarified during this process, such as the level of efficacy to be achieved, whether an improvement in the safety profile is at the center of development, or whether the focus should be on a change in the dosage form of the drug candidate. A detailed description of the product’s possible market positioning and the relevant patient groups are also part of the TPP. Permanent monitoring of criteria and their fulfillment ensure that the most important factors are considered during product development and that changes can be responded to in a timely manner.
Business Activities
DRUG DEVELOPMENTMorphoSys develops drugs using its own research and develop-ment as well as in cooperation with pharmaceutical and biotech-nology partners. The development of new treatments for patients who suffer from serious diseases is our core business activity. With a total of 94 individual therapeutic antibody programs at the end of 2014, three of which are in pivotal phase 3 trials, the Com-pany possesses one of the broadest pipelines in the industry.
TECHNOLOGIESMorphoSys has developed a number of technologies which offer direct access to fully human* antibodies for the treatment of dis-eases. The most widely-known technologies of MorphoSys include HuCAL, which is a collection of billions of fully human antibodies and a system for their optimization. Ylanthia, the next generation of antibody technology from MorphoSys, is currently the largest known antibody library in Fab format*, and is based on an innova-tive concept for the generation of highly specific and fully human antibodies. MorphoSys believes Ylanthia will establish a new stan-dard in the pharmaceutical industry’s development of therapeutic antibodies in this decade and beyond. Through Slonomics*, MorphoSys has a patented, fully automated technology for gene synthesis and modification for the generation of highly diverse gene libraries in a controlled process. The lanthipeptide technol-ogy acquired in the reporting year is a valuable addition to our existing library of antibodies and opens up new possibilities to search for potential drugs comprising stabilized peptides. *SEE GL OSSARY page 1 2 8
05GROUP MANAGEMENT REPORT
Operations and Business Environment

PROPRIETARY DEVELOPMENTAn important goal of the Company is to generate higher enterprise value through the proprietary development of innovative antibod-ies. Table 3 gives a summary of the proprietary clinical product candidates that are being developed for the indications of inflam-matory diseases and cancer.
ONCOLOGY
The ability of monoclonal antibodies* to bind specific antigens has led to their dominant position in the field of targeted cancer thera-pies. The global market for innovative biological therapies for can-cer treatment is growing rapidly. Two of the MorphoSys propri-etary cancer programs, MOR208 and MOR202 are currently in clinical development.
The MorphoSys antibody MOR208 is directed against the target* molecule CD19*, which is of special interest with regard to many B-cell malignancies. According to the market research firm, Deci-sion Resources, the therapeutic market for the B-cell malignancy non-Hodgkin’s lymphoma will reach a size of approximately US$ 10 billion in 2022. Current biological therapies for the treat-ment of B-cell malignancies, including the blockbuster rituximab (trade name Rituxan®) and the antibody obinutuzumab (trade name Gazyva®), are directed against the CD20* target molecule.
Since CD19 is expressed on a larger number of B-cell subtypes in comparison to CD20, the CD19 antibodies may provide a better therapeutic approach. MOR208 was further improved by chang-ing the constant Fc part* of the antibody. This modification leads to both a higher antibody-dependent cell-mediated cytotoxicity (ADCC*) as well as to an improvement in antibody-dependent cel-lular phagocytosis (ADCP*). The most advanced therapeutic ap-proach against CD19 is the bi-specific* antibody blinatumomab (trade name Blincyto™) which received approval in the reporting year for the indication acute lymphoblastic leukemia (ALL*). Other clinical programs directed against the same target molecule use alternative approaches in order to increase the efficacy of the anti-body, e.g. coupling with toxic substances or a change in the anti-body’s glycosylation pattern. Another therapeutic approach against CD19 is the CAR-T* technology. This immune therapy extracts immune cells (T cells) from the patient’s blood. The T cells are subsequently altered outside of the body so that they can be better directed to and kill the patient’s tumor cells. When these T cells are later re-administered to the patient’s blood by infusion, they bind the targeted cancer cells and destroy them. In the area of B-cell malignancies, different approaches with small molecules* are also being developed.*SEE GL OSSARY page 1 2 8
06GROUP MANAGEMENT REPORT
Operations and Business Environment
F I G URE
01 Revenues of the
MorphoSys Group by Segment
1 Group revenues from con-tinuing operations; Sale of AbD Serotec to Bio-Rad was announced in 2012, and therefore respective revenues were re-classi-fied as discontinued opera-tions from 2011 onwards in accordance with IFRS 5
propr ie tary de velopment partnered d i sc ov ery ab d serotec
T O TA L
in million €
64.0
T O TA L
in million €
78.01
15.0
26.9
49.051.0
100.0
90.0
80.0
70.0
60.0
50.0
40.0
30.0
20.0
10.0
0
20142013
T O TA L
in million €
87.0
1.8
66.3
20.2
T O TA L
in million €
82.11
2.4
79.3T O TA L
in million €
51.91
7.0
44.7
2010 2011 2012

MorphoSys’s antibody MOR202 is currently being developed for the treatment of multiple myeloma* (MM) and is directed against the CD38* target molecule. This project was successfully brought into a partnership with Celgene in 2013. Measured in terms of frequency of occurrence, MM is a relatively small area of oncology. Nevertheless, the MM market has shown impressive revenues in recent years and represents a potential market of more than US$ 9 billion in 2015. Significant achievements in clinical practice and the introduction of effective and highly priced pharmaceutical products have led to an expansion of the market. However, com-pared with the compounds currently available, there is still un-tapped market potential in terms of developing different forms of therapy for improving the chances of survival and reducing side effects. Despite much higher survival rates, the disease is seldom curable and a majority of patients experience a relapse. This has led to a particularly high demand for alternative treatments, such as those that target the CD38 surface antigen. Apart from MOR202, the industry has two other clinical development programs target-ing CD38.
In August 2014, a co-development and co-promotion agreement for MOR209/ES414 was signed with Emergent BioSolutions. The compound will be developed for patients suffering from metastatic castration-resistant prostate cancer (mCRPC*). MOR209/ES414 is a bi-specific anti-PSMA/anti-CD3* antibody based on Emergent’s ADAPTIRTM platform. The immunotherapeutic protein* activates the patient’s T-cell immunity against prostate cancer cells ex-pressing prostate specific membrane antigen (PSMA). This anti-gen* is commonly overexpressed in prostate cancer cells. The an-ti-CD3 binding domains of the molecule selectively bind to the T cell receptor on cytotoxic T cells which become activated when the anti-PSMA binding domains crosslink them to the cancer cells. The two pairs of binding domains of MOR209/ES414 are linked to opposite ends of an immunoglobulin Fc domain to extend the com-pound’s half-life and enable the use of a purification process typi-cal of immunoglobulin-based molecules. Prostate cancer is the most common cancer in men with approximately 900,000 new cases annually worldwide. As preclinical* in vitro and in vivo studies have shown, MOR209/ES414 redirects T cell cytotoxicity towards prostate cancer cells expressing PSMA.
INFLAMMATORY AND AUTOIMMUNE DISEASES
Chronic inflammatory and autoimmune diseases affect millions of patients worldwide and pose a considerable social and economic burden. The IMS Institute for Healthcare Informatics (IMS Health) forecasts a world market for the treatment of autoimmune diseases of US$ 33 – 36 billion by the year 2016.
MOR103, the antibody fully out-licensed by MorphoSys to GlaxoSmithKline (GSK) in 2013, is targeted against the GM-CSF* (granulocyte macrophage colony-stimulating factor) target mole-cule – a central factor in the emergence of inflammatory diseases such as rheumatoid arthritis* and multiple sclerosis* (MS). The market for drugs treating rheumatoid arthritis has tremendous commercial potential. Biotechnologically produced drugs already comprise the major part of the total revenues achieved in this market. The market overall is growing continuously. Datamonitor expects the RA-market to reach US$ 18 billion by the year 2020. Currently, the best-selling MS drugs have combined annual reve-nues of approximately US$ 11 billion, and the market is expected to continue to grow. MOR103 has the potential to become the first member of the anti-GM-CSF antibody class of drugs. Comparable drugs currently in development are targeted against the GM-CSF molecule or against the GM-CSF receptor.
New mechanisms for treating inflammatory diseases such as rheumatoid arthritis, osteoporosis or osteoarthritis are being ex-amined in cooperation with the Belgian company Galapagos NV with the aim of developing new antibody therapies to treat these diseases. The first candidate from this cooperation – MOR106 – entered preclinical development in the reporting year. Both com-panies contribute their core technologies and expertise as part of this alliance. In accordance with the agreement, Galapagos and MorphoSys share research and development costs and all future revenues equally.
INFLUENCING FACTORS
Proper medical care for the public is the stated objective of many countries, and the need for new forms of therapy continues to grow in the face of demographic change. However, cost-cutting could slow down the industry’s development. As part of their austerity measures, governments in Europe, the United States and Asia have stepped up their healthcare controls and are monitoring drug reimbursement closely.
As already seen in the field of small molecule drugs, generic com-petition is now becoming an increasing challenge in the biotech-nology industry due to the expiry of patent protection for drugs. The technical barriers to copying bioengineered drugs remain high. Nevertheless, many drug manufacturers, particularly those from Europe and Asia, are now penetrating this market and plac-ing more competitive pressure on established biotechnology companies. According to a study by IMS Health, the global market for biosimilars* will grow from US$ 693 million in 2011 to US$ 4 – 6 billion by 2016.*SEE GL OSSARY page 1 2 8
07GROUP MANAGEMENT REPORT
Operations and Business Environment

TAB L E
03Proprietary1
Clinical Product Candidates
MOR1032 MOR202 MOR208 MOR209/ES414
Compound
• HuCAL antibody against the GM-CSF (granulo-cyte macrophage colony-stimulating fac-tor) cytokine, a target molecule for a broad range of inflammatory diseases
• Out-licensed in 2013
• HuCAL antibody against CD38, a target mole-cule for the treatment of multiple myeloma and certain leukemias
• Entered into a coopera-tion agreement for further development in 2013
• Humanized, Fc-opti-mized anti-CD 19 anti-body for the treatment of B-cell malignancies
• In-licensed in 2010
• Bi-specific anti-PSMA/ anti-CD3 antibody based on Emergent’s ADAPTIR™ platform
• Entered into a cooperation agreement for further development in 2014
Characteris-tics
• Targets both monocytes and macrophages
• Extremely high binding affinity
• Rapid therapeutic effect
• Binds to a unique epi-tope
• Cytotoxic effects cause death of cancer cells
• Preclinical trials show a synergistic effect with pomalidomide and lena-lidomide
• Administration via 2-hour infusion
• Fc-optimization triggers significantly higher immune response by means of antibody- dependent cellular cytotoxicity (ADCC)
• Favorable form of administration
• Simple method of production
• Directs cytotoxic T cells against prostate cancer cells expressing pros-tate-specific membrane antigen (PSMA)
• Promising preclinical in vitro and in vivo data
Funding
Global licensing agree-ment with GSK • GSK is responsible for
all further development and promotion of MOR103 in all indica-tions
• MorphoSys received an upfront payment of € 22.5 million in 2013
• Entitled to receive addi-tional milestone pay-ments from GSK of up to € 423 million as well as tiered double-digit royalties on net sales
Co-development and co-promotion with Celgene• Both companies co-
develop MOR202 globally; cost sharing is 2/3 Celgene and 1/3 MorphoSys
• Upfront payment of € 70.8 million plus equity investment of € 46.2 million
• Milestone-related payments of up to € 511 million
• A 50:50 share in profits from promotion in Europe; outside this market, MorphoSys receives tiered dou-ble-digit royalties on net sales
Completely under the control of MorphoSys • Current funding is
completely provided by MorphoSys
Co-development and co- promotion with Emergent• MorphoSys has global
promotion rights with the exception of the USA and Canada (promotion rights for Emergent)
• Emergent received upfront payment of US$ 20 million and is entitled to potential milestone payments of up to US$ 163 million
• 64 % of development costs are borne by MorphoSys and 36 % by Emergent
• Emergent receives low- single-digit royalties on product sales in the MorphoSys sales regions and MorphoSys receives tiered royalties in the mid-single-digit percentage range up to 20 % on product sales in Emergent’s sales regions
Current Status
• Phase 1b/2a trial for rheumatoid arthritis completed successfully
• Phase 1b trial in multi-ple sclerosis completed successfully
• Expansion of the phase 1/2a trial in patients with multiple myeloma with lenalidomide and pomalidomide as new combination partner
• First clinical data ex-pected in H1/2015
• Promising data on NHL* with 4 subtypes pre-sented in December 2014
• Data on ALL trial with 30 patients expected in H1/2015
• Phase 2 combination trial with lenalidomide in CLL* performed in-dependently by Ohio State University (IST*)
• Initiation of a clinical phase 1 trial planned in early 2015 by our partner Emergent with up to 130 patients with metastatic castra-tion-resistant prostate cancer (mCRPC)
1 MorphoSys has control/owns the patent rights for the development candidate2 In 2013, MOR103 was completely out-licensed to GlaxoSmithKline. After the conclusion of the license agreement, MorphoSys was still responsible for the
clinical development of MOR103 in multiple sclerosis in a phase 1b clinical trial. The trial data was presented in September 2014. With the completion of this trial, the compound’s further development lies entirely with GSK.
*SEE GL OSSARY page 1 2 8
08GROUP MANAGEMENT REPORT
Operations and Business Environment

PARTNERED DISCOVERYIn the Partnered Discovery segment, MorphoSys uses technolo-gies for the research, development and optimization of therapeutic antibodies as drug candidates in extensive partnerships with pharmaceutical and biotechnology companies. While the develop-ment costs are borne by the respective partners, MorphoSys is compensated in the form of research financing, milestone pay-ments and potential royalties on product sales of successful pro-grams.
The strategic alliance formed with Novartis in 2007 – a pharma-ceutical partner with a growing pipeline of biotechnologically developed drugs – is the Company’s largest alliance to date. This alliance was expanded in 2012 by a further agreement under which the companies will collaborate in the use of MorphoSys’s next generation antibody platform Ylanthia, in order to create therapeutic antibodies.
Developing drugs with partners provides MorphoSys with the opportunity to be involved in indications for which the Company lacks proprietary expertise and would normally not pursue a pro-gram itself. Examples of this are:
With the HuCAL antibody bimagrumab, developed by its partner Novartis, MorphoSys has a promising treatment in its pipeline for sporadic inclusion body myositis* (sIBM*) and other muscle- wasting disorders. This antibody is currently in a pivotal phase 2/3 trial and received the “breakthrough therapy designation” from the US Food and Drug Administration (FDA*), and was also awarded the “orphan drug designation” (in Europe and the USA) for the indication of sIBM.*SEE GL OSSARY page 1 2 8
With the HuCAL antibody gantenerumab, developed by its part-ner Roche, MorphoSys has a promising treatment for Alzheimer’s disease in its pipeline. Both of the compound’s most advanced trials are examining ways to achieve a positive benefit by inter-vening at an early stage in the disease’s progression. Roche is evaluating the compound in approx. 1,000 patients with mild Alzheimer’s disease. In a second trial, run by the Dominantly In-herited Alzheimer Network (DIAN), the safety, tolerability and bio-marker efficacy in individuals who have a genetic predisposition for Alzheimer’s disease are being assessed. In December 2014, Roche announced the termination of a third phase 3 trial of the compound in prodromal Alzheimer’s patients. The decision was based on a pre-planned futility analysis and a recommendation by the independent Data Monitoring Committee. Currently, there are no drugs that fundamentally improve the course of Alzheimer’s disease, i.e. there is still high unmet medical need for new treat-ment options in this indication.
During this reporting year, guselkumab, a HuCAL antibody against psoriasis developed by MorphoSys’ partner Janssen, was brought into phase 3 clinical development. Three different pivotal studies are expected to be completed in 2016.
09GROUP MANAGEMENT REPORT
Operations and Business Environment

TAB L E
04Market Data from Selected Phase 2 and Phase 3 Part-nered Programs
Program NameMorphoSys Partner Indication Market Potential
Bimagrumab/BYM338
Novartis
Sporadic inclusion body myositis (sIBM), cachexia
Sporadic inclusion body myositis:• Slowly progressive degenerative inflammatory disease of the
skeletal muscles with very low prevalence of 1 – 9/100,000 (orphan disease)
• No curative therapy available Cachexia:• Emaciation through degradation of muscle and fatty tissue • 80 % of patients with advanced cancer are affected; responsible
for at least 20 % of deaths in cancer patients
Gantenerumab
Roche
Alzheimer’s disease
• High medical need due to lack of disease-modifying drugs• High market growth potential due to aging population, earlier and
improved diagnosis, and the advent of accompanying immune therapies that are prescribed in addition to existing therapies
• In 2013, 8.4 million1 people suffered from Alzheimer’s disease • Market expected to grow from US$ 3.1 billion in the year 2013 to
over US$ 12.7 billion by the year 20231
Guselkumab/CNTO1959
Janssen/J&J
Psoriasis*
Psoriasis:• Lifelong disease with high morbidity; has a negative influence
on the quality of life• Prevalence: 11.6 million patients in 20131
• Market expected to grow from US$ 6.6 million in 2013 to over US$ 10.7 billion by the year 20231
BHQ880
Novartis
Multiple myeloma
• Malignant tumor of the bone marrow (also called plasmacytoma)• Incidence: 46,960 patients in 20121
• Market expected to grow to more than US$ 9 billion in 2015
LFG316
Novartis
Age-related macu-lar degeneration (AMD), uveitis
AMD:• Main cause of severe, irreversible visual impairment in the
industrialized nations • Prevalence: 2.4 million patients suffered from wet AMD in 20131
and 1.7 million from dry AMD• Market expected to grow from US$ 5 billion in 2013 to over
US$ 8.9 billion in the year 20231
Uveitis (inflammation of the iris):• Inflammation of the uvea, which may be caused by autoimmune
diseases (also through rheumatoid arthritis)• Affects approximately 1 in 4,500 people and is more prevalent in
those between 20 and 60 years of age; men and women are equally affected
VAY736
Novartis
Pemphigus vul-garis, primary Sjögren’s syn-drome, relaps-ing-remitting MS
Pemphigus vulgaris:• Skin disease characterized by blister formation in the lower
layers of the epidermis • Very low incidence of 0.5 – 3.2/100,000 (orphan disease)• 10 – 20 % of patients die due to the consequences of side effects
from long-term therapy with glucocorticoids and immunosup-pressives
Primary Sjögren’s syndrome:• Autoimmune disease* that attacks the salivary and lachrymal
glands • Incidence: 3 – 6/100,000Relapsing-remitting MS:• Chronic inflammatory disease in which the myelin sheaths are
attacked in the central nervous system• Prevalence: 700,000 patients in 20131
*SEE GL OSSARY page 1 2 8
10GROUP MANAGEMENT REPORT
Operations and Business Environment
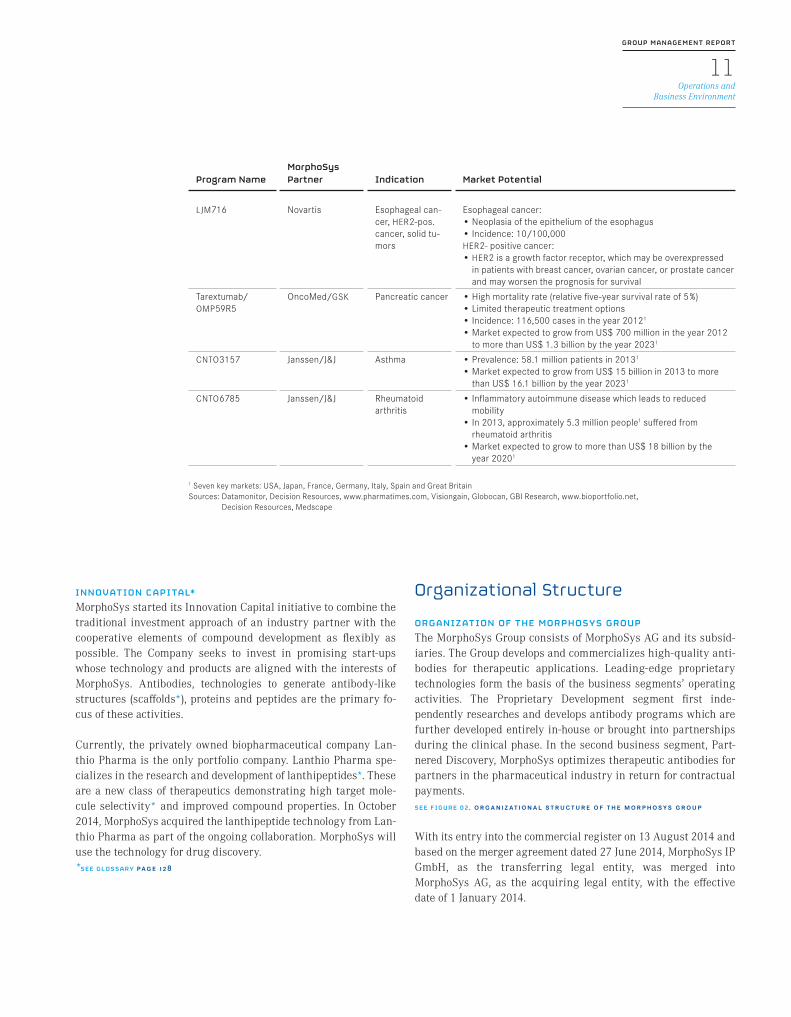
Program NameMorphoSys Partner Indication Market Potential
LJM716
Novartis
Esophageal can-cer, HER2-pos. cancer, solid tu-mors
Esophageal cancer:• Neoplasia of the epithelium of the esophagus• Incidence: 10/100,000HER2- positive cancer:• HER2 is a growth factor receptor, which may be overexpressed
in patients with breast cancer, ovarian cancer, or prostate cancer and may worsen the prognosis for survival
Tarextumab/ OMP59R5
OncoMed/GSK
Pancreatic cancer
• High mortality rate (relative five-year survival rate of 5 %)• Limited therapeutic treatment options• Incidence: 116,500 cases in the year 20121
• Market expected to grow from US$ 700 million in the year 2012 to more than US$ 1.3 billion by the year 20231
CNTO3157
Janssen/J&J
Asthma
• Prevalence: 58.1 million patients in 20131
• Market expected to grow from US$ 15 billion in 2013 to more than US$ 16.1 billion by the year 20231
CNTO6785
Janssen/J&J
Rheumatoid arthritis
• Inflammatory autoimmune disease which leads to reduced mobility
• In 2013, approximately 5.3 million people1 suffered from rheumatoid arthritis
• Market expected to grow to more than US$ 18 billion by the year 20201
1 Seven key markets: USA, Japan, France, Germany, Italy, Spain and Great BritainSources: Datamonitor, Decision Resources, www.pharmatimes.com, Visiongain, Globocan, GBI Research, www.bioportfolio.net,
Decision Resources, Medscape
INNOVATION CAPITAL*MorphoSys started its Innovation Capital initiative to combine the traditional investment approach of an industry partner with the cooperative elements of compound development as flexibly as possible. The Company seeks to invest in promising start-ups whose technology and products are aligned with the interests of MorphoSys. Antibodies, technologies to generate antibody-like structures (scaffolds*), proteins and peptides are the primary fo-cus of these activities.
Currently, the privately owned biopharmaceutical company Lan-thio Pharma is the only portfolio company. Lanthio Pharma spe-cializes in the research and development of lanthipeptides*. These are a new class of therapeutics demonstrating high target mole-cule selectivity* and improved compound properties. In October 2014, MorphoSys acquired the lanthipeptide technology from Lan-thio Pharma as part of the ongoing collaboration. MorphoSys will use the technology for drug discovery.*SEE GL OSSARY page 1 2 8
Organizational Structure
ORGANIZATION OF THE MORPHOSYS GROUPThe MorphoSys Group consists of MorphoSys AG and its subsid-iaries. The Group develops and commercializes high-quality anti-bodies for therapeutic applications. Leading-edge proprietary technologies form the basis of the business segments’ operating activities. The Proprietary Development segment first inde-pendently researches and develops antibody programs which are further developed entirely in-house or brought into partnerships during the clinical phase. In the second business segment, Part-nered Discovery, MorphoSys optimizes therapeutic antibodies for partners in the pharmaceutical industry in return for contractual payments.SEE F IGURE 02, organ iz at ional structure of the morphosys group
With its entry into the commercial register on 13 August 2014 and based on the merger agreement dated 27 June 2014, MorphoSys IP GmbH, as the transferring legal entity, was merged into MorphoSys AG, as the acquiring legal entity, with the effective date of 1 January 2014.
11GROUP MANAGEMENT REPORT
Operations and Business Environment

MorphoSys USA, Inc. was liquidated on 30 September 2014. The remaining assets were distributed to MorphoSys AG as the sole shareholder.
Upon the disposal of the majority of the AbD Serotec business to Bio-Rad on 10 January 2013, the quantitative and qualitative crite-ria of IFRS* 8.12 f. were no longer met. As a result, this segment was no longer a reportable segment under IFRS 8.11. Thus, the re-sults generated by the AbD Serotec segment up to 10 January 2013, which were insignificant, were re-classified to “Unallocated.”*SEE GL OSSARY page 1 2 8
In the 2014 financial year, the Group only maintained the loca-tion of the parent company, MorphoSys AG, in Martinsried near Munich. This location houses the central Group functions such as accounting, controlling, human resources, legal, patents, corpo-rate communications and investor relations, and the Proprietary Development and Partnered Discovery segments.
LEGAL STRUCTURE OF THE MORPHOSYS GROUP: GROUP MANAGEMENT AND SUPERVISIONMorphoSys AG is the parent Company of the MorphoSys Group, a German stock corporation listed in the Prime Standard segment of the Frankfurt Stock Exchange. In accordance with the German Stock Corporation Act, the Company has a dual management structure consisting of a Management Board and a Supervisory Board. The Management Board consist of four members and is re-sponsible for managing the Company. The Supervisory Board ap-
points, oversees and advises Management Board in the manage-ment of the Company. More detailed information concerning the Group’s management and control, as well as corporate governance principles, may be found in the Corporate Governance Report. The Senior Management Group supports the Management Board of MorphoSys AG and consists of 19 managers from various depart-ments.
Research and Development and Business Development
BUSINESS PERFORMANCE IN 2014MorphoSys’s business activities are currently heavily focused on strengthening its proprietary product development through ac-cess to new disease-specific target molecules, advanced product candidates and innovative technology platforms. As a research- intensive biopharmaceutical Company, our business performance is closely linked to the results of our compound and technology development. Project progress, regulatory decisions of health au-thorities, preclinical and clinical research results of our propri-etary product candidates, as well as our projects with our part-ners, all provide information on the probability of success and future market potential. Extending and strengthening the exist-ing patent protection of our product candidates and technologies secures this market potential over our competitors.
12GROUP MANAGEMENT REPORT
Operations and Business Environment
F I G URE
02 Organizational Structure of the MorphoSys Group Segment
PROPRIETARY DEVELOPMENT
Segment PARTNERED DISCOVERY
M O RP H O S Y S A G
Field of use THERAPEUTIC ANTIBODIES

NEW CONTRACTSIn April, MorphoSys announced the start of a strategic partnership with the Moulder Center for Drug Discovery Research, a depart-ment of the School of Pharmacy at the American Temple Univer-sity. The Moulder Center was given access to the MorphoSys Ylan-thia technology to validate new disease-related target molecules and generate therapeutic antibodies against them. MorphoSys has an exclusive option to further develop any antibodies resulting from this partnership. The participating department for new bio-therapeutic compound discovery at the Moulder Center deals with the compound’s design and optimization of lead candidates in various disease areas, including cancer, Alzheimer’s disease, car-diovascular, metabolic and viral diseases.
In 2014, MorphoSys also concluded contracts with industry part-ners. In May, MorphoSys entered into an agreement with the Ger-man drugmaker Merck KGaA to discover and develop therapeutic antibodies against target molecules of the class of immune check-points. MorphoSys and Merck Serono, the biopharmaceutical divi-sion of Merck, agreed to co-develop therapeutic antibodies that are intended to stimulate the immune system to attack tumors (immuno-oncology*). MorphoSys will use its proprietary antibody library, Ylanthia, and other technology platforms to generate anti-bodies against selected target molecules. Merck Serono brings a broad portfolio and expertise in the field of immuno-oncology and clinical development and will be completely responsible for the project starting with phase 1 clinical development. MorphoSys will share the cooperation’s research and development costs and has the option to end the co-development phase at a predetermined time. MorphoSys will receive development and commercial mile-stone payments and tiered royalties on product sales in an amount reflecting the duration of the co-development phase. Merck Serono will be responsible for the commercialization of the resulting products.*SEE GL OSSARY page 1 2 8
In August, MorphoSys and the American company Emergent BioSolutions Inc. announced an agreement for the co-develop-ment and co-promotion of the MOR209/ES414 compound. This is a bi-specific antibody against prostate cancer. MorphoSys secured the compound’s worldwide promotion rights with the exception of the United States and Canada where Emergent retains promotion rights. Emergent received an upfront payment of US$ 20 million and is entitled to receive potential milestone payments of up to US$ 163 million. Milestone payments are linked to certain events, including the development of MOR209/ES414 in multiple indica-tions and the approval in various markets. MorphoSys and Emer-gent will co-develop MOR209/ES414, with MorphoSys assuming 64 % of the research and development expenses and Emergent as-suming 36 % of these expenses. Emergent will manufacture and supply clinical material from its production facilities in Baltimore,
Maryland/USA. Emergent will receive low-single-digit royalties on product sales in the MorphoSys sales regions, and MorphoSys will receive tiered royalties ranging from the mid-single-digits up to 20 % on product sales in Emergent’s sales regions.
In October, MorphoSys announced the acquisition of the lanthip-eptide technology from Lanthio Pharma for drug development. The purchase was triggered when MorphoSys exercised an option under an existing agreement between the two companies from November 2012. The decision was based on a feasibility study for the development of high-quality, highly diverse lanthipeptide li-braries. By exercising the option, MorphoSys receives the lanthip-eptide technology and all related patents. Financial details were not disclosed. MorphoSys intends to continue working on an ex-panded lanthipeptide platform in the 2015 financial year.
PROJECT INITIATIONS AND PROGRESS, TRIAL EXTENSIONSIn the course of the 2014 financial year, the number of individual therapeutic antibodies in the MorphoSys pipeline grew to a total of 94 (31 December 2013: 81 individual antibodies). Of those, 22 anti-bodies were in clinical development, 27 in preclinical development and 45 in the discovery phase by the year’s end. In the Proprietary Development segment, MorphoSys had ten projects in its portfolio at the end of 2014 (31 December 2013: six). In the Partnered Dis-covery segment, the number of compounds initiated and devel-oped by our partners grew to 84 programs (31 December 2013: 75).
13GROUP MANAGEMENT REPORT
Operations and Business Environment

PROPRIETARY DEVELOPMENT
In the course of 2014, one new clinical trial with a proprietary de-velopment candidate, MOR208, has been started.
At the turn of the year 2013/2014, the Ohio State University’s (OSU) Department of Internal Medicine, led by Prof. Dr. John Byrd, Director of Hematology, initiated a phase 2 clinical trial to evaluate the efficacy and safety of MOR208. The trial tests a combination of MOR208 with the approved drug lenalidomide (trade name: Revlimid®, manufactured by Celgene) in patients with chronic lymphocytic leukemia (CLL). These trials progressed further during the reporting year. The trial is being conducted by the sponsor investigator Dr. Jennifer Woyach, Assistant Professor of Internal Medicine at the OSU, and is expected to enroll up to 40 either untreated CLL patients or those with relapsed/refractory acute forms. As an “investigator sponsored trial” (IST) it is largely funded by the study center. MorphoSys only provides the clinical material of MOR208.
In 2013, MorphoSys fully licensed the MOR103 program to GlaxoSmithKline, which at the time conducted a phase 1b study in patients with multiple sclerosis. The Company was able to com-plete this study in the reporting year and to report positive data.
For the MOR202 program, MorphoSys and its partner Celgene have decided to expand the clinical development plan in multiple myeloma. Cohorts with a weekly dosing schedule, with or without the addition of dexamethasone, will be added to the current dose-escalation trial of MOR202, with a bi-weekly dosing regimen. Cohorts with combination therapy of MOR202 with lenalidomide (trade name: Revlimid®, manufactured by Celgene) and pomalido-mide (trade name Pomalyst®, manufactured by Celgene) will start in the middle of 2015.
PARTNERED DISCOVERY
Three antibodies in this segment proceeded into phase 1 clinical development during the 2014 financial year –all from the collabo-ration with Novartis. In February and October, MorphoSys com-municated the successful initiation of clinical trials for two anti-bodies in the field of ophthalmology. Initiation of a phase 1 clinical trial in oncology was announced in December. All three com-pounds are fully human HuCAL antibodies. All of these events triggered milestone payments to MorphoSys.
14GROUP MANAGEMENT REPORT
Operations and Business Environment
F I G URE
03 Clinical Studies with
MorphoSys Antibodies (31 December)
PHASE
2011
1 2
8
12
2010
1 2
6
11
2012
1 2 3
6
1
11
2013 2014
1 12 23 3
16
27
3
8
24 24
phase 1 phase 2 phase 3

The MorphoSys partner Janssen has brought guselkumab, the HuCAL antibody for the treatment of psoriasis, into phase 3 clini-cal development. Four different phase 3 studies with more than 2,500 patients planned for recruitment were initiated during 2014. According to the study design, three of studies are to be completed in 2016. This underpins Janssen’s previously published plans to submit the compound for approval in the year 2017. The launch of the first phase 3 clinical trial triggered a milestone payment to MorphoSys.
MorphoSys’s partner Roche announced the initiation of a new clin-ical phase 3 trial called Marguerite RoAD. This trial will test the gantenerumab compound on up to 1,000 patients suffering from a mild form of Alzheimer’s disease.
In addition, the following studies have either been initiated or an-nounced by the MorphoSys partners:• A planned Boehringer Ingelheim phase 1 clinical trial with the
HuCAL antibody BI 836845 to test the antibody in combination with the enzalutamide compound on up to 160 prostate cancer patients.
• A planned Boehringer Ingelheim phase 1 clinical trial with the HuCAL antibody BI 836845 to test the antibody in combination with the afatinib compound on up to 60 patients with non-small-cell lung cancer.
• A phase 1 clinical trial with the HuCAL antibody BI 836845 con-ducted in Japan by Boehringer Ingelheim on up to 18 patients with advanced tumors.
• A new study conducted by Janssen on the antibody compound guselkumab, in which it will investigate whether genetic analy-sis can predict a response to treatment with the compound in psoriasis patients.
• A phase 2 trial with the HuCAL antibody guselkumab conducted by Janssen for the treatment of psoriatic arthritis.
• A phase 2 trial with the HuCAL antibody bimagrumab initiated by Novartis in the USA, Europe and Japan, in which the com-pound will be tested on up to 210 patients following hip surgery.
• A long-term phase 2/3 trial with the HuCAL antibody bima-grumab to examine the efficacy, safety and tolerability in up to 14 patients with sporadic inclusion body myositis who have al-ready received the antibody during an earlier phase 2 trial. This trial is conducted by Novartis.
• A phase 1 trial with LJM716, which will be tested in combination with the compounds BYL719 and trastuzumab on up to 48 pa-tients with HER2-positive breast tumors. This trial is conducted by Novartis in collaboration with the US Memorial Sloan-Ketter-ing Cancer Center.
• A planned phase 1b combination study with the HuCAL antibody PF-05082566 in combination with the anti-CCR4 antibody mog-amulizumab to test the safety and tolerability of the combination in patients with solid tumors. This study is being conducted by Pfizer and Kyowa Hakko Kirin and is scheduled to start in 2015.
• A planned phase 1/2 combination trial with the HuCAL antibody PF-05082566 in combination with Merck’s cancer drug MK-3475, a PD-1 inhibitor and conducted by Pfizer and Merck.
• MorphoSys’s partner OncoMed was able to continue a previously interrupted phase 1 trial with the antibody compound vantic-tumab using a modified protocol. The decision of the US Food and Drug Administration FDA was announced in August. Changes to the study protocol include a modified dosage regi-men, a change in inclusion criteria, the closer monitoring of patients and measures to counteract the effects on bone metab-olism.
In addition, the following trials conducted by MorphoSys’s part-ners were stopped:• Novartis withdrew a phase 2 study with bimagrumab for me-
chanically ventilated patients before patients were admitted to the trial.
• In December 2014, Roche announced the completion of the phase 3 trial of the gantenerumab compound in prodromal Alzheimer’s disease patients. Two other advanced trials in patients with mild Alzheimer’s disease and in individuals with a genetic predispo-sition to Alzheimer’s disease are still in progress.
Overall, 19 antibody programs in clinical development conducted by partners were tested in more than 50 trials.
CLINICAL STUDY DATA FROM CURRENT PROJECTSPROPRIETARY DEVELOPMENT
In September, clinical data from the phase 1b trial in multiple scle-rosis for the MOR103 program (fully out-licensed to GSK) was pre-sented at the ACTRIMS-ECTRIMS meeting. The data substantiated earlier trial results on the tolerance of MOR103 and showed the first signs of efficacy. At the trial’s completion, the full responsi-bility for further development was transferred to the MorphoSys partner GlaxoSmithKline. Therefore, the decision of whether MOR103 will be developed for the indication of multiple sclerosis in addition to rheumatoid arthritis lies with GlaxoSmithKline.
15GROUP MANAGEMENT REPORT
Operations and Business Environment

In December, MorphoSys published promising clinical data from the ongoing phase 2 study of MOR208 for the treatment of non-Hodgkin’s lymphoma (NHL) at the 56th Annual Meeting of the American Society of Hematology (ASH). The data was gener-ated from the treatment of 89 patients with four different NHL sub-types and shows that MOR208 was well tolerated as monotherapy and has shown encouraging signs of efficacy. The study examines MOR208 antibody in patients with follicular lymphoma (FL*), man-tle cell lymphoma (MCL), diffuse large B-cell lymphomas (DLBCL*) and other indolent NHL forms. Patients received a weekly dose of the antibody during the first eight weeks of treatment. Patients in which this dosage resulted in at least a stabilization of the disease were given MOR208 for another four weeks. After this 12-week treatment program, patients who responded to therapy switched to maintenance therapy with bi-weekly dosing up to the time of pro-gression. This approach has confirmed promising development options for MOR208, particularly the subtypes DLBCL and FL. In both subpopulations, the administration of the compound demon-strated cases of complete clinical response as well as a partial re-sponse.
MorphoSys presented further preclinical data at the ASH confer-ence for the MOR202 program which studied a combination of the compound with pomalidomide. The results showed a synergistic interaction between the two compounds and an increased ability to kill cancer cells. The combination of MOR202 and pomalidomide is set for clinical testing during the 2015 financial year.
PARTNERED DISCOVERY
MorphoSys’s partner Janssen presented promising data on the an-ti-inflammatory HuCAL antibody guselkumab at the 72nd Annual Meeting of the American Academy of Dermatology. The data origi-nated from the X-PLORE study that tested guselkumab in 293 pa-tients with moderate to severe psoriasis. Guselkumab binds specif-ically the target molecule IL-23 and thus differs from Janssen’s approved drug Stelara® which neutralizes IL-23 as well as IL-12.
According to the results published, the randomized phase 2b study conducted at multiple study centers and using several dos-ages of guselkumab in comparison to placebo and adalimumab (trade name Humira®, manufactured by AbbVie) achieved the tri-als primary objective. The compound significantly reduced typical psoriasis symptoms in patients after 16 weeks as measured by the Physician’s Global Assessment (PGA) value of 0 (cleared) or 1 (min-imal). A total of 34 % of patients achieved these values at the lowest dose of 5 mg. The best result at a dose of 100 mg was 86 % in com-parison to approximately 7 % in the placebo group and around 58 % when treated with adalimumab. In addition, guselkumab is cur-rently in a phase 2 clinical trial in psoriatic arthritis (PsA).
At the ASCO Annual Meeting and the AACR conference – two of the most important international conferences in oncology – data was presented from the trials of several of our partnered pro-grams. The results from programs such as PF-05082566, tarex-tumab, LJM716 and BI 836845 support the development of these projects.
MorphoSys’s partner OncoMed published a number of preclinical and clinical research findings during the year on the two HuCAL programs tarextumab and vantictumab. In late September, OncoMed presented clinical data on tarextumab at the Congress of the European Society for Medical Oncology (ESMO) in Madrid. The interim results of ongoing studies substantiated the promising potential of the antibody in the area of pancreatic cancer and non-small-cell lung cancer.
REGULATORY EVENTSPROPRIETARY DEVELOPMENT
In May 2014, the US Food and Drug Administration confirmed the orphan drug status for the MOR208 project for the treatment of chronic lymphocytic leukemia (CLL) and small-cell lymphocytic lymphoma (SLL*). In addition, MorphoSys has received a positive recommendation from the European Medicines Agency EMA* to grant MOR208 the status as a medicinal product for rare disorders (orphan medicinal product) in the same indications. The EMA’s recommendation was confirmed later in the year by the European Commission.*SEE GL OSSARY page 1 2 8
The designation “orphan drug” and “orphan medicinal product” are awarded by the US and European health authorities to support the development of promising drug candidates for diseases affect-ing fewer than 200,000 patients in the US or not more than five for every 10,000 people in the European Union. The receipt of this classification is accompanied by benefits such as seven years of market exclusivity following approval in the United States and ten years in the European Union. Other potential benefits may be in the form of support for protocols, the opportunity to apply for re-search funding, tax benefits for certain research expenses and waived fees for regulatory processes.
16GROUP MANAGEMENT REPORT
Operations and Business Environment

In November, MorphoSys announced that the US Food and Drug Administration (FDA) had awarded the MOR208 program fast-track designation. The FDA’s fast track program promotes the ac-celerated development and testing of compounds that have the potential to meet unmet medical need of serious or even life-threat-ening diseases. Working more closely with the FDA, which is made possible through this program, could accelerate the develop-ment of MOR208 for patients with this particular type of non-Hod-gkin’s lymphoma.
Shortly before the end of the year, the US and European health authorities also confirmed the award of orphan drug and orphan medicinal product status for the MOR208 project for the treatment of diffuse large B-cell lymphoma (DLBCL).
The MOR208 compound program was significantly strengthened by the regulatory decisions taken in the course of the financial year, particularly those in the disease areas DLBCL and CLL, for which positive clinical data already exists and new data is ex-pected to be generated.
During 2014, there were no relevant regulatory decisions an-nounced by the Partnered Discovery segment.
PATENTSDuring the 2014 financial year, MorphoSys continued to consoli-date and expand the patent protection of its development programs and its growing technology portfolio – the Company’s most im-portant value drivers.
The US Patent and Trademark Office (USPTO) granted further pat-ents for the Company’s most recent antibody library, Ylanthia, which has been commercially available for new and existing part-ners since 2012. The first US patent was granted in the first quar-ter of the past year. The State Intellectual Property Office of the People’s Republic of China also granted a patent related to this technology.
In addition, MorphoSys acquired the lanthipeptide technology and all related intellectual property from the Dutch company Lanthio Pharma.
Currently, the Company maintains more than 40 different propri-etary patent families worldwide in addition to the numerous patent families it pursues in collaboration with its partners.
Group Headcount Development
MorphoSys’s success is based on its highly qualified staff and their creativity and motivation. On 31 December 2014 there were 329 employees at the MorphoSys Group (31 December 2013: 299), of whom 124 hold Ph.D. degrees (31 December 2013: 118). The MorphoSys Group had an annual average of 315 employees in 2014 (2013: 290).
It is crucial for a company to have a competitive and attractive re-muneration system when competing for the best employees. In or-der for MorphoSys to compete successfully as an employer, an an-nual comparison of the compensation paid in the biotech industry and in other industries comparable with MorphoSys is carried out and, if necessary, the salary structure is adjusted accordingly. On 1 January 2014, an adaptation of the existing remuneration system was launched in order to better meet the changing requirements of a modern compensation system. This adaptation involves a shift of some elements of variable compensation in favor of fixed compen-sation. This adaptation applies to all employees with the exception of the Management Board. Thus, the annual bonus is now linked exclusively to the achievement of corporate goals. A “spot bonus” was also introduced and promptly rewards (“on the spot“) any ex-ceptional accomplishments of employees.
The chapter titled “Sustainable Business Development” contains a detailed overview of headcount development and MorphoSys’s activities for promoting successful long-term efforts in human resources.
17GROUP MANAGEMENT REPORT
Operations and Business Environment

Changes in the Business Environment
Uncertainty in the financial markets and geopolitical tensions during the year brought global economic growth to another stand-still. At the end of the year, the OECD reported a rather subdued global growth rate of 3.3 % and growth of a meager 0.8 % for the eurozone.
The escalation of conflicts in Ukraine and the Middle East had a significant negative impact on economic activity, particularly in Europe. In several of the industrialized countries, special factors had a dampening effect on economic development and caused quarterly fluctuations in production. Although the unusually harsh winter in the United States at the start of the year resulted in dwindling economic activity, American economic development picked up again in the course of the year and, according to OECD
18GROUP MANAGEMENT REPORT
Operations and Business Environment
193
6046
500
450
400
350
300
250
200
150
100
50
300
250
200
150
100
50
F I G URE
04 Headcount of the MorphoSys Group (31 December)1
464 446 421
299329
EMPL O YEES BY SEGMEN T EMPL O YEES BY F UNC T ION
propr ie tary de velopment partnered d i sc ov ery unallocated
em ploy ees in gener al & adm in istr at i v e
em ploy ees in r&d
55
274
46
253
105
169
55
1 2010 to 2012 includes employees of research and diagnostic segment AbD Serotec, which was sold as of 10 January 2013 (closing date)
2010 2011 2012 2013 2014
2013 2014 2013 2014
300
250
200
150
100
50

estimates, entered the new year with a growth rate of about 2.2 %. Japan’s economic development was overshadowed by the VAT in-crease and grew only 0.4 %. In addition to their economic problems, emerging markets suffered from weaker growth momentum. China, however, managed to announce economic growth of around 7 %, but still battled with factors threatening its financial stability.
In Germany, the economic environment remained challenging. In November, the Centre for European Economic Research (ZEW) re-ported some stabilization in the economy and thus a cautiously rising economy.
Toward the year’s end, several indicators pointed to a slow rise in global economic activity. The improvement, however, was limited mainly to the advanced economies and especially the United States. In comparison, the economic climate indicators for the whole of Europe and the emerging markets have been mixed until recently. Experts believe that the world economy will continue to expand moderately for the time being but will remain vulnerable to setbacks.
The uneven economic recovery in Europe and geopolitical tensions also pose serious risks to the growth of the global pharmaceutical and biotechnology industries. MorphoSys steers its entrepreneur-ial activities while weighing all of the potential risks and opportu-nities, including those in the macroeconomic environment. Never-theless, global political uncertainties did not cause us to refrain from or modify any crucial activities during the past financial year. Fluctuations within individual countries had no influence on MorphoSys’s operations. In this respect, global economic develop-ments had no immediate impact on the Company’s business per-formance.
REGULATORY ENVIRONMENTThe healthcare industry’s regulatory environment is dominated by ever higher standards of product quality, safety and effectiveness, and places high demands on the companies. Novel drugs must demonstrate a significant benefit over existing therapies in order to be approved, gain the acceptance of the market and receive funding from the healthcare system. The industry is also heavily restricted in its pricing due to the legal requirements of the health-care system, which are dominated by the issue of cost savings, particularly in Europe.
Despite continued pressure on the industry, the situation in the market seems to be improving gradually, particularly in the USA. In 2014, the US FDA granted approval to 41 drugs – significantly more than in the previous year (2013: 27 drugs). Twenty biotechno-logical compounds were among the compounds approved. This highlights the importance for the industry of continuous innova-tion in order to develop technologically advanced products and optimize treatments already approved.
The FDA promotes compounds with exceptional drug potential through measures such as the “breakthrough therapy designa-tion,” introduced in 2013, and the “fast track” program, which help expedite product development and testing. In November, the FDA also issued fast track status to MorphoSys’s proprietary compound MOR208, which is currently in a phase 2 clinical trial for patients suffering from diffuse large B-cell lymphoma (DLBCL). Closer co-operation with the audit and approval authorities facilitates the targeted development of the antibody and may help to bring it faster to the market.
DEVELOPMENT OF THE PHARMACEUTICAL AND BIOTECHNOL-OGY SECTORSThe price pressure on drug suppliers in the past year was clearly evident, especially in competitive indications such as oncology or multiple sclerosis. Competitive pressure on providers in the gener-ics market also grew. Specifically, generic versions of biopharma-ceuticals, called biosimilars, represent an important and increas-ingly competitive growth market. This trend is expected to continue in the coming years, as some of the best-selling biological compounds will lose their patent protection.
Given the global aging population and market developments in emerging markets such as China and India, the general growth trend in the healthcare industry continues unabated. The US mar-ket research firm IMS Health estimates that the worldwide reve-nues of the pharmaceutical industry in 2014 were well over a tril-lion dollars – an almost 20 % increase over the previous year. At around 40 %, North America still generates the lion’s share of global industry sales.
19GROUP MANAGEMENT REPORT
Operations and Business Environment

The appreciable economic recovery and local healthcare reform had a positive impact on the US market in particular. The US phar-maceutical industry benefited from fewer patent expiries than in previous years, the launch of innovative products and a significant rise in drug prices. The market was particularly excited about the new hepatitis C drug Sovaldi®, which was placed on the market by Gilead Sciences with great success and at a price of approx. US$ 1,000 per tablet.
In Europe, the generally weak economic situation and restrained spending in the healthcare sector in connection with some coun-tries’ debt reductions led to comparatively weak revenue growth. The need to promote innovation was also evident in Europe. At least European biotechnology companies made a conservative comeback on the stock markets compared to their peers in the USA. In 2014, ten biotech companies went public on European stock exchanges. The principal reason for this positive develop-ment was the tax incentives available for innovative companies, such as those available in France, and an internationally visible growth segment, such as seen in the UK. Germany could not par-ticipate in this trend, however, and had not one single new IPO from this industry. The stagnation in both sales and research in-vestment in Germany is probably due in part to the rather adverse conditions: Cost considerations are making it increasingly difficult for businesses to establish a proprietary research pipeline due to the absence of tax incentives for research and development and a distinct lack of venture capital. In addition, innovative vendors, also those outside of Germany, are being placed under pressure by the growing generics market.
DEVELOPMENT OF THE ANTIBODY SECTORAntibody compounds in cancer immunotherapy monopolized the headlines in the 2014 financial year. The international ASCO Meet-ing in June was also dominated by these compounds. Roche, Merck & Co., Bristol-Myers Squibb and various other companies pre-sented promising clinical results of studies in areas such as mela-noma, bladder cancer and lung cancer. In 2014, anti-PD1 antibod-ies represented an important class of drugs approaching market readiness. In July, the compound nivolumab, developed by the pharmaceutical company Bristol-Myers Squibb, received approval in Japan for the treatment of unresectable melanoma. The com-pound pembrolizumab, developed by Merck, Inc. in the USA, is a new antibody for the treatment of patients with malignant mela-noma. This compound received approval in the United States un-der the trade name Keytruda®.
With antibodies against the target molecule PCSK9, a class of anti-bodies took a step into the last phase of clinical development in 2014. This opens up a whole new disease area for the treatment of high blood pressure and high cholesterol and demonstrates once more the diversity of these compounds’ potential applications.
In addition, the following antibodies were granted approval in 2014: • The angiogenesis inhibitor ramucirumab (trade name: Cyramza®),
a first monoclonal antibody for the treatment of patients with advanced gastric cancer, was approved in the United States.
• The compound siltuximab (trade name: Sylvant®) was approved for the treatment of patients with Castleman’s disease.
• The antibody vedolizumab (trade name: Entyvio®), used to treat moderate to severe ulcerative colitis or Crohn’s disease, received approval.
CURRENCY DEVELOPMENTSIn 2014, the euro weakened again as a result of the debt crises. Falling energy prices put even more downward pressure on infla-tion in Europe. This is increasing the worries of monetary author-ities about deflation or a spiral of falling prices and a shrinking economy. Therefore, the European Central Bank decided to pur-chase government bonds in large scale to avert the threat of defla-tion in the euro area. The currency suffered as a result and, at around US$ 1.23 in 2014, the euro was at its lowest level since 2010.
Since the Company’s business is carried out mainly in euros and US dollars, changes in these two currencies may have an effect on MorphoSys’s costs and revenues in the future. The ongoing weak-ening of the euro against the US$ has a direct impact on the oper-ational result, as costs for clinical studies occur at an increasing extent in the US.
20GROUP MANAGEMENT REPORT
Operations and Business Environment

Analysis of Net Assets, Financial Position and Results of Operations
As of 31 December 2014, the scope of consolidation of the MorphoSys Group had changed. Next to MorphoSys AG, the con-solidated financial statements of 31 December 2014 include Sloning BioTechnology GmbH and Poole Real Estate Ltd. (formerly Biogenesis UK Ltd.). Further information on the Group’s organiza-tional structure can be found on page 11.
Revenues
Compared to the previous year, Group revenues declined by 18 % to € 64.0 million (2013: € 78.0 million). This decline resulted primar-ily from non-recurring effects in relation to the out-licensing of MOR103 to GlaxoSmithKline and from license fees from the sale of the AbD Serotec business unit to Bio-Rad in 2013.
On a geographical basis, MorphoSys achieved 29 %, or € 18.6 mil-lion, of its commercial revenues with biotechnology and pharma-ceutical companies and with non-profit organizations headquar-tered in North America and 71 % or € 45.4 million with customers primarily located in Europe and Asia. In the comparable period of the previous year, these shares were 11 % and 89 %, respectively.SEE F IGURE 05, re venue of the morphosys group by reg ion
21GROUP MANAGEMENT REPORT
Analysis of Net Assets, Financial Position and Results of Operations
F I G URE
05 Revenue of the
MorphoSys Group by Region (in %)
2013 2014
89 71
20112010
81 94
19 6
11 29
2012
95
5
EUROP E AND ASIA
NOR T H AMERIC A

PROPRIETARY DEVELOPMENT AND PARTNERED DISCOVERY SEGMENTS In 2014, the Proprietary Development segment achieved revenues of € 15.0 million (2013: € 26.9 million). These revenues were mainly from co-development activities with Celgene. The decline in comparison to the previous year was affected significantly by an upfront payment recognized in 2013. This payment resulted from out-licensing the MOR103 antibody program to GlaxoSmithKline.
Revenues from the Partnered Discovery segment included € 43.6 million in funded research and license fees (2013: € 48.0 mil-lion) and € 5.4 million in success-based payments (2013: € 3.0 mil-lion). Success-based payments amounted to 8 % (2013: 4 %) of the total revenues of the Partnered Discovery and Proprietary Develop-ment segments. The decline in license fees was driven by a non- recurring effect in the first half of 2013 resulting from the sale of the AbD Serotec business unit to Bio-Rad. As part of this sale,
Bio-Rad was granted a non-exclusive license for the use of the HuCAL technology in the market for research reagents* and diag-nostics.SEE F IGURE 06, revenues proprietary development and partnered discovery
Approximately 92 % of Group revenues were attributable to our partners Novartis, Celgene and Centocor (2013: 88 % with Novartis, GlaxoSmithKline and Bio-Rad).
Assuming the average foreign exchange rates of 2013, revenues of the Proprietary Development and Partnered Discovery segments would have remained unchanged.
*SEE GL OSSARY page 1 2 8
22GROUP MANAGEMENT REPORT
Analysis of Net Assets, Financial Position and Results of Operations
F I G URE
06 Revenues Proprietary
Development and Partnered Discovery
1* thereof AbD Serotec: 2010: 20.1
2* Group revenues from continuing operations
partnered discovery segment: funded research and l icensing fees
partnered discovery segment: success - based payments
proprietary development segment
48.043.6
3.05.4
57.2
9.1
1.8 2.47.0
26.9
15.0
46.6
32.7
1.9
2010 2011 2012 2013 2014
42.7
100.0
90.0
80.0
70.0
60.0
50.0
40.0
30.0
20.0
10.0
0
T O TA L
in million €
64.0
T O TA L
in million €
78.02
T O TA L
in million €
87.01T O TA L
in million €
82.12
T O TA L
in million €
51.92
Operating Expenses
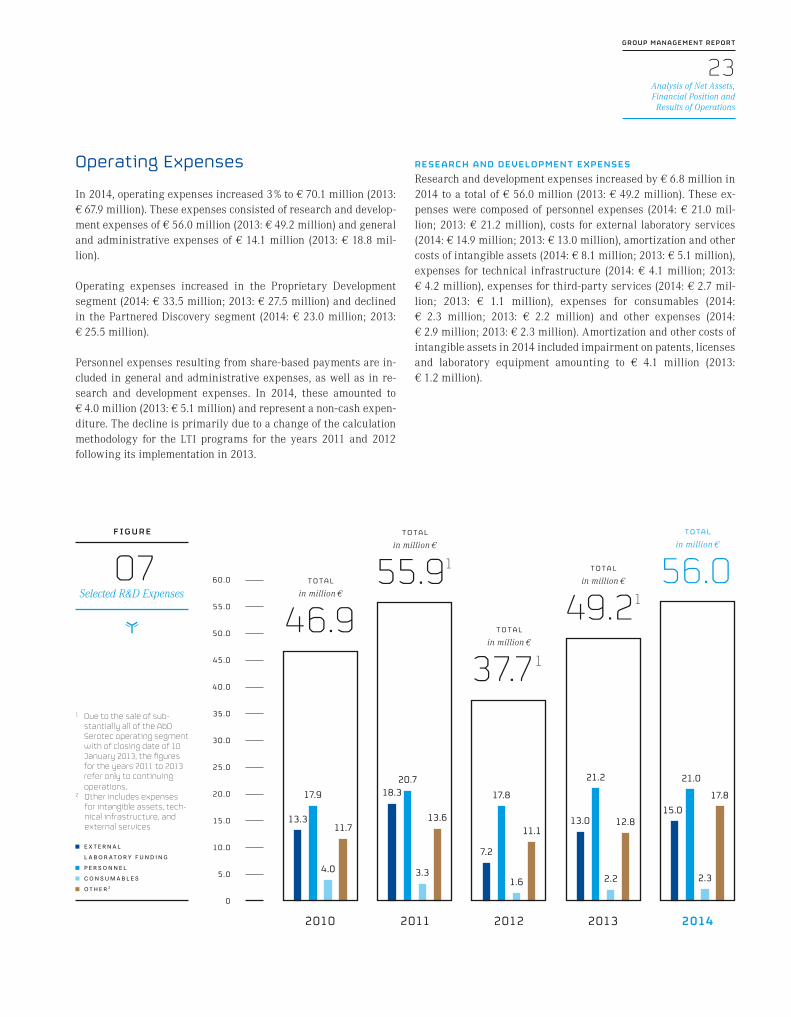
In 2014, operating expenses increased 3 % to € 70.1 million (2013: € 67.9 million). These expenses consisted of research and develop-ment expenses of € 56.0 million (2013: € 49.2 million) and general and administrative expenses of € 14.1 million (2013: € 18.8 mil-lion).
Operating expenses increased in the Proprietary Development segment (2014: € 33.5 million; 2013: € 27.5 million) and declined in the Partnered Discovery segment (2014: € 23.0 million; 2013: € 25.5 million).
Personnel expenses resulting from share-based payments are in-cluded in general and administrative expenses, as well as in re-search and development expenses. In 2014, these amounted to € 4.0 million (2013: € 5.1 million) and represent a non-cash expen-diture. The decline is primarily due to a change of the calculation methodology for the LTI programs for the years 2011 and 2012 following its implementation in 2013.
RESEARCH AND DEVELOPMENT EXPENSESResearch and development expenses increased by € 6.8 million in 2014 to a total of € 56.0 million (2013: € 49.2 million). These ex-penses were composed of personnel expenses (2014: € 21.0 mil-lion; 2013: € 21.2 million), costs for external laboratory services (2014: € 14.9 million; 2013: € 13.0 million), amortization and other costs of intangible assets (2014: € 8.1 million; 2013: € 5.1 million), expenses for technical infrastructure (2014: € 4.1 million; 2013: € 4.2 million), expenses for third-party services (2014: € 2.7 mil-lion; 2013: € 1.1 million), expenses for consumables (2014: € 2.3 million; 2013: € 2.2 million) and other expenses (2014: € 2.9 million; 2013: € 2.3 million). Amortization and other costs of intangible assets in 2014 included impairment on patents, licenses and laboratory equipment amounting to € 4.1 million (2013: € 1.2 million).
23GROUP MANAGEMENT REPORT
Analysis of Net Assets, Financial Position and Results of Operations
F I G URE
07 Selected R&D Expenses
1* Due to the sale of sub - stantially all of the AbD Serotec operating segment with of closing date of 10 January 2013, the figures for the years 2011 to 2013 refer only to continuing operations.
2* Other includes expenses for intangible assets, tech-nical infrastructure, and external services
e x ternal l ab o r ato ry fu nd in g
perso nnel c o nsu mab les other 2
T O TA L
in million €
49.21
T O TA L
in million €
56.0
13.3
18.3
7.2
13.015.0
17.920.7
17.8
21.2 21.0
4.0 3.31.6 2.2 2.3
11.713.6
11.112.8
17.8
T O TA L
in million €
46.9
T O TA L
in million €
55.91
T O TA L
in million €
37.71
2010 2011 2012 2013 2014
60.0
55.0
50.0
45.0
40.0
35.0
30.0
25.0
20.0
15.0
10.0
5.0
0

In 2014, the Company incurred expenses for proprietary product development of € 33.5 million (2013: € 27.5 million) and expenses for technology development of € 2.9 million (2013: € 4.2 million).SEE F IGURE 08, d istr ibut ion of r&d e xpenses
GENERAL AND ADMINISTRATIVE EXPENSESAt € 14.1 million (2013: € 18.8 million), general and administra-tive expenses were below the level of the prior year. This item mainly comprised personnel expenses (2014: € 9.6 million; 2013: € 11.3 million), expenses for third-party services (2014: € 2.7 mil-lion; 2013: € 4.1 million), expenses for technical infrastructure (2014: € 0.8 million; 2013: € 1.3 million) and other expenses (2014: € 0.8 million; 2013: € 1.2 million).
Other Income and Expenses
Other income amounted to € 0.8 million (2013: € 0.8 million) and mainly comprised currency gains and the recovery of receivables impaired in previous years as a result of incoming payments. Other expenses of € 0.6 million (2013: € 0.9 million) mainly con-sisted of currency losses.
EBIT
Earnings before interest and taxes (EBIT) amounted to € – 5.9 mil-lion compared to an EBIT of € 9.9 million in the previous year. The EBIT from the Proprietary Development segment amounted to € – 18.4 million (2013: € – 0.5 million) while the Partnered Dis-covery segment achieved an EBIT of € 25.9 million (2013: € 25.4 million).
24GROUP MANAGEMENT REPORT
Analysis of Net Assets, Financial Position and Results of Operations
19.6
33.5
F I G URE
08 Distribution of R&D
Expenses
r&d expenses on behalf of partners
proprietary development expenses
technology development expenses
17.5
27.5
18.9
25.9
2.1 2.9 3.6 4.22.9
19.1
33.9
18.1
2010 2011 2012 2013 2014
16.0
T O TA L
in million €
49.21
T O TA L
in million €
56.0T O TA L
in million €
46.9
T O TA L
in million €
55.91
T O TA L
in million €
37.71
60.0
55.0
50.0
45.0
40.0
35.0
30.0
25.0
20.0
15.0
10.0
5.0
0

Finance Income and Expenses
Finance income totaled € 1.8 million (2013: € 0.9 million) and mostly included interest income and gains from the sale of securi-ties. Finance expenses of € 0.2 million (2013: € 0.1 million) were mainly the result of bank fees.
Taxes
For the year 2014, the Group reported an income tax benefit of € 1.3 million (2013: income tax expense of € 3.3 million) which consists of a current tax expense of € 0.3 million and deferred tax income of € 1.6 million.
Results from Continuing Operations
In 2014, continuing operations reported a net result of € – 3.0 mil-lion (2013: € 7.4 million). The resulting basic net result per share for the year 2014 amounted to € – 0.12 (2013: € 0.30).
Results from Discontinued Operations
In 2014, the Group did not have any discontinued operations in accordance with IFRS 5 and therefore a profit/loss from discontin-ued operations was not reported (2013: € 6.0 million from the sale of substantially all of the AbD Serotec business unit to Bio-Rad).
Consolidated Net Profit/Loss for the Period
In 2014, a net result of € – 3.0 million was generated (2013: € 13.3 million). The resulting 2014 basic net result per share amounted to € – 0.12 (2013: € 0.54).
TAB L E
05Multiple-Year Overview –
Income Statement
in million € 2014 20131 20121 20111 2010
Revenues 64.0 78.0 51.9 82.1 87.0
Cost of Goods Sold 0 0 0 0 7.3
Gross Profit 64.0 78.0 51.9 82.1 79.7
Research and Development Expenses 56.0 49.2 37.7 55.9 46.9
General and Administrative Expenses 14.1 18.8 12.1 14.9 23.2
Other Income/Expenses2 0.2 (0.1) 0.3 (1.5) 0.2
EBIT2,3 (5.9) 9.9 2.5 9.8 9.8
Finance Income/Expenses2 1.6 0.8 0.6 1.4 3.4
Income Tax Income/Expenses 1.3 (3.3) (0.7) (3.0) (4.0)
Profit/(Loss) for the Year from Continuing Operations (3.0) 7.4 2.4 8.2 9.2
Profit/(Loss) for the Year from Discontinued Operations1 0 6.0 (0.4) 0.01 0
Consolidated Net Profits/(Loss) (3.0) 13.3 1.9 8.2 9.2
1 Due to the sale of substantially all of the AbD Serotec business agreed in December 2012, line items in the income statement related to this transaction are recorded in a single line titled “Results from discontinued operations” from the year 2011 onwards. Other line items contain the results of the continuing operations.
2 To improve comparability with the peer group, MorphoSys changed the structure of its income statement in 2012 and now reports EBIT instead of the results from normal business activities.
3 2010: Result from operating activities
25GROUP MANAGEMENT REPORT
Analysis of Net Assets, Financial Position and Results of Operations

Financial Position
PRINCIPLES OF FINANCIAL MANAGEMENT At MorphoSys, the primary objective of financial management is to have sufficient liquidity reserves available for industry-specific fluctuations and for the continued growth of the Company at all times. The main source of this liquidity is the operational business activities of the various parts of the Company and the resulting cash inflows. Scenario projections and cash flow projections are used to determine our liquidity requirements.
CASH FLOWS*The net cash outflow from operating activities totaled € 14.2 mil-lion in 2014 (2013: cash inflow of € 89.1 million). *SEE GL OSSARY page 1 2 8
In 2014, the Company invested in various financial assets such as available-for-sale securities and bonds, short-term commercial pa-per and fixed-term deposits. These investments resulted in a cash outflow of € 21.5 million (2013: cash outflow of € 193.9 million).
In 2014, financing activities led to a cash outflow of € 3.9 million (2013: cash inflow of € 130.6 million).
INVESTMENTSIn 2014, MorphoSys made investments in property, plant and equipment totaling € 2.9 million (2013: € 1.0 million). Depreciation of property, plant and equipment amounted to € 1.4 million in 2014 compared with € 1.5 million in 2013.
The Company invested € 17.6 million in intangible assets in 2014 (2013: € 4.5 million). Amortization of intangible assets amounted to € 2.7 million in 2014 and was below the level of the prior year (2013: € 3.3 million). In 2014, impairments of € 4.1 million (2013: € 1.1 million) were recognized on patents, licenses and laboratory equipment.
LIQUIDITYAs of 31 December 2014, the Company held liquid funds, market-able securities and other financial assets of € 352.8 million com-pared to € 390.7 million on 31 December 2013.
This amount comprises cash and cash equivalents of € 32.2 mil-lion (31 December 2013: € 71.9 million), marketable securities and bonds amounting to € 113.5 million (31 December 2013: € 199.5 million) as well as other financial assets totaling € 157.0 million (31 December 2013: € 119.3 million), which were reported in the category “loans and receivables” under “other re-ceivables.” Further investments totaling € 50.0 million categorized as “loans and receivables” were reported on 31 December 2014 as “other receivables” under non-current assets (31 December 2013: € 0 million).
The € 37.9 million decline in liquidity, marketable securities and other financial assets was mainly due to the use of cash and cash equivalents for the operating activities in 2014 and for a payment to Emergent.
TAB L E
06Multiple-Year Overview –
Financial Situation
in million € 2014 2013 2012 2011 2010
Net Cash Provided by/Used in Operating Activities1 (14.2) 89.1 1.8 27.1 1.9
Net Cash Provided by/Used in Investing Activities (21.5) (193.9) (12.1) (18.1) (2.0)
Net Cash Provided by/Used in Financing Activities1 (3.9) 130.6 1.6 1.3 2.3
Cash and Cash Equivalents (as of 31. December)2 32.2 71.9 40.7 54.6 44.1
Available-for-sale Financial Assets 106.0 188.4 79.7 79.8 64.3
Bonds, Available-for-sale 7.5 11.1 0 0 0
Financial Assets Categorized as “Loans and Receivables” Current Portion 157.0 119.3 10.0 0 0
Financial Assets Categorized as “Loans and Receivables” Net of Current Portion 50.0 0 0 0 0
1 In 2011, purchases of derivative financial instruments and proceeds from the sale of derivative financial instruments were reclassified from financing activities to operating activities in the statement of cash flows. In order to provide comparative information for the previous year, the figures for 2010 have been adjusted accordingly
2 In 2012, € 5.3 million in cash and cash equivalents was recorded under assets of disposal group classified as held for sale.
26GROUP MANAGEMENT REPORT
Analysis of Net Assets, Financial Position and Results of Operations

Net Assets
ASSETSAs of 31 December 2014, total assets amounted to € 426.5 million or € 21.2 million below the value on 31 December 2013 (€ 447.7 mil-lion). The decline in current assets of € 84.2 million was mainly due to the use of cash and cash equivalents for operating activities in 2014 and due to an investment in non-current financial assets of € 50.0 million.
The majority of cash was invested in various securities. As of 31 December 2014, an amount of € 106.0 million (31 December 2013: € 188.4 million) was invested in various money market funds which were reported in the line item “securities, available for sale.” The line item “bonds, available for sale” contained bonds in the amount of € 7.5 million (31 December 2013: € 11.1 million).
Other receivables increased from € 119.5 million as of 31 Decem-ber 2013 to € 157.1 million. This line item mainly included differ-ent types of investments that were classified as “loans and receiv-ables.” The partial amount of € 4.7 million of the purchase price for the divested business AbD Serotec was retained in an escrow ac-count as of 31 December 2013 and released in the third quarter of 2014.
In comparison to 31 December 2013, non-current assets increased by € 63.0 million, mainly due to a long-term investment of liquid funds in the amount of € 50.0 million and due to a € 15.4 million rise in intangible assets under development resulting from the payment to Emergent. This increase was partially offset by an im-pairment of € 4.1 million on patents, licenses and laboratory equip-ment.
LIABILITIESThe decrease in current liabilities from € 35.4 million on 31 De-cember 2013 to € 32.7 million on 31 December 2014 resulted pri-marily from a decrease in the item “tax liabilities” of € 1.9 million and a decline in “deferred revenue” of € 1.2 million. These declines were partially compensated by the increase in “trade payables and accrued expenses” of € 0.6 million.
Non-current liabilities (31 December 2014: € 45.0 million; 31 De-cember 2013: € 60.1 million) declined by € 15.1 million in compar-ison to 31 December 2013 mainly due to the decrease in deferred revenue.
STOCKHOLDERS’ EQUITY As of 31 December 2014, Group equity totaled € 348.8 million com-pared to € 352.1 million on 31 December 2013.
The number of shares issued totaled 26,456,834 as of 31 December 2014 of which 26,005,944 shares were outstanding (31 December 2013: 26,220,882 and 25,880,992 shares, respectively).
Compared to 31 December 2013, the number of authorized ordi-nary shares increased from 2,335,822 to 4,957,910. This resulted from the creation of the new Authorized Capital 2014-I at the An-nual General Meeting of 23 May 2014. The number of ordinary shares of conditional capital decreased from 8,057,470 to 7,166,848 as the Conditional Capital 1999-I in the amount of € 70,329 and the Conditional Capital 2008/II in the amount of € 212,077 were can-celed. Conditional Capital 2003-II was reduced by € 372,264 from € 725,064 to € 352,800. A further reduction of Conditional Capital 2003-II of € 235,952 to a total of € 116,848 resulted from the exer-cise of 235,952 conversion rights in 2014. The reduction of Condi-tional Capital through the exercise of 235,952 conversion rights was registered for entry in the commercial register in January 2015.
As of 31 December 2014, the value of treasury stock increased by € 7,833,944 to € 14,251,962 compared to its level on 31 December 2013 as a result of MorphoSys’s repurchase of 111,000 of its own shares on the stock exchange. As of 31 December 2014, MorphoSys held 450,890 of its own shares (31 December 2013: 339,890).
Financing
As of 31 December 2014, the Company’s equity ratio amounted to 82 % compared to 79 % on 31 December 2013. Currently, the Group is not financed by debt.
Off-Balance Sheet Financing
MorphoSys does not use any off-balance sheet financing instru-ments such as the sale of receivables, asset-backed securities, sale-and-leaseback transactions, or contingent liabilities in combi-nation with non-consolidated special-purpose entities.
Credit Rating
Currently, MorphoSys is not being assessed for its creditworthi-ness by any agency.
27GROUP MANAGEMENT REPORT
Analysis of Net Assets, Financial Position and Results of Operations

Comparison of Actual Business Results to Forecasts
In the 2014 reporting year, MorphoSys demonstrated very solid financial performance. The revenue and earnings targets pub-lished at the beginning of the financial year were raised by the Company in October. This upward revision was the result of lower than expected development costs as well as milestone payments from partners that had a direct impact on our results.
A detailed comparison of our forecasts with the actual results can be found in table 8.
TAB L E
07Multiple-Year Overview –
Balance Sheet Structure1
in million € 12/31/2014 12/31/2013 12/31/2012 12/31/2011 12/31/2010 12/31/2009
Assets
Currtent Assets 322.4 406.6 142.9 153.9 132.5 155.6
Non-current Assets 104.1 41.1 40.6 73.7 77.3 50.5
Assets of Disposal Group Classified as Held for Sale 0 0 40.9 0.8 0 0
Total 426.5 447.7 224.3 228.4 209.8 206.1
Equity and Liabilities
Current Liabilities 32.7 35.4 11.9 23.8 21.4 24.3
Non-current Liabilities 45.0 60.1 6.6 7.5 2.5 7.9
Liabilities of Disposal Group Classified as Held for Sale 0 0 3.7 0 0 0
Stockholders’ Equity 348.8 352.1 202.0 197.1 185.9 173.9
Total 426.5 447.7 224.3 228.4 209.8 206.1
1 Differences due to rounding
28GROUP MANAGEMENT REPORT
Analysis of Net Assets, Financial Position and Results of Operations

TAB L E
08Comparison of
Actual Business Results to Forecasts
2014 Targets 2014 Results
Financial Targets Group revenues at the upper end of the range of € 58 million to € 63 million (initial guidance was € 58 million to € 63 million; guidance raised to the upper end of the range on 22 October 2014)
Group revenues of € 64.0 million
Investment in proprietary products and technolo-gies in an amount of € 36 million to € 41 million
Investment in proprietary products and technolo-gies in an amount of € 36.5 million
EBIT of € – 5 million to € – 8 million (initial guidance was € – 11 million to € – 16 million; adjusted on 22 October 2014)
EBIT of € – 5.9 million
Proprietary R&D MOR103 (out-licensed to GSK) • Presentation of phase 1b trial data in multiple
sclerosis (MS)
MOR103• Presentation of clinical data from phase 1b trial
in MS at the ACTRIMS-ECTRIMS meeting in September
• Transfer of complete responsibility for further development to GlaxoSmithKline upon the trial’s completion
MOR202• Data from the phase 1/2a trial in multiple
myeloma• Plan further trials with partner Celgene
MOR202• Data from the phase 1/2a trial in multiple
myeloma expected in 2015• Decision to expand clinical development plan
in multiple myeloma with partner Celgene: pomalidomide as new combination partner
MOR208• Conclusion and preliminary data from phase 2
trial B-ALL* in the second half of 2014• Continuation of phase 2 trial in NHL, prelimi-
nary data before the year end
MOR208• Presentation of final data from the phase 1/2a
trial in CLL/SLL at the ASH annual conference• Presentation of clinical phase 2 data for NHL
monotherapy at the ASH annual conference
Partner Pipeline
Progress of partnered development programs
• Net increase of nine partnered programs• Initiation of a phase 1 trial of a HuCAL antibody
against inflammatory diseases by partner Novartis
• Initiation of a phase 1 trial of a HuCAL antibody in the area of diabetic eye disease by partner Novartis
• Initiation of a phase 1 trial of a HuCAL antibody in the area of oncology by partner Novartis
• Initiation of phase 3 trials of the HuCAL anti-body guselkumab (CNTO1959) in moderate to severe psoriasis by partner Janssen Biotech
*SEE GL OSSARY page 1 2 8
29GROUP MANAGEMENT REPORT
Analysis of Net Assets, Financial Position and Results of Operations

The Management Board’s General Assessment of Business Performance
The Management Board can look back on a successful 2014 finan-cial year for the MorphoSys Group. As intended, MorphoSys ex-panded its pipeline further and ongoing programs advanced successfully. A number of promising results were announced by the more advanced trials. MorphoSys strengthened its proprietary portfolio through the in-licensing of the promising drug candidate MOR209/ES414 from Emergent BioSolutions and also through the acquisition of the lanthipeptide technology for drug development from Lanthio Pharma. Several collaborations this year verified that the Ylanthia technology of MorphoSys has the potential to win clearly differentiated antibodies against selected target molecules, including a major alliance with Merck Serono in the area of immuno-oncology.
In the Partnered Discovery business segment, the projects initi-ated by our partners are developing well. However, shortly before the year’s end MorphoSys’s partner Roche announced it had stopped one of three ongoing phase 3 trials with the Alzheimer’s compound gantenerumab. As a result, potential market approval of gantenerumab may be delayed by several years. This event highlights the advantages of our business model and of a broad pipeline of development candidates.
In the 2014 financial year, revenues of the MorphoSys Group reached € 64.0 million. The Company had an EBIT of € – 5.9 million and incurred a loss as a result of the intensified development of its proprietary research pipeline, as already announced. The equity ratio of 82 % and liquidity of € 352.8 million testify to the Compa-ny’s solid financial position.
In the reporting year, the Partnered Discovery segment again made the largest contribution to our business success. The Propri-etary Development segment also generated revenue from the part-nerships concluded with GlaxoSmithKline and Celgene in 2013. Due to the successful development of both business segments, MorphoSys has continued to invest significantly in its proprietary product and technology development.
These investments were directly reflected in the product pipeline. MorphoSys’s partnered and proprietary pipeline made strong progress. Janssen brought the HuCAL antibody guselkumab into phase 3, whereby MorphoSys already has three programs in pivotal trials.
Accounting Judgments
In the 2014 consolidated financial statements, no accounting poli-cies were applied nor related options exercised that differed from those in prior years and that, if applied or exercised differently, would have had a material effect on net assets, financial position, or balance sheet structure. Information on the effects of the Man-agement Board’s use of estimates, assumptions and judgments can be found in the Notes to the Consolidated Financial Statements.
30GROUP MANAGEMENT REPORT
Analysis of Net Assets, Financial Position and Results of Operations

Outlook and Forecast
MorphoSys has always enjoyed a solid reputation for its lead-ing-edge technology, but it is the Company’s extensive pipeline that is now becoming the center of attention. By maximizing the number of development programs, MorphoSys raises its future po-tential and limits the risk associated with the development of new drugs.
Overall Statement on Expected Development
The strategic focus of MorphoSys lies in the development of a broad and sustainable pipeline of innovative drug candidates, both on a proprietary basis and with partners. The foundation of these drug candidates is MorphoSys’s established and proven technolo-gies, and the Company continues to invest in their development. In the therapeutic area, the commercialization of these technologies provides cash flows secured by contracts from long-term partner-ships with large pharmaceutical companies. MorphoSys also prof-its from the successful development of drug candidates through milestone payments and royalties from product sales as soon as the drugs reach the market.
The Group’s stable cash flow and strong liquidity make it possible to further invest in the proprietary development of drugs and tech-nologies. In the year 2015, the Management Board expects the fol-lowing developments: • Further investment in proprietary product candidates resulting
from the start of additional clinical trials. • Continued expansion of proprietary development activities
through in-licensing and possibly company acquisitions, co-de-velopment, or new proprietary development.
• Investments in technology development to maintain the Compa-ny’s leading position in the field of antibody and related technol-ogies. The Company expects to sign new strategic agreements based on its proprietary technology, with a focus on gaining ac-cess to innovative target molecules and compounds.
• Expansion of the therapeutic antibody pipeline as part of the partnership with Novartis.
Strategic Outlook
MorphoSys’s business model is based on its proprietary technolo-gies, including the HuCAL antibody library, the Slonomics plat-form, the Ylanthia antibody library, as well as the Company’s abil-ity to develop innovative drug candidates. The management at MorphoSys intends to expand the Company’s portfolio of propri-etary drug candidates and will drive investment in this area ac-cordingly. MorphoSys will also continue to concentrate on the use and expansion of its technologies in fast-growing and innova-tion-driven areas of the healthcare sector.
In the Proprietary Development segment, MorphoSys develops proprietary therapeutic antibodies in the area of inflammatory dis-ease and oncology. MorphoSys will consider entering into alli-ances for the further development of its proprietary candidates on a case-by-case basis. Under certain conditions, individual projects could remain in proprietary development for an extended period of time and possibly to the point of commercialization.
The Partnered Discovery segment generates cash flows secured by contracts based on long-term collaborations. The development of therapeutic antibodies within partnerships will remain a central pillar of MorphoSys’s strategy. The therapeutic pipeline should continue to grow and mature in the years to come and lead to addi-tional milestone payments. The broad pipeline promises an im-pressive number of market-ready, therapeutic antibodies in the coming years and, consequently, financial participation in the form of royalty payments from product sales.
In the foreseeable future, MorphoSys will invest the majority of its financial resources in its own R&D activities so that it may expand its portfolio of proprietary compound candidates and strengthen its technology platform.
31GROUP MANAGEMENT REPORT
Outlook and Forecast

Expected Economic Development
According to forecasts by the World Bank, the global economy has not fully recovered from the effects of the financial crisis. In the new world economic outlook, the American organization predicts global growth of about 3 %. The loose monetary policies of central banks and the recovery in labor markets contributed significantly to a recovery in the USA and in the UK. The euro area and Japan are experiencing a hesitant recovery. China is also seeing a slow-down in the tempo of growth. In 2015, falling commodity prices, low interest rates and weaker world trade should become more vis-ible in global growth. Support is coming from the impact of the sharp decline in oil prices.
The German economy is expected to strengthen again later this year and the average annual growth in 2015 is expected to reach approximately 1 %. Consumer spending continues to be one of the main reasons for the continued growth. However, the introduction of nationwide minimum wage and pension packages could weaken the labor market and therefore consumption in the future. The weakening of the euro could, however, lead to an increase in Ger-man exports.
The US economy regained its former growth momentum and is predicted to see steady growth. Japan, while still lagging the US, China and India, is still the fourth largest economy in the world and will probably see better annual performance in 2015. Another stimulus program of nearly € 25 billion was launched to accelerate economic growth.
At the end of 2014, the euro crisis regained importance. Concerns surrounding the stability of the euro area surfaced again after the definite failure of the presidential elections in Greece and the sub-sequent victory by the left-wing populist party SYRIZA in the new elections in January 2015. Should Greece terminate the savings agreements with the EU and the International Monetary Fund (IMF), speculation would grow about Greece exiting the euro. In addition, the risk premiums for southern European government bonds would increase, which could be critical for Italy, in particular.
To prevent a further weakening of the euro exchange rate and counteract the threat of deflation, the European Central Bank re-solved a comprehensive program for the purchase of European government bonds. Bonds with a volume of € 60 billion are to be purchased monthly, and the total volume of the measure adopted amounts to € 1.1 trillion. The aim of the program is to avoid defla-tion, lower the interest rate level of bonds in crisis countries, ease the pressure on government budgets and stabilize the euro in the long-term.
Expected Development of the Life Sciences Sector
After three very successful years for the biotechnology sector, 2015 is expected to be another year of continued positive develop-ment. Historically low interest rates and a recovering global econ-omy should result in a continued flow of money into the sector. Scientific progress and a better understanding of biological rela-tionships, such as those in the field of immuno-oncology, led to both innovation and new drug approvals. In 2014, four out of ten newly approved drugs were for rare diseases and another 40 % were based on novel mechanisms of action and were new com-pounds. This trend will continue. According to a newly released report “The Global Outlook for Medicines Through 2018” from IMS Health, global spending on pharmaceuticals will increase by 30 % to US$ 1.3 trillion by the year 2018.
New drug approvals and innovations, as well as clearer guidelines for approval and a strong demand for novel drugs, will continue to lead to growth in the pharmaceutical and biotechnology indus-tries. The number of approvals could stay at a high level or even increase. Although the average revenue potential of newly ap-proved drugs continues to rise, pricing and reimbursement poli-cies will remain the center of attention.
32GROUP MANAGEMENT REPORT
Outlook and Forecast

Expected Business Development
The contractually guaranteed proceeds until at least the end of 2017 from the Novartis agreement, the financial impact of the Celgene contract and our strong liquidity position, will allow MorphoSys to continue concentrating on expanding its partnered pipeline and increasing the value of its proprietary portfolio.
Over the next few years, the Company expects to start ten new partnered programs per year on average for its Partnered Dis-covery segment. However, due to the usual attrition rates in drug development, the net growth of the overall pipeline will be some-what lower. Additional partnerships with pharmaceutical and bio-technology companies based on the Ylanthia technology are ex-pected to occur. MorphoSys is striving to gain a larger share in the development activities of these collaborations. These partnerships, including those with academic institutes, are also expected to pro-vide access to new target molecules and therapeutic programs.
The approval of a therapeutic antibody based on proprietary tech-nology is not expected before 2016/2017. As one of the first part-ners, Novartis has announced publicly that it may possibly submit the therapeutic antibody bimagrumab (BYM338) for approval in 2016. Approval for guselkumab (CNTO1959), an antibody com-pound being developed by Janssen, may be applied for in 2016/2017.
Expected Personnel Development
The Group’s workforce in the two segments Proprietary Develop-ment and Partnered Discovery is expected to grow by approxi-mately 10 % during the 2015 financial year. Additional staff will be needed for the initiation of additional clinical trials for the Com-pany’s proprietary development programs MOR208, MOR202 and MOR209, the expansion of early proprietary development activi-ties and the development of existing and new technologies such as the lanthipeptide technology.
Future Research and Development
The Company’s R&D budget for proprietary drug development will rise significantly in 2015 in comparison to previous years. The majority of these investments will flow to the clinical develop-ment of the most advanced drug candidates MOR208, MOR202 and MOR209. Further investments are planned in the areas of target validation and antibody development as well as in the area of tech-nology development.
The steps planned for the Company’s proprietary portfolio in 2015 are expected to include: • Continuation of a phase 2 trials of MOR208 in NHL and B-ALL • Initiation of further combination trials for MOR208 in NHL • Continuation of a phase 1/2a trial of MOR202 with additional
cohorts with weekly dosing as well as a combination of MOR202 with pomalidomide and lenalidomide
• Initiation of the phase 1 trial for MOR209/ES414 in mCRPC as part of the cooperation with Emergent
• Continuation of the co-development program for MOR106 with Galapagos
• In-licensing of one or more target molecules or compounds for strengthening the proprietary development portfolio
• Further development of the lanthipeptide technology • Initiation and continuation of new development programs in the
area of antibody discovery and preclinical development
Expected Development of the Financial Position and Liquidity
MorphoSys has a solid financial base and predictable revenues, mainly due to its collaboration with Novartis and its development partnership with Celgene. In addition, MorphoSys receives perfor-mance-based milestone payments upon the successful develop-ment of product candidates. Based on this, the Management Board expects Group revenues for the 2015 financial year in the amount of € 58 million to € 63 million.
33GROUP MANAGEMENT REPORT
Outlook and Forecast
Based on management’s current planning, R&D expenses for pro-prietary programs and the development of technology are ex-pected to increase to a range of € 48 million to € 58 million in 2015. MorphoSys plans to initiate more clinical trials in addition to continuing the trials currently underway for MOR208 and MOR202.
The Company expects an EBIT of approximately € – 20 million to € – 30 million in 2015. This 2015 forecast does not include any additional development costs for newly in-licensed programs.
In the years ahead, there will be an increasing impact on net as-sets and the financial position from one-time events, such as the inlicensing and out-licensing of proprietary products, major mile-stone payments and royalties related to HuCAL antibodies that reach the market. Just as such events can cause us to significantly exceed our financial targets; failures in drug development can also have a negative impact on the MorphoSys Group. In the near fu-ture, the Company’s revenue growth will depend on its entry into new partnerships and/or on out-licensing proprietary programs. Starting in 2016/2017, royalties on marketed products could begin to contribute to revenue growth.
At the end of the 2014 fiscal year, the liquidity position of MorphoSys amounted to € 352.8 million (31 December 2013: € 390.7 million). The decrease in the liquidity position was due to investment in the Company’s proprietary research and develop-ment. In connection with the estimated negative financial result for 2015, the liquidity position is expected to further decrease. MorphoSys sees the advantage of having a strong liquidity posi-tion that can be used to accelerate future growth through strategic measures, such as the in-licensing of compounds and investments in promising companies. The funds can also be used to increase investment in the Company’s proprietary portfolio of therapeutic antibodies.
DIVIDENDSThe financial statements of MorphoSys AG under German account-ing principles report an accumulated profit which can be used for distribution. With the estimated losses for 2015, the Company will no longer report an accumulated profit. MorphoSys will continue to invest in the development of proprietary drugs as well as in further in-licensing and acquisition projects in order to continue to create shareholder value and open up new growth opportunities. Therefore, the Company does not anticipate paying a dividend in the foreseeable future.
This outlook is based on the assumptions of the Management Board and takes into account all factors which were known at the time of preparing this Annual Report and those which could influ-ence our Company in the year 2015 and in the years thereafter. Future results may differ materially from expectations, which are described in the section “Outlook and Forecast.” The most import-ant risks are discussed in the risk report.
34GROUP MANAGEMENT REPORT
Outlook and Forecast

Shares and the Capital Market
MorphoSys shares performed in line with the development of our pipeline and were extremely positive during the 2014 financial year. The shares rose to a multi-year high of € 86 and above in mid-December 2014. The market capitalization* of MorphoSys AG reached € 2 billion in September 2014. In December 2014, with the termination of one of three trials with the Alzheimer’s disease candidate gantenerumab by MorphoSys’s partner Roche, the share price declined until the year’s end by almost 12 % from its highest level, but still gained 37 % for the full year. Thus, MorphoSys shares outperformed the benchmark indices: During the same period, the TecDAX* rose 18 % and the NASDAQ Biotech Index* increased 34 %.
Stock Market Development
The year 2014 was a turbulent year for the stock market, particu-larly in Europe. Economic fears dominated the eurozone and polit-ical uncertainties weighed heavily on the export-led German economy. The US stock markets, however, delivered an impressive performance during the reporting year due to strong economic data. In the US alone, there were nearly US$ 9.3 billion in proceeds from 106 IPOs executed by companies in the life science* industry (2013: US$ 7 billion, 52 IPOs). In 2014, as in previous years, the US market was a focus of MorphoSys’s investor relations activities due to strong interest in investing in biotechnology companies.*SEE GL OSSARY page 1 2 8
Liquidity and Index Membership
The average daily trading volume of MorphoSys’s shares across all trading platforms in the regulated market has nearly doubled in 2014 compared to the previous year, rising to € 11.9 million (2013: € 6.9 million). This development is associated with a higher inter-est in the stock and due to the increase in share price during the year. On the TecDAX, the index for the 30 largest technology stocks on the Frankfurt Stock Exchange, the trading volume of the average shares traded also grew more than 40 %. MorphoSys was able to further consolidate its position in the TecDAX in 2014. By
the end of the year, MorphoSys ranked 9th in terms of trading volume (year-end 2013: ranked 11th) and ranked number 8 mea-sured in terms of market capitalization (year-end 2013: ranked 7th).
In addition, the daily trading average on the alternative trading platforms (“dark pools”) amounted to approximately 61,900 MorphoSys AG shares valued at € 4.4 million in 2014 (2013: ap-prox. 35,000 shares valued at € 1.6 million).
Common Stock
The Company’s common stock increased to 26,456,834 shares or € 26,456,834.00 in 2014. This increase resulted from the exercise of 235,952 convertible bonds.
Until the year 2010, MorphoSys issued stock options and non-in-terest-bearing convertible bonds under its employee incentive pro-gram. In 2011, this plan was converted into a performance share plan. The Company repurchases shares annually for this plan. A detailed description of this program can be found in the Corporate Governance Report of this Annual Report. In April 2014, 32,513 performance shares were issued to the Management Board and the Senior Management Group under the long-term incentive plan (LTI plan). For more information on this topic, please refer to the Notes (see section 7.3.4). During the reporting year, no additional stock options were issued to the Management Board, members of the Senior Management Group or the workforce.
35GROUP MANAGEMENT REPORT
Shares and the Capital Market

36GROUP MANAGEMENT REPORT
Shares and the Capital Market
F I G URE
09 Performance of the MorphoSys Share in
2014
12/18/2014HIGHEST LEVEL +51.7 %
04/15/2014 LOWEST LEVEL -3.0 %
m o rph osys nasdaq b iotechn o lo gy inde x tecda x(1 January 2014 = 100 %)170
160
150
140
130
120
110
100
90
80
JAN FEB MAR APR MAY JUN JUL AUG SEP OCT NOV DEC
F I G URE
10 Comparison of the
MorphoSys Share Price Development with
Benchmark Indices between 2010 and 2014
550
500
450
400
350
300
250
200
150
100
50
0
2010 2011 2012 2013 2014
m o rph osys nasdaq b iotechn o lo gy inde x tecda x(1 January 2010 = 100 %)

International Investor Base
During the reporting year, various voting right notifications were issued in accordance with Sections 21, 25 and 26 of the German Securities Trading Act (WpHG). These notifications were published on the MorphoSys website under the heading Media & Investors – Stock Information – Shareholder Structure.
According to the definition given by the Deutsche Börse, at the end of the reporting year 92.7 % of the shares of MorphoSys AG were in free float. Novartis Pharma AG (Basel, Switzerland) held about 5.6 % and Celgene Netherlands II BV (Amsterdam, The Nether-lands) about 3 % of the shares. The share of international institu-tional investors stayed at approx. 70 %. According to the latest voting rights announcement, our largest additional single share-holders were Massachusetts Mutual Life Insurance (Oppen-heimer Funds, Springfield, MA, USA) holding 4.98 %, Perceptive Life Sciences Master Fund (New York, NY, USA) holding 4.89 %, Baillie Gifford Overseas Limited (Edinburgh, UK) holding 3.1 % and Invesco Advisers Inc. (Atlanta, GA, USA) holding 3 %.
An overview of the current shareholder structure is also accessible on the Company’s website (Media & Investors – Stock Informa-tion – Shareholder Structure).
Annual General Meeting
On 23 May 2014, the Management and Supervisory Boards of MorphoSys AG welcomed shareholders to the Company’s 16th Annual General Meeting in Munich. The shareholders and proxies attending represented nearly 48 % of the common stock of MorphoSys AG (2013: 41.6 % of the common stock represented). All nine agenda items submitted for resolution were adopted by a clear majority. This year, the Annual General Meeting is scheduled for 8 May 2015 and will take place again in Munich.
TAB L E
09Key Data for the MorphoSys Share
(31 December)
2014 2013 2012 2011 2010
Total Stockholders’ Equity (in million €) 348.8 352.1 202.0 197.1 185.9
Number of Shares Issued (number) 26,456,834 26,220,882 23,358,228 23,112,167 22,890,252
Market Capitalization (in million €) 2,027 1,464 685 405 424
Closing Price in € (Xetra) 76.63 55.85 29.30 17.53 18.53
Average Daily Trading Volume (in million €)1 11.9 6.9 1.9 1.8 1.1
Average Daily Trading Volume (in % of Share Capital)1 0.65 0.59 0.38 0.38 0.26
1 Figures from 2010 to 2011 only include trading on Xetra and German regional exchanges.
37GROUP MANAGEMENT REPORT
Shares and the Capital Market

Investor Relations Activities
In the course of the 2014 financial year, MorphoSys further in-creased its communication with the capital markets. The Company presented at 26 international investor conferences and at a number of road shows and individual meetings in Europe and the US. The greatest interest was seen in the USA, where a large number of specialized healthcare investors have their headquarters. At the publication of the annual, half-yearly and quarterly results, the Management Board also held telephone conferences where they reported on past and future business developments and answered questions from analysts and investors.
Of particular interest at the investor meetings, aside from the gen-eral progress of the drug pipeline, was the development of the pro-prietary portfolios, which included ten active programs at the end of the reporting year.
At the end of the year, as in the prior year, there were a total of 11 analysts monitoring and evaluating the development of the MorphoSys share.
MorphoSys took first place for the TecDAX in the competition “Investors’ Darling 2014 – Capital Market Strategist of the Year” in which Manager Magazine and the Handelshochschule Leipzig evaluated the capital market communications of all index-listed stock companies. Next to the quality of classical financial report-ing and the IR website, the evaluation also included investor pre-sentations and capital market performance.
More detailed information on the MorphoSys share, the financial ratios, the Company’s strategic direction and the recent develop-ments in the Group may be found on the Company’s website (“Me-dia & Investors”).
TAB L E
10Analyst Recommen-
dations (31 December 2014)
Buy/Overweight Hold Sell n/a
6 4 0 1
Buy/Overweight; Hold; Sell; n/a = not available (no rating)
38GROUP MANAGEMENT REPORT
Shares and the Capital Market

Sustainable Business Development
In addition to the financial performance indicators, which are pre-sented in the chapter “Analysis of Net Assets, Financial Position and Results of Operations,” MorphoSys uses carefully selected non-financial performance indicators to promote sustainable busi-ness development. The Company sees sustainability as an environ-mental and social responsibility towards present and future gener-ations. As a research-based biotechnology company, adherence to the highest environmental, social and ethical standards goes hand in hand with long-term economic success. This chapter outlines the measures that have been taken during the reporting year to meet these standards. Information on the management structure and the corporate governance practices of MorphoSys can be found in the Corporate Governance Report.
Sustainable Corporate Management
A hallmark of MorphoSys’s corporate management is sustainable and responsible behavior in order to add important value to soci-ety. This is true at all levels of management from both a short- and long-term perspective. This goal is inherent to the Company’s core activity of developing ever more effective and safer drugs. In daily operations, high value is placed on working in harmony with strict ecological and social principles. Therefore, MorphoSys follows a business model aimed at sustainable growth that protects the in-terests of its shareholders, creates long-term value and evaluates processes in terms of their effect on the environment, society, pa-tients and employees. Internally, this business model is reflected in our forward-looking human resources policy, which takes the needs of the employees seriously.
MorphoSys bases its long-term and sustainable business success on targeted and innovative research and development. Biotechno-logically produced drugs command an increasing share of the healthcare of a growing and aging population. Comprehensive healthcare is one of the main challenges of the future and MorphoSys can make a valuable contribution through its drug can-didates. In management’s opinion, MorphoSys’s present business model does not contain any components which are contrary to the sustainable investment interests of the shareholders.
A comprehensive risk management system ensures that factors which could threaten sustainable corporate performance are iden-tified at an early stage and that appropriate countermeasures are taken, if necessary. MorphoSys only assumes a risk if there is ample opportunity to increase the enterprise value. At the same time, tremendous effort is being made to systematically identify new opportunities and to leverage our business success (more in-formation on risks and opportunities can be found on page 47).
The entire Management Board, chaired by the Chief Executive Officer, monitors compliance with the sustainability strategy Group-wide. The Credo as part of the Code of Conduct regulates the implementation of the strategy by employees in daily opera-tions. It is valid for all employees of the Group and is available in German and English. Routine employee training on the Code of Conduct in general and on specific sections of the Code ensures that the guidelines are understood and implemented. The Code of Conduct Committee consists of four members (the Chairperson and three other members) who are at the disposal of and may be contacted by all employees. A Compliance Officer coordinates the Compliance Management System. Detailed information on this topic can be found on page 71 of the Corporate Governance Re-port. Each employee can receive advice on all matters relating to legal compliance and corporate responsibility and report sus-pected cases or violations. This may be done on an anonymous basis, if preferred. Breaches of compliance are earnestly pursued and appropriate countermeasures are taken. However, no such violation has been reported to date, and the Company believes serious offenses that could materially affect the Group’s net assets, financial position and results of operations are unlikely in the future.
Detailed information on the SD KPIs used by MorphoSys can be found in the section “Strategy and Group Management” (p 02). The following report on the implementation of the corporate strat-egy of MorphoSys and its sustainable business development also follows the recommendations of the German Sustainability Code. These recommendations were originally presented by the Council for Sustainable Development in October 2011 with an updated ver-sion in October 2014.
39GROUP MANAGEMENT REPORT
Sustainable Business Development

Non-Financial Performance Indicators
ETHICAL STANDARDS AND COMMUNICATION WITH STAKEHOLDERSThe highest scientific and ethical principles when conducting hu-man clinical trials or animal testing are anchored in MorphoSys’s Code of Conduct. Above all, the Company follows the “Declaration of Helsinki” of the World Medical Association (WMA). Strict com-pliance with nationally and internationally applied regulations is mandatory for all MorphoSys employees as well as for sub-con-tractors.
Since European legislation requires the use of animal testing to determine the toxicity*, pharmacokinetics* and pharmacodynam-ics* of a compound candidate, the biotechnology industry cannot forgo such testing. MorphoSys does not have research laboratories of its own that are suitable for animal trials. Therefore, the Com-pany passes these trials on to contract research organizations (CROs*). In the course of its product development activities, MorphoSys contracts out animal trials according to the principles of good animal welfare and the respectful treatment of animals as set out in national and European regulations. MorphoSys has launched a quality assurance and control system with written standard operating procedures (SOPs). This system is maintained and continually improved to ensure that only those contract re-search organizations that follow the local, national and interna-tional regulations are contracted for animal studies. Trials are only carried out after the approval of the relevant ethics committee concerned and under the constant supervision of a veterinarian.
Institutes cooperating with MorphoSys must comply with the legal requirements for research involving animals and, under certain circumstances, also possess the quality assurance verification of Good Laboratory Practice (GLP*). This is how MorphoSys ensures that it is fulfilling its moral obligation for the respectful treatment of animals. In addition, as part of auditing, the trial sites, contract research institutes, the training and competency of the relevant staff, as well as animal welfare are all verified on location and conducted prior to the final award of the contract.
The Declaration of Helsinki mentioned above also defines the eth-ical principles followed by MorphoSys in dealing with healthy vol-unteers and patients during clinical trials. These trials are also carried out in compliance with Good Clinical Practice (GCP*). The trials are carried out in compliance with the relevant provisions on privacy and confidentiality. Respect for the rights, safety and wel-fare of all participants involved in clinical trials has the highest priority at MorphoSys. Clinical trials are initiated only after ap-
proval by the independent ethics committee concerned and/or the institutional review panel. Before participating in a clinical trial, each participant must voluntarily submit an informed consent.*SEE GL OSSARY page 1 2 8
The goal of MorphoSys’s business activities is to improve the health of patients through its scientific work. However, the Com-pany can only reach this objective if its activities also find social acceptance. This requires a continuous and open dialog with stakeholders in order for MorphoSys to understand the potential concerns regarding biotechnological approaches and so that it may explain its activities and their benefits. Consequently, MorphoSys is active in a variety of ways which range from participation in public information events to active support for the Communication and Public Relations task force of BIO Deutschland e.V.
PROCUREMENTThe Department of Central Purchasing and Logistics is responsi-ble for the purchase of external goods, services, consulting and logistics services for MorphoSys. Last year the department in-stalled a considerable number of new systems and processes to increase the long-term efficiency of its procurement management and to establish cost-effective purchasing solutions. In 2014, sev-eral preferred partnerships with suppliers were strategically strengthened through the introduction of special framework agreements. All suppliers selected by MorphoSys undertake to comply with all anti-corruption standards, human rights prac-tices, internationally recognized labor standards and data protec-tion laws. In the reporting year, the activities of the Department of Central Purchasing and Logistics secured savings of approxi-mately 7 % of the expenditures incurred in 2014.
ENVIRONMENTAL PROTECTION AND OCCUPATIONAL SAFETYIn an industry subject to stringent regulatory requirements, envi-ronmental protection and occupational safety are the key tasks of Group management. The department of environmental protection and occupational safety monitors the compliance with all relevant requirements Group-wide. Beyond the Company’s strict compli-ance with all legal requirements, MorphoSys has also initiated a number of Group-wide efforts for sustainable environmental man-agement and the effective protection of its employees.
40GROUP MANAGEMENT REPORT
Sustainable Business Development

A central task is the conservation of resources. In 2014, MorphoSys participated once again in the survey of the Carbon Disclosure Project (CDP) for monitoring internal resource consumption. For the sixth consecutive year, the Company took part in the study of this independent non-profit organization whose aim is to reduce greenhouse gases and ensure the sustainable use of water sup-plies. Once again, the study results showed that it was not neces-sary for the Company to take any action. Nevertheless, MorphoSys
uses the annual study results to routinely observe its consumption in an organized manner. This makes it easier for the Company to promptly correct any excessive consumption. Any resource con-servation measures implemented in the past were also actively pursued in the reporting year. These measures included energy and cost saving screenings, energy-efficient laboratory equipment and measures for the economical use of paper and printer toner.
41GROUP MANAGEMENT REPORT
Sustainable Business Development
F I G URE
11 Occupational Safety at
MorphoSys
ONLY SPECIALLY TRAINED EMPLOYEES ARE ALLOWED T O WORK WI TH T OXIC SUBSTANCES
PATHOGENIC ORGANISMS ARE PROCESSED IN LABORA-T ORIES WI TH PART ICULAR SAFET Y STANDARDS
LOWEST POSSIBLE AMOUNT S OF HAZARDOUS SUBSTANCES USED
ONLY CERT IFIED COMPANIES ARE AUTHORIZED BY MORPHOSYS T O DISPOSE OF CHEMICAL WASTE
INTRODUC T ION OF HAZARDOUS MATERIAL S FOR R&D PURPOSES :
• A dedicated biosafety team as defined by the “Gentechnik Sicherheitsverordung” (German Genetic Engineering Safety Directive) and other safety professionals perform an internal audit to assess the risk involved
• Specific safety and evacuation training for the employees working with the substances
• Assurance that all safety measures are implemen-ted before actual work commences
!

In 2014, MorphoSys again supported the joint initiative “Bike to Work” sponsored by a German health insurance company and the German Bicycle Club (ADFC). Because of this commitment, MorphoSys has been certified as a “bicycle-friendly operation” for the fifth consecutive time. In addition to this initiative, employees were offered an extensive range of preventative healthcare and health-promoting activities such as autogenic training, Pilates, back muscle training, ball sports, participation in marathons, etc. In seminars and lectures accompanied by psychologists, the staff was made familiar with the topic of mental stress and other types of stress. In an exploratory survey carried out at the end of 2014, all employees were asked to evaluate their current level of psycho-logical distress in the workplace. This analysis intended to serve as a leading indicator in order to initiate the necessary corrective measures on a timely basis.
With two reportable accidents, the number of occupational acci-dents in the reporting year equaled the previous year’s level. This rate is well below the average rate in Germany (14.5 accidents per 1,000 full-time employees as reported in the latest survey in 2013).
MorphoSys tries to minimize the amount of pollutants used in lab-oratory work. Only a specially trained group of people are permit-ted to deal with toxins. Work involving contagious pathogens can only be carried only in secure laboratories. For the disposal of chemical waste, MorphoSys commissions only those companies certified to dispose of chemical waste. MorphoSys also refrains from labeling antibodies with radioactive substances.
QUALITY ASSURANCEIt is the special responsibility of a biopharmaceutical company to adhere to the highest standards of quality and safety. MorphoSys follows detailed procedures and strict rules to avoid any security risks in drug development that may pose a serious threat to the patient and, thus, to the economic situation of the Company. This is how the Company guarantees the quality of the compound being tested, keeps the risks to participants of clinical trials as low as possible and ensures that the data can be collected reliably and correctly processed.
In order to control and regulate these processes, MorphoSys cre-ated an integrated quality management system for its proprietary development department that follows the principles of Good Manu-facturing Practice (GMP), Good Clinical Practice (GCP) and Good Laboratory Practices (GLP). An independent quality assurance de-partment ensures that all development activities comply with na-tional and international laws, rules and regulations. The Quality Assurance Manager reports to the CEO and coordinates all activi-ties directly with him. This helps us to achieve the high-quality standards that guarantee product quality, data integrity and en-sures the safety of the subjects.
The Quality Assurance department created a verification proce-dure using a risk-based approach. Based on this procedure, an au-dit is carried out on a selection of contract research institutes, sup-pliers and research sites included in the clinical trials, as well as on MorphoSys’s own departments.
For its proprietary development activities, MorphoSys has a manu-facturing license for the approval of tested compounds. The Com-pany has also been issued a certificate by the German authorities of the Government of Upper Bavaria confirming its compliance with the standards and guidelines of Good Manufacturing Prac-tice (GMP).
INTELLECTUAL PROPERTYThe proprietary technology and the ensuing drug candidates are MorphoSys’s most valuable asset. Therefore, it is critical to the Company’s success that these assets are protected by the corre-sponding patents and other appropriate measures so that they may be efficiently and exclusively utilized.
MorphoSys’s key technologies – HuCAL, Ylanthia and Slonomics – form the Company’s basis for success. Each single technology is protected by a number of patent families, which, in turn, are com-plemented by various independent technology patents. Most of these have now been issued in all major markets, including in the Asian markets, such as China. The spectrum of technology patents was enhanced sustainably in October 2014, with the acquisition of the lanthipeptide technology from Lanthio Pharma.
Our portfolio of development programs was also strengthened this financial year by the licensing agreement with Emergent BioSolutions for the co-development and co-promotion of the drug candidate MOR209/ES414. Like other proprietary development programs, this program is protected by a variety of patents and applications that address various aspects of the molecules and their use. The development candidates MOR103 (out-licensed to GSK) and MOR202 (in partnership with Celgene) are each pro-tected by more than half a dozen different patent applications covering different aspects of the compounds and thus provide effective protection. The relevant patents and associated protec-tion certificates are expected to expire by the year 2031. The MOR208 program is also protected by various patents lasting until their scheduled maturity. Excluding any potential patent office or regulatory extensions, this would mean the patent in the United States would run until the year 2029 and, in the case of the Euro-pean patent, until 2027. Excluding any possible patent office or regulatory extensions, patent protection for MOR209/ES414 is scheduled to run until at least 2032, assuming pending applica-tions are granted.
42GROUP MANAGEMENT REPORT
Sustainable Business Development

The programs that are developed in conjunction with or for part-ner companies are also protected by comprehensive patent protec-tion. There is close cooperation between the patent department of MorphoSys and the corresponding partners. All drug development programs have a term that greatly exceeds the term of the under-lying technologies.
Currently, MorphoSys’s patent lawyers are maintaining more than 40 different patent families, in addition to the numerous patent families pursued by the Company together with its partners. The patent portfolio is regularly analyzed and adapted to the Compa-ny’s corporate strategy.
PERSONNELMorphoSys relies on a future-oriented personnel policy in order to bind professionally and personally suitable employees from differ-ent disciplines to the Company. In an industry such as biotechnol-ogy, in which success relies heavily on the creativity and commit-ment of the workforce, employee retention and satisfaction are crucial factors for success. At the end of the financial year, the staff at MorphoSys comprised employees from 22 different nationalities (2013: 18), who have belonged to the Company for 5.8 years on average (2013: 5.4 years).
*SEE GL OSSARY page 1 2 8
43GROUP MANAGEMENT REPORT
Sustainable Business Development
F I G URE
12 Quality Management System at MorphoSys
MANAGEMENT BOARD
CORPORATE REQUIREMENT S/DEPARTMENTAL REQUIREMENT S
§REGULAT ORY REQUIREMENT S
QUALI T Y MANAGEMENT SYSTEMS
1
2
34
5
6
7 1Training and Qualification
2Self Inspection/ Internal Audits
3Documentation System
4Handling of Deviations, Change Control, Complaints, Out of Specification (OOS) and Recalls
5Batch Record Review/Batch Release
6SOP System
7External Audits (CMO*, CTO*, CRO*, clinical trial sites)

44GROUP MANAGEMENT REPORT
Sustainable Business Development
F I G URE
13 Seniority
(average duration in years)
5.39 5.80
2013 2014
F I G URE
14 Employees by Gender
in 2014
34%Previous year: 36 %
66%Previous year: 64 %
EXECUTIVESTRAINEES
20132013 20142014
EXECUTIVESTRAINEES
20132013 20142014
22
4 44
264339(number)(number)
6
Opportunities for extensive training, internal and external train-ing programs, special training and development programs and visiting conferences are available to employees of the various de-partments. In addition to technical training, MorphoSys also pro-motes the personal development of its employees. In some cases, this can include individualized coaching.
Executives assuming management responsibility at MorphoSys for the first time are required to take part in management semi-nars explicitly designed for MorphoSys. This training is offered in a group of several thematically related courses. The goal is to pro-vide participants with not only theoretical management knowl-edge, but also special knowledge that the Company expects its executives to know.
In 2014, as in the previous year, a two-day workshop took place for all MorphoSys managers. Under the motto “Entrepreneurship,” there were discussions on the Company’s strategy and its imple-mentation, process optimization, goal-oriented problem-solving and creativity management. By the end of this workshop, manag-ers had jointly prepared the basis for a Company-wide mission statement detailing the corporate goals, core values and drivers for the day-to-day work activities.
MorphoSys also actively promotes a career path for specialists and experts. This type of career promotion succeeds in maintaining flat hierarchies – even without staff responsibility. The goal is to give equal footing to traditional management career paths and professional careers, as well as to title and compensation struc-tures.
MorphoSys offers in-house vocational training in order to open up the prospects for a promising career, especially for young people. Equal consideration is even given to students without a diploma for occupations requiring training. As of 31 December 2014, MorphoSys had two trainees in its IT department and six trainees learning to become biology laboratory assistants (31 December 2013: three IT trainees; six trainees learning to become biology laboratory assistants; and one trainee training as a personnel ser-vices clerk).
As explained on page 17, the remuneration structure was adjusted for all employees in 2014. The annual bonus is now linked exclu-sively to the achievement of corporate goals. The individual perfor-mance of each employee is monitored by agreed personal targets and continues to be a key element of individual development. Em-ployees showing extraordinary performance or outstanding ideas are now rewarded promptly with an on-the-spot bonus payment in the form of cash, vouchers, or gift certificates for leisure activities.
Transparent communication within the workforce is a permanent component of MorphoSys’s corporate culture, as stated in the prin-ciples (Credo) of the Company. Every two weeks, general meetings are held, in which the Management Board shares the latest Com-pany developments with all employees. Employees present se-lected projects followed by an open question and answer session. Questions and feedback from the workforce can be taken directly in the meeting or submitted in advance in writing – anonymously if desired. In addition, the Company’s intranet with its integrated document management system provides all employees current relevant information in an organized manner.
In two-day introductory courses, new employees are made famil-iar with the Group and can become fully aware of the Company’s business processes by taking advantage of the information and individual presentations provided by all departments.
Free exercise and relaxation options, such as Pilates lessons or courses on autogenic training, promote health and socializing among employees beyond the departmental boundaries.
Appropriate policies for reconciling professional development with personal life are a strategic success factor for future-oriented com-panies. For several years, MorphoSys has therefore been offering employees a variety of options, such as flexible working hours and individual part-time packages. Modern IT equipment also allows employees to work seamlessly while traveling on business or from their home office. MorphoSys makes it easier for employees with family to re-enter into the work life through special offers and helps them combine work and family life. MorphoSys is a co-founder of the “BioKids” kindergarten in Martinsried. There are also special arrangements through a German service provider of-fering additional services for working family members.
45GROUP MANAGEMENT REPORT
Sustainable Business Development

MorphoSys makes every effort to protect employees from work-place hazards and maintain their health through preventive mea-sures. The extremely low number of occupational accidents demon-strates the success of our strict supervision of all occupational health and safety measures. During the year under review, as in the prior year, there were two reportable accidents at work. MorphoSys tries to keep the number of accidents at this low level and the safety and well-being of all employees at the highest level
possible. The Company does this through policies and training provided by the Department of Health & Safety and by offering routine medical examinations. The fall in attrition rate in the re-porting year to 5.6 % (2013: 5.8 %) is another indication of employ-ees’ strong identification with the Company.
46GROUP MANAGEMENT REPORT
Sustainable Business Development
F I G URE
15 Labor Turnover Rate
(in %)5.81 5.60
2013 2014

Risk and Opportunity Report
MorphoSys belongs to an industry characterized by constant change and progress. The challenges and opportunities in the healthcare industry are influenced by a wide variety of factors. Global demographic changes, medical advances and the desire for an ever increasing quality of life, all provide solid growth pros-pects for the pharmaceutical and biotechnology industries. Grow-ing regulatory requirements in the field of drug development and the cost pressure on health systems in particular must also be taken into account.
MorphoSys strives to systematically identify new opportunities and utilize them for business success and generate a long-term increase in enterprise value. However, entrepreneurial success is not possible without conscious risk taking. Through its worldwide operations, MorphoSys is subject to a number of risks that may affect its business. MorphoSys’s risk management system identi-fies these risks, evaluates them and takes the appropriate mea-sures to avoid these risks and achieve its corporate objectives. Regular strategy review ensures that the opportunities and risks are well balanced. MorphoSys only assumes a risk if it also offers the Company an opportunity to increase its value.
Risk Management System
The risk management system is a central component of MorphoSys’s corporate governance and serves to ensure the prin-ciples of good corporate governance and the fulfillment of regula-tory requirements.
MorphoSys has a comprehensive system in place to identify, as-sess, communicate and handle risks safely in all parts of the Com-pany. Its risk management system identifies risks early, allowing the appropriate action to be taken to limit operating losses and avoid any risks that could jeopardize the Company’s existence. All measures used to minimize risk are assigned to individual risk officers, most of whom belong to the Senior Management Group of MorphoSys.
As part of a systematic risk assessment process, all important risks concerning the Company’s different business segments and the Company as a whole are assessed. These risk assessments are held twice a year. Risks are assessed by comparing their quanti-fiable financial impact on the MorphoSys Group and their proba-bility of occurrence with or without the initiation of a risk minimi-zation process. This methodology is applied for an evaluation period of twelve months and over a medium-term period of three years in order to include obligations taken on for the Company’s proprietary development with longer maturities. In addition, the expanded strategic risk assessment is based on a long-term period of more than three years. An overview of MorphoSys’s current risk assessment can be found in tables 11 and 12.
Risk managers enter their risks into a Group-wide IT platform, which makes monitoring, analyzing and documenting risk much easier. The risk management system distinguishes between risk owners and risk managers. A risk owner is usually the relevant department head (typically a member of the Senior Management Group). Department employees can also be risk mangers if the risks that fall under their area of responsibility are recognized by the risk management system. Risk owners and risk managers are asked to update and reevaluate their risks at half-yearly intervals. The process for this is coordinated and managed by the Corporate Finance & Corporate Development department. This department also oversees the assessment process, summarizes the main con-tents and presents them to the Management Board and the Super-visory Board on a regular basis. The entire evaluation procedure is based on standardized evaluation methods. The system was im-proved in the reporting year by adding a “heat map.” The heat map represents graphically the effectiveness of the controls imple-mented for the five major risks (one-year and three-year view). Thus, the effects of the monitoring activities for the various risks can be graphically visualized. Risk management and the monitor-ing of operations are carried out by the individual managers. The changes in the risk profile brought about by these measures are recorded at regular intervals. A periodic audit by external con-sultants ensures that the risk management system is being devel-oped steadily and that possible changes in Company’s risk areas are promptly corrected. The risks and opportunities management
47GROUP MANAGEMENT REPORT
Risk and Opportunity Report

system consists of a bottom-up method to identify short- and me-dium-term risks, as well as a top-down approach in the area of strategic risks and opportunities. The top-down approach system-atically identifies global strategic risks and opportunities to get a complete picture of the opportunities and risks. Examples of these risks include environmental and industry risks, personal risks and risks that may result from the public perception of the Com-pany. Twice a year, at the same regular intervals used for recogniz-ing other risks, a workshop on the top-down approach takes place with selected members of the Senior Management Group. This workshop addresses various areas of the Company and recognizes and discusses strategic risks and opportunities, also those occur-ring over a period of three years and more. The evaluation process is exclusively qualitative. A presentation of these risks is listed in table 12.
Principles of Risk and Opportunity Management
MorphoSys always encounters both risks and opportunities. This may cause a tangible impact on net assets and financial position or have a direct influence on intangible assets, such as the Com-pany’s image within the industry, or on the Company’s trademark.
MorphoSys defines risk as internal or external events having an immediate impact on the Company. This includes an assessment of the potential financial impact on the Company’s targets. Opportu-nities are in direct relation to risk and seizing opportunities posi-tively impacts the Company’s targets, whereas the occurrence of risks has a negative influence.
Responsibilities under the Risk and Opportunity Management System
The Management Board of MorphoSys AG is responsible for the risk and opportunity management system. The Board ensures that all opportunities and risks are presented, evaluated and monitored in a comprehensive manner. The Department of Corporate Finance & Corporate Development coordinates the implementation of these measures and routinely reports to the Management Board. The Su-pervisory Board has appointed the Audit Committee to monitor the effectiveness of the Group’s risk management system. The Audit Committee routinely reports its findings to the entire Supervisory Board, which is also informed by the Management Board twice a year.
Accounting-Related Internal Control System
MorphoSys uses strict internal controls, Group-wide reporting guidelines and other measures such as employee training and on-going professional training with the goal of maintaining accurate bookkeeping and accounting and ensuring the reliability of the financial reporting in the consolidated financial statements and the Group Management Report. The essential components of Group accounting are prevention, monitoring and detection measures intended to ensure the security and control in accounting and operational functions. More details on the internal control system for financial reporting can be found in the Corporate Governance Report.
48GROUP MANAGEMENT REPORT
Risk and Opportunity Report

Risks
RISK CATEGORIESMorphoSys categorizes its key risks in the following six catego-ries: • Financial risks (for example, risks resulting from insolvencies
and payment defaults; license fees, research funding and mile-stones that are lower-than-anticipated; and risks associated with any form of financing and financial instruments, such as cash investments, bank failures, currencies, interest rates, taxes and debt collection).
• Operational risks (risks such as those in the areas of procure-ment/production, customers, personnel, risks customary for the biotechnology industry such as risks related to preclinical or clinical trial results).
• Strategic risks (for example, mergers and acquisitions (M&A), investments, R&D, corporate image, superior products and tech-nologies of competitors, portfolio development).
• External risks (risks beyond the Company’s control, such as eco-nomic, political and legal risks, as well as risks associated with companies in the biotechnology and pharmaceutical industry, such as intellectual property protection and risks in the regula-tory environment when seeking the approval of new drugs).
• Organizational risks (for example, those concerning IT, facilities management, succession planning, business interruption and process delays as a result of the exaggerated complexity and an excessive number of projects).
• Compliance risks (for example, breach of US FDA and European EMA regulations, quality management policies, accounting standards, corporate governance, as well as violations of the Ger-man Stock Corporation Act).
49GROUP MANAGEMENT REPORT
Risk and Opportunity Report
F I G URE
16 The Risk and Opportu-
nity Management System at MorphoSys
DEFINEOBJECTIVES
ASSESSRISK
TECHNOLOGY SCOUTING
INNOVATION CAPITAL
CORPORATE GOVERNANCE
INTERNAL AUDIT
SUPERVISORY BOARD
MANAGEMENT BOARD
DISCUSSION FORUM
IMPLEMENTMEASURES
RISKMANAGEMENT
COMPLIANCEMANAGEMENT
OPPORTUNITYMANAGEMENT
INTERNALCONTROL SYSTEM
BUSINESS DEVELOPMENT
MONITORSYSTEM

FINANCIAL RISKSFinancial risk management at MorphoSys aims to limit financial risks and reconcile these risks with the requirements of its busi-ness.
Financial risks may arise within the context of licensing agree-ments, for example when projects (products or technologies) are delayed or do not materialize, or are out-licensed to a different de-gree than planned. A corresponding risk also arises when reve-nues do not reach the level projected or when costs are higher than planned due to higher resource requirements. Detailed project preparation, for example through an intensive exchange with in-ternal and external partners and consultants, ensures optimal po-sitioning early in the process and thus represents an important measure for minimizing risk. Financial risks associated with the Company’s proprietary programs could be considerably reduced by the successful introduction of MOR103 and MOR202 into part-nerships in the 2013 financial year. The financial risks relating to MOR208, a completely proprietary program, remain entirely with MorphoSys. With the programs introduced into partnerships, MorphoSys retains some risk with respect to the clinical develop-ment. The early termination of concluded development partner-ships may force MorphoSys to bear future development costs on its own. Such a termination could have a major impact on the income statement and the financial planning.
Due to the continued difficult European economic situation, bank insolvencies still pose a financial risk. Therefore, MorphoSys con-tinues to invest only in funds and products deemed safe – to the extent this is possible and can be estimated – from banks that have maintained their high rating and/or are secured by a strong partner. We have simulated various scenarios and have formed ap-propriate contingency plans. In addition, the appropriate returns of financial assets represent a risk, especially since key interest rates have reached an extremely low level.
OPERATIONAL RISKSOperational risks include risks relating to the exploration and de-velopment of proprietary drug candidates and those found in the Corporate Purchasing and Logistics department. Operational risks also include personnel risks, such as the risk of being able to re-cruit suitable employees or the loss of highly qualified and experi-enced staff.
The failure of a clinical trial before out-licensing to partners – which does not necessarily imply the failure of an entire pro-gram – can result if the trial data did not produce the expected results, showed unexpected adverse side effects, or the compila-tion of the data was incorrect. The design of clinical trials and the draft of development plans are always completed with the utmost care. This has given the trials in clinical testing the best opportu-nity to show clinically relevant data and convince regulatory agen-cies and potential partners. In addition to the existing internal know-how, external experts are also involved. Special steering committees and panels are formed to monitor the progress of clin-ical programs.
Antibody production is a significant cost factor in the area of drug development. A crucial role is played by the obligation to comply with the requirements of the international drug regulatory agen-cies at every step of production in order to guarantee the highest quality of the compounds and ensure patient safety. The produc-tion process for biopharmaceuticals is usually performed in cell culture systems of several thousand liters of culture volume and entails a variety of process steps that need to be carried out under strict supervision and officially controlled conditions up to the completion of the individual investigational medicinal products for use in patients. Therefore, lead times of up to one to two years – depending on the phase of the project – must be scheduled for the supply of antibody material. This supply planning, coupled with early strategic financial investments, are major factors in drug de-velopment due to the high complexity and associated risks in-volved in the production process and in clinical trial planning since they can both have a considerable effect on the speed and cost of development.
The Procurement & Logistics department cooperates closely with suppliers to avoid delivery delays, delivery bottlenecks and avert any additional costs. This relationship is supported by a periodic vendor evaluation that identifies potential problems and finds solu-tions that are communicated both internally and externally to the managers responsible.
Personnel risks occur in the area of recruitment and from the loss of “key performers.” Such risks become apparent when recruiting employees, particularly in light of how difficult it is to find candi-dates with the appropriate qualifications. The Company’s Human Resources department takes every opportunity to respond to these risks – including collaborations with external organizations – and improve the recruitment process. We begin our search for suitable employees as early as possible. In addition, the attractiveness of MorphoSys as an employer is presented to the public through ad-
50GROUP MANAGEMENT REPORT
Risk and Opportunity Report

vertising and trade shows portraying the Company as having an open and creative corporate culture. Next to recruitment, em-ployee retention is also a key element of human resource manage-ment in order to minimize the loss of key performers from the resignation of experienced and highly qualified employees. The continual comparison of industry-standard salary schemes en-sures employees are paid fairly and competitively. Furthermore, suitable salary components and employee interviews ensure a per-formance-based incentive system and support the long-term goal of binding the employee to the Company. Company parties, team building activities, sports and social events, contribute to a good working atmosphere.
STRATEGIC RISKSStrategic risks occur in the proprietary portfolios of therapeutic molecules. After successfully introducing two existing propri-etary programs into partnerships, making additions to the port-folio becomes the focus. Here, risks may arise if there is a lack of attractive targets and compounds or innovative technologies. These risks are also related to missed or failed M&A transactions that would have provided access to strategically important assets. One way MorphoSys responds to these types of risks, is to form multidisciplinary teams to take care of additions to the proprietary portfolios and identify which of the suitable therapeutic molecules can be in-licensed. A New Discovery team searches for suitable targets for developing novel therapeutic molecules using propri-etary or external technological platforms. In order to obtain long-term options for new technologies or therapeutic molecules, a pro-gram called “Innovation Capital” has been established, which invests venture capital in innovative start-up companies.
Development programs brought into partnerships can also fail or see the partnerships end on short notice or prematurely. This could force MorphoSys to search for new development partners or to bear substantial costs of further development fully on its own. There may be a delay or even a termination in the development of individual candidates. Not only could this lead to additional costs for MorphoSys, but it could also lead to a long-term loss of revenue due to delayed market entry.
Another strategic risk is that therapeutic antibodies will no longer be competitive in the distant future due to the existence of better molecules or more favorable therapeutic approaches or because proprietary drug candidates take too long to reach market readi-ness. This risk can also be classified as industry risk. MorphoSys attempts to minimize these risks using its own discovery activi-ties and detailed time schedules for its proprietary development programs. Here again, through the creation of Innovation Capital,
MorphoSys has a suitable tool to identify new trends at an early stage, invest in innovation and thereby participate in development. A scouting team also searches worldwide for new and innovative technologies and analyzes MorphoSys’s competitors regularly.
There is also a strategic risk of a possible non-renewal of the coop-eration agreement with Novartis. The current agreement is valid through 2017 and Novartis has an option to extend the agreement by an additional two years. Should Novartis not exercise this op-tion, MorphoSys would lose annual revenues of approximately € 40 million as of the 2018 financial year.
EXTERNAL RISKSExternal risks for MorphoSys are found, among others, in the con-text of its intellectual property. Patent protection of proprietary technologies is particularly important for MorphoSys. To reduce the risks in this area, MorphoSys is always on the lookout for pub-lished patents and patent applications. The Company analyzes and monitors its findings and develops circumvention strategies for external patents, which may one day be relevant, before they are issued. By following this strategy, MorphoSys has achieved growing success over the years and has secured ample room to maneuver in terms of its proprietary technology platforms and products for many years to come.
Another area where external risks can occur is in our work with service providers in both preclinical and clinical development, in-cluding the processing of clinical data. Here, insufficient or poor performance can lead to development delays, financial loss, or even endanger the programs in their entirety.
As a global biotechnology company with numerous partnerships and its own research and development department for the develop-ment of drug candidates, the MorphoSys Group is exposed to a variety of legal risks. These include risks relating to patent law, potential liability claims from existing partnerships, competition and antitrust law, as well as tax law and environmental protection. Future lawsuits are conceivable but are currently unpredictable. Therefore, we cannot rule out a significant impact on our business and results from expenses incurred as a result of legal or regula-tory judgments, or from agreed settlements that are not, or not fully, covered or that can only be partially covered by insurance.
51GROUP MANAGEMENT REPORT
Risk and Opportunity Report

ORGANIZATIONAL RISKS Organizational risks occur in the areas of Partnered Discovery, Technical Operations and IT, among others. The Partnered Dis-covery area may suffer from a loss of quality or delays may occur within the organization due to a higher number of programs or their increasing complexity. To reduce complexity and, in turn, lower risk, we have introduced uniform processes that are moni-tored for compliance by regular audits.
Risks found in the Technical Operations area relate to procedures that could cause lasting damage, business interruptions, or acci-dents involving hazardous or polluting substances. To avoid these types of disruptions, we take measures such as the routine inspec-tion and maintenance of equipment and facilities and providing training and tutorials for the employees concerned. These risks can be reduced even further with the use of suitable electronic monitoring systems. Financial risks affecting this area are gener-ally covered by insurance. Further information on MorphoSys’s operating environment may be found in the chapter titled “Sus-tainable Business Development.”
Business activities can be exposed to risks resulting from disrup-tions in the IT infrastructure or IT security. These risks are man-aged using backup copies created several times per day and through the use of highly reliable firewall and antivirus scanning systems to ensure the safety and stability of the data. MorphoSys also minimizes the risks associated with the availability, reliabil-ity and efficiency of its IT systems through continuous testing (for example, simulations of gradual hacker attacks) and updates to the software and hardware systems. The IT strategy is also reviewed and adjusted on an annual basis.
COMPLIANCE RISKSCompliance risks can arise when quality standards are not met or business processes are not handled properly from a legal stand-point. MorphoSys is committed to meeting the highest quality standards in its business operations, as set out in the Sustain-ability Report, to counter these risks. The system is also routinely reviewed by external experts and subjected to periodic inspec-tions by an internal, independent quality assurance department to limit risk.
Specific risks could arise, for example, when the internal quality management system does not meet the legal requirements, or when there is a failure to implement the internal systems for de-tecting quality defects. In the event that the internal controls are not able to detect violations of the Good Manufacturing Practice (GMP), Good Clinical Practice (GCP), or Good Laboratory Practice (GLP), this would also constitute a compliance risk.
Insufficient or delayed financial communication could result in fines or legal actions. Annual General Meetings executed incor-rectly could lead to legal disputes with shareholders. This would lead to significant costs from either attempting to avert a challenge of the Annual General Meeting or, if this is not possible, to repeat the Annual General Meeting. Capital measures up for resolution (for example, a capital increase) could possibly also be at risk. The preparation and execution of the Annual General Meeting, as well as all relevant documentation and processes, are closely monitored and reviewed by the internal departments responsible and by ex-ternal lawyers and auditors to minimize this risk.
THE MANAGEMENT BOARD’S EVALUATION OF THE OVERALL RISK SITUATION AT THE MORPHOSYS GROUPThe Management Board of the MorphoSys Group considers the overall risk to be appropriate and trusts the effectiveness of the risk management system with regard to the changes in the envi-ronment and the needs of the current business. It is the Manage-ment Board’s view that the continued existence of the MorphoSys Group is not jeopardized. This assessment applies to each individ-ual Group company as well as to the MorphoSys Group as a whole. This assessment is based on a variety of factors which are summa-rized below: • the MorphoSys Group has an exceptionally high equity ratio and
has successfully confirmed its corporate objectives in the past few years;
• the Management Board of the Group is confident that MorphoSys is well positioned to cope with any adverse events which may occur;
• the Group has an extremely large and broad portfolio of preclin-ical and clinical programs in partnerships with a number of large pharmaceutical companies and a strong technological base for further expanding its proprietary portfolio.
Risks, however, cannot be excluded, controlled or influenced in their entirety.
52GROUP MANAGEMENT REPORT
Risk and Opportunity Report
Opportunities
Leading antibody technologies, excellent know-how and a broad portfolio of validated clinical programs have made MorphoSys one of the world’s leading biotechnology companies in the field of ther-apeutic antibodies. Because this therapeutic class of molecules now belongs to one of the most successful and best-selling drugs in cancer therapy, there are a significant number of pharmaceuti-cal and biotechnology companies active in the field of antibodies who could become future customers and partners for MorphoSys’s products and technologies. For this reason and due to MorphoSys’s long-standing expertise in the field of technology and product de-velopment, the Company has identified a number of growth oppor-tunities for the years to come.
MorphoSys’s antibody technologies for the development and opti-mization of therapeutic antibody candidates offer crucial advan-tages that can lead to higher success rates and shorter develop-ment times in the drug development process. The transfer and application of MorphoSys’s core competencies, also outside of the antibody segment, present the Group with new opportunities since many classes of compounds are similar in their molecular struc-ture. The “Innovation Capital” initiative is able to seize opportuni-ties that were previously unavailable by having MorphoSys act as a strategic investor in young, innovative companies allowing it to use synergies effectively.
OPPORTUNITY MANAGEMENT SYSTEMThe opportunity management system is an important part of the corporate management at MorphoSys. It serves to identify oppor-tunities at an early stage and to generate added value for the Company.
Opportunity management relies on four pillars: • a routine discussion forum comprised of the Management Board
and selected members of the Senior Management Group; • the Company’s business development activities; • a technology scouting team; and • the “Innovation Capital” initiative.
At committee meetigs, selected opportunities are discussed and, where applicable, actions are agreed upon for seizing these oppor-tunities. The meetings and their results are recorded in detail and further actions are monitored and reviewed. The Group’s Business Development team takes part in numerous conferences where it identifies various opportunities that can contribute to the Com-pany’s growth. These are presented in the committee meetings
and assessed through evaluation processes. The technology scout-ing team specifically searches out innovative technologies that can generate synergies with the technological infrastructure of MorphoSys, suitable for identifying new therapeutic molecules. These results are also discussed and evaluated by internal com-mittees existing across all departments. The “Innovation Capital” initiative described above also allows MorphoSys to participate in early innovations and utilize these for the benefit of the Company in the future. An established opportunity evaluation process en-sures a qualitative and reproducible evaluation of opportunities.
GENERAL STATEMENT ON OPPORTUNITIESIncreased life expectancy in industrialized countries and the changing income situation and lifestyle in emerging countries are expected to drive demand for additional and innovative treatment options and advanced technologies. Scientific and medical prog-ress has led to a better understanding of the biological processes of diseases, which, in turn, paves the way for new therapeutic ap-proaches. Innovative therapies, such as fully human antibodies, have reached market maturity in recent years and have led to the development of commercially successful medical products. In ad-dition, therapeutic compounds based on proteins – also known as biological compounds or “biologics” – are threatened less by com-petition from generics than chemically produced molecules be-cause the production of biological compounds is far more complex. Therefore, the demand for antibodies and the interest in this cate-gory of drugs has risen sharply over the past two to three years as demonstrated by the various acquisitions and significant licensing agreements in this field.
MARKET OPPORTUNITIESMorphoSys believes that its antibody platforms, HuCAL, Ylanthia and Slonomics, and the recently in-licensed lanthipeptide technol-ogy can all be used to develop products that address considerable, unmet medical needs.
THERAPEUTIC ANTIBODIES – PROPRIETARY DEVELOPMENTIt is expected that the pharmaceutical industry will increase its in-licensing of new drugs in order to refill its pipelines and replace previous key products and revenue drivers which have lost patent protection. With its most advanced compounds, MOR103, MOR202 and MOR208, MorphoSys is in a good position to capitalize on the needs of pharmaceutical companies. This is highlighted by the partnerships for MOR103 and MOR202 and the partnership for MOR209/ES414 that was completed successfully in 2014.
53GROUP MANAGEMENT REPORT
Risk and Opportunity Report

The guaranteed cash flows from the Partnered Discovery segment in the years to come place MorphoSys in a position to continuously strengthen its proprietary portfolio. MorphoSys will expand its proprietary portfolio by adding clinical trials with its most im-portant drug candidates by investigating new disease areas, for example. MorphoSys intends to complement its portfolio with other programs and could use existing and future opportunities for co-development projects or partnerships. The Company is also looking for more opportunities to in-license interesting drug can-didates.
With the drug candidates MOR208 and MOR202, MorphoSys may have the chance for the first time to market a drug itself.
THERAPEUTIC ANTIBODIES – PARTNERED DISCOVERYBy working with a number of partners in drug development, MorphoSys has been able to better spread the risk that is inextri-cably linked with the development of individual drugs. With over 80 individual therapeutic antibodies currently in development programs with partners, the chance that MorphoSys will partici-pate financially in the marketing of drugs is becoming more likely. In 2014, there were already three antibodies in clinical phase 3. If the clinical trial results are positive, it is possible that an approval may even be awarded in the near future. Our partner Novartis has already announced that an filing for the approval of its bimagrumab antibody could be made in 2016.
TECHNOLOGY DEVELOPMENT MorphoSys continues to invest in its existing and new technologies in order to maintain its technological leadership. With Ylanthia, MorphoSys has established a new technology platform which, un-like its predecessor HuCAL, is again available for broader licens-ing to different partners. The commercialization of the Ylanthia antibody library was started in 2012.
Technological advances of this kind could put the Company in a position to expand its list of partners and increase both the speed and the success rate of partnered and proprietary drug develop-ment programs. New technology modules that enable the produc-tion of antibodies against novel classes of target molecules could also open up new disease areas in which antibody-based treat-ments are still under-represented.
Technology development is driven by a team of scientists focused on the further development of the Company’s technologies. But instead of only relying on internal technology development, MorphoSys also uses external sources of development for strength-ening its technology. The cooperation and participation in Lanthio Pharma, a Dutch company dealing with the development of lanthi-peptide, is a good example of such activities.
ACQUISITION OPPORTUNITIESIn the past, MorphoSys has proven its ability to make acquisitions of compounds and technologies to accelerate its growth. Potential acquisition candidates are systematically presented, discussed and evaluated within the scope of the routine meetings with the Management Board and members of the Senior Management Group already described. Subsequent to these meetings, promis-ing candidates are examined for strategic synergies and evaluated by an internal specialist committee. Protocols are completed on all candidates and assessments and are then systematically archived for observation and follow-up. A proprietary database helps to ad-minister this information and keep it available.
MorphoSys plans to drive its acquisition strategy forward in the new year so that it can complement its existing portfolio and tech-nology platform and secure access to patents and licenses for the development of novel proprietary technologies and products.
FINANCIAL OPPORTUNITIESExchange rate and interest rate developments can have a positive or negative effect on the Group’s financial results. Interest rates and financial market developments are continuously monitored to promptly identify and seize any available opportunities.
54GROUP MANAGEMENT REPORT
Risk and Opportunity Report

TAB L E
11Presentation of the
Key Short- and Medium-Term Risks
at MorphoSys
1-Year Assessment 3-Year Assessment
FINANCIAL RISK
Risk of missing revenue targets • Low ••• High
Risks due to bank insolvencies •• Moderate •• Moderate
OPER ATIONAL RISK
Risks related to the development of proprietary antibodies •• Moderate •• Moderate
Risks related to Human Resources • Low • Low
STR ATEGIC RISK
The risk of not being able to in-license novel therapeutic molecules •• Moderate ••• High
Early termination of drug development partnerships •• Moderate ••• High
Patent-related risks (with regard to the patent situation of the technology platform) •• Moderate •• Moderate
EXTERNAL RISK
Risks related to external service providers in the clinical area ••• High • Low
Patent-related risks (with regard to new national/international regulations) •• Moderate •• Moderate
ORGANIZATIONAL RISK
Risks arising from the growing amount and complexity of programs •• Moderate •• Moderate
Risks in the technical operations area • Low • Low
COMPLIANCE RISK
Quality risks due to legal requirements •• Moderate •• Moderate
Legal risks • Low • Low
LEGEND
• LOW RISK low probability of occurrence, low impact
•• MODER ATE RISK moderate probability of occurrence, moderate impact
••• HIGH RISK moderate probability of occurrence, moderate to strong impact
•••• CATASTROPHIC RISK high probability of occurrence, severe impact
TAB L E
12Summary of the Most Important Long-Term Risks at MorphoSys
Segments Risk Order1
Proprietary Development Lack of competitiveness of the MorphoSys pipeline 1
Partnered Discovery Termination of partnered programs 2
Proprietary Development Insufficient expansion of the MorphoSys pipeline 3
Partnered Discovery Lack of new strategic alliances 4
1 Declining importance of risk from 1 to 4, whereby 1 represents the most important risk.
55GROUP MANAGEMENT REPORT
Risk and Opportunity Report

Statement on Corporate Governance and Corporate Governance Report
The Statement on Corporate Governance and the Corporate Gover-nance Report are published on the Company’s website under Media & Investors – Corporate Governance.
Statement on Corporate Governance Pursuant to Sec. 289a (HGB) for the 2014 Financial Year
In the Declaration on Corporate Governance pursuant to Sec. 289a HGB, the Management Board and the Supervisory Board report on corporate governance. In addition to the annual Declaration of Conformity in accordance with Sec. 161 of the Stock Corporation Act (AktG) it also includes relevant information on corporate gov-ernance practices and other aspects of corporate governance, par-ticularly a description of the working practices of the Management Board and Supervisory Board.
DECLARATION OF CONFORMITY WITH THE GERMAN CORPO-RATE GOVERNANCE CODE (THE “CODE”) OF THE MANAGEMENT BOARD AND THE SUPERVISORY BOARD OF MORPHOSYS AGThe Management Board and the Supervisory Board of MorphoSys AG declare the following pursuant to Sec. 161 of the German Stock Corporation Act: 1. Since the last Declaration of Conformity on 6 December 2013,
MorphoSys AG has complied with the recommendations of the “Government Commission on the German Corporate Gover-nance Code” – with the exceptions described below under item no. 3 – in the Code version dated 13 May 2013 and 24 June 2014.
2. MorphoSys AG will continue to comply with the recommenda-tions of the “Government Commission on the German Corporate Governance Code” in the Code version dated 24 June 2014 – with the exceptions described below under item no. 3.
3. Exceptions: • Remuneration of Management Board members does not pro-
vide for a cap, neither overall nor for individual compensation components (see item 4.2.3 Para. 2 sentence 6 of the Code). In view of the Supervisory Board’s existing limitation possibili-ties concerning the variable compensation components for the Management Board and its annual allocation, the Super-visory Board does not believe that an additional cap is re-quired.
• The Supervisory Board has refrained from full application of the recommendations in item 5.4.1 Para. 2 and Para. 3 sen-tence 1 of the Code. Pursuant to item 5.4.1 Para. 2, the Super-visory Board shall specify concrete objectives regarding the Board’s composition, which shall stipulate, in particular, an appropriate level of female representation. According to item 5.4.1 Para. 3 sentence 1, proposals by the Supervisory Board to the competent election bodies shall take these objectives into account. The Supervisory Board has established concrete objectives regarding its composition and has thereby also de-cided to strive for an adequate representation of women on the Supervisory Board. However, a concrete quota of female members on the Supervisory Board has not been provided since qualifications and not gender should be the decisive criteria in the individual cases for appointment to the Super-visory Board.
Martinsried/Planegg, 5 December 2014
MorphoSys AG
On behalf of the Management Board:
On behalf of the Supervisory Board:
Dr. Simon MoroneyChief Executive Officer
Dr. Gerald MöllerChairman of the Supervisory Board
56GROUP MANAGEMENT REPORT
Statement on Corporate Governance and Corporate Governance Report

RELEVANT INFORMATION ON CORPORATE GOVERNANCE PRACTICESMorphoSys ensures compliance with the rules of conduct and laws through the use of a Group-wide Code of Conduct, a compliance handbook and supplementary internal guidelines.
MorphoSys’s “Code of Conduct” sets out the fundamental princi-ples and key policies and practices for business behavior. The Code serves as a valuable tool for employees and managers, particularly in business, legal, or ethical situations of conflict. The Code of Con-duct also supports transparent and consistent management princi-ples and strengthens the trust of the financial markets, business partners, employees and the public in the Company. Compliance with the Code of Conduct is carefully monitored. The Group-wide implementation of the Code is guided by the Code of Conduct Committee. The Code of Conduct is also regularly reviewed and amended if necessary. The Code of Conduct can be downloaded from the Company’s website under Media & Investors – Corporate Governance.
The compliance handbook describes the compliance management system implemented by MorphoSys. This system ensures compli-ance with all legal requirements and also implements high ethical standards that are mandatory for both the Management Board and all employees. The overall responsibility for the compliance man-agement system lies with the Management Board who regularly reports to the Supervisory Board and the Audit Committee. In carrying out its compliance responsibility, the Management Board has transferred the respective tasks to various positions at MorphoSys.
The Compliance Officer monitors the interfaces of the individual pillars of compliance within MorphoSys and, if necessary, adapts the Company’s existing compliance organization in consultation with the Management Board. The Compliance Officer also regu-larly reports to the CEO on all of the relevant developments in the Company’s compliance organization.
The Compliance Officer is assisted in his duties by a Compliance Committee that meets regularly to discuss compliance issues. The Compliance Committee serves as an interface between the differ-ent departments of MorphoSys dealing with compliance issues and facilitates the identification and discussion of all relevant is-sues concerning the individual compliance pillars. On this basis, the Compliance Officer routinely verifies the observance of the compliance management system as well as the compliance status of MorphoSys.
Further information on the compliance management system at MorphoSys can be found on page 71 in the Corporate Governance Report.
COMPOSITION OF THE MANAGEMENT BOARD AND THE SUPERVISORY BOARDTHE MANAGEMENT BOARD
The Management Board of MorphoSys AG consists of the Chief Executive Officer and three other members. In the schedule of re-sponsibilities, the various areas of responsibility are defined as follows: • Dr. Simon Moroney, Chief Executive Officer, responsible for
Strategy and Planning; Compliance and Quality Assurance; Internal Audit; Human Resources; Business Development & Port-folio Management; Legal and the coordination of individual areas of the Management Board as well as representation of the Management Board to the Supervisory Board.
• Jens Holstein, Chief Financial Officer, responsible for Accounting and Taxes; Controlling; Corporate Finance & Corporate Develop-ment; Risk Management; IT & Technical Operations; Procure-ment and Logistics; Corporate Communications & Investor Rela-tions.
• Dr. Arndt Schottelius, Chief Development Officer, responsible for Preclinical Development; Clinical Research; Clinical Operations; Drug Safety & Pharmacovigilance; Regulatory Affairs; Project Management.
• Dr. Marlies Sproll, Chief Scientific Officer, responsible for Devel-opment Partnerships & Technology Development; Target Mole-cule & Antibody Research; Protein Chemistry; Alliance Manage-ment; Intellectual Property.
SUPERVISORY BOARD
As of 31 December 2014, the Supervisory Board of MorphoSys AG consisted of six members, who oversee and advise the Manage-ment Board. The present Supervisory Board consists of profes-sionally qualified members representing the shareholders of MorphoSys AG. Dr. Gerald Möller, acting Chairman of the Super-visory Board, coordinates the Board’s activities, chairs the Super-visory Board meetings and represents the concerns of the Super-visory Board externally. As defined by the German Corporate Governance Code, all members of the Supervisory Board are inde-pendent and have many years of experience in the biotechnology and pharmaceutical industries. They are duly elected by the share-holders in the course of the Annual General Meeting. The Chair-man of the Supervisory Board is not a former member of the Man-agement Board of MorphoSys AG. With the conclusion of the Annual General Meeting 2015 ends the term of office of of all six members of the Supervisory Board. Regular elections are there-fore planned for the Annual General Meeting 2015. The precise composition of the Supervisory Board and its committees is con-tained in the following table.
57GROUP MANAGEMENT REPORT
Statement on Corporate Governance and Corporate
Governance Report

WORKING PRACTICES OF THE MANAGEMENT BOARD AND SUPERVISORY BOARDTo ensure good corporate governance, open and comprehensive information provided on a routine basis is a guiding principle of the cooperation of the Management Board and Supervisory Board of MorphoSys AG. The dual management system required by the German Stock Corporation Act clearly differentiates between the management and the supervision of a Company. The responsibili-ties of both Boards are clearly defined by the legislator and by the Boards’ bylaws and Articles of Association. MorphoSys AG’s Man-agement and Supervisory Boards work closely together and take actions and decisions for the benefit of the Company. Their stated objective is to sustainably increase the Company’s value.
Each Management Board member has their own area of responsi-bility, which is defined in the schedule of responsibilities. Each member regularly reports to their Management Board colleagues on their respective area of responsibility. The collaboration of Man-agement Board members is governed by the bylaws. Both the schedule of responsibilities and the bylaws were enacted by the Supervisory Board. Meetings of the Management Board typically take place once a week and are chaired by the Chief Executive Officer. At the meetings, resolutions related to actions and trans-actions are passed that require the approval of the entire Manage-ment Board under the rules of procedure. In order to pass resolu-tions, at least half of the members of the Management Board must participate in the vote. Resolutions of the Management Board are
passed by a simple majority. In the event of a tied vote, the vote of the Chief Executive Officer decides. In the case of significant events, each member of the Management Board or the Supervisory Board may convene an extraordinary meeting of the Management Board as a whole. Resolutions of the Management Board may also be passed outside of its meetings by voting verbally, by telephone, or in writing (including email). A protocol is made of each meeting of the full Management Board. This protocol is then submitted for approval at the subsequent meeting of the full Management Board and signed by the Chief Executive Officer.
In addition to the regular Management Board meetings, Manage-ment Board strategy workshops are held. In this workshops, the Management Board prioritizes the strategic objectives across the Group and outlines the future strategy.
The Management Board informs the Supervisory Board with re-spect to planning, business development and the Group’s position, including risk management and compliance issues, in a timely and comprehensive manner in writing, as well as at the Supervisory Board meetings. An extraordinary meeting of the Supervisory Board shall be convened if necessary in the case of a material event. The Supervisory Board is involved by the Management Board in the strategy and planning, as well as in all decisions of fundamental importance to the Company. In addition to the regu-lar Supervisory Board meetings, a further strategy meeting be-tween the Management Board and the Supervisory Board is held
TAB L E
13Composition of the Supervisory Board
Position
Initial Appoint-
mentEnd of Period1
Audit Committee
Remunera- tion and
Nomination Committee
Science and Technology Committee
Dr. Gerald Möller Chairman 1999 2015
Dr. Geoffrey Vernon Deputy
Chairman 1999 2015
Dr. Walter Blättler Member 2007 2015
Dr. Daniel Camus Member 2002 2015
Dr. Marc Cluzel Member 2012 2015
Karin Eastham Member 2012 2015
Independent Financial Expert Chairman Member 1 Period ends with termination of Annual General Meeting 2015.
58GROUP MANAGEMENT REPORT
Statement on Corporate Governance and Corporate Governance Report
once annually in which the focus of discussion is the strategic ori-entation of MorphoSys. According to the Management Board’s rules of procedure, important business transactions are subject to the consent of the Supervisory Board. Detailed information on the collaboration between the Management Board and the Supervi-sory Board and on important topics discussed in the 2014 financial year can be found in the “Report of the Supervisory Board.”
The Supervisory Board shall hold at least two meetings per calen-dar half-year and at least six per calendar year. In addition to the provisions of the Articles of Association, the Supervisory Board has added rules of procedure with regard to its duties: The Super-visory Board Chairman coordinates the work of the Supervisory Board, chairs its meetings and represents the affairs of the Board externally. The Supervisory Board usually makes its decisions in meetings. However, decisions can also be made by telephone, video conference, or outside of the meetings.
The Supervisory Board constitutes a quorum when at least two-thirds of its members (including either the Chairman or the Dep-uty Chairman of the Supervisory Board) participate in the vote. Generally, resolutions of the Supervisory Board are adopted by a simple majority of the votes cast unless the law prescribes a differ-ent majority. In the event of a tied vote, the vote of the Supervisory Board Chairman decides.
Supervisory Board meetings are recorded in writing. Resolutions which are taken outside of the meetings are also recorded. A copy of the minutes and the resolutions adopted outside of meetings is provided to all members of the Supervisory Board. In accordance with the recommendation in item no. 5.6 of the Code, the Supervi-sory Board evaluates the efficiency of its work on a regular basis.
COMPOSITION AND WORKING PRACTICES OF THE MANAGE-MENT BOARD AND SUPERVISORY BOARD COMMITTEESThe Management Board has not established any committees.
The Supervisory Board has three committees: the Audit Commit-tee, the Remuneration and Nomination Committee and the Science and Technology Committee. The three committees formed by the Supervisory Board are occupied by professionally qualified mem-bers.
AUDIT COMMITTEE
The central task of the Audit Committee is to assist the Supervi-sory Board in fulfilling its supervisory duties with respect to the accuracy of the annual and consolidated financial statements, the activities of the external auditors, the internal control functions, risk management, compliance and internal audit. The Audit Com-mittee also submits a recommendation to the Supervisory Board for the election of the independent auditor which takes place at the Annual General Meeting. The members of the Audit Com-mittee are Dr. Daniel Camus (Chairman), Dr. Geoffrey Vernon and Ms. Karin Eastham. All three members are independent financial experts.
REMUNER ATION AND NOMINATION COMMITTEE
The Remuneration and Nomination Committee is responsible for the preparation and annual review of the Management Board’s compensation system before its final approval. The committee also monitors, when necessary, the search for suitable candidates for appointment as Management Board members or as Supervisory Board members and submits proposals to the Supervisory Board in this regard. The Committee also prepares contracts with Man-agement Board members. The members of the Remuneration and Nomination Committee are Dr. Gerald Möller (Chairman), Dr. Marc Cluzel and Ms. Karin Eastham.
SCIENCE AND TECHNOLOGY COMMITTEE
The Science and Technology Committee advises the Supervisory Board on matters concerning proprietary drug and technology de-velopment and also prepares the relevant Supervisory Board reso-lutions. The members of the Science and Technology Committee are Dr. Walter Blättler (Chairman) and Dr. Marc Cluzel.
The biographies of the Supervisory Board members can be found on the MorphoSys website under Company – Management – Su-pervisory Board.
59GROUP MANAGEMENT REPORT
Statement on Corporate Governance and Corporate
Governance Report

TAB L E
14Participation of
Supervisory Board Members
S UP VERV I S O R Y B O ARD MEE T IN G S
by phone
by phone
Strategy Meeting
by phone
Name
01/17 2014
02/27 2014
03/24 2014
05/22 2014
07/25 2014
09/05-06 2014
11/04 2014
12/10 2014
12/17 2014
Dr. Gerald Möller –
Dr. Geoffrey Vernon
Dr. Walter Blättler
Dr. Daniel Camus –
Dr. Marc Cluzel
Karin Eastham
MEE T IN G S O F T HE AUD I T C O MMI T T EE
by phone by phone Name 02/27/2014 03/24/2014 04/25/2014 07/25/2014 11/04/2014 12/10/2014
Dr. Daniel Camus
Karin Eastham
Dr. Geoffrey Vernon –
MEE T IN G S O F T HE REMUNER AT I O N AND N O MINAT I O N C O MMI T T EE
by phone Name 02/27/2014 05/22/2014 07/24/2014 11/04/2014 12/10/2014 12/18/2014
Dr. Gerald Möller –
Dr. Marc Cluzel
Karin Eastham
MEE T IN G S O F T HE S C IEN C E AND T E C HN O L O G Y C O MMI T T EE
by phone Name 02/27/2014 05/22/2014 06/26/2014 07/25/2014 11/04/2014 12/10/2014
Dr. Walter Blättler
Dr. Marc Cluzel
at t ended in perso n
part ic i pated by ph o ne
60GROUP MANAGEMENT REPORT
Statement on Corporate Governance and Corporate Governance Report

Corporate Governance Report
MorphoSys makes responsible, sustainable and value-oriented corporate governance its highest priority. Good corporate gover-nance is a central component of corporate management at MorphoSys. It forms the framework for the management and su-pervision of the Group, which includes its organization, commer-cial principles and measures for guidance and control.
With the creation of the German Corporate Governance Code (the “Code”), a standard was established for the transparent monitor-ing and control of companies, which is particularly oriented to-wards the interests of shareholders. Many of the principles con-tained in the Corporate Governance Code have been practiced at MorphoSys for a long period of time. Individual issues relating to corporate governance at MorphoSys AG are detailed in the Decla-ration on Corporate Governance pursuant to Sec. 289a HGB. This declaration also includes the annual Declaration of Conformity, relevant information on corporate governance practices and a de-scription of the working practices of the Management and Super-visory Boards. Additional information can be found in this Corpo-rate Governance Report.
COMMUNICATION WITH THE CAPITAL MARKETSOne of the most important principles of corporate communication at MorphoSys is to inform institutional investors, private share-holders, financial analysts, employees and all other stakeholders simultaneously and comprehensively on the situation of the Com-pany. This is accomplished through regular, transparent and timely communication. All essential information provided to finan-cial analysts and similar addressees are also promptly made avail-able to shareholders in both the German and English languages. The Company is strictly committed to the principle of fair informa-tion practices.
A central component of investor relations at MorphoSys is routine meetings with analysts and investors in the context of roadshows and individual meetings. Conference calls accompany the publica-tion of the quarterly results and give analysts and investors an opportunity to ask questions on the Company’s development. Com-pany presentations prepared for on-site events are accessible to all interested parties on the Company website. Video and audio re-cordings of key events can always be found on the Company web-site. Transcripts of the conference calls are also made promptly available.
MorphoSys uses its corporate website www.morphosys.com as a central platform for providing current information on the Com-pany and its progress. Here financial reports, presentations for analyst and investor conferences, as well as the Company’s press releases and ad hoc statements can be retrieved. The dates of the main recurring publications and events (annual reports, interim reports, Annual General Meetings, press and analyst conferences) are published in our financial calendar well in advance.
The MorphoSys website was technically and structurally rede-signed at the end of 2014 and will be re-introduced with a new design in the first quarter of 2015.
ESTABLISHMENT OF SPECIFIC TARGETS FOR THE COMPOSI-TION OF THE SUPERVISORY BOARDThe Supervisory Board of MorphoSys AG has a total of six mem-bers. In view of the Company’s international orientation and to ensure a fair share of diversity, the Supervisory Board maintains a ratio of at least two non-German Supervisory Board members or at least two members having extensive international experience. This ratio is currently being met.
We also strive to have at least four independent members repre-sented on our Supervisory Board. This ratio is also currently being met. Material conflicts of interest and those which are not merely temporary, in particular conflicts arising from tasks for major competitors, should be avoided. Currently, no such conflict of inter-est exists.
Furthermore, it is intended that an adequate proportion of women shall be represented on the Supervisory Board. The Supervisory Board is aware that such an adequate proportion of women may not be reached immediately. Nevertheless, the Supervisory Board intends to include qualified women when assessing potential can-didates for vacant positions on the Supervisory Board. A prerequi-site for proposing the election of female candidates shall be their qualification and concrete suitability for the Company. At the Supervisory Board election that took place at the 2012 Annual General Meeting, Ms. Karin Eastham was elected as a new Super-visory Board member.
The provision regarding the age limit of 75 years that is contained in the rules of procedure of the Supervisory Board is currently respected. However, the Supervisory Board may approve excep-tions in individual cases.
The Supervisory Board plans to consider the targets mentioned above for future nominations.
61GROUP MANAGEMENT REPORT
Statement on Corporate Governance and Corporate
Governance Report

REMUNERATION REPORTThe Remuneration Report presents the principles, structure and amount of compensation paid to the Management Board and the Supervisory Board. It reflects the legal provisions and gives con-sideration to the recommendations of the Code.
MANAGEMENT BOARD REMUNER ATION
The remuneration system for the Management Board is intended to provide an incentive for performance-oriented and sustainable corporate management. Therefore, the aggregate compensation of the Management Board members consists of different compo-nents, such as fixed components, an annual cash bonus based on the achievement of individual and corporate targets (short-term incentive – STI), as well as a variable compensation component with a long-term incentive (long-term incentive – LTI) and of other compensation components. The variable remuneration component with long-term incentive consists of a performance share plan. The Management Board members also receive fringe benefits in the form of non-cash benefits. These benefits essentially consist of a company car and insurance premiums. As a component of remu-neration, the fringe benefits of each Management Board member are taxable. All total remuneration packages are reviewed annu-ally by the Remuneration and Nomination Committee for their scope and appropriateness and compared to the results of an an-nual management board compensation analysis. The amount of compensation paid to Management Board members highly de-pends on their individual areas of responsibility, their personal achievement of goals, business performance, as well as on the Company’s success and the economic prospects in relation to the competition. All decisions concerning adjustments to the total re-muneration package are taken by the entire Supervisory Board. The salaries of the Management Board as well as the contributions to a pension plan in the form of a provident fund were last adjusted in July 2014.
OVERVIEW
In the 2014 financial year, € 5,065,240 (2013: € 5,326,352) in ben-efits were granted to the Management Board in accordance with the provisions of the Corporate Governance Code.
Of this total remuneration for the year 2014, € 2,769,205 was cash compensation and € 2,296,035, or 45 %, resulted from personnel expenses for share-based compensation (performance share plan, stock option plan and convertible bond plan) (remuneration with long-term incentive – LTI).
The total amount of benefits paid to the Management Board in the 2014 financial year amounted to € 6,984,419 (2013: € 16,837,592). In addition to cash remuneration of € 2,893,199 (2013: € 2,473,883) paid during the financial year, this also includes the value from the exercise of convertible bonds and stock options (share-based compensation) of € 4,091,220 (2013: € 14,363,709) relevant under German tax law.
Members of the Management Board exercised convertible bonds in the course of 2014. All transactions in MorphoSys shares executed by Management Board members were reported as required by law and published in the Corporate Governance Report and on the Company’s website. In accordance with the requirements of Section 4.2.5, Para. 3 of the Code, the following represents de-tailed information on an individualized basis required by the Code regarding the remuneration of individual Management Board members.
Please note, the following tables in the Corporate Governance Re-port deviate from the information on Management Board remuner-ation provided in the Notes of this Annual Report (item 7.4). This is due to the varying presentation requirements under the Corporate Governance Code and those in accordance with IFRS.
FIXED REMUNER ATION AND FRINGE BENEFITS
The non-performance related remuneration of the Management Board is composed of fixed remuneration and additional benefits, which mainly include the use of company cars and also include subsidies for health, welfare and disability insurance.
PENSION EXPENSES
Furthermore, the Company provides payments to Management Board members of up to 10 % of each Management Board member’s fixed annual salary plus taxes to be paid. These payments are to be used by the Management Board members for their individual re-tirement plans. In addition, all Management Board members par-ticipate in a pension plan in the form of a provident fund, which was introduced in cooperation with Allianz Pensions-Manage-ment e.V. The pension obligations of this provident fund are met by Allianz Pensions-Management e.V.
62GROUP MANAGEMENT REPORT
Statement on Corporate Governance and Corporate Governance Report
PERFORMANCE-BASED COMPENSATION (SHORT-TERM INCENTIVE – STI)
As performance-based remuneration, each member of the Man-agement Board receives an annual cash bonus amounting to up to 70 % of the gross base salary upon the 100 % achievement of objec-tives. These bonus payments are dependent upon the achievement of corporate and personal objectives which are determined by the Supervisory Board at the beginning of each financial year. Corpo-rate targets comprise 80 % of performance-based remuneration and are based on business development measured by revenue and operating results. The progress of the partnered pipeline and the Company’s proprietary portfolio, as well as technology targets, is also taken into consideration. Personal targets comprise 20 % of performance-based remuneration and include the fulfillment of operational targets for which the respective Management Board member is responsible. At the start of the year, the Supervisory Board assesses the degree to which the corporate and personal objectives were achieved in the prior year and determines the cor-responding bonus. The bonus is subject to a ceiling of 125 % of the target amount (corresponding to 87.5 % of gross basic salary). If targets are not achieved, the performance-based remuneration may be completely omitted. The bonus for the 2014 financial year will be paid in February 2015.
LONG -TERM INCENTIVE COMPENSATION (LTI)
In 2011, MorphoSys introduced a new, long-term incentive plan (Performance Share Plan) for the Management Board and mem-bers of the Senior Management Group. The LTI program is based on the allocation of shares which are linked to the achievement of certain pre-defined performance targets over a four-year period.
Each year the Supervisory Board decides on the number of shares to be allocated to the Management Board. On 1 April 2014, the Management Board was granted 18,264 shares; whereby each Management Board member received an entitlement to a certain number of shares. For more details, please refer to section 7.3.4 of the Notes to the Consolidated Financial Statement and the com-ments on share buybacks in the Corporate Governance Report.
With the allotment of shares for a given year, the Supervisory Board sets the long-term performance targets. For the 2014 LTI program, the target was defined as the share price performance of the MorphoSys share compared to a benchmark index, which con-sists of equal parts of the NASDAQ Biotech Index and the TecDAX index. Shares are annually awarded on the basis of a daily com-parison of the MorphoSys share with the benchmark. For the price
performance in a given year, there is a hurdle of 50 % and a maxi-mum limit of 200 %. For example, in comparing the performance of the MorphoSys share with that of the index, performance of less than 50 % in the relevant year means that no shares would be allo-cated. Performance of more than 200 %, however, would result in no additional shares being allocated.
The final number of performance shares allocated to the beneficia-ries of the LTI program is determined after the completion of the program, specifically after a period of four years. This calculation incorporates the number of shares initially allocated, after adjust-ing the Company’s share price performance versus the benchmark index and at the discretion of the Supervisory Board with regards to a “company factor.” The company factor is a number between 0 and 2 and is determined by the Supervisory Board depending on the Company’s situation. The predefined default value of the com-pany factor is 1.
MISCELL ANEOUS
Management Board members were not granted any loans or simi-lar benefits in the reporting year nor have members of the Man-agement Board received any benefits from third parties that were either promised or granted based on their position as a Manage-ment Board member.
TERMINATION OF MANAGEMENT BOARD EMPLOYMENT CONTR ACTS/
CHANGE OF CONTROL
If a Management Board member’s service contract terminates as a result of death, their spouse or life partner is entitled to the fixed monthly salary for the month of death and the 12 months there-after. In the event of a change in control, each Management Board member is entitled to exercise their extraordinary right to termi-nate their employment contract, including entitlement to any out-standing amounts of fixed salary for the remainder of the agreed contract period. Moreover, in such a case, all stock options, con-vertible bonds and performance shares granted will become vested immediately and are exercisable after the expiration of the statutory vesting period or blackout periods. A change in control occurs particularly when: (i) MorphoSys transfers assets or a sub-stantial part of its assets to unaffiliated third parties, (ii) MorphoSys merges with a non-affiliated company, or (iii) a shareholder or third party holds 30 % or more of the voting rights in MorphoSys.
63GROUP MANAGEMENT REPORT
Statement on Corporate Governance and Corporate
Governance Report
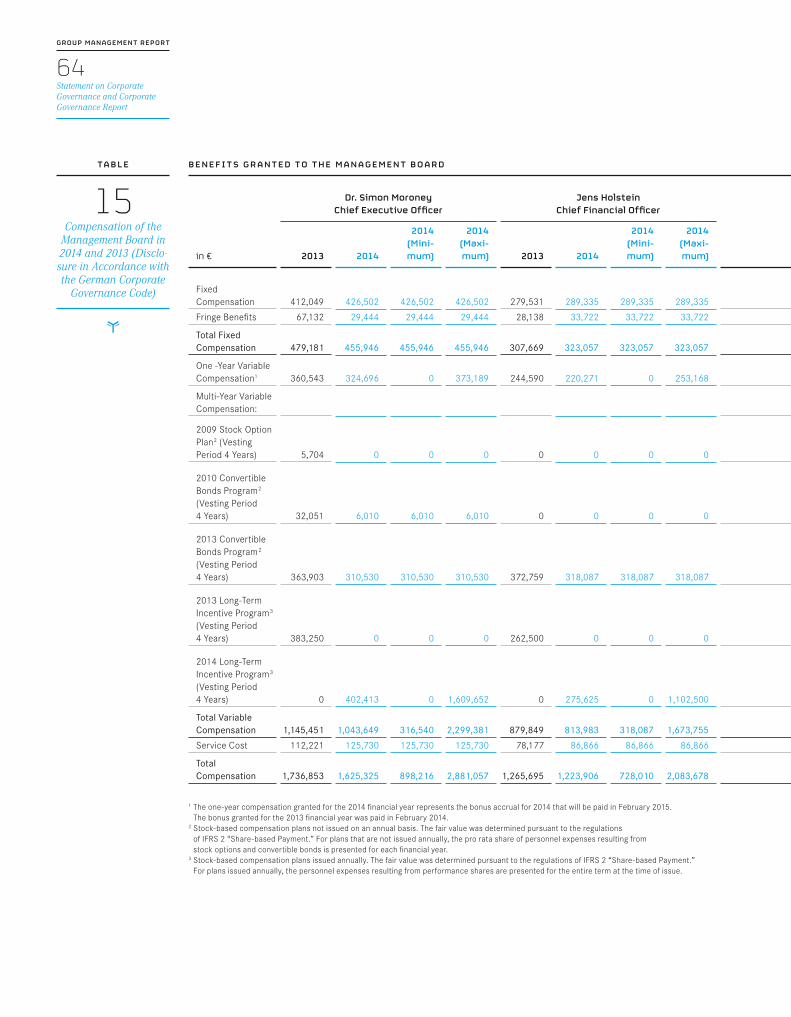
B ENEF I T S G R AN T ED T O T HE MANA G EMEN T B O ARD
Dr. Simon Moroney Chief Executive Officer
Jens Holstein Chief Financial Officer
Dr. Arndt Schottelius Chief Development Officer
Dr. Marlies Sproll Chief Scientific Officer Total
in € 2013 2014
2014 (Mini-mum)
2014 (Maxi-mum) 2013 2014
2014 (Mini-mum)
2014 (Maxi-mum) 2013 2014
2014 (Mini-mum)
2014 (Maxi-mum) 2013 2014
2014 (Mini-mum)
2014 (Maxi-mum) 2013 2014
2014 (Mini-mum)
2014 (Maxi-mum)
Fixed Compensation 412,049 426,502 426,502 426,502 279,531 289,335 289,335 289,335 279,531 289,335 289,335 289,335 279,531 289,335 289,335 289,335 1,250,642 1,294,507 1,294,507 1,294,507
Fringe Benefits 67,132 29,444 29,444 29,444 28,138 33,722 33,722 33,722 29,143 32,508 32,508 32,508 21,579 22,828 22,828 22,828 145,992 118,502 118,502 118,502
Total Fixed Compensation 479,181 455,946 455,946 455,946 307,669 323,057 323,057 323,057 308,674 321,843 321,843 321,843 301,110 312,163 312,163 312,163 1,396,634 1,413,009 1,413,009 1,413,009
One -Year Variable Compensation1 360,543 324,696 0 373,189 244,590 220,271 0 253,168 244,590 215,208 0 253,168 244,590 210,144 0 253,168 1,094,313 970,319 0 1,132,693
Multi-Year Variable Compensation:
2009 Stock Option Plan2 (Vesting Period 4 Years) 5,704 0 0 0 0 0 0 0 6,337 0 0 0 2,577 0 0 0 14,618 0 0 0
2010 Convertible Bonds Program2 (Vesting Period 4 Years) 32,051 6,010 6,010 6,010 0 0 0 0 17,988 3,373 3,373 3,373 17,988 3,373 3,373 3,373 68,027 12,756 12,756 12,756
2013 Convertible Bonds Program2 (Vesting Period 4 Years) 363,903 310,530 310,530 310,530 372,759 318,087 318,087 318,087 249,243 212,687 212,687 212,687 249,243 212,687 212,687 212,687 1,235,148 1,053,991 1,053,991 1,053,991
2013 Long-Term Incentive Program3 (Vesting Period 4 Years) 383,250 0 0 0 262,500 0 0 0 262,500 0 0 0 262,500 0 0 0 1,170,750 0 0 0
2014 Long-Term Incentive Program3 (Vesting Period 4 Years) 0 402,413 0 1,609,652 0 275,625 0 1,102,500 0 275,625 0 1,102,500 0 275,625 0 1,102,500 0 1,229,288 0 4,917,152
Total Variable Compensation 1,145,451 1,043,649 316,540 2,299,381 879,849 813,983 318,087 1,673,755 780,658 706,893 216,060 1,571,728 776,898 701,829 216,060 1,571,728 3,582,856 3,266,354 1,066,747 7,116,592
Service Cost 112,221 125,730 125,730 125,730 78,177 86,866 86,866 86,866 78,294 86,653 86,653 86,653 78,170 86,628 86,628 86,628 346,862 385,877 385,877 385,877
Total Compensation 1,736,853 1,625,325 898,216 2,881,057 1,265,695 1,223,906 728,010 2,083,678 1,167,626 1,115,389 624,556 1,980,224 1,156,178 1,100,620 614,851 1,970,519 5,326,352 5,065,240 2,865,633 8,915,478
1 The one-year compensation granted for the 2014 financial year represents the bonus accrual for 2014 that will be paid in February 2015. The bonus granted for the 2013 financial year was paid in February 2014.
2 Stock-based compensation plans not issued on an annual basis. The fair value was determined pursuant to the regulations of IFRS 2 “Share-based Payment.” For plans that are not issued annually, the pro rata share of personnel expenses resulting from stock options and convertible bonds is presented for each financial year.
3 Stock-based compensation plans issued annually. The fair value was determined pursuant to the regulations of IFRS 2 “Share-based Payment.” For plans issued annually, the personnel expenses resulting from performance shares are presented for the entire term at the time of issue.
TAB L E
15Compensation of the
Management Board in 2014 and 2013 (Disclo-sure in Accordance with the German Corporate
Governance Code)
64GROUP MANAGEMENT REPORT
Statement on Corporate Governance and Corporate Governance Report
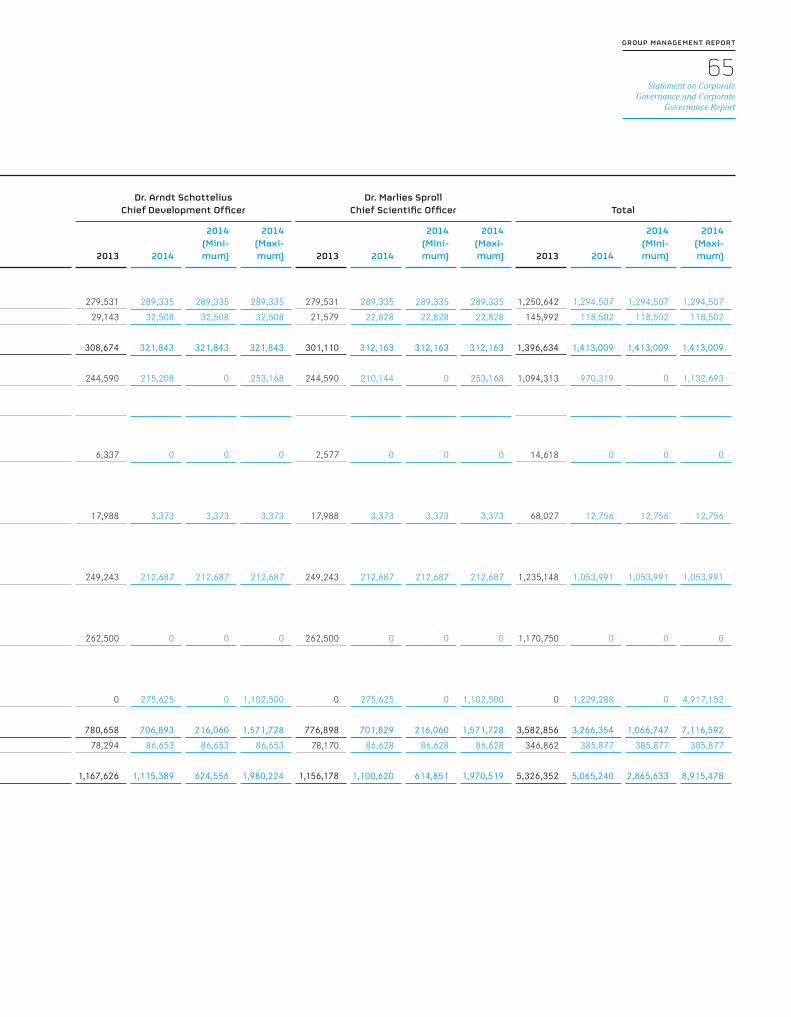
B ENEF I T S G R AN T ED T O T HE MANA G EMEN T B O ARD
Dr. Simon Moroney Chief Executive Officer
Jens Holstein Chief Financial Officer
Dr. Arndt Schottelius Chief Development Officer
Dr. Marlies Sproll Chief Scientific Officer Total
in € 2013 2014
2014 (Mini-mum)
2014 (Maxi-mum) 2013 2014
2014 (Mini-mum)
2014 (Maxi-mum) 2013 2014
2014 (Mini-mum)
2014 (Maxi-mum) 2013 2014
2014 (Mini-mum)
2014 (Maxi-mum) 2013 2014
2014 (Mini-mum)
2014 (Maxi-mum)
Fixed Compensation 412,049 426,502 426,502 426,502 279,531 289,335 289,335 289,335 279,531 289,335 289,335 289,335 279,531 289,335 289,335 289,335 1,250,642 1,294,507 1,294,507 1,294,507
Fringe Benefits 67,132 29,444 29,444 29,444 28,138 33,722 33,722 33,722 29,143 32,508 32,508 32,508 21,579 22,828 22,828 22,828 145,992 118,502 118,502 118,502
Total Fixed Compensation 479,181 455,946 455,946 455,946 307,669 323,057 323,057 323,057 308,674 321,843 321,843 321,843 301,110 312,163 312,163 312,163 1,396,634 1,413,009 1,413,009 1,413,009
One -Year Variable Compensation1 360,543 324,696 0 373,189 244,590 220,271 0 253,168 244,590 215,208 0 253,168 244,590 210,144 0 253,168 1,094,313 970,319 0 1,132,693
Multi-Year Variable Compensation:
2009 Stock Option Plan2 (Vesting Period 4 Years) 5,704 0 0 0 0 0 0 0 6,337 0 0 0 2,577 0 0 0 14,618 0 0 0
2010 Convertible Bonds Program2 (Vesting Period 4 Years) 32,051 6,010 6,010 6,010 0 0 0 0 17,988 3,373 3,373 3,373 17,988 3,373 3,373 3,373 68,027 12,756 12,756 12,756
2013 Convertible Bonds Program2 (Vesting Period 4 Years) 363,903 310,530 310,530 310,530 372,759 318,087 318,087 318,087 249,243 212,687 212,687 212,687 249,243 212,687 212,687 212,687 1,235,148 1,053,991 1,053,991 1,053,991
2013 Long-Term Incentive Program3 (Vesting Period 4 Years) 383,250 0 0 0 262,500 0 0 0 262,500 0 0 0 262,500 0 0 0 1,170,750 0 0 0
2014 Long-Term Incentive Program3 (Vesting Period 4 Years) 0 402,413 0 1,609,652 0 275,625 0 1,102,500 0 275,625 0 1,102,500 0 275,625 0 1,102,500 0 1,229,288 0 4,917,152
Total Variable Compensation 1,145,451 1,043,649 316,540 2,299,381 879,849 813,983 318,087 1,673,755 780,658 706,893 216,060 1,571,728 776,898 701,829 216,060 1,571,728 3,582,856 3,266,354 1,066,747 7,116,592
Service Cost 112,221 125,730 125,730 125,730 78,177 86,866 86,866 86,866 78,294 86,653 86,653 86,653 78,170 86,628 86,628 86,628 346,862 385,877 385,877 385,877
Total Compensation 1,736,853 1,625,325 898,216 2,881,057 1,265,695 1,223,906 728,010 2,083,678 1,167,626 1,115,389 624,556 1,980,224 1,156,178 1,100,620 614,851 1,970,519 5,326,352 5,065,240 2,865,633 8,915,478
1 The one-year compensation granted for the 2014 financial year represents the bonus accrual for 2014 that will be paid in February 2015. The bonus granted for the 2013 financial year was paid in February 2014.
2 Stock-based compensation plans not issued on an annual basis. The fair value was determined pursuant to the regulations of IFRS 2 “Share-based Payment.” For plans that are not issued annually, the pro rata share of personnel expenses resulting from stock options and convertible bonds is presented for each financial year.
3 Stock-based compensation plans issued annually. The fair value was determined pursuant to the regulations of IFRS 2 “Share-based Payment.” For plans issued annually, the personnel expenses resulting from performance shares are presented for the entire term at the time of issue.
65GROUP MANAGEMENT REPORT
Statement on Corporate Governance and Corporate
Governance Report
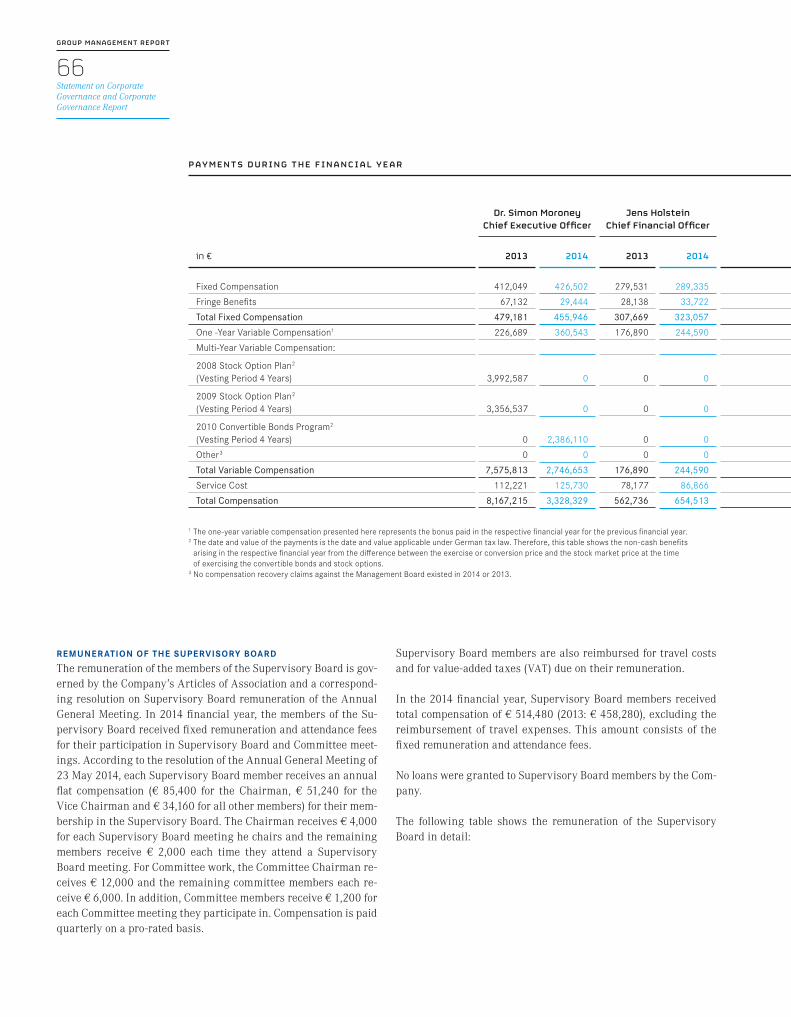
REMUNER ATION OF THE SUPERVISORY BOARD
The remuneration of the members of the Supervisory Board is gov-erned by the Company’s Articles of Association and a correspond-ing resolution on Supervisory Board remuneration of the Annual General Meeting. In 2014 financial year, the members of the Su-pervisory Board received fixed remuneration and attendance fees for their participation in Supervisory Board and Committee meet-ings. According to the resolution of the Annual General Meeting of 23 May 2014, each Supervisory Board member receives an annual flat compensation (€ 85,400 for the Chairman, € 51,240 for the Vice Chairman and € 34,160 for all other members) for their mem-bership in the Supervisory Board. The Chairman receives € 4,000 for each Supervisory Board meeting he chairs and the remaining members receive € 2,000 each time they attend a Supervisory Board meeting. For Committee work, the Committee Chairman re-ceives € 12,000 and the remaining committee members each re-ceive € 6,000. In addition, Committee members receive € 1,200 for each Committee meeting they participate in. Compensation is paid quarterly on a pro-rated basis.
Supervisory Board members are also reimbursed for travel costs and for value-added taxes (VAT) due on their remuneration.
In the 2014 financial year, Supervisory Board members received total compensation of € 514,480 (2013: € 458,280), excluding the reimbursement of travel expenses. This amount consists of the fixed remuneration and attendance fees.
No loans were granted to Supervisory Board members by the Com-pany.
The following table shows the remuneration of the Supervisory Board in detail:
P AY MEN T S D UR IN G T HE F INAN C I AL Y E AR
Dr. Simon Moroney Chief Executive Officer
Jens Holstein Chief Financial Officer
Dr. Arndt Schottelius Chief Development
OfficerDr. Marlies Sproll
Chief Scientific Officer Total
in €
2013 2014 2013 2014 2013 2014 2013 2014 2013 2014
Fixed Compensation 412,049 426,502 279,531 289,335 279,531 289,335 279,531 289,335 1,250,642 1,294,507
Fringe Benefits 67,132 29,444 28,138 33,722 29,143 32,508 21,579 22,828 145,992 118,502
Total Fixed Compensation 479,181 455,946 307,669 323,057 308,674 321,843 301,110 312,163 1,396,634 1,413,009
One -Year Variable Compensation1 226,689 360,543 176,890 244,590 164,155 244,590 162,653 244,590 730,387 1,094,313
Multi-Year Variable Compensation:
2008 Stock Option Plan2 (Vesting Period 4 Years) 3,992,587 0 0 0 0 0 2,410,143 0 6,402,730 0
2009 Stock Option Plan2 (Vesting Period 4 Years) 3,356,537 0 0 0 3,273,300 0 1,331,142 0 7,960,979 0
2010 Convertible Bonds Program2 (Vesting Period 4 Years) 0 2,386,110 0 0 0 1,705,110 0 0 0 4,091,220
Other3 0 0 0 0 0 0 0 0 0 0
Total Variable Compensation 7,575,813 2,746,653 176,890 244,590 3,437,455 1,949,700 3,903,938 244,590 15,094,096 5,185,533
Service Cost 112,221 125,730 78,177 86,866 78,294 86,653 78,170 86,628 346,862 385,877
Total Compensation 8,167,215 3,328,329 562,736 654,513 3,824,423 2,358,196 4,283,218 643,381 16,837,592 6,984,419
1 The one-year variable compensation presented here represents the bonus paid in the respective financial year for the previous financial year. 2 The date and value of the payments is the date and value applicable under German tax law. Therefore, this table shows the non-cash benefits
arising in the respective financial year from the difference between the exercise or conversion price and the stock market price at the time of exercising the convertible bonds and stock options.
3 No compensation recovery claims against the Management Board existed in 2014 or 2013.
66GROUP MANAGEMENT REPORT
Statement on Corporate Governance and Corporate Governance Report

DIRECTORS’ HOLDINGS OF MANAGEMENT BOARD AND SUPERVISORY BOARDThe members of the Management Board and the Supervisory Board hold more than 1 % of the shares issued by the Company. All shares, performance shares and convertible bonds held by each member of the Management Board and the Supervisory Board are listed below.
P AY MEN T S D UR IN G T HE F INAN C I AL Y E AR
Dr. Simon Moroney Chief Executive Officer
Jens Holstein Chief Financial Officer
Dr. Arndt Schottelius Chief Development
OfficerDr. Marlies Sproll
Chief Scientific Officer Total
in €
2013 2014 2013 2014 2013 2014 2013 2014 2013 2014
Fixed Compensation 412,049 426,502 279,531 289,335 279,531 289,335 279,531 289,335 1,250,642 1,294,507
Fringe Benefits 67,132 29,444 28,138 33,722 29,143 32,508 21,579 22,828 145,992 118,502
Total Fixed Compensation 479,181 455,946 307,669 323,057 308,674 321,843 301,110 312,163 1,396,634 1,413,009
One -Year Variable Compensation1 226,689 360,543 176,890 244,590 164,155 244,590 162,653 244,590 730,387 1,094,313
Multi-Year Variable Compensation:
2008 Stock Option Plan2 (Vesting Period 4 Years) 3,992,587 0 0 0 0 0 2,410,143 0 6,402,730 0
2009 Stock Option Plan2 (Vesting Period 4 Years) 3,356,537 0 0 0 3,273,300 0 1,331,142 0 7,960,979 0
2010 Convertible Bonds Program2 (Vesting Period 4 Years) 0 2,386,110 0 0 0 1,705,110 0 0 0 4,091,220
Other3 0 0 0 0 0 0 0 0 0 0
Total Variable Compensation 7,575,813 2,746,653 176,890 244,590 3,437,455 1,949,700 3,903,938 244,590 15,094,096 5,185,533
Service Cost 112,221 125,730 78,177 86,866 78,294 86,653 78,170 86,628 346,862 385,877
Total Compensation 8,167,215 3,328,329 562,736 654,513 3,824,423 2,358,196 4,283,218 643,381 16,837,592 6,984,419
1 The one-year variable compensation presented here represents the bonus paid in the respective financial year for the previous financial year. 2 The date and value of the payments is the date and value applicable under German tax law. Therefore, this table shows the non-cash benefits
arising in the respective financial year from the difference between the exercise or conversion price and the stock market price at the time of exercising the convertible bonds and stock options.
3 No compensation recovery claims against the Management Board existed in 2014 or 2013.
TAB L E
16Compensation of the Supervisory Board in
2014 and 2013
Fixed Compensation Attendance Fees Total Compensation
in €
2014 2013 2014 2013 2014 2013
Dr. Gerald Möller 97,400 94,400 38,000 32,000 135,400 126,400
Dr. Walter Blättler 46,160 43,160 25,200 17,000 71,360 60,160
Dr. Daniel Camus 46,160 43,160 23,200 19,500 69,360 62,660
Dr. Marc Cluzel 46,160 46,160 32,400 23,500 78,560 69,660
Karin Eastham 46,160 40,160 32,400 22,500 78,560 62,660
Dr. Geoffrey Vernon 57,240 57,240 24,000 19,500 81,240 76,740
TOTAL 339,280 324,280 175,200 134,000 514,480 458,280
67GROUP MANAGEMENT REPORT
Statement on Corporate Governance and Corporate
Governance Report

DIRECTORS’ DEALINGSMembers of the Management Board and Supervisory Board of MorphoSys AG, as well as closely related persons to such mem-bers, are obligated to disclose trading in MorphoSys shares in ac-cordance with Sec. 15a of the German Securities Trading Act (WpHG).
During the reporting year, MorphoSys received the following noti-fications pursuant to Sec. 15a WpHG which are listed in the follow-ing table.
TAB L E
17Directors’ Holdings
S HARE S
01/01/2014 Additions Forfeitures Sales 12/31/2014
MANAGEMENT BOARD
Dr. Simon Moroney 452,885 40,000 0 40,000 452,885
Jens Holstein 6,500 0 0 4,500 2,000
Dr. Arndt Schottelius 2,000 33,000 0 33,000 2,000
Dr. Marlies Sproll 27,370 1,250 0 0 28,620
TOTAL 488,755 74,250 0 77,500 485,505
SUPERVISORY BOARD
Dr. Gerald Möller 9,000 0 0 0 9,000
Dr. Walter Blättler 2,019 0 0 0 2,019
Dr. Daniel Camus 0 0 0 0 0
Dr. Marc Cluzel 0 500 0 0 500
Karin Eastham 1,000 0 0 0 1,000
Dr. Geoffrey Vernon 0 0 0 0 0
TOTAL 12,019 500 0 0 12,519
C O NVER T IB L E B O ND S
01/01/2014 Additions Forfeitures Exercises 12/31/2014
MANAGEMENT BOARD
Dr. Simon Moroney 147,186 0 0 40,000 107,186
Jens Holstein 90,537 0 0 0 90,537
Dr. Arndt Schottelius 93,537 0 0 33,000 60,537
Dr. Marlies Sproll 93,537 0 0 0 93,537
TOTAL 424,797 0 0 73,000 351,797
P ERF O RMAN C E S HARE S
01/01/2014 Additions Forfeitures Allocations 12/31/2014
MANAGEMENT BOARD
Dr. Simon Moroney 48,676 5,979 0 0 54,655
Jens Holstein 33,339 4,095 0 0 37,434
Dr. Arndt Schottelius 33,339 4,095 0 0 37,434
Dr. Marlies Sproll 33,339 4,095 0 0 37,434
TOTAL 148,693 18,264 0 0 166,957
68GROUP MANAGEMENT REPORT
Statement on Corporate Governance and Corporate Governance Report

PREVENTING CONFLICTS OF INTERESTMembers of the Management Board and the Supervisory Board are obliged to refrain from actions that could lead to conflicts of inter-est with their functions performed at MorphoSys AG. Such trans-actions or secondary employment of the Management Board must be disclosed immediately to the Supervisory Board and are subject to its approval. The Supervisory Board, in turn, must inform the Annual General Meeting of any conflicts of interest and their treat-ment. In the 2014 financial year, no conflicts of interest occurred.
STOCK REPURCHASESBy resolution of the Annual General Meeting of 19 May 2011, which was replaced by the resolution of the Annual General Meet-ing of 23 May 2014, in accordance with Sec. 71 Para. 1 no. 8 AktG, MorphoSys is authorized to repurchase its own shares in an amount up to 10 % of the existing common stock. This authoriza-tion may be exercised in whole or in part, once or on several occa-sions, by the Company or a third party on behalf of the Company, for the purposes specified in the authorizing resolution. It is at the discretion of the Management Board as to whether the repurchase is carried out on the stock exchange, by a public offer or a public call to tender.
TAB L E
18Directors’ Dealings
in 2014
Party Subject to the Notifi-cation Re-quirement Function
Date of Transaction
in 2014Type of
Transaction
Number of Stocks/
DerivativesAverage
Share PriceTransaction
Volume
Dr. Marlies Sproll CSO 12/03/2014
Purchase of MorphoSys AG shares 1,250 79.52396 € 99,404.95 €
Dr. Simon Moroney CEO 11/20/2014
Sale; convertible bonds were converted
into MorphoSys AG shares and subse-
quently sold 5,000 76.8745 € 384,372.50 €
Dr. Simon Moroney CEO 11/19/2014
Sale; convertible bonds were converted
into MorphoSys AG shares and subse-
quently sold 5,000 77.7346 € 388,673.00 €
Dr. Simon Moroney CEO 11/18/2014
Sale; convertible bonds were converted
into MorphoSys AG shares and subse-
quently sold 10,000 77.2813 € 772,813.00 €
Dr. Simon Moroney CEO 11/17/2014
Sale; convertible bonds were converted
into MorphoSys AG shares and subse-
quently sold 20,000 76.4454 € 1,528,908.00 €
Dr. Arndt Schottelius CDO 06/13/2014
Sale; convertible bonds were converted
into MorphoSys AG shares and subse-
quently sold 11,000 68.1948 € 750,142.80 €
Dr. Arndt Schottelius CDO 06/12/2014
Sale; convertible bonds were converted
into MorphoSys AG shares and subse-
quently sold 22,000 69.7598 € 1,534,715.60 €
Jens Holstein CFO 03/26/2014Sale of MorphoSys AG
shares 4,500 65.52 € 294,826.30 €
Dr. Marc Cluzel (via C&F Consulting)
Member of the Super-
visory Board 03/13/2014Purchase of
MorphoSys AG shares 500 67.60 € 38,802.00 €
69GROUP MANAGEMENT REPORT
Statement on Corporate Governance and Corporate
Governance Report

In March 2014, MorphoSys repurchased a total of 111,000 of its own shares on the basis of the authorization from 2011. The Com-pany plans to use these treasury shares for a long-term incentive plan for the Management Board and the Senior Management Group. However, this authorization also permits the shares to be used for other lawful purposes.
INFORMATION AND COMMUNICATIONDuring the 2014 financial year, the optimization of business pro-cesses based on the ERP and Corporate Performance Management systems (CPM) was continued successfully within the planned project budget and time frame.
Based on modern IT security technology, new IT services were established for working securely off-site within the IT security infrastructure. As part of this expansion, new services were brought into operation to provide a more secure exchange of data with external business partners.
The new IT security infrastructure was successfully reviewed by means of an external security audit under the existing organiza-tional controls in order to ensure the protection of information at MorphoSys.
Since April of this reporting year, R&D data from antibody selec-tion, characterization and production has been collected, stored, analyzed and processed in a database called YBase, which was developed specifically for MorphoSys’s workflows and technolo-gies.
This software solution is based on the software of GeneData Biologics, which was developed in close collaboration with the provider and is used industry-wide. It enables MorphoSys to com-pletely record the massive rise in the selection of antibody candi-dates from new technologies such as Ylanthia and Slonomics, and to identify the most promising drug candidates quickly and reli-ably.
INFORMATION ON INTERNAL CONTROL AND RISK MANAGEMENT SYSTEMS WITH REGARD TO THE ACCOUNTING PROCESS PUR-SUANT TO SEC. 289 PARA. 5 AND SEC. 315 PARA. 2 NO. 5 HGBIn the 2014 financial year, MorphoSys completed a routine update of the documentation for its existing internal control and risk man-agement systems in order to maintain adequate internal control over financial reporting. This ensures the availability of all con-trols so that the financial figures can be reported as precisely and as accurately as possible. The COSO (Committee of Sponsoring Organizations of the Treadway Commission) defines the corre-sponding COSO framework (“Internal Control – Integrated Frame-work”). This is the basis most commonly used for internal control over financial reporting and is also the framework used by MorphoSys.
In view of system constraints, there is no absolute assurance that internal controls can prevent or completely uncover a misrepre-sentation in the context of financial reporting at all times. Internal controls can only give reasonable assurance that the financial re-porting is reliable and verify that the preparation of the financial statements is in accordance with the IFRS standards for external purposes adopted by the European Union.
To ensure the accuracy of the reported financial indicators and the underlying execution of all accounting processes, MorphoSys has implemented a strict four-eye principle. The effectiveness and effi-ciency of these processes are also routinely reviewed and moni-tored by external service providers. The consolidated financial statements go through a large number of preparation, audit and control processes in order that they are promptly reported to the market and to shareholders. This is done using a plan, agreed on by the management, for which the necessary resources are made available both internally as well as externally.
Furthermore, numerous rules and guidelines ensure the strict separation of planning, posting and executing financial transac-tions. Compliance with and implementation of these guidelines is regularly reviewed. This functional separation is ensured with all IT systems through the appropriate assignment of rights.
70GROUP MANAGEMENT REPORT
Statement on Corporate Governance and Corporate Governance Report
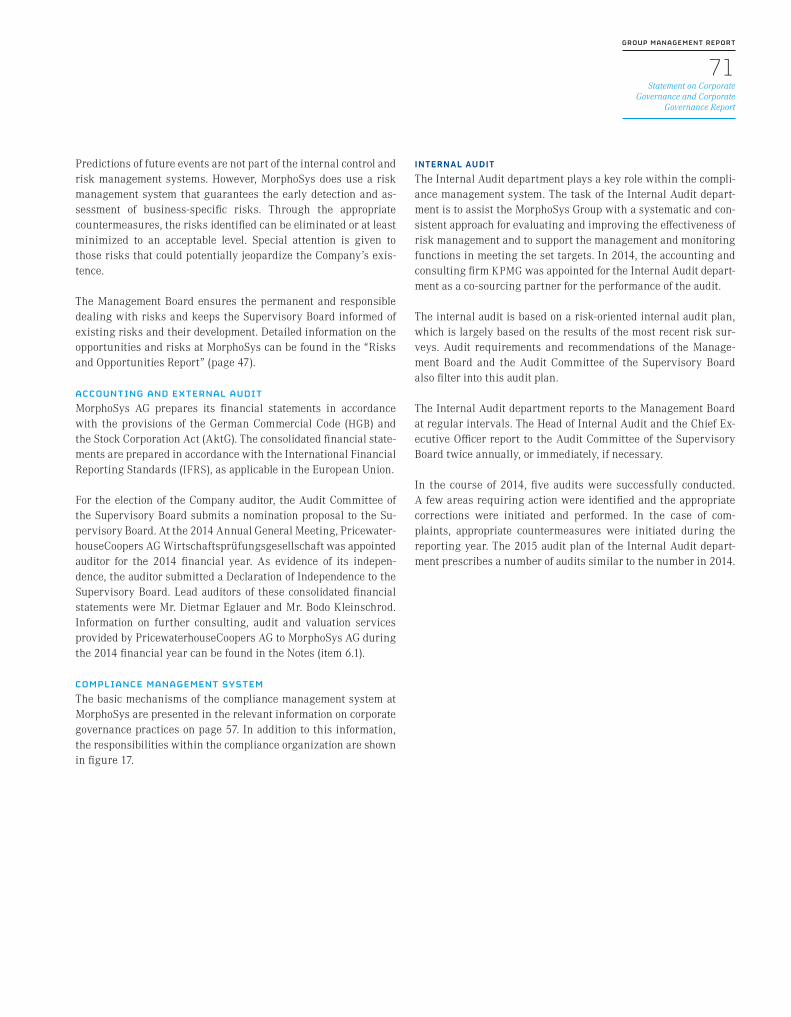
Predictions of future events are not part of the internal control and risk management systems. However, MorphoSys does use a risk management system that guarantees the early detection and as-sessment of business-specific risks. Through the appropriate countermeasures, the risks identified can be eliminated or at least minimized to an acceptable level. Special attention is given to those risks that could potentially jeopardize the Company’s exis-tence.
The Management Board ensures the permanent and responsible dealing with risks and keeps the Supervisory Board informed of existing risks and their development. Detailed information on the opportunities and risks at MorphoSys can be found in the “Risks and Opportunities Report” (page 47).
ACCOUNTING AND EXTERNAL AUDIT MorphoSys AG prepares its financial statements in accordance with the provisions of the German Commercial Code (HGB) and the Stock Corporation Act (AktG). The consolidated financial state-ments are prepared in accordance with the International Financial Reporting Standards (IFRS), as applicable in the European Union.
For the election of the Company auditor, the Audit Committee of the Supervisory Board submits a nomination proposal to the Su-pervisory Board. At the 2014 Annual General Meeting, Pricewater-houseCoopers AG Wirtschaftsprüfungsgesellschaft was appointed auditor for the 2014 financial year. As evidence of its indepen-dence, the auditor submitted a Declaration of Independence to the Supervisory Board. Lead auditors of these consolidated financial statements were Mr. Dietmar Eglauer and Mr. Bodo Kleinschrod. Information on further consulting, audit and valuation services provided by PricewaterhouseCoopers AG to MorphoSys AG during the 2014 financial year can be found in the Notes (item 6.1).
COMPLIANCE MANAGEMENT SYSTEMThe basic mechanisms of the compliance management system at MorphoSys are presented in the relevant information on corporate governance practices on page 57. In addition to this information, the responsibilities within the compliance organization are shown in figure 17.
INTERNAL AUDIT
The Internal Audit department plays a key role within the compli-ance management system. The task of the Internal Audit depart-ment is to assist the MorphoSys Group with a systematic and con-sistent approach for evaluating and improving the effectiveness of risk management and to support the management and monitoring functions in meeting the set targets. In 2014, the accounting and consulting firm KPMG was appointed for the Internal Audit depart-ment as a co-sourcing partner for the performance of the audit.
The internal audit is based on a risk-oriented internal audit plan, which is largely based on the results of the most recent risk sur-veys. Audit requirements and recommendations of the Manage-ment Board and the Audit Committee of the Supervisory Board also filter into this audit plan.
The Internal Audit department reports to the Management Board at regular intervals. The Head of Internal Audit and the Chief Ex-ecutive Officer report to the Audit Committee of the Supervisory Board twice annually, or immediately, if necessary.
In the course of 2014, five audits were successfully conducted. A few areas requiring action were identified and the appropriate corrections were initiated and performed. In the case of com-plaints, appropriate countermeasures were initiated during the reporting year. The 2015 audit plan of the Internal Audit depart-ment prescribes a number of audits similar to the number in 2014.
71GROUP MANAGEMENT REPORT
Statement on Corporate Governance and Corporate
Governance Report

72GROUP MANAGEMENT REPORT
Statement on Corporate Governance and Corporate Governance Report
F I G URE
17 Compliance Manage-ment System (CMS)
reports toCompliance Officer
manages the interfaces between the different compliance streams
Chief Executive Officer
Internal Control System
Interal Audit
Quality Management System (GCP, GMP, GLP)
Quality assurance
Risk Manage-ment System
Code of Conduct Committee
Legal
CMS

Disclosures Pursuant to Sec. 289 Para. 4, Sec. 315 Para. 4 HGB and Ex-planatory Report of the Management Board Pursuant to Sec. 176 Para. 1 Sentence 1 AktG
COMPOSITION OF COMMON STOCKAs of 31 December 2014, the Company’s statutory common stock amounted to € 26,456,834.00 and was divided into 26,456,834 no-par-value bearer shares. This concerns bearer shares with vot-ing rights, except for the 450,890 treasury shares held by the Com-pany, whereby each share carries one vote at the Annual General Meeting.
RESTRICTIONS AFFECTING VOTING RIGHTS OR THE TRANSFER OF SHARESThe Management Board is not aware of any restrictions which might affect voting rights or the transfer of shares. This also re-lates to restrictions which might arise from agreements between shareholders.
Furthermore, restrictions on voting rights could also arise from the provisions of the German Stock Corporation Act (AktG), such as those according to Sec. 136 AktG, or for treasury shares pursu-ant to Sec. 71b AktG.
SHAREHOLDINGS IN THE COMMON STOCK EXCEEDING 10 % OF THE VOTING RIGHTSWe have not been notified of or are aware of any direct or indirect interests in the common stock of the Company which exceed 10 % of the voting rights.
SHARES WITH SPECIAL RIGHTS CONFERRING POWERS OF CONTROLShares with special rights conferring powers of control do not exist.
CONTROL OVER VOTING RIGHTS WITH REGARD TO EMPLOYEE OWNERSHIP IN THE CAPITAL Employees who hold shares in the Company exercise their voting rights directly in accordance with the statutory provisions and the Articles of Association like other shareholders.
APPOINTMENT AND DISMISSAL OF MEMBERS OF THE MANAGEMENT BOARD AND AMENDMENTS TO THE ARTICLES OF ASSOCIATIONThe determination of the number of Management Board members, their appointment and dismissal and the nomination of the Chief Executive Officer, are carried out by the Supervisory Board in ac-cordance with Sec. 6 of the Articles of Association and Sec. 84 AktG. The Management Board of the Company currently consists of the Chief Executive Officer and three other members. Manage-
ment Board members may be appointed for a maximum period of five years. A reappointment or extension of the term of office is permitted up to a maximum of five years in each case. The Super-visory Board may revoke the appointment of a Management Board member or the nomination of a Chief Executive Officer for good cause within the meaning of Sec. 84 Para. 3 AktG. If a required member of the Management Board is absent, one will be appointed by the court in cases of urgency pursuant to Sec. 85 AktG.
In principle, the Articles of Association may only be amended by a resolution of the Annual General Meeting in accordance with Sec. 179 Para. 1 sentence 1 AktG. Pursuant to Sec. 179 Para. 2 sentence 2 AktG in conjunction with Sec. 20 of the Articles of As-sociation, the Annual General Meeting of MorphoSys resolves amendments to the Articles of Association generally through a simple majority of the votes cast and a simple majority of the com-mon stock represented. To the extent that the law stipulates a man-datory greater majority of votes or capital, this shall be applied. However, amendments to the Articles of Association that only af-fect their wording can be resolved by the Supervisory Board in accordance with Sec. 179 Para. 1 sentence 2 AktG in conjunction with Sec. 12 Para. 3 of the Articles of Association.
POWER OF THE MANAGEMENT BOARD TO ISSUE SHARESThe Management Board’s power to issue shares is provided for in Sec. 5 Para. 5 to Para. 6e of the Company’s Articles of the Associa-tion as of 31 December 2014 and the statutory provisions:
1. Authorized Capital a. According to Sec. 5 Para. 5 of the Articles of Association, the
Management Board is authorized, with the consent of the Su-pervisory Board, to increase the Company’s common stock on one or more occasions by up to € 2,335,822.00 for cash contri-butions or contributions in kind by issuing up to 2,335,822 new, no-par-value bearer shares until and including 30 April 2018 (Authorized Capital 2013-I).
If there is a capital increase, the shareholders are principally entitled to subscription rights. The shares may also be sub-scribed for by one or several credit institutions with the obli-gation to offer the shares to shareholders for subscription. However, the Management Board is authorized to exclude the subscription rights of shareholders with the consent of the Supervisory Board:
aa) in the case of a capital increase for cash contribution, to the extent that this is necessary for avoiding fractional shares; or
bb) in the case of a capital increase against contribution in kind, to the extent that the capital increase is used for the acquisition of companies, interests in companies, patents or other intellectual property rights or license rights; or of assets which constitute a business in its entirety; or
73GROUP MANAGEMENT REPORT
Statement on Corporate Governance and Corporate
Governance Report

cc) in the case of a capital increase for cash contribution, to the extent that the new shares are placed on a domestic and/or foreign stock exchange in the context of a listing.
The Management Board is authorized, with the consent of the Supervisory Board, to determine the further details of the capital increase and its implementation.
b. According to Sec. 5 Para. 6 of the Articles of Association, the Management Board is authorized, with the consent of the Su-pervisory Board, to increase the Company’s common stock on one or more occasions by up to € 2,622,088.00 for cash contri-bution by issuing up to 2,622,088 new no-par-value bearer shares until and including 30 April 2019 (Authorized Capital 2014-I).
Shareholders are principally entitled to subscription rights. The shares may also be subscribed for by one or several credit institutions with the obligation to offer the shares to share-holders for subscription. However, the Management Board is authorized to exclude the subscription rights of shareholders with the consent of the Supervisory Board:
aa) to the extent that this is necessary for avoiding fractional shares; or
bb) if the issue price of the new shares is not significantly below the market price of already listed shares of the same class at the time of the final determination of the issue price and the total number of shares issued against contribution in cash, excluding subscription rights during the term of this authorization does not exceed 10 % of the common stock, neither at the date this authoriza-tion takes effect nor at the time it is exercised, in accor-dance with or in the respective application of Sec. 186 Para. 3 sentence 4 AktG.
The Management Board is authorized, with the consent of the Supervisory Board, to determine the further details of the capital increase and its implementation.
2. Conditional Capital a. The previous Conditional Capital 1999-I according to Sec. 5
Para. 6a of the Articles of Association was canceled by a reso-lution of the Annual General Meeting on 23 May 2014.
b. According to Sec. 5 Para. 6b of the Articles of Association, the Company’s common stock is conditionally increased by up to € 6,600,000.00, divided into a maximum of 6,600,000 no-par-value bearer shares (Conditional Capital 2011-I). The condi-tional capital increase will only be executed to the extent that
the holders of warrants or conversion rights resulting from convertible bonds or bonds with warrants, which were con-ferred by the Company until 30 April 2016 under the authori-zation of the Annual General Meeting of 19 May 2011, make use of their subscription rights or that the holders of con-vertible bonds, issued by the Company or one of its direct or indirect domestic or foreign wholly owned subsidiaries until 30 April 2016, and who are subject to a conversion obligation, meet their obligation to convert. The new shares participate in the Company’s profits from the beginning of the financial year in which they were created through the exercise of con-version rights or the fulfillment of conversion obligations.
c. According to Sec. 5 Para. 6c of the Articles of Association, the Company’s common stock is conditionally increased by up to € 352,800.00 through the issue of up to 352,800 new no-par-value bearer shares of the Company (Conditional Capital 2003-II). The conditional capital increase will only be exe-cuted to the extent that holders of convertible bonds issued exercise their conversion rights for conversion into ordinary shares of the Company. The new shares are first entitled to dividends for the financial year, for which there has been no resolution of the Annual General Meeting on the appropria-tion of accumulated income at the time of issuance. The Man-agement Board is authorized, with the consent of the Supervi-sory Board, to determine the further details of the conditional capital increase and its implementation.
d. The previous Conditional Capital 2008-II according to Sec. 5 Para. 6d of the Articles of Association was canceled by a res-olution of the Annual General Meeting on 23 May 2014.
e. According to Sec. 5 Para. 6e of the Articles of Association, the Company’s common stock is conditionally increased by up to € 450,000.00 through the issue of up to 450,000 new no-par-value bearer shares of the Company (Conditional Capital 2008-III). The conditional capital increase will only be exe-cuted to the extent that holders of convertible bonds issued exercise their conversion rights for conversion into ordinary shares of the Company. The new shares participate in the Company’s profits from the beginning of the financial year, for which there has been no resolution on the appropriation of accumulated income at the time of issuance. The Manage-ment Board is authorized, with the consent of the Supervi-sory Board, to determine the further details of the conditional capital increase and its implementation.
74GROUP MANAGEMENT REPORT
Statement on Corporate Governance and Corporate Governance Report
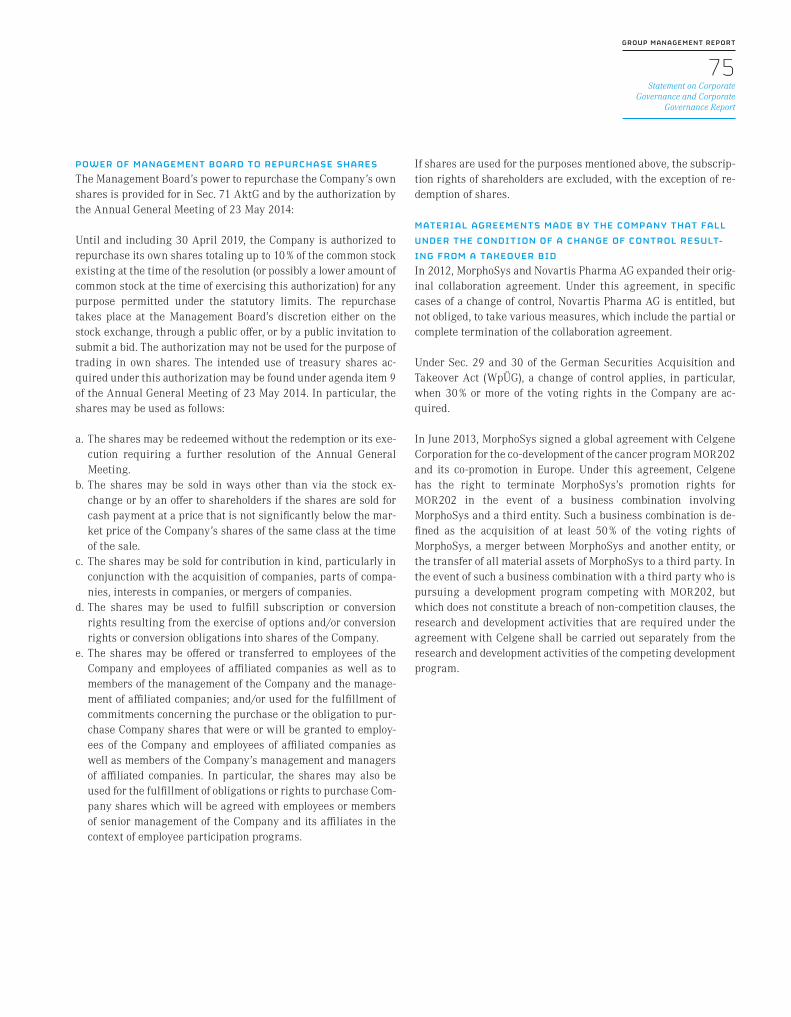
POWER OF MANAGEMENT BOARD TO REPURCHASE SHARES The Management Board’s power to repurchase the Company’s own shares is provided for in Sec. 71 AktG and by the authorization by the Annual General Meeting of 23 May 2014:
Until and including 30 April 2019, the Company is authorized to repurchase its own shares totaling up to 10 % of the common stock existing at the time of the resolution (or possibly a lower amount of common stock at the time of exercising this authorization) for any purpose permitted under the statutory limits. The repurchase takes place at the Management Board’s discretion either on the stock exchange, through a public offer, or by a public invitation to submit a bid. The authorization may not be used for the purpose of trading in own shares. The intended use of treasury shares ac-quired under this authorization may be found under agenda item 9 of the Annual General Meeting of 23 May 2014. In particular, the shares may be used as follows:
a. The shares may be redeemed without the redemption or its exe-cution requiring a further resolution of the Annual General Meeting.
b. The shares may be sold in ways other than via the stock ex-change or by an offer to shareholders if the shares are sold for cash payment at a price that is not significantly below the mar-ket price of the Company’s shares of the same class at the time of the sale.
c. The shares may be sold for contribution in kind, particularly in conjunction with the acquisition of companies, parts of compa-nies, interests in companies, or mergers of companies.
d. The shares may be used to fulfill subscription or conversion rights resulting from the exercise of options and/or conversion rights or conversion obligations into shares of the Company.
e. The shares may be offered or transferred to employees of the Company and employees of affiliated companies as well as to members of the management of the Company and the manage-ment of affiliated companies; and/or used for the fulfillment of commitments concerning the purchase or the obligation to pur-chase Company shares that were or will be granted to employ-ees of the Company and employees of affiliated companies as well as members of the Company’s management and managers of affiliated companies. In particular, the shares may also be used for the fulfillment of obligations or rights to purchase Com-pany shares which will be agreed with employees or members of senior management of the Company and its affiliates in the context of employee participation programs.
If shares are used for the purposes mentioned above, the subscrip-tion rights of shareholders are excluded, with the exception of re-demption of shares.
MATERIAL AGREEMENTS MADE BY THE COMPANY THAT FALL UNDER THE CONDITION OF A CHANGE OF CONTROL RESULT-ING FROM A TAKEOVER BID In 2012, MorphoSys and Novartis Pharma AG expanded their orig-inal collaboration agreement. Under this agreement, in specific cases of a change of control, Novartis Pharma AG is entitled, but not obliged, to take various measures, which include the partial or complete termination of the collaboration agreement.
Under Sec. 29 and 30 of the German Securities Acquisition and Takeover Act (WpÜG), a change of control applies, in particular, when 30 % or more of the voting rights in the Company are ac-quired. In June 2013, MorphoSys signed a global agreement with Celgene Corporation for the co-development of the cancer program MOR202 and its co-promotion in Europe. Under this agreement, Celgene has the right to terminate MorphoSys’s promotion rights for MOR202 in the event of a business combination involving MorphoSys and a third entity. Such a business combination is de-fined as the acquisition of at least 50 % of the voting rights of MorphoSys, a merger between MorphoSys and another entity, or the transfer of all material assets of MorphoSys to a third party. In the event of such a business combination with a third party who is pursuing a development program competing with MOR202, but which does not constitute a breach of non-competition clauses, the research and development activities that are required under the agreement with Celgene shall be carried out separately from the research and development activities of the competing development program.
75GROUP MANAGEMENT REPORT
Statement on Corporate Governance and Corporate
Governance Report
COMPENSATION AGREEMENTS CONCLUDED BY THE COMPANY WITH MEMBERS OF THE MANAGEMENT BOARD AND EMPLOY-EES IN THE EVENT OF A TAKEOVER BID Following a change of control, each member of the Management Board may terminate their employment contract and demand the fixed salary still outstanding until the end of the contract period. Moreover, in such a case, all stock options, convertible bonds and performance shares granted will become vested immediately and are exercisable after the expiration of the statutory waiting times or blackout periods.
Following a change of control, each member of the Senior Manage-ment Group may also terminate their employment contract and demand a severance payment equal to one annual gross fixed
salary. Moreover, in such a case, any stock options, convertible bonds and performance shares granted will also become vested immediately and are exercisable after the expiration of the statu-tory waiting times or blackout periods.
The following cases constitute a change of control: (i) MorphoSys transfers the Company’s assets, in whole or in substantial part, to an unaffiliated entity, (ii) MorphoSys merges with a non-affiliated entity, or (iii) a shareholder or third party directly or indirectly holds 30 % or more of the voting rights in MorphoSys.
76GROUP MANAGEMENT REPORT
Statement on Corporate Governance and Corporate Governance Report

Subsequent Events
Subsequent to the end of the 2014 financial year, there have not been any significant changes in the industry environment. Other events having a material impact on the net assets, financial posi-tion and results of operations have also not occurred since the end of the financial year.
77GROUP MANAGEMENT REPORT
Subsequent Events

FinancialStatementsconsol idated statement of income ( i frs) 80
consol idated statement of
comprehens ive income ( i frs) 8 1
consol idated bal ance shee t ( i frs) 8 2
consol idated statement changes in
stockholder ’s equ i t y ( i frs) 84
consol idated statement of cash flows ( i frs) 86
notes to the consol idated f inanc ial statements
gener al informat ion 88
summary of s ign if icant account ing p ol ic i es 88
segment rep ort ing 1 0 1
notes to the income statement 1 0 3
notes to the asse ts of the bal ance shee t 1 07
notes to equ i t y and l iab i l i t i es of the bal ance shee t 1 1 2
remuner at ion system for the management board
and employees of the group 1 1 5
add it ional notes 1 2 3
78F I N A N C I A L S TAT E M E N T S
Contents

79F I N A N C I A L S TAT E M E N T S
Contents

Consolidated Statement of Income (IFRS)
in € Note 2014 2013
Continuing Operations
Revenues 2.7.1, 4.1 63,977,978 77,960,057
Operating Expenses
Research and Development 2.7.2, 4.2.1 55,962,693 49,151,721
General and Administrative 2.7.2, 4.2.2 14,146,042 18,769,991
Total Operating Expenses 70,108,735 67,921,712
Other Income 2.7.3, 4.3 782,273 797,252
Other Expenses 2.7.4, 4.3 550,084 911,050
Earnings before Interest and Taxes (EBIT) (5,898,568) 9,924,547
Finance Income 2.7.5, 4.3 1,809,751 867,511
Finance Expenses 2.7.6, 4.3 219,879 111,161
Income Tax (Expenses)/Income 2.7.7, 4.4 1,296,067 (3,310,077)
Result for the Year from Continuing Operations (3,012,629) 7,370,820
Result for the Year from Discontinued Operations 0 5,951,110
Consolidated Net (Loss)/Profit (3,012,629) 13,321,930
Basic Net (Loss)/Profit per Share 2.7.8, 4.5 (0.12) 0.54
thereof from Continuing Operations 2.7.8, 4.5 (0.12) 0.30
thereof from Discontinued Operations 2.7.8, 4.5 0.00 0.24
Diluted Net (Loss)/Profit per Share 2.7.8, 4.5 (0.12) 0.54
thereof from Continuing Operations 2.7.8, 4.5 (0.12) 0.30
thereof from Discontinued Operations 2.7.8, 4.5 0.00 0.24
Shares Used in Computing Basic Net Result per Share 2.7.8, 4.5 25,903,995 24,504,031
Shares Used in Computing Diluted Net Result per Share 2.7.8, 4.5 26,190,314 24,763,094
80F I N A N C I A L S TAT E M E N T S
Consolidated Statement of Income (IFRS)

Consolidated Statement of Comprehensive Income (IFRS)*
in € 2014 2013
Consolidated Net (Loss)/Profit (3,012,629) 13,321,930
Change in Unrealized Gains and Losses on Available-for-sale Financial Assets and Bonds (347,517) (357,632)
(Thereof Reclassifications of Unrealized Gains and Losses to Profit and Loss) 318,957 482,018
Change of Current Tax Effects presented in Other Comprehensive Income on Available-for-sale Financial Assets and Bonds 244,151 259,878
Deferred Taxes (141,657) (176,706)
Change in Unrealized Gains and Losses on Available-for-sale Financial Assets and Bonds, Net of Deferred Tax (245,023) (274,460)
Effects from Equity-related Recognition of Deferred Taxes 0 28,098
Foreign Currency Gain from Consolidation 101,290 1,302,421
Comprehensive Income (143,733) 1,056,059
Total Comprehensive Income (3,156,362) 14,377,989
thereof from Continuing Operations (3,156,362) 13,001,310
thereof from Discontinued Operations 0 1,376,679
* In financial years 2014 and 2013, the statement of comprehensive income only comprised components, which will be reclassified in terms of IAS 1.82A(b) to profit or in subsequent periods when specific conditions are met.
81F I N A N C I A L S TAT E M E N T S
Consolidated Statement of Comprehensive Income (IFRS)

Consolidated Balance Sheet (IFRS)
in € Note 12/31/2014 12/31/2013
ASSETS
Current Assets
Cash and Cash Equivalents 2.8.1, 5.1 32,238,161 71,873,696
Available-for-sale Financial Assets 2.8.1, 5.2 106,039,373 188,360,354
Bonds, Available-for-sale 2.8.1, 5.2 7,488,259 11,102,087
Accounts Receivable 2.8.2, 5.3 14,990,532 10,270,322
Tax Receivables 2.8.2, 5.5 1,120,563 77,743
Other Receivables 2.8.2, 5.4 157,093,262 119,458,330
Inventories, Net 2.8.3, 5.5 556,171 731,009
Prepaid Expenses and Other Current Assets 2.8.4, 5.5 2,869,067 4,693,943
Total Current Assets 322,395,388 406,567,484
Non-current Assets
Property, Plant and Equipment, Net 2.8.5, 5.6 3,557,729 2,168,189
Patents, Net 2.8.6, 5.7.1 6,987,910 7,834,711
Licenses, Net 2.8.6, 5.7.2 1,343,188 5,396,516
In-Licensed Research Programs 2.8.6, 5.7.3 28,254,201 12,807,800
Software, Net 2.8.6, 5.7.4 2,042,206 1,758,026
Goodwill 2.8.6, 5.7.5 7,352,467 7,352,467
Other Receivables, Net of Current Portion 2.8.2, 5.4 50,030,000 0
Shares Available-for-sale, Net of Current Portion 2.8.7, 5.8 1,726,633 1,726,633
Deferred Tax Asset 2.8.7, 4.4 1,737,387 313,372
Prepaid Expenses and Other Assets, Net of Current Portion 2.8.8, 5.9 1,050,864 1,731,548
Total Non-current Assets 104,082,585 41,089,262
TOTAL ASSETS 426,477,973 447,656,746
82F I N A N C I A L S TAT E M E N T S
Consolidated Balance Sheet (IFRS)

in € Note 12/31/2014 12/31/2013
LIABILITIES AND STOCKHOLDERS’ EQUIT Y
Current Liabilities
Accounts Payable and Accrued Expenses 2.9.1, 6.1 17,830,792 17,190,021
Tax Liabilities 2.9.2, 6.2 777,281 2,690,282
Provisions 2.9.1, 6.2 19,541 260,000
Current Portion of Deferred Revenue 2.9.3, 6.3 14,075,166 15,266,877
Total Current Liabilities 32,702,780 35,407,180
Non-current Liabilities
Provisions, Net of Current Portion 2.9.4, 6.2 43,344 636,941
Deferred Revenue, Net of Current Portion 2.9.4, 6.3 44,677,035 59,168,599
Convertible Bonds due to Related Parties 2.9.5 251,679 298,606
Total Non-current Liabilities 44,972,058 60,104,146
Total Liabilities 77,674,838 95,511,326
Stockholders’ Equity
Common Stock 2.9.7, 6.4.1 26,456,834 26,220,882
Ordinary Shares Issued (26,456,834 and 26,220,882 for 2014 and 2013, respectively)
Ordinary Shares Outstanding (26,005,944 and 25,880,992 for 2014 and 2013, respectively)
Treasury Stock (450,890 and 339,890 shares for 2014 and 2013, respectively), at Cost 2.9.7, 6.4.4 (14,251,962) (6,418,018)
Additional Paid-in Capital 2.9.7, 6.4.5 318,375,720 310,963,651
Revaluation Reserve 2.9.7, 6.4.6 (4,642) 240,381
Translation Reserve 2.9.7, 6.4.7 293,846 192,556
Accumulated Income 2.9.7, 6.4.8 17,933,339 20,945,968
Total Stockholders’ Equity 348,803,135 352,145,420
TOTAL LIABILITIES AND STOCKHOLDER’S EQUIT Y 426,477,973 447,656,746
83F I N A N C I A L S TAT E M E N T S
Consolidated Balance Sheet (IFRS)
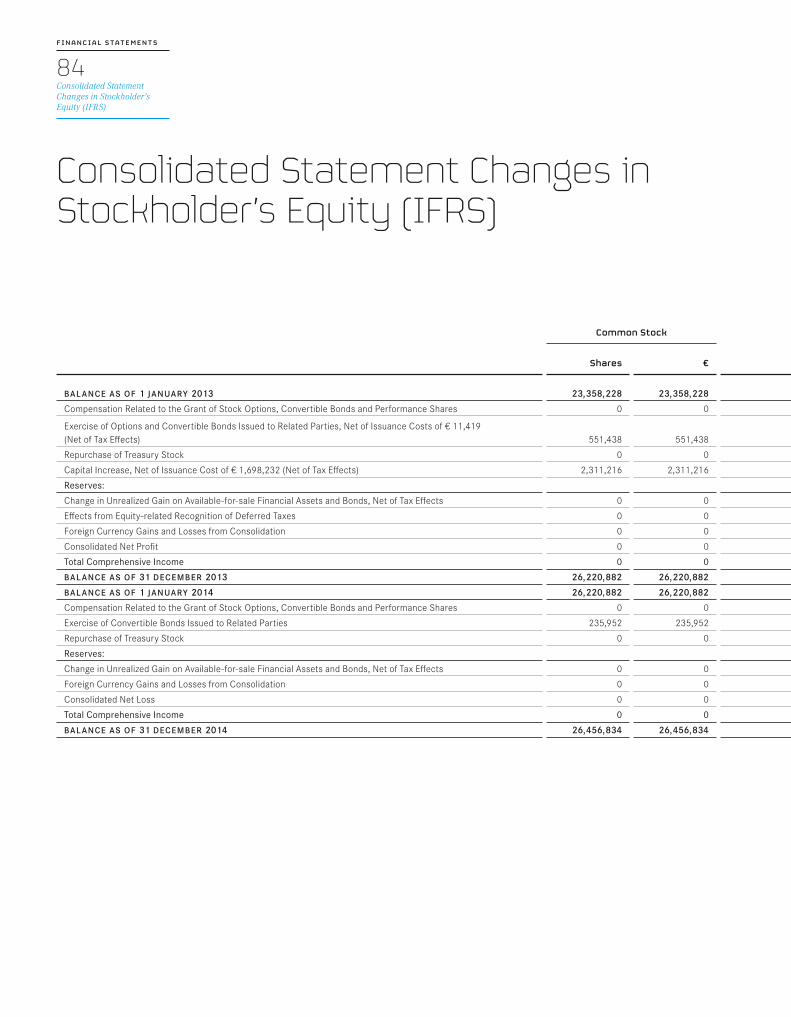
Consolidated Statement Changes in Stockholder’s Equity (IFRS)
Common Stock
Treasury Stock Additional Paid-in Capital
€
Revaluation Reserve
€
Translation Reserve
€
Accumulated Income
€
Total Stock-holders’ Equity
€
Shares € Shares €
BALANCE AS OF 1 JANUARY 2013 23,358,228 23,358,228 255,415 (3,594,393) 175,245,266 486,743 (1,109,865) 7,624,038 202,010,017
Compensation Related to the Grant of Stock Options, Convertible Bonds and Performance Shares 0 0 0 0 4,742,092 0 0 0 4,742,092
Exercise of Options and Convertible Bonds Issued to Related Parties, Net of Issuance Costs of € 11,419 (Net of Tax Effects) 551,438 551,438 0 0 6,606,570 0 0 0 7,158,008
Repurchase of Treasury Stock 0 0 84,475 (2,823,625) 0 0 0 0 (2,823,625)
Capital Increase, Net of Issuance Cost of € 1,698,232 (Net of Tax Effects) 2,311,216 2,311,216 0 0 124,369,723 0 0 0 126,680,939
Reserves:
Change in Unrealized Gain on Available-for-sale Financial Assets and Bonds, Net of Tax Effects 0 0 0 0 0 (274,460) 0 0 (274,460)
Effects from Equity-related Recognition of Deferred Taxes 0 0 0 0 0 28,098 0 0 28,098
Foreign Currency Gains and Losses from Consolidation 0 0 0 0 0 0 1,302,421 0 1,302,421
Consolidated Net Profit 0 0 0 0 0 0 0 13,321,930 13,321,930
Total Comprehensive Income 0 0 0 0 0 (246,362) 1,302,421 13,321,930 14,377,989
BALANCE AS OF 31 DECEMBER 2013 26,220,882 26,220,882 339,890 (6,418,018) 310,963,651 240,381 192,556 20,945,968 352,145,420
BALANCE AS OF 1 JANUARY 2014 26,220,882 26,220,882 339,890 (6,418,018) 310,963,651 240,381 192,556 20,945,968 352,145,420
Compensation Related to the Grant of Stock Options, Convertible Bonds and Performance Shares 0 0 0 0 3,686,387 0 0 0 3,686,387
Exercise of Convertible Bonds Issued to Related Parties 235,952 235,952 0 0 3,725,682 0 0 0 3,961,634
Repurchase of Treasury Stock 0 0 111,000 (7,833,944) 0 0 0 0 (7,833,944)
Reserves:
Change in Unrealized Gain on Available-for-sale Financial Assets and Bonds, Net of Tax Effects 0 0 0 0 0 (245,023) 0 0 (245,023)
Foreign Currency Gains and Losses from Consolidation 0 0 0 0 0 0 101,290 0 101,290
Consolidated Net Loss 0 0 0 0 0 0 0 (3,012,629) (3,012,629)
Total Comprehensive Income 0 0 0 0 0 (245,023) 101,290 (3,012,629) (3,156,362)
BALANCE AS OF 31 DECEMBER 2014 26,456,834 26,456,834 450,890 (14,251,962) 318,375,720 (4,642) 293,846 17,933,339 348,803,135
84F I N A N C I A L S TAT E M E N T S
Consolidated Statement Changes in Stockholder’s Equity (IFRS)

Consolidated Statement Changes in Stockholder’s Equity (IFRS)
Common Stock
Treasury Stock Additional Paid-in Capital
€
Revaluation Reserve
€
Translation Reserve
€
Accumulated Income
€
Total Stock-holders’ Equity
€
Shares € Shares €
BALANCE AS OF 1 JANUARY 2013 23,358,228 23,358,228 255,415 (3,594,393) 175,245,266 486,743 (1,109,865) 7,624,038 202,010,017
Compensation Related to the Grant of Stock Options, Convertible Bonds and Performance Shares 0 0 0 0 4,742,092 0 0 0 4,742,092
Exercise of Options and Convertible Bonds Issued to Related Parties, Net of Issuance Costs of € 11,419 (Net of Tax Effects) 551,438 551,438 0 0 6,606,570 0 0 0 7,158,008
Repurchase of Treasury Stock 0 0 84,475 (2,823,625) 0 0 0 0 (2,823,625)
Capital Increase, Net of Issuance Cost of € 1,698,232 (Net of Tax Effects) 2,311,216 2,311,216 0 0 124,369,723 0 0 0 126,680,939
Reserves:
Change in Unrealized Gain on Available-for-sale Financial Assets and Bonds, Net of Tax Effects 0 0 0 0 0 (274,460) 0 0 (274,460)
Effects from Equity-related Recognition of Deferred Taxes 0 0 0 0 0 28,098 0 0 28,098
Foreign Currency Gains and Losses from Consolidation 0 0 0 0 0 0 1,302,421 0 1,302,421
Consolidated Net Profit 0 0 0 0 0 0 0 13,321,930 13,321,930
Total Comprehensive Income 0 0 0 0 0 (246,362) 1,302,421 13,321,930 14,377,989
BALANCE AS OF 31 DECEMBER 2013 26,220,882 26,220,882 339,890 (6,418,018) 310,963,651 240,381 192,556 20,945,968 352,145,420
BALANCE AS OF 1 JANUARY 2014 26,220,882 26,220,882 339,890 (6,418,018) 310,963,651 240,381 192,556 20,945,968 352,145,420
Compensation Related to the Grant of Stock Options, Convertible Bonds and Performance Shares 0 0 0 0 3,686,387 0 0 0 3,686,387
Exercise of Convertible Bonds Issued to Related Parties 235,952 235,952 0 0 3,725,682 0 0 0 3,961,634
Repurchase of Treasury Stock 0 0 111,000 (7,833,944) 0 0 0 0 (7,833,944)
Reserves:
Change in Unrealized Gain on Available-for-sale Financial Assets and Bonds, Net of Tax Effects 0 0 0 0 0 (245,023) 0 0 (245,023)
Foreign Currency Gains and Losses from Consolidation 0 0 0 0 0 0 101,290 0 101,290
Consolidated Net Loss 0 0 0 0 0 0 0 (3,012,629) (3,012,629)
Total Comprehensive Income 0 0 0 0 0 (245,023) 101,290 (3,012,629) (3,156,362)
BALANCE AS OF 31 DECEMBER 2014 26,456,834 26,456,834 450,890 (14,251,962) 318,375,720 (4,642) 293,846 17,933,339 348,803,135
85F I N A N C I A L S TAT E M E N T S
Consolidated Statement Changes in Stockholder’s
Equity (IFRS)

Consolidated Statement of Cash Flows (IFRS)
in € Note 2014 2013
OPER ATING ACTIVITIES:
Consolidated Net (Loss)/Profit (3,012,629) 13,321,930
Adjustments to Reconcile Net Profit to Net Cash Provided by Operating Activities:
Impairment of Assets 5.6, 5.7 4,117,590 1,624,255
Depreciation and Amortization of Tangible and Intangible Assets 5.6, 5.7 4,134,479 4,834,447
Net Gain on Sales of Financial Assets 5.2 (727,979) (520,730)
Purchase of Derivative Financial Instruments 5.4 (15,820) (22,800)
Proceeds from the Disposal of Derivative Financial Instruments 9,503 0
Unrealized Net Gain/(Loss) on Derivative Financial Instruments 5.4 (38,189) 22,800
(Gain)/Loss on Sale of Property, Plant and Equipment/Intangible Assets (7,269) 6,791
Loss from Liquidation of Subsidiaries 76,489 0
Net Gain on Sale of Assets Classified as Available-for-sale 0 (8,000,712)
Recognition of Deferred Revenue 6.3 (33,546,601) (23,989,809)
Stock-based Compensation 4.2.3, 7 3,959,340 5,145,455
Income Tax Expenses/(Income) 4.4 (1,296,067) 3,699,337
Changes in Operating Assets and Liabilities:
Accounts Receivable 5.3 (4,720,210) (1,500,912)
Prepaid Expenses, Other Assets and Tax Receivables 5.4, 5.5 907,573 (3,157,708)
Accounts Payable and Accrued Expenses and Provisions 6.1, 6.2 218,748 6,524,350
Other Liabilities 6.1 156,412 526,350
Deferred Revenue 6.3 17,863,327 91,860,930
Interest Paid (117,371) (24,591)
Interest Received 762,680 167,797
Income Taxes Paid (2,942,362) (1,379,563)
Net Cash Provided/(Used) by Operating Activities (14,218,356) 89,137,617
thereof from Continuing Operations (14,218,356) 91,005,448
thereof from Discontinued Operations 0 (1,867,831)
86F I N A N C I A L S TAT E M E N T S
Consolidated Statement of Cash Flows (IFRS)

in € Note 2014 2013
INVESTING ACTIVITIES:
Purchase of Financial Assets 5.2 (149,061,725) (192,261,784)
Proceeds from Sales of Financial Assets 5.2 231,934,641 83,823,406
Purchase of Bonds, Available-for-sale 5.2 (7,571,909) (11,138,742)
Proceeds from Sales of Bonds, Available-for-sale 11,156,203 0
Purchase of Assets Classified as Loans and Receivables 2.8.2, 5.4 (241,635,544) (173,185,607)
Proceeds from Sale of Assets Classified as Loans and Receivables 2.8.2, 5.4 149,466,472 68,729,122
Purchase of Shares Classified as Available-for-sale 2.8.7, 5.8 0 (845,000)
Purchase of Property, Plant and Equipment 5.6 (2,899,662) (1,049,566)
Proceeds from Disposals of Property, Plant and Equipment 5,000 5,950
Purchase of Intangible Assets 5.7 (17,579,001) (4,513,991)
Proceeds from Disposal of Assets Classified as Available-for-sale 0 36,579,511
Proceeds from Closing of an Escrow Account 4,686,883 0
Net Cash Used by Investing Activities (21,498,642) (193,856,701)
thereof from Continuing Operations (21,498,642) (230,437,417)
thereof from Discontinued Operations 0 36,580,716
FINANCING ACTIVITIES:
Repurchase of Treasury Stock 6.4.4 (7,833,944) (2,823,625)
Proceeds of Share Issuance 0 128,379,156
Proceeds from the Exercise of Options and Convertible Bonds Granted to Related Parties 3,914,707 7,169,564
Net of Proceeds and Payments from the Issuance of Convertible Bonds Granted to Related Parties 7.1.2 0 225,000
Cost of Share Issuance 6.4.5 0 (2,323,688)
Net Cash Provided/(Used) by Financing Activities (3,919,237) 130,626,407
thereof from Continuing Operations (3,919,237) 130,626,407
thereof from Discontinued Operations 0 0
Effect of Exchange Rate Differences on Cash 700 (4,467)
(Decrease)/Increase in Cash and Cash Equivalents (39,635,535) 25,902,856
Cash and Cash Equivalents at the Beginning of the Period 71,873,696 45,970,840
Cash and Cash Equivalents at the End of the Period 32,238,161 71,873,696
87F I N A N C I A L S TAT E M E N T S
Consolidated Statement of Cash Flows (IFRS)

Notes
1 General Information
BUSINESS ACTIVITIES AND THE COMPANYMorphoSys AG (“the Company” or “MorphoSys”) is a leader in the develop-ment of highly efficient technologies for the generation of therapeutic anti-bodies. The Company’s proprietary portfolio of compounds and the pipe-line of compounds jointly developed with partners from the pharmaceutical and biotechnology industry is among one of the broadest in the industry. The Group was founded in July 1992 as a German limited liability com-pany. In June 1998, MorphoSys became a German stock corporation. In March 1999, the Company completed its initial public offering on Germa-ny’s “Neuer Markt”: the segment of the Deutsche Börse designated for high-growth companies. On 15 January 2003, MorphoSys AG was admit-ted to the Prime Standard segment of the Frankfurt Stock Exchange.
2 Summary of Significant Accounting Policies
2.1 BASIS OF AND CHANGES IN ACCOUNTING STANDARDS2.1.1 BASIS OF APPLICATION
These consolidated financial statements were prepared in accordance with the International Financial Reporting Standards (IFRS) as published by the International Accounting Standards Board (IASB), London. The state-ments take into account the recommendations of the International Finan-cial Reporting Standards Interpretations Committee (IFRS IC), as applica-ble in the European Union (EU). They also give consideration to the supplementary German commercial law provisions, applicable in accor-dance with Sec. 315a Para. 1 of the German Commercial Code (HGB).
These consolidated financial statements as of 31 December 2014 comprise MorphoSys AG and its subsidiaries (collectively referred to as the “MorphoSys Group” or the “Group”).
In preparing the consolidated financial statements in accordance with IFRS, the Management Board is required to make certain estimates and assumptions which have an effect on the amounts recognized in the con-solidated financial statements and the accompanying notes. The actual results may differ from these estimates. The estimates and the underlying assumptions are subject to continuous review. Any changes in estimates are recognized in the period in which the changes are made and in all relevant future periods.
The consolidated financial statements have been prepared in euro – the MorphoSys Group’s functional currency. The statements are prepared on the basis of historical cost, except for derivative financial instruments and available-for-sale financial assets, which are recognized at their respec-tive fair value. All figures in this report are rounded to the nearest euro, thousand euros, or million euros.
To provide improved transparency, the presentation of reserves in the balance sheet is divided into “Revaluation Reserve” and “Translation Re-serve”.
Unless stated otherwise, the accounting policies set out below have been applied consistently to all periods presented in these consolidated finan-cial statements.
88F I N A N C I A L S TAT E M E N T S
Notes
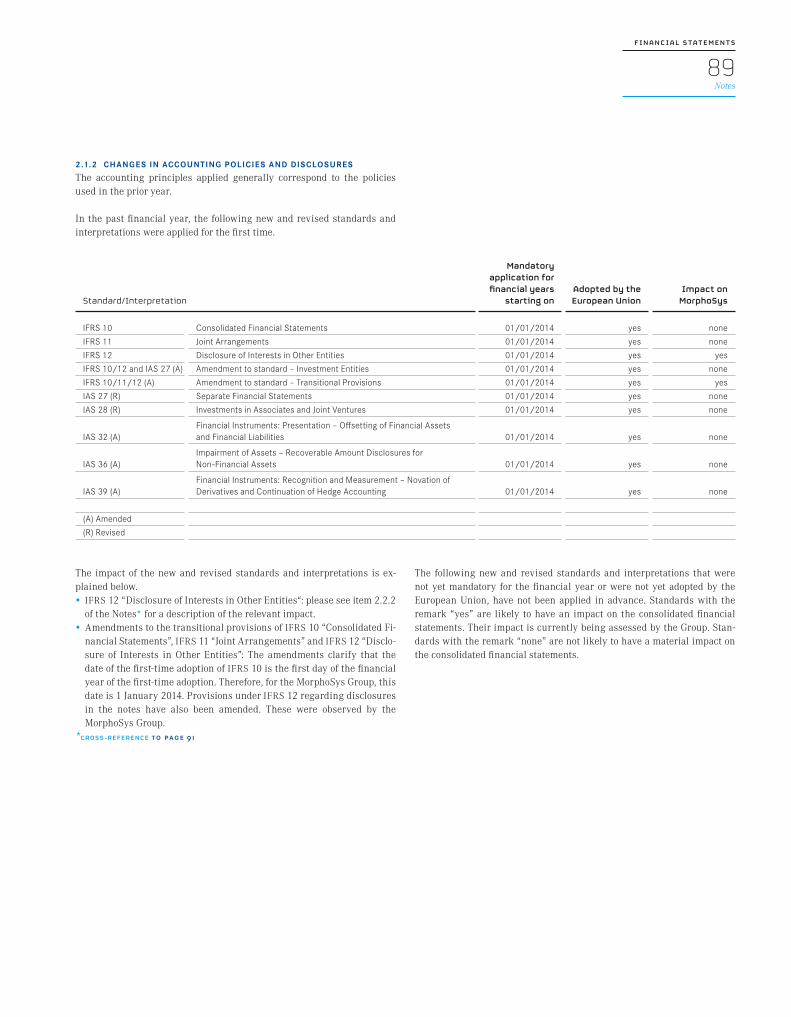
2.1.2 CHANGES IN ACCOUNTING POLICIES AND DISCLOSURES
The accounting principles applied generally correspond to the policies used in the prior year.
In the past financial year, the following new and revised standards and interpretations were applied for the first time.
Standard/Interpretation
Mandatory application for financial years
starting on Adopted by the European Union
Impact on MorphoSys
IFRS 10 Consolidated Financial Statements 01/01/2014 yes none
IFRS 11 Joint Arrangements 01/01/2014 yes none
IFRS 12 Disclosure of Interests in Other Entities 01/01/2014 yes yes
IFRS 10/12 and IAS 27 (A) Amendment to standard – Investment Entities 01/01/2014 yes none
IFRS 10/11/12 (A) Amendment to standard – Transitional Provisions 01/01/2014 yes yes
IAS 27 (R) Separate Financial Statements 01/01/2014 yes none
IAS 28 (R) Investments in Associates and Joint Ventures 01/01/2014 yes none
IAS 32 (A)Financial Instruments: Presentation – Offsetting of Financial Assets and Financial Liabilities 01/01/2014 yes none
IAS 36 (A)Impairment of Assets – Recoverable Amount Disclosures for Non-Financial Assets 01/01/2014 yes none
IAS 39 (A)Financial Instruments: Recognition and Measurement – Novation of Derivatives and Continuation of Hedge Accounting 01/01/2014 yes none
(A) Amended
(R) Revised
The impact of the new and revised standards and interpretations is ex-plained below. • IFRS 12 “Disclosure of Interests in Other Entities“: please see item 2.2.2
of the Notes* for a description of the relevant impact. • Amendments to the transitional provisions of IFRS 10 “Consolidated Fi-
nancial Statements”, IFRS 11 “Joint Arrangements” and IFRS 12 “Disclo-sure of Interests in Other Entities”: The amendments clarify that the date of the first-time adoption of IFRS 10 is the first day of the financial year of the first-time adoption. Therefore, for the MorphoSys Group, this date is 1 January 2014. Provisions under IFRS 12 regarding disclosures in the notes have also been amended. These were observed by the MorphoSys Group.
*CROSS-REFERENCE to page 9 1
The following new and revised standards and interpretations that were not yet mandatory for the financial year or were not yet adopted by the European Union, have not been applied in advance. Standards with the remark “yes” are likely to have an impact on the consolidated financial statements. Their impact is currently being assessed by the Group. Stan-dards with the remark “none” are not likely to have a material impact on the consolidated financial statements.
89F I N A N C I A L S TAT E M E N T S
Notes

Standard/Interpretation
Mandatory application for financial years
starting on Adopted by the European Union
Possible impact on MorphoSys
IFRS 9 Financial Instruments 01/01/2018 no yes
IFRS 14 Regulatory Deferral Accounts 01/01/2016 no none
IFRS 15 Revenue from Contracts with Customers 01/01/2017 no yes
IFRS 10 and IAS 28 (A)Sale or Contribution of Assets between an Investor and its Associate or Joint Venture 01/01/2016 no none
IFRS 11 (A) Accounting for Acquisitions of Interests in Joint Operations 01/01/2016 no none
IAS 16 and IAS 38 (A) Clarification of Acceptable Methods of Depreciation and Amortization 01/01/2016 no none
IAS 16 and IAS 41 (A) Bearer Plants 01/01/2016 no none
IAS 19 (A) Employee Contributions to Defined Benefit Plans 01/07/2014 no none
IAS 27 (A) Application of the Equity Method in Separate Financial Statements 01/01/2016 no none
IFRIC 21 Levies 17/06/2014 yes none
Improvements to International Financial Reporting Standards, 2010 - 2012 cycle 01/07/2014 no none
Improvements to International Financial Reporting Standards, 2011 - 2013 cycle 01/07/2014 no none
Improvements to International Financial Reporting Standards, 2012 - 2014 cycle 01/01/2016 no none
(A) Amended Erweitert
2.2 CONSOLIDATION PRINCIPLESIntercompany balances and transactions and any unrealized gains arising from intercompany transactions are eliminated when preparing consoli-dated financial statements pursuant to IFRS 10.B86. Unrealized losses are eliminated in the same manner as unrealized gains, but are considered an indication of a possible impairment of the transferred asset. Accounting policies have been applied consistently for all subsidiaries.
2.2.1 CONSOLIDATED COMPANIES AND SCOPE OF CONSOLIDATION
MorphoSys AG has two wholly-owned subsidiaries (collectively referred to as the “MorphoSys Group” or the “Group”): Sloning BioTechnology GmbH and Poole Real Estate Ltd. (formerly Biogenesis UK Ltd.).
Upon entry into the commercial register on 13 August 2014 and based on the merger agreement dated 27 June 2014, MorphoSys IP GmbH, as the transferring legal entity, was merged into MorphoSys AG, as the acquiring legal entity, with the effective date of 1 January 2014.
MorphoSys USA, Inc., Charlotte, North Carolina, USA, was liquidated in financial year 2014. The remaining assets were distributed to MorphoSys AG as the sole shareholder.
On 31 December 2014, Poole Real Estate Ltd., Oxford, UK, was in the pro-cess of liquidation. The liquidation was resolved by the shareholders and entered into the commercial register of the United Kingdom (Companies House) on 20 March 2014.
The consolidated financial statements for the year ended 31 December 2014 were prepared and approved by the Management Board in its meet-ing on 17 February 2015 by a resolution of the Management Board. The Management Board is composed of Dr. Simon Moroney (Chief Executive Officer), Jens Holstein (Chief Financial Officer), Dr. Marlies Sproll (Chief Scientific Officer), and Dr. Arndt Schottelius (Chief Development Officer). The Supervisory Board is allowed to amend the financial statements after their approval by the Management Board. The registered offices of the MorphoSys Group’s headquarters are located at Lena-Christ-Straße 48, 82152 Martinsried, Germany.
SCOPE OF CONSOLIDATION AS OF 31 DECEMBER 2014
Name and Corporate Seat of the Company Local Currency
Exchange Rate on Dec 31, 2014 one Unit of Euro
in Local Currency Share of
Capital %Share Capital in Local Currency
Total Assets in Local Currency
Total Liabilities in Local Currency
Total Revenue in Local Currency
Profit/Loss in Local Currency
COMPANY CONSOLIDATED (APART FROM PARENT COMPANY)
Poole Real Estate Ltd., Oxford, UK £ 0.78266 100 200 17,215 5,000 0 (4,484)
Sloning BioTechnology GmbH, Martinsried, Germany € – 100 951,660 18,288,050 14,865,102 3,041,936 2,865,381
90F I N A N C I A L S TAT E M E N T S
Notes
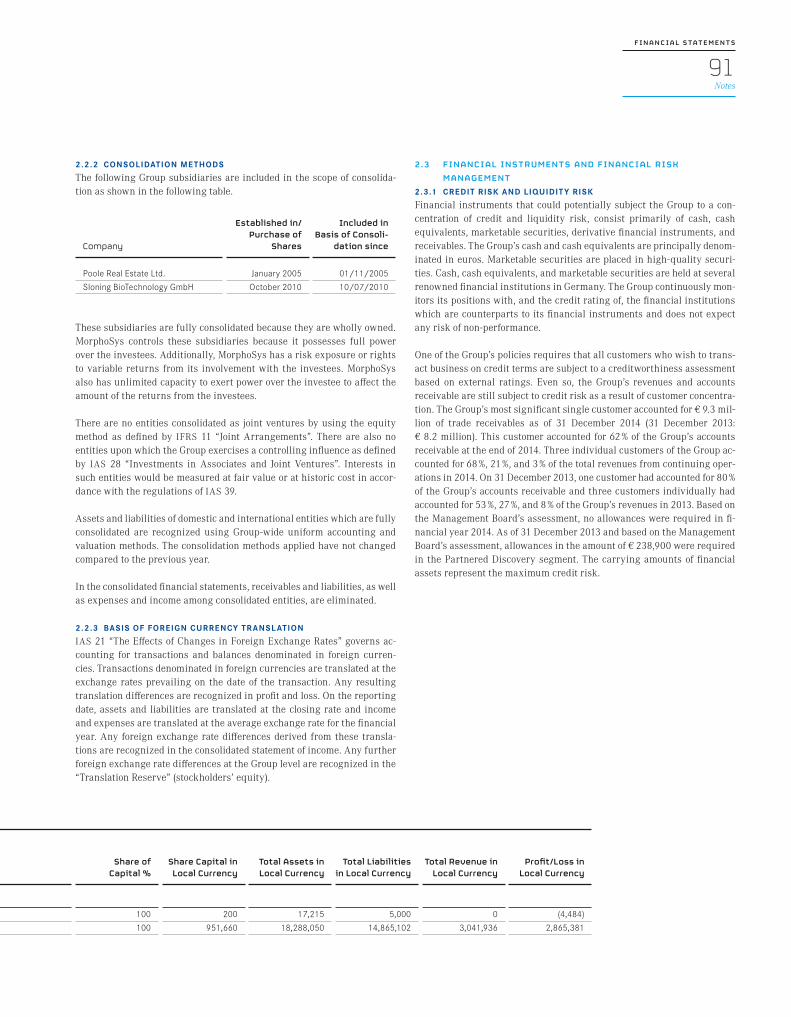
2.2.2 CONSOLIDATION METHODS
The following Group subsidiaries are included in the scope of consolida-tion as shown in the following table.
Company
Established in/Purchase of
Shares
Included in Basis of Consoli-
dation since
Poole Real Estate Ltd. January 2005 01/11/2005
Sloning BioTechnology GmbH October 2010 10/07/2010
These subsidiaries are fully consolidated because they are wholly owned. MorphoSys controls these subsidiaries because it possesses full power over the investees. Additionally, MorphoSys has a risk exposure or rights to variable returns from its involvement with the investees. MorphoSys also has unlimited capacity to exert power over the investee to affect the amount of the returns from the investees.
There are no entities consolidated as joint ventures by using the equity method as defined by IFRS 11 “Joint Arrangements”. There are also no entities upon which the Group exercises a controlling influence as defined by IAS 28 “Investments in Associates and Joint Ventures”. Interests in such entities would be measured at fair value or at historic cost in accor-dance with the regulations of IAS 39.
Assets and liabilities of domestic and international entities which are fully consolidated are recognized using Group-wide uniform accounting and valuation methods. The consolidation methods applied have not changed compared to the previous year.
In the consolidated financial statements, receivables and liabilities, as well as expenses and income among consolidated entities, are eliminated.
2.2.3 BASIS OF FOREIGN CURRENCY TR ANSLATION
IAS 21 “The Effects of Changes in Foreign Exchange Rates” governs ac-counting for transactions and balances denominated in foreign curren-cies. Transactions denominated in foreign currencies are translated at the exchange rates prevailing on the date of the transaction. Any resulting translation differences are recognized in profit and loss. On the reporting date, assets and liabilities are translated at the closing rate and income and expenses are translated at the average exchange rate for the financial year. Any foreign exchange rate differences derived from these transla-tions are recognized in the consolidated statement of income. Any further foreign exchange rate differences at the Group level are recognized in the “Translation Reserve” (stockholders’ equity).
2.3 FINANCIAL INSTRUMENTS AND FINANCIAL RISK MANAGEMENT
2.3.1 CREDIT RISK AND LIQUIDIT Y RISK
Financial instruments that could potentially subject the Group to a con-centration of credit and liquidity risk, consist primarily of cash, cash equivalents, marketable securities, derivative financial instruments, and receivables. The Group’s cash and cash equivalents are principally denom-inated in euros. Marketable securities are placed in high-quality securi-ties. Cash, cash equivalents, and marketable securities are held at several renowned financial institutions in Germany. The Group continuously mon-itors its positions with, and the credit rating of, the financial institutions which are counterparts to its financial instruments and does not expect any risk of non-performance.
One of the Group’s policies requires that all customers who wish to trans-act business on credit terms are subject to a creditworthiness assessment based on external ratings. Even so, the Group’s revenues and accounts receivable are still subject to credit risk as a result of customer concentra-tion. The Group’s most significant single customer accounted for € 9.3 mil-lion of trade receivables as of 31 December 2014 (31 December 2013: € 8.2 million). This customer accounted for 62 % of the Group’s accounts receivable at the end of 2014. Three individual customers of the Group ac-counted for 68 %, 21 %, and 3 % of the total revenues from continuing oper-ations in 2014. On 31 December 2013, one customer had accounted for 80 % of the Group’s accounts receivable and three customers individually had accounted for 53 %, 27 %, and 8 % of the Group’s revenues in 2013. Based on the Management Board’s assessment, no allowances were required in fi-nancial year 2014. As of 31 December 2013 and based on the Management Board’s assessment, allowances in the amount of € 238,900 were required in the Partnered Discovery segment. The carrying amounts of financial assets represent the maximum credit risk.
SCOPE OF CONSOLIDATION AS OF 31 DECEMBER 2014
Name and Corporate Seat of the Company Local Currency
Exchange Rate on Dec 31, 2014 one Unit of Euro
in Local Currency Share of
Capital %Share Capital in Local Currency
Total Assets in Local Currency
Total Liabilities in Local Currency
Total Revenue in Local Currency
Profit/Loss in Local Currency
COMPANY CONSOLIDATED (APART FROM PARENT COMPANY)
Poole Real Estate Ltd., Oxford, UK £ 0.78266 100 200 17,215 5,000 0 (4,484)
Sloning BioTechnology GmbH, Martinsried, Germany € – 100 951,660 18,288,050 14,865,102 3,041,936 2,865,381
91F I N A N C I A L S TAT E M E N T S
Notes

The credit risk of trade receivables by geographic region as of the report-ing date was composed as follows.
in € 12/31/2014 12/31/2013
Europe and Asia 10,264,935 8,538,478
USA and Canada 4,725,597 1,731,844
Other 0 0
TOTAL 14,990,532 10,270,322
The term structure of trade receivables as of the reporting date was com-posed as follows.
in €; A/R are due in12/31/2014 0 (30) days
12/31/2014 30 (60) days
12/31/2014 60 + days
12/31/2014 Total
Accounts Receivable 14,666,085 324,447 0 14,990,532
Write-off 0 0 0 0
Accounts Receivable, Net of Allowance for Impairment 14,666,085 324,447 0 14,990,532
in €; A/R are due in12/31/2013 0 (30) days
12/31/2013 30 (60) days
12/31/2013 60 + days
12/31/2013 Total
Accounts Receivable 10,344,683 8,681 155,858 10,509,222
Write-off (238,900) 0 0 (238,900)
Accounts Receivable, Net of Allowance for Impairment 10,105,783 8,681 155,858 10,270,322
As of 31 December 2014 and 31 December 2013, the Group was not ex-posed to a credit risk from derivative financial instruments. The maxi-mum credit risk of financial guarantees (rent deposits) as of the reporting date amounted to € 0.6 million (31 December 2013: € 1.3 million).
The contractually agreed maturities and the corresponding cash outflows of accounts payable are within one year. The convertible bonds due to re-lated parties have a term until 31 December 2015 and 31 March 2020 (maximum cash outflow: € 0.3 million).
2.3.2 MARKET RISK
Market risk is the risk that changes in market prices, such as foreign exchange rates, interest rates, and equity prices, will affect the Group’s results of operations or the value of the financial instruments held. The Group is exposed to currency and interest rate risks.
CURRENCY RISK
The consolidated financial statements are prepared in euros. While the expenses of MorphoSys are predominantly incurred in euros, a part of the revenues is dependent upon the current exchange rates of the US dollar. The Group examines the necessity of hedging foreign exchange rates to minimize currency risk during the year and addresses this risk by using derivative financial instruments.
92F I N A N C I A L S TAT E M E N T S
Notes

The Group’s exposure to foreign currency risk based on carrying amounts was composed as follows.
as of 31 December 2014; in € EUR USD GBP Total
Cash and Cash Equivalents 32,130,970 107,191 0 32,238,161
Available-for-sale Financial Assets 106,039,373 0 0 106,039,373
Bonds, Available-for-sale 7,488,259 0 0 7,488,259
Accounts Receivable 14,887,707 102,825 0 14,990,532
Accounts Payable and Accrued Expenses (17,898,438) 67,646 0 (17,830,792)
TOTAL 142,647,871 277,662 0 142,925,533
as of 31 December 2013; in € EUR USD GBP Total
Cash and Cash Equivalents 70,885,679 24,643 963,374 71,873,696
Available-for-sale Financial Assets 188,360,354 0 0 188,360,354
Available-for-sale Assets 11,102,087 0 0 11,102,087
Accounts Receivable 10,270,322 0 0 10,270,322
Accounts Payable and Accrued Expenses (17,260,346) 60,316 10,009 (17,190,021)
TOTAL 263,358,096 84,959 973,383 264,416,438
Different foreign exchange rates and their impact on assets and liabilities were simulated in a detailed sensitivity analysis in order to determine the resulting effects on income. A 10 % increase of the euro against the US dollar as of 31 December 2014 would have slightly decreased the Group’s income (assuming stable interest rates). A 10 % decline of the euro against the US dollar would have slightly increased the Group’s income. Foreign currency issues in the British pound did not exist as of 31 December 2014.
A 10 % increase of the euro against the US dollar as of 31 December 2013 would have slightly increased the Group’s profit from continuing opera-tions (assuming stable interest rates). A 10 % decline of the euro against the US dollar would have slightly decreased the Group’s profit from con-tinuing operations. A 10 % increase of the euro against the British pound as of 31 December 2013 would have reduced the Group’s profit from con-tinuing operations by € 0.1 million (assuming stable interest rates). A 10 % decline of the euro against the British pound would have increased the Group’s profit from continuing operations by € 0.1 million.
If the foreign exchange rates for the US dollar against the euro remained unchanged at the average rate of 2013, the Group’s revenues from continu-ing operations would have been € 0.1 million higher (2013: Group reve-nues from continuing operations would have been € 0.1 million higher).
INTEREST R ATE RISK
The Group’s risk exposure to changes in interest rates mainly concerns available-for-sale securities/investments. Changes in the general level of interest rates may lead to an increase or decrease in the fair value of these securities/investments. The Group’s investment focus places the safety of an investment ahead of its return. The interest rate risk is mitigated due to the fact that all securities/investments can be liquidated within a maxi-mum of two years. The Group is currently not subject to significant inter-est rate risks from liabilities recorded in the balance sheet.
2.3.3 FAIR VALUE HIER ARCHY AND MEASUREMENT PROCEDURES
The IFRS 13 “Fair Value Measurement” guidelines must always be applied when, based on another IAS/IFRS guideline, measurement at fair value is required or permitted or disclosures regarding measurement at fair value are required. The fair value is the price that would be achieved on the valuation date upon the sale of an asset in an arm’s length transaction between independent market participants or the price to be paid for the transfer of a liability (disposal or exit price). Accordingly, the fair value of a liability reflects the default risk (i.e., own credit risk). Measurement at fair value requires that the sale of the asset or the transfer of the liability takes place on the principal market or, if such a principal market is not available, on the most advantageous market. The principal market is the market with the highest volume and the highest level of activity to which the company has access.
93F I N A N C I A L S TAT E M E N T S
Notes

Fair value is measured by using the same assumptions and taking into account the same characteristics of the asset or liability as would an inde-pendent market participant. Fair value is a market-based and not an enti-ty-specific measurement. For non-financial assets, fair value is deter-mined based on the highest and best use of the asset as determined by a market participant. For financial instruments, the use of bid prices for as-sets and ask prices for liabilities is permitted, but not required, if those prices most suitably reflect fair value in the respective circumstances. For simplification purposes, the use of mean rates is also permitted. Thus, IFRS 13 not only applies to financial assets, but also to all assets and lia-bilities.
MorphoSys uses the following hierarchy for determining and disclosing the fair value of financial instruments:Level 1: Quoted (unadjusted) prices in active markets for identical assets
or liabilities to which the Company has access.Level 2: Inputs other than quoted prices included within Level 1 that are
observable for the assets or liabilities, either directly (i.e., as prices) or indirectly (i.e., derived from prices).
Level 3: Inputs for the asset or liability that are not based on observable market data (that is, unobservable inputs).
The carrying amounts of financial assets and liabilities, such as cash and cash equivalents, marketable securities, accounts receivable, and accounts payable approximate their fair value due to their short-term maturities.
HIER ARCHY LEVEL 1
The fair value of financial instruments, which are traded in active mar-kets, is based upon quoted market prices as of the reporting date. A mar-ket is considered an active market if quoted prices are available from an
exchange, dealer, broker, industry group, pricing service, or a regulatory body that is easily and regularly accessible and these prices reflect cur-rent and regularly occurring market transactions at arm’s length condi-tions. For assets held by the Group, the appropriate quoted market price is the buyer’s bid price. These instruments are included in Level 1 (see also item 5.2 of these Notes*).*CROSS-REFERENCE to page 1 0 8
HIER ARCHY LEVEL 2
The fair value of financial instruments, which are not traded in active markets, can be determined using measurement procedures. In this case, fair value is estimated on the basis of the results of a valuation method that makes maximum use of market data, and relies as little as possible on entity-specific inputs. If all inputs required for measuring fair value are observable, the instrument is allocated to Level 2. If important inputs are not based on observable market data, the instrument is allocated to Level 3.
None of the financial assets and liabilities were allocated to hierarchy levels 2 or 3.
The fair value of licenses payable is determined by the effective interest method. Convertible bonds are recorded at ascribed values, which approx-imate the amount becoming due upon settlement.
There were no transfers from one fair value hierarchy level to another in 2014 and 2013.
The fair values of financial assets and liabilities and the carrying amounts presented in the consolidated balance sheet were composed as follows.
31 December 2014 (in 000’s €) NoteLoans and
ReceivablesAvailable-
for-saleOther Financial
LiabilitiesTotal Carrying
Amount Fair value
Cash and Cash Equivalents 5.1 32,238 0 0 32,238 32,238
Accounts Receivable 5.3 14,991 0 0 14,991 *
Other Receivables 5.4 157,093 0 0 157,093 157,093
Other Receivables, Net of Current Portion 5.4 50,030 0 0 50,030 50,030
Shares Available-for-sale, Net of Current Portion 5.8 0 1,727 0 1,727 *
Available-for-sale Financial Assets 5.2 0 106,039 0 106,039 106,039
Bonds, Available-for-sale 5.2 0 7,488 0 7,488 7,488
TOTAL 254,352 115,254 0 369,606 352,889
Convertible Bonds - Liability Component 7.1 0 0 (252) (252) (252)
Accounts Payable and Accrued Expenses 6.1 0 0 (17,831) (17,831) (17,831)
TOTAL 0 0 (18,083) (18,083) (18,083)
* Declaration waived in line with IFRS 7.29 (a)
94F I N A N C I A L S TAT E M E N T S
Notes

31 December 2013 (in 000’s €) NoteLoans and
ReceivablesAvailable-
for-saleOther Financial
LiabilitiesTotal Carrying
Amount Fair value
Cash and Cash Equivalents 5.1 71,874 0 0 71,874 71,874
Accounts Receivable 5.3 10,270 0 0 10,270 *
Other Receivables 5.4 119,458 0 0 119,458 119,458
Shares Available-for-sale, Net of Current Portion 5.8 0 1,727 0 1,727 *
Available-for-sale Financial Assets 5.2 0 188,360 0 188,360 188,360
Bonds, Available-for-sale 5.2 0 11,102 0 11,102 11,102
TOTAL 201,602 201,189 0 402,791 390,794
Convertible Bonds - Liability Component 7.1 0 0 (299) (299) (299)
Accounts Payable and Accrued Expenses 6.1 0 0 (17,190) (17,190) (17,190)
TOTAL 0 0 (17,489) (17,489) (17,489)
* Declaration waived in line with IFRS 7.29 (a)
2.4 IMPAIRMENTS2.4.1 NON-DERIVATIVE FINANCIAL INSTRUMENTS
A financial instrument not carried at fair value through profit or loss is assessed at each reporting date to determine whether there is objective evidence to show that it is impaired. A financial instrument is impaired if objective evidence indicates that an event has occurred after the initial recognition of the asset that could result in a loss, and if that event could have negative effects on the estimated future cash flows of that asset which can be assessed reliably.
Objective evidence that financial instruments (including equity securi-ties) are impaired can include the default or delinquency of a debtor, indi-cations that a debtor or issuer will enter insolvency, adverse changes in the payment status of borrowers or issuers in the Group, and economic conditions that correlate with defaults or the disappearance of an active market for a security. In addition, a significant or prolonged decline in an equity security’s fair value below its acquisition cost is objective evidence of impairment.
2.4.2 RECEIVABLES
The Group considers evidence of impairment of receivables both at an in-dividual and collective level. All individually significant receivables are tested specifically for impairment. All individually significant receivables found not to be specifically impaired are then collectively tested for any impairment that occurred but was not yet identified. Individually non-sig-nificant receivables are collectively tested for impairment by grouping to-gether receivables with similar risk characteristics.
In assessing collective impairment, the Group uses historical trends of default probabilities of the timing of impairment reversals and of the amount of loss incurred. These are then adjusted for management’s as-sessment as to whether current economic and credit conditions are such that the actual losses are likely to be greater or less than those suggested by the historical trends.
For a financial instrument measured at amortized cost less impairment, impairment is calculated as the difference between its carrying amount and the present value of the estimated future cash flows. Cash flows are discounted at the asset’s original effective interest rate. Losses are recog-nized in profit or loss and reflected in an allowance account against receiv-ables. Interest on the impaired asset continues to be recognized. When a subsequent event (e.g. repayment by a debtor) causes the amount of im-pairment to decrease, the impairment is reversed through profit and loss.
2.4.3 AVAILABLE -FOR- SALE FINANCIAL ASSETS
Impairment of available-for-sale financial assets is recognized by reclassi-fying the accumulated losses from the revaluation reserve in equity to profit and loss. The accumulated loss that is to be reclassified from equity to profit and loss is the difference between the acquisition cost less amor-tization and any principal repayment, and the current fair value less any impairment recognized previously in profit or loss. If, in a subsequent pe-riod, the fair value of an impaired available–for-sale financial asset in-creases and the increase can be related objectively to an event occurring after the impairment was recognized in profit or loss, then the impairment loss is reversed with the amount of the reversal recognized in profit or loss. However, any subsequent increase in the fair value of an available-for-sale financial instrument is recognized under equity in other compre-hensive income.
2.4.4 NON-FINANCIAL ASSETS
The carrying amounts of the Group’s non-financial assets, inventories and deferred tax assets are reviewed at each reporting date for any indication of impairment. The asset’s recoverable amount is estimated if such indica-tion exists. For goodwill and intangible assets that have indefinite useful lives or that are not yet available for use, the recoverable amount is esti-mated at the same time each year. Impairment is recognized if the carry-ing amount of an asset or the cash generating unit (CGU) exceeds its esti-mated recoverable amount.
95F I N A N C I A L S TAT E M E N T S
Notes

The recoverable amount of an asset or CGU is the greater of its value in use and its fair value less costs of disposal. In assessing value in use, the esti-mated future pre-tax cash flows are discounted to their present value using a pre-tax discount rate that reflects current market assessments with regard to the time value of money and the risks specific to the asset or CGU. For the purposes of impairment testing, assets that cannot be tested individually are grouped into the smallest group of assets that gen-erates cash flows from continuing use that are largely independent of the cash flows of other assets or CGUs. For the purposes of goodwill impair-ment testing, a ceiling test for the operating segment must be carried out. CGUs to which goodwill has been allocated are aggregated so that the level at which impairment testing is performed reflects the lowest level at which goodwill is monitored for internal reporting purposes. Goodwill acquired in a business combination is allocated to groups of CGUs that are expected to benefit from the synergies of the combination.
The Group’s corporate assets do not generate separate cash flows and are utilized by more than one CGU. Corporate assets are allocated to CGUs on a reasonable and consistent basis and are tested for impairment as part of the impairment testing of the CGU, to which the corporate asset was allo-cated.
Impairment losses are recognized in profit and loss. Goodwill impairment is not reversible. For all other assets, impairment recognized in prior peri-ods is assessed at each reporting date for any indications that the losses decreased or no longer exist. Impairment is reversed when there has been a change in the estimates used to determine the recoverable amount. Im-pairment loss can only be reversed to the extent that the asset’s carrying amount does not exceed the carrying amount that would have been deter-mined, net of depreciation or amortization, if no impairment had been rec-ognized.
2.5 ADDITIONAL INFORMATION2.5.1 KEY ESTIMATES AND ASSUMPTIONS
Estimates and judgments are continually evaluated and are based on his-torical experience and other factors that include expectations of future events that are believed to be realistic under the current circumstances.
The Group makes estimates and assumptions concerning the future. The resulting accounting-related estimates will, by definition, seldomly corre-spond to the actual results. The estimates and assumptions that bear a significant risk of causing material adjustments to the carrying amounts of assets and liabilities in the next financial year are addressed below.
GOODWILL
On an annual basis, the Group tests whether goodwill is subject to impair-ment in accordance with the accounting policies discussed in item 2.4.4*. The recoverable amounts of cash generating units have been determined on the basis of value-in-use calculations. These calculations require the use of estimates (see also item 5.7.5 of the Notes*).*CROSS-REFERENCE to page 9 5 and page 1 1 2
A sensitivity analysis was performed for the technology development activities within the Partnered Discovery segment, which form the cash-generating unit and also comprise the goodwill from the acquisition of Sloning BioTechnology GmbH. A 30 % increase in the weighted average cost of capital (WACC) or a 30 % decrease in future cash flows would not result in impairment of the cash-generating unit.
INCOME TA XES
The Group is subject to income taxes in numerous tax jurisdictions. Key assumptions are required in determining the Group’s provision for in-come taxes. There are many transactions and calculations which are un-certain with respect to the calculation of the ultimate tax burden.
As of 31 December 2014, deferred tax assets on tax loss carryforwards in the amount of € 1.8 million were recognized as a result of positive busi-ness expectations at Sloning BioTechnology GmbH for financial years 2015 to 2019. In previous years, no deferred tax assets were reported for corpo-rate tax loss carryforwards in the amount of € 2.4 million and trade tax loss carryforwards in the amount of € 2.3 million as the usability of these tax loss carry forwards was deemed uncertain with regard to German tax legislation (Sec. 8 Para. 4, of the German Corporation Tax Act (KStG former version) and Sec. 8c KStG). In the event that a portion of the total tax loss carryforwards had not been utilizable due to a tax audit, the Group would be required to pay higher income taxes for future periods at an earlier point in time since the tax loss carryforwards would be consumed sooner than expected. The definitive nature of the tax loss carryforwards in ques-tion was confirmed in the context of a tax audit completed by the time the consolidated financial statements had been prepared. Therefore, deferred tax assets were recognized in the full amount of existing tax loss carryfor-wards.
As of 31 December 2014, deferred tax assets on tax loss carryforwards in the amount of € 1.2 million were recognized as a result of positive busi-ness expectations at MorphoSys AG for financial years 2015 to 2019.
2.5.2 CAPITAL MANAGEMENT
With regard to capital management, the Management Board’s policy is to preserve a strong and sustainable capital base in order to maintain the confidence of investors, business partners, and the market and to support future business development. As of 31 December 2014, the equity ratio amounted to 81.8 % (31 December 2013: 78.6 %; see also the following over-view). Presently, the Group is not carrying financial debt.
Pursuant to the respective incentive plans resolved by the Annual General Meeting, the Management Board and employees may participate in the Group’s performance through long-term performance-related remunera-tion components consisting of convertible bonds. MorphoSys also estab-lished long-term incentive programs (LTI plan) in the years 2011, 2012, 2013, and 2014. These programs are based on the performance-related is-suance of shares, so called “performance shares”, which are granted when certain predefined success criteria have been achieved (for more informa-tion, please refer to item 7.3 of the Notes*). There were no changes in the Group’s approach to capital management in the course of the year.*CROSS-REFERENCE to page 1 1 6
in 000’ € 12/31/2014 12/31/2013
Stockholders’ Equity 348,803 352,145
In % of Total Capital 81.8 % 78.6 %
Debt 77,675 95,511
In % of Total Capital 18.2 % 21.4 %
TOTAL CAPITAL 426,478 447,657
96F I N A N C I A L S TAT E M E N T S
Notes

2.6 USE OF INTEREST RATES FOR VALUATION The Group uses interest rates to measure fair values. When calculating stock-based compensation, MorphoSys uses the interest rates of German government bonds with maturities of five or seven years on the date they were granted to determine the fair value of convertible bonds.
2.7 ACCOUNTING POLICIES APPLIED TO LINE ITEMS OF THE INCOME STATEMENT
2.7.1 REVENUES AND REVENUE RECOGNITION
The Group’s revenues include license fees and milestone payments, ser-vice fees and revenues from the sale of goods. Pursuant to IAS 18.9, reve-nues are measured at the fair value of the consideration received or receiv-able. In accordance with IAS 18.20b, revenues are only recognized to the extent that it is sufficiently probable that the Company will receive the economic benefits associated with the transaction.
LICENSE FEES AND MILESTONE PAYMENTS
Revenues related to non-refundable fees for providing access to technolo-gies, fees for the use of technologies, and license fees are recognized on a straight line basis over the period of the agreement unless a more appro-priate method of revenue recognition is available. The period of the agree-ment usually corresponds to the contractually agreed term of the research project, or in the case of contracts without an agreed project term, it cor-relates to the expected term of the collaboration. If all IAS 18.14 criteria are met, revenue is recognized immediately and in full. Revenues from milestone payments are recognized upon achievement of certain contrac-tual criteria.
SERVICE FEES
Service fees in the context of research and development collaborations are recognized in the period in which the services are provided.
If it is probable that discounts will be granted and that their amount can be reliably determined, then the discount is recognized as a reduction in revenue at the time of the revenue recognition. The timing of the transfer of risks and rewards varies depending upon the individual terms of the sales contract. In accordance with IAS 18.21 and 18.25, revenue from mul-tiple-element transactions is recognized by allocating the total consider-ation among the separately identifiable components based on their re-spective fair values and by applying IAS 18.20. The applicable revenue recognition criteria are assessed separately for each component.
Deferred revenues consist of payments received from customers which may not yet be recognized as revenue since the related services specified in the contract have not yet been rendered.
2.7.2 OPER ATING EXPENSES
PERSONNEL EXPENSES RESULTING FROM STOCK OPTIONS
The Group applies the provisions of IFRS 2 “Share-based Payment”. IFRS 2 requires the Group to recognize share-based payments at their fair value on the valuation date as a compensation expense for the period that the beneficiary renders the services related to the granting of the share-based payments.
RESEARCH AND DEVELOPMENT
Research costs are expensed in the period in which they occurred. Gener-ally, development costs are expensed as incurred in accordance with IAS 38.5 and IAS 38.11 to 38.23. Development costs are recognized as an intangible asset when the criteria of IAS 38.21 (probability of expected future economic benefits, reliability of cost measurement) are met, and if the Group can provide evidence pursuant to IAS 38.57.
GENER AL AND ADMINISTR ATIVE
This line item includes personnel expenses, consumables, operating costs, amortization of intangible assets, expenses for external services, infra-structure costs, and depreciation.
OPER ATING LEASE PAYMENTS
Payments made under operating leases are recognized in the income statement on a straight-line basis over the term of the lease. According to SIC-15, all incentive agreements in the context of operating leases are rec-ognized as an integral part of the net consideration agreed for the use of the leased asset. The total amount of income resulting from incentives is recognized as a reduction in lease expenses on a straight-line basis over the term of the rental.
All lease agreements in the Group are to be classified exclusively as oper-ating leases. The Group did not engage in any finance lease arrangements in which the Group, as lessee, capitalized the assets at the start of the lease with the lower of fair value or the net present value of the mini-mum-lease payments and then depreciated the assets on a straight-line basis over its economic life.
2.7.3 OTHER INCOME
GOVERNMENT GR ANTS
Grants received from governmental agencies for the support of specific research and development projects are recognized in the income state-ment in the separate line item “other income” to the extent that the related expenses have already occurred. Under the terms of the grants, govern-mental agencies generally have the right to audit the use of the funds granted to the Group.
Basically, government grants are cost subsidies for which recognition through profit and loss is limited to the corresponding costs. In financial year 2014, there were no payments granted that were required to be clas-sified as investment subsidies.
2.7.4 OTHER EXPENSES
The line item “other expenses” comprises mainly currency losses from the operating business.
2.7.5 FINANCE INCOME
Interest income is recognized in the income statement as it occurs and takes into account the effective rate of interest for the asset.
2.7.6 FINANCE EXPENSES
Borrowing costs are expensed in the period they occur and are included in finance expenses in the income statement.
97F I N A N C I A L S TAT E M E N T S
Notes

2.7.7 INCOME TA X EXPENSES/INCOME
Income taxes comprise current and deferred taxes. Income taxes are rec-ognized in the income statement unless the income taxes relate to items recognized directly in equity or other comprehensive income.
Current taxes are the expected taxes payable on the taxable income for the year, using the prevailing tax rates or those adopted on the reporting date, as well as any adjustments to taxes payable with respect to previous years.
The calculation of deferred taxes is based on the balance sheet liability method and results in temporary differences between the carrying amounts of assets and liabilities and the amounts used for taxation pur-poses. Deferred taxes are calculated depending on the realization method expected for the carrying amount of assets and the repayment of liabili-ties. The calculation is also based on the prevailing tax rates or those ad-opted on the reporting date.
Deferred tax assets and liabilities are offset if there is a legally enforceable right to offset current tax liabilities and assets, and if they relate to income taxes imposed by the same tax authority on the same taxable entity, or on different tax entities that intend to settle current tax assets and liabilities on a net basis, or when their tax assets and liabilities are to be realized simultaneously.
Deferred tax assets are only recognized to the extent that it is likely that future taxable income will be available against which the asset can be utilized. Deferred tax assets are reduced to the extent that it is no longer probable that the related tax benefit will be realized.
2.7.8 EARNINGS/LOSS PER SHARE
The Group reports basic and diluted earnings per share. Basic earnings per share is computed by dividing the net profit or loss attributable to parent company shareholders by the weighted average number of ordi-nary shares outstanding during the reporting period. Diluted earnings per share is calculated in the same manner however, the net profit or loss attributable to parent company shareholders and the weighted average number of ordinary shares outstanding are adjusted for any dilutive ef-fects resulting from convertible bonds or stock options granted to the Management Board and employees.
2.8 ACCOUNTING POLICIES APPLIED TO THE ASSETS OF THE BALANCE SHEET
2.8.1 CASH AND CASH EQUIVALENTS
LIQUID ASSETS
The Group considers all cash at banks and on hand, as well as short-term deposits with an original maturity of three months or less, to be cash or cash equivalents. The Group invests most of its cash and cash equiva-lents in deposits at several major financial institutions: Commerzbank, HypoVereinsbank, Bayern LB, Sparkasse, LBBW, Svenska Handelsbanken, BNP Paribas, and Deutsche Bank.
The Group recognizes cash and cash equivalents at nominal value. Securi-ties are recognized and measured at fair value. Any fluctuations in the fair value of securities primarily composed of money market funds are di-rectly recognized in equity. Permanent impairment, however, is recog-nized in profit and loss.
NON - DERIVATIVE FINANCIAL INSTRUMENTS
Depending upon their classification, existing financial instruments are either measured at amortized cost (category “loans and receivables”) or at fair value (category “available-for-sale financial assets”). The amortized cost of current receivables and current liabilities generally corresponds to either the nominal amount or the repayment amount.
All non-derivative financial instruments are initially recognized at fair value, which is defined as the fair value of the consideration provided net of transaction costs.
The Group applies IAS 39 for financial instruments in the form of debt and equity instruments. At the time of purchase, the Management Board de-termines the classification of the financial instrument and reviews the classification at each reporting date. The classification depends on the pur-pose for which the financial instruments were acquired. On 31 December 2014 and on 31 December 2013, some financial instruments held by the Group were classified as “available-for-sale”. These financial instruments are recognized or derecognized as of the date on which the Group commits to the purchase or sale of the financial instruments. Following their initial recognition, available-for-sale financial assets are measured at fair value and any resulting gain or loss is reported directly in the revaluation re-serve within equity until the financial instruments are sold, redeemed, or otherwise disposed of, or considered impaired, at which time the accumu-lated loss is reported in profit and loss.
Guarantees granted for rent deposits, which have been collateralized with available-for-sale securities and obligations from convertible bonds issued to employees are recorded under other assets as restricted cash, since they are not available for use in the Group’s operations.
In November 2012, MorphoSys acquired an interest in Lanthio Pharma B.V., a privately held company headquartered in Groningen, the Nether-lands. A contribution was also made to this company in September 2013. On 31 December 2014, the Group’s share in Lanthio Pharma B.V.’s share capital continued to amount to 19.98 %. No significant influence exists as defined by IAS 28. The investment is measured at amortized cost since it constitutes an equity instrument for which no quoted price is observable in an active market and whose fair value cannot reliably be assessed. The financial instrument is reported in the category “available-for-sale”.
DERIVATIVE FINANCIAL INSTRUMENTS
The Group uses derivative financial instruments to hedge its exposure to foreign exchange rate risk. In accordance with IAS 39.9, all derivative fi-nancial instruments are held exclusively for trading and are initially rec-ognized at fair value. Subsequent to their initial recognition, derivative financial instruments are measured at fair value, which is defined as their quoted market price on the reporting date. Any resulting gain or loss from derivatives is recognized in profit and loss because the Group currently does not apply hedge accounting. According to the Group’s foreign cur-rency hedging policy, the Group only hedges highly probable future cash flows and clearly identifiable receivables that can be collected within a twentyfour-month period.
The use of derivative financial instruments is subject to a Group policy representing a guideline set out in writing for dealing with derivative financial instruments and approved by the Management Board. Any changes in the fair value of derivative financial instruments are docu-mented.
98F I N A N C I A L S TAT E M E N T S
Notes

2.8.2 ACCOUNTS RECEIVABLE , INCOME TA X RECEIVABLES, AND OTHER
RECEIVABLES
Accounts receivable are measured at amortized cost less any impairment, for example, allowances for doubtful accounts (see items 2.4.2 and 5.3 of the Notes*).*CROSS-REFERENCE to page 9 5 and page 1 0 9
Income tax receivables mainly include receivables due from tax authori-ties in the context of capital gain taxes withheld.
Other non-derivative financial instruments are measured at amortized cost using the effective interest method less any impairment. In 2014, investments were carried out in various financial assets which were allo-cated to the category “loans and receivables” pursuant to IAS 39 “Finan-cial Instruments”.
2.8.3 INVENTORIES
Inventories are measured at the lower value of production or acquisition costs and net realizable value pursuant to the FIFO method. The acquisi-tion costs comprise all costs of purchase and all costs incurred in bringing the inventories into operating condition, while taking into account reduc-tions in the purchase price, such as bonuses and discounts. Net realizable value is the estimated selling price less the estimated expenses necessary for completion and sale. Inventories may be classified as raw materials and supplies.
2.8.4 PREPAID EXPENSES AND OTHER CURRENT ASSETS
Prepaid expenses include expenses that resulted in an outflow of cash prior to the reporting date, but which will only be recognized as expenses in the subsequent financial year. Such expenses mainly relate to mainte-nance contracts, sublicenses, and prepayments for external laboratory services not yet performed. Other current assets primarily comprise re-ceivables from the tax authorities as a result of value-added taxes. This item is recognized at nominal value.
2.8.5 PROPERT Y, PLANT, AND EQUIPMENT
Property, plant, and equipment is recorded at historical cost less accumu-lated depreciation (see also item 5.6 of the Notes*) and any impairment (see item 2.4.4 of the Notes*). Historical cost includes expenditure directly related to the purchase at the time of the acquisition. Replacements, build-ing alterations, and improvements are capitalized, while repair and main-tenance expenses are charged to expenses as they are incurred. Property, plant, and equipment is depreciated over its useful life on a straight-line basis (see table below). Leasehold improvements are depreciated over the estimated useful lives of the assets on a straight-line basis.*CROSS-REFERENCE to page 1 1 0 and page 9 5
Asset Class Useful LifeDepreciation
Rates
Computer Hardware 3 years 33 %
Low-value Laboratory and Office Equipment below € 150 Immediately 100 %
Low-value Laboratory and Office Equipment between € 150 and € 1,000 5 years 20 %
Permanent Improvements to Property/Buildings 10 years 10 %
Office Equipment 8 years 13 %
Laboratory Equipment 4 years 25 %
An asset’s residual value and useful life are reviewed at the end of each reporting period, and adjusted if appropriate.
Borrowing costs that can be directly attributed to the acquisition, con-struction, or production of a qualifying asset, are not included in the ac-quisition or production cost since the Group finances the entire operating business through the use of equity.
2.8.6 INTANGIBLE ASSETS
Purchased intangible assets are capitalized at acquisition cost and intan-gible assets are exclusively amortized over their useful lives on a straight-line basis. Internally generated intangible assets are recognized to the extent that the recognition criteria set out in IAS 38 are met.
Development costs are capitalized as intangible assets provided that the capitalization criteria described in IAS 38 have been met, namely, clear specification of the product or procedure, technical feasibility, intention of completion, use, commercialization, coverage of development costs through future free cash flows, reliable determination of these free cash flows, availability of sufficient resources for completion of development and sale. Amortization is recorded in research and development expenses.
Expenses to be classified as research expenses are allocated to research and development expenses as defined by IAS 38.
Subsequent expenditures for capitalized intangible assets are only capi-talized when they substantially increase the future economic benefits em-bodied in the specific asset to which they relate. All other expenditures are expensed as incurred.
PATENTS
Patents obtained by the Group are recorded at acquisition cost, less accu-mulated amortization (see below), and any impairment (see item 2.4.4 of the Notes*). Patent costs are amortized on a straight-line basis over the lower of the estimated useful life of the patent (ten years) and the remain-ing patent term. Amortization commences when the patent is issued. Tech-nology identified in the purchase price allocation in the acquisition of Sloning BioTechnology GmbH is recorded at fair value at the time of acqui-sition, less accumulated amortization (useful life of ten years).*CROSS-REFERENCE to page 9 5 and page 9 5
99F I N A N C I A L S TAT E M E N T S
Notes

LICENSE RIGHTS
The Group has acquired license rights from third parties by making up-front license payments, paying annual fees to maintain the license, and paying fees for sub-licenses. The Group amortizes upfront license pay-ments on a straight-line basis over the estimated useful life of the ac-quired license (eight to ten years). The amortization period and the amor-tization method are reviewed at the end of each financial year pursuant to IAS 38.104. Annual fees to maintain the license are amortized over the term of each annual agreement. Sub-license fees are amortized on a straight-line basis over the term of the contract or the estimated useful life of the collaboration for those contracts without a stipulated term.
IN - LICENSED REASEARCH PROGR AMS
This line item contains capitalized upfront payments from the in-licensing of two compounds for the Proprietary Development segment as well as a milestone payment for one of these compounds which was paid at a later time. The assets are recorded at acquisition cost and are not yet available for use and therefore not subject to amortization. The assets were tested for impairment on the reporting date as required by IAS 36.
SOF T WARE
Software is recorded at acquisition cost less accumulated amortization (see below) and any impairment (see item 2.4.4 of the Notes*). Amortiza-tion is recognized in profit and loss on a straight-line basis over the esti-mated useful life of three to five years. Software is amortized from the date the software is operational.*CROSS-REFERENCE to page 9 5
GOODWILL
The goodwill recognized is attributable to expected synergies and to the skills of the acquired workforce. Goodwill is tested annually for impair-ment as required by IAS 36 (see also item 5.7.5 of the Notes*).*CROSS-REFERENCE to page 1 1 2
Intangible Asset Class Useful LifeAmortisation
Rates
Patents 10 years 10 %
License Rights 8 (10) years 13 % (10) %
Inlicensed Research Programs Not yet amortized –
Software 3 (5) years 33 % (20) %
Know How and Customer List 6 (10) years 17 % (10) %
Goodwill Impairment –
2.8.7 SHARES AVAILABLE -FOR- SALE
The interest in Dutch Lanthio Pharma B.V. is recognized at amortized cost. The financial instrument is recorded in the category “available-for-sale”.
2.8.8 PREPAID EXPENSES AND OTHER NON- CURRENT ASSETS
The non-current portion of expenses occurring prior to the reporting date but to be recognized in subsequent financial years is also recorded under prepaid expenses. This line item contains maintenance contracts and sub-licenses.
This line item also includes other non-current assets which are recognized at fair value. Other non-current assets comprise mainly restricted cash, such as rent deposits.
2.9 ACCOUNTING POLICIES APPLIED TO EQUITY AND LIABILITY ITEMS OF THE BALANCE SHEET
2.9.1 ACCOUNTS PAYABLE , OTHER LIABILITIES, AND PROVISIONS
Trade payables and other liabilities are recognized at amortized cost. Lia-bilities with a term above one year are discounted to their net present value. Liabilities of uncertain timing or amount are recorded as provi-sions.
IAS 37 requires the recognition of provisions for obligations to third par-ties arising from past events. Furthermore, provisions are only recognized for legal or factual obligations to third parties if the occurrence of the event is more likely than not. Provisions are recognized at the amount re-quired to settle the respective obligation and discounted to the reporting date if the interest effect is material. The amount required to meet the obligation also includes expected price and cost increases. The interest portion of the added provisions is recorded in the finance result. The measurement of provisions is based on past experience and considers the circumstances in existence on the reporting date.
2.9.2 TA X LIABILITIES
Tax liabilities are recognized and measured at their nominal value. Tax liabilities contain obligations from current taxes, excluding deferred taxes. Accruals for trade taxes, corporate taxes, and similar taxes on in-come are determined based on the taxable income of the consolidated com-panies less any prepayments made.
2.9.3 CURRENT PORTION OF DEFERRED REVENUE
Upfront payments from customers for services to be rendered by the Group are recognized as deferred revenue in accordance with IAS 18.13 and measured at the lower of fair value or nominal value. The correspond-ing rendering of services and revenue recognition occurs within the twelve month period following the reporting date.
2.9.4 DEFERRED REVENUE AND PROVISIONS, NET OF CURRENT
PORTION
This line item includes the non-current portion of deferred upfront pay-ments from customers in accordance with IAS 18.13 which are measured at the lower of fair value or nominal value. Due to its low level of material-ity, this line item is not discounted to its present value in the financial year despite its long-term maturity.
2.9.5 CONVERTIBLE BONDS DUE TO RELATED PARTIES
The Group issued convertible bonds to the Management Board and to em-ployees of the Group. In accordance with IAS 32.28, the equity component of a convertible bond must be recorded separately under additional paid-in capital. The equity component is determined by deducting the separately determined amount of the liability component from the fair value of the convertible bond. Any impact arising from the equity component is recog-nized in profit and loss in personnel expenses resulting from share-based payments, whereas any impact on profit and loss arising from the liability component is recognized as interest expense. The Group applies the provi-sions of IFRS 2 “Share-based Payments” for all convertible bonds granted to the Management Board and the Group’s employees.
100F I N A N C I A L S TAT E M E N T S
Notes

2.9.6 DEFERRED TA X LIABILITIES
The recognition and measurement of deferred taxes are based on the pro-visions of IAS 12. Deferred tax assets and liabilities are calculated using the liability method, which is common practice internationally. Under this method, the taxes expected to be paid or recovered in subsequent finan-cial years are based on the applicable tax rate at the time of recognition.
Deferred tax assets and liabilities are recorded separately in the balance sheet. Deferred tax liabilities take into account the future tax effects of temporary differences between the valuation of assets and liabilities in the balance sheet and tax loss carryforwards.
Deferred tax assets are offset against deferred tax liabilities if the taxes are levied by the same taxation authority and have matching terms. Pur-suant to IAS 12, deferred tax assets and liabilities may not be discounted.
2.9.7 STOCKHOLDERS’ EQUIT Y
COMMON STOCK
Ordinary shares are classified as stockholders’ equity. Incremental costs directly attributable to the issuance of ordinary shares and stock options are recognized as a deduction from equity, net of any tax effects. When common stock that was recorded as stockholders’ equity is repurchased, the amount of consideration paid, including directly attributable costs, is recognized as a deduction from stockholders’ equity net of taxes and is classified as treasury shares. When treasury shares are subsequently sold or reissued, the proceeds are recognized as an increase in stockholders’ equity, and the profit or loss resulting from the transaction is offset against accumulated income.
TREASURY STOCK
Repurchases of own shares at the price quoted on an exchange or at mar-ket value are recorded in this line item.
ADDITIONAL PAID - IN CAPITAL
Additional paid-in capital mainly includes personnel expenses resulting from the grant of stock options, convertible bonds, and performance shares, and the proceeds from newly created shares in excess of their nominal value.
REVALUATION RESERVE
The revaluation reserve mainly consists of unrealized gains and losses on available-for-sale securities that are measured directly in equity until they are sold.
TR ANSL ATION RESERVE
The translation reserve comprises all foreign exchange differences which are not recognized in profit and loss.
ACCUMUL ATED INCOME
The “accumulated income” line item comprises the Group’s accumulated consolidated net profits/losses. A separate measurement of this item is not conducted.
3 Segment Reporting
MorphoSys Group applies IFRS 8 “Segment Reporting”. An operating seg-ment is defined as a component of an entity that engages in business activ-ities from which it may earn revenues and incur expenses and whose op-erating results are regularly reviewed by the entity’s chief operating decision maker and for which discrete financial information is available.
Segment information is presented with respect to the Group’s operating segments. The operating segments are based on the Group’s management and internal reporting structures. The segment results and segment as-sets include items that can be either directly attributed to the individual segment or can be allocated to the segments on a reasonable basis. Inter-company pricing is determined on an arm’s length basis.
The Management Board determines the economic success of the segments based on key figures chosen so that all income and expenses are included. The operating earnings before interest and taxes, or EBIT, is the key benchmark for measuring and evaluating the operating results. The EBIT margin reflects the ratio of EBIT to revenues.
The Group consists of the following operating segments.
3.1 PROPRIETARY DEVELOPMENTThis segment comprises all of the activities relating to the proprietary development of therapeutic antibodies. Presently, the activities of this seg-ment comprise the clinical development of the proprietary program MOR208, the co-development of MOR202 with Celgene, and the comple-tion of the clinical development of the MOR103 program under the cooper-ation with GSK. MorphoSys is also pursuing further programs at an early stage in proprietary development or as co-development.
3.2 PARTNERED DISCOVERYMorphoSys possesses one of the leading technologies for the generation of therapeutics based on human antibodies. The Group markets this technol-ogy commercially via partnerships with numerous pharmaceutical and biotechnology companies. This segment encompasses all operational ac-tivities relating to these commercial agreements, as well as the majority of the technological development.
3.3 ABD SEROTECUpon sale of substantially all of the AbD Serotec business on 10 January 2013 to Bio-Rad, the quantitative and qualitative criteria of IFRS 8.12 f. were no longer fulfilled so that this segment was no longer a reportable segment under IFRS 8.11. Therefore, the results generated by the AbD Se-rotec segment until 10 January 2013, which were immaterial, were reclas-sified to “Unallocated”.
3.4 CROSS-SEGMENT DISCLOSURESWith cross-segment disclosures, segment revenues are based on the customers’ geographical locations. The information on segment assets is based on the respective location of the assets.
101F I N A N C I A L S TAT E M E N T S
Notes

The segment result is defined as segment revenues less the segment’s op-erating expenses. In financial year 2014, impairments totaling € 4.1 mil-lion were recognized. Of this amount, € 2.1 million was attributable to the Proprietary Development segment and € 2.0 million to the Partnered Dis-covery segment (2013: impairment of € 1.0 million in the Proprietary Development segment and of € 0.6 million in the Partnered Discovery seg-ment).
The Group’s key customers are assigned to the Partnered Discovery seg-ment as well as the Proprietary Development segment. As of 31 December 2014, the most important single customer accounted for a carrying amount of € 9.3 million of total accounts receivable (31 December 2013: € 8.2 mil-lion). Three individual customers of the Group who are predominantly as-signed to the Partnered Discovery segment, contributed € 43.2 million, € 13.5 million, and € 2.0 million to total revenues in 2014. In 2013, three customers mainly assigned to the Partnered Discovery segment accounted for € 41.6 million, € 21.3 million, and € 6.0 million of the Group’s total revenues.
In 2014, “unallocated” other operating expenses primarily included per-sonnel expenses (2014: € 8.7 million; 2013: € 9.2 million), costs for exter-nal services (2014: € 2.5 million; 2013: € 3.0 million), and costs for infrastructure (2014: € 0.8 million; 2013: € 1.2 million). Current assets categorized as “unallocated” mainly composed of cash and cash equiva-lents, securities and bonds available-for-sale, as well as other receivables (31 December 2014: € 287.3 million; 31 December 2013: € 377.5 million). Non-current assets categorized as “unallocated” mainly comprised long-term investments of financial assets of € 50.0 million (31 December 2013: € 0.0 million). Current liabilities categorized as “unallocated” included mainly accounts payable and accrued expenses (31 December 2014: € 4.0 million; 31 December 2013: € 5.4 million) as well as provisions (31 December 2014: € 0.8 million; 31 December 2013: € 2.9 million).
Proprietary Development Partnered Discovery Unallocated Elimination Groupthereof from
Discontinued Operationsthereof from
Continuing Operations
For the Twelve-month Period Ended 31 December(in 000’s €)
2014 2013 2014 2013 2014 2013 2014 2013 2014 2013 2014 2013 2014 2013
External Revenues 15,041 26,909 48,937 51,044 0 610 0 0 63,978 78,563 0 603 63,978 77,960
Intersegment Revenues 0 0 0 0 0 0 0 0 0 0 0 0 0 0
REVENUES, TOTAL 15,041 26,909 48,937 51,044 0 610 0 0 63,978 78,563 0 603 63,978 77,960Cost of Goods Sold 0 0 0 0 0 158 0 0 0 158 0 158 0 0
Other Operating Expenses 33,535 27,500 23,041 25,537 13,533 16,992 0 0 70,109 70,029 0 2,107 70,109 67,922
Inter-segment Costs 0 0 0 0 0 0 0 0 0 0 0 0 0 0
TOTAL OPER ATING EXPENSES 33,535 27,500 23,041 25,537 13,533 17,150 0 0 70,109 70,187 0 2,265 70,109 67,922Other Income 105 129 22 80 655 600 0 0 782 809 0 12 782 797
Other Expenses 0 0 0 227 550 686 0 0 550 913 0 2 550 911
SEGMENT EBIT (18,389) (462) 25,918 25,360 (13,428) (16,626) 0 0 (5,899) 8,272 0 (1,652) (5,899) 9,924Finance Income 0 0 0 0 1,810 867 0 0 1,810 867 0 0 1,810 867
Finance Expenses 0 0 0 0 220 115 0 0 220 115 0 5 220 110
Other Income from Sale of Assets and Liabilities of Disposal Group Classified as Held for Sale 0 0 0 0 0 8,001 0 0 0 8,001 0 8,001 0 0
PROFIT BEFORE TA XES (18,389) (462) 25,918 25,360 (11,838) (7,873) 0 0 (4,309) 17,025 0 6,344 (4,309) 10,681Income Tax (Expenses)/Income 0 0 0 0 1,296 (3,345) 0 0 1,296 (3,345) 0 (35) 1,296 (3,310)
Income Tax Expenses in connection with the Sale of Assets and Liabilities of the Disposal Group Classified as Held for Sale 0 0 0 0 0 (358) 0 0 0 (358) 0 (358) 0 0
NET PROFIT/(LOSS) (18,389) (462) 25,918 25,360 (10,542) (11,576) 0 0 (3,013) 13,322 0 5,951 (3,013) 7,371Current Assets 6,200 2,783 25,887 24,036 290,308 379,749 0 0 322,395 406,568 0 0 322,395 406,568
Non-current Assets 30,079 15,601 17,347 19,807 56,657 5,681 0 0 104,083 41,089 0 0 104,083 41,089
TOTAL SEGMENT ASSETS 36,279 18,384 43,234 43,843 346,965 385,430 0 0 426,478 447,657 0 0 426,478 447,657Current Liabilities 25,343 23,436 2,558 3,681 4,802 8,290 0 0 32,703 35,407 0 0 32,703 35,407
Non-current Liabilities 40,414 53,885 4,263 5,283 295 936 0 0 44,972 60,104 0 0 44,972 60,104
Stockholders’ Equity 0 0 0 0 348,803 352,146 0 0 348,803 352,146 0 0 348,803 352,146
TOTAL SEGMENT LIABILITIES AND EQUIT Y 65,757 77,321 6,821 8,964 353,900 361,372 0 0 426,478 447,657 0 0 426,478 447,657Capital Expenditure 17,335 3,150 2,512 1,883 631 530 0 0 20,478 5,563 0 6 20,478 5,557
Depreciation and Amortization 1,149 1,010 2,621 3,291 364 534 0 0 4,134 4,835 0 22 4,134 4,813
102F I N A N C I A L S TAT E M E N T S
Notes

The following overview shows the regional distribution of the Group’s revenues.
in 000’ € 2014 2013
Germany 733 4
Europe and Asia 44,628 69,140
USA and Canada 18,617 8,816
Total from Continuing Operations 63,978 77,960
Total from Discontinued Operations 0 603
TOTAL 63,978 78,563
All non-current Group assets in the amount of € 102.3 million (31 Decem-ber 2013: € 40.8 million), excluding deferred tax assets, are located in Germany. The Group’s investments in the amount of € 20.5 million (31 December 2013: € 5.6 million) were all made in Germany.
4 Notes to the Income Statement
4.1 REVENUESIn 2014, revenues from continuing operations included license fees and milestone payments totaling € 43.5 million (2013: € 57.8 million). The Proprietary Development segment contributed revenues of € 14.4 million (2013: € 26.4 million), and the Partnered Discovery segment contributed revenues of € 29.1 million (2013: € 31.4 million).
Of the service fees totaling € 20.5 million (2013: € 20.2 million), an amount of € 0.6 million (2013: € 0.5 million) was attributable to the Proprietary Development segment and an amount of € 19.9 million (2013: € 19.6 mil-lion) was attributable to the Partnered Discovery segment.
Proprietary Development Partnered Discovery Unallocated Elimination Groupthereof from
Discontinued Operationsthereof from
Continuing Operations
For the Twelve-month Period Ended 31 December(in 000’s €)
2014 2013 2014 2013 2014 2013 2014 2013 2014 2013 2014 2013 2014 2013
External Revenues 15,041 26,909 48,937 51,044 0 610 0 0 63,978 78,563 0 603 63,978 77,960
Intersegment Revenues 0 0 0 0 0 0 0 0 0 0 0 0 0 0
REVENUES, TOTAL 15,041 26,909 48,937 51,044 0 610 0 0 63,978 78,563 0 603 63,978 77,960Cost of Goods Sold 0 0 0 0 0 158 0 0 0 158 0 158 0 0
Other Operating Expenses 33,535 27,500 23,041 25,537 13,533 16,992 0 0 70,109 70,029 0 2,107 70,109 67,922
Inter-segment Costs 0 0 0 0 0 0 0 0 0 0 0 0 0 0
TOTAL OPER ATING EXPENSES 33,535 27,500 23,041 25,537 13,533 17,150 0 0 70,109 70,187 0 2,265 70,109 67,922Other Income 105 129 22 80 655 600 0 0 782 809 0 12 782 797
Other Expenses 0 0 0 227 550 686 0 0 550 913 0 2 550 911
SEGMENT EBIT (18,389) (462) 25,918 25,360 (13,428) (16,626) 0 0 (5,899) 8,272 0 (1,652) (5,899) 9,924Finance Income 0 0 0 0 1,810 867 0 0 1,810 867 0 0 1,810 867
Finance Expenses 0 0 0 0 220 115 0 0 220 115 0 5 220 110
Other Income from Sale of Assets and Liabilities of Disposal Group Classified as Held for Sale 0 0 0 0 0 8,001 0 0 0 8,001 0 8,001 0 0
PROFIT BEFORE TA XES (18,389) (462) 25,918 25,360 (11,838) (7,873) 0 0 (4,309) 17,025 0 6,344 (4,309) 10,681Income Tax (Expenses)/Income 0 0 0 0 1,296 (3,345) 0 0 1,296 (3,345) 0 (35) 1,296 (3,310)
Income Tax Expenses in connection with the Sale of Assets and Liabilities of the Disposal Group Classified as Held for Sale 0 0 0 0 0 (358) 0 0 0 (358) 0 (358) 0 0
NET PROFIT/(LOSS) (18,389) (462) 25,918 25,360 (10,542) (11,576) 0 0 (3,013) 13,322 0 5,951 (3,013) 7,371Current Assets 6,200 2,783 25,887 24,036 290,308 379,749 0 0 322,395 406,568 0 0 322,395 406,568
Non-current Assets 30,079 15,601 17,347 19,807 56,657 5,681 0 0 104,083 41,089 0 0 104,083 41,089
TOTAL SEGMENT ASSETS 36,279 18,384 43,234 43,843 346,965 385,430 0 0 426,478 447,657 0 0 426,478 447,657Current Liabilities 25,343 23,436 2,558 3,681 4,802 8,290 0 0 32,703 35,407 0 0 32,703 35,407
Non-current Liabilities 40,414 53,885 4,263 5,283 295 936 0 0 44,972 60,104 0 0 44,972 60,104
Stockholders’ Equity 0 0 0 0 348,803 352,146 0 0 348,803 352,146 0 0 348,803 352,146
TOTAL SEGMENT LIABILITIES AND EQUIT Y 65,757 77,321 6,821 8,964 353,900 361,372 0 0 426,478 447,657 0 0 426,478 447,657Capital Expenditure 17,335 3,150 2,512 1,883 631 530 0 0 20,478 5,563 0 6 20,478 5,557
Depreciation and Amortization 1,149 1,010 2,621 3,291 364 534 0 0 4,134 4,835 0 22 4,134 4,813
103F I N A N C I A L S TAT E M E N T S
Notes

4.2 OPERATING EXPENSES4.2.1 RESEARCH AND DEVELOPMENT EXPENSES
Research and development expenses include the following items.
in 000’ € 2014 2013
Personnel Expenses 21,048 21,218
Consumable Supplies 2,327 2,157
Other Operating Expenses 2,863 2,312
Amortization and Other Costs of Intangible Assets 8,050 5,070
External Services 17,549 14,137
Depreciation and Other Costs for Infrastructure 4,126 4,258
Total from Continuing Operations 55,963 49,152
Total from Discontinued Operations 0 6
TOTAL 55,963 49,158
in million € 2014 2013 2012 2011 2010
R&D Expenses on behalf of Partners 19.5 17.5 16.0 19.1 18.9
Proprietary Development Expenses 33.6 27.5 18.1 33.9 25.9
Technology Development Expenses 2.9 4.2 3.6 2.9 2.1
R&D TOTAL 56.0 49.2 37.7 55.9 46.9
4.2.2 GENER AL AND ADMINISTR ATIVE EXPENSES
General and administrative expenses include the following items.
in 000’ € 2014 2013
Personnel Expenses 9,612 11,282
Consumable Supplies 77 29
Other Operating Expenses 835 1,219
Amortization of Intangible Assets 129 972
External Services 2,685 4,072
Depreciation and Other Costs for Infrastructure 808 1,196
Total from Continuing Operations 14,146 18,770
Total from Discontinued Operations 0 2,101
TOTAL 14,146 20,871
4.2.3 PERSONNEL EXPENSES
Personnel expenses include the following items.
in 000’ € 2014 2013
Wages and Salaries 22,353 23,327
Social Security Contributions 3,689 3,288
Stock-based Compensation Expense 3,959 5,145
Temporary Staff (External) 200 647
Other 459 93
Total from Continuing Operations 30,660 32,500
Total from Discontinued Operations 0 523
TOTAL 30,660 33,023
104F I N A N C I A L S TAT E M E N T S
Notes

In 2014 and 2013, other personnel expenses mainly included recruitment costs.
The average number of employees in the financial year 2014 was 315 (2013: 290). Of the 329 employees engaged on 31 December 2014 (31 De-cember 2013: 299), 274 employees were active in research and develop-ment (31 December 2013: 253) and 55 employees were engaged in general and administrative functions (31 December 2013: 46 employees). On 31 December 2014, there were 105 employees in the Proprietary Develop-ment segment and 169 employees in the Partnered Discovery segment; 55 employees were not allocated to any specific segment (31 December 2013: 60 in the Proprietary Development segment, 193 employees in the Partnered Discovery segment, and 46 employees were not allocated). Costs for the defined-contribution plans amounted to € 0.4 million in 2014 (2013: € 0.3 million).
4.3 OTHER INCOME AND EXPENSES, FINANCE INCOME AND FINANCE EXPENSES
The item “other income and expenses, finance income and finance ex-penses” includes the following items.
in 000’ € 2014 2013
Grant Income 127 209
Gain on Exchange 422 130
Appreciation of Accounts Receiv-able Previously Deemed Impaired 202 0
Miscellaneous Income 31 458
Other Income 782 797
Loss on Exchange (449) (359)
Impairment of Accounts Receivable 0 (239)
Repayment of Grant Income 0 (101)
Miscellaneous Expenses (101) (212)
Other Expenses (550) (911)
Gain on Marketable Securities 761 521
Interest Income 1,004 347
Unrealized Loss on Derivatives 45 0
Finance Income 1,810 868
Interest Expenses (118) (22)
Loss on Derivatives (6) (33)
Bank Fees (63) (56)
Loss on Marketable Securities (33) 0
Finance Expenses (220) (111)
Total from Continuing Operations 1,822 643
Total from Discontinued Operations 0 5
TOTAL 1,822 648
4.4 INCOME TAX EXPENSES/INCOME MorphoSys AG and its German subsidiary Sloning BioTechnology GmbH are subject to corporate taxes, the solidarity surcharge, and trade taxes. The Company’s corporate tax rate of 15.0 %, the solidarity surcharge of 5.5 %, and the effective trade tax rate of 10.5 % have all remained un-changed.
Income taxes for the past financial year are comprised as follows.
in 000’ € 2014 2013
Current Tax Expense (Thereof Re-garding Prior Years: Tax Income of k€ 6; 2013: Tax Expense of k€ 60) (283) (3,753)
Deferred Tax Income 1,579 443
Total Income Tax Income/(Expense) 1,296 (3,310)
Total Amount of Current Taxes Resulting from Entries Directly Recognized in Equity 0 611
Total Amount of Current Taxes Resulting from Entries Directly Recognized in Other Comprehen-sive Income (15) (260)
Total Amount of Deferred Taxes Resulting from Entries Directly Recognized in Other Comprehen-sive Income 17 159
Total Amount of Tax-Effects Resulting from Entries Directly Recognized in Equity or Other Comprehensive Income 2 510
The table below reconciles the expected income tax expense to the actual income tax expense as presented in the consolidated financial statements. The combined income tax rate of 26.33 % in financial year 2014 (2013: 26.33 %) was applied to profit before taxes to calculate the statutory in-come tax expense. This rate comprised corporate income tax of 15.0 %, a solidarity surcharge of 5.5 % on the corporate tax, and an average trade tax of 10.5 % applicable to the Group.
in 000’ € 2014 2013
Profit Before Income Taxes (4,309) 10,681
Expected Tax Rate 26.33 % 26.33 %
Expected Income Tax 1,134 (2,812)
Tax Effects Resulting from:
Deferred Tax Asset on Tax Loss Carryforwards 629 200
Stock-based Compensation (424) (533)
Non-tax-deductible Items (179) (160)
Permanent Differences due to Tax Exemptions 107 1
Prior Year Taxes (6) (40)
Other Effects 35 34
Actual Income Tax 1,296 (3,310)
105F I N A N C I A L S TAT E M E N T S
Notes

As of 31 December 2014, deferred tax assets on tax loss carryforwards in the amount of € 1.8 million were recognized as a result of positive busi-ness expectations at Sloning BioTechnology GmbH for financial years 2015 to 2019. No deferred tax assets were reported in previous years for a por-tion of the corporate tax loss carryforwards in the amount of € 2.4 million and trade tax loss carryforwards in the amount of € 2.3 million as the us-ability of these tax loss carryforwards was deemed uncertain with regard to German tax regulation (Sec. 8 Para. 4 of the German Corporation Tax Act (KStG-former version) and Sec. 8c of the German Corporation Tax Act (KStG)) (see also item 2.9.6 of the Notes*). The definitive nature of the tax loss carryforwards in question was confirmed in the context of a tax audit completed by the time the consolidated financial statements had been pre-pared. Therefore, deferred tax assets were recognized in the full amount of existing tax loss carryforwards. The tax loss carryforwards may be carried forward indefinitely and in unlimited amounts. As of 2004, Ger-man tax law restricts the offsetting of taxable income against existing tax loss carryforwards up to an amount of € 1.0 million plus 60 % of taxable income exceeding € 1.0 million. *CROSS-REFERENCE to page 1 0 1
As of 31 December 2014, deferred tax assets on tax loss carryforwards in the amount of € 1.2 million were recognized as a result of positive busi-ness expectations at MorphoSys AG for financial years 2015 to 2019.
Deferred tax assets and liabilities are composed as follows.
in 000’s €, as of December 31 DTA 2014 DTA 2013 DTL 2014 DTL 2013
Intangible Assets 0 0 1,829 2,049
Non-recognition of DTA on Intangible Assets 0 0 0 0
Property, Plant and Equipment 0 0 0 0
Land 0 0 0 0
Building 0 0 0 0
Other Equipment, Furnitures, Fixtures 0 43 0 0
Shares in Affiliated Companies 0 0 0 0
Inventories 0 0 0 0
Advanced Payments 0 0 0 0
Receivables and Other Assets 0 0 0 0
Treasury Stock 0 0 0 0
Prepaid Expenses and Deferred Charges 0 0 7 0
Short-term Securities Investments 54 260 37 100
Other Accrual/Provisions 533 428 0 0
Trade Accounts Payable 0 0 0 0
Convertible Bonds 0 0 0 0
Other Liabilities 0 0 0 0
Tax Losses 3,023 1,731 0 0
3,610 2,462 1,873 2,149
As of 31 December 2014, deferred tax assets of € 3.6 million were offset against deferred tax liabilities of € 1.9 million (2013: deferred tax assets of € 2.5 million with deferred tax liabilities of € 2.1 million). The correspond-ing deferred tax assets and deferred tax liabilities concerned the same taxable entity and were imposed by the same tax authority.
As of 31 December 2014, there were temporary differences in connection with investments in subsidiaries (so-called outside basis differences) in the amount of € 0.3 million for which no deferred tax liabilities were rec-ognized.
106F I N A N C I A L S TAT E M E N T S
Notes

4.5 EARNINGS (LOSS)/CONSOLIDATED NET PROFIT PER SHARE Basic earnings (loss) per share is computed by dividing the consolidated net loss of financial year 2014 in the amount of € 3,012,629 (2013: consoli-dated net profit of € 13,321,930) by the weighted average number of ordi-nary shares outstanding during the respective years (2014: 25,903,995; 2013: 24,504,031).
The weighted average number of ordinary shares is calculated as follows.
2014 2013
SHARES ISSUED ON JANUARY, 1 26,220,882 23,358,228Effect of Treasury Shares Held (339,890) (255,415)
Effect of Repurchase of Treasury Stock (88,492) (56,458)
Effect of Share Issuance 0 1,242,621
Effect of Shares Issued in January 0 0
Effect of Shares Issued in February 0 0
Effect of Shares Issued in March 0 0
Effect of Shares Issued in April 58,746 0
Effect of Shares Issued in May 2,198 0
Effect of Shares Issued in June 37,063 21,567
Effect of Shares Issued in July 0 170,075
Effect of Shares Issued in August 2,122 9,502
Effect of Shares Issued in September 4,030 1,492
Effect of Shares Issued in October 1,781 1,884
Effect of Shares Issued in November 4,936 9,662
Effect of Shares Issued in December 619 873
WEIGHTED -AVER AGE NUMBER OF SHARES OF COMMON STOCK 25,903,995 24,504,031
Diluted earnings (loss) per share is calculated by taking into account the potential increase in the Group’s ordinary shares as the result of granted stock options and convertible bonds.
The following table shows the reconciliation of basic earnings per share to diluted earnings per share (in €, except for disclosure per share).
2014 2013
Numerator
Profit for the Year from Continuing Operations (3,012,629) 7,370,820
Profit/(Loss) for the Year from Discontinued Operations 0 5,951,110
Consolidated Net (Loss)/Profit (3,012,629) 13,321,930
Denominator
Weighted-average Shares Used for Basic EPS 25,903,995 24,504,031
Dilutive Shares Arising from Convertible Bonds 286,319 259,063
TOTAL DENOMINATOR 26,190,314 24,763,094Earnings per Share (in €)
Basic (0.12) 0.54
thereof from Continuing Operations (0.12) 0.30
thereof from Discontinued Operations 0.00 0.24
Diluted (0.12) 0.54
thereof from Continuing Operations (0.12) 0.30
thereof from Discontinued Operations 0.00 0.24
5 Notes to the Assets of the Balance Sheet
5.1 CASH AND CASH EQUIVALENTS
in 000’ € 12/31/2014 12/31/2013
Bank Balances and Cash in Hand 32,238 71,874
Term Deposits 573 964
Restricted Cash (573) (964)
Cash and Cash Equivalents 32,238 71,874
The decline in cash and cash equivalents resulted mainly from the use of cash and cash equivalents for operating activities and for the transaction with Emergent.
Restricted cash in the amount of € 0.6 million mainly consisted of rent deposits (2013: € 1.0 million).
107F I N A N C I A L S TAT E M E N T S
Notes

5.2 FINANCIAL ASSETS/SECURITIESAs of 31 December 2014 and 2013, available-for-sale financial assets are comprised as follows.
Gross Unrealized
in 000’ €
Maturity Cost Gains Losses Market Value
31 DECEMBER 2014
Money Market Funds daily 105,961 142 64 106,039
Restricted Cash 0
TOTAL 106,03931 DECEMBER 2013
Money Market Funds daily 188,305 378 0 188,683
Restricted Cash (323)
TOTAL 188,360
The Group’s gross unrealized gain from available-for-sale money market funds in the amount of € 141,640 and the gross unrealized loss of € 64,291 as of 31 December 2014 and the gross unrealized gain of € 377,872 as of 31 December 2013 were recorded as a separate item within equity (reval-uation reserve). In 2014, the Group recorded a net gain in the amount of € 710,518 from the disposal of financial assets in the income statement. This gain was previously recognized in stockholders’ equity (2013: € 520,730). Restricted cash in the amount of € 0.3 million as of 31 Decem-ber 2013 consisted of rent deposits.
As of 31 December 2014 and 2013, bonds available-for-sale comprised as follows.
Gross Unrealized
in 000’ €
Maturity Cost Gains Losses Market Value
31 DECEMBER 2014
Bonds daily 7,572 0 84 7,488
TOTAL 7,48831 DECEMBER 2013
Bonds daily 11,139 5 42 11,102
TOTAL 11,102
The Group’s gross unrealized loss from available-for-sale bonds in the amount of € 83,650 as of 31 December 2014 as well as the gross unreal-ized loss of € 41,750 and the gross unrealized gain of € 5,095 as of 31 De-cember 2013 were recognized as a separate item of equity (revaluation reserve). In 2014, the Group recorded a net gain in the amount of € 17,460 from the disposal of financial assets in the income statement that were previously recognized in stockholders’ equity. In 2013, the Group did not report any gains or losses in the income statement from these financial assets since no assets were sold.
Further information on the accounting of financial assets is provided in item 2.8.1 of the Notes*.*CROSS-REFERENCE to page 9 8
108F I N A N C I A L S TAT E M E N T S
Notes

5.3 ACCOUNTS RECEIVABLEAll accounts receivable are non-interest bearing and generally have pay-ment terms of between 30 and 45 days. As of 31 December 2014 and 2013, accounts receivable included unbilled receivables amounting to € 3,649,124 and € 1,597,498, respectively.
Based on the Management Board’s estimate, no net loss for allowances for doubtful receivables was recognized in profit and loss in 2014 (2013: net loss of € 238,900). In 2013, this loss was attributed to the Partnered Dis-covery segment.
5.4 OTHER RECEIVABLESAs of 31 December 2014, the Company held current financial assets amounting to € 157.1 million (31 December 2013: € 119.3 million) and non-current financial assets in the amount of € 50.0 million (31 December 2013: € 0 million), which were assigned to the category “loans and receiv-ables” in accordance with IAS 39 “Financial Instruments”. These assets consisted mainly of time deposits with fixed or variable interest rates.
Interest income of € 914,140 (2013: € 273,207) was recognized in the finance result. The risks associated with these financial instruments mainly result from credit risks of banks. There was no indication for im-pairment in financial year 2014.
A portion of the € 4.7 million purchase price for the divested AbD Serotec business held in an escrow account was released during the third quarter of 2014.
Under the Group’s hedging policy, highly probable cash flows and definite foreign-currency receivables, collectable within a twenty-four-month period, are tested as to whether they should be hedged. As of 2003, MorphoSys began using foreign currency options and forwards in order to hedge its foreign exchange risk against US dollar receivables. These deriv-atives are recorded at their fair values as “other receivables”.
As of 31 December 2014, there were 24 unsettled forward rate agreements with terms ranging from one to 24 months. The resulting unrealized gain of € 44,506 as of 31 December 2014 was recorded in the finance result. As of 31 December 2013, no unsettled forward rate agreements or option con-tracts were outstanding. At the beginning of the year, the Group entered into four option contracts that reached maturity during financial year 2014. A realized loss of € 0.01 million (2013: loss of € 0.02 million) was recorded in finance expenses.
5.5 PREPAID EXPENSES, INCOME TAX RECEIVABLES, OTHER CURRENT ASSETS, AND INVENTORIES
As of 31 December 2014, prepaid expenses mainly consisted of prepaid fees for external laboratory services of € 0.5 million (31 December 2013: € 2.7 million), prepaid fees for sublicenses of € 0.2 million (31 December 2013: € 0.1 million), and other prepayments amounting to € 0.5 million (31 December 2013: € 0.4 million).
As of 31 December 2014, tax receivables amounted to € 2.8 million (31 December 2013: € 1.5 million) consisting of receivables due from tax authorities for value-added taxes payable in the amount of € 1.7 million (31 December 2013: € 1.4 million) and receivables in the context of capital gain taxes withheld and taxes for prior years in the amount of € 1.1 mil-lion (31 December 2013: € 0.1 million).
Inventories amounting to € 0.6 million as of 31 December 2014 were stored at the Martinsried location and consisted of raw materials and sup-plies. As of the reporting date, there were no inventories carried at fair value less selling costs.
Inventories amounting to € 0.7 million as of 31 December 2013 were stored at the Martinsried location. As of 31 December 2013, inventories consisted of raw materials and supplies of € 0.5 million and work in prog-ress of € 0.2 million.
109F I N A N C I A L S TAT E M E N T S
Notes

5.6 PROPERTY, PLANT, AND EQUIPMENT
in 000’ €
Office and Laboratory Equipment
Furniture and Fixtures Total
Cost
1 JANUARY 2014 12,161 1,867 14,028Additions 2,864 35 2,899
Disposals (1,062) (137) (1,199)
31 DECEMBER 2014 13,963 1,765 15,728
Accumulated Depreciation
1 JANUARY 2014 10,173 1,687 11,860Depreciation Charge for the Year 1,386 60 1,446
Write-offs for the Year 57 0 57
Disposals (1,056) (137) (1,193)
31 DECEMBER 2014 10,560 1,610 12,170
Carrying Amount
1 JANUARY 2014 1,988 180 2,16831 DECEMBER 2014 3,403 155 3,558
Cost
1 JANUARY 2013 12,436 1,892 14,328Additions 1,004 39 1,043
Disposals (1,279) (64) (1,343)
31 DECEMBER 2013 12,161 1,867 14,028
Accumulated Depreciation
1 JANUARY 2013 9,485 1,651 11,136Depreciation Charge for the Year 1,435 84 1,519
Write-offs for the Year 522 16 538
Disposals (1,269) (64) (1,333)
31 DECEMBER 2013 10,173 1,687 11,860
Carrying Amount
1 JANUARY 2013 2,951 241 3,19231 DECEMBER 2013 1,988 180 2,168
In financial year 2014, impairment of property, plant, and equipment amounted to € 0.1 million (2013: € 0.5 million) and mainly related to labo-ratory equipment in the Partnered Discovery segment. The impairment was caused by the fact that there was no longer an economic benefit ex-pected from these assets.
No borrowing costs were capitalized during the reporting period. There were neither restrictions on retention of title nor property, plant and equipment pledged as security for liabilities. There were no material con-tractual commitments for the purchase of property, plant, and equipment as of the reporting date.
Depreciation is included in the following line items of the income state-ment.
in 000’ € 2014 2013
Research and Development 1,208 1,155
Research and Development (Write-off) 57 538
General and Administrative 238 364
Total from Continuing Operations 1,503 2,057
Profit/(Loss) for the Year from Discontinued Operations 0 13
TOTAL 1,503 2,070
110F I N A N C I A L S TAT E M E N T S
Notes

5.7 INTANGIBLE ASSETS
in 000’ € Patents License Rights
In-Licensed Research Programs Software Goodwill Total
Cost
1 JANUARY 2014 15,470 25,001 12,808 4,376 7,352 65,007Additions 273 815 15,446 1,045 0 17,579
Disposals 0 (3,920) 0 (241) 0 (4,161)
31 DECEMBER 2014 15,743 21,896 28,254 5,180 7,352 78,425
Accumulated Depreciation
1 JANUARY 2014 7,635 19,604 0 2,619 0 29,858Depreciation Charge for the Year 1,120 824 0 744 0 2,688
Write-offs for the Year 0 4,045 0 16 0 4,061
Disposals 0 (3,920) 0 (241) 0 (4,161)
31 DECEMBER 2014 8,755 20,553 0 3,138 0 32,446
Carrying Amount
1 JANUARY 2014 7,835 5,397 12,808 1,757 7,352 35,14931 DECEMBER 2014 6,988 1,343 28,254 2,042 7,352 45,979
Cost
1 JANUARY 2013 14,902 24,410 10,513 3,350 7,352 60,527Additions 568 591 2,295 1,061 0 4,515
Disposals 0 0 0 (35) 0 (35)
31 DECEMBER 2013 15,470 25,001 12,808 4,376 7,352 65,007
Accumulated Depreciation
1 JANUARY 2013 6,236 17,281 0 1,999 0 25,516Depreciation Charge for the Year 1,075 1,576 0 640 0 3,291
Write-offs for the Year 324 747 0 15 0 1,086
Disposals 0 0 0 (35) 0 (35)
31 DECEMBER 2013 7,635 19,604 0 2,619 0 29,858
Carrying Amount
1 JANUARY 2013 8,666 7,129 10,513 1,351 7,352 35,01131 DECEMBER 2013 7,835 5,397 12,808 1,757 7,352 35,149
In financial year 2014, impairments on patents and licenses totaled € 4.1 million (2013: € 1.1 million). Of this amount, € 2.1 million was recog-nized in the Proprietary Development segment (2013: € 1.1 million) and € 2.0 million in the Partnered Discovery segment (2013: € 0). These im-pairments were incurred because these assets were no longer expected to generate an economic benefit.
As of 31 December 2014, in-licensed research programs were subject to an impairment test as required by IAS 36. This test did not reveal any impair-ment.
Amortization is included in the following line items of the income state-ment.
in 000’ € 2014 2013
Research and Development 2,562 3,068
Research and Development (Write-off) 4,058 760
General and Administrative 126 223
General and Administrative (Write-Off) 3 326
Total from Continuing Operations 6,749 4,377
Profit/(Loss) for the Year from Discontinued Operations 0 12
TOTAL 6,749 4,389
111F I N A N C I A L S TAT E M E N T S
Notes

5.7.1 PATENTS
In financial year 2014, the carrying amount of patents declined by € 0.8 million from € 7.8 million to € 7.0 million. This was the result of ad-ditions amounting to € 0.3 million for patent applications, particularly for proprietary programs and technologies, which were offset by straight-line amortization of € 1.1 million.
5.7.2 LICENSES
The carrying amount of licenses declined by € 4.1 million from € 5.4 mil-lion to € 1.3 million in 2014. Additions during the financial year concerned one-time payments totaling € 0.8 million for access to target molecules as well as technologies. Amortization and impairment amounted to € 0.8 mil-lion and € 4.1 million, respectively.
5.7.3 IN -LICENSED RESEARCH PROGR AMS
The carrying amount of in-licensed research programs increased from € 12.8 million to € 28.3 million in 2014. This increase was primarily the result of the in-licensing of a research program from Emergent in the form of an upfront payment of US$ 20 million. The in-licensed compounds, which were reported at acquisition cost, are currently not available for use and were therefore not yet amortized.
5.7.4 SOFTWARE
In financial year 2014, additions to this line item totaled € 1.0 million. The carrying amount increased by € 0.2 million from € 1.8 million in 2013 to € 2.0 million in 2014. Additions were offset by amortization in the amount of € 0.8 million and minor software disposals.
5.7.5 GOODWILL
On 30 September 2014, goodwill in the amount of € 7.4 million from the acquisition of Sloning BioTechnology GmbH in the year 2010 was subject to an impairment test as required by IAS 36. The recoverable amount of the cash-generating unit of the team for technology development within the Partnered Discovery segment has been determined on the basis of value in use calculations; the value-in-use was higher than the carrying amount of the cash generating unit. A detailed sensitivity analysis was also performed. The cash flow forecasts are based on a period of ten years since the Management Board believes that commercialisation by means of licensing agreements, upfront payments, milestone payments, funded re-search, and royalties will fully pay off in the medium to longer term. For this reason, a planning horizon of ten years is considered appropriate for the value-in-use calculation. Cash flow forecasts are mainly based on the central assumption that the currently developed technology will prove to be very beneficial for new and existing customers and will lead to a num-ber of new agreements. The values of the underlying key assumptions were determined using both internal (past experience) and external sources of information (market information). On the basis of the updated cash flow forecast for the next ten years, the value in use was determined as follows: A beta factor of 1.2 (2013: 1.3), WACC of 11.5 % (2013: 15.2 %), as well as a perpetual growth rate of 1 %. The fair value assumptions correlate to the Management Board’s forecasts in term of future development and are based on internal planning scenarios as well as external sources of information.
5.8 SHARES, AVAILABLE-FOR-SALEShares available-for-sale comprise the 19.98 % share in Dutch Lanthio Pharma B.V. The investment increased in financial year 2013 due to a con-tribution in the amount of € 0.8 million to a total of € 1.7 million and re-mained unchanged in 2014.
5.9 PREPAID EXPENSES AND OTHER ASSETSThis line item included the non-current portion of prepaid expenses and other assets. The Group has classified certain line items in other assets as “restricted cash” which are not available for use in the Group’s operations (see items 2.8.1, 5.1, and 5.2 of the Notes*). As of 31 December 2014 and 2013, the Group’s restricted cash amounted to € 0.6 million and € 1.3 mil-lion, respectively. This included issued rent guarantees as well as convert-ible bonds granted to employees in the amount of € 251,679 and € 298,606, respectively.*CROSS-REFERENCE to page 9 8 and page 1 07 – 1 0 8
This line item is composed as follows.
in 000’ € 12/31/2014 12/31/2013
Prepaid Expenses, Net of Current Portion 183 51
Other Current Assets 868 1,681
TOTAL 1,051 1,732
6 Notes to Equity and Liabilities of the Balance Sheet
6.1 ACCOUNTS PAYABLE AND ACCRUED EXPENSESAccounts payable are non-interest-bearing and, under normal circum-stances, have payment terms of no more than 30 days.
Accounts payable are listed in the following table.
in 000’ € 12/31/2014 12/31/2013
Trade Accounts Payable 569 1,078
Licenses Payable 89 120
Accrued Expenses 16,101 15,076
Other Liabilities 1,072 916
TOTAL 17,831 17,190
Accrued expenses mainly included accrued personnel expenses for pay-ments to employees and the management amounting to € 3.1 million (31 December 2013: € 5.6 million), provisions for outstanding invoices in the amount of € 2.0 million (31 December 2013: € 1.8 million), external labora-tory services in the amount of € 10.5 million (31 December 2013: € 6.8 mil-
112F I N A N C I A L S TAT E M E N T S
Notes

lion), license payments in the amount of € 0.4 million (31 December 2013: € 0.5 million), audit fees and other audit-related costs in the amount of € 0.1 million (31 December 2013: € 0.1 million), and insignificant amounts for legal advice (31 December 2013: € 0.3 million).
At the Company’s Annual General Meeting in May 2014, the Supervisory Board was given authorization to appoint PricewaterhouseCoopers AG Wirtschaftsprüfungsgesellschaft (PwC AG), Munich, as the auditor.
In financial year 2014, PwC AG received compensation from MorphoSys in the amount of € 265,483, including audit fees in the amount of € 175,900, fees for other audit-related and valuation services of € 52,300, fees for tax services in the amount of € 5,855 as well as fees for other services in the amount of € 31,428.
6.2 PROVISIONS AND TAX LIABILITIESAs of 31 December 2014, the Group recorded provisions and tax liabilities in the amount of € 0.8 million (2013: € 3.6 million for the entire Group).
Tax liabilities mainly comprised income tax expenses. As of 31 December 2014, provisions and tax liabilities were uncertain in terms of their amount and are expected to be utilized in 2015.
The provisions and tax liabilities developed as follows in financial year 2014.
in 000’ € 01/01/2014 Additions Utilized Released 12/31/2014
Taxes 2,690 375 2,259 29 777
Other Obligations 897 379 999 214 63
TOTAL 3,587 754 3,258 243 840
6.3 DEFERRED REVENUESDeferred revenues relate to payments received from customers for which the services have not been rendered. This line item developed as follows.
in 000’ € 2014 2013
OPENING BAL ANCE 74,435 6,543
Prepayments Received in the Fiscal Year 17,863 91,860
Revenue Recognised through Release of Prepayments in line with Services Performed in the Fiscal Year (33,546) (23,968)
CLOSING BAL ANCE 58,752 74,435thereof short-term 14,075 15,267
thereof long-term 44,677 59,168
6.4 STOCKHOLDERS’ EQUITY6.4.1 COMMON STOCK
On 31 December 2014 the Company had common stock amounting to € 26,456,834, including treasury stock, which represents an increase of € 235,952 in comparison to the level of € 26,220,882 on 31 December 2013. Each no-par value share is entitled to one vote. Common stock increased by € 235,952 or 235,952 shares as a result of the exercise of 235,952 con-vertible bonds granted to the Management Board and the Senior Manage-ment Group. The weighted average exercise price per exercised convert-ible bonds amounted to € 16.79.
As of 31 December 2014, the Company held 450,890 shares in treasury stock in the amount of € 14,251,962, which corresponds to an increase of € 7,833,944 compared to 31 December 2013 (339,890 shares, € 6,418,018). This increase was the result of the repurchase of 111,000 own stocks on the stock exchange. The treasury stock may be used for all purposes named in the authorization of the Annual General Meetings on 19 May 2011 as well as on 23 May 2014, and particularly for any existing or future employee participation schemes and/or to finance acquisitions. The shares may also, however, be redeemed.
113F I N A N C I A L S TAT E M E N T S
Notes

6.4.2 AUTHORIZED CAPITAL
Compared to 31 December 2013, the number of authorized ordinary shares increased from 2,335,822 to 4,957,910. This resulted from the creation of the new Authorized Capital 2014-I at the Annual General Meeting on 23 May 2014. With the Supervisory Board’s consent, the Management Board is authorized to increase the Company’s common stock on one or more occasions by up to € 2,622,088 by issuing up to 2,622,088 new, no-par value bearer shares up to and including the date of 30 April 2019.
6.4.3 CONDITIONAL CAPITAL
The number of ordinary shares of conditional capital decreased to 7,166,848 compared to 8,057,470 on 31 December 2013. At the Annual General Meeting on 23 May 2014, the Conditional Capital 1999-I in the amount of € 70,329 and the Conditional Capital 2008/II in the amount of € 212,077 were cancelled. Conditional Capital 2003-II was reduced by € 372,264 from € 725,064 to € 352,800. A further reduction of Conditional Capital 2003-II of € 235,952 to a total of € 116,848 resulted from the exer-cise of 235,952 conversion rights in 2014. The reduction of Conditional Capital through the exercise of 235,952 conversion rights was registered for entry in the commercial register in January 2015.
6.4.4 TREASURY STOCK
In the years 2013 and 2014, the Group repurchased own shares. Composi-tion and development of this line item can be found in the following table.
Number of
Shares Value
As of 12/31/2010 79,896 9,774
Purchase in 2011 84,019 1,747,067
As of 12/31/2011 163,915 1,756,841
Purchase in 2012 91,500 1,837,552
As of 12/31/2012 255,415 3,594,393
Purchase in 2013 84,475 2,823,625
As of 12/31/2013 339,890 6,418,018
Purchase in 2014 111,000 7,833,944
As of 12/31/2014 450,890 14,251,962
The average stock price at the time of the repurchases carried out in 2014 amounted to € 70.53 per share (2013: € 33.43 per share). Treasury stocks are recognized at acquisition cost.
6.4.5 ADDITIONAL PAID - IN CAPITAL
On 31 December 2013, additional paid-in capital amounted to € 318,375,720 (31 December 2013: € 310,963,651). The total increase of € 7,412,069 re-sulted from the exercise of convertible bonds granted totaling € 3,725,682. Furthermore, additional paid-in capital increased by € 3,686,387 from per-sonnel expenses resulting from share-based payments.
In 2013, additional paid-in capital increased by € 135,718,385. The capital increase in September 2013 and the agreement with Celgene resulted in a total increase of € 124,369,723. In addition, the exercise of stock options and personnel expenses resulting from share-based payments resulted in an increase of € 6,606,570 and € 4,742,092, respectively.
IFRS 2 “Share-based Payment” requires the consideration of the effects of share-based payments if the Group acquires goods or services in ex-change for stocks or stock options (“settlement in equity instruments”) or other assets that represent the value of a specific number of stocks or stock options (“cash settlement”). The key impact of IFRS 2 on the Group arises from the expense of using an option pricing model in connection with share-based incentives for employees and the Management Board. Further information may be found under items 7.1, 7.2 and 7.3 of the Notes*.*CROSS-REFERENCE to page 1 1 5 – 1 1 6
6.4.6 REVALUATION RESERVE
On 31 December 2014, the revaluation reserve amounted to € -4.642 (31 December 2013: € 240,381). The reduction amounting to a total of € 245,023 arose from a change in the unrealized gain on available-for-sale securities and bonds of € 347,517, which was partly offset by the effects from the equity-related recognition of deferred taxes in the amount of € 102,494.
6.4.7 TR ANSLATION RESERVE
The translation reserve increased by € 101,290 from € 192,556 on 31 De-cember 2013 to € 293,846 on 31 December 2014. This item included ex-change rate differences arising from the revaluation of Group company fi-nancial statements of prepared in foreign currencies as well as differences between the exchange rates used in the balance sheet and the income statement.
6.4.8 ACCUMULATED INCOME
The consolidated net loss amounting to € 3,012,629 is reported in accumu-lated income. Thus, accumulated income declined from € 20,945,968 in 2013 to € 17,933,339 in 2014.
114F I N A N C I A L S TAT E M E N T S
Notes

7 Remuneration System for the Management Board and Employees of the Group
7.1 CONVERTIBLE BONDS7.1.1 2010 PROGR AM
On 1 April 2010, 352,800 convertible bonds were granted to members of the Management Board and members of the Senior Management Group. The exercise price of the convertible bonds was € 16.79 and equaled the Company’s share price in the XETRA closing auction of the Frankfurt Stock Exchange on the trading day preceding the issuance of the convert-ible bonds. Each convertible bond having a par value of € 0.33 entitles the conversion into one no-par value bearer share of the Group against pay-ment of the exercise price. The beneficiaries may only exercise their con-version rights following a vesting period of four years beginning after the grant date. Exercise of the conversion rights is only possible if, on one trading day during the lifetime of the convertible bond, the share price reached at least 110 % of the exercise price as of the grant date. After 31 December 2015, these convertible bonds can no longer be exercised. If the conversion rights are not exercised, the beneficiaries receive a reimburse-ment of the amount paid to acquire the conversion rights (€ 0.33 per con-vertible bond/share). Convertible bonds are recorded at their accreted value, which closely approximates to the principal amount on their due date.
In financial year 2014, a total of 235,952 convertible bonds were exercised at a weighted-average share price of € 69.69.
7.1.2 2013 PROGR AM
On 1 April 2013, MorphoSys AG granted the Management Board and mem-bers of the Senior Management Group convertible bonds with a total nom-inal value of € 225,000 and divided into 449,999 bearer bonds with equal rights from “Conditional Capital 2008-III”. The beneficiaries have the right to convert the bonds received into shares of the Company. Each convertible bond may be exchanged for one of the Company’s bearer shares equal to the proportional amount of common stock, which currently stands at € 1. The exercise of the convertible bonds is subject to several conditions, such as the achievement of performance targets, the expiration of vesting peri-ods, the exercisability of the conversion rights, the existence of an employ-ment or service contract which is not under notice, and the commence-ment of the exercise period.
The conversion price amounted to € 31.88 and was derived from the Com-pany’s share price in the XETRA closing auction of the Frankfurt Stock Exchange on the trading day preceding the issuance of the convertible bonds. The exercise of the conversion rights is admissible if, on at least one trading day during the lifetime of the convertible bonds, the share price of the Company has amounted to more than 120 % of the price in the XETRA closing auction of the Frankfurt Stock Exchange on the trading day pre-ceding the issuance of the convertible bonds.
The exercise of the conversion rights is only admissible after the expira-tion of a four-year vesting period from the grant date. In the event of a change of control, the vesting period will be shortened to two years from the grant date. For every year without a notice of termination of the em-ployment relationship with the Company or an affiliated company, 25 % of the conversion rights will become vested. In the event of a change of con-trol, all unvested conversion rights become vested.
If an employment or service contract of a beneficiary is terminated without notice, no further conversion rights can be vested in line with the above mentioned vesting scheme. Thus, upon rendition of the notice, all conver-sion rights still unvested by this time will expire without substitution. In the event of a contractual notice of termination of such employment or service contract with the beneficiary, or a mutually agreed dissolution contract, the previous sentence applies and becomes effective as of the date of termination of the employment or service contract.
The following table shows the development of the convertible bond plans for employees of the Group in financial years 2014 and 2013.
Convertible
Bonds
Weighted- average Price (€)
OUTSTANDING ON 1 JANUARY 2013 320,550 16.79Granted 449,999 31.88
Exercised 0 0.00
Forfeited (3,750) 16.79
Expired 0 0.00
OUTSTANDING ON 31 DECEMBER 2013 766,799 25.65
OUTSTANDING ON 1 JANUARY 2014 766,799 25.65Granted 0 0.00
Exercised (235,952) 16.79
Forfeited 0 0.00
Expired 0 0.00
OUTSTANDING ON 31 DECEMBER 2014 530,847 29.58
On 31 December 2014, the number of vested convertible bonds totaled 193,348 shares (31 December 2013: zero shares).
115F I N A N C I A L S TAT E M E N T S
Notes

The following overview includes the weighted-average exercise price as well as information on the contract duration of significant groups of con-vertible bonds as of 31 December 2014.
Range of Exercise PricesNumber
Outstanding
Remaining Contractual Life
(in Years)
Weighted- average Exercise
Price (€)Number
Exercisable
Weighted- average Exercise
Price (€)
€ 10.00 – € 25.00 80,848 1.00 16.79 80,848 16.79
€ 25.01 – € 40.00 449,999 5.25 31.88 112,500 31.88
530,847 4.60 29.58 193,348 29.58
The Group recognizes personnel expenses resulting from convertible bonds in accordance with IFRS 2 and IAS 32.28. The equity component of the convertible bonds is presented separately in additional paid-in capital. The corresponding amount is recognized as personnel expenses from con-vertible bonds. In 2014 and 2013, compensation expenses related to con-vertible bonds amounted to € 1,609,086 and € 1,997,414, respectively.
7.2 STOCK APPRECIATION RIGHTSOn 1 October 2010, employees of MorphoSys AG were granted 15,000 stock appreciation rights at the same conditions as the convertible bonds granted on 1 April 2010. Compensation expenses amounted to € 272.953 in 2014 (2013: € 449.420). In financial year 2014, all stock appreciation rights were exercised at an average share price of € 74.44.
7.3 LONG-TERM INCENTIVE PROGRAMSThe total decline in recognized personnel expenses from share-based pay-ments resulted from the modification carried out in financial year 2013 for the 2011 and 2012 LTI programs. For the 2011 LTI program, vesting peri-ods were modified so that the beneficiaries’ claims would become vested at a rate of one quarter per year. However, in the case of the 2012 LTI pro-gram, claims become vested on a pro-rata basis. With this modification, changes in the interpretation and development of labor law were taken into account. As a result of the adaptation, personnel expenses are ac-counted for comparatively earlier within the four-year period, resulting in a decrease of personnel expenses in 2014 compared to the previous year.
7.3.1 2011 LONG -TERM INCENTIVE PROGR AM
On 1 June 2011, MorphoSys established a long-term incentive plan (LTI plan) for the Management Board and the Senior Management Group. Ac-cording to IFRS, this program is considered a share-based payment pro-gram with settlement in equity instruments and is accounted for accord-ingly. The LTI plan is a performance-related share plan and will be paid out in ordinary shares of MorphoSys AG if predefined key performance criteria have been achieved. These criteria are assessed and approved an-nually by the Supervisory Board. These key performance criteria pres-ently consist of revenues, EBIT, and the number of projects in the R&D portfolio.
The grant date was 1 June 2011 and the vesting period is four years. A total of 25 % of the performance shares will become vested in each year of the four-year vesting period, provided that the performance criteria set for the respective period were met by 100 %. The annual number of vested shares shall be reduced to the extent that the performance criteria of the relevant year were fulfilled only between 50 % and 99 %, and increased to the extent that the performance criteria were achieved by more than 100 % (maxi-mum 110 %). In consideration of these conditions, the ordinary shares of MorphoSys AG will be delivered to the beneficiaries after the four-year vesting period. In any case, the maximum pay-out at the end of the four-year period is limited by a factor determined by the Group which generally amounts to “1”. The Supervisory Board may deviate from this factor, for example, if the level of payments is considered to be inappropriate given the general development of the Group.
If the number of repurchased shares is not sufficient for servicing the LTI plan, MorphoSys reserves the right to pay a certain amount of the LTI plan in cash in the amount of the performance shares at the end of the vesting period, provided the cash amount does not exceed 200 % of the fair value of the performance shares on the grant date.
If a member of the Management Board ceases to hold an office at MorphoSys Group prematurely before expiration of the four year performance period, the Management Board member (or his/her heirs) is entitled to perfor-mance shares determined on a precise daily pro-rata basis. If a member of the Management Board ceases to hold an office within MorphoSys Group for good reason as defined by Sec. 626 Para. 2 of the German Civil Code (BGB) prematurely before expiration of the four-year performance period, the beneficiary will not be entitled to an allocation of performance shares. If a change of control occurs during the course of the four-year vesting period, all performance shares are considered fully vested. In every above named case, the allocation of the performance shares only occurs at the end of the four-year vesting period.
116F I N A N C I A L S TAT E M E N T S
Notes
In June 2011, MorphoSys repurchased 84,019 of its own shares on the stock exchange at an average price of € 20.79 per share for the 2011 LTI plan. The repurchased shares may be used for all purposes named in the authorization of the Annual General Meetings on 19 May 2011 as well as on 23 May 2014 and particularly for any existing or future employee par-ticipation schemes and/or to finance acquisitions. However, they may also be redeemed. These 84,019 shares were granted to the beneficiaries retro-actively on 1 June 2011. This included 53,997 shares for the Management Board (for further information please see the table titled “Performance Shares” in item 7.4* “Directors’ Dealings”) and 30,022 shares for the Se-nior Management Group. The fair value of the performance shares was € 21.34 per share on the grant date (1 June 2011). No dividends were con-sidered in the determination of the fair value of the repurchased shares since the Group does not intend to distribute any dividends in the foresee-able future. From the grant date until 31 December 2014, three beneficia-ries have left MorphoSys and, therefore, 5,216 performance shares were forfeited. *CROSS-REFERENCE to page 1 1 9
In 2014, personnel expenses resulting from stock options under the Group’s 2011 LTI plan amounted to € 172,311 (2013: € 778,124).
7.3.2 2012 LONG -TERM INCENTIVE PROGR AM
On 1 April 2012, MorphoSys established a second long-term incentive plan (LTI plan) for the Management Board and the Senior Management Group. According to IFRS 2, this program is considered a share-based payment program with settlement in equity instruments and is accounted for ac-cordingly. The LTI plan is a performance-related share plan and will be paid out in ordinary shares of MorphoSys AG if predefined key perfor-mance criteria have been achieved. These criteria are approved annually by the Supervisory Board.
The grant date was 1 April 2012 and the vesting period is four years. One fourth of the performance shares will become vested in each year of the four-year vesting period, provided that the performance criteria set for the respective period were met in full. The annual number of vested shares shall be reduced to the extent that the performance criteria of the relevant year have been fulfilled only between 50 % and 99 %, and increased to the extent that the performance criteria were met by more than 100 % (maxi-mum 200 %). If in one year the specified performance criteria are achieved by less than 50 %, no shares will become vested in that year. In any case, the maximum pay-out at the end of the four-year period is limited by a factor determined by the Group which generally amounts to “1”. However, in justified cases, the Supervisory Board may set this factor freely be-tween “0” and “2”, for example, if the level of payment seems unreasonable with regard to the general development of the Company. The right to re-ceive a certain allocation of shares under the LTI plan, however, only oc-curs at the end of the four-year vesting period.
If the number of repurchased shares is not sufficient for servicing the LTI plan, MorphoSys reserves the right to pay a certain amount of the LTI plan in cash in the amount of the performance shares at the end of the vesting period, provided the cash amount does not exceed 200 % of the fair value of the performance shares on the grant date.
If a member of the Management Board ceases to hold an office within MorphoSys Group prematurely before expiration of the four year perfor-mance period, the Management Board member (or his/her heirs) is enti-tled to performance shares determined on a precise daily pro-rata basis. If a member of the Management Board ceases to hold an office within MorphoSys Group for good reason as defined by Sec. 626 Para. 2 of the German Civil Code (BGB) prematurely before expiration of the four-year performance period, the beneficiary will not be entitled to an allocation of performance shares. If a change of control occurs during the course of the four-year vesting period, all performance shares are considered fully vested. In every above named case, the right to receive a certain allocation of shares under the LTI plan only occurs at the end of the four-year vesting period.
In April 2012, MorphoSys repurchased 91,500 of its own shares on the stock exchange at an average price of € 20.08 per share for the 2012 LTI plan. The repurchased shares may be used for all purposes named in the authorization of the Annual General Meetings on 19 May 2011 as well as on 23 May 2014 and particularly for any existing or future employee par-ticipation schemes and/or to finance acquisitions. However, they may also be redeemed. These 91,500 shares were granted to the beneficiaries retro-actively on 1 April 2012. These included 57,967 shares for the Manage-ment Board (for further information please see the table titled “Perfor-mance Shares” in item 7.4* “Directors’ Dealings”) and 33,533 shares for the Senior Management Group. The fair value of the performance shares was € 19.24 per share on the grant date (1 April 2012). No dividends were considered in the determination of the fair value of the repurchased shares since the Group does not intend to distribute any dividends in the foresee-able future. From the grant date until 31 December 2014, two beneficiaries have left MorphoSys and thus 4,051 performance shares were forfeited. *CROSS-REFERENCE to page 1 1 9
On 1 October 2012, MorphoSys established a further long-term incentive plan (LTI plan) for members of the Senior Management Group. The terms of the plan were identical to the program of 1 April 2012. A total of 2,292 shares were granted. The fair value was € 24.00 per share on the grant date.
In 2014, personnel expenses resulting from stock options under the Group’s 2012 LTI plan amounted to € 293,904 (2013: € 974,997).
117F I N A N C I A L S TAT E M E N T S
Notes

7.3.3 2013 LONG -TERM INCENTIVE PROGR AM
On 1 April 2013, MorphoSys established a further long-term incentive plan (LTI plan) for the Management Board and the Senior Management Group. According to IFRS 2, this program is considered a share-based pay-ment program with settlement in equity instruments and is accounted for accordingly. The LTI plan is a performance-related share plan and will be paid out in ordinary shares of MorphoSys AG if predefined key perfor-mance criteria have been achieved. These criteria are evaluated annually by the Supervisory Board. The grant date was 1 April 2013 and the vest-ing/performance period is four years. If the predefined key performance criteria for the respective period are met by 100 %, 25 % of the performance shares become vested in each year of the four-year vesting period. The number of shares vested each year will be reduced or increased to the ex-tent that the performance criteria of the respective year have only been achieved between 50 % and 99.9 % (<100 %) or that the achievement of the performance criteria has exceeded 100 % (maximum 200 %). If in one year the performance criteria are achieved by less than 50 %, “0” shares will become vested in that year. In any case, the maximum pay-out at the end of the four-year period is limited by a factor determined by the Group which generally amounts to “1”. However, in justified cases, the Supervi-sory Board may set this factor freely between “0” and “2”, for example, if the level of payment is regarded as unreasonable in view of the general development of the Company. The right to receive a certain allocation of shares under the LTI plan, however, only occurs at the end of the four-year vesting period.
If the number of repurchased shares is not sufficient for servicing the LTI plan, MorphoSys reserves the right to pay a certain amount of the LTI plan in cash in the amount of the performance shares at the end of the vesting period, provided the cash amount does not exceed 200 % of the fair value of the performance shares on the grant date.
If a member of the Management Board ceases to hold an office within MorphoSys Group prematurely before expiration of the four year perfor-mance period, the Management Board member (or his/her heirs) is enti-tled to performance shares determined on a precise daily pro-rata basis. If a member of the Management Board ceases to hold an office within MorphoSys Group for good reason as defined by Sec. 626 Para. 2 of the German Civil Code (BGB) prematurely before expiration of the four-year performance period, the beneficiary will not be entitled to an allocation of performance shares. If a change of control occurs during the course of the four-year vesting period, all performance shares are considered fully vested. In every above named case, the right to receive a certain allocation of shares under the LTI plan only occurs at the end of the four-year vesting period.
In April and May 2013, MorphoSys repurchased 84,475 of its own shares on the stock exchange at an average price of € 33.43 per share. The repur-chased shares may be used for all purposes named in the authorization of the Annual General Meetings on 19 May 2011 as well as on 23 May 2014 and particularly for any existing or future employee participation schemes and/or to finance acquisitions. However, they may also be redeemed. Of these shares, 61,600 were granted to the beneficiaries retroactively effec-tive 1 April 2013. This included 36,729 shares for the Management Board
(for further information, please see the table titled “Performance Shares” in item 7.4* “Directors’ Dealings”) and 24,871 shares for the Senior Man-agement Group. On the grant date (1 April 2013), the fair value of the per-formance shares was € 31.88 per share. No dividends were considered in the determination of the fair value of the repurchased shares since the Group does not intend to distribute any dividends in the foreseeable fu-ture. From the grant date until 31 December 2014, no beneficiary has left MorphoSys and no performance shares have been forfeited. For the calcu-lation of the personnel expenses resulting from share-based payments under the 2013 LTI plan, it was assumed that one beneficiary will leave the Company during the four-year period.*CROSS-REFERENCE to page 9 5 and page 1 1 9
On 1 October 2013, MorphoSys established a further long-term incentive plan (LTI plan) for members of the Senior Management Group. The terms of the plan were identical to the program of 1 April 2013. A total of 549 shares were granted and the fair value on the grant date was € 57.39 per share.
In 2014, personnel expenses resulting from stock options under the Group’s 2013 LTI plan amounted to € 594,309 (2013: € 917,319).
7.3.4 2014 LONG -TERM INCENTIVE PROGR AM
On 1 April 2014, MorphoSys established a fourth long-term incentive plan (LTI plan) for the Management Board and the Senior Management Group. According to IFRS 2, this program is considered a share-based payment program with settlement in equity instruments and is accounted for ac-cordingly. The LTI plan is a performance-related share plan and will be paid out in ordinary shares of MorphoSys AG if predefined key perfor-mance criteria have been achieved. These criteria are evaluated annually by the Supervisory Board. The grant date was 1 April 2014 and the vest-ing/performance period is four years. If the predefined key performance criteria for the respective period are met by 100 %, 25 % of the performance shares become vested in each year of the four-year vesting period. The number of shares vested each year will be reduced or increased to the ex-tent that the performance criteria of the respective year have only been achieved between 50 % and 99.9 % (<100 %) or that the achievement of the performance criteria has exceeded 100 % (maximum 200 %). If in one year the performance criteria are met by less than 50 %, “0” shares will become vested in that year. In any case, the maximum pay-out at the end of the four-year period is limited by a factor determined by the Group which gen-erally amounts to “1”. However, in justified cases, the Supervisory Board may set this factor freely between “0” and “2”, for example, if the level of payment is regarded as unreasonable in view of the general development of the Company. The right to receive a certain allocation of shares under the LTI plan, however, only occurs at the end of the four-year vesting period.
If the number of repurchased shares is not sufficient for servicing the LTI plan, MorphoSys reserves the right to pay a certain amount of the LTI plan in cash in the amount of the performance shares at the end of the vesting period, provided the cash amount does not exceed 200 % of the fair value of the performance shares on the grant date.
118F I N A N C I A L S TAT E M E N T S
Notes

If a member of the Management Board ceases to hold an office within the MorphoSys Group through termination (or if the member of the Manage-ment Board terminates the employment contract), resignation, death, in-jury, disability, or by reaching the retirement age (receipt of a normal re-tirement pension, early-retirement pension or disability pension, as long as the requirements for the disability pension entitlement are met), or under other circumstances subject to the Supervisory Board’s discretion, the Management Board member (or his/her heirs) is entitled to perfor-mance shares determined on a precise daily pro-rata basis.
If a member of the Management Board ceases to hold an office within MorphoSys Group for good reason as defined by Sec. 626 Para. 2 of the German Civil Code (BGB) and/or as defined by Sec. 84 Para. 3 of the Ger-man Stock Corporation Act (AktG), the beneficiary will not be entitled to an allocation of performance shares.
If a change of control occurs during the course of the four-year vesting period, all performance shares will become fully vested. In this case, the right to receive a certain allocation of shares under the LTI plan only oc-curs at the end of the four-year vesting period.
In March 2014, MorphoSys repurchased 111,000 of its own shares on the stock exchange at an average price of € 70.53 per share. The repurchased shares may be used for all purposes named in the authorization of the Annual General Meetings on 19 May 2011 as well as on 23 May 2014 and particularly for any existing or future employee participation schemes and/or to finance acquisitions. However, they may also be redeemed. A total of 32,513 of these shares were granted to beneficiaries on 1 April 2014: 18,264 were granted to the Management Board (further details may be found in the table titled “Performance Shares” in item 7.4* “Directors’
Dealings”) and 14,249 shares were granted to the Senior Management Group. The fair value of the performance shares as of the grant date (1 April 2014) was € 67.30 per share. This was equivalent to the share price on the Frankfurt Stock Exchange (Xetra) on the trading day preced-ing the grant date. No dividends were considered in the determination of the fair value of the repurchased shares since the Group does not intend to distribute any dividends in the foreseeable future. From the grant date until 31 December 2014, no beneficiary has left MorphoSys and no perfor-mance shares have been forfeited. For the calculation of the personnel expenses resulting from share-based payments under the 2014 LTI plan, it was assumed that one beneficiary will leave the Company during the four-year period.*CROSS-REFERENCE to page 9 5 and page 1 1 9
In 2014, personnel expenses resulting from stock options under the Group’s 2014 LTI plan amounted to € 1,016,776.
7.4 RELATED PARTIESRelated parties that can be influenced by the Group or that can have a significant influence on the Group, can be divided into subsidiaries, mem-bers of management in key positions, and other related entities.
The Group engages in business relationships with members of the Man-agement Board and the Supervisory Board as related parties who are re-sponsible for the planning, management, and monitoring of the Group. In addition to cash compensation, the Group has granted the Management Board convertible bonds and performance shares. The tables below show the shares, convertible bonds and performance shares held by the mem-bers of the Management Board and Supervisory Board, as well as the changes in their ownership during financial year 2014.
SHARES
01/01/2014 Additions Forfeitures Sales 12/31/2014
MANAGEMENT BOARD Dr. Simon Moroney 452,885 40,000 0 40,000 452,885
Jens Holstein 6,500 0 0 4,500 2,000
Dr. Arndt Schottelius 2,000 33,000 0 33,000 2,000
Dr. Marlies Sproll 27,370 1,250 0 0 28,620
TOTAL 488,755 74,250 0 77,500 485,505
SUPERVISORY BOARD Dr. Gerald Möller 9,000 0 0 0 9,000
Dr. Walter Blättler 2,019 0 0 0 2,019
Dr. Daniel Camus 0 0 0 0 0
Dr. Marc Cluzel 0 500 0 0 500
Karin Eastham 1,000 0 0 0 1,000
Dr. Geoffrey Vernon 0 0 0 0 0
TOTAL 12,019 500 0 0 12,519
119F I N A N C I A L S TAT E M E N T S
Notes

CONVERTIBLE BONDS
01/01/2014 Additions Forfeitures Exercises 12/31/2014
MANAGEMENT BOARD Dr. Simon Moroney 147,186 0 0 40,000 107,186
Jens Holstein 90,537 0 0 0 90,537
Dr. Arndt Schottelius 93,537 0 0 33,000 60,537
Dr. Marlies Sproll 93,537 0 0 0 93,537
TOTAL 424,797 0 0 73,000 351,797
PERFORMANCE SHARES
01/01/2014 Additions Forfeitures Allocations 12/31/2014
MANAGEMENT BOARD Dr. Simon Moroney 48,676 5,979 0 0 54,655
Jens Holstein 33,339 4,095 0 0 37,434
Dr. Arndt Schottelius 33,339 4,095 0 0 37,434
Dr. Marlies Sproll 33,339 4,095 0 0 37,434
TOTAL 148,693 18,264 0 0 166,957
MANAGEMENT BOARD REMUNERATION FOR THE YEARS 2014 AND 2013 (IAS 24) :
Dr. Simon Moroney
Chief Executive OfficerJens Holstein
Chief Financial OfficerDr. Arndt Schottelius
Chief Development OfficerDr. Marlies Sproll
Chief Scientific Officer Total
2013 2014 2013 2014 2013 2014 2013 2014 2013 2014
Fixed Compensation 412,049 426,502 279,531 289,335 279,531 289,335 279,531 289,335 1,250,642 1,294,507
Fringe Benefits 67,132 29,444 28,138 33,722 29,143 32,508 21,579 22,828 145,992 118,502
One-Year Variable Compensation 360,543 324,696 244,590 220,271 244,590 215,208 244,590 210,144 1,094,313 970,319
Total Short-Term Employee Benefits (IAS 24.17 (a)) 839,724 780,642 552,259 543,328 553,264 537,051 545,700 522,307 2,490,947 2,383,328
Service Cost 112,221 125,730 78,177 86,866 78,294 86,653 78,170 86,628 346,862 385,877
Total Benefit Expenses - Post-Employment Benefits (IAS 24.17 (b)) 112,221 125,730 78,177 86,866 78,294 86,653 78,170 86,628 346,862 385,877
Multi-Year Variable Compensation*:
2009 Stock Option Plan (Vesting Period 4 Years) 5,704 0 0 0 6,337 0 2,577 0 14,618 0
2010 Convertible Bonds Program (Vesting Period 4 Years) 32,051 6,010 0 0 17,988 3,373 17,988 3,373 68,027 12,756
2013 Convertible Bonds Program (Vesting Period 4 Years) 363,903 310,530 372,759 318,087 249,243 212,687 249,243 212,687 1,235,148 1,053,991
2011 Long-Term Incentive Program (Vesting Period 4 Years) 173,250 40,060 118,666 27,439 118,666 27,439 118,666 27,439 529,248 122,377
2012 Long-Term Incentive Program (Vesting Period 4 Years) 201,177 62,218 137,793 42,615 137,793 42,615 137,793 42,615 614,556 190,063
2013 Long-Term Incentive Program (Vesting Period 4 Years) 177,749 113,270 121,746 77,583 121,746 77,583 121,746 77,583 542,987 346,019
2014 Long-Term Incentive Program (Vesting Period 4 Years) 0 186,964 0 128,057 0 128,057 0 128,057 0 571,135
Total Stock-Based Compensation (IAS 24.17 (e)) 953,834 719,052 750,964 593,781 651,773 491,754 648,013 491,754 3,004,584 2,296,341
Total Compensation 1,905,779 1,625,424 1,381,400 1,223,975 1,283,331 1,115,458 1,271,883 1,100,689 5,842,393 5,065,546
* The fair value was determined pursuant to the regulations of IFRS 2 “Share-based Payments”. This table shows the pro rata share of personnel expenses resulting from stock based compensation for the respective financial year. Further details can be found in Sections 7.1 and 7.3.
120F I N A N C I A L S TAT E M E N T S
Notes

The Supervisory Board of MorphoSys AG does not hold any convertible bonds and performance shares.
The remuneration of the Management Board consists of fixed and variable components as well as other remuneration components. Following the ex-piration of the relevant contract term, the service contracts of the Manage-ment Board members stipulate a non-competition clause for a period of six months. During this period, the Management Board member is entitled to compensation payments amounting to 100 % of the pro rata fixed compen-sation.
In 2014, the total remuneration of the Supervisory Board, excluding reim-bursement for travel costs, amounted to € 514,480 (2013: € 458,280).
While the remuneration of the Management Board and the Supervisory Board as members in key management positions is presented in accor-dance with the provisions of the Corporate Governance Code in the man-agement report, the following tables show the expense-based view in ac-cordance with IAS 24.
MANAGEMENT BOARD REMUNERATION FOR THE YEARS 2014 AND 2013 (IAS 24) :
Dr. Simon Moroney
Chief Executive OfficerJens Holstein
Chief Financial OfficerDr. Arndt Schottelius
Chief Development OfficerDr. Marlies Sproll
Chief Scientific Officer Total
2013 2014 2013 2014 2013 2014 2013 2014 2013 2014
Fixed Compensation 412,049 426,502 279,531 289,335 279,531 289,335 279,531 289,335 1,250,642 1,294,507
Fringe Benefits 67,132 29,444 28,138 33,722 29,143 32,508 21,579 22,828 145,992 118,502
One-Year Variable Compensation 360,543 324,696 244,590 220,271 244,590 215,208 244,590 210,144 1,094,313 970,319
Total Short-Term Employee Benefits (IAS 24.17 (a)) 839,724 780,642 552,259 543,328 553,264 537,051 545,700 522,307 2,490,947 2,383,328
Service Cost 112,221 125,730 78,177 86,866 78,294 86,653 78,170 86,628 346,862 385,877
Total Benefit Expenses - Post-Employment Benefits (IAS 24.17 (b)) 112,221 125,730 78,177 86,866 78,294 86,653 78,170 86,628 346,862 385,877
Multi-Year Variable Compensation*:
2009 Stock Option Plan (Vesting Period 4 Years) 5,704 0 0 0 6,337 0 2,577 0 14,618 0
2010 Convertible Bonds Program (Vesting Period 4 Years) 32,051 6,010 0 0 17,988 3,373 17,988 3,373 68,027 12,756
2013 Convertible Bonds Program (Vesting Period 4 Years) 363,903 310,530 372,759 318,087 249,243 212,687 249,243 212,687 1,235,148 1,053,991
2011 Long-Term Incentive Program (Vesting Period 4 Years) 173,250 40,060 118,666 27,439 118,666 27,439 118,666 27,439 529,248 122,377
2012 Long-Term Incentive Program (Vesting Period 4 Years) 201,177 62,218 137,793 42,615 137,793 42,615 137,793 42,615 614,556 190,063
2013 Long-Term Incentive Program (Vesting Period 4 Years) 177,749 113,270 121,746 77,583 121,746 77,583 121,746 77,583 542,987 346,019
2014 Long-Term Incentive Program (Vesting Period 4 Years) 0 186,964 0 128,057 0 128,057 0 128,057 0 571,135
Total Stock-Based Compensation (IAS 24.17 (e)) 953,834 719,052 750,964 593,781 651,773 491,754 648,013 491,754 3,004,584 2,296,341
Total Compensation 1,905,779 1,625,424 1,381,400 1,223,975 1,283,331 1,115,458 1,271,883 1,100,689 5,842,393 5,065,546
* The fair value was determined pursuant to the regulations of IFRS 2 “Share-based Payments”. This table shows the pro rata share of personnel expenses resulting from stock based compensation for the respective financial year. Further details can be found in Sections 7.1 and 7.3.
121F I N A N C I A L S TAT E M E N T S
Notes

SUPERVISORY BOARD REMUNERATION FOR THE YEARS 2014 AND 2013:
Fixed Compensation Attendance Fees Total Compensation
in €
2014 2013 2014 2013 2014 2013
Dr. Gerald Möller 97,400 94,400 38,000 32,000 135,400 126,400
Dr. Walter Blättler 46,160 43,160 25,200 17,000 71,360 60,160
Dr. Daniel Camus 46,160 43,160 23,200 19,500 69,360 62,660
Dr. Marc Cluzel 46,160 46,160 32,400 23,500 78,560 69,660
Karin Eastham 46,160 40,160 32,400 22,500 78,560 62,660
Dr. Geoffrey Vernon 57,240 57,240 24,000 19,500 81,240 76,740
TOTAL 339,280 324,280 175,200 134,000 514,480 458,280
In the years 2014 and 2013, there were no other long-term benefits in ac-cordance with IAS 24.17 (c) or benefits upon termination of employment in accordance with IAS 24.17 (d) accruing to the Management Board or Su-pervisory Board.
There are presently no other agreements with current or former members of the Supervisory Board.
On 31 December 2014, the Senior Management Group held 169,050 con-vertible bonds (31 December 2013: 300,002 units), no stock appreciation rights (SARs) (31 December 2013: 15,000), and 91,807 performance shares (31 December 2013: 77,558), which were granted by the Company. In 2014, an additional long-term incentive program was granted to the Manage-ment Board and Senior Management Group. As part of this program, the Management Board and Senior Management Group were granted 18,264 and 14,249 performance shares, respectively. No stock options were exer-cised in 2014 (2013: 150,026 stock options). During the same period, 130,952 convertible bonds (2013: no convertible bonds) and 15,000 stock appreciation rights exercised (2013: no stock appreciation rights) were ex-ercised. In 2014, there were no performance shares or convertible bonds forfeited because no beneficiaries had left MorphoSys.
122F I N A N C I A L S TAT E M E N T S
Notes

8 Additional Notes
8.1 OBLIGATIONS ARISING FROM RENTAL, OPERATING LEASES, AND OTHER CONTRACTS
The Group leases facilities and equipment under long-term operating leases. In financial years 2014 and 2013, leasing expenses amounted to € 1,939,537 and € 1,795,316. Key leasing agreements mainly concerned leased buildings. The majority of these contracts can be renewed on a yearly or quarterly basis. Some of these agreements may be terminated prematurely.
Future minimum payments under non-terminable operating leases, insur-ance contracts, as well as other services are composed as follows.
in 000’ €Rent and
Leasing 2014Rent and
Leasing 2013 Other 2014 Other 2013 Total 2014 Total 2013
Up to One Year 2,415 2,536 1,057 830 3,472 3,366
Between One and Five Years 3,142 2,690 5 27 3,147 2,717
More than Five Years 0 0 0 0 0 0
TOTAL 5,557 5,226 1,062 857 6,619 6,083
In financial years 2014 and 2013, total expenses for operating leases and insurance contracts as well as other services amounted to a total of € 3,556,243 and € 3,366,291, respectively.
In addition, the following future payments may become due from cur-rently active, terminable contracts for outsourced studies. However, these amounts may be substantially lower due to the respective contractual clauses in the event of an early termination of the study.
in 000’ € Total 2014
Up to One Year 14,865
Between One and Five Years 53,056
More than Five Years 0
TOTAL 67,921
8.2 CONTINGENT ASSETS/CONTINGENT LIABILITIESContingent liabilities are potential obligations based on past events whose existence is confirmed only when one or more uncertain future events occur which are beyond the control of the Company. Current obligations may represent a contingent liability if there is not sufficient probability for an outflow of resources to justify the recognition of a provision. Moreover, it is not possible to make a sufficiently reliable estimate of the amount of the obligations.
The Management Board is unaware of any proceedings that may result in a significant obligation for the Group and may lead to a material adverse effect on the Group’s net assets, financial position, and results of opera-tions.
If certain milestones are achieved in the Proprietary Development seg-ment, such as the application for an investigational new drug (IND) with regard to specific target molecules, this may trigger milestone payments to licensors. However, no further details can be published since the timing and the achievement of such milestones are uncertain.
If a partner achieves certain milestones in the Partnered Discovery seg-ment, such as the application for an investigational new drug (IND) with regard to specific target molecules, or the transfer of a technology, this may trigger milestone payments to MorphoSys. However, no further de-tails can be published since the timing and the achievement of such mile-stones are uncertain.
8.3 CORPORATE GOVERNANCEThe Group has submitted the Declaration of Conformity with the recom-mendations of the Government Commission on the German Corporate Governance Code for financial year 2014 pursuant to Sec. 161 of the Ger-man Stock Corporation Act (AktG). This declaration was published on 5 December 2014 on the Group’s website (www.morphosys.com) and made permanently available to the public.
8.4 RESEARCH AND DEVELOPMENT AGREEMENTSThe Group has entered numerous research and development agreements as part of its proprietary research and development activities and its part-nered research strategy.
8.4.1 PROPRIETARY DEVELOPMENT SEGMENT
In the Proprietary Development segment, partnerships are directed to-wards the objectives of the Group’s proprietary drug development pro-grams in its core areas of oncology and inflammatory diseases. These partnerships include (in alphabetical order): Celgene, Emergent Biosolu-tions, Galapagos, GlaxoSmithKline, Merck Serono, Temple University, and Xencor.
123F I N A N C I A L S TAT E M E N T S
Notes

In June 2013, MorphoSys and Celgene Corporation announced a global agreement on the joint development of the MOR202 cancer program and its co-promotion in Europe. MOR202 is a fully human monoclonal antibody aimed at the CD38 target molecule for the treatment of multiple myeloma and other blood cancers. In 2013, the compound was in a phase 1/2a clin-ical trial in patients with relapsed/refractory multiple myeloma. MorphoSys and Celgene are co-promoting the further development of MOR202 for the treatment of multiple myeloma and other indications and share the development costs in a ratio of 1/3 to 2/3. This agreement pro-vided for an upfront payment to MorphoSys in the amount of € 70.8 mil-lion, and Celgene acquired additional shares in MorphoSys amounting to € 46.2 million. As part of this cooperation, MorphoSys may receive addi-tional development-related and regulatory and revenue-related milestones as well as tiered, double-digit royalties on net sales outside of the co-pro-motion activities carried out in select European markets. MorphoSys will receive 50 % of the revenues from the co-promotion activities carried out in select European markets.
In August 2014, MorphoSys and Emergent BioSolutions Inc. announced an agreement to jointly develop and commercialize the compound MOR209/ES414. This compound is a bi-specific anti-PSMA/anti-CD3 antibody tar-geting prostate cancer, which was developed by Emergent based on its proprietary ADAPTIRTM platform (modular protein technology). Under this agreement, MorphoSys received the promotion rights worldwide, with the exception of the USA and Canada where Emergent will retain promo-tion rights. Emergent received an upfront payment of US$ 20 million and is eligible to receive potential milestone payments of up to US$ 163 mil-lion. The milestone payments are linked to specific events, including the development of MOR209/ES414 in several indications as well as the ap-proval in various markets. MorphoSys and Emergent will co-develop MOR209/ES414, with MorphoSys assuming 64 % of the development costs and Emergent assuming 36 % of the costs. Emergent will manufacture and supply clinical material from its manufacturing facilities in Baltimore, Maryland/USA. Emergent will receive low single-digit royalties on prod-uct sales in MorphoSys’s sales regions and MorphoSys will receive tiered royalties ranging from the mid single-digits up to 20 % on product sales in Emergent’s sales regions.
In November 2008, MorphoSys and Galapagos announced the beginning of a long-term joint drug discovery and development cooperation. The goal of the cooperation is to explore novel mechanisms for the treatment of in-flammatory diseases and to develop antibody therapies against these dis-eases. The agreement covers all activities ranging from the probing of target molecules to the completion of clinical trials for novel therapeutic antibodies. Subsequent to the demonstration of clinical efficacy in hu-mans, the programs will be out-licensed to partners for further develop-ment, approval, and commercialization. Both companies provided their core technologies and expertise within the scope of the alliance. Along with the use of its adenovirus-based platform for the exploration of new target molecules for the development of antibodies, Galapagos provided access to already identified target molecules that are associated with bone and joint diseases. MorphoSys provided access to its antibody technolo-gies used for generating fully human antibodies directed against these target molecules. Under the terms of agreements, both Galapagos and MorphoSys bear the costs of research and development. In July 2014, the
collaboration advanced into the preclinical development of MOR106, an antibody from MorphoSys’ next-generation antibody library Ylanthia di-rected against a novel Galapagos target molecule. The antibody will be co-developed in the area of inflammatory diseases.
In June 2013, MorphoSys announced that it had entered into a global agreement with GlaxoSmithKline (GSK) to develop and commercialize MOR103. MOR103 is a proprietary HuCAL antibody from MorphoSys against the GM-CSF target molecule. Under the terms of the agreement, GSK assumes responsibility for the entire development and commercial-ization of MOR103. Under the agreement, MorphoSys received an immedi-ate upfront payment of € 22.5 million. Depending on the achievement of certain developmental stages, as well as regulatory, commercial, and rev-enue-related milestones, MorphoSys is eligible to receive additional pay-ments from GSK in the amount of up to € 423 million, as well as tiered double-digit royalties on net sales.
In June 2014, MorphoSys and Merck KGaA announced an agreement to identify and develop therapeutic antibodies against target molecules of the class of immune checkpoints. Under the agreement, both MorphoSys and Merck Serono, the biopharmaceutical division of Merck, aim to co-de-velop forms of therapies that are intended to prompt the immune system to attack tumors. MorphoSys will use its proprietary Ylanthia antibody library and other technology platforms to generate antibodies directed against the selected target molecules. Merck Serono is contributing its broad portfolio and expertise in the field of immuno-oncology and clinical development and will assume full project responsibility starting with phase 1 of clinical development.
In April 2014, MorphoSys agreed to a strategic partnership focused on the discovery of new therapeutic antibodies with the Moulder Center for Drug Discovery Research, a division of the School of Pharmacy at Temple Uni-versity, USA. As part of the cooperation, the Moulder Center receives access to the Ylanthia technology from MorphoSys to validate new dis-ease-related target molecules and to generate therapeutic antibodies directed against these molecules. MorphoSys receives an exclusive option to further develop each antibody resulting from the co-operation. The Moulder Center’s department for new biotherapeutic drug discovery is in-volved with the design of compounds and the optimization of lead candi-dates in various disease areas including cancer, Alzheimer’s disease, car-diovascular, metabolic and viral diseases.
In June 2010, MorphoSys AG and the US-based biopharmaceutical com-pany, Xencor, signed an exclusive global licensing and cooperation agree-ment. Under this agreement, MorphoSys receives exclusive global licens-ing rights to the XmAb5574/MOR208 antibody for the treatment of cancer and other indications. The companies will jointly conduct a phase 1/2a trial in the US in patients with chronic lymphocytic leukemia. MorphoSys will be solely responsible for the further clinical development after the successful completion of the phase 1 clinical trial. Xencor received an up-front payment of US$ 13 million (about € 10.5 million) from MorphoSys, which was capitalized under in-licensed research programs. Xencor is entitled to development, regulatory, and commercially-related milestone payments as well as tiered royalties on product sales.
124F I N A N C I A L S TAT E M E N T S
Notes

In November 2012, as the first activity under the Innovation Capital Initia-tive, MorphoSys announced a partnership with the privately-held biophar-maceutical company, Lanthio Pharma. The Dutch company specializes in the research and development of lanthipeptides. Lanthipeptides are an innovative class of therapeutic substances demonstrating high target mol-ecule selectivity and improved compound properties. The LanthioPep technology of Lanthio Pharma is used to identify peptides that address the disease’s specific point of attack and stabilize the peptides in the optimal conformation for binding them to this receptor. As part of their collabora-tion, MorphoSys and Lanthio Pharma jointly used their technologies to create high quality and diverse lanthipeptide libraries. In 2014, MorphoSys exercised its preferential rights to the exclusive in-licensing of the Lan-thioPep technology for compound discovery.
8.4.2 PARTNERED DISCOVERY SEGMENT
In its commercial partnerships in the Partnered Discovery segment, MorphoSys receives various types of payment which are spread over the term of the agreements or recognized in full as revenue when reaching a predefined target or milestone. These payments include upfront payments upon signature, annual license fees in exchange for access to MorphoSys’s technologies, and payments for funded research to be performed by MorphoSys on behalf of the partner. In addition, MorphoSys is entitled to development-related milestone payments and royalties on product sales for specific antibody compound programs.
Prior to financial year 2014, active collaborations with a number of part-ners had already ended because the original term of the agreements had expired. However, drug development programs initiated in this active phase are designed so that they may continue at the partner’s operations and thus result in performance-based payments for the achievement of the milestones defined. For more detailed information on individual drug can-didates within the various alliances and limited to the information avail-able to the public, please refer to the section of this annual report entitled the “Research and Development” and to the overview of the Group’s drug pipeline. More detailed information on the Group’s individual research al-liances is available on the Group’s website.
Partnerships in the Partnered Discovery segment which were dissolved before the beginning of 2014, but under which drug development pro-grams were still being pursued, include ( in alphabetical order): Astellas, Bayer HealthCare Pharmaceuticals, Boehringer Ingelheim, Daiichi-San-kyo, F. Hoffmann-La Roche, GPC Biotech, Immunogen, Janssen Biotech, Merck & Co., OncoMed Pharmaceuticals, Pfizer, Fibron Ltd. (transfer of the Prochon Biotech Ltd. agreement), and Schering-Plough (a subsidiary of Merck & Co.).
Partnerships that were still active in 2014 include (in alphabetical order): ContraFect, GeneFrontier Corporation/Kaneka, Heptares, and Novartis. Of these partnerships, the collaboration with ContraFect was terminated in 2014.
Since October 2013, MorphoSys has been involved in arbitration proceed-ings with ContraFect Corp. in relation to the contract concluded between the two companies in 2011. The proceedings, initiated by MorphoSys, have since led to an agreement and the termination of the license agreement as per 15 August 2014. As part of the agreement, under which both parties’ outstanding receivables and claims have been settled, ContraFect made a payment to MorphoSys in the amount of € 1 million. This payment was made in the third quarter of 2014.
In February 2013, MorphoSys concluded an alliance with British Heptares Therapeutics Ltd. This cooperation should pave the way for novel thera-peutic antibodies against membrane-constant G protein coupled-receptors (GPCRs). GPCRs are crucial for a variety of biological processes and dis-eases. The agreement involves both of the Group’s segments. Under the terms of the agreement, Heptares will develop stabilized receptors (StaRs) as antigens for a set of GPCR target molecules proposed by MorphoSys. MorphoSys will subsequently apply its Ylanthia antibody library to de-velop therapeutic antibody compounds against these target molecules. Two such projects are currently in the early development phase. MorphoSys has the right to sublicense third parties the access to these target mole-cules in conjunction with therapeutic antibody programs. Heptares will receive upfront and research funding payments and will participate in MorphoSys’s future revenues from related license agreements. Addition-ally, Heptares has the option to develop a therapeutic antibody against a proprietary GPCR target molecule based on MorphoSys’s Ylanthia library. In this context, MorphoSys may receive license fees, milestone payments, and royalties.
Currently, the Group’s most extensive alliance is with Novartis AG. Both parties started working together in 2004, which has led to the creation of several ongoing therapeutic antibody programs against a number of dis-eases. In December 2007, MorphoSys and Novartis significantly expanded their previous relationship and forged one of the most comprehensive stra-tegic alliances in the discovery and development of biopharmaceuticals. The contractually guaranteed annual payments for technology access, in-ternalization charges and R&D services amount to more than € 400 mil-lion over the contractual term of ten years. The total amount of guaranteed payments and probability-weighted performance-based milestones, con-tingent upon the successful clinical development and regulatory approval of several products, could exceed the threshold of € 650 million at the full contractual term of the successful collaboration. In addition to these pay-ments, MorphoSys is also entitled to royalties and/or profit sharing on any future product sales.
In November 2012, MorphoSys and Novartis entered into a cooperation agreement on the use of the new Ylanthia technology platform. This exten-sion of the existing strategic cooperation represents the start of the com-mercialization of Ylanthia and should produce improved antibody candi-dates that can be developed faster than previously possible.
125F I N A N C I A L S TAT E M E N T S
Notes

8.5 SUBSEQUENT EVENTSSubsequent to the end of financial year 2014, there have not been any significant changes in the industry environment. Other events having a material impact on the net assets, financial position, and results of opera-tions have also not occurred since the end of the financial year.
8.6 RESPONSIBILITY STATEMENTWe confirm to the best of our knowledge and in accordance with the appli-cable reporting principles, that the consolidated financial statements give a true and fair view of the assets, liabilities, financial position, and results of operations of the Group, and that the Group Management Report in-cludes a fair review of the development of the business including the re-sults and the position of the Group, together with a description of the prin-cipal opportunities and risks associated with the expected development of the Group.
Martinsried, 17 February 2015
Dr. Simon Moroney Jens HolsteinChief Executive Officer Chief Financial Officer
Dr. Arndt Schottelius Dr. Marlies SprollChief Development Officer Chief Scientific Officer
126F I N A N C I A L S TAT E M E N T S
Notes
Auditor’s Report
We have audited the consolidated financial statements prepared by MorphoSys AG, Martinsried, comprising the consolidated income statement, consolidated statement of comprehensive income, con-solidated balance sheet, consolidated statement of changes in stock-holders’ equity, consolidated statement of cash flows and notes, together with the group management report for the business year from January 1, 2014 to December 31, 2014. The preparation of the consolidated financial statements and the group management re-port in accordance with IFRS, as adopted by the EU, the additional requirements of German commercial law pursuant to Article 315a Section 1 German Commercial Code and supplementary provisions of the articles of incorporation are the responsibility of the Parent Company's Board of Managing Directors. Our responsibility is to express an opinion on the consolidated financial statements and on the group management report based on our audit.
We conducted our audit of the consolidated financial statements in accordance with Article 317 German Commercial Code and Ger-man generally accepted standards for the audit of financial state-ments promulgated by the Institute of Public Auditors in Germany. Those standards require that we plan and perform the audit such that misstatements materially affecting the presentation of the net assets, financial position and results of operations in the consoli-dated financial statements in accordance with the applicable finan-cial reporting framework and in the group management report are detected with reasonable assurance. Knowledge of the business activities and the economic and legal environment of the Group and expectations as to possible misstatements are taken into ac-count in the determination of audit procedures. The effectiveness of the accounting-related internal control system and the evidence supporting the disclosures in the consolidated financial state-ments and the group management report are examined primarily on a test basis within the framework of the audit. The audit in-cludes assessing the annual financial statements of those entities included in consolidation, the determination of the entities to be included in consolidation, the accounting and consolidation prin-ciples used and significant estimates made by the Company’s
Board of Managing Directors, as well as evaluating the overall pre-sentation of the consolidated financial statements and the group management report. We believe that our audit provides a reason-able basis for our opinion.
Our audit has not led to any reservations.
In our opinion, based on the findings of our audit the consolidated financial statements comply with IFRS as adopted by the EU, the additional requirements of German commercial law pursuant to Article 315a Section 1 German Commercial Code and supplemen-tary provisions of the articles of incorporation and give a true and fair view of the net assets, financial position and results of opera-tions of the Group in accordance with these requirements. The group management report is consistent with the consolidated fi-nancial statements and as a whole provides a suitable view of the Group's position and suitably presents the opportunities and risks of future development.
Munich, 18 February 2015
PricewaterhouseCoopersAktiengesellschaftWirtschaftsprüfungsgesellschaft
Dietmar Eglauer Bodo Kleinschrod Wirtschaftsprüfer Wirtschaftsprüfer(German Public Auditor) (German Public Auditor)
127A D D I T I O N A L I N F O R M AT I O N
Auditor’s Report

Glossary
AADCC – Antibody-dependent cell-mediated cytotoxic-ity; a mechanism of cell-mediated immunity whereby an effector cell of the immune system actively de-stroys a target cell that has been bound by specific antibodies
ADCP – Antibody-dependent cellular phagocytosis
ALL – Acute lymphoblastic leukemia; a form of cancer of the white blood cells characterized by excess lym-phoblasts
Antibody – Proteins of the immune system that recognize antigens, thereby triggering an immune response
Antibody library – A collection of genes that encode corresponding human antibodies
Antigen – Foreign substance stimulating antibody production; binding partner of antibody
Autoimmune disease – Disease caused by an im-mune response by the body against one of its own tissues, cells or molecules
BB-ALL – acute lymphoblastic B-cell leukemia, blood cancer affecting white blood cells, subform of ALL
Biosimilars – Term used to describe officially ap-proved new versions of innovator biopharmaceutical products, following patent expiration
Bispecific – Antibody consisting of parts from two different antibodies
CCAR-T technology – New therapeutic approach in which immune cells are reprogrammed
Cash flow – Key performance indicator in the cash flow statement used to assess the financial and earn-ing capacity
CD3 – surface antigen on T cells
CD19 – Therapeutic target for the treatment of B-cell lymphomas and leukemias
CD20 – Therapeutic target for the treatment of B-cell lymphomas and leukemias
CD38 – Therapeutic target for the treatment of mul-tiple myeloma and certain leukemias
Clinical trial – Clinical trials allow safety and efficacy data to be collected for new drugs or devices; depend-ing on the type of product and the stage of its devel-opment, investigators enroll healthy volunteers and/or patients into small pilot studies initially, followed by larger-scale studies in patients
CLL – Chronic lymphocytic leukemia; most common type of cancer of the blood and bone marrow, affect-ing the B-cells
CMO – Contract manufacturing organization
CRO – Contract research organization
CTO – Contract testing organization
DDiscounted cash flow model – Method of valuing assets, especially for due diligence
DLBCL – diffuse large B-cell lymphoma, a subform of NHL
EEMA – European Medicines Agency
FFab format – The antigen binding fragment of the antibody
Fc-engineered – Modification within the Fc part of an antibody to improve effector function
Fc part – Constant part of an antibody known as the Fc (fragment, crystallizable) region
FDA – Food and Drug Administration; US federal agency for the supervision of food and drugs
FL – follicular lymphoma, a subform of NHL
GGCP – Good clinical practice; an inter national ethical and scientific quality standard for designing, con-ducting, recording and reporting trials that involve the participation of human subjects
GLP – Good laboratory practice; a formal framework for the implementation of safety tests on chemical products
GM-CSF – Granulocyte-macrophage colony-stimu-lating factor; underlying target molecule of MOR103 program
GMP – Good management practice; term for the con-trol and management of manufacturing and quality control testing of pharmaceutical products and medi-cal devices
128A D D I T I O N A L I N F O R M AT I O N
Glossary

HHuCAL – Human Combinatorial Antibody Library; pro-prietary antibody library enabling rapid generation of specific human antibodies for all applications
Human – Of human origin
IIFRS – International Financial Reporting Standards; future EU-wide standards produced by the IASB
Immuno-oncology – new class of compounds that stimulate the immune system to attack tumors
Inclusion body myositis – Inflammatory myopathy
Inflammatory diseases – Inflammatory tissue modification, often caused by autoimmune reactions
Innovation capital – Investments in start-ups with technologies and product candidates being close to MorphoSys’s areas of interest
IST – Investigator-sponsored trial; clinical study in which the entire responsibility (sponsor function) is carried by the clinical center and not by a pharmaceu-tical company
LLanthipeptides – Novel class of therapeutics with high target selectivity and improved drug-like proper-ties
Life sciences – All branches of science that study all organisms, especially living ones
MMarket capitalization – Value of a com pany’s out-standing shares, as measured by shares times current price
MCRPC – metastatic castration-resistant prostate cancer
Monoclonal antibody – Homogeneous antibody originating from a single clone, produced by a hybrid-oma cell
Multiple myeloma – Type of cancer that develops in a subset of white blood cells called plasma cells formed in the bone marrow
Multiple sclerosis – Disease of the central nervous system characterized by the destruction of nerve fibers
NNASDAQ Biotech Index – stock market index made up of biotechnological or pharmaceutical companies listed at the US stock exchange NASDAQ
NHL – Non-Hodgkin lymphomas; diverse group of blood cancers that include any kind of lymphoma except Hodgkin’s lymphomas
PPharmacodynamics – Study of the effects of drugs on the body
Pharmacokinetics – Determination of the fate of substances administered externally to a living organ-ism
Preclinic – Preclinical stage of drug development; tests in animal models as well as in laboratory essays
Protein – Polymer consisting of amino acids, e. g. antibodies and enzymes
Psoriasis – A chronic, non-contagious autoimmune disease which affects the skin and joints
RResearch reagents – Substances used in research applications
Rheumatoid arthritis – Inflammatory disease of the joints; abbreviation: RA
Royalties – Percentage share of ownership of the revenue generated by drug products
SScaffolds – Proteins with antibody - like capabilities
sIBM – sporadic inclusion body myositis, inflam-matory myopathy
SLL – small-cell lymphocytic lymphoma, a subform of CLL
Slonomics – DNA engineering and protein library generation platform acquired by MorphoSys in 2010
Small molecules – Low molecular compounds
129A D D I T I O N A L I N F O R M AT I O N
Glossary

TTarget – Target molecule for thera peutic interven-tion, e.g. on the surface of diseased cells
Target product profile (TPP) – Summary of specifi-cations on a planned therapeutic product
Target molecule selectivity – Criteria to describe to what degree an antibody binds to other structures besides its target molecule
TecDAX – Index of the 30 largest technology compa-nies listed on the Frankfurt Stock Exchange
Toxicity – Poisonousness
YYlanthia – The novel next-generation antibody plat-form of MorphoSys
130A D D I T I O N A L I N F O R M AT I O N
Glossary

F I G URE S
List of Figures and Tables
TAB L E S
01 re venues of the morphosys group by segment 0 6
02 organ iz at ional structure of the
morphosys group 1 2
03 cl in ical stud ies w i th morphosys ant ibod ies 14
04 he adcount of the morphosys group 1 8
05 re venue of the morphosys group by reg ion 2 1
06 re venues propr ie tary de velopment and
partnered d iscovery 2 2
07 selected r&d e xpenses 2 3
08 d istr ibut ion of r&d e xpenses 2 4
09 performance of the morphosys share in 20 14 3 6
10 compar ison of the morphosys share pr ice
de velopment w ith benchmark ind ices
be t ween 20 10 and 20 14 3 6
11 occupat ional safe t y at morphosys 4 1
12 qual i t y management system at morphosys 43
13 sen ior i t y 4 4
14 employees by gender in 20 14 4 4
15 l abor turnover r ate 46
16 the r isk and opp ortun it y management
system at morphosys 49
17 compl iance management system (cms) 7 2
01 de velopment of f inanc ial performance ind icators 0 3
02 susta inable de velopment of ke y performance
ind icators (sd kp is) at morphosys 04
03 propr ie tary cl in ical product cand idates 08
04 marke t data from selected phase 2 and phase 3
partnered progr ams 1 0
05 mult iple -ye ar overv ie w – income statement 2 5
06 mult iple -ye ar overv ie w – f inanc ial s i tuat ion 2 6
07 mult iple -ye ar overv ie w – bal ance shee t
structure 2 8
08 compar ison of actual bus iness results
to forecasts 29
09 ke y data for the morphosys share 37
10 analyst recommen dat ions 3 8
11 presentat ion of the ke y short- and med ium -term
r isks at morphosys 5 5
12 summary of the most imp ortant long -term r isks
at morphosys 5 5
13 compos i t ion of the superv isory board 58
14 part ic ipat ion of superv isory board members 60
15 compensat ion of the management board
in 20 14 and 20 13 64
16 compensat ion of the superv isory board
in 20 14 and 20 13 67
17 d irectors ’ hold ings 68
18 d irectors ’ de al ings in 20 14 69
131A D D I T I O N A L I N F O R M AT I O N
List of Figures and Tables
MorphoSys AGLena-Christ-Str. 4882152 Martinsried / PlaneggGermanyPhone: +49-89-89927- 0Fax: +49-89-89927-222www.morphosys.com
8 May 201520 15 annual gener al mee t ing in mun ich
27 July 2015publ icat ion of 20 15 s i x months ’ rep ort
4 November 2015 publ icat ion of 20 15 n ine months ’ report
26 February 2015publ icat ion of 20 14 y e ar - end results
5 May 2015publ icat ion of 20 15 three months ’ report
FINANCIAL CALENDAR
2015