Consolidated Financial Statements for the Fiscal Year ended March ...
Consolidated Financial Statements for the Year Ended March 31, 2013 <Under Japanese GAAP>
May 10, 2013 These financial statements have been prepared for reference only in accordance with accounting principles and practices generally accepted in Japan.
NAGASE & CO., LTD. Stock exchange listing: Tokyo, Osaka (First Sections) Code number: 8012 (http://www.nagase.co.jp) Representative: Hiroshi Nagase, Representative Director and President Contact: Masanori Furukawa, General Manager, Corporate Accounting Division Tel: +81-3-3665-3103 Annual General Meeting of Stockholders (scheduled): June 26, 2013 Start of Distribution of Dividends (scheduled): June 27, 2013 Securities Report Filing (scheduled): June 27, 2013 Supplementary Documents: Yes Investors' Meeting: Yes
(Note: Amounts have been rounded down to the nearest million yen.)
1. Consolidated Results for the Year Ended March 31, 2013 (April 1, 2012 to March 31, 2013)
(1) Consolidated Operating Results (% = year-on-year change)
Net sales Operating profit Ordinary income Net income
Millions of yen % Millions of yen % Millions of yen % Millions of yen %
FYE March 2013 666,272 5.4 15,578 16.0 17,927 14.3 14,182 65.5FYE March 2012 631,854 (4.3) 13,427 (28.3) 15,690 (23.9) 8,570 (33.2)
(Notes) Comprehensive income FYE March 2013: ¥27,222 million (273.8%)
FYE March 2012: ¥7,282 million (20.8% decrease)
Earnings per
share Earnings per
share (diluted) Return on equity
Ordinary income/ total assets
Operating income/ net sales
Yen Yen % % %
FYE March 2013 111.31 6.5 3.8 2.3FYE March 2012 66.69 4.2 3.8 2.1
(Reference) Equity in earnings of affiliates FYE March 2013: ¥933 million
FYE March 2012 ¥368 million
(2) Consolidated Financial Position
Total assets Net assets Net worth ratio Net assets per share
Millions of yen Millions of yen % Yen
FYE March 2013 486,747 237,806 46.9 1,803.31FYE March 2012 450,842 212,744 45.4 1,592.87
(Reference) Equity capital FYE March 2013: ¥228,505 million
FYE March 2012: ¥204,706 million
(3) Consolidated Cash Flows
Cash flows from
operating activities Cash flows from
investing activities Cash flows from
financing activities
Cash and cash equivalents, end of the
year
Millions of yen Millions of yen Millions of yen Millions of yen
FYE March 2013 18,576 (9,529) 1,164 45,816FYE March 2012 5,690 (81,066) 56,961 28,517

2. Dividends
Annual dividend per share Total dividends
paid
(full fiscal year)
Payout ratio
(consolidated)
Dividends/
net assets
(consolidated)1Q 2Q 3Q
FiscalYear End
Annual
Yen Yen Yen Yen Yen Millions of yen % %
FYE March 2012 12.00 12.00 24.00 3,084 36.0 1.5FYE March 2013 13.00 13.00 26.00 3,294 23.4 1.5
FYE March 2014 (estimate) 14.00 14.00 28.00 24.5
3. Projected Consolidated Results for the Fiscal Year Ending March 31, 2014
(April 1, 2013 to March 31, 2014)
(% = year-on-year change)
Net sales Operating profit Ordinary income Net income Earnings per
share
Millions of yen % Millions of yen % Millions of yen % Millions of yen % Yen
2Q (cumulative) Full fiscal year 764,000 14.7 19,200 23.2 21,000 17.1 14,500 2.2 114.43
(Note) As the Company only discloses full-year earnings targets, we have omitted presentation of interim consolidated results
here.
* Notes (1) Changes in major subsidiaries during the period (changes in specified subsidiaries accompanying changes in the
scope of consolidation): No New: ― (Company name: ) Excluded: ― (Company name: ) (2) Changes of accounting policies or presentation methods in the consolidated financial statements
i. Changes in accordance with revisions to accounting and other standards: No ii. Changes in items other than (i) above: Yes iii. Changes in accounting estimates: Yes iv. Restatement of prior period financial statements after error corrections: No (Note) For details, see page 23, “3. Consolidated Financial Statements (6) Changes in Basic Matters related to the
Preparations of Consolidated Financial Statements.” (3) Number of shares issued and outstanding (common stock)
i. Number of shares issued and outstanding as of the fiscal period end (including treasury stock) March 31, 2013 138,408,285 shares March 31, 2012 138,408,285 shares
ii. Number of treasury stock as of the fiscal period end
March 31, 2013 11,693,809 shares March 31, 2012 9,893,787 shares
iii. Average number of shares during the period: March 31, 2013 127,406,786shares March 31, 2012 128,514,527shares
* Disclosure of Audit Procedure Progress This earnings report is exempt from audit procedures as provided by the Financial Instruments and Exchange Act. Consolidated financial statements were undergoing the audit process at the time of the release of this report. * Cautionary Statement with Respect to Forecasts of Consolidated Business Results Earnings forecasts presented in this document are based on information available and assumptions deemed rational at the time. Actual performance could differ materially from forecasts due to a variety of factors. Please refer to “1. Business Performance” on pages 2 through 9 of the attached supplementary documents for further information.
NAGASE & Co., Ltd. (8012)
Consolidated Financial Statements for the Fiscal Year Ended March 31, 2013
- 1 -
Attachments
1. Business Performance ................................................................................................................. 2
(1) Analysis of Business Performance ........................................................................................ 2
(2) Analysis of Financial Position. .............................................................................................. 6
(3) Dividend Policy and Dividends for the Fiscal Years Ended March 2013 and March 2014 ............................................................................................................................ 7
(4) Operating and Other Risks .................................................................................................... 7
2. Management Policies ................................................................................................................ 10
(1) Basic Management Policy ................................................................................................... 10
(2) Management Objectives and Medium-Term Strategies ...................................................... 10
(3) Issues to be Addressed by the Company ............................................................................. 11
3. Consolidated Financial Statements. .......................................................................................... 13
(1) Consolidated Balance Sheets ............................................................................................... 13
(2) Consolidated Statements of Income and Consolidated Statements of Comprehensive Income ................................................................................................................................. 15
(3) Consolidated Statement of Change in Shareholders' Equity ................................................ 18
(4) Consolidated Statements of Cash Flows .............................................................................. 21
(5) Assumption for Going Concern ........................................................................................... 23
(6) Changes in Basic Matters related to the Preparations of Consolidated Financial Statements ........................................................................................................................... 23
(7) Notes related to Consolidated Financial Statements ............................................................ 24
(Segment Information,etc.) .................................................................................................. 24
(Per-Share Data) .................................................................................................................. 30
(Significant Subsequent Events) .......................................................................................... 30
4. Other ......................................................................................................................................... 31
Financial Highlights (Consolidated) .................................................................................... 31

NAGASE & Co., Ltd. (8012)
Consolidated Financial Statements for the Fiscal Year Ended March 31, 2013
- 2 -
1. Business Performance
(1) Analysis of Business Performance
(Performance for the Fiscal Year Ended March 2013)
a. General Summary of Results
During the past fiscal year, the global economy experienced growing demand for smartphones and tablets, as well as stronger economies in Southeast Asia and North America. Negative customer sentiment in Japan, economic stagnation in the European Union, and slowing growth and anti-Japan demonstrations in China combined to make for wide gaps among countries and regions in economic performance. Lately, we have seen some small signs of economic recovery in Japan. Export business is improving and share prices have gained strength with the weakening of the yen. Still, these improvements had little impact on helping our consolidated earnings for the fiscal year under review.
In this environment, the Company recorded domestic sales of ¥361.97 billion (1.2% year-on-year decline) and overseas sales of ¥304.3 billion (14.6% increase), resulting in total net sales of ¥666.27 billion, representing a 5.4% increase year on year.
The addition of Hayashibara Co., Ltd. (Hayashibara) to the consolidation and the strong performance in smartphone and tablet materials sales led to gross profit of ¥82.58 billion (15.3% year-on-year increase). Gross profit ratio grew 1.1 points to 12.4% for the comparative period. The larger number of consolidated subsidiaries meant greater selling expenses and general and administrative expenses. Losses among subsidiaries worsened, which was another factor pressuring profits. However, lower depreciation and amortization (Changes in depreciation methods for property, plant and equipment) offset these factors. As a result, the Company recorded operating profit of ¥15.57 billion, which was a 16.0% increase year on year. The Company recorded ordinary income of ¥17.92 billion, a 14.3% year-on-year increase. This result was mainly due to increased interest expense related to the Company’s acquiring long-term funds for the purchase of Hayashibara, offsetting income gained from equity in earnings of affiliates. In addition, the Company recorded impairment losses (¥1.89 billion) for unprofitable production equipment at manufacturing subsidiaries. Other major factors affecting profits included gain on sales of non-current assets (¥3.35 billion) for sales of land and increase of deferred tax assets (¥1.42 billion) related to recoverable tax losses of Hayashibara.by revised business plan. As a result, net income amounted to ¥14.18 billion, which was a 65.5% year-on-year increase.
b. Segment Summary
Beginning April 2012, the Company has been executing on the “Change-S2014” three-year business plan. To accomplish the goals set out in this plan, the Company reorganized four business segments (Chemicals, Plastics, Electronics, and Life Sciences) away from product categories into segments to more fully concentrate the strengths of our entire group, reflecting the respective positions of each business in the value chain, as well as with the most closely aligned industries. This realignment has resulted in five segment categories: Functional Materials (located at the top of the value chain), Advanced Materials & Processing (located in the next stage of the value chain), Electronics, Automotive & Energy, and Life & Healthcare (these last three segments functioning across all industries). See“3. Consolidated Financial Statements (7) Notes related to Consolidated Financial Statements (Segment Information, etc.)” for more detail regarding business segments, related industries, and products.
For presentation purposes, the Company has calculated prior year consolidated figures and ratios according to the segment classifications above for comparison.
Functional Materials
Overall, net sales in the Functional Materials segment experienced marginal growth. The decrease in net sales in the domestic market and in Northeast Asia was offset by significantly higher net sales in Southeast Asia.
Our performance chemicals business reported minor overall gains in net sales. As plastic materials and additives sales to Asia fell, sales of urethane materials to the automotive industry also declined due to anti-Japanese
NAGASE & Co., Ltd. (8012)
Consolidated Financial Statements for the Fiscal Year Ended March 31, 2013
- 3 -
sentiment in China. In contrast, the Company saw strong performance in coating raw materials sales for the domestic construction market, strong performance in basic chemicals in Southeast Asia, and higher sales of additives to the Middle East. These gains served to outpace the declines noted above.
Sales decreased overall in our specialty chemicals business. Surfactant sales were strong for the period; however, raw materials for industrial oil solutions (automotive & textile market) and fluorochemicals sales both fell compared to the prior fiscal year. At the same time, precision abrasive materials sales for the hard disk drive market underperformed year on year. As a result, net sales for the Functional Materials segment amounted to ¥180.02 billion, which was a ¥2.89 billion (1.6%) increase year on year. Segment operating profit came in at ¥5.42 billion, a ¥850 million (13.6%) decline year on year. This decline was mainly due to gross profit declines stemming from lower revenues in Japan and Northeast Asia, not fully offset by revenue gains and slightly higher profits in Southeast Asia.
Advanced Materials & Processing
The Advanced Materials & Processing segment saw minor overall performance declines during the period. While net sales grew in Northeast Asia and Southeast Asia, these gains were offset by decreases in domestic performance.
The colors and imaging business reported declines overall. The dyes/additives business and information printing materials business showed comparative performance declines, while the Company’s reorganization of certain businesses into equity method affiliates (including dyestuffs and textile processing agents for the textile processing industry) contributed to lower sales performance.
Our plastic business for office equipment and appliance increased overall. While we did experience lower domestic sales and raw materials exports to major users, plastic sales in Asia were stronger year on year, as were exports of molding tools.
As a whole, our business related to functional films and sheets and plastic molding products reported lower net sales. Sales of anti-reflective sheets for game machines experienced higher performance year on year. However, sales of liquid crystal polarizer film precision inspection systems underperformed prior year results by a slight margin.
As a result, net sales for the Advanced Materials & Processing segment amounted to ¥214.54 billion, a decrease of ¥3.38 billion (1.6%) compared to the prior fiscal year. The Segment reported operating profit of ¥2.38 billion, which represented a ¥590 million (19.9%) year-on-year decline. The Segment attributed this decline mainly to lower gross profit from revenue declines and worsened operating profit results among manufacturing subsidiaries in the office equipment and appliances business.
Electronics
Sales in the Electronics segment increased overall for the period. The Company reported large net sales gains in Northeast Asia, with growth in Japan, Southeast Asia, Europe, and North America as well.
Net sales in the electronic chemicals business declined overall. We noted strong performance in sales for mobile phone applications in our formulated epoxy resin business for the period. However, a decline in sales of chemicals used in the manufacture of semiconductors and LCD panels led to the drop in overall performance.
The Electronic Materials business recorded sales declines for film used in LCDs and materials in LED lighting applications during the period. In contrast, we noted strong performance in touch-panel material sales, which contributed to overall wide gains in sales for the electronics materials business.
As a result, we recorded total net sales of ¥116.1 billion in this segment, representing a ¥5.6 billion (5.1%) increase year on year. Operating profit amounted to ¥6.29 billion, which was a ¥270 million (4.6%) year-on-year increase, due to gross profit increases stemming from higher net sales of touch-panel materials.

NAGASE & Co., Ltd. (8012)
Consolidated Financial Statements for the Fiscal Year Ended March 31, 2013
- 4 -
Automotive & Energy
Our automotive-related business saw growth overall during the period. During the first half of the fiscal year, sales of auto product increased significantly owing to reconstruction demand in the wake of March 11, eco-car subsidies, and other domestic factors. Overseas as well, the Japanese auto makers produced cars in higher numbers. These factors contributed to strong performance in raw materials and component sales for automotive industry both in Japan and overseas. However, domestic sales for the second half of the year fell sharply, owing to the end of eco-car subsidies. As well, Japanese auto makers saw lower production in China due to anti-Japanese demonstrations in that country. These factors led to lower net sales in Japan and China. However, strong performance in North America and the ASEAN countries contributed to overall growth for the segment.
As a result, segment net sales for the fiscal year amounted to ¥83.06 billion, representing a ¥6.95 billion (9.1%) increase year on year. Operating profit amounted to ¥760 million, a decline owing mainly to poor performance in the energy business, despite profitability in export transactions in the fourth quarter due to the weakened yen. This result was ¥170 million lower (18.4%) than the prior fiscal year.
Life & Healthcare
Consolidating the functional saccharides business of Hayashibara (acquired during the previous fiscal year; net sales of ¥24.41 billion for the fiscal year ended March 2013), the Company saw significant overall growth in this segment.
Sales in the fine chemicals business grew overall compared to the prior fiscal year. Sales of pharmaceutical raw materials and intermediates were level year on year, while in vitro diagnostics and medical materials experienced strong performance. Functional saccharide sales performed well, particularly sales of trehalose for the food industry. We also saw strong sales of enzyme and fermentation products in the food and starch saccharide market.
Our beauty care products business includes sales of cosmetics and health foods. New product launches in health foods and whitening cosmetic products led to sales growth for the year. However these gains were more than offset by lower year-on-year sales of cosmetics products introduced during the prior fiscal year.
As a result, segment net sales amounted to ¥71.68 billion for the fiscal year, which was a ¥22.51 billion (45.8%) increase year on year. Operating profit amounted to ¥3.98 billion, representing a ¥3.27 billion (464.1%) increase year on year. This gain in operating profit was mainly due to the new consolidation of Hayashibara's functional saccharides business.
Other
No special matters to disclose.
(Forecast for the Fiscal Year Ending March 2014)
(Millions of yen)
Net sales Operating profit Ordinary income Net income
Year ending March 31, 2014 764,000 19,200 21,000 14,500
Year ended March 31, 2013 666,272 15,578 17,927 14,182
Change +14.7% +23.2% +17.1% +2.2%
NAGASE & Co., Ltd. (8012)
Consolidated Financial Statements for the Fiscal Year Ended March 31, 2013
- 5 -
a. Performance Forecast for the Fiscal Year Ending March 2014
Taking into account the weakened yen and related export growth, increased activity at Japanese manufacturers, an improving economy, and stock price rebounds, we expect more positive consumer sentiment in fiscal 2013. At the same time, we believe that business in North America and ASEAN countries will stabilize. In contrast, the long-lived financial crisis in the European Union has no apparent end in sight, causing concerns about intra-Union commerce and product exports to the region.
In light of these conditions, we have set expectations for earnings at ¥764.0 billion in consolidated net sales (14.7% year-on-year growth), with gross profit at ¥93.4 billion (13.1% increase). Despite a projected increase in retirement benefits for employees associated with amortizing actuarial differences in retirement benefit obligations, we expect net sales and gross profit growth to drive operating profit gains. As such, we have set operating profit projections at ¥19.2 billion (23.2% year-on-year increase), with ordinary income projected to be ¥21.0 billion (17.1% increase). We have set net income expectations at ¥14.5 billion (2.2% increase), since we do not foresee any special factors (e.g. last fiscal year's added deferred tax assets) affecting net profits.
The figures above have been calculated using a currency conversion rate of ¥95 to the US dollar.
b. Forecast by Business Segment
We have moved certain businesses to other segments for the next-period operations. We have moved abrasives sales business for the semiconductor and HDD industries formerly under the Functional Materials segment to the Electronics segment, which is positioned closer to the end user. This should allow us to develop new markets and applications for these products. We have also moved raw materials sales business for the cosmetics industry formerly under the Functional Materials segment to the Life & Healthcare segment. We believe this will help the Company produce synergistic effects with the newly acquired Hayashibara products.
We have calculated next-period figures and current-period ratios reflecting these organizational changes.
In addition to growth in the smartphone and tablet markets, we project a recovery in production units for office equipment, appliances, and automobiles. Given this, we expect to see an increase in sales for related parts and components. Accordingly, we forecast net sales of ¥181.0 billion (9.2% year-on-year increase) in Functional Materials, ¥255.0 billion (18.9% increase) in Advanced Materials & Processing, ¥149.0 billion (19.7% increase) in Electronics, ¥94.0 billion (13.2% increase) in Automotive & Energy, and ¥84.0 billion (8.4% increase) in Life & Healthcare.
Next-period forecasts are based on information available at the time they were calculated. Actual future earnings may differ from forecast due to a variety of factors, including, but not limited to, overseas and domestic business conditions, foreign exchange rate fluctuations, etc.
(Millions of yen)
FYE March 2013
Actual (before reorganization)
FYE March 2013 Actual (after
reorganization)
FYE March 2014 Forecast
Change
Functional Materials 180,025 165,812 181,000 +9.2%
Advanced Materials & Processing
214,546 214,546 255,000 +18.9%
Electronics 116,105 124,488 149,000 +19.7%
Automotive & Energy 83,068 83,068 94,000 +13.2%
Life & Healthcare 71,685 77,516 84,000 +8.4%
Other 841 841 1,000 +18.9%
Total Sales 666,272 666,272 764,000 +14.7%

NAGASE & Co., Ltd. (8012)
Consolidated Financial Statements for the Fiscal Year Ended March 31, 2013
- 6 -
(2) Analysis of Financial Position
a. Summary of Consolidated Balance Sheets
As of the end of the fiscal period, current assets amounted to ¥305.75 billion. This represents an increase of ¥23.47 billion compared to the end of the prior consolidated fiscal year. This increase was mainly due to increases in cash and time deposits resulting from accumulated liquidity on hand and increases in inventories. Non-current assets increased ¥12.43 billion compared to the end of the prior fiscal year, reaching ¥180.99 billion. This increase was mainly due to increase of property, plant and equipment (purchases of land and buildings) and increased investments in securities stemming from market price recoveries. As a result, total assets at the end of the fiscal year amounted to ¥486.74 billion, which was an increase of ¥35.9 billion compared to the end of the prior fiscal year.
Despite a decrease in loans, unsecured bond issuances led to a ¥10.84 billion increase in liabilities over the end of the prior fiscal year. At the end of the consolidated fiscal year, the Company had ¥248.94 billion in liabilities.
Net assets amounted to ¥237.8 billion at the end of the consolidated fiscal year, representing an increase of ¥25.06 billion compared to the end of the prior year. This increase was mainly due to the Company's recording ¥14.18 billion in net income and improved translation adjustments stemming from the weakened yen.
As a result, the Company experienced a 1.5-point increase in shareholders' equity ratio, up to 46.9% as of the end of the consolidated fiscal year.
b. Summary of Consolidated Cash Flows
Cash and cash equivalents (“Cash”) increased by ¥12.66 billion compared to the prior fiscal year. Cash from operating activities amounted to ¥18.57 billion. Cash used in investing activities amounted to a net outflow of ¥9.52 billion, while cash from financing activities amounted to ¥1.16 billion. The Company saw an additional ¥910 million in new funding via newly consolidated entities and also recorded an increase in cash flows of ¥3.72 billion due to changes in fiscal years of consolidated subsidiaries. As a result, consolidated Cash increased by ¥17.29 billion (+60.7%) compared to the end of the prior consolidated fiscal year, amounting to a total of ¥45.81 billion.
(Cash Flows from Operating Activities)
Cash flows from operating activities for the consolidated fiscal year amounted to ¥18.57 billion. This increase was mainly due to net income before income taxes and minority interests of ¥19.45 billion, offsetting ¥6.38 billion in income tax payments. In addition, the Company recorded ¥7.44 billion in depreciation and amortization, which has no effect on cash flows.
(Cash Flows from Investing Activities)
Cash used in investing activities during the consolidated fiscal year amounted to ¥9.52 billion. The Group sold ¥3.23 billion in property, plant, and equipment, but paid ¥12.26 billion for tangible and intangible fixed assets during the period.
(Cash Flows from Financing Activities)
Cash flows from financing activities for the consolidated fiscal year amounted to ¥1.16 billion. This result was mainly due to cash inflow from unsecured corporate bond issuances in the amount of ¥29.85 billion, offset by repayments of loans in the amount of ¥27.83 billion.

NAGASE & Co., Ltd. (8012)
Consolidated Financial Statements for the Fiscal Year Ended March 31, 2013
- 7 -
FYE March
2009 FYE March
2010 FYE March
2011 FYE March
2012 FYE March
2013
Net worth ratio 54.1% 53.1% 53.7% 45.4% 46.9%
Net worth ratio based on market value
28.7% 40.8% 33.9% 29.2% 29.9%
Interest-bearing debt to cash flow ratio
0.9 years 0.8 years 2.5 years 15.6 years 5.3 years
Interest coverage ratio 36.0 44.7 19.5 8.9 17.7
(Notes) Net worth ratio: Equity capital/total assets
Net worth ratio based on market value: Market capitalization/total assets
Interest-bearing debt to cash flow ratio: Interest-bearing debt/operating cash flow
Interest coverage ratio: Operating cash flow/interest payments
* Indicators are calculated based on consolidated figures. * Market capitalization is calculated using the closing price at the end of the year multiplied by the number of
outstanding shares at the end of the year (less treasury stock at cost). * Operating cash flow is net cash provided by operating activities as shown in the consolidated statements of cash
flows. Interest-bearing debt is all liabilities for which interest is payable as presented in the consolidated balance sheets. Interest payments are the amount of interest paid as presented in the consolidated statements of cash flows.
(3) Dividend Policy and Dividends for the Fiscal Years Ended March 2013 and March 2014
Our basic policy is to continue paying a stable dividend to our shareholders in line with our consolidated results as we improve our earnings power and management structure. We look to improve per-share dividends based on considerations of consolidated payout ratio and consolidated dividend to equity ratio. We also plan to use funds from internal reserves effectively in our business activities and to build a stronger management foundation.
The Nagase Group declared a year-end dividend of ¥13 per share based on this policy, resulting in a scheduled full-year cash dividend of ¥26 per share.
We forecast a full-year dividend of ¥28 per share for the next fiscal year, consisting of a ¥14 per share interim dividend and a ¥14 per share year-end dividend.
(4) Operating and Other Risks
The Nagase Group is engaged in trading, marketing, research and development, manufacturing and processing in six business segments across the world: Functional Materials, Advanced Materials & Processing, Electronics, Automotive & Energy, Life & Healthcare, and Other. The nature of these businesses entails various risks that may have a material effect on investment decisions. We provide a discussion of the major risks below.
Any forward-looking statements are based on management decisions as of the end of fiscal year under review.
a. Overall Operating Risk
The Nagase Group is engaged in activities that rely on the use of chemicals across a wide spectrum of products and services through our Functional Materials, Advanced Materials & Processing, Electronics, Automotive & Energy and Life & Healthcare business. These products and services include dyes/pigments, coating materials/inks, surfactants, OA, electrical equipment, home electronics, automobiles, LCDs, semiconductors, and pharmaceutical/medical applications. Accordingly, significant changes in domestic and international commercial chemicals industry could affect the Nagase Group's earnings and financial condition.
NAGASE & Co., Ltd. (8012)
Consolidated Financial Statements for the Fiscal Year Ended March 31, 2013
- 8 -
b. Product Market Conditions
The Nagase Group relies heavily on petrochemicals manufactured from naphtha in our Functional Materials, Advanced Materials & Processing, and Automotive & Energy segments. Raw materials markets and demand-supply balance are two factors that result in unique market circumstances for each of our products. Fluctuations in these factors could affect our revenues and profits in related product lines. Some products manufactured by the Group use raw materials derived from grains. Raw materials costs fluctuate widely due to changes in grain market prices; we may not be able to pass on increased raw materials costs through higher sales prices, which could affect our profits in related product lined.
c. Impact of Fluctuations in Foreign Currency Exchange Rates
The Nagase Group conducts import/export as well as non-trade business transactions denominated in foreign currencies. Fluctuations in currency markets have a significant impact when prices are converted to yen. While the Group executes exchange contract hedges for these transactions to minimize exchange rate risk to the greatest extent possible, currency exchange rate fluctuations could have a significant impact on Group earnings and financial conditions. The Nagase Group owns foreign-domiciled corporations whose financial statements are prepared using local currencies. The conversion of these currencies to Japanese yen for consolidated reporting purposes entails currency conversion risk due to fluctuating exchange rates.
d. Impact of Fluctuations in Interest Rates
The Nagase Group obtains funds for operating and financing activities through loans from financial institutions; some of these loans are interest-bearing debt including variable interest terms. The Group reduces interest rate fluctuation risk related to variable interest loans by utilizing interest-rate swap contracts. Group earnings and financial conditions may be affected by future interest rate trends.
e. Risks Involved in Operating Overseas
A significant and increasing percentage of Nagase Group sales and manufacturing are conducted overseas in locations such as China, Southeast Asia, Europe, and the United States. While Group management keeps a close eye on local trends and conditions in order to respond appropriately, unforeseen events stemming from local government regulations, business customs, or other influences could have a significant impact on Group business performance and financial conditions.
f. Impact of Changes in Stock Prices
The Nagase Group maintains a portfolio of marketable securities, primarily equity shares of companies doing business with the Group. These equity investments are subject to share price fluctuation risks. As a matter of policy, the Nagase Group reduces risk by continuously reviewing and reorganizing its shareholdings. However, changes in share prices could impact Group earnings and financial condition. A decline in share prices could damage the value of pension plan assets managed by the Group, increasing retirement benefit costs and thereby reducing Group profits.
g. Counterparty Credit Risk
The Nagase Group extends credit to domestic and overseas purchasers in connection with various transactions. As a matter of policy, the Nagase Group reduces credit risk by obtaining guarantees and collateral according to the financial condition of the purchaser. Although the Nagase Group strives to ensure stable, uninterrupted product procurement, financial weakness or bankruptcies among suppliers or others could damage the Group's ability to procure goods. Such circumstances could have a significant impact on the Group's earnings and financial condition.
h. Risk of Investments
The Nagase Group business is based on brokered transactions. At the same time, the Group continues to look for new high-value business opportunities. Accordingly, we support the Nagase R&D Center and domestic

NAGASE & Co., Ltd. (8012)
Consolidated Financial Statements for the Fiscal Year Ended March 31, 2013
- 9 -
manufacturing subsidiaries in their pursuit of new business through proactive investment and strategic mergers and acquisitions, using advanced technologies and information-gathering capabilities as leverage.
As a result of pursuing new business, the Group will be exposed to greater risk than were we to follow a conventional brokered business model. The book value of business assets and intangible fixed assets (goodwill, etc.) when acquiring other companies becomes an important management topic. If future cash flows from new businesses underperform projections, and the Group records correlating impairment losses, such losses may have a significant impact on Group earnings and financial condition.
i. Product Quality Risk
The Nagase Group operates the Nagase R&D Center and domestic manufacturing subsidiaries to offer high-value-added products to our customers. We pay detailed attention to the quality of the technologies and products that bear the name of Nagase and our affiliates. We also bear manufacturers' liability for products that we handle as an importer, and accordingly treat these products with the same attention to detail and quality as if they were made in our own facilities. However, product defects could result in cessation of sales and/or product recalls, exposing the Nagase Group to liability for damages, which could have a significant impact on Group earnings and financial conditions.
j. Risks of Handling Various Chemicals
The Nagase Group imports and exports a variety of chemicals in the performance of our main business lines. To maintain international peace and safety, the chemicals we export are subject to different laws, including the Foreign Exchange and Foreign Trade Control Law and the Export Trade Control Order. Imports are subject to the Chemical Substances Control Law and other related statutes. To ensure compliance, the Group has established the Security Trade Control Committee and the Item Compliance Committee. While these committees are charged with assuring compliance to both Japanese law and the various chemical control regulations of China, Southeast Asia, Europe, the United States and other regions, violation of such laws and statutes could result in restrictions on Group business activities, having a significant impact on Group earnings and financial condition.
k. Risks of Natural Disasters
The Nagase Group has put emergency response systems in place, including the creation of a business contingency plan, the adoption of safety confirmation systems, the creation of a disaster-response manual, earthquake-response measures, disaster-response training, and other measures to deal with natural disasters. However, as we conduct business across a great number of countries and regions, we are exposed to the risk of major natural disasters, H1N1 influenza and other communicable diseases, and other emergencies that could disrupt our supply chain. Such disruptions could prevent us from selling our products or damage the manufacturing capabilities of important Group facilities. Such interruptions would result in opportunity loss, and could have a significant impact on Group earnings and financial condition.

NAGASE & Co., Ltd. (8012)
Consolidated Financial Statements for the Fiscal Year Ended March 31, 2013
- 10 -
2. Management Policies
(1) Basic Management Policy
<Management Philosophy>
The Nagase Group is a member of the world society. As such, it is our duty to maintain good and fair business practices and, through continued growth and development, provide society with the goods and services needed while improving the welfare of our employees.
Consistent with this management philosophy, we believe our most important goal is to contribute to society, including efforts to maintain good and fair business practices, while ensuring continued growth and development.
Guided by our Group slogan to be a “technology- and intelligence-oriented company that turns wisdom into business,” we strive to become a unique company that combines the functions of a trading company with that of manufacturing, taking advantage of technologies and wisdom, tempered by experience. We will continue to create stronger functions and offer better business solutions as we become our customers' partner of choice in business.
(2) Management Objectives and Medium-Term Strategies
Based on this management philosophy, we created the following objectives and strategies as we work toward our vision for the future.
• Allow stakeholders to realize their dreams and ideals through our business • Continue to grow and increase value, using our strengths in technology • Anticipate changes in the market structure and environment, growing together with our customers as we offer
unique solutions • Contribute to making a better society and global environment
The Nagase Group believes that we must further accelerate the organizational and operational changes we pursued to date under our “CHANGE” 11 medium-term business plan. This is the only way that we can reach our vision for Nagase in a business environment where structural and qualitative changes are happening faster every day. Based on the recognition, the Company launched our Change-S2014 three-year medium-term business plan in April 2012 and we have positioned the business plan as to promote Acceleration of Change.
Under Change-S2014, our basic strategic goals are to accelerate the improving quality of our business and operations (Speed up), to bring e total strength of the Nagase Group to bear throughout the value chain in our strategic markets (Step up), and to expand our unique solutions globally, creating sustained growth (Sustainable growth). Executing on these basic strategies, the Company reorganized four business segments away from product categories, reflecting the respective positions of each business in the value chain, as well as with the most closely aligned industries. This realignment has resulted in five segment categories: Functional Materials (located at the top of the value chain), Advanced materials & Processing (located in the next stage of the value chain), Electronics, Automotive & Energy, and Life & Healthcare (these last three segments functioning across all industries). The Company is working to accelerate“ CHANGE”, guided by a goal to promote globalization and create high-value-added businesses. We plan to take maximum advantage of our Group strengths, improving existing businesses and creating new ones in the Bio, Environment and Energy, and Electronics fields. We will combine segment functions with our Group-wide foundation of technologies as one means to put our comprehensive capabilities to best use.
Another task for the Group is to improve our management foundation in order to respond to the changing external environment and evolution of the Group's business structure.
We have set performance indicators to achieve in the final year (fiscal year ending in March, 2015) of our Change-S2014 plan: Consolidated net sales of ¥800 billion, consolidated operating profits of ¥30 billion and a

NAGASE & Co., Ltd. (8012)
Consolidated Financial Statements for the Fiscal Year Ended March 31, 2013
- 11 -
return on equity of 8.0%. We will also be investing ¥40 billion in certain areas over the three years of this plan to achieve qualitative change in our operations and to grow our business.
(3) Issues to be Addressed by the Company
We began executing on our new Change-S2014 three-year plan in April 2012. Under this plan, we have defined Group-wide initiatives to address issues of creating stronger capabilities in core businesses and a stronger management foundation, based on the strategies outlined above.
[Stronger Capabilities in Core Businesses]
a. Fields Utilizing Bioscience Technologies
Working from the Hayashibara business, we will create a quicker feedback loop from the market through the integration of the Nagase Group research and development and sales functions. Our goal is to create highly original bio-related products, expanding sales of the same throughout the world, which will lead to stronger competitive position and higher growth in the medical, food, health and beauty markets within our Life & Healthcare business.
We have also identified potential applications of bio-related technologies for general commercial use and uses in long-term renewable resources.
The Company experienced strong sales of core Hayashibara products in the food industry, as well as the development and launch of new products. We have also worked to build a more robust sales structure overseas for Hayashibara products and to revise our sales agent policies. Local entities have started their own marketing and sales activities, which has been factor in accelerating our global growth.
One area of bio-related technologies we are working on relates to the development of bio-derived chemicals that do not rely on petroleum resources. We have been working together with Kobe University and other labs in a next-generation agri-industrial bio production project. This project was adopted by the Ministry of Education, Culture, Sports, Science and Technology as a continuing program to run through fiscal 2018. The Nagase R&D Center leads this program in promoting biotechnology research and development activities.
b. Fields Utilizing Environment/Energy-Related Technologies
The Nagase Group is creating a new business model anticipating global technological innovations in green energy, bringing our entire force to bear in businesses focused on friendly manufacturing (using electricity generated from PV, wind power, and other renewable sources), smart grids, and energy conservation systems, as well as next-generation automobiles that make smart use of resources.
We are also advancing research into reducing the environmental burden of business, such as chemical recycling and creating lighter components for automobiles.
The start of the feed-in tariff scheme for renewable energy this fiscal year was a factor in strong solar power system sales by the Company.
The Group's Captex subsidiary manufactures and sells rechargeable battery systems equipped with lithium-ion rechargeable batteries. The company's factory began full-scale production at its plant in Okazaki (Aichi Prefecture) in April 2012; however, the market became much more competitive due to new entrants, lower costs, and other factors. The company plans to introduce a smaller model in June 2013, as well as speed new development based on in-house technologies.
c. Fields Utilizing Electronics-Related Technologies
The electronics field is one of rapid technological innovation and structural change. Here, our goal is to expand our business by offering highly innovative technologies, products, and services that meet the needs of our customers.

NAGASE & Co., Ltd. (8012)
Consolidated Financial Statements for the Fiscal Year Ended March 31, 2013
- 12 -
To accelerate the pace of growth in the global market, we will create more nimble manufacturing and development capabilities overseas.
During the period, the Group saw strong performance in sales for smartphone and tablet components, thanks in part to global proposal/procurement strategies and products tailored to the needs of our customers in the market.
The Group's U.S. Engineered Materials Systems Inc. arm, acquired in January 2012, recorded strong sales of conductive materials used on electronics components for tablets, contributing to Group profits for the fiscal year.
In China, Nagase ChemteX (Wuxi) Corp. committed to building a research and development facility for expanding the company's ability to offer product functions meeting the needs of the local market. The facility is expected to come online sometime during fiscal 2013.
[Stronger Management Foundation]
Where the Japanese market has slowed compared to the growing markets in emerging countries, the Nagase Group has chosen to focus expanding business in emerging and other international markets, establishing high-value-added businesses using our manufacturing and processing functions. Through investments in manufacturing, we have increased Group-wide manufacturing and processing bases in Japan and around the world, changing the fundamental shape of internal risk in the Group's manufacturing businesses.
To respond to these internal and external changes, we are engaged in creating a stronger consolidated management structure, building more mature risk management policies, and developing higher-caliber human resources.
With respect to stronger consolidated management structure, we continue build a more efficient Group management structure, encourage personnel interchange within the Group, and improve our IT infrastructure. To ensure a sound financial foundation, we are working to balance liabilities and equity at prudent levels, while keeping an eye open for any changes in our credit rating. At the same time, we are improving our ability to forecast present and future operating cash flows to balance investment (risk assets) and operating cash flows properly. From a perspective of efficient asset utilization, we are replacing older assets with newer, more profitable assets.
In terms of risk management, we are in the process of putting stronger systems into place for internal controls, risk management, and transaction risk control (as a manufacturer) across the Group's companies.
We are also in the process of establishing a stronger Group management foundation through hiring, training, and utilizing a talented workforce that can respond to the diverse demands of our businesses.
During the period, the Company secured funds through long-term debt and corporate bonds to acquire Hayashibara without damaging the Company's credit rating. Nagase also sold off idle assets, investment securities, and other assets to replace less-effective assets.
The Company established Investment Guidelines to clarify corporate investment standards and speed the decision-making process. At the same time, the Company improved its monitoring of investment performance.
As one way to practice stronger risk management, Nagase started a system for visualizing and reducing risks. This new system should provide the Company with improved transaction risk management from the standpoint of a manufacturer.
In terms of human resources development, Nagase is actively promoting a program of staff sharing among related firms, affiliates, and local overseas entities, while also improving existing Group-wide staff programs.

NAGASE & Co., Ltd. (8012)
Consolidated Financial Statements for the Fiscal Year Ended March 31, 2013
- 13 -
3. Consolidated Financial Statements
(1) Consolidated Balance Sheets
(Millions of yen)
Prior Consolidated Fiscal Year
(March 31, 2012)
Current Consolidated Fiscal Year
(March 31, 2013)
ASSETS Current assets
Cash and time deposits 29,184 46,693Notes and accounts receivable 197,702 196,001Merchandise and finished goods 41,087 47,104Work in process 1,292 1,554Raw materials and supplies 2,879 3,204Deferred tax assets 4,067 4,282Other 7,299 7,967Less allowance for doubtful accounts (1,235) (1,057)
Total current assets 282,280 305,751
Non-current assets Property, plant and equipment
Buildings and structures 45,398 50,057Accumulated depreciation (24,445) (26,156)
Buildings and structures (net) 20,952 23,900
Machinery, equipment and vehicles 51,992 57,047Accumulated depreciation (42,856) (45,688)
Machinery, equipment and vehicles (net) 9,136 11,358
Land 18,523 19,441Others 24,282 22,676
Accumulated depreciation (16,168) (16,409)
Other (net) 8,114 6,266
Total property, plant and equipment 56,727 60,967
Intangible fixed assets Goodwill 32,079 30,726Technology-based assets 21,669 20,093Other 3,705 4,475
Total intangible fixed assets 57,454 55,295
Investments and other assets Investments in securities 49,014 56,870Long-term loan receivable 1,122 837Deferred tax assets 896 2,249Other 3,612 5,067Less allowance for doubtful accounts (266) (289)
Total investments and other assets 54,379 64,734
Total non-current assets 168,561 180,996
Total assets 450,842 486,747

NAGASE & Co., Ltd. (8012)
Consolidated Financial Statements for the Fiscal Year Ended March 31, 2013
- 14 -
(Millions of yen)
Prior Consolidated Fiscal Year
(March 31, 2012)
Current Consolidated Fiscal Year
(March 31, 2013)
LIABILITIES Current liabilities
Notes and accounts payable 109,163 107,941Short-term loans 38,633 25,061Current portion of long-term debt 11,551 10,408Accrued income taxes 3,170 2,947Deferred tax liabilities 50 21Provision for bonuses 3,632 3,968Provision for officer bonuses 198 219Other 15,290 15,244
Total current liabilities 181,689 165,812
Long-term liabilities Bonds 30,000Long-term debt 38,200 32,614Deferred tax liabilities 7,251 9,251Accrued retirement benefits for employees 10,032 10,283Other 922 980
Total long-term liabilities 56,407 83,129
Total liabilities 238,097 248,941
Net assets Shareholders’ equity
Common stock 9,699 9,699Capital surplus 10,041 10,041Retained earnings 186,907 199,160Less treasury stock, at cost (5,460) (7,109)
Total shareholders’ equity 201,188 211,792
Accumulated other comprehensive income (loss) Unrealized holding gain on securities 12,731 17,943Deferred (loss) gain on hedges (21) (6)Translation adjustments (9,191) (1,223)
Total accumulated other comprehensive income 3,518 16,712
Stock acquisition rights 110 50Minority interests 7,927 9,250
Total net assets 212,744 237,806
Total liabilities and net assets 450,842 486,747

NAGASE & Co., Ltd. (8012)
Consolidated Financial Statements for the Fiscal Year Ended March 31, 2013
- 15 -
(2) Consolidated Statements of Income and Consolidated Statements of Comprehensive Income
(Consolidated Statements of Income) (Millions of yen)
Prior Consolidated Fiscal Year
(April 1, 2011 - March 31, 2012)
Current Consolidated Fiscal Year
(April 1, 2012 - March 31, 2013)
Net sales 631,854 666,272Cost of sales 560,226 583,689
Gross profit 71,628 82,583
Selling, general and administrative expenses Selling expenses 8,768 10,013Employee salaries 18,233 19,637Provision for accrued bonuses for employees 2,156 2,530Provision for accrued bonuses for directors 198 225Depreciation and amortization 3,056 3,971Retirement benefit expenses 1,837 1,992Provision for retirement benefits for directors 57 51Allowance for doubtful accounts 433 (36)Amortization of goodwill 151 1,612Other 23,309 27,005
Total selling, general and administrative expenses 58,200 67,004
Operating profit 13,427 15,578
Non-operating income Interest income 268 203Divided income 1,018 1,212Rent income 260 292Investment profit on equity method 368 933Foreign exchange gain 694 548Other 874 630
Non-operating income, total 3,485 3,822
Non-operating expenses Interest expenses 692 1,099Other 529 373
Non-operating expenses, total 1,221 1,472
Ordinary income 15,690 17,927
Extraordinary gains Gain on sale of non-current assets 16 3,358Gain on sale of investment securities 1,759 801Other 129 305
Total extraordinary gains 1,905 4,464
NAGASE & Co., Ltd. (8012)
Consolidated Financial Statements for the Fiscal Year Ended March 31, 2013
- 16 -
(Millions of yen)
Prior Consolidated Fiscal Year
(April 1, 2011 - March 31, 2012)
Current Consolidated Fiscal Year
(April 1, 2012 - March 31, 2013)
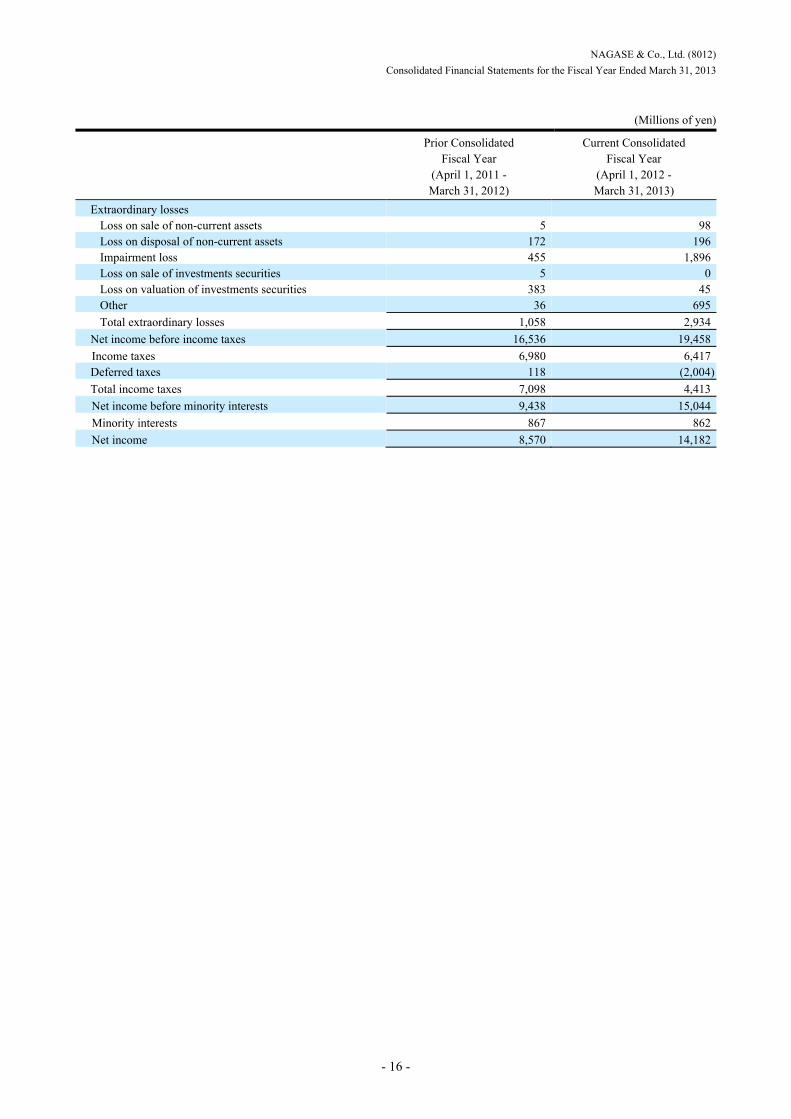
Extraordinary losses Loss on sale of non-current assets 5 98Loss on disposal of non-current assets 172 196Impairment loss 455 1,896Loss on sale of investments securities 5 0Loss on valuation of investments securities 383 45Other 36 695
Total extraordinary losses 1,058 2,934
Net income before income taxes 16,536 19,458
Income taxes 6,980 6,417Deferred taxes 118 (2,004)
Total income taxes 7,098 4,413
Net income before minority interests 9,438 15,044
Minority interests 867 862
Net income 8,570 14,182
NAGASE & Co., Ltd. (8012)
Consolidated Financial Statements for the Fiscal Year Ended March 31, 2013
- 17 -
(Consolidated Statement of Comprehensive Income) (Millions of yen)
Prior Consolidated Fiscal Year
(April 1, 2011 - March 31, 2012)
Current Consolidated Fiscal Year
(April 1, 2012 - March 31, 2013)
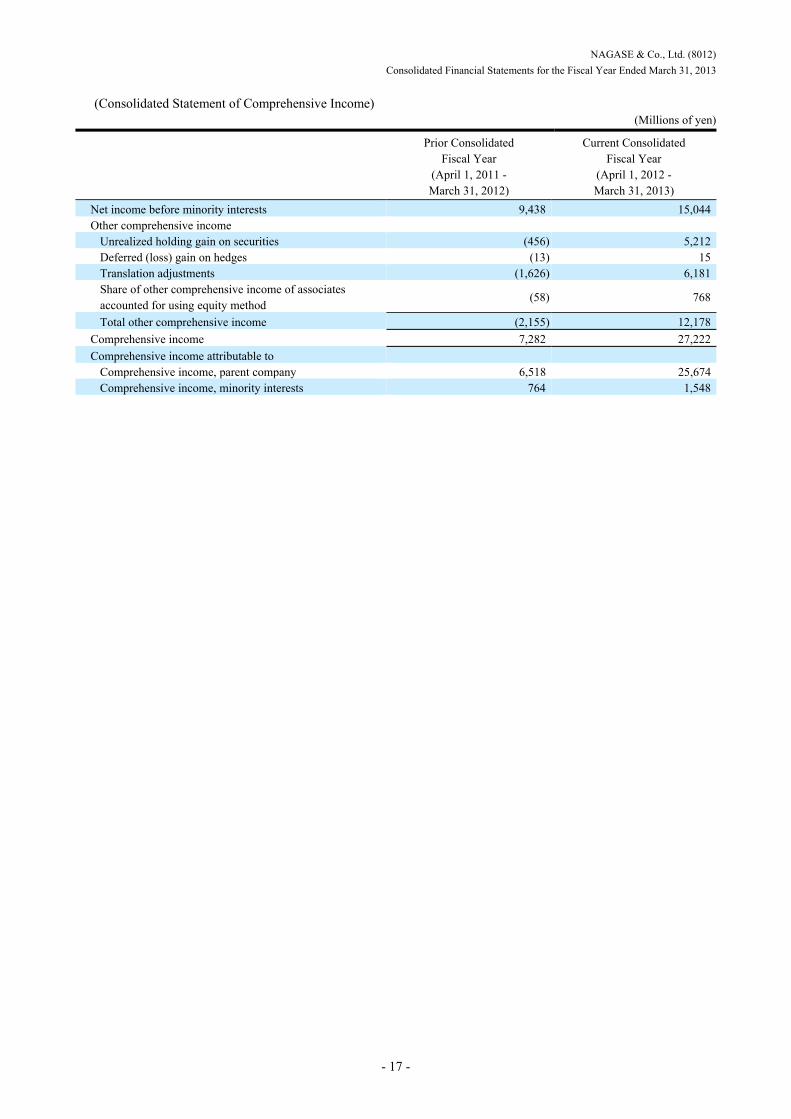
Net income before minority interests 9,438 15,044Other comprehensive income
Unrealized holding gain on securities (456) 5,212Deferred (loss) gain on hedges (13) 15Translation adjustments (1,626) 6,181Share of other comprehensive income of associates accounted for using equity method
(58) 768
Total other comprehensive income (2,155) 12,178
Comprehensive income 7,282 27,222
Comprehensive income attributable to Comprehensive income, parent company 6,518 25,674Comprehensive income, minority interests 764 1,548

NAGASE & Co., Ltd. (8012)
Consolidated Financial Statements for the Fiscal Year Ended March 31, 2013
- 18 -
(3) Consolidated Statement of Change in Shareholders’ Equity
(Millions of yen)
Prior Consolidated Fiscal Year
(April 1, 2011 - March 31, 2012)
Current Consolidated Fiscal Year
(April 1, 2012 - March 31, 2013)
Shareholders’ equity Common stock
Balance, beginning of period 9,699 9,699Changes
Total changes - -
Balance, end of period 9,699 9,699
Capital surplus Balance, beginning of period 10,041 10,041Changes
Disposal of less treasury stock 0 0
Total changes 0 0
Balance, end of period 10,041 10,041
Retained earnings Balance, beginning of period 181,665 186,907Changes
Cash dividends (3,212) (3,189)Net Income 8,570 14,182Changes in scope of consolidation (118) (66)Changes in scope of equity affiliates 3 717Changes accompanying changes in fiscal years of consolidated subsidiaries
609
Total changes 5,241 12,253
Balance, end of period 186,907 199,160
Treasury stock Balance, beginning of period (5,460) (5,460)Changes
Purchases of treasury stock (0) (1,649)Disposal of treasury stock 0 0
Total changes (0) (1,649)
Balance, end of period (5,460) (7,109)
Total shareholders’ equity Balance, beginning of period 195,946 201,188Changes
Cash dividends (3,212) (3,189)Net income 8,570 14,182Purchases of treasury stock (0) (1,649)Disposal of treasury stock 0 0Changes in scope of consolidation (118) (66)Changes in scope of equity affiliates 3 717Changes accompanying changes in fiscal years of consolidated subsidiaries
609
Total changes 5,242 10,604
NAGASE & Co., Ltd. (8012)
Consolidated Financial Statements for the Fiscal Year Ended March 31, 2013
- 19 -
(Millions of yen)
Prior Consolidated Fiscal Year
(April 1, 2011 - March 31, 2012)
Current Consolidated Fiscal Year
(April 1, 2012 - March 31, 2013)
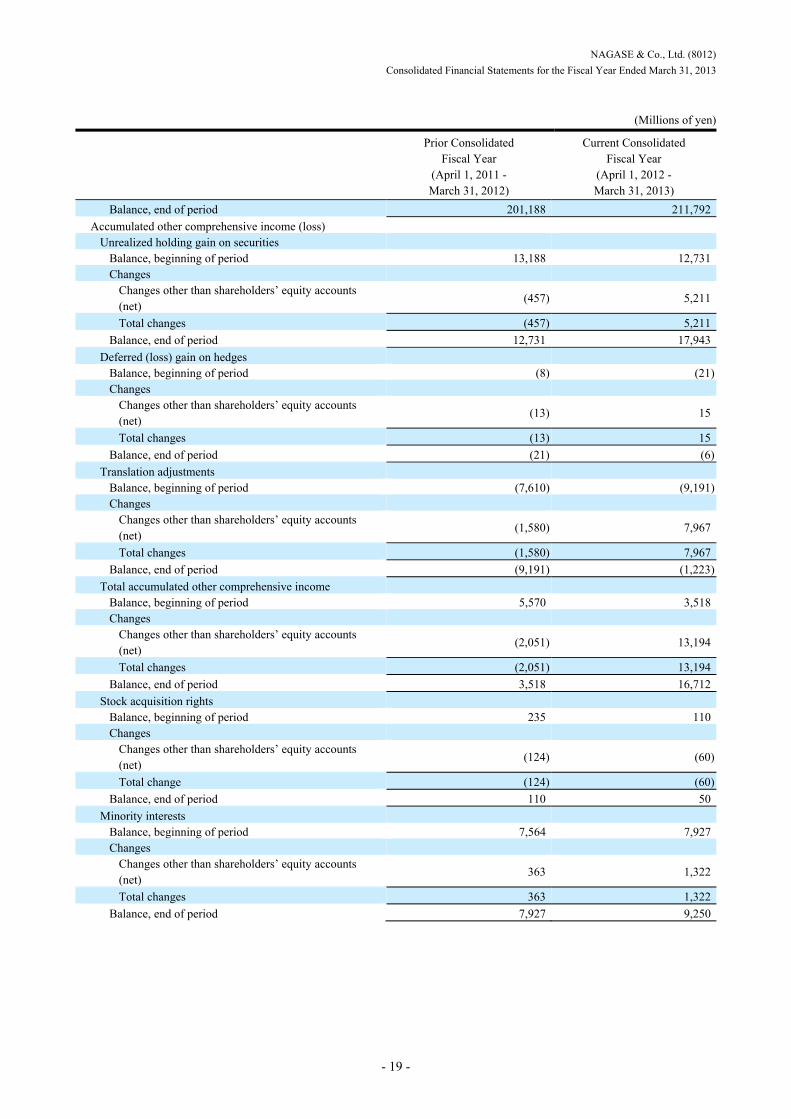
Balance, end of period 201,188 211,792
Accumulated other comprehensive income (loss) Unrealized holding gain on securities
Balance, beginning of period 13,188 12,731Changes
Changes other than shareholders’ equity accounts (net)
(457) 5,211
Total changes (457) 5,211
Balance, end of period 12,731 17,943
Deferred (loss) gain on hedges Balance, beginning of period (8) (21)Changes
Changes other than shareholders’ equity accounts (net)
(13) 15
Total changes (13) 15
Balance, end of period (21) (6)
Translation adjustments Balance, beginning of period (7,610) (9,191)Changes
Changes other than shareholders’ equity accounts (net)
(1,580) 7,967
Total changes (1,580) 7,967
Balance, end of period (9,191) (1,223)
Total accumulated other comprehensive income Balance, beginning of period 5,570 3,518Changes
Changes other than shareholders’ equity accounts (net)
(2,051) 13,194
Total changes (2,051) 13,194
Balance, end of period 3,518 16,712
Stock acquisition rights Balance, beginning of period 235 110Changes
Changes other than shareholders’ equity accounts (net)
(124) (60)
Total change (124) (60)
Balance, end of period 110 50
Minority interests Balance, beginning of period 7,564 7,927Changes
Changes other than shareholders’ equity accounts (net)
363 1,322
Total changes 363 1,322
Balance, end of period 7,927 9,250

NAGASE & Co., Ltd. (8012)
Consolidated Financial Statements for the Fiscal Year Ended March 31, 2013
- 20 -
(Millions of yen)
Prior Consolidated Fiscal Year
(April 1, 2011 - March 31, 2012)
Current Consolidated Fiscal Year
(April 1, 2012 - March 31, 2013)
Total net assets Balance, beginning of period 209,316 212,744Changes
Dividends of surplus (3,212) (3,189)Net income 8,570 14,182Purchases of treasury stock (0) (1,649)Disposal of treasury stock 0 0Changes in scope of consolidation (118) (66)Changes in scope of equity affiliates 3 717Changes accompanying changes in fiscal years of consolidated subsidiaries
609
Changes other than shareholders’ equity accounts (net) (1,813) 14,457
Total changes 3,428 25,061
Balance, end of period 212,744 237,806

NAGASE & Co., Ltd. (8012)
Consolidated Financial Statements for the Fiscal Year Ended March 31, 2013
- 21 -
(4) Consolidated Statements of Cash Flows
(Millions of yen)
Prior Consolidated Fiscal Year
(April 1, 2011 - March 31, 2012)
Current Consolidated Fiscal Year
(April 1, 2012 - March 31, 2013)
Cash flows from operating activities Net income before income taxes 16,536 19,458Depreciation and amortization 7,272 7,445Amortization of goodwill 151 1,612Impairment loss 455 1,896Provision for retirement benefits for employees (decrease) 974 205Interest income and dividend income (1,286) (1,416)Interest expenses 692 1,099Foreign exchange loss (gain) (9) (1,032)Loss (gain) on sale of non-current assets (11) (3,259)Loss (gain) on sale of investments securities (1,753) (800)Loss (gain) on valuation of investments securities 383 45(Increase) decrease in notes and accounts receivable (10,120) 10,357(Increase) decrease in inventories (7,417) (1,490)Increase (decrease) in notes and accounts payable 6,712 (8,771)Other 111 (1,061)
Sub total 12,689 24,289
Interest and dividends received 1,467 1,724Interest paid (637) (1,050)Taxes paid (7,829) (6,387)
Cash flows from operating activities 5,690 18,576
Cash flows from investing activities Purchases of property, plant and equipment (11,215) (10,551)Cash from sales of property, plant and equipment 46 3,235Payment for acquisition of intangible fixed assets (1,420) (1,709)Purchases of investment securities (914) (214)Cash from sale of investment securities 2,151 1,200Cash paid for equity investments (686) (646)Payment for acquisitions (67,774) Proceeds from sales of shares of consolidated subsidiaries accompanying changes of scope of consolidation
537
Change in short-term loans (increase) (175) (380)Other (1,615) (464)
Cash flows from investing activities (81,066) (9,529)

NAGASE & Co., Ltd. (8012)
Consolidated Financial Statements for the Fiscal Year Ended March 31, 2013
- 22 -
(Millions of yen)
Prior Consolidated Fiscal Year
(April 1, 2011 - March 31, 2012)
Current Consolidated Fiscal Year
(April 1, 2012 - March 31, 2013)
Cash flows from financing activities Increase (decrease) in short-term loans, net 22,976 (16,273)Proceeds from long-term loans 39,257 4,665Repayment of long-term debt (1,527) (11,564)Proceeds from issuance of bond 29,855Purchase of treasury stock 0 (1,649)Cash dividends paid (3,212) (3,189)Cash dividends paid to minority shareholders (401) (540)Other (130) (139)
Cash flows from financing activities 56,961 1,164
Effects of exchange rate changes on cash and cash equivalents
(434) 2,451
Net increase (decrease) in cash and cash equivalents (18,849) 12,662
Cash and cash equivalents at beginning of the year 47,202 28,517Increase in cash and cash equivalents accompanying consolidation
165 915
Increase (decrease) in cash and cash equivalents accompanying changes in fiscal years of consolidated subsidiaries
3,721
Cash and cash equivalents, at end of the period 28,517 45,816

NAGASE & Co., Ltd. (8012)
Consolidated Financial Statements for the Fiscal Year Ended March 31, 2013
- 23 -
(5) Assumption for Going Concern
No matters to report. (6) Changes in Basic Matters related to the Preparations of Consolidated Financial Statements
(Change in the Scope of Consolidation or Application of Equity Method Accounting)
1) Number of consolidated subsidiaries 61 (New) 6
Beginning with the consolidated fiscal year under review, the Company has included Nagase Tool Matex Co., Ltd. and five other companies into its consolidation. This policy change has been made to allow the Company to more accurately understand Group performance, to allow for timelier implementation of management policies, and to provide more appropriate information disclosure.
2) Number of affiliates accounted under the equity method 21
(New) 11
Beginning with the consolidated fiscal year under review, the Company has included OnFine Co., Ltd. and 10 other entities as equity method affiliates. This policy change has been made to allow the Company to more accurately understand Group performance, to allow for timelier implementation of management policies, and to provide more appropriate information disclosure.
Nagase Colors & Chemicals Co., Ltd., an equity method affiliate, merged with and absorbed equity method affiliate ON Co-Labo Corporation on April 1, 2012. The resulting entity has been called Nagase-OG Colors & Chemicals Co., Ltd..
(Changes in Matters related to Subsidiary Fiscal Year Ends)
Beginning with the consolidated fiscal year under review, the Company changed the December fiscal year ends of 22 subsidiaries (February fiscal year end for TOTAKU INDUSTRIES, INC.) to match that of the parent company. This policy change has been made to allow the Company to more accurately understand Group performance, to allow for timelier implementation of management policies, and to provide more appropriate information disclosure. For the 10 overseas consolidated subsidiaries and three equity method affiliates required to have December fiscal year ends according to local statutes, the Company had been making adjustments necessary for Group consolidation, taking into account major transactions occurring before the parent company fiscal year-end. The Company has now adopted a consolidation method to produce financial statements via provisional account settlements as of the consolidation date.
The Company recorded income statement results between January 1, 2012 (March 1, 2012 for TOTAKU INDUSTRIES, INC.) and March 31, 2012 associated with these changes as increases in retained earnings. Changes in cash and cash equivalents are presented in “Increase (decrease) in cash and cash equivalents accompanying changes in fiscal years of consolidated subsidiaries.”
(Changes in Accounting Policies which are Difficult to Distinguish from Changes in Accounting Estimates)
Changes in Depreciation Method for Property, Plant and Equipment
Effective April 1, 2012, the Company and its domestic consolidated subsidiaries have changed their depreciation
method for property, plant and equipment, except for buildings acquired on or subsequent to April 1, 1998, to the
straight-line method. Previously, the declining-balance method had been principally applied by the Company and
its domestic consolidated subsidiaries, and the straight-line method had been applied principally by the Company's
overseas subsidiaries.
Under the “CHANGE” 11 medium-term business plan (from the year ended March 31, 2010 to the year ended
March 31, 2012), the Company and its consolidated subsidiaries (collectively, the “Group”) had been engaged in

NAGASE & Co., Ltd. (8012)
Consolidated Financial Statements for the Fiscal Year Ended March 31, 2013
- 24 -
building stronger research, development, and manufacturing functions. In addition, the current “Change-S2014”
medium-term business plan (from the year ended March 31, 2013 to the year ending March 31, 2015), keeps the
Group’s attention focused on these same areas, while calling for significant increase in capital investment.
With increased capital investment, greater investment in group manufacturing companies, and full-scale operations
of manufacturing facilities from the year ended March 31, 2013, the Company has reexamined its depreciation
policies for property, plant and equipment. As a result, the Company concluded that adopting the straight-line
method to allocate depreciation expense evenly over the estimated useful lives of property, plant and equipment
would more appropriately reflect the actual characteristics of the Group’s business considering that manufacturing
facilities and equipment will likely be used consistently and reliably over the estimated useful lives.
As a result of this change, depreciation expense decreased by ¥2,138 million ($22,733 thousand), operating income increased by ¥1,896 million ($20,159 thousand) and income before income taxes and minority interests increased by ¥1,918 million ($20,393 thousand) for the year ended March 31, 2013, from the corresponding amounts which would have been recorded under the previous depreciation method. (Changes in Accounting Estimates)
Changes in Estimated Useful Lives of Property, Plant and Equipment
The Company and certain consolidated subsidiaries have changed the estimated useful lives of certain items of property, plant and equipment beginning with the consolidated fiscal year under review.
In conjunction with these changes, depreciation and amortization for the consolidated fiscal year is ¥90 million greater than calculations using prior estimates of useful lives. Operating profit, ordinary income, and net income before income taxes were each comparatively lower by ¥88 million.
(7) Notes related to Consolidated Financial Statements
(Segment Information, etc. )
a. Segment Information
1 Reportable Segments
The Company’s reportable segments are those units comprising the Nagase Group for which separate financial information is available and for which the board of directors make regular decisions regarding resource allocation and operating performance.
Beginning April 2012, the Company has been executing on the “Change-S2014” three-year business plan. To accomplish the goals set out in this plan, beginning with the consolidated fiscal year under review, the Company reorganized four business segments (Chemicals, Plastics, Electronics, and Life Sciences) away from product categories into segments to more fully concentrate the strengths of our entire group, reflecting the respective positions of each business in the value chain, as well as with the most closely aligned industries. This realignment has resulted in five segment categories: Functional Materials (located at the top of the value chain), Advanced Materials & Processing (located in the next stage of the value chain), Electronics, Automotive & Energy, and Life & Healthcare (these last three segments functioning across all industries). Reportable segments have also been reclassified to reflect this change.
Segment information for the prior consolidated fiscal year has been prepared under this new classification method.
The following describes the major products and services handled by each reportable segment.
The Functional Materials segment is engaged in the sales of materials for paints/inks, urethane materials, plastic materials, plastic adhesives, industrial oil solutions, surfactants, fluorochemicals, encapsulment materials, silicone materials, precision electronics abrasives, and more for the paints/inks, resins, urethane foam, organic synthesis, surfactants, semiconductor, and HDD-related industries.

NAGASE & Co., Ltd. (8012)
Consolidated Financial Statements for the Fiscal Year Ended March 31, 2013
- 25 -
The Advanced Materials & Processing segment is engaged in the sales of dyestuffs, dyes, functional dyes, information printing products, thermoplastic resins, thermosetting resins, synthetic rubber, inorganic materials, plastics products, resins molding tools/dies, and external inspection equipment for the dye/additive, information printing, textile processing, raw resin material, resin molding, functional film and sheet and other industries.
The Electronics segment is engaged in the sales of pre-processing materials and devices for LCD/semiconductors, materials for LCD panels, materials and devices for semiconductor assembly, low-temperatures/vacuum equipment, high-function epoxy resins, and more for the display, touch panel, LCD, semiconductor, electronic components, heavy electrical, and other industries.
The Automotive & Energy segment is engaged in sales of plastic products, thermoplastic resins, thermosetting resins, resins molding tools/dies, battery materials, solar cell/secondary battery-related materials, and more for the automotive, automotive component, and energy industries.
The Life & Healthcare segment is engaged in the sales of pharmaceutical/agricultural chemicals and materials, research products, in vitro diagnostics, enzymes, food additives, additives for cosmetics, and feeds/fertilizers for the pharmaceutical, food, and cosmetics industries. In addition, this segment sells cosmetics, health foods, and beauty foods directly to consumers.
2 Net Sales, Profit (Loss), Assets, Liabilities, and Other by Segment
Profit in reportable segments is defined as operating profit. Inter-segment profits and transfers are based on actual market prices.
NAGASE & Co., Ltd. (8012)
Consolidated Financial Statements for the Fiscal Year Ended March 31, 2013
- 26 -
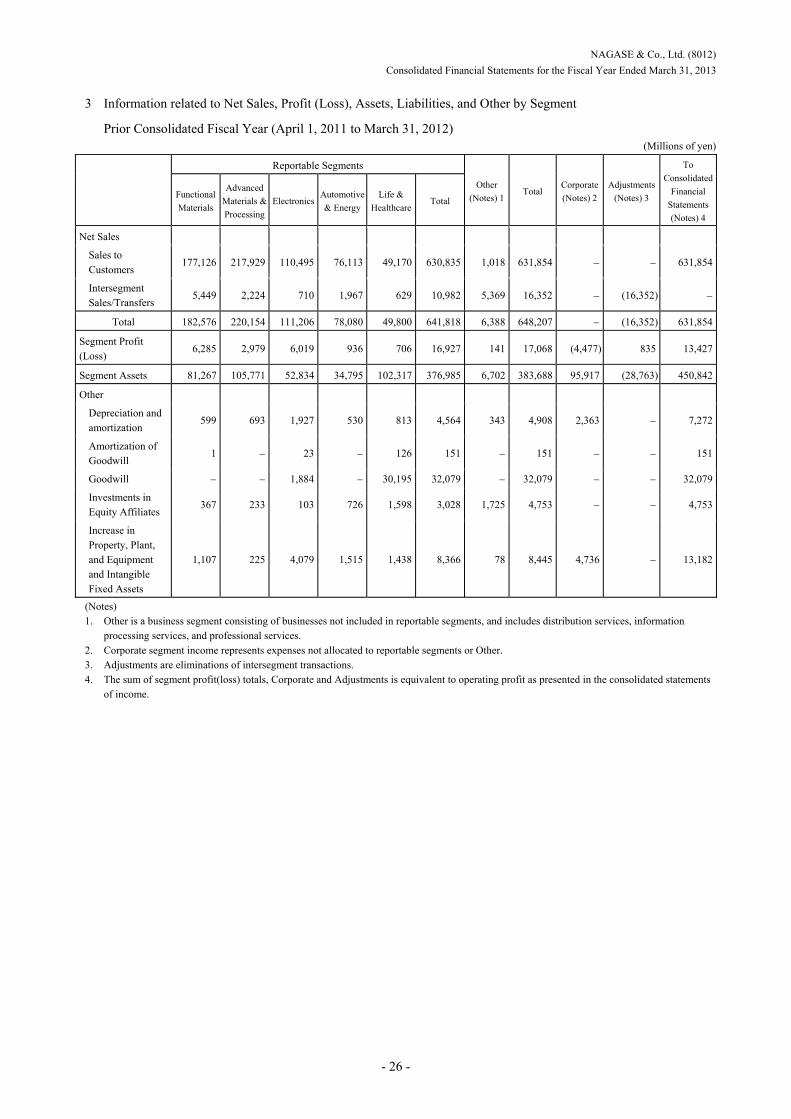
3 Information related to Net Sales, Profit (Loss), Assets, Liabilities, and Other by Segment
Prior Consolidated Fiscal Year (April 1, 2011 to March 31, 2012) (Millions of yen)
Reportable Segments
Other
(Notes) 1Total
Corporate
(Notes) 2
Adjustments
(Notes) 3
To
Consolidated
Financial
Statements
(Notes) 4
Functional
Materials
Advanced
Materials &
Processing
Electronics Automotive
& Energy
Life &
HealthcareTotal
Net Sales
Sales to Customers
177,126 217,929 110,495 76,113 49,170 630,835 1,018 631,854 631,854
Intersegment Sales/Transfers
5,449 2,224 710 1,967 629 10,982 5,369 16,352 (16,352)
Total 182,576 220,154 111,206 78,080 49,800 641,818 6,388 648,207 (16,352) 631,854
Segment Profit (Loss)
6,285 2,979 6,019 936 706 16,927 141 17,068 (4,477) 835 13,427
Segment Assets 81,267 105,771 52,834 34,795 102,317 376,985 6,702 383,688 95,917 (28,763) 450,842
Other
Depreciation and amortization
599 693 1,927 530 813 4,564 343 4,908 2,363 7,272
Amortization of Goodwill
1 23 126 151 151 151
Goodwill 1,884 30,195 32,079 32,079 32,079
Investments in Equity Affiliates
367 233 103 726 1,598 3,028 1,725 4,753 4,753
Increase in Property, Plant, and Equipment and Intangible Fixed Assets
1,107 225 4,079 1,515 1,438 8,366 78 8,445 4,736 13,182
(Notes) 1. Other is a business segment consisting of businesses not included in reportable segments, and includes distribution services, information
processing services, and professional services. 2. Corporate segment income represents expenses not allocated to reportable segments or Other. 3. Adjustments are eliminations of intersegment transactions. 4. The sum of segment profit(loss) totals, Corporate and Adjustments is equivalent to operating profit as presented in the consolidated statements
of income.

NAGASE & Co., Ltd. (8012)
Consolidated Financial Statements for the Fiscal Year Ended March 31, 2013
- 27 -
Current Consolidated Fiscal Year (April 1, 2012 to March 31, 2013) (Millions of yen)
Reportable Segments
Other
(Notes) 1Total
Corporate
(Notes) 2
Adjustments
(Notes) 3
To
Consolidated
Financial
Statements
(Notes) 4
Functional
Materials
Advanced
Materials &
Processing
Electronics Automotive
& Energy
Life &
HealthcareTotal
Net Sales
Sales to Customers
180,025 214,546 116,105 83,068 71,685 665,431 841 666,272 666,272
Intersegment Sales/Transfers
4,904 2,182 733 1,384 452 9,657 5,523 15,180 (15,180)
Total 184,929 216,728 116,838 84,453 72,138 675,088 6,364 681,453 (15,180) 666,272
Segment Profit (Loss)
5,428 2,386 6,297 763 3,986 18,862 265 19,127 (3,672) 123 15,578
Segment Assets 81,384 108,696 61,760 37,387 95,735 384,964 6,489 391,453 127,891 (32,597) 486,747
Other
Depreciation and amortization
434 537 1,508 250 2,025 4,756 202 4,959 2,486 7,445
Amortization of Goodwill
96 1,516 1,612 1,612 1,612
Goodwill 2,046 28,679 30,726 30,726 30,726
Investments in Equity Affiliates
1,781 1,545 56 1,613 1,856 6,854 1,793 8,648 8,648
Increase in Property, Plant, and Equipment and Intangible Fixed Assets
626 853 2,784 92 3,028 7,385 436 7,821 3,870 11,691
(Notes) 1. Other is a business segment consisting of businesses not included in reportable segments, and includes distribution services, information
processing services, and professional services. 2. Corporate segment income represents expenses not allocated to reportable segments or Other. 3. Adjustments are eliminations of intersegment transactions. 4. The sum of segment profit(loss) total, Corporate and Adjustments is equivalent to operating profit as presented in the consolidated statements
of income. 5. Beginning with the consolidated period under review, the Company and its domestic subsidiaries have changed from the declining balance
method to the straight-line method for depreciating property, plant and equipment. With this change in accounting policy, segment income for the consolidated fiscal year under review is ¥218 million higher in Functional Materials, ¥215 million higher in Advanced Materials & Processing, ¥778 million higher in Electronics, ¥170 million higher in Automotive & Energy, and ¥168 million higher in Life & Healthcare, and ¥344 million increase in Corporate than under the previous method.
6. The Company and certain consolidated subsidiaries have changed the estimated useful lives of certain items of property, plant and equipment beginning with the consolidated fiscal year under review. In conjunction with these changes, segment income for the consolidated fiscal year is ¥86 million lower in Electronics and ¥2 million lower in Automotive & Energy than calculations using prior estimates of useful lives.

NAGASE & Co., Ltd. (8012)
Consolidated Financial Statements for the Fiscal Year Ended March 31, 2013
- 28 -
b. Other Information
Prior Consolidated Fiscal Year (April 1, 2011 to March 31, 2012)
1 Products and Services
Omitted, since the same information has been disclosed under Segment Information.
2 Geographic Information
(1) Net sales (Millions of yen)
Japan China Other Total
366,369 122,501 142,983 631,854
(Notes) Net sales are categorized by country or region, according to the location of the customer.
(2) Property, Plant and Equipment
(Millions of yen)
Japan Other Total
53,569 3,158 56,727
3 Major Customers
Information not presented here, since no single customer accounts for 10% or more of consolidated net sales.
Current Consolidated Fiscal Year (April 1, 2012 to March 31, 2013)
1 Products and Services
Omitted, since the same information has been disclosed under Segment Information.
2 Geographic Information
(1) Net Sales (Millions of yen)
Japan China Other Total
361,971 133,076 171,224 666,272
(Note) Net sales are categorized by country or region, according to the location of the customer.
(2) Property, Plant and Equipment
(Millions of yen)
Japan Other Total
54,619 6,347 60,967
3 Major Customers
Information not presented here, since no single customer accounts for 10% or more of consolidated net sales.
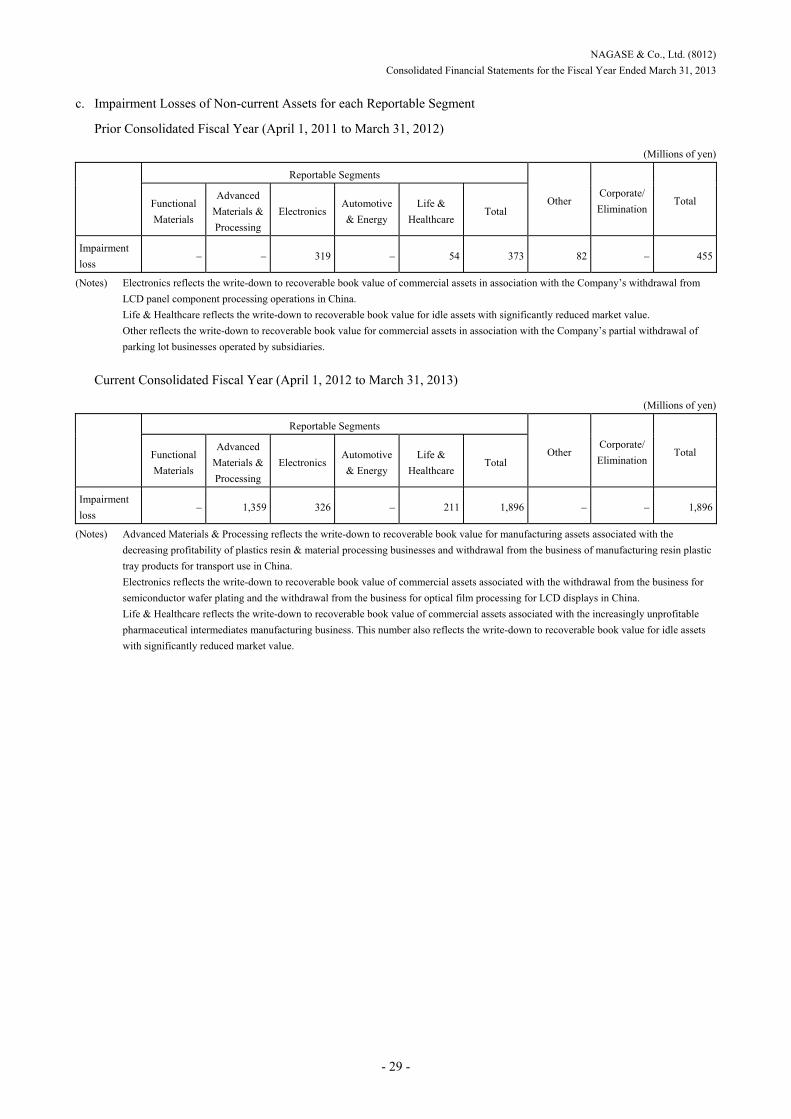
NAGASE & Co., Ltd. (8012)
Consolidated Financial Statements for the Fiscal Year Ended March 31, 2013
- 29 -
c. Impairment Losses of Non-current Assets for each Reportable Segment
Prior Consolidated Fiscal Year (April 1, 2011 to March 31, 2012)
(Millions of yen)
Reportable Segments
Other Corporate/
Elimination Total Functional
Materials
Advanced
Materials &
Processing
Electronics Automotive
& Energy
Life &
HealthcareTotal
Impairment
loss 319 54 373 82 455
(Notes) Electronics reflects the write-down to recoverable book value of commercial assets in association with the Company’s withdrawal from
LCD panel component processing operations in China.
Life & Healthcare reflects the write-down to recoverable book value for idle assets with significantly reduced market value.
Other reflects the write-down to recoverable book value for commercial assets in association with the Company’s partial withdrawal of
parking lot businesses operated by subsidiaries.
Current Consolidated Fiscal Year (April 1, 2012 to March 31, 2013)
(Millions of yen)
Reportable Segments
Other Corporate/
Elimination Total Functional
Materials
Advanced
Materials &
Processing
Electronics Automotive
& Energy
Life &
HealthcareTotal
Impairment
loss 1,359 326 211 1,896 1,896
(Notes) Advanced Materials & Processing reflects the write-down to recoverable book value for manufacturing assets associated with the
decreasing profitability of plastics resin & material processing businesses and withdrawal from the business of manufacturing resin plastic
tray products for transport use in China.
Electronics reflects the write-down to recoverable book value of commercial assets associated with the withdrawal from the business for
semiconductor wafer plating and the withdrawal from the business for optical film processing for LCD displays in China.
Life & Healthcare reflects the write-down to recoverable book value of commercial assets associated with the increasingly unprofitable
pharmaceutical intermediates manufacturing business. This number also reflects the write-down to recoverable book value for idle assets
with significantly reduced market value.

NAGASE & Co., Ltd. (8012)
Consolidated Financial Statements for the Fiscal Year Ended March 31, 2013
- 30 -
(Per-Share Data)
Prior Consolidated Fiscal Year (April 1, 2011 to March 31, 2012)
Current Consolidated Fiscal Year (April 1, 2012 to March 31, 2013)
Net Assets per Share ¥1,592.87 Net Assets per Share ¥1,803.31
Earnings per Share ¥66.69 Earnings per Share ¥111.31
Diluted earnings per share not presented, as the Company does not issue any stock with dilutive effects.
Diluted earnings per share not presented, as the Company does not issue any stock with dilutive effects.
(Note) Basis for calculations
Earnings per share and diluted earnings per share
Item
Prior Consolidated Fiscal Year
(April 1, 2011 to March 31, 2012)
Current Consolidated Fiscal Year
(April 1, 2012 to March 31, 2013)
Net Income from consolidated statements of income (millions of yen)
8,570 14,182
Net income related to common stock (millions of yen) 8,570 14,182
Average number of outstanding shares of common stock (shares)
128,514,527 127,406,786
Major reason for increase in number of common shares used to calculate diluted earnings per share (shares)
Stock acquisition rights
Dilutive stock not included in calculation of diluted earnings per share (no dilutive effects)
Number of stock acquisition rights (units) 826 409
(Significant Subsequent Events)
No matters to report.

NAGASE & Co., Ltd. (8012)
Consolidated Financial Statements for the Fiscal Year Ended March 31, 2013
- 31 -
4. Other Year ended March 31, 2013 Financial Highlights (Consolidated) [Sales in overseas markets] (Millions of yen)
Item Current Consolidated Fiscal Year Prior Consolidated Fiscal Year
Change
(Notes)
1. Sales in overseas markets consist of net sales of the Company and consolidated subsidiaries in other countries or regions.
2. Major countries in each region
(1) Northeast Asia ················· Taiwan, China (2) Southeast Asia ················· Singapore, Thailand (3) North America ················ U.S. (4) Europe & Others ············· Germany
Amount Overseas Sales/Consolidated
Sales (%) Amount
Overseas Sales Consolidated
Sales (%)
Overseas Sales 304,301 45.7 265,484 42.0 38,816
Northeast Asia 175,965 26.4 155,692 24.6 20,272
Southeast Asia 85,881 12.9 72,882 11.5 12,998
North America 25,423 3.8 21,236 3.4 4,186
Europe & Other 17,031 2.6 15,673 2.5 1,358
[Income (Loss)] (Millions of yen)
Item Current
Consolidated Fiscal Year
Prior Consolidated Fiscal Year
Change Overview
Change (%)
Net sales 666,272 631,854 34,418 [Net sales]
Functional Materials: Sales declined in Japan and Northeast Asia; however, Southeast Asia experienced sales growth. The performance chemical business grew, while the specialty chemicals business recorded a decline in sales.
Advanced Materials & Processing: The office automation and customer electronics business saw higher sales of synthetic resins and increasing exports of molding tools to Asia. Business related to dyes/additives and information printing materials business saw lower year-on-year sales.
Electronics: The electronic materials business experienced lower performance of liquid crystal films and LED-related components. In contrast, sales of touch panel products experienced year-on-year growth. In the electronic chemicals business, the Company saw strong performance in formulated epoxy resins, but lower sales in chemicals used in the manufacturer of semiconductors and LCD panels.
Automotive & Energy: Domestic, North American, and Asian sales exhibited strength during the fiscal year.
Life & Healthcare: Net sales of functional saccharides business gained by a wide margin due to the addition of Hayashibara to the Group’s consolidated earnings. Net sales of beauty care products business fell year-on-year, as new products introduced during the prior fiscal year underperformed.
[Gross profit]
Higher profits in Life & Healthcare, Automotive & Energy, and Electronics segments. Lower profits in Functional Materials and Advanced Materials & Processing segments.
[Selling, general and administrative expenses]
• Selling expense (+1,245): Higher selling expense with the consolidation of Hayashibara
• Payroll (+2,355): Increased employee bonuses (+1,787); mainly due to the consolidation of Hayashibara
• Depreciation and amortization (+913): Additional 1,576 in depreciation of technological assets with the acquisition of Hayashibara; -769 due to change in depreciation method for tangible fixed assets.
• Amortization of goodwill (+1,463): Additional amortization (+1,516) related to goodwill in Hayashibara acquisition
[Operating profit]
Higher profits in Life & Healthcare, Functional Materials, and Automotive & Energy segments. Lower profits in Electronics and Advanced Materials & Processing segments. [Extraordinary gains]
• 3,358 in gains on disposal of fixed assets: mainly simple land sales of 3,161 [Extraordinary losses]
• Gain on disposal of fixed assets 3,358: mainly simple land sales of 3,161
5.4%
Functional Materials 180,025 177,126 2,899
Advanced Materials & Processing 214,546 217,929 (3,383)
Electronics 116,105 110,495 5,609
Automotive & Energy 83,068 76,113 6,954
Life & Healthcare 71,685 49,170 22,515
Other 841 1,018 (177)
Gross profit 82,583 71,628 10,955
(Profit Ratio) (12.4%) (11.3%) 15.3%
Selling, general and administrative expenses
67,004 58,200 8,804
Selling expense 10,013 8,768 1,245
Payroll 28,720 26,364 2,355
Depreciation and amortization 3,971 3,058 913
Amortization of goodwill 1,612 149 1,463
Other 22,686 19,859 2,826
Operating profit 15,578 13,427 2,151
16.0%
Financial Profit 316 594 (277)
Interest income 203 268 (64)
Divided income 1,212 1,018 194
Interest expenses 1,099 692 407
Other non-operating profit (Loss) 2,032 1,669 363
Ordinary income 17,927 15,690 2,237
14.3%
Extraordinary gains 4,464 1,905 2,558
Extraordinary losses 2,934 1,058 1,875
Total income taxes 4,413 7,098 (2,685)
Minority interests 862 867 (5)
Net income 14,182 8,570 5,612
65.5%
[Assets, Liabilities] (Millions of yen)
Item Current
Consolidated Fiscal Year
Prior Consolidated Fiscal Year
Change
Overview
Current assets 305,751 282,280 23,470 [Current assets]
Increase in cash and deposits (+17,508) and inventories (+6,603); decrease in notes and accounts receivable (-1,701) [Non-current assets]
• Increase in tangible fixed assets (+4,239) and buildings (+2,947)
• Decrease in intangible fixed assets (-2,158): mainly from goodwill (-1,353) and depreciation of technological assets (-1,575)
[Current liabilities]
• Short-term loans: decrease due to refinancing through corporate bonds (-20,000) [Long-term liabilities]
• Corporate bonds: Issuance of unsecured corporate bonds (+30,000) [Net assets]
• Shareholders’ equity: Higher retained earnings due to net income gains (+14,182)
• Accumulated other comprehensive income: Increased due to foreign currency translation adjustments (+7,967)
• Increase in valuation differences in available-for-sale securities (+5,211)
Non-current assets 180,996 168,561 12,435
PP&E/intangible Fixed Assets 116,262 114,182 2,080
Investments and other assets 64,734 54,379 10,354
Total assets 486,747 450,842 35,905
Current liabilities 165,812 181,689 (15,877)
Short-term loans 25,061 38,633 (13,572)
Current portion of long-term debt 10,408 11,551 (1,142)
Other 130,342 131,505 (1,162)
Long-term liabilities 83,129 56,407 26,721
Bonds 30,000 30,000
Long-term debt 32,614 38,200 (5,586)
Other 20,515 18,206 2,308
Total liabilities 248,941 238,097 10,844
Interest-bearing debt 98,425 88,710 9,714
Shareholders’ equity 211,792 201,188 10,604
Accumulated other comprehensive income (loss)
16,712 3,518 13,194
Stock acquisition rights 50 110 (60)
Minority interests 9,250 7,927 1,322
Total net assets 237,806 212,744 25,061
Net worth ratio 46.9% 45.4%
(Note) Figures inside parentheses of explanatory text indicate comparative change

NAGASE & Co., Ltd. (8012)
Consolidated Financial Statements for the Fiscal Year Ended March 31, 2013
- 32 -
Earnings Performance and Fiscal 2014 Earnings Forecast (Millions of yen)
FYE March 2010 FYE March 2011 FYE March 2012 FYE March 2013FYE March 2014
(forecast) Year-on-Year
Change
Net Sales 603,949 660,213 631,854 666,272 764,000 114.7%
Functional Materials 177,126 180,025 181,000
Advanced Materials & Processing 217,929 214,546 255,000
Electronics 110,495 116,105 149,000
Automotive & Energy 76,113 83,068 94,000
Life & Healthcare 49,170 71,685 84,000
Other 1,018 841 1,000
Gross profit 65,415 73,008 71,628 82,583 93,400 113.1%
Ratio (10.8%) (11.1%) (11.3%) (12.4%) (12.2%)
Operating profit 13,128 18,732 13,427 15,578 19,200 123.2%
Ratio (2.2%) (2.8%) (2.1%) (2.3%) (2.5%)
Ordinary income 14,712 20,625 15,690 17,927 21,000 117.1%
Ratio (2.4%) (3.1%) (2.5%) (2.7%) (2.7%)
Net income 7,537 12,823 8,570 14,182 14,500 102.2%
Ratio (1.2%) (1.9%) (1.4%) (2.1%) (1.9%)
Total assets 368,088 375,336 450,842 486,747
Equity capital 195,344 201,516 204,706 228,505
Net worth ratio 53.1% 53.7% 45.4% 46.9%
ROE (Equity capital/profit ratio) 4.0% 6.5% 4.2% 6.5%
ROA (Total assets/profit ratio) 2.1% 3.4% 2.1% 3.0%
Earnings per share () 58.64 99.76 66.69 111.31 114.43 102.8%
Debt to cash flow ratio (x)
Consolidated companies 59 60 66 82 88
Consolidated subsidiaries 49 51 55 61 63
Equity method affiliates 10 9 11 21 25
Note 1: ROE = net income /{( equity capital, beginning of period + equity capital, end of period) / 2} ROA = net income / {(total assets, beginning of period + total assets, end of period) / 2}
Note 2: Debt to Cash Flow Ratio = (Interest-bearing debt cash and deposits) / equity capital
Consolidated Companies
[Ratio of Profitable to Unprofitable Companies] (Units: Companies)
Category Current Consolidated Fiscal Year Prior Consolidated Fiscal Year
Profitable Co’s Unprofitable Co’s Total Profitable Co’s Unprofitable Co’s Total
Consolidated Japan 23 5 28 20 5 25
Subsidiaries Overseas 24 9 33 23 7 30
Equity Method Japan 7 2 9 7 2 9
Affiliates Overseas 9 3 12 2 0 2
Composition Ratio (%) 77% 23% 100% 79% 21% 100%
Major Profitable Companies
Category Company Name Main Business Lines
Domestic Consolidated Subsidiaries
Hayashibara Co., Ltd. Development, manufacture, and sales of food raw materials, pharmaceutical raw materials, health food raw materials, and functional dyes
Nagase ChemteX Corp. Manufacture of epoxy resins, enzyme-processed products, commercial chemicals
Overseas Consolidated Subsidiaries
Nagase Electronics Technology Co., Ltd. Thin-glass processing via chemical etching of LCD glass panel units
Nagase (Hong Kong) Ltd. Import/export, brokerage, market development, information collection
Equity Method Affiliates Nagase Landauer, Ltd. Radiation measurement services
Major Unprofitable Companies
Category Company Name Main Business Lines
Domestic Consolidated Subsidiaries
Setsunan Kasei Co., Ltd. Plastics color processing, sales
CAPTEX Co., Ltd. Manufacture and sales of rechargeable batteries
Overseas Consolidated Subsidiaries
Nagase Precision Plastics (Shanghai) Co., Ltd. Plastic tray molding
Nagase International Electronics Ltd. Management and operations of domestic/global electronics industry businesses
Equity Method Affiliates SN Tech Corporation Manufacture, recycling of developing chemicals
[Employees] (Unit: People)
Current Consolidated Fiscal Year Change
Parents Consolidated Subsidiaries
Equity Affiliates Total Parents Consolidated Subsidiaries
Equity Affiliates Total
972 4,925 3,189 9,086 11 341 1,967 2,319
* Change indicates change versus prior consolidated fiscal year.