CONSOLIDATED FINANCIAL STATEMENTS FOR THE · PDF fileconsolidated financial statements for the...
31
SAVOLA GROUP COMPANY (A Saudi Joint Stock Company) CONSOLIDATED FINANCIAL STATEMENTS FOR THE YEAR ENDED DECEMBER 31, 2012 AND INDEPENDENT AUDITORS' REPORT
-
Upload
trinhxuyen -
Category
Documents
-
view
221 -
download
3
Transcript of CONSOLIDATED FINANCIAL STATEMENTS FOR THE · PDF fileconsolidated financial statements for the...

SAVOLA GROUP COMPANY (A Saudi Joint Stock Company) CONSOLIDATED FINANCIAL STATEMENTS FOR THE YEAR ENDED DECEMBER 31, 2012 AND INDEPENDENT AUDITORS' REPORT

1
SAVOLA GROUP COMPANY (A Saudi Joint Stock Company) CONSOLIDATED FINANCIAL STATEMENTS FOR THE YEAR ENDED DECEMBER 31, 2012
Page
Independent auditors’ report 2 Consolidated balance sheet 3 Consolidated income statement 4 Consolidated cash flow statement 5 - 6 Consolidated statement of changes in shareholders’ equity 7 Notes to the consolidated financial statements 8 - 30

2
INDEPENDENT AUDITORS’ REPORT February 16, 2013 To the Shareholders of Savola Group Company: (A Saudi Joint Stock Company) Scope of audit
We have audited the accompanying consolidated balance sheet of Savola Group Company (the “Company”) and Subsidiaries (collectively the “Group”) as of December 31, 2012 and the related consolidated statements of income, cash flows and changes in shareholders’ equity for the year then ended, and the notes which form an integral part of the consolidated financial statements. These consolidated financial statements, which were prepared by the Company in accordance with Article 123 of the Regulations for Companies and presented to us with all information and explanations which we required, are the responsibility of the Group’s management. Our responsibility is to express an opinion on these consolidated financial statements based on our audit. We conducted our audit in accordance with auditing standards generally accepted in Saudi Arabia. Those standards require that we plan and perform the audit to obtain reasonable assurance about whether the financial statements are free of material misstatement. An audit includes examining, on a test basis, evidence supporting the amounts and disclosures in the financial statements. An audit also includes assessing the accounting principles used and significant estimates made by management, as well as evaluating the overall financial statement presentation. We believe that our audit provides a reasonable basis for our opinion. Unqualified opinion
In our opinion, such consolidated financial statements taken as a whole: Present fairly, in all material respects, the financial position of the Group as of December 31,
2012 and the results of its operations and its cash flows for the year then ended in conformity with accounting principles generally accepted in Saudi Arabia appropriate to the circumstances of the Group; and
Comply, in all material respects, with the requirements of the Regulations for Companies and
the Company’s Bylaws with respect to the preparation and presentation of consolidated financial statements.
PricewaterhouseCoopers
By: Ibrahim R. Habib License Number 383
PricewaterhouseCoopers, Jameel Square, P.O. Box 16415, Jeddah 21464, Kingdom of Saudi Arabia
T: +966 (2) 610-4400, F: +966 (2) 610-4411, www.pwc.com/middle-east
License No. 25, Licensed Partners: Omar M. Al Sagga (369), Khalid A. Mahdhar (368), Mohammed A. Al Obaidi (367), Ibrahim R. Habib (383)

3
SAVOLA GROUP COMPANY (A Saudi Joint Stock Company) Consolidated balance sheet
(All amounts in Saudi Riyals thousands unless otherwise stated) As at December 31,
Note 2012 2011
Assets Current assets
Cash and cash equivalents 5 943,259 1,214,084
Accounts receivable 6 1,447,960 1,815,640
Inventories 7 3,973,422 3,152,449
Prepayments and others receivables 8 1,993,898 1,424,242
Assets classified as held for sale 9 186,353 167,398
8,544,892 7,773,813
Non-current assets
Long term receivables 10.3 167,899 308,678
Investments in associates and other investments 10 7,526,660 5,332,161
Property, plant and equipment 11 5,779,951 5,384,430
Intangible assets 12 1,322,133 1,302,294
14,796,643 12,327,563
Total assets 23,341,535 20,101,376
Liabilities
Current liabilities
Short-term borrowings 13 3,527,275 2,755,429
Current maturity of long-term borrowings 14 910,952 656,103
Accounts payable 15 2,744,204 2,718,927
Accrued and other liabilities 16 1,961,259 1,428,521
Liabilities classified as held for sale 9 159,239 181,299
9,302,929 7,740,279
Non-current liabilities
Long-term borrowings 14 3,612,246 2,821,494
Deferred tax liability 16 33,583 -
Deferred gain 17 103,193 103,181
Long-term payables 18 53,781 58,342
Employee termination benefits 19 353,751 307,263
4,156,554 3,290,280
Total liabilities 13,459,483 11,030,559
Equity
Share capital 21 5,000,000 5,000,000
Statutory reserve 22 1,217,231 1,077,010
General reserve 4,000 4,000
Retained earnings 2,540,166 2,005,378
Others reserves 10 (5,701) (808)
Effect of acquisition transactions with non-controlling interest without change in control
2,042
(59,443)
Currency translation differences (471,068) (303,670)
Equity attributable to shareholders’ of the parent company
8,286,670
7,722,467
Non-controlling interest 1,595,382 1,348,350
Total equity 9,882,052 9,070,817
Total liabilities and equity 23,341,535 20,101,376
Contingencies and commitments 30 The notes on pages 8 to 30 form an integral part of these consolidated financial statements.

4
SAVOLA GROUP COMPANY (A Saudi Joint Stock Company) Consolidated income statement
(All amounts in Saudi Riyals thousands unless otherwise stated)
Year ended December 31,
Note 2012 2011
Revenues 4,20 27,391,493 25,195,702
Cost of sales 20 (22,629,925) (21,224,980)
Gross profit 4,761,568 3,970,722
Share in net income of associates and dividend income of available-for-sale investment - net 10.1,10.2
578,567
440,613
Other income - net 25 73,721 96,767
Total income 5,413,856 4,508,102
Operating expenses
Selling and marketing 20, 23 (2,367,292) (2,144,813)
General and administrative 20, 24 (590,317) (562,472)
Total expenses (2,957,609) (2,707,285)
Income from operations 2,456,247 1,800,817
Other income (expenses)
Gain on disposal of investments 10 46,651 152,781
Impairment loss and cost of projects written off 12 - (35,366)
Financial charges - net 26 (427,381) (317,472)
Income before zakat and foreign income tax 2,075,517 1,600,760
Zakat and foreign income tax 16 (268,148) (132,024)
Net income for the year 1,807,369 1,468,736
Net income attributable to:
Shareholders’ of the parent company 1,402,209 1,202,376
Non-controlling interest’s share of year’s net income
in subsidiaries 405,160 266,360
Net income for the year 1,807,369 1,468,736
Earnings per share (in Saudi Riyals): 28
Operating income 4.91 3.60
Net income for the year attributable to the shareholders’ of the parent company
2.80
2.40
The notes on pages 8 to 30 form an integral part of these consolidated financial statements.

5
SAVOLA GROUP COMPANY (A Saudi Joint Stock Company) Consolidated cash flow statement
(All amounts in Saudi Riyals thousands unless otherwise stated)
Year ended December 31,
2012 2011
Cash flow from operating activities
Net income for the year 1,807,369 1,468,736
Adjustments for non-cash items
Depreciation, amortization, impairment and amortization of deferred gain
564,007
558,234
Share in net income of associates (568,793) (436,863)
Financial charges - net 427,381 317,472
Gain from disposal of investments (46,651) (152,781)
Gain on sale of property, plant and equipment (3,542) (10,087)
Changes in working capital
Accounts receivable 367,680 (71,319)
Inventories (820,973) (596,908)
Prepayments and other receivables (661,925) 174,191
Accounts payable 25,277 486,910
Accrued and other liabilities 554,871 (195,281)
Employee termination benefits 46,488 31,157
Net cash generated from operating activities 1,691,189 1,573,461
Cash flow from investing activities
Dividends received 228,098 222,303
Proceeds from sale of investments 173,049 142,069
Change in long term receivables 140,779 -
Effect of acquisition transaction with non-controlling interest without change in control
61,485
-
Proceeds from sale of property, plant and equipment 55,853 94,807
Addition to deferred charges (51,309) (37,054)
Purchase of property, plant and equipment (1,070,183) (674,044)
Additions to investments (1,997,832) (219,892)
Cash effect of consolidation of an associate - 141,313
Acquisition of subsidiaries, net of cash - (445,642)
Net change in other investments - 7,864
Net cash utilized in investing activities (2,460,060) (768,276)
Cash flow from financing activities
Net change in short-term borrowings 771,846 644,686
Additions to long-term borrowings 1,550,000 1,045,010
Repayments of long-term borrowings (504,399) (909,257)
Net change in restricted deposits financing 8,479 (20,963)
Changes in non-controlling interest (158,128) (112,841)
Financial charges - net (427,381) (317,472)
Dividends paid (742,371) (497,678)
Net cash generated from (utilized in) financing activities 498,046 (168,515)
(Continued)

6
SAVOLA GROUP COMPANY (A Saudi Joint Stock Company) Consolidated cash flow statement (continued)
(All amounts in Saudi Riyals thousands unless otherwise stated)
Year ended December 31,
Note 2012 2011
Net change in cash and cash equivalents (270,825) 636,670
Cash and cash equivalents at beginning of year 1,214,084 577,414
Cash and cash equivalents at end of year 943,259 1,214,084
Supplemental schedule of non-cash information
Directors’ remuneration 2,200 2,200
Other reserves 10 (4,893) 89,304
Currency translation differences 10 (167,398) (73,244)
Investment properties classified as held for sale 8 - 467,359
The notes on pages 8 to 30 form an integral part of these consolidated financial statements.

7
SAVOLA GROUP COMPANY (A Saudi Joint Stock Company) Notes to the consolidated financial statements for the year ended December 31, 2012 Consolidated statement of changes in shareholders' equity
(All amounts in Saudi Riyals thousands unless otherwise stated)
Share capital
Statutory reserve
General Reserve
Other reserves
Effect of acquisition transaction
with non-controlling
interest without
change in control
Currency translation differences
Retained earnings
Total shareholders
equity
Non-controlling
interest
Total equity
Note
January 1, 2012 5,000,000 1,077,010 4,000 (808) (59,443) (303,670) 2,005,378 7,722,467 1,348,350 9,070,817
Net income for the year - - - - - - 1,402,209 1,402,209 405,160 1,807,369
Transfer to statutory reserve 22 - 140,221 - - - - (140,221) - - -
Dividends 29 - - - - - - (725,000) (725,000) - (725,000)
Other reserves adjustment 10 - - - (4,893) - - - (4,893) - (4,893)
Currency translation differences - - - - - (167,398) - (167,398) - (167,398)
Directors remuneration 20 - - - - - - (2,200) (2,200) - (2,200)
Acquisition of non-controlling interest without change in control
- - - - 61,485 - - 61,485
-
61,485
Other changes in non-controlling interests
- - - - - - - -
(158,128)
(158,128)
December 31, 2012 5,000,000 1,217,231 4,000 (5,701) 2,042 (471,068) 2,540,166 8,286,670 1,595,382 9,882,052
January 1, 2011 5,000,000 956,772 4,000 (90,112) (45,637) (230,426) 1,425,440 7,020,037 1,194,831 8,214,868
Net income for the year - - - - - - 1,202,376 1,202,376 266,360 1,468,736
Transfer to statutory Reserve 22 - 120,238 - - - (120,238) - - -
Dividends 29 - - - - - - (500,000) (500,000) - (500,000)
Other reserves adjustment 10 - - - 89,304 - - - 89,304 - 89,304
Currency translation differences - - - - - (73,244) - (73,244) - (73,244)
Directors remuneration 20 - - - - - - (2,200) (2,200) - (2,200) Acquisition of non-controlling interest without change in control
- - - - (13,806) - - (13,806)
- (13,806)
Other changes in non-controlling interests
- - - - - - - -
(112,841)
(112,841)
December 31, 2011 5,000,000 1,077,010 4,000 (808) (59,443) (303,670) 2,005,378 7,722,467 1,348,350 9,070,817
The notes on pages 8 to 30 form an integral part of these consolidated financial statements.

SAVOLA GROUP COMPANY (A Saudi Joint Stock Company) Notes to the consolidated financial statements for the year ended December 31, 2012
(All amounts in Saudi Riyals thousands unless otherwise stated)
8
1 General information Savola Group Company (the “Company”) and its subsidiaries (collectively the “Group”) consist of the Company and its various Saudi Arabian and foreign subsidiaries. The objectives of the Company along with its subsidiaries includes the manufacturing and sale of vegetable oils and to set up related industries, retail outlets, dairy products, fast foods, packing materials, exports and imports, commercial contracting, trade agencies, development of agricultural products and real estate related investment activities. The Company is a Saudi Joint Stock company registered in the Kingdom of Saudi Arabia under Commercial Registration No. 4030019708 issued in Jeddah on Rajab 21, 1399H (corresponding to June 16, 1979). The Company was formed under the Regulations for Companies in the Kingdom of Saudi Arabia per Royal Decree number M/21 dated Rabi-ul-Awal 29, 1398H (March 9, 1978). The registered address of the Company is Saudi Business Centre, Madinah Road, Jeddah, Kingdom of Saudi Arabia, Kingdom of Saudi Arabia. At December 31, the Group has investments in the following subsidiaries (collectively referred as “the Group”): (a) Direct subsidiaries of the Company
(i) Operating subsidiaries
(ii) Dormant and Holding subsidiaries
Ownership interest (%)
Country of Principal business at December 31 Subsidiary name incorporation Activity 2012 2011
Savola Foods Company (“SFC”) Saudi Arabia Foods 90 90
Al-Azizia Panda United Company (“APU”) Saudi Arabia Retail 74.4 74.4
Savola Packaging Systems Limited ("SPS") Saudi Arabia
Manufacturing of Plastic packaging products
100
100
Al Matoun International for Real Estate Investment Holding Company
Saudi Arabia
Real Estate
80
80
United Sugar Company, Egypt (“USCE”) Egypt Manufacturing of Sugar 19.1 19.1
Giant Stores Trading Company (“Giant”) Saudi Arabia Retail 8 8
United Company for Central Markets (“UCCM”)
Lebanon
Retail
8
8
Ownership interest (%)
Country of Principal business at December 31 Subsidiary name incorporation Activity 2012 2011
Kafazat Al Kawniah for Real Estate Limited Saudi Arabia Holding Company 80 80
Alwaqat Al Kawniah Limited Saudi Arabia Holding Company 60 60
Aalinah Al Kawniah Limited Saudi Arabia Holding Company 100 100
Abtkar Al Kawniah Limited Saudi Arabia Holding Company 80 80
Adeem Arabia Company Ltd. (“AAC”) Saudi Arabia Holding Company 80 80
Savola Industrial Investments Co. ("SIIC") Saudi Arabia Holding Company 4.5 4.5
Utur Packaging Materials Company Limited (“Utur”)
Saudi Arabia
Holding Company
100
100
Al Mojammat Al Mowahadah Real Estate Company (“Mojammat”)
Saudi Arabia
Holding Company
100
100
Marasina International Real Estate Investment Ltd.
Saudi Arabia
Holding Company
100
100
Asda'a International Real Estate Investment Ltd.
Saudi Arabia
Holding Company
100
100
Masa'ay International Real Estate Investment Ltd.
Saudi Arabia Holding Company
100
100

SAVOLA GROUP COMPANY (A Saudi Joint Stock Company) Notes to the consolidated financial statements for the year ended December 31, 2012
(All amounts in Saudi Riyals thousands unless otherwise stated)
9
(ii) Dormant and Holding subsidiaries (continued)
(b) Subsidiaries controlled through SFC
Ownership interest (%)
Country of Principal business at December 31 Subsidiary name incorporation Activity 2012 2011
Saraya International Real Estate Investment Ltd.
Saudi Arabia
Holding Company
100
100
Savola Trading International Limited Saudi Arabia Dormant Company 100 100
United Properties Development Company ("UPDC")
Saudi Arabia Dormant Company
100 100
Kamin Al Sharq for Industrial Investments (“Kamin”)
Saudi Arabia Dormant Company
100 100
Arabian Sadouk for telecommunications Co.(“Sadouk”)
Saudi Arabia Dormant Company
100 100
Al Maoun International Holding Company Saudi Arabia Dormant Company 100 100
Afia Foods Arabia Saudi Arabia Dormant Company 100 100
Al Gharra International for Real Estate Development Company
Saudi Arabia
Holding Company
100
-
Afia International Company (“AIC”) Saudi Arabia Manufacturing of Edible oil 95.19 95.19
SIIC Saudi Arabia Holding Company 95 95
Savola Foods Emerging Markets Company Limited (“SFEM”)
British Virgin Islands
Holding Company 95.4 95.4
Savola Foods for Sugar Company (“SFSC”) Cayman Islands Holding Company 95 95
El Maleka for Food Industries Company (“El Maleka”)
Egypt
Manufacturing of Pasta
100
100
El Farasha for Food Industries Company (“El Farasha”)
Egypt
Manufacturing of Pasta 100 100
Savola Foods Company International (“SFCI”) Limited
UAE Holding Company 100 -
International Foods Industries Company Limited (“IFI”)
Saudi Arabia
Manufacturing of Specialty fats 60 -
Alexandria Sugar Company Egypt (“ASCE”) Egypt Manufacturing of Sugar 19 19 SIIC United Sugar Company (“USC”) Saudi Arabia Manufacturing of Sugar 74.48 74.48 USC USCE Egypt Manufacturing of Sugar 56.75 56.75
ASCE Egypt Manufacturing of Sugar 62 62
Beet Sugar Industries Cayman Islands Dormant Company 100 100
USCE
ASCE Egypt Manufacturing of Sugar 19 19
SFEM
Savola Morocco Company Morocco Manufacturing of Edible oils
100
100
Savola Edible Oils (Sudan) Ltd. Sudan Manufacturing of Edible oils
100
100
AFIA International Company – Algeria Algeria Manufacturing of Edible oils
100
100

SAVOLA GROUP COMPANY (A Saudi Joint Stock Company) Notes to the consolidated financial statements for the year ended December 31, 2012
(All amounts in Saudi Riyals thousands unless otherwise stated)
10
(c) Subsidiaries controlled through AIC
(d) Subsidiaries controlled through APU
(e) Subsidiaries controlled through SPS
During 2012, as per the terms of the Master Joint Venture Agreement between the Group and Al Muhaidib Holding Company Limited (“Al Muhaidib”) entered into during the year ended December 31, 2008 to acquire Giant and other operations and sell 20% of APU equity, the Group received a settlement of Saudi Riyals 61.4 million from Al Muhaidib relating to non-completion of transfer of ownership of the Al Muhaidib’s Qatar operations to Savola Group due to certain local regulations. Such settlement was recorded within equity as part of ‘Effect of transactions with non-controlling interest without change in control’ since it is treated as additional consideration on disposal of 20% APU equity.
Subsidiary ownership Subsidiary name
Country of incorporation
Principal business activity
interest (%) at December 31
2012 2011
Savola Behshahr Company (SBeC) Iran Holding Company 80 80 Malintra Holdings Luxembourg Holding Company 100 100
Savola Foods Limited (“SFL”) British Virgin Islands
Holding Company
100
100
Afia International Company - Jordan Jordan Manufacturing of Edible oils 97.4 97.4
Inveskz Inc. British Virgin islands
Holding Company
90
90
Afia Trading International British Virgin islands
Trading Company
100
100
Savola Foods International British Virgin Islands
Dormant Company 100 100
KUGU Gida Yatum Ve Ticaret A.S (“KUGU”) Turkey Holding Company 100 100 SBeC Behshahr Industrial Company Iran Manufacturing of Edible oils 79.9 79.9 Margarine Manufacturing Company Iran Manufacturing of Edible oils 79.9 79.9 Tolue Pakshe Aftab (“TPA”) Company Iran Trading and Distribution 100 - SFL Afia International Company, Egypt Egypt Manufacturing of Edible oils 99.92 99.92
Latimar International Limited British Virgin islands
Dormant Company
100
100
Elington International Limited British Virgin islands
Dormant Company
100
100
Inveskz Inc. Savola Foods CIS Kazakhstan Manufacturing of Edible oils 100 100 KUGU Yudum Gida Sanayi ve Ticaret A.S (“Yudum”)
Turkey
Manufacturing of Edible oils
100
100
APU Giant Saudi Arabia Retail 90 90 UCCM Lebanon Retail 90 90 Giant Lebanese Sweets and Bakeries (“LSB”) Saudi Arabia Dormant Company 95 95
SPS
New Marina for Plastic Industries Egypt Manufacturing of plastic packaging products 100 100
Al Sharq Company for Plastic Industries. Ltd. (“Al-Sharq”) Saudi Arabia
Manufacturing of plastic packaging products 100 100

SAVOLA GROUP COMPANY (A Saudi Joint Stock Company) Notes to the consolidated financial statements for the year ended December 31, 2012
(All amounts in Saudi Riyals thousands unless otherwise stated)
11
Effective September 16, 2009, the Group’s subsidiary, APU acquired the operations of Saudi Geant Company Limited ("Geant") for a total consideration of Saudi Riyals 469.3 million, including cash consideration of Saudi Riyals 232 million and a deferred equity consideration of Saudi Riyals 237.3 million. The Company had paid the cash consideration on October 12, 2009 whereas the deferred equity component was settled during 2010, through issuance of 45.7 million new shares of APU at a price of Saudi Riyals 51.92 per share. Also as per the agreement, Geant is entitled to acquire 1% share of APU each year at the fair value for a period of up to 3 years. These consolidated financial statements were authorized for issue by the Company's Board of Directors on February 13, 2013.
2 Summary of significant accounting policies
The principal accounting policies applied in the preparation of these consolidated financial statements are set out below. These policies have been consistently applied to all years presented, unless otherwise stated. 2.1 Basis of preparation
The accompanying consolidated financial statements have been prepared under the historical cost convention on the accrual basis of accounting, as modified by revaluation of available-for-sale investments and derivative financial instruments to fair value, and in compliance with accounting standards promulgated by Saudi Organization for Certified Public Accountants. 2.2 Critical accounting estimates and judgments
The preparation of financial statements in conformity with generally accepted accounting principles requires the use of certain critical estimates and assumptions that affect the reported amounts of assets and liabilities and disclosure of contingent assets and liabilities at the reporting date and the reported amounts of revenues and expenses during the reporting period. Estimates and judgments are continually evaluated and are based on historical experience and other factors, including expectations of future events that are believed to be reasonable under the circumstances. The Group makes estimates and assumptions concerning the future. The resulting accounting estimates will, by definition, seldom equal the related actual results. The estimates and assumptions that have a significant risk of causing a material adjustment to the carrying amounts of assets and liabilities within the next financial year are discussed below:
(a) Impairment of goodwill The Group tests annually whether goodwill has suffered any impairment, in accordance with the accounting policy stated in Note 2.3. The recoverable amounts of cash generating units have been determined based on value-in-use calculations. These calculations require the use of estimates. (b) Impairment of available for sale investments The Group exercises judgment to calculate the impairment loss of available for sale investments as well as their underlying assets. This includes the assessment of objective evidence which causes an other than temporary decline in the value of investments. Any significant and prolonged decline in the fair value of equity investment below its cost is considered as objective evidence for the impairment. The determination of what is 'significant' and 'prolonged' requires judgment. The Group also considers impairment to be appropriate when there is evidence of deterioration in the financial health of the investee, industry and sector performance, changes in technology, and operational and financing cash flows.
(c) Provision for doubtful debts A provision for impairment of account receivables is established when there is objective evidence that the Group will not be able to collect all amounts due according to the original terms of the receivables. Significant financial difficulties of the debtor, probability that the debtor will enter bankruptcy or financial reorganization, and default or delinquency in payments are considered indicators that the trade receivable is impaired. For significant individual amounts, assessment is made at individual basis. Amounts which are not individually significant, but are over due, are assessed collectively and a provision is recognized considering the length of time considering the past recovery rates.
(d) Provision for inventory obsolescence The Group determines its provision for inventory obsolescence based upon historical experience, expected inventory turnover, inventory aging and current condition, and current and future expectations with respect to sales. Assumptions underlying the provision for inventory obsolescence include future sales trends, and the

SAVOLA GROUP COMPANY (A Saudi Joint Stock Company) Notes to the consolidated financial statements for the year ended December 31, 2012
(All amounts in Saudi Riyals thousands unless otherwise stated)
12
expected inventory requirements and inventory composition necessary to support these future sales and offerings. The estimate of the Group's provision for inventory obsolescence could materially change from period to period due to changes in product offerings of those products. 2.3 Investments
(a) Subsidiaries Subsidiaries are entities over which the Group has the power to govern the financial and operating policies to obtain economic benefit generally accompanying a shareholding of more than one half of the voting rights. The existence and effect of potential voting rights that are currently exercisable or convertible are considered when assessing whether the Group controls another entity. Subsidiaries are fully consolidated from the date on which control is transferred to the Group. They are de-consolidated from the date that control ceases. The purchase method of accounting is used to account for the acquisition of subsidiaries. The cost of an acquisition is measured as the fair value of the assets given or liabilities incurred or assumed at the date of acquisition, plus costs directly attributable to the acquisition. The excess of the cost of acquisition over the fair value of the Group’s share of the identifiable net assets acquired is recorded as goodwill. Goodwill arising from acquisition of subsidiaries is reported under "intangible assets" in the accompanying balance sheet. Goodwill is tested annually for impairment and carried at cost, net of any accumulated amortization and impairment losses, if any. The subsidiaries on which the Group control is temporary are not consolidated and are accounted for as an associates.
Inter-company transactions, balances and unrealized gains on transactions between Group companies are eliminated. Unrealized losses are also eliminated. Accounting policies of subsidiaries have been changed where necessary to ensure consistency with the policies adopted by the Group. Changes in a group’s ownership interest in a subsidiary after acquiring control, is accounted as equity transactions and the carrying amounts of the minority interests is adjusted against the fair value of the consideration paid and any difference is recognized directly in equity under “Effect of acquisition transactions with non-controlling interest without change in control”. (b) Associates Associates are entities over which the Group has significant influence but not control, generally accompanying a shareholding of between 20% and 50% of the voting rights. Investments in associates are accounted for using the equity method of accounting and are initially recognized at cost. The Group’s investment in associates includes goodwill identified on acquisition, net of any accumulated amortization and impairment losses, if any. The Group’s share of its associates’ post-acquisition income or losses is recognized in the income statement, and its share of post-acquisition movements in reserves is recognized in reserves. The cumulative post-acquisition movements are adjusted against the carrying amount of the investment. When the Group’s share of losses in associate companies equals or exceeds its interest in the associate and jointly-controlled company, including any other unsecured receivables, the Group does not recognize further losses, unless it has incurred obligations or made payments on behalf of the associate. Dilution gains and losses arising in investments in associates are recognized in the income statement. (c) Investment in available-for sale investments Available-for-sale investments principally consist of less than 20% equity investments in certain quoted/unquoted investments. These investments are included in non-current assets unless management intends to sell such investments within twelve months from the balance sheet date. These investments are initially recognized at cost and are subsequently re-measured at fair value at each reporting date as follows: (i) Fair values of quoted securities are based on available market prices at the reporting date adjusted for any
restriction on the transfer or sale of such investments; and (ii) Fair values of unquoted securities are based on a reasonable estimate determined by reference to the
current market value of other similar quoted investment securities or is based on the expected discounted cash flows.

SAVOLA GROUP COMPANY (A Saudi Joint Stock Company) Notes to the consolidated financial statements for the year ended December 31, 2012
(All amounts in Saudi Riyals thousands unless otherwise stated)
13
Cumulative adjustments arising from revaluation of these investments are reported as separate component of equity as other reserves until the investment is disposed. 2.4 Segment reporting
(a) Business segment A business segment is group of assets, operations or entities: (i) engaged in revenue producing activities; (ii) results of its operations are continuously analyzed by management in order to make decisions related to
resource allocation and performance assessment; and (iii) financial information is separately available. (b) Geographical segment A geographical segment is group of assets, operations or entities engaged in revenue producing activities within a particular economic environment that are subject to risks and returns different from those operating in other economic environments. 2.5 Foreign currency translations
(a) Reporting currency These consolidated financial statements are presented in Saudi Riyals which is the reporting currency of the Group. (b) Transactions and balances Foreign currency transactions are translated into Saudi Riyals using the exchange rates prevailing at the dates of the transactions. Foreign exchange gains and losses resulting from the settlement of such transactions and from the translation at the year-end exchange rates of monetary assets and liabilities denominated in foreign currencies are recognized in the income statement. (c) Group companies The results and financial position of foreign subsidiaries and associates having reporting currencies other than Saudi Riyals are translated into Saudi Riyals as follows: (i) assets and liabilities for each balance sheet presented are translated at the closing exchange rate at the
date of that balance sheet; (ii) income and expenses for each the income statement are translated at average exchange rates; and (iii) components of the equity accounts are translated at the exchange rates in effect at the dates of the
related items originated. Cumulative adjustments resulting from the translations of the financial statements of foreign subsidiaries and associates into Saudi Riyals are reported as a separate component of equity. Any goodwill arising on acquisition of foreign subsidiaries and any subsequent fair value adjustments to the carrying values of assets and liabilities arising on the acquisition are treated as assets and liabilities of the foreign subsidiaries and translated at the closing rate and recognized in the equity. Dividends received from associates are translated at the exchange rate in effect at the transaction date and related currency translation differences are realized in the income statement. When investments in foreign subsidiaries and associates are partially disposed off or sold, currency translation differences that were recorded in equity are recognized in income as part of gain or loss on disposal or sale. 2.6 Cash and cash equivalents
Cash and cash equivalents include cash in hand and with banks and other short-term highly liquid investments with maturities of three months or less from the purchase date.
SAVOLA GROUP COMPANY (A Saudi Joint Stock Company) Notes to the consolidated financial statements for the year ended December 31, 2012
(All amounts in Saudi Riyals thousands unless otherwise stated)
14
2.7 Accounts receivable
Accounts receivable are carried at original invoice amount less provision for doubtful debts. A provision against doubtful debts is established when there is objective evidence that the Group will not be able to collect all amounts due according to the original terms of the receivables. Such provisions are charged to the income statement and reported under “General and administrative expenses”. When account receivable is uncollectible, it is written-off against the provision for doubtful debts. Any subsequent recoveries of amounts previously written-off are credited against “General and administrative expenses” in the income statement. 2.8 Inventories
Inventories are carried at the lower of cost or net realizable value. Cost is determined using weighted average method. The cost of finished products include the cost of raw materials, labor and production overheads. Inventories in transit are valued at cost. Stores and spares are valued at cost, less any provision for slow moving items. Net realizable value is the estimated selling price in the ordinary course of business, less the costs of completion and selling expenses. 2.9 Property, plant and equipment
Property, plant and equipment are carried at cost less accumulated depreciation except construction in progress which is carried at cost. Land is not depreciated. Depreciation is charged to the income statement, using the straight-line method, to allocate the costs of the related assets to their residual values over the following estimated useful lives: Years
Buildings 12.5 - 33
Leasehold improvements 3 - 33
Plant and equipment 3 - 30
Furniture and office equipment 3 - 16
Vehicles 4 - 10
Gains and losses on disposals are determined by comparing proceeds with carrying amount and are included in the income statement. Maintenance and normal repairs which do not materially extend the estimated useful life of an asset are charged to the income statement as and when incurred. Major renewals and improvements, if any, are capitalized and the assets so replaced are retired. 2.10 Investment property
Property held for long-term rental yields or for capital appreciation or both, which is not occupied by the Group is classified as investment property and is reported under “Other investments”. Investment property comprises land, buildings and lease hold improvements. Investment property is recorded at historical cost, net of accumulated depreciation. Historical cost includes expenditure that is directly attributable to the acquisition of the assets. Subsequent costs are included in the asset's carrying amount or recognized as a separate asset, as appropriate, only when it is probable that future economic benefits associated with the asset will flow to the Group and the cost of the asset can be measured reliably. The carrying amount of the replaced part is derecognized. All other repairs and maintenance costs are charged to the income statement during the financial period in which they are incurred. Land is not depreciated. 2.11 Deferred charges
Costs that are not of benefit beyond the current period are charged to the income statement, while costs that will benefit future periods are capitalized. Deferred charges, reported under “Intangible assets” in the accompanying balance sheet, include certain indirect construction costs incurred by the Group in relation to setting up its retail outlets. Such costs are amortized over periods which do not exceed five years.

SAVOLA GROUP COMPANY (A Saudi Joint Stock Company) Notes to the consolidated financial statements for the year ended December 31, 2012
(All amounts in Saudi Riyals thousands unless otherwise stated)
15
2.12 Impairment of non-current assets
Non-current assets are reviewed for impairment whenever events or changes in circumstances indicate that the carrying amount may not be recoverable. An impairment loss is recognized for the amount by which the carrying amount of the asset exceeds its recoverable amount which is the higher of an asset’s fair value less cost to sell and value in use. For the purpose of assessing impairment, assets are grouped at lowest levels for which there are separately identifiable cash flows (cash-generating units). Non-current assets other than intangible assets that suffered impairment are reviewed for possible reversal of impairment at each reporting date. Where an impairment loss subsequently reverses, the carrying amount of the asset or cash-generating unit is increased to the revised estimate of its recoverable amount, but the increased carrying amount should not exceed the carrying amount that would have been determined, had no impairment loss been recognized for the assets or cash-generating unit in prior years. A reversal of an impairment loss is recognized as income immediately in the income statement. Impairment losses recognized on intangible assets are not reversible. 2.13 Assets and liabilities classified as held for sale
Assets held for sale comprises of assets and liabilities or disposal group that are expected to be recovered primarily through sale rather than through continuing use. Immediately before classification as held for sale, all assets under disposal group are measured at the lower of their carrying amount and fair value less cost to sell. Subsequent to initial recognition, any impairment loss on a disposal group is first allocated to goodwill, (if there is any) and then to remaining assets and liabilities on pro rata basis. However, no loss is allocated to financial assets, which continued to be measured in accordance with their initial accounting policies. Gains or losses on disposal of such assets or disposal group are recognized in consolidated income statement currently. 2.14 Borrowings Borrowings are recognized at the proceeds received, net of transaction costs incurred, if any. Borrowing costs that are directly attributable to the acquisition, construction or production of qualifying assets are capitalized as part of those assets. Other borrowing costs are charged to the income statement. 2.15 Accounts payable and accruals
Liabilities are recognized for amounts to be paid for goods and services received, whether or not billed to the Group. 2.16 Provisions Provisions are recognized when; the Group has a present legal or constructive obligation as a result of a past event; it is probable that an outflow of resources will be required to settle the obligation; and the amount can be reliably estimated. 2.17 Zakat and taxes
The Company is subject to zakat in accordance with the regulations of the Department of Zakat and Income Tax (“DZIT”). Foreign shareholders in the consolidated Saudi Arabian subsidiaries are subject to income taxes. Income tax provisions related to the foreign shareholders in such subsidiaries are charged to the minority interest in the accompanying consolidated financial statements. Provision for zakat for the Company and zakat related to the Company’s ownership in the Saudi Arabian subsidiaries is charged to the income statement. Additional amounts payable, if any, at the finalization of final assessments are accounted for when such amounts are determined. The Company and its Saudi Arabian subsidiaries withhold taxes on certain transactions with non-resident parties in the Kingdom of Saudi Arabia as required under Saudi Arabian Income Tax Law. Foreign subsidiaries are subject to income taxes in their respective countries of domicile. Such income taxes are charged to consolidated income statement. Deferred income tax assets are recognized on carry-forward tax losses and on all major temporary differences between financial income and taxable income to the extent that it is probable that future taxable profit will be available against which such carry-forward tax losses and the temporary differences can be utilized. Deferred income tax liabilities are recognized on significant temporary differences expected to result in an income tax liability in future periods. Deferred income taxes are determined using tax rates which have been enacted by the balance sheet date and are expected to apply when the related deferred income tax asset is realized or the deferred income tax liability is settled.

SAVOLA GROUP COMPANY (A Saudi Joint Stock Company) Notes to the consolidated financial statements for the year ended December 31, 2012
(All amounts in Saudi Riyals thousands unless otherwise stated)
16
2.18 Employee termination benefits
Employee termination benefits required by Saudi Labor and Workman Law are accrued by the Company and its Saudi Arabian subsidiaries and charged to the income statement. The liability is calculated; as the current value of the vested benefits to which the employee is entitled, should the employee leave at the balance sheet date. Termination payments are based on employees’ final salaries and allowances and their cumulative years of service, as stated in the laws of Saudi Arabia. The foreign subsidiaries provide currently for employee termination and other benefits as required under the laws of their respective countries of domicile. There are no funded or unfunded benefit plans established by the foreign subsidiaries. 2.19 Revenues
Revenues are recognized upon delivery of products and customer acceptance, if any, or on the performance of services. Revenues are shown net of discounts and transportation expenses, and after eliminating sales within the Group. Rental income from operating leases is recognized in the income statement on a straight-line basis over the lease term. Promotional and display income is comprised of income earned from promotion and display of various products by vendors within the Group's retail stores, and is recognized in the period in which the product is listed. Dividend income is recognized when the right to receive payment is established. 2.20 Selling, marketing and general and administrative expenses
Selling, marketing and general and administrative expenses include direct and indirect costs not specifically part of production costs as required under generally accepted accounting principles. Allocations between selling, marketing and general and administrative expenses and production costs, when required, are made on a consistent basis. 2.21 Dividends
Dividends are recorded in the financial statements in the period in which they are approved by shareholders of Group. 2.22 Derivative financial instruments
The Group uses derivative financial instruments (commodity future contracts) to hedge its price risk of raw material in the Sugar business. Derivatives are measured at fair value, and changes in the fair value of a derivative hedging instrument are recognized in statement of income under cost of sales as an adjustment to the carrying amount of hedged item, the inventory. 2.23 Operating leases
Rental expenses under operating leases are charged to the income statement over the period of the respective lease.
3 Financial instruments and risk management The Group’s activities expose it to a variety of financial risks: market risk (including currency risk, fair value and cash flow interest rate risks and price risk), credit risk and liquidity risk. The Group’s overall risk management program focuses on the unpredictability of financial markets and seeks to minimize potential adverse effects on the Group’s financial performance. The Group uses derivative financial instruments to hedge certain risk exposures. Risk management is carried out by senior management under policies approved by the board of directors. Senior management identifies, evaluates and hedges financial risks in close co-operation with the Group’s operating units. The most important types of risk are credit risk, currency risk and fair value and cash flow interest rate risks. Financial instruments carried on the balance sheet include cash and cash equivalents, accounts receivable, investments, long term receivables, short-term and long-term borrowings, accounts payable and accrued and other current liabilities. The particular recognition methods adopted are disclosed in the individual policy statements associated with each item.

SAVOLA GROUP COMPANY (A Saudi Joint Stock Company) Notes to the consolidated financial statements for the year ended December 31, 2012
(All amounts in Saudi Riyals thousands unless otherwise stated)
17
Financial asset and liability is offset and net amounts reported in the financial statements, when the Group has a legally enforceable right to set off the recognized amounts and intends either to settle on a net basis, or to realize the asset and liability simultaneously. 3.1 Currency risk Currency risk is the risk that the value of a financial instrument will fluctuate due to changes in foreign exchange rates. The Group’s transactions are principally in Saudi Riyals, US Dollars, Iranian Riyals, Egyptian Pounds, and Turkish Lira. The Group operates internationally and is exposed to foreign exchange risk arising from various currency exposures. The Group also has investments in foreign subsidiaries and associates, whose net assets are exposed to currency translation risk. Currently, such exposures are mainly related to exchange rate movements between Saudi Riyals against Turkish Lira, Egyptian Pounds and Iranian Riyals. Such exposures are recorded as a separate component of shareholders’ equity in the accompanying financial statements. The Group’s management monitors such exposures and considers the use of forward exchange contracts and borrowings denominated in the relevant foreign currency to hedge the foreign currency exposures. 3.2 Fair value and cash flow interest rate risks Fair value and cash flow interest rate risks are the exposures to various risks associated with the effect of fluctuations in the prevailing interest rates on the Group’s financial positions and cash flows. The Group’s interest rate risks arise mainly from its short-term deposits and bank borrowings, which are at floating rate of interest and are subject to re-pricing on a regular basis. Management monitors the changes in interest rates and believes that the fair value and cash flow interest rate risks to the Group are not significant. 3.3 Price risk The risk that the value of a financial instrument will fluctuate as a result of changes in market prices, whether those changes are caused by factors specific to the individual instrument or its issuer or factors affecting all instruments traded in the market. The Group is exposed to equity securities price risk because Group holds investment in certain listed equities which are classified on the balance sheet as available-for-sale investments. The Group diversifies its portfolio to manage its price risk arising from investments in equity securities. 3.4 Credit risk Credit risk is the risk that one party to a financial instrument will fail to discharge an obligation and cause the other party to incur a financial loss. The Group has no significant concentration of credit risk. Cash and cash equivalents are placed with banks with sound credit ratings. Accounts receivable are carried net of provision for doubtful debts. 3.5 Liquidity risk Liquidity risk is the risk that an enterprise will encounter difficulty in raising funds to meet commitments associated with financial instruments. Liquidity risk may result from an inability to sell a financial asset quickly at an amount close to its fair value. Liquidity risk is managed by monitoring on a regular basis that sufficient funds are available through committed credit facilities to meet any future commitments. As at December 31, 2012, the Group has unused bank financing facilities amounting to Saudi Riyals 3.2 billion (2011: Saudi Riyals 3.4 billion) 3.6 Fair value Fair value is the amount for which an asset could be exchanged, or a liability settled between knowledgeable willing parties in an arm’s length transaction. As the Group's financial instruments are compiled under the historical cost convention, except for available-for-sale investments which are carried at fair values, differences can arise between the book values and fair value estimates. Management believes that the fair values of the Group's financial assets and liabilities are not materially different from their carrying values.
4 Segment information The Group operates principally in the following major business segments: Foods - includes manufacturing and sale of Edible oils, Sugar and Pasta products. Retail - includes Group’s hyper and super markets operations. Plastic - includes manufacturing and sale of Plastic products for industrial and commercial use. Investment and other activities segment - includes Group subsidiaries which are engaged in real estate activities, investments in associates, available-for-sale investments and other investments.
SAVOLA GROUP COMPANY (A Saudi Joint Stock Company) Notes to the consolidated financial statements for the year ended December 31, 2012
(All amounts in Saudi Riyals thousands unless otherwise stated)
18
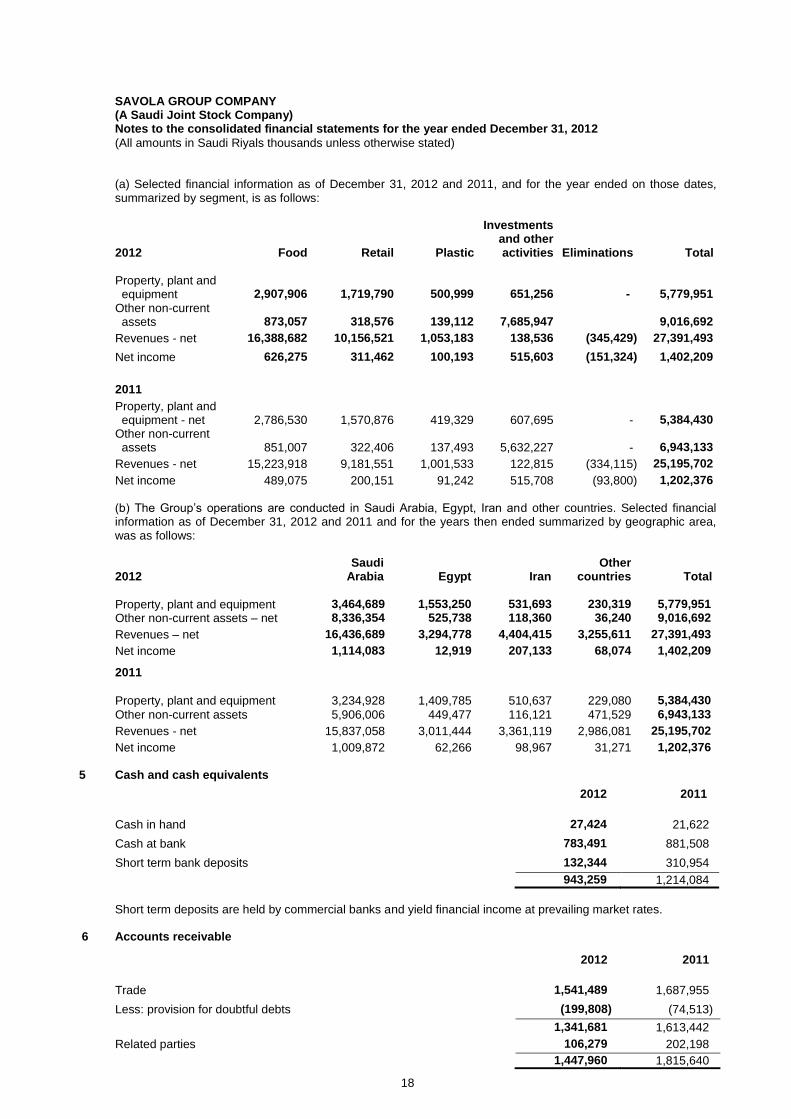
(a) Selected financial information as of December 31, 2012 and 2011, and for the year ended on those dates, summarized by segment, is as follows: 2012
Food
Retail
Plastic
Investments and other activities
Eliminations
Total
Property, plant and equipment
2,907,906
1,719,790
500,999
651,256
-
5,779,951
Other non-current assets
873,057
318,576
139,112
7,685,947
9,016,692
Revenues - net 16,388,682 10,156,521 1,053,183 138,536 (345,429) 27,391,493
Net income 626,275 311,462 100,193 515,603 (151,324) 1,402,209
2011
Property, plant and equipment - net
2,786,530
1,570,876
419,329
607,695
-
5,384,430
Other non-current assets
851,007
322,406
137,493
5,632,227
-
6,943,133
Revenues - net 15,223,918 9,181,551 1,001,533 122,815 (334,115) 25,195,702
Net income 489,075 200,151 91,242 515,708 (93,800) 1,202,376
(b) The Group’s operations are conducted in Saudi Arabia, Egypt, Iran and other countries. Selected financial information as of December 31, 2012 and 2011 and for the years then ended summarized by geographic area, was as follows: 2012
Saudi Arabia Egypt Iran
Other countries Total
Property, plant and equipment 3,464,689 1,553,250 531,693 230,319 5,779,951
Other non-current assets – net 8,336,354 525,738 118,360 36,240 9,016,692
Revenues – net 16,436,689 3,294,778 4,404,415 3,255,611 27,391,493
Net income 1,114,083 12,919 207,133 68,074 1,402,209 2011
Property, plant and equipment 3,234,928 1,409,785 510,637 229,080 5,384,430
Other non-current assets 5,906,006 449,477 116,121 471,529 6,943,133
Revenues - net 15,837,058 3,011,444 3,361,119 2,986,081 25,195,702
Net income 1,009,872 62,266 98,967 31,271 1,202,376
5 Cash and cash equivalents 2012 2011
Cash in hand 27,424 21,622
Cash at bank 783,491 881,508
Short term bank deposits 132,344 310,954
943,259 1,214,084
Short term deposits are held by commercial banks and yield financial income at prevailing market rates.
6 Accounts receivable 2012 2011
Trade 1,541,489 1,687,955
Less: provision for doubtful debts (199,808) (74,513)
1,341,681 1,613,442
Related parties 106,279 202,198
1,447,960 1,815,640

SAVOLA GROUP COMPANY (A Saudi Joint Stock Company) Notes to the consolidated financial statements for the year ended December 31, 2012
(All amounts in Saudi Riyals thousands unless otherwise stated)
19
7 Inventories
2012 2011
Finished products 1,981,367 1,516,400
Raw and packing materials 1,454,606 1,214,047
Work in process 180,431 120,980
Spare parts and supplies, not held for sale 210,098 213,054
Goods in transit 243,229 175,532
4,069,731 3,240,013
Less: provision for inventory obsolescence / slow moving (96,309) (87,564)
3,973,422 3,152,449
Certain inventories at December 31, 2012 and 2011 are pledged with foreign banks as collateral against bank borrowing facilities of certain consolidated subsidiaries.
8 Prepayments and others
Note 2012 2011
Advances to vendors and others 735,007 224,029
Investment properties classified as held for sale 8.2, 10.3 467,359 467,359
Prepaid rent and expenses 231,589 207,741
Receivable from government authorities 8.1 198,113 137,056
Current portion of long term receivables 10.3 163,687 132,550
Employee receivables 64,614 68,339
Balance relating to commodity future contracts 44,865 34,435
Unclaimed dividends 12,044 29,031
Restricted deposits 24,499 32,978
Other receivables 52,121 90,724
1,993,898 1,424,242
8.1 Receivable from government authorities
Receivable from government authorities represent claims of certain foreign consolidated subsidiaries from respective local governments on account of value added tax, custom duties, subsidies and advance taxes. 8.2 Investment properties classified as held for sale
Investment properties classified as held for sale at December 31, 2012 and 2011 represents land parcels owned by the Company held for sale. Also see note 10.3.
9 Assets and liabilities classified as held for sale
During the fourth quarter of 2010, as an outcome of the review of its foods business pruning strategy, the Group has decided to entrench its position in core markets and assess exiting from certain overseas operations. Accordingly, some of the overseas operations within the edible oils segment are presented as disposal group ‘held for sale’. Efforts to sell the disposal group have commenced. During the current year, Group management has entered into agreement with a third party to sell one part of such business. The net loss relating to these business disposal groups amounted to Saudi Riyals 2.1 million during 2012 (2011: net loss of Saudi Riyals 5.1 million). At December 31, 2012, the disposal group comprised assets of Saudi Riyals 186.3 million (2011: Saudi Riyals 167.4 million) and liabilities of Saudi Riyals 159.2 million (2011: Saudi Riyals 181.3 million) after recognition of impairment loss of Saudi Riyals 115 million during fourth quarter of 2010 held as follows:
SAVOLA GROUP COMPANY (A Saudi Joint Stock Company) Notes to the consolidated financial statements for the year ended December 31, 2012
(All amounts in Saudi Riyals thousands unless otherwise stated)
20
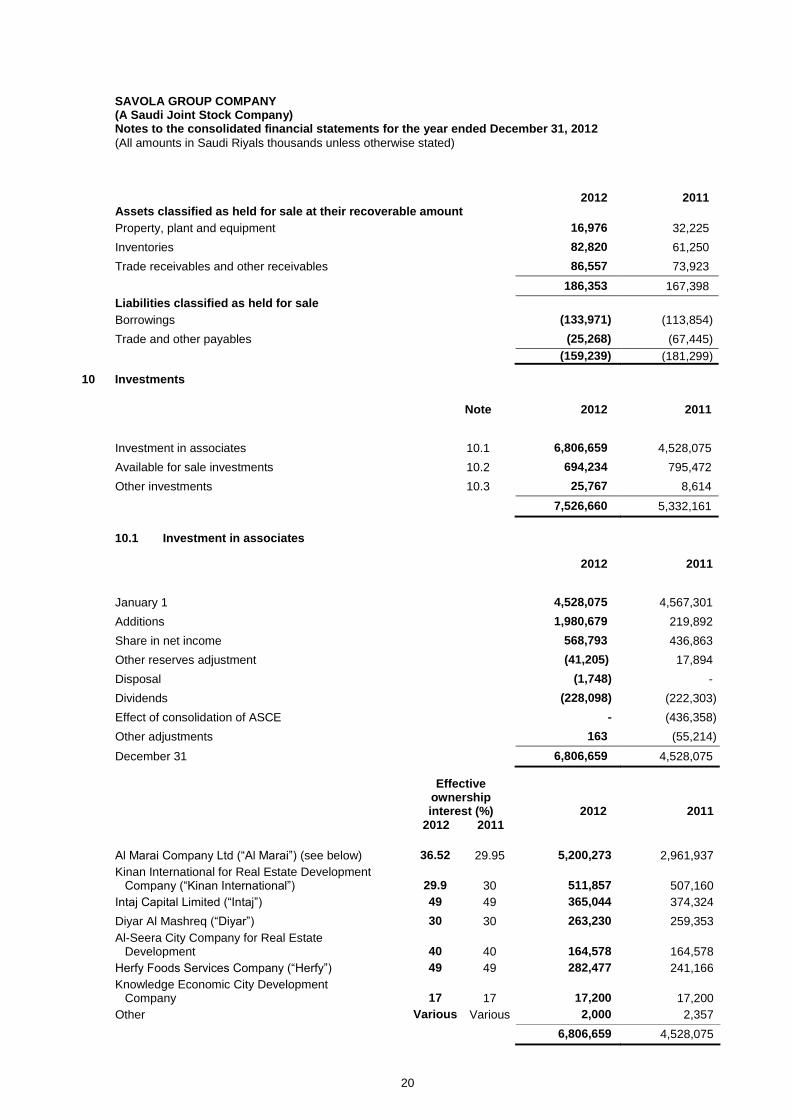
2012 2011 Assets classified as held for sale at their recoverable amount
Property, plant and equipment 16,976 32,225
Inventories 82,820 61,250
Trade receivables and other receivables 86,557 73,923
186,353 167,398
Liabilities classified as held for sale
Borrowings (133,971) (113,854)
Trade and other payables (25,268) (67,445)
(159,239) (181,299)
10 Investments
Note 2012 2011
Investment in associates 10.1 6,806,659 4,528,075
Available for sale investments 10.2 694,234 795,472
Other investments 10.3 25,767 8,614
7,526,660 5,332,161
10.1 Investment in associates
2012 2011
January 1 4,528,075 4,567,301
Additions 1,980,679 219,892
Share in net income 568,793 436,863
Other reserves adjustment (41,205) 17,894
Disposal (1,748) -
Dividends (228,098) (222,303)
Effect of consolidation of ASCE - (436,358)
Other adjustments 163 (55,214)
December 31 6,806,659 4,528,075
Effective
ownership interest (%)
2012
2011
2012 2011
Al Marai Company Ltd (“Al Marai”) (see below) 36.52 29.95 5,200,273 2,961,937
Kinan International for Real Estate Development Company (“Kinan International”)
29.9
30
511,857
507,160
Intaj Capital Limited (“Intaj”) 49 49 365,044 374,324
Diyar Al Mashreq (“Diyar”) 30 30 263,230 259,353
Al-Seera City Company for Real Estate Development
40
40
164,578
164,578
Herfy Foods Services Company (“Herfy”) 49 49 282,477 241,166
Knowledge Economic City Development Company
17
17
17,200
17,200
Other Various Various 2,000 2,357
6,806,659 4,528,075

SAVOLA GROUP COMPANY (A Saudi Joint Stock Company) Notes to the consolidated financial statements for the year ended December 31, 2012
(All amounts in Saudi Riyals thousands unless otherwise stated)
21
During October, 2012, the Company acquired 6.57% additional ownership equity in Al Marai amounting to Saudi Riyals 1.98 billion. The acquisition resulted in the increase in the Company’s ownership interest in Al Marai to 36.52% at December 31, 2012. 10.2 Available-for-sale investments
AFS investments at December 31, principally comprise the following:
2012 2011
Quoted investments
Emaar the Economic City (“Emaar”) 61,782 183,751
Knowledge Economic City 273,672 238,920
Taameer Jordan Holding Company 9,534 23,555
Unquoted investments
Swicorp Joussour Company 208,819 208,819
Swicorp, Saudi Arabia 115,674 115,674
Others 24,753 24,753
694,234 795,472
Movement in the available-for-sale investments was as follows:
2012 2011
January 1 795,472 725,572
Disposals (124,650) (1,510)
Other reserves adjustments 36,312 71,410
Other Adjustment (12,900) -
December 31 694,234 795,472
During 2012, the Group partially disposed its investment in Emaar at a capital gain of Saudi Riyals 46.7 million.
Available-for-sale investments are denominated in the following currencies: 2012 2011
Saudi Riyals 684,700 771,916
Jordanian Dinar 9,534 23,556
694,234 795,472
10.3 Other investments
2012 2011
Long term bank deposits of SBeC 25,767 8,614
Investment properties - -
25,767 8,614
Movement in investment properties is as follows:
Note 2012 2011
January 1, - 803,998
Additions - 3,239
Assets held for sale 8 - (467,359)
Disposals - (339,878)
December 31, - -
SAVOLA GROUP COMPANY (A Saudi Joint Stock Company) Notes to the consolidated financial statements for the year ended December 31, 2012
(All amounts in Saudi Riyals thousands unless otherwise stated)
22
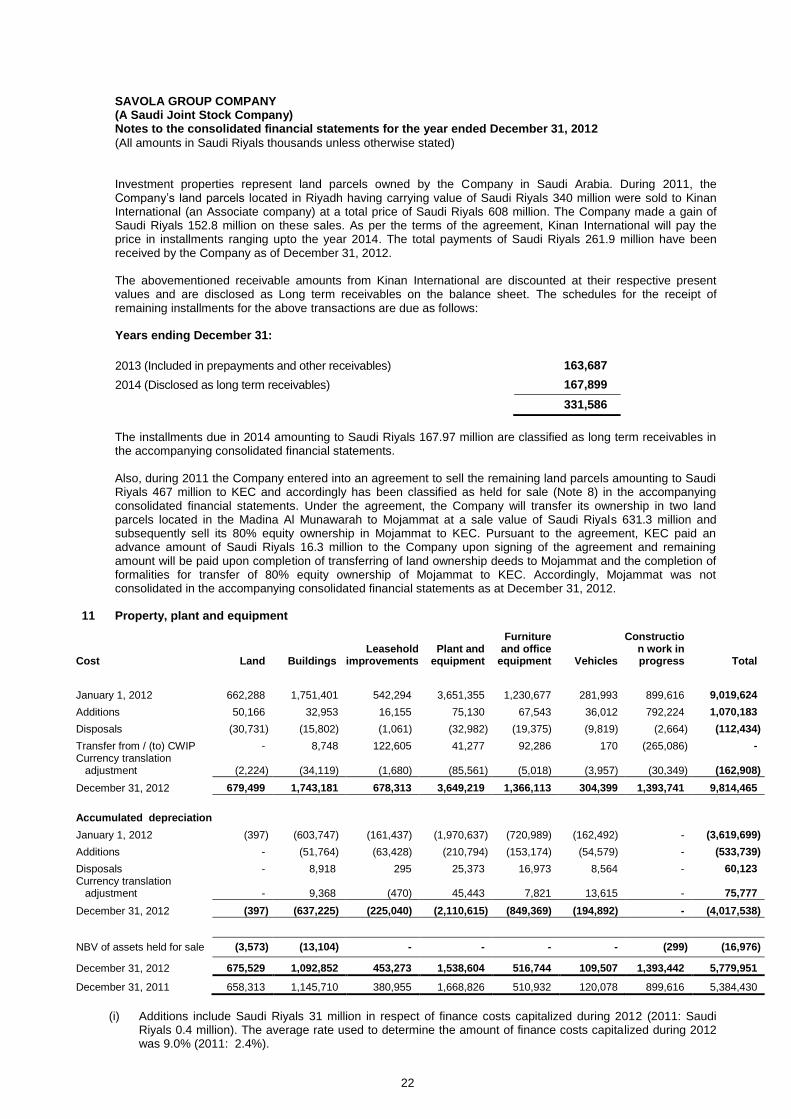
Investment properties represent land parcels owned by the Company in Saudi Arabia. During 2011, the Company’s land parcels located in Riyadh having carrying value of Saudi Riyals 340 million were sold to Kinan International (an Associate company) at a total price of Saudi Riyals 608 million. The Company made a gain of Saudi Riyals 152.8 million on these sales. As per the terms of the agreement, Kinan International will pay the price in installments ranging upto the year 2014. The total payments of Saudi Riyals 261.9 million have been received by the Company as of December 31, 2012. The abovementioned receivable amounts from Kinan International are discounted at their respective present values and are disclosed as Long term receivables on the balance sheet. The schedules for the receipt of remaining installments for the above transactions are due as follows: Years ending December 31:
2013 (Included in prepayments and other receivables) 163,687
2014 (Disclosed as long term receivables) 167,899
331,586
The installments due in 2014 amounting to Saudi Riyals 167.97 million are classified as long term receivables in the accompanying consolidated financial statements. Also, during 2011 the Company entered into an agreement to sell the remaining land parcels amounting to Saudi Riyals 467 million to KEC and accordingly has been classified as held for sale (Note 8) in the accompanying consolidated financial statements. Under the agreement, the Company will transfer its ownership in two land parcels located in the Madina Al Munawarah to Mojammat at a sale value of Saudi Riyals 631.3 million and subsequently sell its 80% equity ownership in Mojammat to KEC. Pursuant to the agreement, KEC paid an advance amount of Saudi Riyals 16.3 million to the Company upon signing of the agreement and remaining amount will be paid upon completion of transferring of land ownership deeds to Mojammat and the completion of formalities for transfer of 80% equity ownership of Mojammat to KEC. Accordingly, Mojammat was not consolidated in the accompanying consolidated financial statements as at December 31, 2012.
11 Property, plant and equipment
Cost Land Buildings Leasehold
improvements Plant and
equipment
Furniture and office
equipment Vehicles
Construction work in progress Total
January 1, 2012 662,288 1,751,401 542,294 3,651,355 1,230,677 281,993 899,616 9,019,624
Additions 50,166 32,953 16,155 75,130 67,543 36,012 792,224 1,070,183
Disposals (30,731) (15,802) (1,061) (32,982) (19,375) (9,819) (2,664) (112,434)
Transfer from / (to) CWIP - 8,748 122,605 41,277 92,286 170 (265,086) - Currency translation adjustment (2,224) (34,119) (1,680) (85,561) (5,018) (3,957) (30,349) (162,908)
December 31, 2012 679,499 1,743,181 678,313 3,649,219 1,366,113 304,399 1,393,741 9,814,465
Accumulated depreciation
January 1, 2012 (397) (603,747) (161,437) (1,970,637) (720,989) (162,492) - (3,619,699)
Additions - (51,764) (63,428) (210,794) (153,174) (54,579) - (533,739)
Disposals - 8,918 295 25,373 16,973 8,564 - 60,123 Currency translation adjustment - 9,368 (470) 45,443 7,821 13,615 - 75,777
December 31, 2012 (397) (637,225) (225,040) (2,110,615) (849,369) (194,892) - (4,017,538)
NBV of assets held for sale (3,573) (13,104) - - - - (299) (16,976)
December 31, 2012 675,529 1,092,852 453,273 1,538,604 516,744 109,507 1,393,442 5,779,951
December 31, 2011 658,313 1,145,710 380,955 1,668,826 510,932 120,078 899,616 5,384,430
(i) Additions include Saudi Riyals 31 million in respect of finance costs capitalized during 2012 (2011: Saudi
Riyals 0.4 million). The average rate used to determine the amount of finance costs capitalized during 2012 was 9.0% (2011: 2.4%).

SAVOLA GROUP COMPANY (A Saudi Joint Stock Company) Notes to the consolidated financial statements for the year ended December 31, 2012
(All amounts in Saudi Riyals thousands unless otherwise stated)
23
(ii) Construction work in progress relates to the construction of super markets and hyper markets for APU and
upgrading and enhancing the production facilities of SFC, SPS and some of their subsidiaries. (iii) Under the terms of land lease agreements with Jeddah Industrial City, Jeddah Islamic Port, Riyadh Industrial
City, and Industrial zone, Sokhna port, Egypt certain subsidiaries have renewable operating leases for lands on which their production facilities are located. Annual lease and service charge payments to the lessor are nominal.
(iv) Certain property, plant and equipment of the Group are pledged as collateral with Saudi Industrial
Development Fund and commercial banks. Also see Note 14.
12 Intangible assets
Goodwill
Deferred charges
Other intangible
assets (Note 12.1)
Total
Cost
January 1, 2012 1,153,250 603,674 - 1,756,924
Additions - 51,309 - 51,309
Adjustments (181,177) - 181,177 -
Write-off - (4,683) - (4,683)
Currency translation adjustment (1,190) - - (1,190)
December 31, 2012 970,883 650,300 181,177 1,802,360
Amortization
January 1, 2012 - (454,630) - (454,630)
Additions - (25,597) - (25,597)
December 31, 2012 - (480,227) - (480,227)
Net balance 970,883 170,073 181,177 1,322,133
Goodwill Deferred charges
Total
Cost
January 1, 2011 836,516 601,986 1,438,502
Additions 338,949 37,054 376,003
Currency translation adjustment (22,215) - (22,215)
Write-offs - (35,366) (35,366)
December 31, 2011 1,153,250 603,674 1,756,924
Amortization
January 1, 2011 - (413,681) (413,681)
Additions - (40,949) (40,949)
December 31, 2011 - (454,630) (454,630)
Net balance as at December 31, 2011 1,153,250 149,044 1,302,294 12.1 Other intangible assets As disclosed in Note 1 of the accompanying consolidated financial statements, during 2011, the Group acquired 100% ownership interest in El Maleka and El Farasha. The details are as follows:
Purchase Consideration paid 453,434
Net assets acquired (66,599)
Fair value adjustment (65,794)
Total net assets acquired (132,393)
Excess of purchase consideration paid over net assets acquired
321,041
Less: allocated to other intangible assets (181,177)
Goodwill 139,864

SAVOLA GROUP COMPANY (A Saudi Joint Stock Company) Notes to the consolidated financial statements for the year ended December 31, 2012
(All amounts in Saudi Riyals thousands unless otherwise stated)
24
Subsequent to Group’s acquisition in 2011 of 100% ownership interest El Maleka and El Farasha in Egypt, for a total consideration of Saudi Riyals 453 million, and payment of total amount of excess of purchase consideration paid over net assets acquired of Saudi Riyals 321 million; the Group has carried out an initial fair valuation of assets acquired on the basis of which an amount of Saudi Riyals 65.8 million has already been allocated to property, plant and equipment. However, a formal study of Purchase Price Allocation was completed during 2012 and upon its finalization an amount of Saudi Riyals 181.1 million was allocated to ‘Other Intangible Assets’ mainly representing value of brands acquired. 12.2 Goodwill
Impairment tests for goodwill
The recoverable amount of goodwill is determined based on fair value calculations. These calculations use cash flow projections based on financial budgets approved by management covering a five year period. The key assumptions used for fair value calculations are as follows: 1 Budgeted gross margin. 2 Weighted average growth rate 3 Discount rate applied to the cash flow projections. Management determined budgeted gross margin and weighted average growth rates based on past performance and its expectations of market development. The discount rates used are pre-zakat and pre-income tax reflect specific risks relating to the industry. The results of impairment test at December 31, 2012 indicated no impairment charge.
13 Short-term borrowings
These represent borrowing facilities obtained from various commercial banks and bear financial charges at prevailing market rates which are based on inter-bank offer rates. Certain short-term bank loans at December 31, 2012 were guaranteed by corporate guarantees of the Company.
14 Long-term borrowings
Note 2012 2011
Commercial bank loans 14.1 4,503,509 3,453,768
SIDF loans 14.2 19,689 23,829
4,523,198 3,477,597
Current maturity shown under current liabilities (910,952) (656,103)
3,612,246 2,821,494
14.1 Commercial bank loans
The Group has obtained loans and Murabaha financing from various commercial banks and financial institutions in order to finance capital projects, investments and for working capital requirements. Finance charges on these debts are based on prevailing market rates. Property, plant and equipment at December 31, 2012 includes assets of certain consolidated subsidiaries having net book value of approximately Saudi Riyals 1,235 million (2011: Saudi Riyals 957 million) which are pledged with foreign banks as collateral against bank borrowing facilities. The financing agreements include certain covenants, which, among other things, require certain financial ratios to be maintained. 14.2 SIDF loans
SIDF has provided loans to SPS to finance the manufacturing facilities and expansion projects. The loans are secured by a charge on property, plant and equipment of SPS and corporate guarantees of the shareholders. At December 31, 2012, property, plant and equipment having a net book value of Saudi Riyals 292 million (2011: Saudi Riyals 233 million) were collateralized as security against SIDF loans. The SIDF loan agreements include certain covenants, which among other things require that certain financial ratios be maintained.

SAVOLA GROUP COMPANY (A Saudi Joint Stock Company) Notes to the consolidated financial statements for the year ended December 31, 2012
(All amounts in Saudi Riyals thousands unless otherwise stated)
25
14.3 Maturity profile of long-term borrowings Years ending December 31:
2013 910,952
2014 2,628,694
2015 560,644
2016 185,897
2017 and thereafter 237,011
4,523,198
In an extra ordinary general meeting held on December 15, 2012, the Company’s shareholders approved the establishment of Sukuk program pursuant to which the Company can issue Sukuk through one or more tranches for an amount that will not exceed the Company’s paid-up capital amounting to Saudi Riyals 5 billion. The Company had not issued any Sukuk as at December 31, 2012. As of January 22, 2013, the Group has completed the offering and issuance of the first tranche of the Sukuk with a total value of SR 1.5 billion. The Sukuk issued have a tenor of 7 years, and have been offered at nominal value with an expected variable return to the Sukuk-holders of 6 months SIBOR plus 1.10%.
15 Accounts payable
Note 2012 2011
Trade 2,658,452 2,620,594
Related parties 20.2 85,752 98,333
2,744,204 2,718,927
16 Accrued and other liabilities
Note 2012 2011
Accrued expenses 390,075 360,906
Accrued zakat and tax 16.1 342,337 214,218
Accrued interest 214,113 16,114
Employee related accrual 174,718 146,018
Marketing related accruals 170,730 131,782
Unclaimed dividend 165,054 177,864
Advance against sale of land 119,378 119,378
Payable to contractors 90,932 33,435
Advances from customers 56,971 11,774
Payable to government authorities 53,276 12,476
Accrued utilities 43,415 31,651
Provision for dividend (BID) 31,370 23,196
Accruals for un-invoiced purchases 23,609 17,163
Other liabilities 85,281 132,546
1,961,259 1,428,521

SAVOLA GROUP COMPANY (A Saudi Joint Stock Company) Notes to the consolidated financial statements for the year ended December 31, 2012
(All amounts in Saudi Riyals thousands unless otherwise stated)
26
16.1 Zakat and tax matters
Zakat and taxes included in the consolidated income statement are comprised of the following:
2012 2011
Income tax 202,963 88,948
Zakat 42,193 43,076
Deferred tax 22,992 -
268,148 132,024
The movement in the accrual for zakat and taxes are as follows: 2012 2011
January 1, 214,218 166,634
Charge 245,156 132,024
Payments (117,037) (84,440)
December 31, 342,337 214,218
16.1.1 Components of zakat base
The Group’s Saudi Arabia subsidiaries file separate zakat and income tax declarations on unconsolidated basis. The significant components of the zakat base of each company under zakat and income tax regulation are principally comprised of shareholders’ equity, provisions at the beginning of year, long-term borrowings and estimated taxable income, less deductions for the net book value of property, plant and equipment, investments and certain other items. 16.1.2 Status of final assessments (a) Zakat status
The Company has finalized its zakat status up to the year 2004. The Company has filed the Zakat returns for the years 2005 to 2011. The DZIT issued the assessment for the year 2009 and claimed zakat differences of Saudi Riyals 1.3 million. The Company has paid for such zakat differences and is also appealing such differences with the DZIT. The Company’s Saudi subsidiaries received final zakat certificates for certain years and provisional zakat certificates for other years. They have also received queries from the DZIT for the open years, for which replies have been / will be filed by the respective companies. Some Saudi consolidated subsidiaries received assessments from the DZIT concerning their zakat declarations for the open years, in which the DZIT assessed additional zakat liabilities of approximately Saudi Riyals 20.1 million (2011: Saudi Riyals 62.3 million). The subsidiaries have objected to such assessments and the matter is pending with the DZIT and Appeal Committees. Management of the Company and the subsidiaries believe that such additional assessments will not result in the additional liability and no provisions have been made for such assessments. (b) Income tax status
The Group’s foreign subsidiaries are obliged to pay income tax as per applicable tax laws of their countries of incorporation. Some of the subsidiaries are currently tax exempt. Tax paying subsidiaries determine their liabilities based on applicable corporate rates to the adjusted taxable income for the year. Certain foreign subsidiaries are also obliged to pay quarterly advances tax determined on prior year tax liability bases. Certain subsidiaries have received final tax assessments for certain years and provisional tax assessments for other years. They have also received queries from departments of income tax after their assessment or inspections for open years, for which replies have been filed.

SAVOLA GROUP COMPANY (A Saudi Joint Stock Company) Notes to the consolidated financial statements for the year ended December 31, 2012
(All amounts in Saudi Riyals thousands unless otherwise stated)
27
The Group management believes that there are no significant amounts under protest with departments of income tax in any foreign operation. 16.2 Deferred tax liability
Deferred tax liability is calculated on temporary difference on end of service provision, deferred rent payable and property plant and equipment under the liability method using effective tax rate.
17 Deferred gain
2012 2011
January 1 103,181 111,630
Addition 9,120 -
Amortization (9,108) (8,449)
December 31 103,193 103,181
Deferred gain principally relates to deferral of capital gain on land and building sale and operating leaseback transaction by the Group. Such gains are deferred over the lease period.
18 Long-term payables
Long-term payables represent dividends declared in prior years and share fractions, which resulted from split of shares in prior years. Such amounts have not yet been claimed by the respective shareholders for several years. In the opinion of management, such amounts are unlikely to be paid during 2013 and, accordingly, they have been classified under non-current liabilities.
19 Employee termination benefits 2012 2011
January 1 307,263 276,106
Provisions 84,082 68,767
Payments (37,594) (37,610)
December 31 353,751 307,263
20 Related party matters
Related party transactions mainly represent sale of products in the ordinary course of business to entities related to certain consolidated subsidiaries. The terms of such transactions are mutually agreed between the parties. The Company has a group treasury function and arranges for credit facilities to its affiliated entities through local commercial banks. All related party transactions are approved by the management. 20.1 Related party transactions
Significant transactions with related parties in the ordinary course of business included in the financial statements are summarized below: 2012 2011
Sales 638,618 788,125
Purchases 508,822 477,600
Rent expense charged by related parties 88,339 88,470
Key management personnel remuneration 31,282 27,244
Investment property sold to a related party - 336,567

SAVOLA GROUP COMPANY (A Saudi Joint Stock Company) Notes to the consolidated financial statements for the year ended December 31, 2012
(All amounts in Saudi Riyals thousands unless otherwise stated)
28
20.2 Related party balances
Significant year end balances arising from transactions with related parties are as follows: (i) Receivable from related parties
Company name Relationship 2012 2011
Intaj Associate 51,806 70,560
Certain shareholders of USC Shareholders of a
subsidiary 45,151 47,933
Kinan International Associate 3,351 -
Afia Wings International Company Associate 2,757 2,757
Al Muhaidib Holding Company Shareholder of the subsidiary
-
63,234
Other 3,214 17,714
106,279 202,198
(ii) Payable to related parties
Company name Relationship 2012 2011
Abdul Kadir Al Muhaidib Company Shareholder of the
Company 33,433 41,597
Al Marai Company Associate 27,871 24,229
Herfy Associate 7,375 9,498
Hail Agricultural Development Company Associate 4,329 4,533
Diyar Associate - 13,699
Other 12,744 4,777
85,752 98,333
20.3 Board of directors remuneration
Board of Directors’ remuneration for the year ended December 31, 2012 amounting to Saudi Riyals 2.2 million (2011: Saudi Riyals 2.2 million) has been calculated in accordance with the Company’s By laws and is considered as appropriation shown in the statement of changes in shareholders’ equity. Attendance allowances and other expenses to the directors and members of various board committees for the year ended December 31, 2012 amounting to Saudi Riyals 636 thousand (2011: Saudi Riyals 634 thousand) are charged to expenses and included under general and administrative expenses.
21 Share capital
The share capital of the Company as of December 31, 2012 and 2011 was comprised of 500 million shares stated at Saudi Riyals 10 per share.
22 Statutory reserve
In accordance with the Regulations for Companies in the Kingdom of Saudi Arabia, the Company transfers 10% of the net income for the year to a statutory reserve until such reserve equals 50% of its share capital. The statutory reserve in the accompanying consolidated financial statements is the statutory reserve of the Company. This reserve currently is not available for distribution to the shareholders of the Company.

SAVOLA GROUP COMPANY (A Saudi Joint Stock Company) Notes to the consolidated financial statements for the year ended December 31, 2012
(All amounts in Saudi Riyals thousands unless otherwise stated)
29
23 Selling and marketing expenses
2012 2011
Salaries, wages and benefits 817,932 713,265
Advertisement 410,483 387,252
Rent 380,639 339,086
Depreciation and amortization 276,024 272,085
Utilities 154,504 151,108
Commission 116,093 79,329
Maintenance 109,014 91,735
Transportation 10,552 6,890
Provision for doubtful debts 2,603 3,150
Other 89,448 100,913
2,367,292 2,144,813
24 General and administrative expenses
2012 2011
Salaries, wages and benefits 394,657 351,066
Professional fees 28,048 25,996
Depreciation 24,226 32,875
Traveling 12,750 10,632
Rent 12,225 11,292
Utilities, telephone and communication cost 10,967 10,511
Insurance 10,704 14,207
Training 10,327 9,350
Repairs and maintenance 9,165 7,968
Transportation 8,634 5,116
Supplies and packaging 4,480 4,150
Information technology 4,205 6,201
Inter-Company write-offs - 9,266
Other 59,929 63,842
590,317 562,472
25 Other income (expenses)
2012 2011
Scrap sales 30,381 26,751
Product listing and opening fees 30,144 29,344
Amortization of deferred gain 9,108 8,449
Gains on disposal of property and equipment 3,542 10,087
Insurance recoveries - 3,824
Rental income - 1,401
Other 546 16,911
73,721 96,767
Product listing fee represents the fee received from suppliers to list their products in new retail store openings and is recognized in the period it is earned.
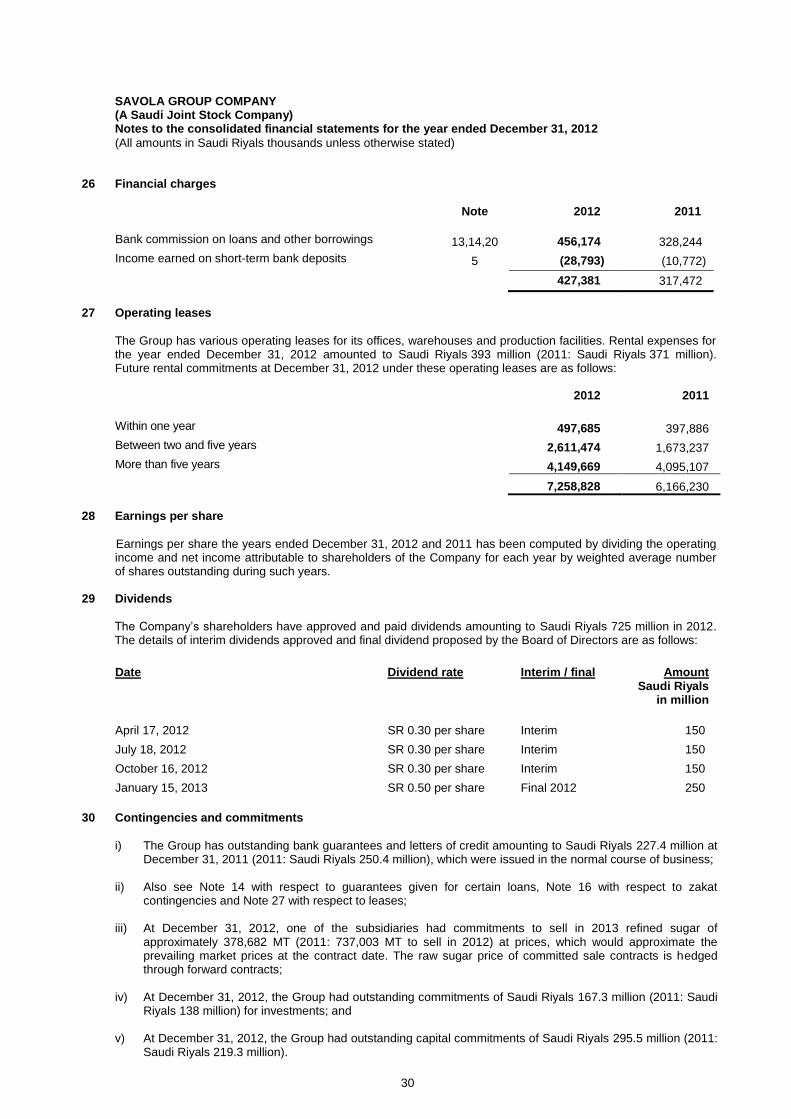
SAVOLA GROUP COMPANY (A Saudi Joint Stock Company) Notes to the consolidated financial statements for the year ended December 31, 2012
(All amounts in Saudi Riyals thousands unless otherwise stated)
30
26 Financial charges
Note 2012 2011
Bank commission on loans and other borrowings 13,14,20 456,174 328,244
Income earned on short-term bank deposits 5 (28,793) (10,772)
427,381 317,472
27 Operating leases
The Group has various operating leases for its offices, warehouses and production facilities. Rental expenses for the year ended December 31, 2012 amounted to Saudi Riyals 393 million (2011: Saudi Riyals 371 million). Future rental commitments at December 31, 2012 under these operating leases are as follows: 2012 2011
Within one year 497,685 397,886
Between two and five years 2,611,474 1,673,237
More than five years 4,149,669 4,095,107
7,258,828 6,166,230
28 Earnings per share
Earnings per share the years ended December 31, 2012 and 2011 has been computed by dividing the operating income and net income attributable to shareholders of the Company for each year by weighted average number of shares outstanding during such years.
29 Dividends
The Company’s shareholders have approved and paid dividends amounting to Saudi Riyals 725 million in 2012. The details of interim dividends approved and final dividend proposed by the Board of Directors are as follows:
Date Dividend rate Interim / final Amount
Saudi Riyals in million
April 17, 2012 SR 0.30 per share Interim 150
July 18, 2012 SR 0.30 per share Interim 150
October 16, 2012 SR 0.30 per share Interim 150
January 15, 2013 SR 0.50 per share Final 2012 250
30 Contingencies and commitments
i) The Group has outstanding bank guarantees and letters of credit amounting to Saudi Riyals 227.4 million at December 31, 2011 (2011: Saudi Riyals 250.4 million), which were issued in the normal course of business;
ii) Also see Note 14 with respect to guarantees given for certain loans, Note 16 with respect to zakat contingencies and Note 27 with respect to leases;
iii) At December 31, 2012, one of the subsidiaries had commitments to sell in 2013 refined sugar of
approximately 378,682 MT (2011: 737,003 MT to sell in 2012) at prices, which would approximate the prevailing market prices at the contract date. The raw sugar price of committed sale contracts is hedged through forward contracts;
iv) At December 31, 2012, the Group had outstanding commitments of Saudi Riyals 167.3 million (2011: Saudi
Riyals 138 million) for investments; and v) At December 31, 2012, the Group had outstanding capital commitments of Saudi Riyals 295.5 million (2011:
Saudi Riyals 219.3 million).