Consolidated FinanCial statements · Consolidated FinanCial statements 1. Consolidated Balance...
67
FINANCIAL DATA CONSOLIDATED FINANCIAL STATEMENTS 1. Consolidated Balance Sheets 120 2. Consolidated Statements of Income 122 3. Consolidated Statements of Comprehensive Income 124 4. Consolidated Statements of Changes in Net Assets 125 5. Consolidated Statements of Cash Flows 129 6. Notes to the Consolidated Financial Statements 131 NONCONSOLIDATED FINANCIAL STATEMENTS 7. Nonconsolidated Balance Sheets 158 8. Nonconsolidated Statements of Income 160 9. Nonconsolidated Statements of Changes in Net Assets 162 10. Nonconsolidated Proposed Appropriations of Surplus 168 11. Notes to the Nonconsolidated Financial Statements 169 *All figures are rounded down to the nearest unit. Independent Auditor’s Report 184 119
Transcript of Consolidated FinanCial statements · Consolidated FinanCial statements 1. Consolidated Balance...
Financial Data
Consolidated FinanCial statements
1. Consolidated Balance Sheets 120
2. Consolidated Statements of Income 122
3. Consolidated Statements of Comprehensive Income 124
4. Consolidated Statements of Changes in Net Assets 125
5. Consolidated Statements of Cash Flows 129
6. Notes to the Consolidated Financial Statements 131
nonConsolidated FinanCial statements
7. Nonconsolidated Balance Sheets 158
8. Nonconsolidated Statements of Income 160
9. Nonconsolidated Statements of Changes in Net Assets 162
10. Nonconsolidated Proposed Appropriations of Surplus 168
11. Notes to the Nonconsolidated Financial Statements 169
*All figures are rounded down to the nearest unit.
Independent Auditor’s Report 184
119
CONSOLIDATED FINANCIAL STATEMENTS
CONSOLIDATED FINANCIAL STATEMENTS
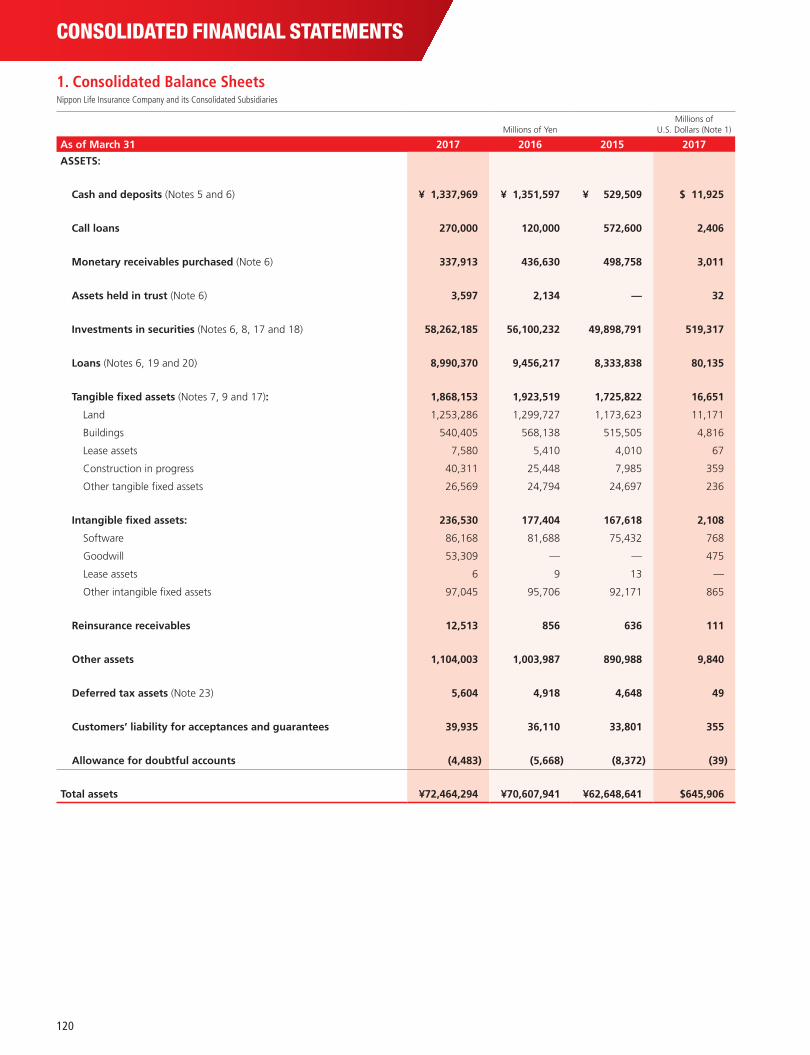
1. Consolidated Balance SheetsNippon Life Insurance Company and its Consolidated Subsidiaries
Millions of YenMillions of
U.S. Dollars (Note 1)
As of March 31 2017 2016 2015 2017
ASSETS:
Cash and deposits (Notes 5 and 6) ¥ 1,337,969 ¥ 1,351,597 ¥ 529,509 $ 11,925
Call loans 270,000 120,000 572,600 2,406
Monetary receivables purchased (Note 6) 337,913 436,630 498,758 3,011
Assets held in trust (Note 6) 3,597 2,134 — 32
Investments in securities (Notes 6, 8, 17 and 18) 58,262,185 56,100,232 49,898,791 519,317
Loans (Notes 6, 19 and 20) 8,990,370 9,456,217 8,333,838 80,135
Tangible fixed assets (Notes 7, 9 and 17): 1,868,153 1,923,519 1,725,822 16,651
Land 1,253,286 1,299,727 1,173,623 11,171
Buildings 540,405 568,138 515,505 4,816
Lease assets 7,580 5,410 4,010 67
Construction in progress 40,311 25,448 7,985 359
Other tangible fixed assets 26,569 24,794 24,697 236
Intangible fixed assets: 236,530 177,404 167,618 2,108
Software 86,168 81,688 75,432 768
Goodwill 53,309 — — 475
Lease assets 6 9 13 —
Other intangible fixed assets 97,045 95,706 92,171 865
Reinsurance receivables 12,513 856 636 111
Other assets 1,104,003 1,003,987 890,988 9,840
Deferred tax assets (Note 23) 5,604 4,918 4,648 49
Customers’ liability for acceptances and guarantees 39,935 36,110 33,801 355
Allowance for doubtful accounts (4,483 ) (5,668 ) (8,372 ) (39 )
Total assets ¥72,464,294 ¥70,607,941 ¥62,648,641 $645,906
120
Millions of YenMillions of
U.S. Dollars (Note 1)
As of March 31 2017 2016 2015 2017
LIABILITIES:
Policy reserves and other reserves:
Reserve for outstanding claims ¥ 394,243 ¥ 353,480 ¥ 202,171 $ 3,514
Policy reserves 58,930,878 57,490,828 49,202,876 525,277
Reserve for dividends to policyholders (mutual company) (Note 11) 1,001,102 1,015,013 1,037,472 8,923
Reserve for dividends to policyholders (limited company) (Note 12) 67,847 69,681 — 604
Subtotal 60,394,071 58,929,002 50,442,520 538,319
Reinsurance payables 9,590 761 557 85
Corporate bonds (Notes 6 and 13) 920,825 650,825 399,590 8,207
Other liabilities (Notes 6, 14 and 17) 2,243,231 2,291,459 1,707,220 19,994
Accrued bonuses for directors and audit and supervisory board members 79 87 74 —
Net defined benefit liability (Note 15) 450,558 460,449 411,416 4,016
Accrued retirement benefits for directors and audit and supervisory board members 5,246 5,208 4,397 46
Reserve for program points 9,013 9,420 13,171 80
Reserve for price fluctuations in investments in securities 1,135,765 963,730 778,723 10,123
Deferred tax liabilities (Note 23) 620,563 697,450 1,223,642 5,531
Deferred tax liabilities for land revaluation 106,432 109,383 115,440 948
Acceptances and guarantees 39,935 36,110 33,801 355
Total liabilities 65,935,313 64,153,887 55,130,557 587,711
NET ASSETS:
Foundation funds (Note 16) 150,000 200,000 200,000 1,337
Reserve for redemption of foundation funds (Note 16) 1,150,000 1,100,000 1,050,000 10,250
Reserve for revaluation 651 651 651 5
Consolidated surplus 622,388 630,790 541,573 5,547
Total foundation funds and others 1,923,039 1,931,441 1,792,225 17,140
Net unrealized gains on available-for-sale securities 4,588,092 4,721,039 6,023,903 40,895
Deferred losses on derivatives under hedge accounting (65,262 ) (123,921 ) (231,060 ) (581 )
Land revaluation losses (58,084 ) (86,202 ) (88,670 ) (517 )
Foreign currency translation adjustments 30,549 24,893 36,330 272
Remeasurement of defined benefit plans (24,556 ) (29,637 ) (30,381 ) (218 )
Total accumulated other comprehensive income 4,470,738 4,506,171 5,710,121 39,849
Noncontrolling interests 135,203 16,440 15,736 1,205
Total net assets 6,528,981 6,454,053 7,518,084 58,195
Total liabilities and net assets ¥72,464,294 ¥70,607,941 ¥62,648,641 $645,906
The accompanying notes are an integral part of the consolidated financial statements.
121
Financial Data
CONSOLIDATED FINANCIAL STATEMENTS
2. Consolidated Statements of IncomeNippon Life Insurance Company and its Consolidated Subsidiaries
Millions of YenMillions of
U.S. Dollars (Note 1)
For the years ended March 31 2017 2016 2015 2017
ORDINARY INCOME:
Revenues from insurance and reinsurance ¥5,236,045 ¥6,262,042 ¥5,370,865 $46,671
Investment income:
Interest, dividends, and other income 1,458,328 1,421,721 1,373,699 12,998
Gain from assets held in trust, net — — 4 —
Gain on sales of securities 287,182 95,288 242,571 2,559
Gain on redemptions of securities 6,000 7,121 5,039 53
Reversal of allowance for doubtful accounts 1,351 2,361 726 12
Other investment income 1,919 829 525 17
Gain from separate accounts, net 50,432 — 154,187 449
Subtotal 1,805,215 1,527,321 1,776,754 16,090
Other ordinary income 260,555 268,229 262,474 2,322
Total ordinary income 7,301,817 8,057,594 7,410,093 65,084
ORDINARY EXPENSES:
Benefits and other payments:
Death and other claims 1,226,875 1,015,417 1,022,477 10,935
Annuity payments 936,713 851,543 839,921 8,349
Health and other benefits 824,505 780,732 748,368 7,349
Surrender benefits 932,899 890,886 959,865 8,315
Other refunds 217,639 408,104 387,696 1,939
Reinsurance premiums 13,048 2,090 1,701 116
Subtotal 4,151,681 3,948,774 3,960,031 37,005
Provision for policy reserves:
Provision for reserve for outstanding claims 30,975 117,644 — 276
Provision for policy reserves 1,125,720 2,191,448 1,684,483 10,034
Provision for interest on reserve for dividends to policyholders (mutual company) 22,458 23,041 23,602 200
Provision for interest on reserve for dividends to policyholders (limited company) 25 8 — 0
Subtotal 1,179,180 2,332,142 1,708,085 10,510
Investment expenses:
Interest expenses 22,388 16,547 10,342 199
Loss from assets held in trust, net 1,976 65 — 17
Loss on trading securities 5,371 — — 47
Loss on sales of securities 123,761 14,800 18,386 1,103
Loss on valuation of securities 27,868 36,748 3,258 248
Loss on redemptions of securities 32,974 23,947 21,595 293
Loss on derivative financial instruments, net 116,229 8,279 48,979 1,036
Foreign exchange losses, net 16,441 44,314 381 146
Write-offs of loans 55 28 20 0
Depreciation of rental real estate and other assets 17,834 16,011 14,917 158
Other investment expenses 30,224 27,180 25,982 269
Loss from separate accounts, net — 43,585 — —
Subtotal 395,127 231,508 143,863 3,521
Operating expenses (Note 21) 708,262 624,910 586,062 6,313
Other ordinary expenses 339,179 358,909 393,447 3,023
Total ordinary expenses 6,773,431 7,496,245 6,791,489 60,374
Ordinary profit ¥ 528,385 ¥ 561,348 ¥ 618,604 $ 4,709
122
Millions of YenMillions of
U.S. Dollars (Note 1)
For the years ended March 31 2017 2016 2015 2017
Extraordinary gains:
Gain on disposals of fixed assets ¥ 39,856 ¥ 9,136 ¥ 4,025 $ 355
Gain on bargain purchase (Note 3) — 102,957 — —
Subtotal 39,856 112,093 4,025 355
Extraordinary losses:
Loss on disposals of fixed assets 16,018 10,220 3,459 142
Impairment losses (Note 22) 5,243 5,886 19,908 46
Provision for reserve for price fluctuations in investments in securities 172,034 169,295 155,411 1,533
Loss on reduction entry of real estate 2 — 136 0
Contributions for assisting social public welfare 2,977 2,977 2,977 26
Subtotal 196,275 188,380 181,891 1,749
Provision for reserve for dividends to policyholders (limited company) 18,161 4,452 — 161
Surplus before income taxes 353,805 480,609 440,738 3,153
Income taxes (Note 23):
Current 99,889 120,484 172,542 890
Deferred (54,372 ) (45,007 ) (41,146 ) (484 )
Total income taxes 45,517 75,476 131,396 405
Net surplus 308,288 405,132 309,342 2,747
Net surplus attributable to noncontrolling interests 6,319 1,669 1,271 56
Net surplus attributable to the parent company ¥301,969 ¥403,463 ¥308,070 $2,691
The accompanying notes are an integral part of the consolidated financial statements.
123
Financial Data
CONSOLIDATED FINANCIAL STATEMENTS
3. Consolidated Statements of Comprehensive IncomeNippon Life Insurance Company and its Consolidated Subsidiaries
Millions of YenMillions of
U.S. Dollars (Note 1)
For the years ended March 31 2017 2016 2015 2017
Net surplus ¥ 308,288 ¥ 405,132 ¥ 309,342 $ 2,747
Other comprehensive (loss) income (Note 24): (56,533 ) (1,214,850 ) 2,649,292 (503 )
Net unrealized gains on available-for-sale securities (136,125 ) (1,300,313 ) 2,760,495 (1,213 )
Deferred losses on derivatives under hedge accounting 58,659 107,139 (96,904 ) 522
Land revaluation losses — 3,528 7,615 —
Foreign currency translation adjustments 14,750 (3,385 ) 17,321 131
Remeasurement of defined benefit plans 4,730 745 (50,466 ) 42
Share of other comprehensive income (loss) of associates accounted for under the equity method 1,450 (22,564 ) 11,230 12
Comprehensive income (loss): ¥ 251,754 ¥ (809,717 ) ¥2,958,634 $ 2,243
Comprehensive income (loss) attributable to the parent company 242,367 (811,399 ) 2,957,245 2,160
Comprehensive income attributable to noncontrolling interests 9,387 1,681 1,388 83
The accompanying notes are an integral part of the consolidated financial statements.
124
Millions of Yen
Foundation funds and others
For the year ended March 31, 2015Foundation funds
(Note 16)
Reserve for redemption of
foundation funds (Note 16)
Reserve for revaluation
Consolidated surplus
Total foundation funds and others
Beginning balance ¥250,000 ¥1,000,000 ¥651 ¥ 477,329 ¥1,727,980
Increase/decrease:
Additions to reserve for dividends to policyholders (mutual company) (201,765 ) (201,765 )
Additions to reserve for redemption of foundation funds 50,000 (50,000 ) —
Interest on foundation funds (2,785 ) (2,785 )
Net surplus attributable to the parent company 308,070 308,070
Redemption of foundation funds (50,000 ) (50,000 )
Reversal of land revaluation losses 10,724 10,724
Net change, excluding foundation funds and others
Net change (50,000 ) 50,000 — 64,244 64,244
Ending balance ¥200,000 ¥1,050,000 ¥651 ¥ 541,573 ¥1,792,225
Millions of Yen
For the year ended March 31, 2015
Accumulated other comprehensive income
Noncontrolling interests
Total net assets
Net unrealized gains on available-for-sale
securities
Deferred losses on derivatives under hedge accounting
Land revaluation
losses
Foreign currency translation
adjustments
Remeasurement of defined
benefit plans
Total accumulated other comprehensive
income
Beginning balance ¥3,261,140 ¥(134,156 ) ¥(85,561 ) ¥10,162 ¥ 20,085 ¥3,071,671 ¥14,399 ¥4,814,051
Increase/decrease:
Additions to reserve for dividends to policyholders (mutual company) (201,765 )
Additions to reserve for redemption of foundation funds —
Interest on foundation funds (2,785 )
Net surplus attributable to the parent company 308,070
Redemption of foundation funds (50,000 )
Reversal of land revaluation losses 10,724
Net change, excluding foundation funds and others 2,762,762 (96,904 ) (3,108 ) 26,167 (50,466 ) 2,638,450 1,337 2,639,788
Net change 2,762,762 (96,904 ) (3,108 ) 26,167 (50,466 ) 2,638,450 1,337 2,704,032
Ending balance ¥6,023,903 ¥(231,060 ) ¥(88,670 ) ¥36,330 ¥(30,381 ) ¥5,710,121 ¥15,736 ¥7,518,084
4. Consolidated Statements of Changes in Net AssetsNippon Life Insurance Company and its Consolidated Subsidiaries
125
Financial Data
CONSOLIDATED FINANCIAL STATEMENTS
Millions of Yen
Foundation funds and others
For the year ended March 31, 2016Foundation funds
(Note 16)
Reserve for redemption of
foundation funds (Note 16)
Reserve for revaluation
Consolidated surplus
Total foundation funds and others
Beginning balance ¥200,000 ¥1,050,000 ¥651 ¥ 541,573 ¥1,792,225
Increase/decrease:
Issuance of foundation funds 50,000 50,000
Additions to reserve for dividends to policyholders (mutual company) (257,299 ) (257,299 )
Additions to reserve for redemption of foundation funds 50,000 (50,000 ) —
Interest on foundation funds (1,935 ) (1,935 )
Net surplus attributable to the parent company 403,463 403,463
Redemption of foundation funds (50,000 ) (50,000 )
Reversal of land revaluation losses 1,060 1,060
Change in scope of consolidation and equity method accounting (6,485 ) (6,485 )
Change in the parent’s ownership interest due to transactions with noncontrolling interests 413 413
Net change, excluding foundation funds and others
Net change — 50,000 — 89,216 139,216
Ending balance ¥200,000 ¥1,100,000 ¥651 ¥ 630,790 ¥1,931,441
Millions of Yen
For the year ended March 31, 2016
Accumulated other comprehensive income
Noncontrolling interests
Total net assets
Net unrealized gains on available-for-sale
securities
Deferred losses on derivatives under hedge accounting
Land revaluation
losses
Foreign currency translation
adjustments
Remeasurement of defined
benefit plans
Total accumulated other comprehensive
income
Beginning balance ¥ 6,023,903 ¥(231,060 ) ¥(88,670 ) ¥ 36,330 ¥(30,381 ) ¥ 5,710,121 ¥15,736 ¥ 7,518,084
Increase/decrease:
Issuance of foundation funds 50,000
Additions to reserve for dividends to policyholders (mutual company) (257,299 )
Additions to reserve for redemption of foundation funds —
Interest on foundation funds (1,935 )
Net surplus attributable to the parent company 403,463
Redemption of foundation funds (50,000 )
Reversal of land revaluation losses 1,060
Change in scope of consolidation and equity method accounting (6,485 )
Change in the parent’s ownership interest due to transactions with noncontrolling interests 413
Net change, excluding foundation funds and others (1,302,864 ) 107,139 2,468 (11,437 ) 743 (1,203,950 ) 703 (1,203,247 )
Net change (1,302,864 ) 107,139 2,468 (11,437 ) 743 (1,203,950 ) 703 (1,064,030 )
Ending balance ¥ 4,721,039 ¥(123,921 ) ¥(86,202 ) ¥ 24,893 ¥(29,637 ) ¥ 4,506,171 ¥16,440 ¥ 6,454,053
126
Millions of Yen
Foundation funds and others
For the year ended March 31, 2017Foundation funds
(Note 16)
Reserve for redemption of
foundation funds (Note 16)
Reserve for revaluation
Consolidated surplus
Total foundation funds and others
Beginning balance ¥200,000 ¥1,100,000 ¥651 ¥ 630,790 ¥1,931,441
Cumulative effect of change in accounting policies 1,882 1,882
Beginning balance after reflecting accounting policy changes 200,000 1,100,000 651 632,673 1,933,324
Increase/decrease:
Additions to reserve for dividends to policyholders (mutual company) (229,857 ) (229,857 )
Additions to reserve for redemption of foundation funds 50,000 (50,000 ) —
Interest on foundation funds (1,698 ) (1,698 )
Net surplus attributable to the parent company 301,969 301,969
Redemption of foundation funds (50,000 ) (50,000 )
Reversal of land revaluation losses (28,117 ) (28,117 )
Change in the parent’s ownership interest due to transactions with noncontrolling interests (2,580 ) (2,580 )
Net change, excluding foundation funds and others
Net change (50,000 ) 50,000 — (10,284 ) (10,284 )
Ending balance ¥150,000 ¥1,150,000 ¥651 ¥ 622,388 ¥1,923,039
Millions of Yen
For the year ended March 31, 2017
Accumulated other comprehensive income
Noncontrolling interests
Total net assets
Net unrealized gains on available-for-sale
securities
Deferred losses on derivatives under hedge accounting
Land revaluation
losses
Foreign currency translation
adjustments
Remeasurement of defined
benefit plans
Total accumulated other comprehensive
income
Beginning balance ¥4,721,039 ¥(123,921 ) ¥(86,202 ) ¥24,893 ¥(29,637 ) ¥4,506,171 ¥ 16,440 ¥6,454,053
Cumulative effect of change in accounting policies 2 1,884
Beginning balance after reflecting accounting policy changes 4,721,039 (123,921 ) (86,202 ) 24,893 (29,637 ) 4,506,171 16,442 6,455,938
Increase/decrease:
Additions to reserve for dividends to policyholders (mutual company) (229,857 )
Additions to reserve for redemption of foundation funds —
Interest on foundation funds (1,698 )
Net surplus attributable to the parent company 301,969
Redemption of foundation funds (50,000 )
Reversal of land revaluation losses (28,117 )
Change in the parent’s ownership interest due to transactions with noncontrolling interests (2,580 )
Net change, excluding foundation funds and others (132,947 ) 58,659 28,117 5,656 5,080 (35,433 ) 118,761 83,327
Net change (132,947 ) 58,659 28,117 5,656 5,080 (35,433 ) 118,761 73,043
Ending balance ¥4,588,092 ¥ (65,262 ) ¥(58,084 ) ¥30,549 ¥(24,556 ) ¥4,470,738 ¥135,203 ¥6,528,981
127
Financial Data
CONSOLIDATED FINANCIAL STATEMENTS
Millions of U.S. Dollars (Note 1)
Foundation funds and others
For the year ended March 31, 2017Foundation funds
(Note 16)
Reserve for redemption of
foundation funds (Note 16)
Reserve for revaluation
Consolidated surplus
Total foundation funds and others
Beginning balance $1,782 $ 9,804 $ 5 $ 5,622 $17,215
Cumulative effect of change in accounting policies 16 16
Beginning balance after reflecting accounting policy changes 1,782 9,804 5 5,639 17,232
Increase/decrease:
Additions to reserve for dividends to policyholders (mutual company) (2,048 ) (2,048 )
Additions to reserve for redemption of foundation funds 445 (445 ) —
Interest on foundation funds (15 ) (15 )
Net surplus attributable to the parent company 2,691 2,691
Redemption of foundation funds (445 ) (445 )
Reversal of land revaluation losses (250 ) (250 )
Change in the parent’s ownership interest due to transactions with noncontrolling interests (22 ) (22 )
Net change, excluding foundation funds and others
Net change (445 ) 445 — (91 ) (91 )
Ending balance $1,337 $10,250 $ 5 $ 5,547 $17,140
Millions of U.S. Dollars (Note 1)
Accumulated other comprehensive income
Noncontrolling interests
Total net assetsFor the year ended March 31, 2017
Net unrealized gains on available-for-sale
securities
Deferred losses on derivatives under hedge accounting
Land revaluation
losses
Foreign currency translation
adjustments
Remeasurement of defined
benefit plans
Total accumulated other comprehensive
income
Beginning balance $42,080 $(1,104 ) $(768 ) $221 $(264 ) $40,165 $ 146 $57,527
Cumulative effect of change in accounting policies 0 16
Beginning balance after reflecting accounting policy changes 42,080 (1,104 ) (768 ) 221 (264 ) 40,165 146 57,544
Increase/decrease:
Additions to reserve for dividends to policyholders (mutual company) (2,048 )
Additions to reserve for redemption of foundation funds —
Interest on foundation funds (15 )
Net surplus attributable to the parent company 2,691
Redemption of foundation funds (445 )
Reversal of land revaluation losses (250 )
Change in the parent’s ownership interest due to transactions with noncontrolling interests (22 )
Net change, excluding foundation funds and others (1,185 ) 522 250 50 45 (315 ) 1,058 742
Net change (1,185 ) 522 250 50 45 (315 ) 1,058 651
Ending balance $40,895 $ (581 ) $(517 ) $272 $(218 ) $39,849 $1,205 $58,195
The accompanying notes are an integral part of the consolidated financial statements.
128
5. Consolidated Statements of Cash FlowsNippon Life Insurance Company and its Consolidated Subsidiaries
Millions of YenMillions of
U.S. Dollars (Note 1)
For the years ended March 31 2017 2016 2015 2017
I Cash flows from operating activities:
Surplus before income taxes ¥ 353,805 ¥ 480,609 ¥ 440,738 $ 3,153
Depreciation of rental real estate and other assets 17,834 16,011 14,917 158
Depreciation 53,632 47,273 47,265 478
Impairment losses 5,243 5,886 19,908 46
Amortization of goodwill 655 — — 5
Gain on bargain purchase — (102,957 ) — —
Net increase (decrease) in reserve for outstanding claims 30,950 116,990 (2,774 ) 275
Net increase in policy reserves 1,124,400 2,192,346 1,685,475 10,022
Provision for interest on reserve for dividends to policyholders (mutual company) 22,458 23,041 23,602 200
Provision for interest on reserve for dividends to policyholders (limited company) 25 8 — 0
Provision for reserve for dividends to policyholders (limited company) 18,161 4,452 — 161
Net decrease in allowance for doubtful accounts (1,442 ) (2,454 ) (806 ) (12 )
Net (decrease) increase in accrued bonuses for directors and audit and supervisory board members (7 ) 12 24 (0 )
Net decrease in net defined benefit liability (3,313 ) (6,914 ) (7,387 ) (29 )
Net increase (decrease) in accrued retirement benefits for directors and audit and supervisory board members 37 90 (110 ) 0
Net increase in reserve for price fluctuations in investments in securities 172,034 169,295 155,411 1,533
Interest, dividends, and other income (1,458,328 ) (1,421,721 ) (1,373,699 ) (12,998 )
Losses from assets held in trust, net 1,976 65 — 17
Net gains on investments in securities (108,554 ) (30,311 ) (204,487 ) (967 )
Net losses on policy loans 119,409 132,085 145,484 1,064
Losses on derivative financial instruments, net 116,229 8,279 48,979 1,036
Interest expenses 22,388 16,547 10,342 199
Net foreign exchange losses 16,306 43,806 575 145
Net (gains) losses on tangible fixed assets (23,604 ) 1,614 (35 ) (210 )
Losses (gains) on equity method investments 13,093 (984 ) 97 116
(Gains) losses from separate accounts, net (50,432 ) 43,585 (154,187 ) (449 )
Net increase in reinsurance receivables (1,513 ) (139 ) (108 ) (13 )
Net increase in other assets (excluding those related to investing activities and financing activities) (27,039 ) (55 ) (29,642 ) (241 )
Net increase (decrease) in reinsurance payables 1,904 (365 ) 176 16
Net (decrease) increase in other liabilities (excluding those related to investing activities and financing activities) (8,829 ) 13,294 16,530 (78 )
Others, net (60,522 ) (91,580 ) (38,642 ) (539 )
Subtotal 346,961 1,657,813 797,645 3,092
Interest, dividends, and other income received 1,514,948 1,454,091 1,394,428 13,503
Interest paid (22,055 ) (16,676 ) (7,687 ) (196 )
Dividends paid to policyholders (mutual company) (181,208 ) (186,287 ) (193,741 ) (1,615 )
Dividends paid to policyholders (limited company) (20,020 ) (6,878 ) — (178 )
Others, net 10,344 4,518 4,659 92
Income taxes paid (102,103 ) (187,492 ) (207,110 ) (910 )
Net cash provided by operating activities ¥ 1,546,865 ¥ 2,719,088 ¥ 1,788,193 $ 13,787
129
Financial Data
CONSOLIDATED FINANCIAL STATEMENTS
Millions of YenMillions of
U.S. Dollars (Note 1)
For the years ended March 31 2017 2016 2015 2017
II Cash flows from investing activities:
Net decrease (increase) in deposits ¥ 504 ¥ (400 ) ¥ 500 $ 4
Net decrease in receivables under securities borrowing transactions — — 159,856 —
Purchases of monetary receivables purchased (3,000 ) (23,342 ) (17,500 ) (26 )
Proceeds from sales and redemptions of monetary receivables purchased 115,125 87,689 99,205 1,026
Purchases of assets held in trust (4,700 ) (2,000 ) — (41 )
Proceeds from decrease in assets held in trust 1,260 — — 11
Purchases of securities (10,727,182 ) (9,868,971 ) (8,529,358 ) (95,616 )
Proceeds from sales and redemptions of securities 8,800,478 6,493,263 7,500,525 78,442
Disbursements for loans (1,256,954 ) (1,098,153 ) (1,136,208 ) (11,203 )
Proceeds from collections of loans 1,613,276 1,251,891 1,186,604 14,379
Net (losses) gains from the settlement of derivative financial instruments (151,832 ) 365,475 (731,311 ) (1,353 )
Net increase (decrease) in cash received as collateral under securities lending transactions 39,684 (114,618 ) (272,701 ) 353
Others, net (28,552 ) 70,872 33,147 (254 )
① Total of investing activities (1,601,893 ) (2,838,295 ) (1,707,240 ) (14,278 )
[I + II①] [(55,028 )] [(119,207 )] [80,953 ] [(490 )]
Purchases of tangible fixed assets (54,472 ) (50,009 ) (50,695 ) (485 )
Proceeds from sales of tangible fixed assets 102,076 31,879 8,299 909
Payments for acquisition of subsidiary’s shares with change in scope of consolidation (Note 4) (88,249 ) — — (786 )
Proceeds from acquisition of subsidiary’s shares with change in scope of consolidation (Note 4) — 222,986 — —
Others, net (41,186 ) (30,251 ) (25,162 ) (367 )
Net cash used in investing activities (1,683,724 ) (2,663,689 ) (1,774,799 ) (15,007 )
III Cash flows from financing activities:
Proceeds from debt borrowing 253,867 208,841 220,448 2,262
Repayments of debt (288,594 ) (195,942 ) (213,616 ) (2,572 )
Proceeds from issuance of corporate bonds 270,000 251,235 242,550 2,406
Proceeds from issuance of foundation funds — 50,000 — —
Redemption of foundation funds (50,000 ) (50,000 ) (50,000 ) (445 )
Interest on foundation funds (1,698 ) (1,935 ) (2,785 ) (15 )
Proceeds from sales of shares of subsidiaries not resulting in change in scope of consolidation 58,198 — — 518
Others, net 19,619 6,302 4,703 174
Net cash provided by financing activities 261,392 268,500 201,300 2,329
IV Effect of exchange rate changes on cash and cash equivalents 6,339 (321 ) (209 ) 56
V Net increase in cash and cash equivalents 130,873 323,578 214,485 1,166
VI Cash and cash equivalents at the beginning of the year 1,410,595 1,086,504 872,018 12,573
VII Net increase in cash and cash equivalents resulting from change in scope of consolidation — 513 — —
VIII Cash and cash equivalents at the end of the year (Note 5) ¥ 1,541,468 ¥ 1,410,595 ¥ 1,086,504 $ 13,739
The accompanying notes are an integral part of the consolidated financial statements.
130
6. Notes to the Consolidated Financial StatementsNippon Life Insurance Company and its Consolidated Subsidiaries
1. Basis of Presenting the Consolidated Financial Statements
(1) Accounting principles and presentation
The accompanying consolidated financial statements have been prepared
from the accounts and records maintained by NIPPON LIFE INSURANCE
COMPANY (“Nippon Life” or the “Company”) and its consolidated subsid-
iaries in accordance with the provisions set forth in the Insurance Business
Act and the related rules and regulations applicable to the life insurance
industry, and in accordance with accounting principles generally accepted in
Japan, which are different in certain respects from the application and dis-
closure requirements of International Financial Reporting Standards. Cer-
tain accounting and reporting practices required to be followed by the
industry are regulated by the Financial Services Agency and the related
ministry by means of ministerial ordinances and guidance. The accompany-
ing consolidated financial statements of the Company and its consolidated
subsidiaries are in compliance with such requirements. The information pro-
vided in the consolidated financial statements including the notes to the
consolidated financial statements is limited to information required by the
Insurance Business Act and the related rules and regulations applicable to the
life insurance industry and disclosed as additional information. Amounts of
less than one million yen and one million U.S. dollars have been eliminated for
financial statement presentation. As a result, totals may not add up exactly.
(2) U.S. dollar amounts
Nippon Life prepares its consolidated financial statements in Japanese yen.
The U.S. dollar amounts included in the consolidated financial statements
and notes thereto represent the arithmetical results of translating Japanese
yen to U.S. dollars on the basis of ¥112.19=U.S.$1, the effective rate of
exchange at the balance sheet date of March 31, 2017. The inclusion of such
U.S. dollar amounts is solely for convenience and is not intended to imply
that Japanese yen amounts have been or could be readily converted, realized
or settled in U.S. dollars at ¥112.19=U.S.$1 or at any other rate.
2. Summary of Significant Accounting Policies(1) Principles of consolidation
i) Consolidated subsidiaries
The consolidated financial statements include the accounts of Nippon
Life and its subsidiaries. Consolidated subsidiaries as of March 31, 2017,
2016 and 2015, are listed as follows:
Nissay Credit Guarantee Co., Ltd. (Japan)
Nissay Leasing Co., Ltd. (Japan)
Nissay Capital Co., Ltd. (Japan)
Nissay Asset Management Corporation (Japan)
Nissay Information Technology Co., Ltd. (Japan)
Mitsui Life Insurance Company Limited (Japan) (from the fiscal year
ended March 31, 2016)
Nippon Life Insurance Company of America (U.S.A.)
NLI Commercial Mortgage Fund, LLC (U.S.A.)
NLI Commercial Mortgage Fund II, LLC (U.S.A.)
NLI US Investments, Inc. (U.S.A.) (from the fiscal year ended March
31, 2016)
MLC Limited (Australia) (from the fiscal year ended March 31, 2017)
Nissay Computer Co., Ltd. (Japan) (up to the fiscal year ended March
31, 2015)
MLC Limited has been included within the scope of consolidation for
the fiscal year ended March 31, 2017 due to acquisition by the Company.
Nissay Computer Co., Ltd. has been removed from the scope of con-
solidation from the fiscal year ended March 31, 2016 as it was merged
with the Company’s subsidiary Nissay Information Technology Co., Ltd.
NLI US Investments, Inc. has become more significant to the Company
and has therefore been included within the scope of consolidation from
the fiscal year ended March 31, 2016.
Mitsui Life Insurance Company Limited has been included within the
scope of consolidation for the fiscal year ended March 31, 2016 due to
acquisition by the Company.
The major subsidiaries excluded from consolidation are Nippon Life
Global Investors Americas, Inc., Nissay Trading Corporation, and Nissay
Card Service Co., Ltd.
The respective and aggregate effects of the companies which are
excluded from consolidation, based on total assets, revenues, net income
and surplus for the fiscal years ended March 31, 2017, 2016 and 2015,
are immaterial. This exclusion from consolidation does not prevent a
reasonable assessment of the financial position of the Company and its
subsidiaries and the result of their operations.
ii) Affiliates
Affiliates accounted for under the equity method as of March 31, 2017,
2016 and 2015, are listed as follows:
The Master Trust Bank of Japan, Ltd. (Japan)
Corporate-Pension Business Service Co., Ltd. (Japan)
PanAgora Asset Management, Inc. (U.S.A.) (from the fiscal year ended
March 31, 2016)
Nissay-Greatwall Life Insurance Co., Ltd. (China)
Bangkok Life Assurance Public Company Limited (Thailand)
Reliance Nippon Life Insurance Company Limited (India)
Reliance Nippon Life Asset Management Limited (India) (from the
fiscal year ended March 31, 2016)
Post Advisory Group, LLC (U.S.A.) (from the fiscal year ended March
31, 2016)
PT Sequis (Indonesia) (from the fiscal year ended March 31, 2016)
PT Asuransi Jiwa Sequis Life (Indonesia) (from the fiscal year ended
March 31, 2016)
131
Financial Data
CONSOLIDATED FINANCIAL STATEMENTS
PanAgora Asset Management, Inc., Reliance Capital Asset Manage-
ment Limited, Post Advisory Group, LLC, PT Sequis, and PT Asuransi Jiwa
Sequis Life have become more significant to the Company and have
therefore been included within the scope of equity method accounting
from the fiscal year ended March 31, 2016.
The subsidiaries not consolidated, such as Nippon Life Global Investors
Americas, Inc., and Nissay Trading Corporation, and affiliates other than
those listed above, such as SL Towers Co., Ltd. are not accounted for
under the equity method. The respective and aggregate effects of such
companies on consolidated net income and surplus for the fiscal years
ended March 31, 2017, 2016 and 2015, are immaterial.
The number of consolidated subsidiaries and unconsolidated subsid-
iaries and affiliates accounted for under the equity method as of March
31, 2017, 2016 and 2015, was as follows:
2017 2016 2015
Consolidated subsidiaries 11 10 9
Subsidiaries not consolidated but accounted for under the equity method 0 0 0
Affiliates accounted for under the equity method 10 10 5
iii) The fiscal year-end dates of consolidated subsidiaries
The fiscal year-end date of consolidated overseas subsidiaries is Septem-
ber 30 and December 31. In preparing the consolidated financial state-
ments, consolidated overseas subsidiaries with the fiscal year-end date of
September 30 are consolidated using financial statements based on a
provisional closing of accounts as of December 31. Consolidated over-
seas subsidiaries with a closing date of December 31 are consolidated
using financial statements based on the fiscal year-end of accounts as of
December 31.
Necessary adjustments are made to reflect significant transactions
that occurred between the Company’s fiscal year-end date of March 31
and December 31.
iv) Valuation of assets and liabilities of consolidated subsidiaries
Assets and liabilities of consolidated subsidiaries acquired by the Com-
pany are initially measured at fair value as of the date of the acquisition.
v) Amortization of goodwill
Goodwill and the equivalent amount of goodwill from affiliates accounted
for under the equity method are amortized under the straight-line method
over 20 years.
However, for items that are immaterial, the total amount of goodwill
is expensed as incurred.
vi) All significant intercompany balances and transactions have been
eliminated in consolidation. All material unrealized profits/losses
included in assets/liabilities resulting from transactions within the
group are eliminated.
(2) Business combinations
From the fiscal year ended March 31, 2016, the Company has applied the
“Accounting Standard for Business Combinations” (The Accounting Stan-
dards Board of Japan (ASBJ) Statement No. 21, September 13, 2013), the
“Accounting Standard for Consolidated Financial Statements” (ASBJ State-
ment No. 22, September 13, 2013), the “Accounting Standard for Business
Divestitures” (ASBJ Statement No. 7, September 13, 2013), and other stan-
dards and guidance.
Major accounting changes are as follows:
(a) Transactions with a noncontrolling interest
A parent’s ownership interest in a subsidiary might change if the parent
purchases or sells ownership interests in its subsidiary. The carrying
amount of the noncontrolling interest is adjusted to reflect the change in
the parent’s ownership interest in its subsidiary while the parent retains
its controlling interest in its subsidiary.
Under the previous accounting standard, any difference between the
fair value of the consideration received or paid and the amount by which
the noncontrolling interest is adjusted is accounted for as an adjustment
of goodwill or as profit or loss in the consolidated statements of income.
Under the revised accounting standard, such difference is accounted for
as consolidated surplus as long as the parent retains control over
its subsidiary.
(b) Presentation of the consolidated balance sheets
In the consolidated balance sheets, “minority interests” under the previ-
ous accounting standard is changed to “noncontrolling interests” under
the revised accounting standard.
(c) Presentation of the consolidated statements of income
In the consolidated statements of income, “surplus before minority inter-
ests” under the previous accounting standard is changed to “net sur-
plus” under the revised accounting standard, and “net surplus” under
the previous accounting standard is changed to “net surplus attributable
to the parent company” under the revised accounting standard.
(d) Acquisition-related costs
Acquisition-related costs are costs, such as advisory fees or professional
fees, which an acquirer incurs to effect a business combination.
Under the previous accounting standard, the acquirer accounts for
acquisition-related costs by including them in the acquisition costs of the
investment. Under the revised accounting standard, acquisition-related
costs shall be accounted for as expenses in the periods in which the costs
are incurred.
The Company applied the revised accounting standards and guidance
for the above changes, effective April 1, 2015. The revised accounting
standards and guidance for (a) transactions with a noncontrolling inter-
est and (d) acquisition-related costs were applied prospectively.
With respect to (b) presentation of the consolidated balance sheets
and (c) presentation of the consolidated statements of income, the appli-
cable line items in the 2015 consolidated financial statements have been
accordingly reclassified and presented in line with those in 2016.
In the consolidated statements of cash flows for the fiscal year ended
March 31, 2016, cash flows relating to acquisitions or sales of shares of
132
subsidiaries that do not result in a change in scope of consolidation are
presented under financing activities, and cash flows relating to expenses
for the acquisition of subsidiaries are presented under operating activities.
As a result, ordinary profit and surplus before income taxes for the
fiscal year ended March 31, 2016, each decreased by ¥1,075 million.
(3) Cash and cash equivalents
Cash and cash equivalents, for the purpose of reporting consolidated cash
flows, are composed of cash in hand, deposits held at call with banks and all
highly liquid short-term investments with a maturity of three months or less
when purchased, which are readily convertible into cash and present insig-
nificant risk of change in value.
(4) Securities and hedging activities
1) Securities of the Company and certain consolidated subsidiaries (includ-
ing items such as deposits and monetary receivables purchased which
are treated as securities based on the “Accounting Standard for Financial
Instruments” ASBJ Statement No. 10) and securities within assets held in
trust) are valued as follows:
i) Trading securities are stated at fair value on the balance sheet date.
The moving average method is used for calculating the cost basis.
ii) Held-to-maturity debt securities are valued using the moving average
method, net of accumulated amortization (straight-line).
iii) Policy-reserve-matching bonds are valued using the moving average
method, net of accumulated amortization (straight-line), in accor-
dance with the Industry Audit Committee Report No. 21, “Temporary
Treatment of Accounting and Auditing Concerning Policy-Reserve-
Matching Bonds in the Insurance Industry,” issued by the Japanese
Institute of Certified Public Accountants (JICPA).
iv) Investments in subsidiaries and affiliates that are not consolidated
nor accounted for under the equity method (stocks issued by subsid-
iaries prescribed in Article 2, Paragraph 12 of the Insurance Business
Act or subsidiaries prescribed in Article 13-5-2, Paragraph 3 of the
Order for Enforcement of the Insurance Business Act and stocks
issued by affiliates prescribed in Article 13-5-2, Paragraph 4 of the
Order for Enforcement of the Insurance Business Act) are stated at
cost using the moving average method.
v) Available-for-sale securities
a. Regarding securities with a fair value, stocks (including foreign
stocks) are valued by using the average fair value during the
period of one month before the balance sheet date (the cost basis
is calculated by using the moving average method). Other securi-
ties with a fair value are valued by using the fair value on the
balance sheet date (the cost basis is calculated by using the
moving average method).
b. Regarding securities of which the fair value is extremely difficult to
be determined, bonds (including foreign bonds) for which the differ-
ence between the purchase price and face value is due to an
interest rate adjustment are stated at cost using the moving aver-
age method, net of accumulated amortization (straight-line). Other
securities without readily determinable fair values are stated at cost
using the moving average method.
2) Unrealized gains/losses, net of applicable taxes for available-for-sale
securities, are recorded as a separate component of net assets.
Hedge accounting is applied by the Company and certain consolidated sub-
sidiaries based on the following methods:
1) The Company and certain consolidated subsidiaries mainly apply the fol-
lowing hedge accounting methods: The exceptional accounting treat-
ment (“Tokurei-shori”) for interest rate swaps is applied to hedge the
cash flow volatility of certain loans denominated in Japanese yen and
certain loans denominated in foreign currencies; deferred hedge account-
ing for interest rate swaps is applied to hedge the interest rate fluctua-
tion exposures on certain insurance policies, based on the Industry Audit
Committee Report No. 26, “Accounting and Auditing Treatments related
to Application of Accounting for Financial Instruments in the Insurance
Industry” issued by the JICPA; deferred hedge accounting and designated
hedge accounting (“Furiate-shori”) for currency swaps are applied to
hedge the cash flow volatility caused by foreign exchange rate fluctua-
tions on certain foreign currency-denominated bonds, certain foreign
currency-denominated loans, and foreign currency-denominated subor-
dinated corporate bonds issued by the Company; fair value hedge
accounting and deferred hedge accounting for foreign exchange forward
contracts are applied to hedge the price fluctuation exposures related to
foreign exchange rate fluctuations on certain foreign currency-denomi-
nated bonds, certain foreign currency-denominated stocks and certain
other foreign currency-denominated instruments; and fair value hedge
accounting for equity forward contracts is applied to hedge the price
fluctuation exposures on certain domestic stocks.
2) Hedging instruments and hedged items
(Hedging instruments) (Hedged items)
Interest rate swaps Loans, foreign currency-denominated loans, and insurance policies
Currency swaps Foreign currency-denominated bonds, foreign currency- denominated loans, and foreign currency-denominated subordinated corporate bonds
Foreign exchange forward contracts
Foreign currency-denominated bonds, foreign currency-denominated stocks and other foreign currency-denominated instruments
Equity forward contracts
Domestic stocks
3) Effectiveness of hedging activities is mainly evaluated by performing a
ratio analysis of fair value movement comparisons based on the hedg-
ing instruments and hedged items taken, which is in accordance with
the internal risk management policies of the Company and certain
consolidated subsidiaries.
4) Derivative financial instruments and derivative financial instruments
within assets held in trust are stated at fair value.
133
Financial Data
CONSOLIDATED FINANCIAL STATEMENTS
(5) Policy-reserve-matching bonds
Securities that are held for the purpose of matching the duration of out-
standing liabilities within the subgroups (classified by insurance type, matu-
rity period, and investment policy) of insurance products, such as individual
insurance and annuities, workers’ asset-formation insurance and annuities,
and group insurance and annuities are classified as policy-reserve-matching
bonds in accordance with the Industry Audit Committee Report No. 21,
“Temporary Treatment of Accounting and Auditing Concerning Policy-
Reserve-Matching Bonds in the Insurance Industry,” issued by the JICPA.
(6) Foreign currency translation
Assets and liabilities denominated in foreign currencies are translated into
Japanese yen using the “Accounting Standards for Foreign Currency
Transactions” (Business Accounting Council).
Foreign currency-denominated available-for-sale securities of the
Company, with exchange rates which have significantly fluctuated and
where recovery is not expected, are converted to Japanese yen using either
the rate on the balance sheet date or the average one-month rate prior to
the balance sheet date, whichever indicates a weaker yen. This translation
difference is recorded as a loss on valuation of securities.
Moreover, translation differences related to bonds included in transla-
tion differences of foreign currency-denominated available-for-sale securities
held by certain consolidated subsidiaries are recorded as foreign exchange
gains/losses, net, while translation differences related to other foreign cur-
rency-denominated available-for-sale securities are recorded as a separate
component of net assets.
(7) Tangible fixed assets
1) Tangible fixed assets are depreciated based on the following methods:
a. Tangible fixed assets (except for lease assets)
(i) Buildings
Straight-line method.
(ii) Assets other than the above
Primarily the declining-balance method.
Certain other tangible fixed assets with an acquisition price of less
than ¥200,000 of the Company and certain consolidated subsid-
iaries are depreciated over a 3 year period on a straight-line basis.
b. Lease assets
(i) Lease assets related to financial leases where ownership is
transferred
The same depreciation method applied to owned fixed assets.
(ii) Lease assets related to financial leases where ownership is not
transferred
Straight-line method based on lease period.
The estimated useful lives of major items are as follows:
Buildings 2 to 60 years
Other tangible fixed assets 2 to 20 years
Tangible fixed assets are stated at cost, net of accumulated deprecia-
tion and impairment losses.
2) Revaluation of land used in the operations of the Company is performed
based on the Act on Revaluation of Land. The tax effect of the amount
related to the valuation difference between book value and the revalued
amount for land revaluation is recognized as a deferred tax liability
within the liability section. The valuation differences, excluding tax, are
recognized as land revaluation losses within the net assets section.
Revaluation date March 31, 2002
Revaluation methodology The amount is calculated by using the listed value of
the land and road rate as prescribed by Article 2, Items
1 and 4, respectively, of the Order for Enforcement of
the Act on Revaluation of Land.
(8) Software
Capitalized software for internal use, which is included within intangible
fixed assets, is amortized using the straight-line method over its estimated
useful lives as internally determined (3 to 5 years).
(9) Leases
Financial leases where ownership is not transferred are capitalized based on
the “Accounting Standard for Lease Transactions” (ASBJ Statement No. 13).
Financial leases where the Company or a consolidated subsidiary is the
lessee, ownership is not transferred, and the lease start date is March 31,
2008, or prior are accounted for under the accounting treatment applied to
ordinary operating leases.
Regarding financial leases where the Company or a consolidated sub-
sidiary is the lessor and ownership is not transferred, if any, the Company
recognizes income and expense at the time of receiving the lease fee as
other ordinary income and other ordinary expenses, respectively.
(10) Allowance for doubtful accounts
1) An allowance for doubtful accounts for the Company is recognized in
accordance with the Company’s internal Asset Valuation Regulation and
Write-Off/Provision Rule.
i) An allowance for loans to borrowers who are legally or substantially
bankrupt, such as being bankrupt or being in the process of civil
rehabilitation proceedings, is recognized based on the amount of
credit remaining after directly deducting amounts expected to be
collected through the disposal of collateral or the execution of
guarantees from the balance of loans (as mentioned at 4) below).
ii) An allowance for loans to borrowers who are not currently legally
bankrupt but have a significant possibility of bankruptcy is recognized
at the amounts deemed necessary considering an assessment of the
borrowers’ overall solvency and the amounts remaining after deduc-
tion of amounts expected to be collected through the disposal of
collateral or the execution of guarantees.
134
iii) An allowance for loans to borrowers other than the above is provided
based on the borrowers’ balance multiplied by the historical average
(of a certain period) percentage of bad debt.
2) All credits extended by the Company are assessed by responsible sections
in accordance with the Company’s internal Asset Valuation Regulation. The
assessments are verified by the independent Asset Auditing Department.
The results of the assessments are reflected in the calculation of the
allowance for doubtful accounts.
3) For consolidated subsidiaries, the Company records the allowance amounts
deemed necessary in accordance mainly with the Company’s internal
Asset Valuation Regulation and Write-Off/Provision Rule.
4) The estimated uncollectible amount calculated by subtracting the amount
of collateral value or the amount collectible by the execution of guaran-
tees from the balance of loans is directly deducted from the balance of
loans (including loans with credits secured and/or guaranteed) made to
legally or substantially bankrupt borrowers. The estimated uncollectible
amounts were ¥703 million (U.S.$6 million) (including ¥112 million
(U.S.$0 million) of credits secured and/or guaranteed), ¥1,333 million
(including ¥175 million of credits secured and/or guaranteed) and ¥743
million (including ¥197 million of credits secured and/or guaranteed) as
of March 31, 2017, 2016 and 2015, respectively.
(11) Accrued bonuses for directors and audit and supervisory
board members
Accrued bonuses for directors and audit and supervisory board members are
recognized based on amounts estimated to be paid.
(12) Net defined benefit liability
1) Net defined benefit liability is the amount of retirement benefit obliga-
tions prepared for payment of employee retirement benefits less pension
plan assets, based on the projected amounts as of March 31, 2017, 2016
and 2015.
2) The accounting methods of the Company and certain consolidated sub-
sidiaries used for retirement benefits as of March 31, 2017, 2016 and
2015, are as follows:
i) Attribution method for estimated retirement benefits: Benefit formula
basis
ii) Period of amortizing actuarial gains/losses: 5 years
iii) Period of amortizing prior service costs: 5 years
(13) Accrued retirement benefits for directors and
audit and supervisory board members
Accrued retirement benefits for directors and audit and supervisory board
members are recognized based on estimated payment amounts under
internal rules.
(14) Reserve for program points
A reserve for program points is recognized based on the amount projected
to be incurred for expenses from the use of points granted to policyholders.
(15) Reserve for price fluctuations in investments in securities
Reserve for price fluctuations in investments in securities is recognized based
on Article 115 of the Insurance Business Act.
(16) Accounting for consumption taxes
Consumption taxes and local consumption taxes of the Company and cer-
tain consolidated subsidiaries are accounted for by the tax exclusion method.
However, consumption taxes paid on certain asset transactions, which are
not deductible from consumption taxes withheld and are stipulated to be
deferred under the Consumption Tax Act, are deferred as prepaid expenses
and amortized over a 5 year period on a straight-line basis. Consumption
taxes other than deferred consumption taxes are expensed as incurred.
(17) Policy reserves
Policy reserves of the Company and certain consolidated subsidiaries are
reserves set forth in accordance with Article 116 of the Insurance Business
Act. Policy reserves are recognized based on the following methodology:
1) Reserves for contracts concluded in or after April 1996, other than those
in which factors used as a basis for computing policy reserves and insur-
ance premiums are alterable and those for variable insurance, are com-
puted by the net level premium method based on the assumption rates
locked in at the sales and renewal prescribed by the Insurance Business
Act and the statement of calculation procedures*.
2) Reserves for other contracts are determined by the net level premium
method using the assumption rates locked in at the sales and renewal
prescribed by the statement of calculation procedures*.
* Documents approved by the Financial Services Agency that describe the specific calculation methods for insurance premiums and policy reserves.
Additional policy reserve amounts are included to cover a possible
deficiency in the amount of the reserve for certain individual annuity policy-
holders in accordance with Article 69, Paragraph 5 of the Ordinance for
Enforcement of the Insurance Business Act.
Policy reserves of consolidated overseas life insurance companies are
recorded as the amounts computed in accordance with the accounting
standards of each country, such as Australian accounting standards.
(18) Revenue recognition
Insurance premiums of the Company and certain consolidated subsidiaries
are recognized when cash is received and insurance premiums due but not
collected are not recognized as revenues. Unearned insurance premiums are
recognized as policy reserves.
Insurance premiums of consolidated overseas subsidiaries with a regular
due date are recognized on a due basis and insurance premiums due but not
collected are recognized as revenues.
135
Financial Data
CONSOLIDATED FINANCIAL STATEMENTS
(19) Policy acquisition costs
Policy acquisition costs of the Company and certain consolidated subsidiar-
ies are recorded to expense as incurred.
Policy acquisition costs of certain consolidated overseas subsidiaries are
deferred and amortized over the period that the policy will generate profits.
(20) Income taxes
The provision for income taxes is computed based on the pretax income
included in the consolidated statements of income. The asset and liability
approach is used to recognize deferred tax assets and liabilities for the
expected future tax consequences of temporary differences between the
carrying amounts and the tax bases of assets and liabilities. Deferred
taxes are measured by applying the enacted statutory tax rates to the
temporary differences.
(21) New accounting standards
Effective from the fiscal year ended March 31, 2017, the Company has
applied the “Implementation Guidance on Recoverability of Deferred Tax
Assets” (ASBJ Guidance No. 26, March 28, 2016), which included certain
revisions of the previous accounting and auditing guidance issued by the
JICPA. While the new guidance continues to follow the basic framework of
the previous guidance, it provides new guidance for the application of judg-
ment in assessing the recoverability of deferred tax assets.
The previous guidance provided a basic framework which included cer-
tain specific restrictions on recognizing deferred tax assets depending on the
company’s classification in respect of its profitability, taxable profit and
temporary differences, etc.
The new guidance does not change such basic framework but, in limited
cases, allows companies to recognize deferred tax assets even for a deduct-
ible temporary difference for which it was specifically prohibited to recognize
a deferred tax asset under the previous guidance, if the company can justify,
with reasonable grounds, that it is probable that the deductible temporary
difference will be utilized against future taxable profit in some future period.
The new guidance was effective for the beginning of annual periods
beginning on or after April 1, 2016. The new guidance shall not be applied
retrospectively and any adjustments from the application of the new guid-
ance at the beginning of the reporting period shall be reflected within con-
solidated surplus or accumulated other comprehensive income at the
beginning of the reporting period.
Following the new guidance, the Company and certain consolidated
subsidiaries partially revised their accounting treatment of recoverability of
deferred tax assets.
As a result, as of April 1, 2016, deferred tax assets increased by ¥1,884
million (U.S.$16 million), consolidated surplus increased by ¥1,882 million
(U.S.$16 million) and noncontrolling interests increased by ¥2 million (U.S.$0
million).
3. Business CombinationMatters concerning business combinations through acquisition are as
follows:
(1) MLC Limited (for the fiscal year ended March 31, 2017)
1) Overview of the business combination
a. Name and business of the acquiree
Name: MLC Limited
Business: Life insurance business
b. Main reasons for executing the business combination
The Australian life insurance market is forecast to realize high rates of
growth over the long term. By entering this market, the Company
aims to sustainably expand policyholders’ benefits through enhanc-
ing steady and sustainable operating profit bases of overseas insur-
ance businesses.
c. Business combination date
October 1, 2016 (deemed acquisition date)
d. Legal form of the business combination
Share acquisition for cash consideration
e. Name of company after business combination
MLC Limited
f. Percentage of voting rights acquired
80%
g. Main rationale for determining the acquirer
The main rationale for the Company being the acquirer is that the
Company will clearly control the decision-making body of the
acquiree based on majority ownership of voting rights.
2) Period for which the acquiree’s business results were included in the
consolidated statements of income for the fiscal year ended March
31, 2017
From October 1, 2016 to December 31, 2016
3) Acquisition cost
Consideration for acquisition: payment in cash
¥176,246 million (U.S.$1,570 million)
Acquisition cost
¥176,246 million (U.S.$1,570 million)
The figure is a provisional amount as part of the consideration for acqui-
sition has not yet been determined.
4) Description and amount of main acquisition-related costs
Advisory fees
¥3,161 million (U.S.$28 million)
5) Amount and rationale for recognizing goodwill, and amortization method
and period
a. Amount of goodwill recognized
¥49,299 million (U.S.$439 million)
The figure is a provisional amount as the acquisition cost has not yet
been determined.
136
b. Rationale for recognizing goodwill
Goodwill was recognized because the equity interest in the net
amount of the assets acquired and the liabilities assumed were lower
than the acquisition cost.
c. Amortization method and period
Straight-line amortization over 20 years
6) Amounts of the assets acquired and the liabilities assumed on the busi-
ness combination date and their main components
Total assets: ¥470,920 million (U.S.$4,197 million)
(including investments in securities of ¥333,130 million (U.S.$2,969 million))
Total liabilities: ¥318,876 million (U.S.$2,842 million)
(including policy reserves and other reserves of ¥297,715 million
(U.S.$2,653 million))
7) Estimated impact on the consolidated statements of income for the fiscal
year ended March 31, 2017, assuming the business combination had
been completed at the beginning of the fiscal year (unaudited)
The estimated amounts of the impact are total ordinary income of
¥483,456 million (U.S.$4,309 million), ordinary profit of ¥32,924 million
(U.S.$293 million), and net surplus attributable to the parent company of
¥14,564 million (U.S.$129 million). The estimated amounts of the impact
represent total ordinary income, ordinary profit and net surplus attribut-
able to the parent company calculated based on the annual financial
statements for the year ended September 2016 prepared by MLC Lim-
ited. The amounts include the amortization of goodwill recognized at the
time of the business combination.
These estimates do not represent the total ordinary income, ordinary
profit and net surplus attributable to the parent company of MLC Limited
assuming that the business combination had actually been completed at
the beginning of the fiscal year ended March 31, 2017.
(2) Mitsui Life Insurance Company Limited (for the fiscal year
ended March 31, 2016)
1) Overview of the business combination
a. Name and business of the acquiree
Name: Mitsui Life Insurance Company Limited (“Mitsui Life”)
Business: Life insurance business
b. Main reasons for executing the business combination
i. Further strengthen and develop the Company’s competitive sales
representative channels through mutual cooperation.
ii. Establish channels and foundations through mutual cooperation
to provide appropriate products through the bancassurance and
agency areas, on the premise that adequate underwriting systems
are established and maintained, in order to meet diversified cus-
tomer needs in a flexible manner.
iii. In addition to i. and ii. above, mutually cooperate, share knowl-
edge, and leverage synergies to grow as a group.
c. Business combination date
December 31, 2015 (deemed acquisition date)
d. Legal form of the business combination
Share acquisition through tender offer
e. Name of company after business combination
Mitsui Life Insurance Company Limited
f. Percentage of voting rights acquired
100%
The Company and Mitsui Life have agreed that, after Mitsui Life
becomes a wholly owned subsidiary of the Company, 16% of the
outstanding ordinary shares of Mitsui Life will be sold to Sumitomo
Mitsui Banking Corporation, Sumitomo Mitsui Trust Bank, Limited,
Mitsui Sumitomo Insurance Co., Ltd., Mitsui & Co., Ltd. and Mitsui
Fudosan Co., Ltd. (collectively referred to as the “Post-Transaction
Shareholders”) and approximately 1% of the outstanding ordinary
shares of Mitsui Life are intended to be sold to other Mitsui group
companies, in order to preserve and develop business relationships
between Mitsui Life and Mitsui group companies.
Under the agreement above, the Company entered into a share
transfer agreement concerning the outstanding ordinary shares of
Mitsui Life with the Post-Transaction Shareholders and 14 other
Mitsui group companies subsequent to March 31, 2016, and sold a
total of 17.4% of the outstanding ordinary shares of Mitsui Life to
these Mitsui group companies on April 28 and May 18, 2016.
g. Main rationale for determining the acquirer
The main rationale for the Company being the acquirer is that the
Company will clearly control the decision-making body of the
acquiree based on majority ownership of voting rights.
2) Period for which the acquiree’s business results were included in the con-
solidated statements of income for the fiscal year ended March 31, 2016
From January 1, 2016 to March 31, 2016
3) Acquisition cost
Consideration for acquisition: payment in cash
¥334,473 million
Acquisition cost
¥334,473 million
4) Description and amount of main acquisition-related costs
Advisory fees
¥1,075 million
5) Amount and rationale for recognizing gain on bargain purchase
a. Amount of gain on bargain purchase recognized
¥102,957 million
b. Rationale for recognizing gain on bargain purchase
Gain on bargain purchase was recognized because the equity interest
in the net amount of the assets acquired and the liabilities assumed
exceeded the acquisition cost.
Of the difference between the equity interest in the net amount of
the assets acquired and the liabilities assumed and the acquisition
cost, the Company recognized as liabilities the 16% equity interest of
¥19,610 million that was scheduled to be transferred to the
137
Financial Data
CONSOLIDATED FINANCIAL STATEMENTS
Post-Transaction Shareholders, based on the agreement described in
(1) 1) f. of Note 3 above that 16% of the outstanding shares of Mitsui
Life will be sold to the Post-Transaction Shareholders. Upon the
completion of the transfer, the Company reduced its liabilities by this
amount and recognized the transferred equity interest in the net
amount of the assets acquired and the liabilities assumed as noncon-
trolling interests.
6) Amounts of the assets acquired and the liabilities assumed on the busi-
ness combination date and their main components
Total assets: ¥7,421,484 million
(including investments in securities of ¥5,151,265 million)
Total liabilities: ¥6,964,443 million
(including policy reserves and other reserves of ¥6,202,014 million)
7) Estimated impact on the consolidated statements of income for the fiscal
year ended March 31, 2016, assuming the business combination had
been completed at the beginning of the fiscal year (unaudited)
The estimated amounts of the impact are total ordinary income of
¥650,789 million, ordinary profit of ¥31,103 million, and net surplus
attributable to the parent company of ¥15,148 million.
The estimated amounts of the impact represent the respective differ-
ences between the total ordinary income and other earnings data calcu-
lated as if the business combination had been completed at the beginning
of the fiscal year ended March 31, 2016, and the total ordinary income
and other earnings data shown on the Company’s consolidated state-
ments of income for the fiscal year ended March 31, 2016.
4. Additional Information for Consolidated Statements of Cash Flows
(1) Acquisition of MLC Limited (for the fiscal year ended March
31, 2017)
The main components of the assets and liabilities of MLC Limited at acquisi-
tion date, following its conversion into a newly consolidated subsidiary
through the acquisition of shares, and the relationship between the acquisi-
tion cost of the shares and net payments from the acquisition are as
follows:
Millions of YenMillions of U.S. Dollars
Total assets ¥ 470,920 $ 4,197
(including investments in securities of ¥333,130 million (U.S.$2,969 million))
Goodwill 49,299 439
Total liabilities (318,876 ) (2,842 )
(including policy reserves and other reserves of ¥(297,715) million (U.S.$(2,653) million))
Foreign currency translation adjustments 5,311 47
Noncontrolling interests (30,408 ) (271 )
Acquisition cost of subsidiary’s shares 176,246 1,570
Cash and cash equivalents of subsidiary 87,997 784
Net payments from acquisition of subsidiary’s shares ¥ 88,249 $ 786
(2) Acquisition of Mitsui Life Insurance Company Limited (for the
fiscal year ended March 31, 2016)
The main components of the assets and liabilities of Mitsui Life Insurance
Company Limited at acquisition date, following its conversion into a newly
consolidated subsidiary through the acquisition of shares, and the relation-
ship between the acquisition cost of the shares and net proceeds from the
acquisition are as follows:
Millions of Yen
Total assets ¥ 7,421,484
(including investments in securities of ¥5,151,265 million)
Total liabilities ¥(6,964,443)
(including policy reserves and other reserves of ¥(6,202,014) million)
Gain on bargain purchase ¥ (102,957)
Other liabilities ¥ (19,610)
Acquisition cost of subsidiary’s shares ¥ 334,473
Cash and cash equivalents of subsidiary ¥ 557,459
Net proceeds from acquisition of subsidiary’s shares ¥ 222,986
5. Cash and Cash EquivalentsThe reconciliation of “Cash and cash equivalents” in the consolidated state-
ments of cash flows and “Cash and deposits” in the consolidated balance
sheets as of March 31, 2017, 2016 and 2015, was as follows:
Millions of YenMillions of U.S. Dollars
2017 2016 2015 2017
Cash and deposits ¥1,337,969 ¥1,351,597 ¥ 529,509 $11,925
Call loans 270,000 120,000 572,600 2,406
Monetary receivables purchased 35,999 21,998 36,996 320
Time deposits with initial term of over 3 months to maturity and others (102,500 ) (83,000 ) (52,601 ) (913 )
Cash and cash equivalents ¥1,541,468 ¥1,410,595 ¥1,086,504 $13,739
6. Financial InstrumentsRegarding the investment of the general accounts of the Company and
certain consolidated subsidiaries (except separate accounts as provided in
Article 118, Paragraph 1 of the Insurance Business Act), in light of the
characteristics of life insurance policies, the Company and certain consoli-
dated subsidiaries have built a portfolio geared towards mid- to long-term
investment and formulated an investment plan considering the outlook of
the investment environment.
Based on this, in order to reliably pay benefits and other payments in the
future, the Company and certain consolidated subsidiaries have positioned
yen-denominated assets that can be expected to provide stable income, such
as bonds and loans, as the core assets of the Company and certain consoli-
dated subsidiaries and from the viewpoint of improving profit in the mid- to
long-term, the Company and certain consolidated subsidiaries invest in
domestic stocks and foreign securities. Also, from the viewpoint of effective
investment, the Company and certain consolidated subsidiaries mainly use
138
derivative transactions for managing asset investment risks. Specifically, the
Company and certain consolidated subsidiaries use interest rate swaps for
the interest rate-related investments of the Company and certain consoli-
dated subsidiaries, foreign exchange forward contracts and currency options
and swaps for the currency-related investments of the Company and certain
consolidated subsidiaries, and equity forward contracts, equity index futures
and equity index options for the equity-related investments of the Company
and certain consolidated subsidiaries, and hedge accounting is applied with
respect to a portion thereof.
The Company and certain consolidated subsidiaries mainly apply the
following hedge accounting methods: The exceptional accounting treatment
(“Tokurei-shori”) for interest rate swaps is applied to hedge the cash flow
volatility of certain loans denominated in Japanese yen and certain loans
denominated in foreign currencies; deferred hedge accounting for interest
rate swaps is applied to hedge the interest rate fluctuation exposures on
certain insurance policies, based on the Industry Audit Committee Report No.
26, “Accounting and Auditing Treatments related to Application of Account-
ing for Financial Instruments in the Insurance Industry” issued by the JICPA;
deferred hedge accounting and designated hedge accounting (“Furiate-
shori”) for currency swaps are applied to hedge the cash flow volatility
caused by foreign exchange rate fluctuations on certain foreign currency-
denominated bonds, certain foreign currency-denominated loans, and for-
eign currency-denominated subordinated corporate bonds issued by the
Company; fair value hedge accounting and deferred hedge accounting for
foreign exchange forward contracts are applied to hedge the price fluctua-
tion exposures related to foreign exchange rate fluctuations on certain for-
eign currency-denominated bonds, certain foreign currency-denominated
stocks and certain other foreign currency-denominated instruments; and fair
value hedge accounting for equity forward contracts is applied to hedge the
price fluctuation exposures on certain domestic stocks. The effectiveness of
hedging activities is mainly evaluated by performing a ratio analysis of fair
value movement comparisons based on the hedging instruments and
hedged items taken, which is in accordance with the internal risk manage-
ment policies of the Company and certain consolidated subsidiaries.
Securities are mainly exposed to market risk and credit risk, loans are
exposed to credit risk, and derivative transactions are exposed to market risk
and credit risk. Market risk refers to the risk of incurring losses when the fair
value of investment assets declines due to such factors as fluctuations in
interest rates, exchange rates, or stock prices. Credit risk refers to the risk of
incurring losses when the value of assets, primarily loans and corporate
bonds, declines due to deterioration of the financial condition of the party to
whom credit has been extended. It includes country risk. These risks are
managed according to rules and regulations regarding investment risks.
To manage market risk, the Company and certain consolidated subsid-
iaries have implemented investment limits based on the nature of the assets
in order to avoid excessive losses from financing and investment transac-
tions. In addition, the Company and certain consolidated subsidiaries moni-
tor and regularly report on the status of compliance to the Risk Management
Committee, the advisory body of the Management Committee, and has
developed a system to manage risk within acceptable levels in the event of
a breach of the internal rules. Also, to manage market risk in the portfolio of
the Company and certain consolidated subsidiaries, the Company and cer-
tain consolidated subsidiaries use a statistical analysis method to rationally
calculate the market value-at-risk of the portfolio as a whole and conducts
appropriate asset allocation within acceptable boundaries of risk.
To manage credit risk, the Company and certain consolidated subsidiar-
ies have built a thorough monitoring system involving the Assessment
Management Department, which is independent of the departments han-
dling investment and finance activities. The Company and certain consoli-
dated subsidiaries also continue to build a sound portfolio through the
establishment and monitoring of interest guidelines to ensure the returns
the Company and certain consolidated subsidiaries obtain are commensu-
rate with the risk, a system of internal ratings for classifying the creditworthi-
ness of borrowers, and credit ceilings to ensure that credit risk is not
excessively concentrated in a particular company, group, or country. In addi-
tion, the Company and certain consolidated subsidiaries calculate credit
value-at-risk as a measurement of the magnitude of credit risk across the
portfolio of the Company and certain consolidated subsidiaries as a whole,
and monitor whether the magnitude of risk stays within an appropriate range.
139
Financial Data
CONSOLIDATED FINANCIAL STATEMENTS
(1) Balance sheet amounts and fair values of major financial instruments and their differences are as follows:
Millions of Yen Millions of U.S. Dollars
As of March 31 2017 2016 2015 2017Balance sheet
amount (*1) Fair value (*2) DifferenceBalance sheet
amount (*1) Fair value (*2) DifferenceBalance sheet
amount (*1) Fair value (*2) DifferenceBalance sheet
amount (*1) Fair value (*2) Difference
Cash and deposits (negotiable certificates of deposit): ¥ 752,601 ¥ 752,601 ¥ — ¥ 784,296 ¥ 784,296 ¥ — ¥ 313,499 ¥ 313,499 ¥ — $ 6,708 $ 6,708 $ —
Available-for-sale securities 752,601 752,601 — 784,296 784,296 — 313,499 313,499 — 6,708 6,708 —
Monetary receivables purchased: 337,913 366,297 28,383 436,630 477,324 40,693 498,758 534,726 35,968 3,011 3,264 252
Held-to-maturity debt securities 3,262 3,949 687 3,942 4,813 870 — — — 29 35 6
Policy-reserve-matching bonds 287,005 314,702 27,696 394,343 434,166 39,822 459,891 495,860 35,968 2,558 2,805 246
Available-for-sale securities 47,645 47,645 — 38,344 38,344 — 38,866 38,866 — 424 424 —
Assets held in trust: 3,597 3,597 — 2,134 2,134 — — — — 32 32 —
Trading securities 3,397 3,397 — 1,934 1,934 — — — — 30 30 —
Available-for-sale securities 200 200 — 200 200 — — — — 1 1 —
Investments in securities: 57,139,306 61,224,609 4,085,302 54,811,717 59,797,975 4,986,258 48,719,245 51,316,611 2,597,365 509,308 545,722 36,414
Trading securities 1,854,861 1,854,861 — 1,504,252 1,504,252 — 1,005,262 1,005,262 — 16,533 16,533 —
Held-to-maturity debt securities 45,676 46,132 455 50,592 51,300 708 49,201 49,339 137 407 411 4
Policy-reserve-matching bonds 21,345,239 25,375,088 4,029,849 22,117,306 27,057,693 4,940,386 20,214,005 22,796,569 2,582,564 190,259 226,179 35,919
Investments in subsidiaries and affiliates 32,594 87,590 54,996 21,762 66,925 45,163 22,810 37,474 14,663 290 780 490
Available-for-sale securities 33,860,935 33,860,935 — 31,117,803 31,117,803 — 27,427,965 27,427,965 — 301,817 301,817 —
Loans (*3): 8,987,810 9,318,744 330,933 9,452,673 9,855,076 402,402 8,327,360 8,660,317 332,956 80,112 83,062 2,949
Policy loans 710,377 710,377 — 758,908 758,908 — 736,402 736,402 — 6,331 6,331 —
Industrial and consumer loans 8,277,432 8,608,366 330,933 8,693,765 9,096,168 402,402 7,590,958 7,923,915 332,956 73,780 76,730 2,949
Derivative financial instruments (*4): (47,524 ) (47,524 ) — (44,934 ) (44,934 ) — (215,282 ) (215,282 ) — (423 ) (423 ) —
Hedge accounting not applied 16,186 16,186 — 18,856 18,856 — 515 515 — 144 144 —
Hedge accounting applied (63,710 ) (63,710 ) — (63,790 ) (63,790 ) — (215,798 ) (215,798 ) — (567 ) (567 ) —
Corporate bonds (*3, *5) (920,825 ) (968,282 ) (47,457 ) (650,825 ) (694,144 ) (43,319 ) (399,590 ) (417,493 ) (17,903 ) (8,207 ) (8,630 ) (423 )
Cash received as collateral under securities lending transactions (*5) (873,773 ) (873,773 ) — (834,089 ) (834,089 ) — (529,989 ) (529,989 ) — (7,788 ) (7,788 ) —
Loans payable (*3,*5) (210,192 ) (213,408 ) (3,216 ) (244,107 ) (245,740 ) (1,632 ) (82,988 ) (82,686 ) 301 (1,873 ) (1,902 ) (28 )
(*1) For transactions for which an allowance for doubtful accounts was recorded, the amount of the allowance is deducted.(*2) For securities for which impairment losses were recognized in the fiscal years ended March 31, 2017, 2016 and 2015, the fair value is the balance sheet amount after the impairment losses are deducted.(*3) The fair values of derivative financial instruments that are interest rate swaps under exceptional accounting treatment (“Tokurei-shori”) or currency swaps under designated hedge accounting (“Furiate-shori”) are included
in the fair values of loans, corporate bonds, and loans payable because they are accounted for as an integral part of the loans, corporate bonds, and loans payable that are the hedged items.(*4) Assets and liabilities generated by derivative financial instruments are offset and presented net. Net liabilities in total are presented in parentheses.(*5) Corporate bonds, cash received as collateral under securities lending transactions, and loans payable are recorded in liabilities and presented in parentheses.
(2) Fair value measurement methods for the major financial instruments of
the Company and certain consolidated subsidiaries are as follows:
1) Securities, deposits, and monetary receivables purchased that are
treated as securities based on the “Accounting Standard for Financial
Instruments” (ASBJ Statement No. 10)
i) Items with a market price
Fair value is measured based on the closing market price on the
balance sheet date. However, the fair values of available-for-
sale domestic and foreign equity securities are based on the
average market price over a one-month period prior to the
balance sheet date.
ii) Items without a market price
Fair value is measured mainly by discounting future cash flows to
present value.
2) Loans
i) Policy loans
Fair value is deemed to approximate book value, due to expected
repayment periods, interest rate requirements, and other charac-
teristics. These loans have no repayment date either in form or in
substance because stated due dates can be extended if the loan
amount is within a certain range of its surrender benefit. Thus, the
book value is used as the fair value of the policy loans.
ii) Industrial and consumer loans
Fair value of variable interest rate loans is deemed to approximate
book value because market interest rates are reflected in future
cash flows over the short term. Thus, book value is used as fair
value for variable interest rate loans.
Fair value of fixed interest rate loans is measured mainly by
discounting future cash flows to present value.
Fair value of loans to legally or substantially bankrupt borrow-
ers or borrowers who are not currently legally bankrupt but have
a high probability of bankruptcy is measured by deducting the
140
estimated uncollectible amount from the book value prior to
direct write-offs.
3) Derivative financial instruments
i) Fair value of futures and other market transactions is measured by
the liquidation value or closing market price on the balance
sheet date.
ii) Fair value of equity options is measured primarily by the liquida-
tion value or closing market price on the balance sheet date or the
price calculated by the Company based on volatility and other
data obtained mainly from external information vendors.
iii) Fair value of foreign exchange contracts and currency options is
measured primarily based on theoretical values calculated by the
Company using Telegraphic Transfer Middle rates and discount
rates obtained from financial institutions that are the counterpar-
ties in such transactions.
iv) Fair value of interest rate swaps and currency swaps is measured
primarily based on present values calculated by discounting the
differences between future cash inflows and outflows using pub-
lished market interest rates and other data.
v) Fair value of forward contracts is measured primarily based on
present values calculated by discounting future cash flows using
published market interest rates and other data.
4) Assets held in trust
Fair value is based on a reasonably calculated price by the trustee of
the assets held in trust, in accordance with the calculation methods
set forth in 1) and 3) above.
5) Corporate bonds
Corporate bonds are stated at fair value on the balance sheet date.
6) Cash received as collateral under securities lending transactions
The book value is used as fair value due to their short-term settlement.
7) Loans payable
Fair value of variable interest rate loans payable is deemed to approxi-
mate book value because market interest rates are reflected in future
cash flows over the short term. Thus, book value is used as fair value
for variable interest rate loans payable. Fair value of fixed interest rate
loans payable is measured mainly by discounting future cash flows to
present value.
(3) Unlisted equity securities, investments in partnerships whereby partner-
ship assets consist of unlisted equity securities, and other items of which
the fair value is extremely difficult to be determined are not included in
investments in securities in table (1).
Balance sheet amounts by holding purpose were ¥280,608 million
(U.S.$2,501 million), ¥290,247 million and ¥240,764 million for stocks
of subsidiaries and affiliates and ¥842,270 million (U.S.$7,507 million),
¥998,267 million and ¥938,781 million for available-for-sale securities as
of March 31, 2017, 2016 and 2015, respectively.
(4) Matters regarding securities and others by holding purpose are as follows:
1) Trading securities
Derivative financial instruments within assets held in trust, investments in securities for separate accounts and certain other securities are classified as
trading securities as of March 31, 2017, 2016 and 2015.
Valuation gains/losses included in profit and loss were gains of ¥65,537 million (U.S.$584 million), ¥38,615 million and ¥154,939 million for deriva-
tive financial instruments within assets held in trust and investments in securities related to separate accounts for the fiscal years ended March 31,
2017, 2016 and 2015, respectively.
2) Held-to-maturity debt securities
Balance sheet amounts, fair values and their differences by type are as follows:
Millions of Yen Millions of U.S. Dollars
As of March 31 2017 2016 2015 2017
TypeBalance sheet
amount Fair value DifferenceBalance sheet
amount Fair value DifferenceBalance sheet
amount Fair value DifferenceBalance sheet
amount Fair value Difference
Fair value exceeds the balance sheet amount:
Monetary receivables purchased ¥ 3,262 ¥ 3,949 ¥ 687 ¥ 3,942 ¥ 4,813 ¥ 870 ¥ — ¥ — ¥ — $ 29 $ 35 $ 6
Domestic bonds 29,655 30,132 476 38,796 39,567 770 31,443 31,574 131 264 268 4
Foreign securities 7,808 7,823 14 820 822 2 5,693 5,758 65 69 69 0
Subtotal 40,727 41,905 1,178 43,558 45,203 1,644 37,136 37,333 196 363 373 10
Fair value does not exceed the balance sheet amount:
Domestic bonds — — — — — — 1,004 1,003 (0 ) — — —
Foreign securities 8,212 8,177 (35 ) 10,975 10,910 (65 ) 11,061 11,002 (58 ) 73 72 (0 )
Subtotal 8,212 8,177 (35 ) 10,975 10,910 (65 ) 12,065 12,006 (59 ) 73 72 (0 )
Total ¥48,939 ¥50,082 ¥1,142 ¥54,534 ¥56,113 ¥1,579 ¥49,201 ¥49,339 ¥137 $436 $446 $10
141
Financial Data
CONSOLIDATED FINANCIAL STATEMENTS
3) Policy-reserve-matching bonds
Balance sheet amounts, fair values and their differences by type are as follows:
Millions of Yen Millions of U.S. Dollars
As of March 31 2017 2016 2015 2017
TypeBalance sheet
amount Fair value DifferenceBalance sheet
amount Fair value DifferenceBalance sheet
amount Fair value DifferenceBalance sheet
amount Fair value Difference
Fair value exceeds the balance sheet amount:
Monetary receivables purchased ¥ 283,224 ¥ 310,953 ¥ 27,728 ¥ 393,073 ¥ 432,939 ¥ 39,865 ¥ 457,286 ¥ 493,315 ¥ 36,029 $ 2,524 $ 2,771 $ 247
Domestic bonds 20,991,083 25,031,367 4,040,284 22,038,824 26,975,735 4,936,910 20,047,635 22,626,539 2,578,904 187,102 223,115 36,012
Foreign securities 54,979 57,114 2,135 71,717 75,196 3,478 71,655 75,699 4,043 490 509 19
Subtotal 21,329,288 25,399,436 4,070,148 22,503,616 27,483,871 4,980,254 20,576,578 23,195,555 2,618,977 190,117 226,396 36,279
Fair value does not exceed the balance sheet amount:
Monetary receivables purchased 3,781 3,749 (31 ) 1,270 1,227 (42 ) 2,604 2,544 (60 ) 33 33 (0 )
Domestic bonds 299,176 286,606 (12,569 ) 6,691 6,688 (3 ) 94,532 94,148 (383 ) 2,666 2,554 (112 )
Foreign securities — — — 72 72 (0 ) 181 180 (0 ) — — —
Subtotal 302,957 290,355 (12,601 ) 8,034 7,988 (46 ) 97,318 96,874 (444 ) 2,700 2,588 (112 )
Total ¥21,632,245 ¥25,689,791 ¥4,057,546 ¥22,511,650 ¥27,491,859 ¥4,980,208 ¥20,673,896 ¥23,292,429 ¥2,618,532 $192,817 $228,984 $36,166
4) Available-for-sale securities
Acquisition cost or amortized cost, balance sheet amounts and their differences by type are as follows:
Millions of Yen Millions of U.S. Dollars
As of March 31 2017 2016 2015 2017
Type
Acquisition cost or
amortized costBalance sheet
amount Difference
Acquisition cost or
amortized costBalance sheet
amount Difference
Acquisition cost or
amortized costBalance sheet
amount Difference
Acquisition cost or
amortized costBalance sheet
amount Difference
Balance sheet amount exceeds acquisition cost or amortized cost:
Cash and deposits (negotiable certificates of deposit) ¥ 587,600 ¥ 587,601 ¥ 1 ¥ 435,300 ¥ 435,300 ¥ 0 ¥ 93,000 ¥ 93,000 ¥ 0 $ 5,237 $ 5,237 $ 0
Monetary receivables purchased 10,074 11,180 1,106 14,167 15,683 1,515 1,000 1,016 16 89 99 9
Domestic bonds 3,454,533 3,674,457 219,923 3,965,914 4,271,349 305,435 2,235,511 2,393,305 157,794 30,791 32,752 1,960
Domestic stocks 3,416,428 7,825,582 4,409,153 3,216,667 7,028,499 3,811,831 3,728,491 8,744,114 5,015,622 30,452 69,752 39,300
Foreign securities 10,305,344 12,264,480 1,959,135 12,449,748 14,909,025 2,459,277 11,576,691 14,706,905 3,130,213 91,856 109,318 17,462
Other securities 940,019 1,109,657 169,637 932,272 1,131,464 199,192 696,330 815,423 119,093 8,378 9,890 1,512
Subtotal 18,714,000 25,472,958 6,758,958 21,014,070 27,791,323 6,777,253 18,331,024 26,753,765 8,422,741 166,806 227,051 60,245
Balance sheet amount does not exceed acquisition cost or amortized cost:
Cash and deposits (negotiable certificates of deposit) 165,000 164,999 (0 ) 349,000 348,996 (3 ) 220,500 220,498 (1 ) 1,470 1,470 (0 )
Monetary receivables purchased 36,466 36,464 (1 ) 22,663 22,661 (2 ) 37,852 37,850 (2 ) 325 325 (0 )
Assets held in trust 200 200 — 200 200 — — — — 1 1 —
Domestic bonds 520,295 512,685 (7,609 ) 51,657 50,454 (1,203 ) 125,848 125,038 (809 ) 4,637 4,569 (67 )
Domestic stocks 988,772 861,846 (126,925 ) 1,132,054 922,078 (209,975 ) 216,198 192,876 (23,321 ) 8,813 7,682 (1,131 )
Foreign securities 7,122,665 6,796,288 (326,377 ) 2,497,824 2,413,355 (84,469 ) 344,802 335,046 (9,756 ) 63,487 60,578 (2,909 )
Other securities 842,552 815,937 (26,615 ) 406,896 391,574 (15,321 ) 115,756 115,255 (500 ) 7,510 7,272 (237 )
Subtotal 9,675,952 9,188,422 (487,529 ) 4,460,297 4,149,321 (310,975 ) 1,060,958 1,026,565 (34,393 ) 86,246 81,900 (4,345 )
Total ¥28,389,953 ¥34,661,381 ¥6,271,428 ¥25,474,367 ¥31,940,645 ¥6,466,277 ¥19,391,983 ¥27,780,331 ¥8,388,348 $253,052 $308,952 $55,900
* Securities totaling ¥842,270 million (U.S.$7,507 million), ¥998,267 million and ¥938,781 million, whose fair values are extremely difficult to be determined, as of March 31, 2017, 2016 and 2015, respectively, are not included.
Impairment losses of ¥13,788 million (U.S.$122 million), ¥21,826 million and ¥17 million were recognized for securities with a fair value during the
fiscal years ended March 31, 2017, 2016 and 2015, respectively.
Regarding stocks (including foreign stocks) with fair values of the Company and certain consolidated subsidiaries, impairment losses are recognized
142
for stocks whose fair value has declined significantly from the acquisition price based on the average fair value in the last month of the fiscal year, in
principle. However, in the case of a security that meets certain criteria, such as a security for which the fair value declines substantially and the decline
in the fair value in the last month of the fiscal year is substantial, impairment losses are recognized based on the fair value on the fiscal year-end date.
The criteria by which the fair value of a stock is deemed to have declined significantly are as follows:
a. A security for which the ratio of the average fair value in the last month of the fiscal year to the acquisition cost is 50% or less.
b. A security that meets both of the following criteria:
1. Average fair value in the last month of the fiscal year is between 50% and 70% of its acquisition cost.
2. The historical fair value, the business conditions of the issuing company and other aspects are subject to certain requirements.
(5) Scheduled repayment amounts for the main monetary claims and liabilities and redemption amounts for securities with maturities are as follows:
As of March 31, 2017 Millions of Yen Millions of U.S. Dollars
1 year or underOver 1 year
under 5 yearsOver 5 years
under 10 years Over 10 years 1 year or underOver 1 year
under 5 yearsOver 5 years
under 10 years Over 10 years
Cash and deposits (negotiable certificates of deposit): ¥ 752,600 ¥ — ¥ — ¥ — $ 6,708 $ — $ — $ —
Available-for-sale securities 752,600 — — — 6,708 — — —
Monetary receivables purchased: 36,000 7,614 27,855 264,993 320 67 248 2,362
Held-to-maturity debt securities — — — 3,262 — — — 29
Policy-reserve-matching bonds — 7,373 27,631 251,656 — 65 246 2,243
Available-for-sale securities 36,000 240 223 10,074 320 2 1 89
Investments in securities: 1,101,601 4,660,991 9,960,948 27,670,693 9,819 41,545 88,786 246,641
Held-to-maturity debt securities 14,084 25,816 2,854 2,726 125 230 25 24
Policy-reserve-matching bonds 469,887 1,250,847 4,371,106 15,049,402 4,188 11,149 38,961 134,142
Available-for-sale securities 617,629 3,384,326 5,586,987 12,618,565 5,505 30,166 49,799 112,474
Loans (*1) 1,203,554 3,025,880 2,019,155 1,971,086 10,727 26,971 17,997 17,569
Corporate bonds — — — 890,825 — — — 7,940
Cash received as collateral under securities lending transactions 873,773 — — — 7,788 — — —
Loans payable (*2) 31,269 59,808 19,113 — 278 533 170 —
(*1) Assets such as policy loans, which do not have a stated maturity date, are not included. Also, ¥6,403 million (U.S.$57 million) in loans to legally or substantially bankrupt borrowers or borrowers who are not currently legally bankrupt but have a high probability of bankruptcy are not included.
(*2) Liabilities such as subordinated loans payable, which do not have a stated maturity date, are not included.
As of March 31, 2016 Millions of Yen
1 year or underOver 1 year
under 5 yearsOver 5 years
under 10 years Over 10 years
Cash and deposits (negotiable certificates of deposit): ¥ 784,300 ¥ — ¥ — ¥ —
Available-for-sale securities 784,300 — — —
Monetary receivables purchased: 24,625 5,574 48,916 355,472
Held-to-maturity debt securities — — — 3,942
Policy-reserve-matching bonds 906 5,226 48,603 339,081
Available-for-sale securities 23,718 347 313 12,448
Investments in securities: 1,411,751 5,067,414 8,443,005 26,676,101
Held-to-maturity debt securities 12,507 33,224 1,360 3,356
Policy-reserve-matching bonds 735,737 1,508,254 3,681,496 16,005,141
Available-for-sale securities 663,506 3,525,935 4,760,149 10,667,603
Loans (*1) 1,044,471 3,215,568 2,278,581 2,087,892
Corporate bonds — — — 650,825
Cash received as collateral under securities lending transactions 834,089 — — —
Loans payable (*2) 27,454 47,699 18,953 —
(*1) Assets such as policy loans, which do not have a stated maturity date, are not included. Also, ¥8,593 million in loans to legally or substantially bankrupt borrowers or borrowers who are not currently legally bankrupt but have a high probability of bankruptcy are not included.
(*2) Liabilities such as subordinated loans payable, which do not have a stated maturity date, are not included.
143
Financial Data
CONSOLIDATED FINANCIAL STATEMENTS
As of March 31, 2015 Millions of Yen
1 year or underOver 1 year
under 5 yearsOver 5 years
under 10 years Over 10 years
Cash and deposits (negotiable certificates of deposit): ¥313,500 ¥ — ¥ — ¥ —
Available-for-sale securities 313,500 — — —
Monetary receivables purchased: 42,040 2,094 61,379 392,605
Policy-reserve-matching bonds 5,040 2,094 60,527 391,605
Available-for-sale securities 37,000 — 851 1,000
Investments in securities: 925,782 5,165,746 6,268,357 23,494,898
Held-to-maturity debt securities 15,932 31,412 1,809 —
Policy-reserve-matching bonds 570,864 2,289,427 2,801,365 14,432,666
Available-for-sale securities 338,985 2,844,906 3,465,182 9,062,231
Loans 873,138 2,915,309 1,963,052 1,833,428
Corporate bonds — — — 399,590
Cash received as collateral under securities lending transactions 529,989 — — —
Loans payable 35,194 36,047 11,746 —
* Assets such as policy loans, which do not have a stated maturity date, are not included. Also, ¥11,000 million in loans to legally or substantially bankrupt borrowers or borrowers who are not currently legally bankrupt but have a high probability of bankruptcy are not included.
(6) Data on fair value of derivative transactions
i) Hedge accounting not applied a. Interest rate-related
Millions of Yen Millions of U.S. Dollars
As of March 31 2017 2016 2015 2017
Contract amount
Fair valueNet gains (losses)
Contract amount
Fair value Net losses
Contract amount
Fair valueNet gains (losses)
Contract amount
Fair valueNet gains (losses)
Over 1 year
Over 1 year
Over 1 yearOver 1 year
Over-the-counter:
Interest rate swaps
Receive fixed interest rate / pay variable interest rate ¥–– ¥–– ¥–– ¥–– ¥1,000 ¥1,000 ¥ (0 ) ¥ (0 ) ¥–– ¥–– ¥–– ¥–– $–– $–– $–– $––
Pay fixed interest rate / receive variable interest rate –– –– –– –– 2,500 2,500 (11 ) (11 ) –– –– –– –– –– –– –– ––
Total ¥–– ¥(12 ) ¥–– $––
Note: Net gains (losses) represent the fair value.
144
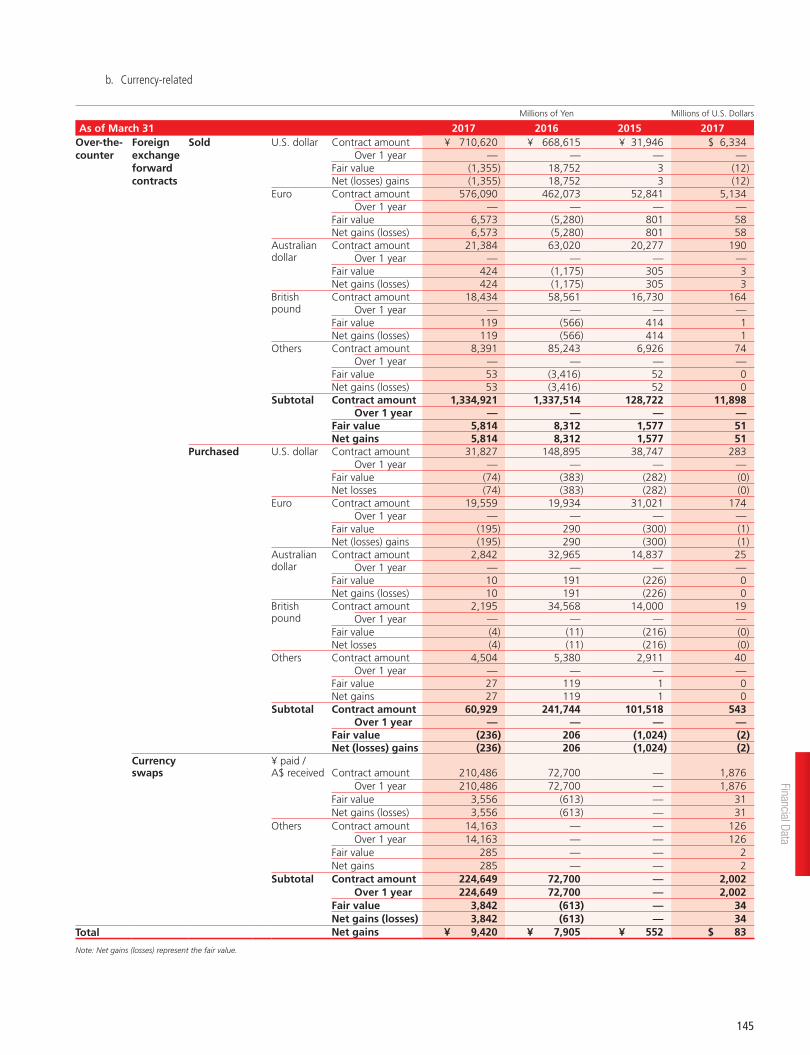
b. Currency-related
Millions of Yen Millions of U.S. Dollars
As of March 31 2017 2016 2015 2017Over-the- Foreign Sold U.S. dollar Contract amount ¥ 710,620 ¥ 668,615 ¥ 31,946 $ 6,334counter exchange Over 1 year — — — —
forward Fair value (1,355 ) 18,752 3 (12 )contracts Net (losses) gains (1,355 ) 18,752 3 (12 )
Euro Contract amount 576,090 462,073 52,841 5,134Over 1 year — — — —
Fair value 6,573 (5,280 ) 801 58Net gains (losses) 6,573 (5,280 ) 801 58
Australian dollar
Contract amount 21,384 63,020 20,277 190Over 1 year — — — —
Fair value 424 (1,175 ) 305 3Net gains (losses) 424 (1,175 ) 305 3
British pound
Contract amount 18,434 58,561 16,730 164Over 1 year — — — —
Fair value 119 (566 ) 414 1Net gains (losses) 119 (566 ) 414 1
Others Contract amount 8,391 85,243 6,926 74Over 1 year — — — —
Fair value 53 (3,416) 52 0Net gains (losses) 53 (3,416) 52 0
Subtotal Contract amount 1,334,921 1,337,514 128,722 11,898Over 1 year — — — —
Fair value 5,814 8,312 1,577 51Net gains 5,814 8,312 1,577 51
Purchased U.S. dollar Contract amount 31,827 148,895 38,747 283Over 1 year — — — —
Fair value (74 ) (383 ) (282 ) (0 )Net losses (74 ) (383 ) (282 ) (0 )
Euro Contract amount 19,559 19,934 31,021 174Over 1 year — — — —
Fair value (195 ) 290 (300 ) (1 )Net (losses) gains (195 ) 290 (300 ) (1 )
Australian dollar
Contract amount 2,842 32,965 14,837 25Over 1 year — — — —
Fair value 10 191 (226 ) 0Net gains (losses) 10 191 (226 ) 0
British pound
Contract amount 2,195 34,568 14,000 19Over 1 year — — — —
Fair value (4 ) (11 ) (216 ) (0 )Net losses (4 ) (11 ) (216 ) (0 )
Others Contract amount 4,504 5,380 2,911 40Over 1 year — — — —
Fair value 27 119 1 0Net gains 27 119 1 0
Subtotal Contract amount 60,929 241,744 101,518 543Over 1 year — — — —
Fair value (236 ) 206 (1,024 ) (2 )Net (losses) gains (236 ) 206 (1,024 ) (2 )
Currency swaps
¥ paid /A$ received Contract amount 210,486 72,700 — 1,876
Over 1 year 210,486 72,700 — 1,876Fair value 3,556 (613 ) — 31Net gains (losses) 3,556 (613 ) — 31
Others Contract amount 14,163 — — 126Over 1 year 14,163 — — 126
Fair value 285 — — 2Net gains 285 — — 2
Subtotal Contract amount 224,649 72,700 — 2,002Over 1 year 224,649 72,700 — 2,002
Fair value 3,842 (613 ) — 34Net gains (losses) 3,842 (613 ) — 34
Total Net gains ¥ 9,420 ¥ 7,905 ¥ 552 $ 83
Note: Net gains (losses) represent the fair value.
145
Financial Data
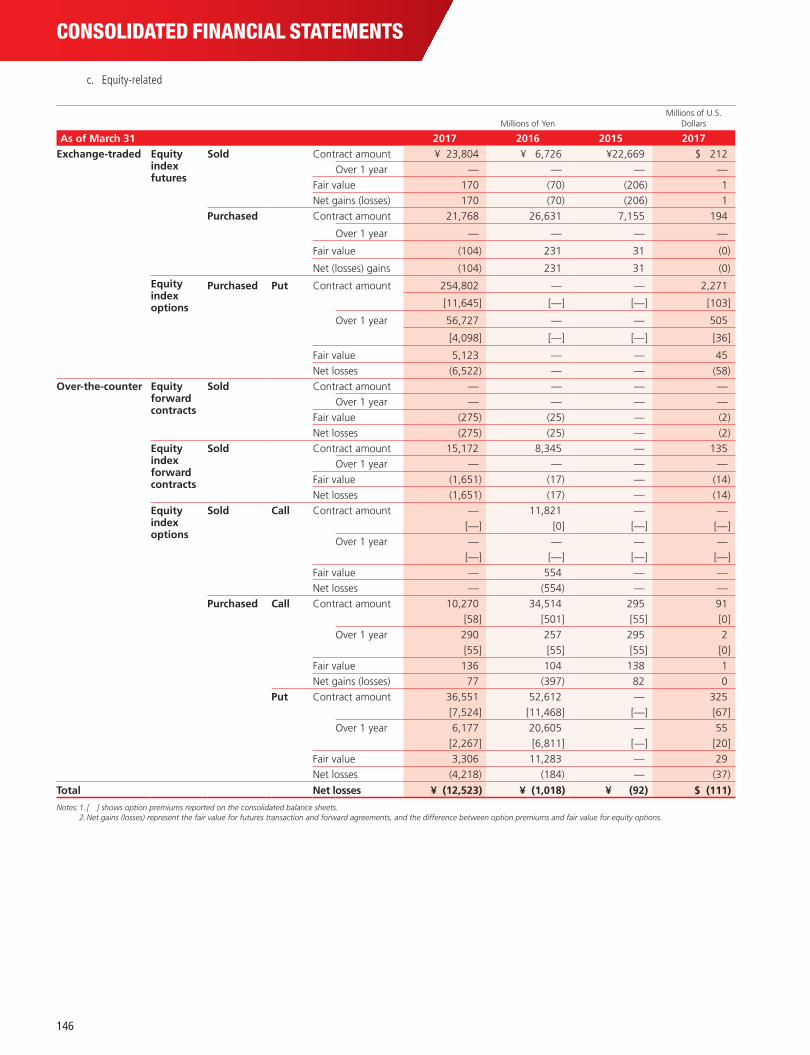
CONSOLIDATED FINANCIAL STATEMENTS
c. Equity-related
Millions of YenMillions of U.S.
Dollars
As of March 31 2017 2016 2015 2017Exchange-traded Equity
index futures
Sold Contract amount ¥ 23,804 ¥ 6,726 ¥22,669 $ 212
Over 1 year — — — —
Fair value 170 (70 ) (206 ) 1
Net gains (losses) 170 (70 ) (206 ) 1
Purchased Contract amount 21,768 26,631 7,155 194
Over 1 year — — — —
Fair value (104 ) 231 31 (0 )
Net (losses) gains (104 ) 231 31 (0 )
Equity index options
Purchased Put Contract amount 254,802 — — 2,271
[11,645 ] [— ] [— ] [103 ]
Over 1 year 56,727 — — 505
[4,098 ] [— ] [— ] [36 ]
Fair value 5,123 — — 45
Net losses (6,522 ) — — (58 )
Over-the-counter Equity forward contracts
Sold Contract amount — — — —
Over 1 year — — — —
Fair value (275 ) (25 ) — (2 )
Net losses (275 ) (25 ) — (2 )
Equity index forward contracts
Sold Contract amount 15,172 8,345 — 135
Over 1 year — — — —
Fair value (1,651 ) (17 ) — (14 )
Net losses (1,651 ) (17 ) — (14 )
Equity indexoptions
Sold Call Contract amount — 11,821 — —
[— ] [0 ] [— ] [— ]
Over 1 year — — — —
[— ] [— ] [— ] [— ]
Fair value — 554 — —
Net losses — (554 ) — —
Purchased Call Contract amount 10,270 34,514 295 91
[58 ] [501 ] [55 ] [0 ]
Over 1 year 290 257 295 2
[55 ] [55 ] [55 ] [0 ]
Fair value 136 104 138 1
Net gains (losses) 77 (397 ) 82 0
Put Contract amount 36,551 52,612 — 325
[7,524 ] [11,468 ] [— ] [67 ]
Over 1 year 6,177 20,605 — 55
[2,267 ] [6,811 ] [— ] [20 ]
Fair value 3,306 11,283 — 29
Net losses (4,218 ) (184 ) — (37 )
Total Net losses ¥ (12,523 ) ¥ (1,018 ) ¥ (92 ) $ (111 )
Notes: 1. [ ] shows option premiums reported on the consolidated balance sheets. 2. Net gains (losses) represent the fair value for futures transaction and forward agreements, and the difference between option premiums and fair value for equity options.
146
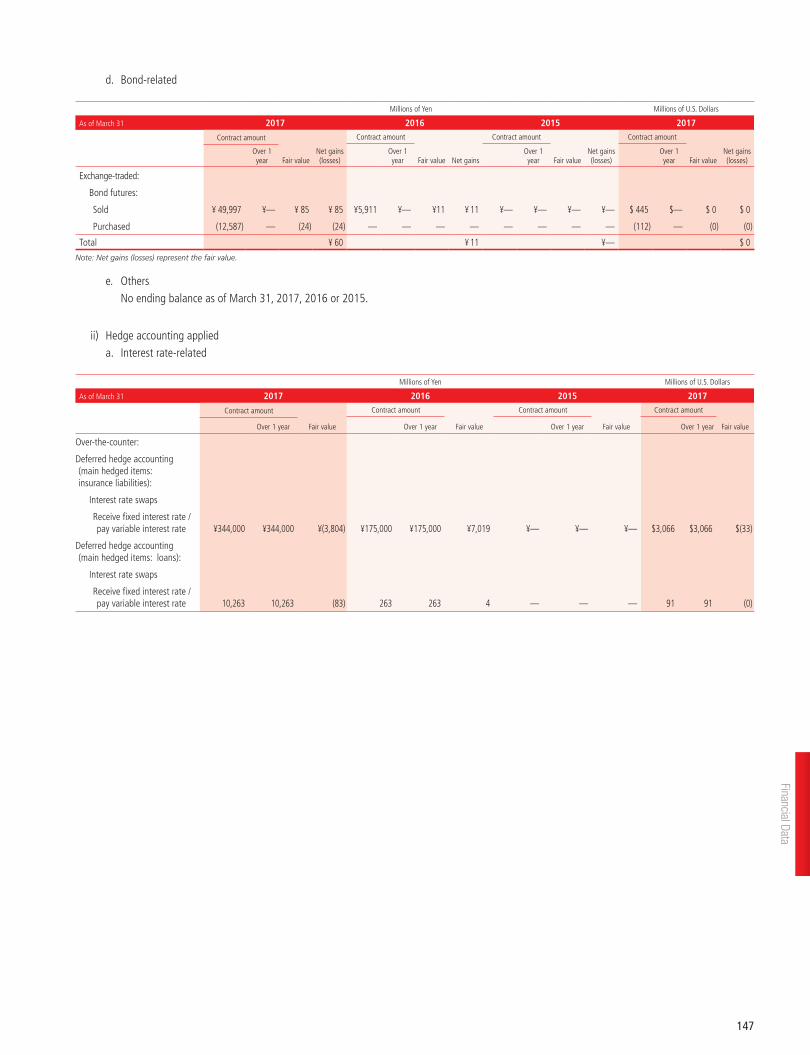
d. Bond-related
Millions of Yen Millions of U.S. Dollars
As of March 31 2017 2016 2015 2017
Contract amount
Fair valueNet gains (losses)
Contract amount
Fair value Net gains
Contract amount
Fair valueNet gains (losses)
Contract amount
Fair valueNet gains (losses)
Over 1 year
Over 1 year
Over 1 year
Over 1 year
Exchange-traded:
Bond futures:
Sold ¥ 49,997 ¥— ¥ 85 ¥ 85 ¥5,911 ¥— ¥11 ¥ 11 ¥— ¥— ¥— ¥— $ 445 $— $ 0 $ 0
Purchased (12,587 ) — (24 ) (24 ) — — — — — — — — (112 ) — (0 ) (0 )
Total ¥ 60 ¥ 11 ¥— $ 0
Note: Net gains (losses) represent the fair value.
e. Others No ending balance as of March 31, 2017, 2016 or 2015.
ii) Hedge accounting applied a. Interest rate-related
Millions of Yen Millions of U.S. Dollars
As of March 31 2017 2016 2015 2017
Contract amount
Fair value
Contract amount
Fair value
Contract amount
Fair value
Contract amount
Fair valueOver 1 year Over 1 year Over 1 yearOver 1 year
Over-the-counter:
Deferred hedge accounting (main hedged items: insurance liabilities):
Interest rate swaps
Receive fixed interest rate / pay variable interest rate ¥344,000 ¥344,000 ¥(3,804 ) ¥175,000 ¥175,000 ¥7,019 ¥–– ¥–– ¥–– $3,066 $3,066 $(33 )
Deferred hedge accounting (main hedged items: loans):
Interest rate swaps
Receive fixed interest rate / pay variable interest rate 10,263 10,263 (83 ) 263 263 4 — — — 91 91 (0 )
147
Financial Data
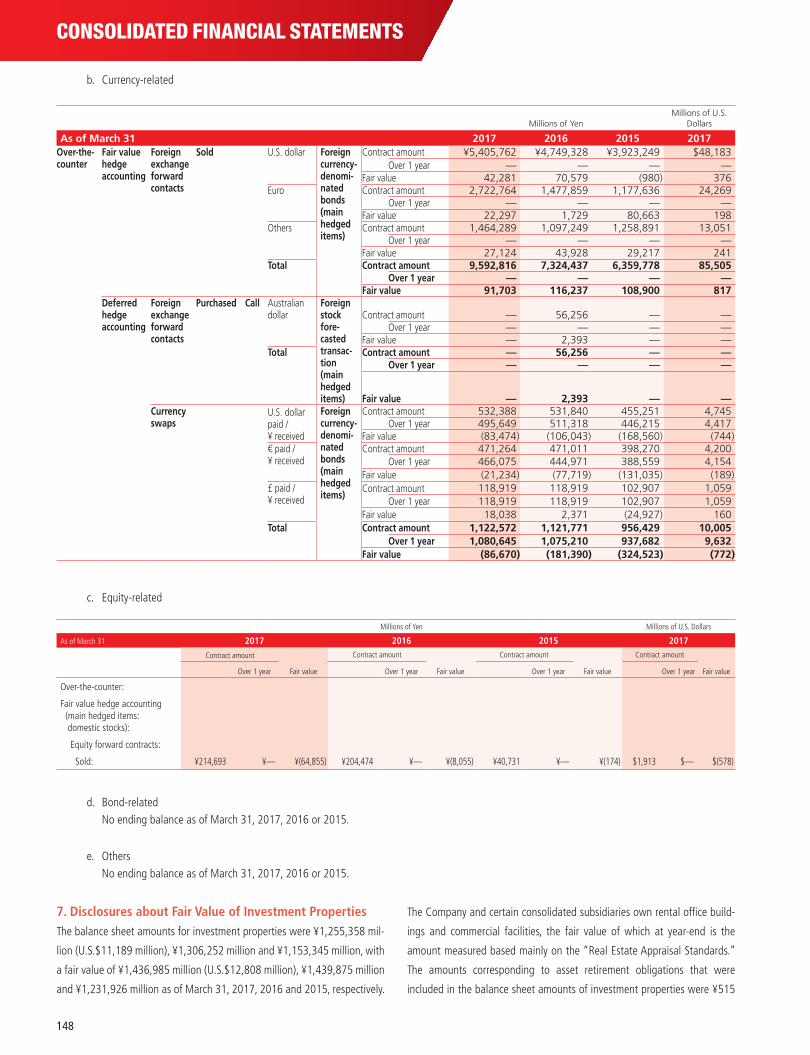
CONSOLIDATED FINANCIAL STATEMENTS
b. Currency-related
Millions of YenMillions of U.S.
Dollars
As of March 31 2017 2016 2015 2017Over-the-counter
Fair valuehedgeaccounting
Foreignexchangeforwardcontacts
Sold U.S. dollar Foreigncurrency-denomi-natedbonds(mainhedgeditems)
Contract amount ¥5,405,762 ¥4,749,328 ¥3,923,249 $48,183Over 1 year — — — —
Fair value 42,281 70,579 (980 ) 376Euro Contract amount 2,722,764 1,477,859 1,177,636 24,269
Over 1 year — — — —Fair value 22,297 1,729 80,663 198
Others Contract amount 1,464,289 1,097,249 1,258,891 13,051Over 1 year — — — —
Fair value 27,124 43,928 29,217 241Total Contract amount 9,592,816 7,324,437 6,359,778 85,505
Over 1 year — — — —Fair value 91,703 116,237 108,900 817
Deferredhedgeaccounting
Foreignexchangeforwardcontacts
Purchased Call Australian dollar
Foreign stock fore-casted transac-tion (main hedged items)
Contract amount — 56,256 — —Over 1 year — — — —
Fair value — 2,393 — —Total Contract amount — 56,256 — —
Over 1 year — — — —
Fair value — 2,393 — —Currencyswaps
U.S. dollar paid / ¥ received
Foreigncurrency-denomi-natedbonds(mainhedgeditems)
Contract amount 532,388 531,840 455,251 4,745Over 1 year 495,649 511,318 446,215 4,417
Fair value (83,474 ) (106,043 ) (168,560 ) (744 )€ paid / ¥ received
Contract amount 471,264 471,011 398,270 4,200Over 1 year 466,075 444,971 388,559 4,154
Fair value (21,234 ) (77,719 ) (131,035 ) (189 )£ paid / ¥ received
Contract amount 118,919 118,919 102,907 1,059Over 1 year 118,919 118,919 102,907 1,059
Fair value 18,038 2,371 (24,927 ) 160Total Contract amount 1,122,572 1,121,771 956,429 10,005
Over 1 year 1,080,645 1,075,210 937,682 9,632Fair value (86,670 ) (181,390 ) (324,523 ) (772 )
c. Equity-related
Millions of Yen Millions of U.S. Dollars
As of March 31 2017 2016 2015 2017
Contract amount
Fair value
Contract amount
Fair value
Contract amount
Fair value
Contract amount
Fair valueOver 1 year Over 1 year Over 1 yearOver 1 year
Over-the-counter:
Fair value hedge accounting (main hedged items: domestic stocks):
Equity forward contracts:
Sold: ¥214,693 ¥— ¥(64,855 ) ¥204,474 ¥— ¥(8,055 ) ¥40,731 ¥— ¥(174 ) $1,913 $— $(578 )
d. Bond-related No ending balance as of March 31, 2017, 2016 or 2015.
e. Others No ending balance as of March 31, 2017, 2016 or 2015.
7. Disclosures about Fair Value of Investment PropertiesThe balance sheet amounts for investment properties were ¥1,255,358 mil-
lion (U.S.$11,189 million), ¥1,306,252 million and ¥1,153,345 million, with
a fair value of ¥1,436,985 million (U.S.$12,808 million), ¥1,439,875 million
and ¥1,231,926 million as of March 31, 2017, 2016 and 2015, respectively.
The Company and certain consolidated subsidiaries own rental office build-
ings and commercial facilities, the fair value of which at year-end is the
amount measured based mainly on the “Real Estate Appraisal Standards.”
The amounts corresponding to asset retirement obligations that were
included in the balance sheet amounts of investment properties were ¥515
148
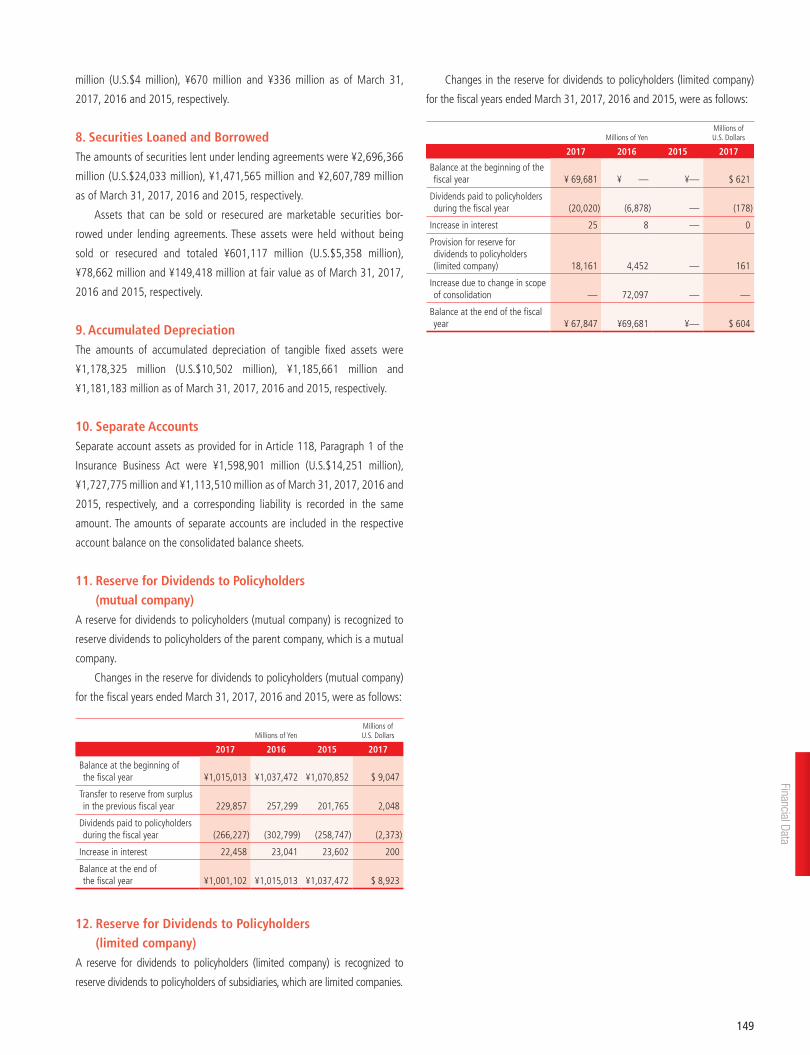
million (U.S.$4 million), ¥670 million and ¥336 million as of March 31,
2017, 2016 and 2015, respectively.
8. Securities Loaned and BorrowedThe amounts of securities lent under lending agreements were ¥2,696,366
million (U.S.$24,033 million), ¥1,471,565 million and ¥2,607,789 million
as of March 31, 2017, 2016 and 2015, respectively.
Assets that can be sold or resecured are marketable securities bor-
rowed under lending agreements. These assets were held without being
sold or resecured and totaled ¥601,117 million (U.S.$5,358 million),
¥78,662 million and ¥149,418 million at fair value as of March 31, 2017,
2016 and 2015, respectively.
9. Accumulated DepreciationThe amounts of accumulated depreciation of tangible fixed assets were
¥1,178,325 million (U.S.$10,502 million), ¥1,185,661 million and
¥1,181,183 million as of March 31, 2017, 2016 and 2015, respectively.
10. Separate AccountsSeparate account assets as provided for in Article 118, Paragraph 1 of the
Insurance Business Act were ¥1,598,901 million (U.S.$14,251 million),
¥1,727,775 million and ¥1,113,510 million as of March 31, 2017, 2016 and
2015, respectively, and a corresponding liability is recorded in the same
amount. The amounts of separate accounts are included in the respective
account balance on the consolidated balance sheets.
11. Reserve for Dividends to Policyholders (mutual company)
A reserve for dividends to policyholders (mutual company) is recognized to
reserve dividends to policyholders of the parent company, which is a mutual
company.
Changes in the reserve for dividends to policyholders (mutual company)
for the fiscal years ended March 31, 2017, 2016 and 2015, were as follows:
Millions of YenMillions of U.S. Dollars
2017 2016 2015 2017
Balance at the beginning of the fiscal year ¥1,015,013 ¥1,037,472 ¥1,070,852 $ 9,047
Transfer to reserve from surplus in the previous fiscal year 229,857 257,299 201,765 2,048
Dividends paid to policyholders during the fiscal year (266,227 ) (302,799 ) (258,747 ) (2,373 )
Increase in interest 22,458 23,041 23,602 200
Balance at the end of the fiscal year ¥1,001,102 ¥1,015,013 ¥1,037,472 $ 8,923
12. Reserve for Dividends to Policyholders (limited company)
A reserve for dividends to policyholders (limited company) is recognized to
reserve dividends to policyholders of subsidiaries, which are limited companies.
Changes in the reserve for dividends to policyholders (limited company)
for the fiscal years ended March 31, 2017, 2016 and 2015, were as follows:
Millions of YenMillions of U.S. Dollars
2017 2016 2015 2017
Balance at the beginning of the fiscal year ¥ 69,681 ¥ — ¥— $ 621
Dividends paid to policyholders during the fiscal year (20,020 ) (6,878 ) — (178 )
Increase in interest 25 8 — 0
Provision for reserve for dividends to policyholders (limited company) 18,161 4,452 — 161
Increase due to change in scope of consolidation — 72,097 — —
Balance at the end of the fiscal year ¥ 67,847 ¥69,681 ¥— $ 604
149
Financial Data
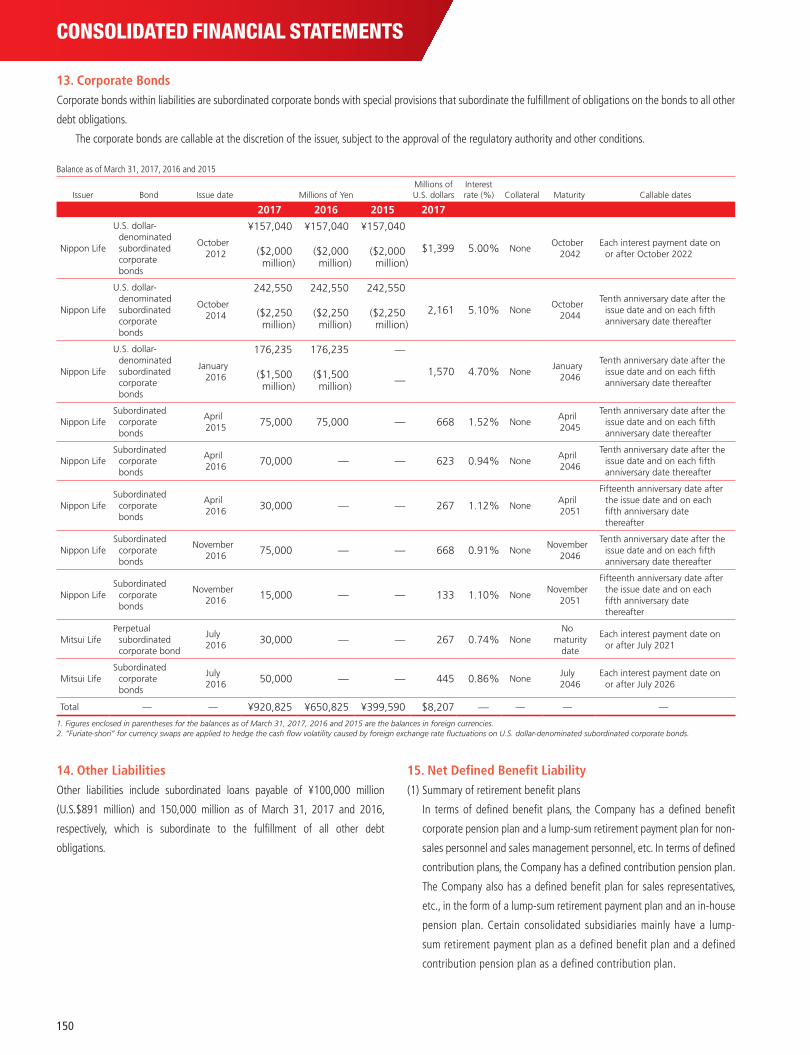
CONSOLIDATED FINANCIAL STATEMENTS
13. Corporate BondsCorporate bonds within liabilities are subordinated corporate bonds with special provisions that subordinate the fulfillment of obligations on the bonds to all other
debt obligations.
The corporate bonds are callable at the discretion of the issuer, subject to the approval of the regulatory authority and other conditions.
Balance as of March 31, 2017, 2016 and 2015
Issuer Bond Issue date Millions of YenMillions of U.S. dollars
Interest rate (%) Collateral Maturity Callable dates
2017 2016 2015 2017
Nippon Life
U.S. dollar-denominated subordinated corporate bonds
October 2012
¥157,040 ¥157,040 ¥157,040
$1,399 5.00% NoneOctober
2042Each interest payment date on
or after October 2022($2,000 million )
($2,000 million )
($2,000 million )
Nippon Life
U.S. dollar-denominated subordinated corporate bonds
October 2014
242,550 242,550 242,550
2,161 5.10% NoneOctober
2044
Tenth anniversary date after the issue date and on each fifth anniversary date thereafter
($2,250 million )
($2,250 million )
($2,250 million )
Nippon Life
U.S. dollar-denominated subordinated corporate bonds
January 2016
176,235 176,235 —
1,570 4.70% NoneJanuary
2046
Tenth anniversary date after the issue date and on each fifth anniversary date thereafter
($1,500 million )
($1,500 million ) —
Nippon LifeSubordinated
corporate bonds
April 2015 75,000 75,000 — 668 1.52% None
April 2045
Tenth anniversary date after the issue date and on each fifth anniversary date thereafter
Nippon LifeSubordinated
corporate bonds
April 2016 70,000 — — 623 0.94% None
April 2046
Tenth anniversary date after the issue date and on each fifth anniversary date thereafter
Nippon LifeSubordinated
corporate bonds
April 2016 30,000 — — 267 1.12% None
April 2051
Fifteenth anniversary date after the issue date and on each fifth anniversary date thereafter
Nippon LifeSubordinated
corporate bonds
November 2016 75,000 — — 668 0.91% None
November 2046
Tenth anniversary date after the issue date and on each fifth anniversary date thereafter
Nippon LifeSubordinated
corporate bonds
November 2016 15,000 — — 133 1.10% None
November 2051
Fifteenth anniversary date after the issue date and on each fifth anniversary date thereafter
Mitsui LifePerpetual
subordinated corporate bond
July 2016 30,000 — — 267 0.74% None
No maturity
date
Each interest payment date on or after July 2021
Mitsui LifeSubordinated
corporate bonds
July 2016 50,000 — — 445 0.86% None
July 2046
Each interest payment date on or after July 2026
Total — — ¥920,825 ¥650,825 ¥399,590 $8,207 — — — —
1. Figures enclosed in parentheses for the balances as of March 31, 2017, 2016 and 2015 are the balances in foreign currencies. 2. “Furiate-shori” for currency swaps are applied to hedge the cash flow volatility caused by foreign exchange rate fluctuations on U.S. dollar-denominated subordinated corporate bonds.
14. Other LiabilitiesOther liabilities include subordinated loans payable of ¥100,000 million
(U.S.$891 million) and 150,000 million as of March 31, 2017 and 2016,
respectively, which is subordinate to the fulfillment of all other debt
obligations.
15. Net Defined Benefit Liability(1) Summary of retirement benefit plans
In terms of defined benefit plans, the Company has a defined benefit
corporate pension plan and a lump-sum retirement payment plan for non-
sales personnel and sales management personnel, etc. In terms of defined
contribution plans, the Company has a defined contribution pension plan.
The Company also has a defined benefit plan for sales representatives,
etc., in the form of a lump-sum retirement payment plan and an in-house
pension plan. Certain consolidated subsidiaries mainly have a lump-
sum retirement payment plan as a defined benefit plan and a defined
contribution pension plan as a defined contribution plan.
150
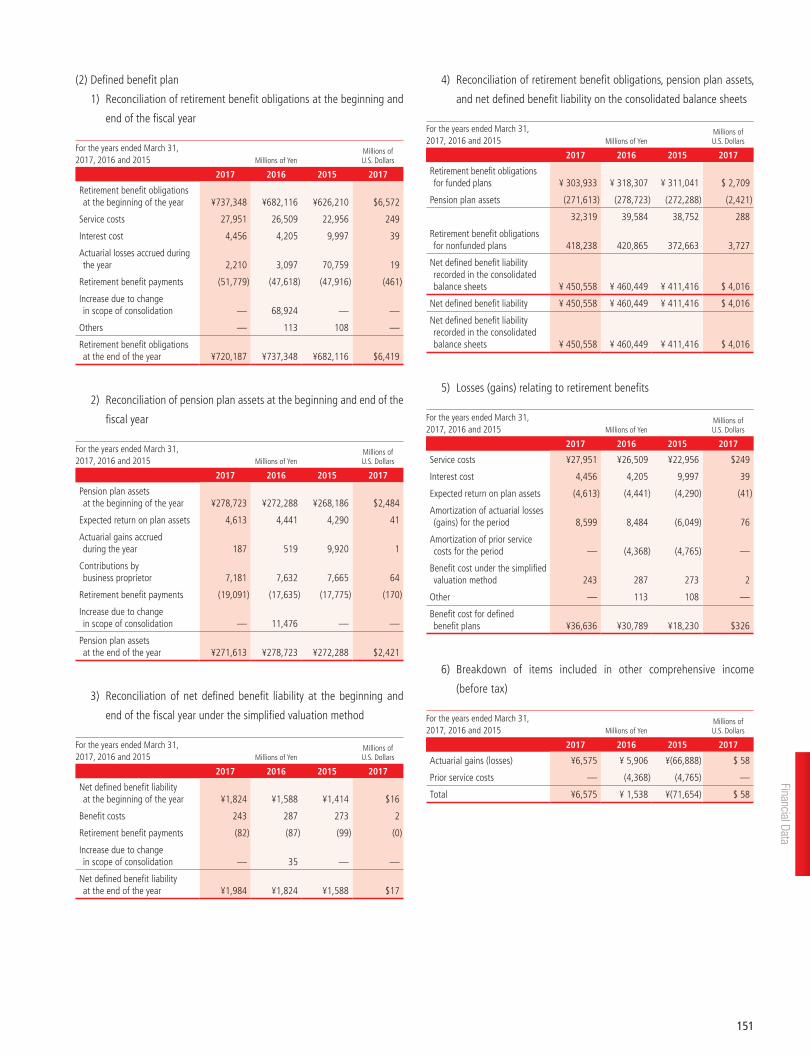
(2) Defined benefit plan
1) Reconciliation of retirement benefit obligations at the beginning and
end of the fiscal year
For the years ended March 31, 2017, 2016 and 2015 Millions of Yen
Millions of U.S. Dollars
2017 2016 2015 2017
Retirement benefit obligations at the beginning of the year ¥737,348 ¥682,116 ¥626,210 $6,572
Service costs 27,951 26,509 22,956 249
Interest cost 4,456 4,205 9,997 39
Actuarial losses accrued during the year 2,210 3,097 70,759 19
Retirement benefit payments (51,779 ) (47,618 ) (47,916 ) (461 )
Increase due to change in scope of consolidation — 68,924 — —
Others — 113 108 —
Retirement benefit obligations at the end of the year ¥720,187 ¥737,348 ¥682,116 $6,419
2) Reconciliation of pension plan assets at the beginning and end of the
fiscal year
For the years ended March 31, 2017, 2016 and 2015 Millions of Yen
Millions of U.S. Dollars
2017 2016 2015 2017
Pension plan assets at the beginning of the year ¥278,723 ¥272,288 ¥268,186 $2,484
Expected return on plan assets 4,613 4,441 4,290 41
Actuarial gains accrued during the year 187 519 9,920 1
Contributions by business proprietor 7,181 7,632 7,665 64
Retirement benefit payments (19,091 ) (17,635 ) (17,775 ) (170 )
Increase due to change in scope of consolidation — 11,476 — —
Pension plan assets at the end of the year ¥271,613 ¥278,723 ¥272,288 $2,421
3) Reconciliation of net defined benefit liability at the beginning and
end of the fiscal year under the simplified valuation method
For the years ended March 31, 2017, 2016 and 2015 Millions of Yen
Millions of U.S. Dollars
2017 2016 2015 2017
Net defined benefit liability at the beginning of the year ¥1,824 ¥1,588 ¥1,414 $16
Benefit costs 243 287 273 2
Retirement benefit payments (82 ) (87 ) (99 ) (0 )
Increase due to change in scope of consolidation — 35 — —
Net defined benefit liability at the end of the year ¥1,984 ¥1,824 ¥1,588 $17
4) Reconciliation of retirement benefit obligations, pension plan assets,
and net defined benefit liability on the consolidated balance sheets
For the years ended March 31, 2017, 2016 and 2015 Millions of Yen
Millions of U.S. Dollars
2017 2016 2015 2017
Retirement benefit obligations for funded plans ¥ 303,933 ¥ 318,307 ¥ 311,041 $ 2,709
Pension plan assets (271,613 ) (278,723 ) (272,288 ) (2,421 )
32,319 39,584 38,752 288
Retirement benefit obligations for nonfunded plans 418,238 420,865 372,663 3,727
Net defined benefit liability recorded in the consolidated balance sheets ¥ 450,558 ¥ 460,449 ¥ 411,416 $ 4,016
Net defined benefit liability ¥ 450,558 ¥ 460,449 ¥ 411,416 $ 4,016
Net defined benefit liability recorded in the consolidated balance sheets ¥ 450,558 ¥ 460,449 ¥ 411,416 $ 4,016
5) Losses (gains) relating to retirement benefits
For the years ended March 31, 2017, 2016 and 2015 Millions of Yen
Millions of U.S. Dollars
2017 2016 2015 2017
Service costs ¥27,951 ¥26,509 ¥22,956 $249
Interest cost 4,456 4,205 9,997 39
Expected return on plan assets (4,613 ) (4,441 ) (4,290 ) (41 )
Amortization of actuarial losses (gains) for the period 8,599 8,484 (6,049 ) 76
Amortization of prior service costs for the period — (4,368 ) (4,765 ) —
Benefit cost under the simplified valuation method 243 287 273 2
Other — 113 108 —
Benefit cost for defined benefit plans ¥36,636 ¥30,789 ¥18,230 $326
6) Breakdown of items included in other comprehensive income
(before tax)
For the years ended March 31, 2017, 2016 and 2015 Millions of Yen
Millions of U.S. Dollars
2017 2016 2015 2017
Actuarial gains (losses) ¥6,575 ¥ 5,906 ¥(66,888 ) $ 58
Prior service costs — (4,368 ) (4,765 ) —
Total ¥6,575 ¥ 1,538 ¥(71,654 ) $ 58
151
Financial Data
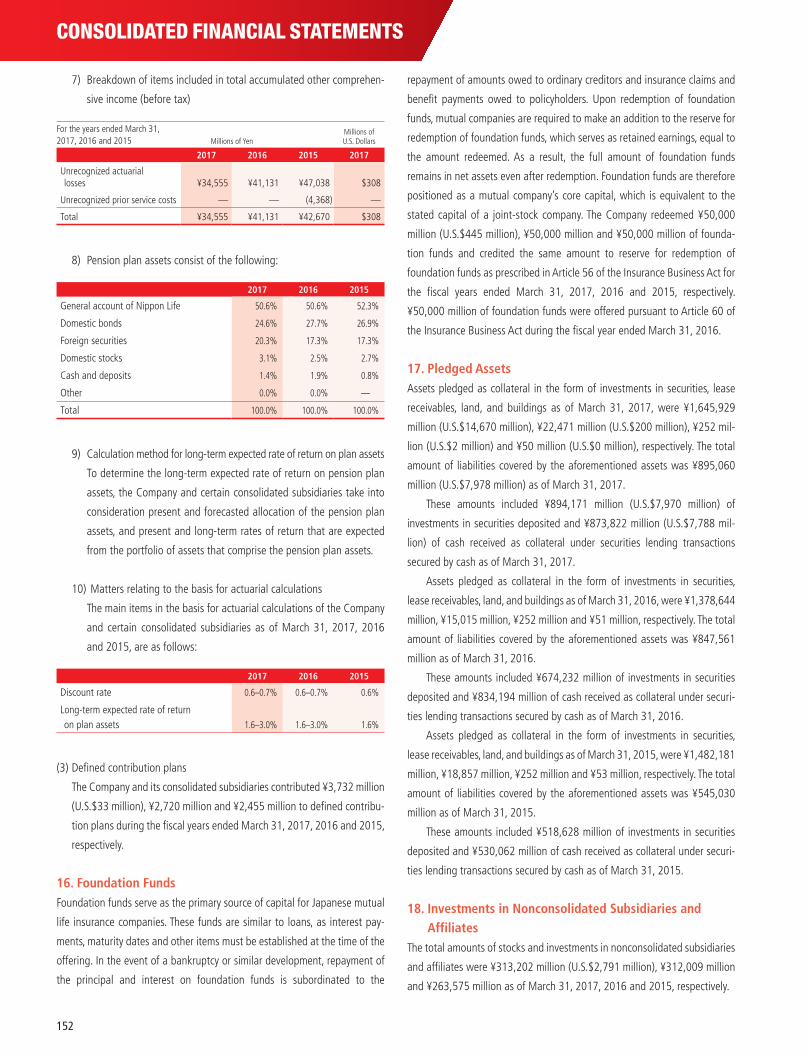
CONSOLIDATED FINANCIAL STATEMENTS
7) Breakdown of items included in total accumulated other comprehen-
sive income (before tax)
For the years ended March 31, 2017, 2016 and 2015 Millions of Yen
Millions of U.S. Dollars
2017 2016 2015 2017
Unrecognized actuarial losses ¥34,555 ¥41,131 ¥47,038 $308
Unrecognized prior service costs — — (4,368 ) —
Total ¥34,555 ¥41,131 ¥42,670 $308
8) Pension plan assets consist of the following:
2017 2016 2015
General account of Nippon Life 50.6% 50.6% 52.3%
Domestic bonds 24.6% 27.7% 26.9%
Foreign securities 20.3% 17.3% 17.3%
Domestic stocks 3.1% 2.5% 2.7%
Cash and deposits 1.4% 1.9% 0.8%
Other 0.0% 0.0% —
Total 100.0% 100.0% 100.0%
9) Calculation method for long-term expected rate of return on plan assets
To determine the long-term expected rate of return on pension plan
assets, the Company and certain consolidated subsidiaries take into
consideration present and forecasted allocation of the pension plan
assets, and present and long-term rates of return that are expected
from the portfolio of assets that comprise the pension plan assets.
10) Matters relating to the basis for actuarial calculations
The main items in the basis for actuarial calculations of the Company
and certain consolidated subsidiaries as of March 31, 2017, 2016
and 2015, are as follows:
2017 2016 2015
Discount rate 0.6–0.7% 0.6–0.7% 0.6%
Long-term expected rate of return on plan assets 1.6–3.0% 1.6–3.0% 1.6%
(3) Defined contribution plans
The Company and its consolidated subsidiaries contributed ¥3,732 million
(U.S.$33 million), ¥2,720 million and ¥2,455 million to defined contribu-
tion plans during the fiscal years ended March 31, 2017, 2016 and 2015,
respectively.
16. Foundation FundsFoundation funds serve as the primary source of capital for Japanese mutual
life insurance companies. These funds are similar to loans, as interest pay-
ments, maturity dates and other items must be established at the time of the
offering. In the event of a bankruptcy or similar development, repayment of
the principal and interest on foundation funds is subordinated to the
repayment of amounts owed to ordinary creditors and insurance claims and
benefit payments owed to policyholders. Upon redemption of foundation
funds, mutual companies are required to make an addition to the reserve for
redemption of foundation funds, which serves as retained earnings, equal to
the amount redeemed. As a result, the full amount of foundation funds
remains in net assets even after redemption. Foundation funds are therefore
positioned as a mutual company’s core capital, which is equivalent to the
stated capital of a joint-stock company. The Company redeemed ¥50,000
million (U.S.$445 million), ¥50,000 million and ¥50,000 million of founda-
tion funds and credited the same amount to reserve for redemption of
foundation funds as prescribed in Article 56 of the Insurance Business Act for
the fiscal years ended March 31, 2017, 2016 and 2015, respectively.
¥50,000 million of foundation funds were offered pursuant to Article 60 of
the Insurance Business Act during the fiscal year ended March 31, 2016.
17. Pledged AssetsAssets pledged as collateral in the form of investments in securities, lease
receivables, land, and buildings as of March 31, 2017, were ¥1,645,929
million (U.S.$14,670 million), ¥22,471 million (U.S.$200 million), ¥252 mil-
lion (U.S.$2 million) and ¥50 million (U.S.$0 million), respectively. The total
amount of liabilities covered by the aforementioned assets was ¥895,060
million (U.S.$7,978 million) as of March 31, 2017.
These amounts included ¥894,171 million (U.S.$7,970 million) of
investments in securities deposited and ¥873,822 million (U.S.$7,788 mil-
lion) of cash received as collateral under securities lending transactions
secured by cash as of March 31, 2017.
Assets pledged as collateral in the form of investments in securities,
lease receivables, land, and buildings as of March 31, 2016, were ¥1,378,644
million, ¥15,015 million, ¥252 million and ¥51 million, respectively. The total
amount of liabilities covered by the aforementioned assets was ¥847,561
million as of March 31, 2016.
These amounts included ¥674,232 million of investments in securities
deposited and ¥834,194 million of cash received as collateral under securi-
ties lending transactions secured by cash as of March 31, 2016.
Assets pledged as collateral in the form of investments in securities,
lease receivables, land, and buildings as of March 31, 2015, were ¥1,482,181
million, ¥18,857 million, ¥252 million and ¥53 million, respectively. The total
amount of liabilities covered by the aforementioned assets was ¥545,030
million as of March 31, 2015.
These amounts included ¥518,628 million of investments in securities
deposited and ¥530,062 million of cash received as collateral under securi-
ties lending transactions secured by cash as of March 31, 2015.
18. Investments in Nonconsolidated Subsidiaries and Affiliates
The total amounts of stocks and investments in nonconsolidated subsidiaries
and affiliates were ¥313,202 million (U.S.$2,791 million), ¥312,009 million
and ¥263,575 million as of March 31, 2017, 2016 and 2015, respectively.
152
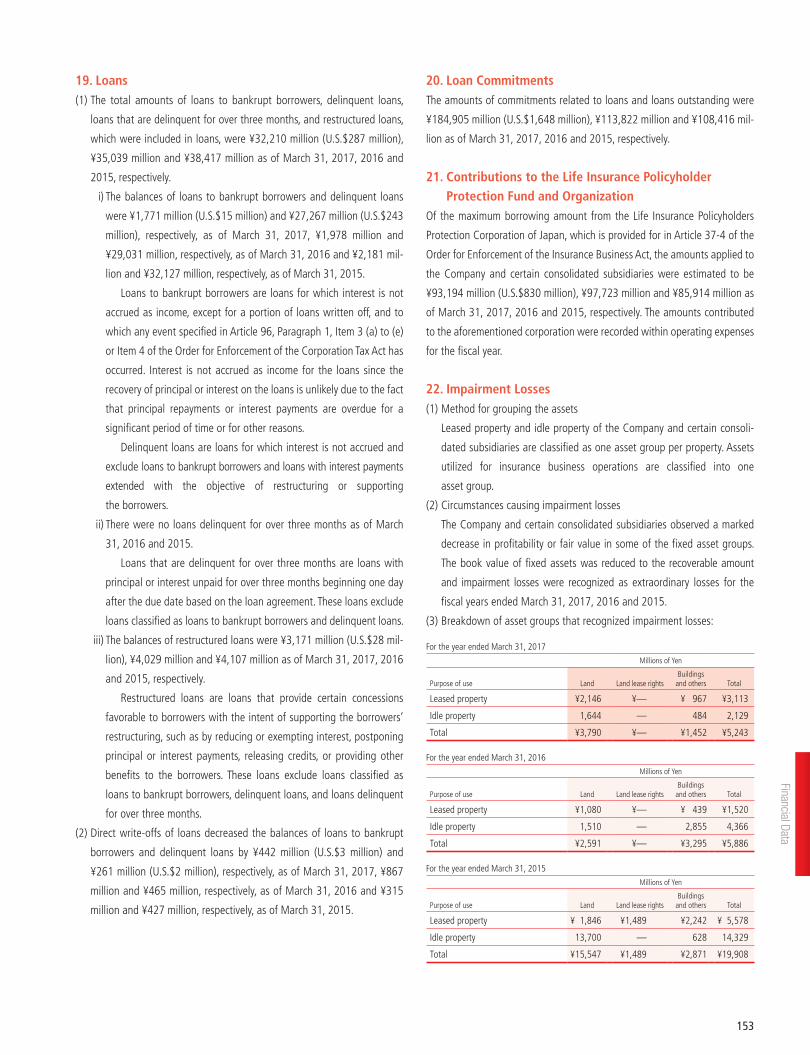
19. Loans(1) The total amounts of loans to bankrupt borrowers, delinquent loans,
loans that are delinquent for over three months, and restructured loans,
which were included in loans, were ¥32,210 million (U.S.$287 million),
¥35,039 million and ¥38,417 million as of March 31, 2017, 2016 and
2015, respectively.
i) The balances of loans to bankrupt borrowers and delinquent loans
were ¥1,771 million (U.S.$15 million) and ¥27,267 million (U.S.$243
million), respectively, as of March 31, 2017, ¥1,978 million and
¥29,031 million, respectively, as of March 31, 2016 and ¥2,181 mil-
lion and ¥32,127 million, respectively, as of March 31, 2015.
Loans to bankrupt borrowers are loans for which interest is not
accrued as income, except for a portion of loans written off, and to
which any event specified in Article 96, Paragraph 1, Item 3 (a) to (e)
or Item 4 of the Order for Enforcement of the Corporation Tax Act has
occurred. Interest is not accrued as income for the loans since the
recovery of principal or interest on the loans is unlikely due to the fact
that principal repayments or interest payments are overdue for a
significant period of time or for other reasons.
Delinquent loans are loans for which interest is not accrued and
exclude loans to bankrupt borrowers and loans with interest payments
extended with the objective of restructuring or supporting
the borrowers.
ii) There were no loans delinquent for over three months as of March
31, 2016 and 2015.
Loans that are delinquent for over three months are loans with
principal or interest unpaid for over three months beginning one day
after the due date based on the loan agreement. These loans exclude
loans classified as loans to bankrupt borrowers and delinquent loans.
iii) The balances of restructured loans were ¥3,171 million (U.S.$28 mil-
lion), ¥4,029 million and ¥4,107 million as of March 31, 2017, 2016
and 2015, respectively.
Restructured loans are loans that provide certain concessions
favorable to borrowers with the intent of supporting the borrowers’
restructuring, such as by reducing or exempting interest, postponing
principal or interest payments, releasing credits, or providing other
benefits to the borrowers. These loans exclude loans classified as
loans to bankrupt borrowers, delinquent loans, and loans delinquent
for over three months.
(2) Direct write-offs of loans decreased the balances of loans to bankrupt
borrowers and delinquent loans by ¥442 million (U.S.$3 million) and
¥261 million (U.S.$2 million), respectively, as of March 31, 2017, ¥867
million and ¥465 million, respectively, as of March 31, 2016 and ¥315
million and ¥427 million, respectively, as of March 31, 2015.
20. Loan CommitmentsThe amounts of commitments related to loans and loans outstanding were
¥184,905 million (U.S.$1,648 million), ¥113,822 million and ¥108,416 mil-
lion as of March 31, 2017, 2016 and 2015, respectively.
21. Contributions to the Life Insurance Policyholder Protection Fund and Organization
Of the maximum borrowing amount from the Life Insurance Policyholders
Protection Corporation of Japan, which is provided for in Article 37-4 of the
Order for Enforcement of the Insurance Business Act, the amounts applied to
the Company and certain consolidated subsidiaries were estimated to be
¥93,194 million (U.S.$830 million), ¥97,723 million and ¥85,914 million as
of March 31, 2017, 2016 and 2015, respectively. The amounts contributed
to the aforementioned corporation were recorded within operating expenses
for the fiscal year.
22. Impairment Losses(1) Method for grouping the assets
Leased property and idle property of the Company and certain consoli-
dated subsidiaries are classified as one asset group per property. Assets
utilized for insurance business operations are classified into one
asset group.
(2) Circumstances causing impairment losses
The Company and certain consolidated subsidiaries observed a marked
decrease in profitability or fair value in some of the fixed asset groups.
The book value of fixed assets was reduced to the recoverable amount
and impairment losses were recognized as extraordinary losses for the
fiscal years ended March 31, 2017, 2016 and 2015.
(3) Breakdown of asset groups that recognized impairment losses:
For the year ended March 31, 2017Millions of Yen
Purpose of use Land Land lease rightsBuildings
and others Total
Leased property ¥2,146 ¥— ¥ 967 ¥3,113
Idle property 1,644 — 484 2,129
Total ¥3,790 ¥— ¥1,452 ¥5,243
For the year ended March 31, 2016Millions of Yen
Purpose of use Land Land lease rightsBuildings
and others Total
Leased property ¥1,080 ¥— ¥ 439 ¥1,520
Idle property 1,510 — 2,855 4,366
Total ¥2,591 ¥— ¥3,295 ¥5,886
For the year ended March 31, 2015Millions of Yen
Purpose of use Land Land lease rightsBuildings
and others Total
Leased property ¥ 1,846 ¥1,489 ¥2,242 ¥ 5,578
Idle property 13,700 — 628 14,329
Total ¥15,547 ¥1,489 ¥2,871 ¥19,908
153
Financial Data
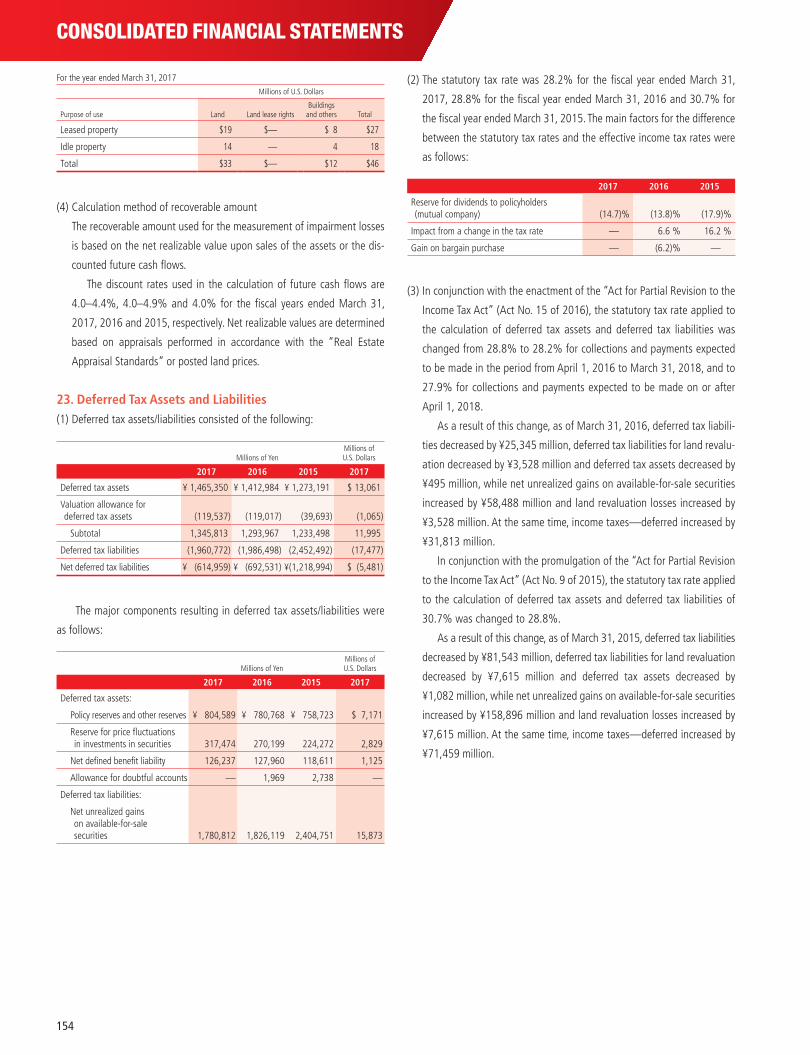
CONSOLIDATED FINANCIAL STATEMENTS
For the year ended March 31, 2017Millions of U.S. Dollars
Purpose of use Land Land lease rightsBuildings
and others Total
Leased property $19 $— $ 8 $27
Idle property 14 — 4 18
Total $33 $— $12 $46
(4) Calculation method of recoverable amount
The recoverable amount used for the measurement of impairment losses
is based on the net realizable value upon sales of the assets or the dis-
counted future cash flows.
The discount rates used in the calculation of future cash flows are
4.0–4.4%, 4.0–4.9% and 4.0% for the fiscal years ended March 31,
2017, 2016 and 2015, respectively. Net realizable values are determined
based on appraisals performed in accordance with the “Real Estate
Appraisal Standards” or posted land prices.
23. Deferred Tax Assets and Liabilities(1) Deferred tax assets/liabilities consisted of the following:
Millions of YenMillions of U.S. Dollars
2017 2016 2015 2017
Deferred tax assets ¥ 1,465,350 ¥ 1,412,984 ¥ 1,273,191 $ 13,061
Valuation allowance for deferred tax assets (119,537 ) (119,017 ) (39,693 ) (1,065 )
Subtotal 1,345,813 1,293,967 1,233,498 11,995
Deferred tax liabilities (1,960,772 ) (1,986,498 ) (2,452,492 ) (17,477 )
Net deferred tax liabilities ¥ (614,959 ) ¥ (692,531 ) ¥(1,218,994 ) $ (5,481 )
The major components resulting in deferred tax assets/liabilities were
as follows:
Millions of YenMillions of U.S. Dollars
2017 2016 2015 2017
Deferred tax assets:
Policy reserves and other reserves ¥ 804,589 ¥ 780,768 ¥ 758,723 $ 7,171
Reserve for price fluctuations in investments in securities 317,474 270,199 224,272 2,829
Net defined benefit liability 126,237 127,960 118,611 1,125
Allowance for doubtful accounts — 1,969 2,738 —
Deferred tax liabilities:
Net unrealized gains on available-for-sale securities 1,780,812 1,826,119 2,404,751 15,873
(2) The statutory tax rate was 28.2% for the fiscal year ended March 31,
2017, 28.8% for the fiscal year ended March 31, 2016 and 30.7% for
the fiscal year ended March 31, 2015. The main factors for the difference
between the statutory tax rates and the effective income tax rates were
as follows:
2017 2016 2015
Reserve for dividends to policyholders (mutual company) (14.7)% (13.8)% (17.9)%
Impact from a change in the tax rate — 6.6 % 16.2 %
Gain on bargain purchase — (6.2)% —
(3) In conjunction with the enactment of the “Act for Partial Revision to the
Income Tax Act” (Act No. 15 of 2016), the statutory tax rate applied to
the calculation of deferred tax assets and deferred tax liabilities was
changed from 28.8% to 28.2% for collections and payments expected
to be made in the period from April 1, 2016 to March 31, 2018, and to
27.9% for collections and payments expected to be made on or after
April 1, 2018.
As a result of this change, as of March 31, 2016, deferred tax liabili-
ties decreased by ¥25,345 million, deferred tax liabilities for land revalu-
ation decreased by ¥3,528 million and deferred tax assets decreased by
¥495 million, while net unrealized gains on available-for-sale securities
increased by ¥58,488 million and land revaluation losses increased by
¥3,528 million. At the same time, income taxes—deferred increased by
¥31,813 million.
In conjunction with the promulgation of the “Act for Partial Revision
to the Income Tax Act” (Act No. 9 of 2015), the statutory tax rate applied
to the calculation of deferred tax assets and deferred tax liabilities of
30.7% was changed to 28.8%.
As a result of this change, as of March 31, 2015, deferred tax liabilities
decreased by ¥81,543 million, deferred tax liabilities for land revaluation
decreased by ¥7,615 million and deferred tax assets decreased by
¥1,082 million, while net unrealized gains on available-for-sale securities
increased by ¥158,896 million and land revaluation losses increased by
¥7,615 million. At the same time, income taxes—deferred increased by
¥71,459 million.
154
24. Other Comprehensive Income (Loss)The components of other comprehensive income (loss) for the fiscal years
ended March 31, 2017, 2016 and 2015, were as follows:
(1) Reclassification adjustments to profit or loss relating to other compre-
hensive income (loss)
For the year ended March 31, 2017Millions of Yen Millions of U.S. Dollars
Net unrealized gains on available-for-sale securities:
Losses arising during the year ¥(111,657 ) $(995 )
Reclassification adjustments to profit or loss (79,897 ) ¥(191,555 ) (712 ) $(1,707 )
Deferred losses on derivatives under hedge accounting:
Gains arising during the year 69,253 617
Reclassification adjustments to profit or loss 12,161 81,414 108 725
Foreign currency translation adjustments:
Gains arising during the year 14,750 131
Reclassification adjustments to profit or loss — 14,750 — 131
Remeasurement of defined benefit plans:
Losses arising during the year (2,012 ) (17 )
Reclassification adjustments to profit or loss 8,588 6,575 76 58
Share of other comprehensive income of associates accounted for under the equity method:
Gains arising during the year 3,198 28
Reclassification adjustments to profit or loss (1,748 ) 1,450 (15 ) 12
Amount before income tax effect (87,363 ) (778 )
Income tax effect 30,829 274
Total other comprehensive loss ¥ (56,533 ) $ (503 )
For the year ended March 31, 2016Millions of Yen
Net unrealized gains on available-for-sale securities:
Losses arising during the year ¥(1,861,999 )
Reclassification adjustments to profit or loss (34,354 ) ¥(1,896,354 )
Deferred losses on derivatives under hedge accounting:
Gains arising during the year 144,191
Reclassification adjustments to profit or loss 8,356 152,548
Foreign currency translation adjustments:
Losses arising during the year (3,385 )
Reclassification adjustments to profit or loss — (3,385 )
Remeasurement of defined benefit plans:
Losses arising during the year (2,560 )
Reclassification adjustments to profit or loss 4,099 1,538
Share of other comprehensive loss of associates accounted for under the equity method:
Losses arising during the year (21,779 )
Reclassification adjustments to profit or loss (784 ) (22,564 )
Amount before income tax effect (1,768,217 )
Income tax effect 553,366
Total other comprehensive loss ¥(1,214,850 )
For the year ended March 31, 2015Millions of Yen
Net unrealized gains on available-for-sale securities:
Gains arising during the year ¥3,939,987
Reclassification adjustments to profit or loss (205,480 ) ¥3,734,506
Deferred losses on derivatives under hedge accounting:
Losses arising during the year (134,408 )
Reclassification adjustments to profit or loss 3,472 (130,935 )
Foreign currency translation adjustments:
Gains arising during the year 17,321
Reclassification adjustments to profit or loss — 17,321
Remeasurement of defined benefit plans:
Losses arising during the year (60,814 )
Reclassification adjustments to profit or loss (10,839 ) (71,654 )
Share of other comprehensive income of associates accounted for under the equity method:
Gains arising during the year 11,917
Reclassification adjustments to profit or loss (686 ) 11,230
Amount before income tax effect 3,560,469
Income tax effect (911,176 )
Total other comprehensive income ¥2,649,292
155
Financial Data
CONSOLIDATED FINANCIAL STATEMENTS
(2) Income tax effect relating to other comprehensive (loss) income
For the year ended March 31, 2017Millions of Yen Millions of U.S. Dollars
Before income
tax effectIncome
tax effect
After income
tax effect
Before income
tax effectIncome
tax effect
After income
tax effect
Net unrealized gains on available-for-sale securities ¥(191,555 ) ¥ 55,429 ¥(136,125 ) $(1,707 ) $ 494 $(1,213 )
Deferred losses on derivatives under hedge accounting 81,414 (22,755 ) 58,659 725 (202 ) 522
Foreign currency translation adjustments 14,750 — 14,750 131 — 131
Remeasurement of defined benefit plans 6,575 (1,844 ) 4,730 58 (16 ) 42
Share of other comprehensive income of associates accounted for under the equity method 1,450 — 1,450 12 — 12
Total other comprehensive loss ¥ (87,363 ) ¥ 30,829 ¥ (56,533 ) $ (778 ) $ 274 $ (503 )
For the year ended March 31, 2016Millions of Yen
Before income
tax effectIncome
tax effect
After income
tax effect
Net unrealized gains on available-for-sale securities ¥(1,896,354 ) ¥596,040 ¥(1,300,313 )
Deferred losses on derivatives under hedge accounting 152,548 (45,409 ) 107,139
Land revaluation losses — 3,528 3,528
Foreign currency translation adjustments (3,385 ) — (3,385 )
Remeasurement of defined benefit plans 1,538 (793 ) 745
Share of other comprehensive loss of associates accounted for under the equity method (22,564 ) — (22,564 )
Total other comprehensive loss ¥(1,768,217 ) ¥553,366 ¥(1,214,850 )
For the year ended March 31, 2015Millions of Yen
Before income
tax effectIncome
tax effect
After income
tax effect
Net unrealized gains on available-for-sale securities ¥3,734,506 ¥(974,010 ) ¥2,760,495
Deferred losses on derivatives under hedge accounting (130,935 ) 34,031 (96,904 )
Land revaluation losses — 7,615 7,615
Foreign currency translation adjustments 17,321 — 17,321
Remeasurement of defined benefit plans (71,654 ) 21,187 (50,466 )
Share of other comprehensive income of associates accounted for under the equity method 11,230 — 11,230
Total other comprehensive income ¥3,560,469 ¥(911,176 ) ¥2,649,292
25. OthersThe following items are disclosed in the nonconsolidated financial state-
ments and not required to be disclosed in the consolidated financial state-
ments by the Japanese Insurance Business Act.
• Net Assets Provided for in the Ordinance for Enforcement of the Insurance
Business Act
• Policy Reserves for Reinsurance Contracts Provided in Accordance with
Article 71, Paragraph 1 of the Ordinance for Enforcement of the Insurance
Business Act
• Investment Income and Expenses
• Provision for Policy Reserves for Ceded Reinsurance
156
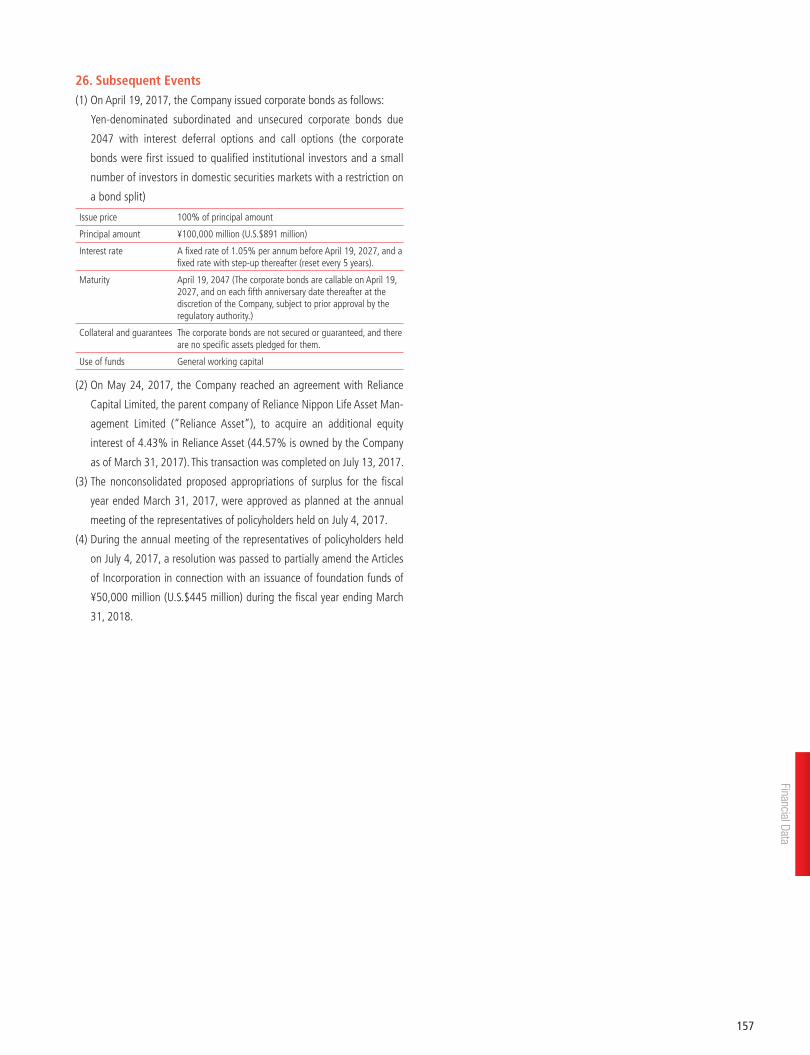
26. Subsequent Events(1) On April 19, 2017, the Company issued corporate bonds as follows:
Yen-denominated subordinated and unsecured corporate bonds due
2047 with interest deferral options and call options (the corporate
bonds were first issued to qualified institutional investors and a small
number of investors in domestic securities markets with a restriction on
a bond split)
Issue price 100% of principal amount
Principal amount ¥100,000 million (U.S.$891 million)
Interest rate A fixed rate of 1.05% per annum before April 19, 2027, and a fixed rate with step-up thereafter (reset every 5 years).
Maturity April 19, 2047 (The corporate bonds are callable on April 19, 2027, and on each fifth anniversary date thereafter at the discretion of the Company, subject to prior approval by the regulatory authority.)
Collateral and guarantees The corporate bonds are not secured or guaranteed, and there are no specific assets pledged for them.
Use of funds General working capital
(2) On May 24, 2017, the Company reached an agreement with Reliance
Capital Limited, the parent company of Reliance Nippon Life Asset Man-
agement Limited (“Reliance Asset”), to acquire an additional equity
interest of 4.43% in Reliance Asset (44.57% is owned by the Company
as of March 31, 2017). This transaction was completed on July 13, 2017.
(3) The nonconsolidated proposed appropriations of surplus for the fiscal
year ended March 31, 2017, were approved as planned at the annual
meeting of the representatives of policyholders held on July 4, 2017.
(4) During the annual meeting of the representatives of policyholders held
on July 4, 2017, a resolution was passed to partially amend the Articles
of Incorporation in connection with an issuance of foundation funds of
¥50,000 million (U.S.$445 million) during the fiscal year ending March
31, 2018.
157
Financial Data
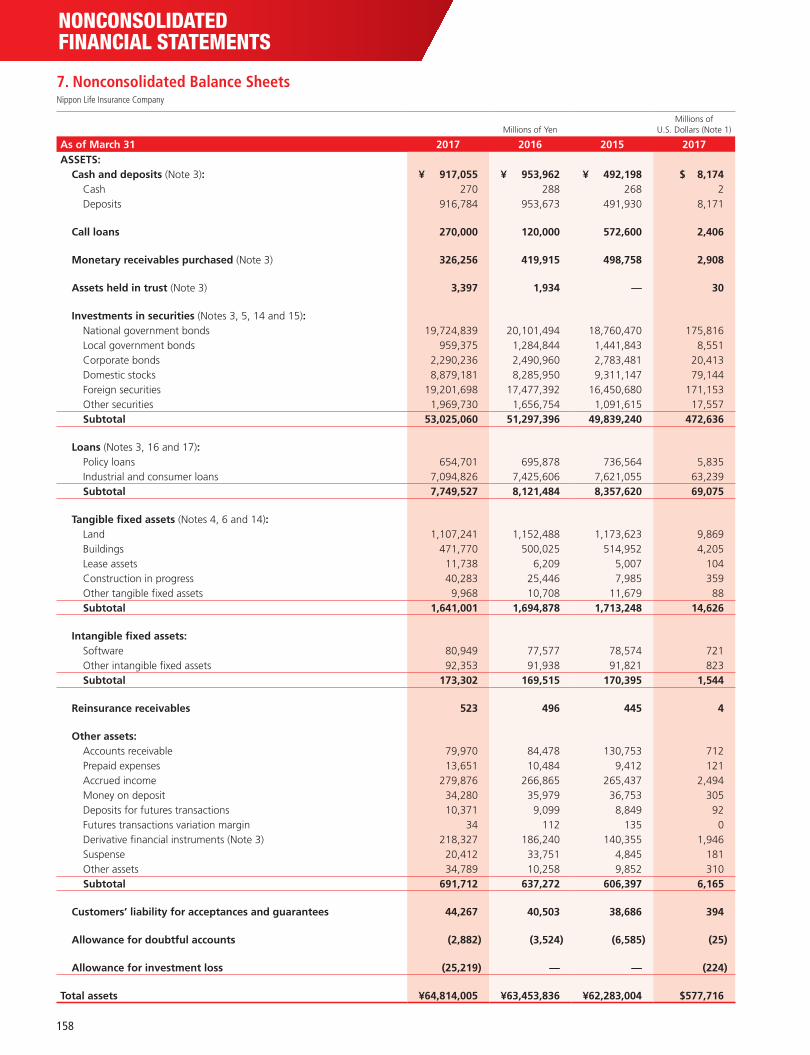
NONCONSOLIDATED FINANCIAL STATEMENTS
NONCONSOLIDATED FINANCIAL STATEMENTS
7. Nonconsolidated Balance SheetsNippon Life Insurance Company
Millions of YenMillions of
U.S. Dollars (Note 1)
As of March 31 2017 2016 2015 2017ASSETS:
Cash and deposits (Note 3): ¥ 917,055 ¥ 953,962 ¥ 492,198 $ 8,174Cash 270 288 268 2Deposits 916,784 953,673 491,930 8,171
Call loans 270,000 120,000 572,600 2,406
Monetary receivables purchased (Note 3) 326,256 419,915 498,758 2,908
Assets held in trust (Note 3) 3,397 1,934 — 30
Investments in securities (Notes 3, 5, 14 and 15):National government bonds 19,724,839 20,101,494 18,760,470 175,816Local government bonds 959,375 1,284,844 1,441,843 8,551Corporate bonds 2,290,236 2,490,960 2,783,481 20,413Domestic stocks 8,879,181 8,285,950 9,311,147 79,144Foreign securities 19,201,698 17,477,392 16,450,680 171,153Other securities 1,969,730 1,656,754 1,091,615 17,557Subtotal 53,025,060 51,297,396 49,839,240 472,636
Loans (Notes 3, 16 and 17):Policy loans 654,701 695,878 736,564 5,835Industrial and consumer loans 7,094,826 7,425,606 7,621,055 63,239Subtotal 7,749,527 8,121,484 8,357,620 69,075
Tangible fixed assets (Notes 4, 6 and 14):Land 1,107,241 1,152,488 1,173,623 9,869Buildings 471,770 500,025 514,952 4,205Lease assets 11,738 6,209 5,007 104Construction in progress 40,283 25,446 7,985 359Other tangible fixed assets 9,968 10,708 11,679 88Subtotal 1,641,001 1,694,878 1,713,248 14,626
Intangible fixed assets:Software 80,949 77,577 78,574 721Other intangible fixed assets 92,353 91,938 91,821 823Subtotal 173,302 169,515 170,395 1,544
Reinsurance receivables 523 496 445 4
Other assets:Accounts receivable 79,970 84,478 130,753 712Prepaid expenses 13,651 10,484 9,412 121Accrued income 279,876 266,865 265,437 2,494Money on deposit 34,280 35,979 36,753 305Deposits for futures transactions 10,371 9,099 8,849 92Futures transactions variation margin 34 112 135 0Derivative financial instruments (Note 3) 218,327 186,240 140,355 1,946Suspense 20,412 33,751 4,845 181Other assets 34,789 10,258 9,852 310Subtotal 691,712 637,272 606,397 6,165
Customers’ liability for acceptances and guarantees 44,267 40,503 38,686 394
Allowance for doubtful accounts (2,882 ) (3,524 ) (6,585 ) (25 )
Allowance for investment loss (25,219 ) — — (224 )
Total assets ¥64,814,005 ¥63,453,836 ¥62,283,004 $577,716
158
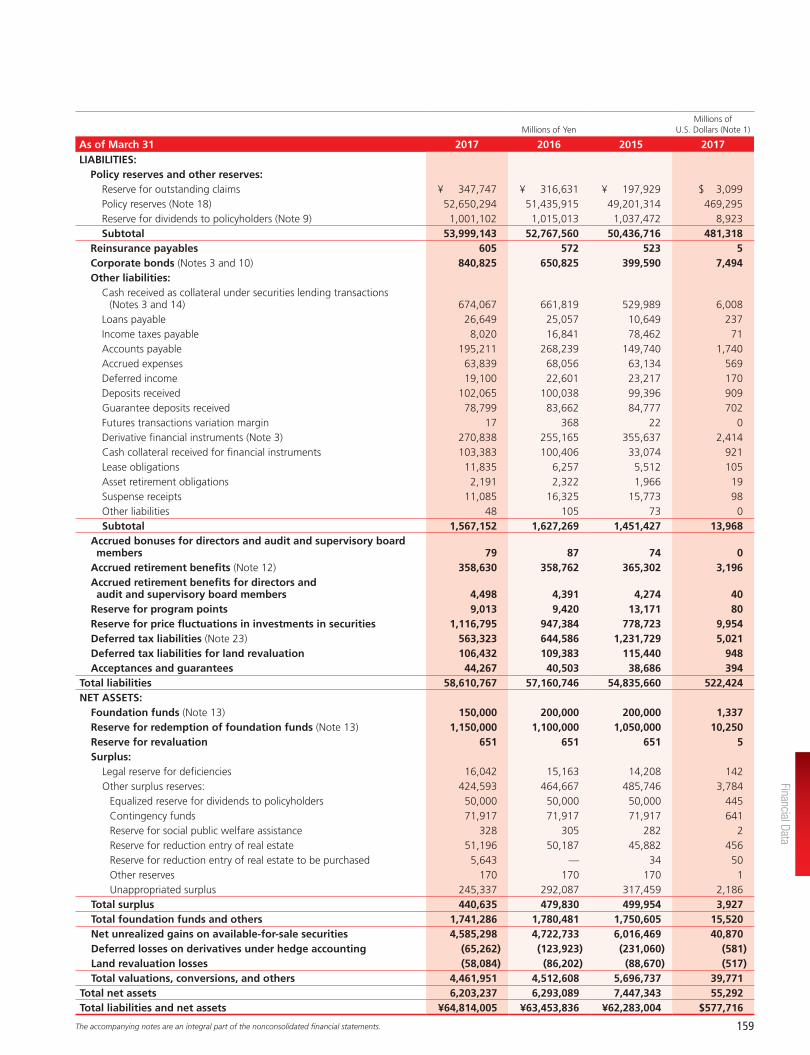
Millions of YenMillions of
U.S. Dollars (Note 1)
As of March 31 2017 2016 2015 2017LIABILITIES:
Policy reserves and other reserves:Reserve for outstanding claims ¥ 347,747 ¥ 316,631 ¥ 197,929 $ 3,099Policy reserves (Note 18) 52,650,294 51,435,915 49,201,314 469,295Reserve for dividends to policyholders (Note 9) 1,001,102 1,015,013 1,037,472 8,923Subtotal 53,999,143 52,767,560 50,436,716 481,318
Reinsurance payables 605 572 523 5Corporate bonds (Notes 3 and 10) 840,825 650,825 399,590 7,494Other liabilities:
Cash received as collateral under securities lending transactions (Notes 3 and 14) 674,067 661,819 529,989 6,008
Loans payable 26,649 25,057 10,649 237Income taxes payable 8,020 16,841 78,462 71Accounts payable 195,211 268,239 149,740 1,740Accrued expenses 63,839 68,056 63,134 569Deferred income 19,100 22,601 23,217 170Deposits received 102,065 100,038 99,396 909Guarantee deposits received 78,799 83,662 84,777 702Futures transactions variation margin 17 368 22 0Derivative financial instruments (Note 3) 270,838 255,165 355,637 2,414Cash collateral received for financial instruments 103,383 100,406 33,074 921Lease obligations 11,835 6,257 5,512 105Asset retirement obligations 2,191 2,322 1,966 19Suspense receipts 11,085 16,325 15,773 98Other liabilities 48 105 73 0Subtotal 1,567,152 1,627,269 1,451,427 13,968
Accrued bonuses for directors and audit and supervisory board members 79 87 74 0
Accrued retirement benefits (Note 12) 358,630 358,762 365,302 3,196Accrued retirement benefits for directors and audit and supervisory board members 4,498 4,391 4,274 40
Reserve for program points 9,013 9,420 13,171 80Reserve for price fluctuations in investments in securities 1,116,795 947,384 778,723 9,954Deferred tax liabilities (Note 23) 563,323 644,586 1,231,729 5,021Deferred tax liabilities for land revaluation 106,432 109,383 115,440 948Acceptances and guarantees 44,267 40,503 38,686 394
Total liabilities 58,610,767 57,160,746 54,835,660 522,424NET ASSETS:
Foundation funds (Note 13) 150,000 200,000 200,000 1,337Reserve for redemption of foundation funds (Note 13) 1,150,000 1,100,000 1,050,000 10,250Reserve for revaluation 651 651 651 5Surplus:
Legal reserve for deficiencies 16,042 15,163 14,208 142Other surplus reserves: 424,593 464,667 485,746 3,784 Equalized reserve for dividends to policyholders 50,000 50,000 50,000 445 Contingency funds 71,917 71,917 71,917 641 Reserve for social public welfare assistance 328 305 282 2 Reserve for reduction entry of real estate 51,196 50,187 45,882 456 Reserve for reduction entry of real estate to be purchased 5,643 — 34 50 Other reserves 170 170 170 1 Unappropriated surplus 245,337 292,087 317,459 2,186
Total surplus 440,635 479,830 499,954 3,927Total foundation funds and others 1,741,286 1,780,481 1,750,605 15,520Net unrealized gains on available-for-sale securities 4,585,298 4,722,733 6,016,469 40,870 Deferred losses on derivatives under hedge accounting (65,262 ) (123,923 ) (231,060 ) (581 )Land revaluation losses (58,084 ) (86,202 ) (88,670 ) (517 )Total valuations, conversions, and others 4,461,951 4,512,608 5,696,737 39,771
Total net assets 6,203,237 6,293,089 7,447,343 55,292Total liabilities and net assets ¥64,814,005 ¥63,453,836 ¥62,283,004 $577,716
The accompanying notes are an integral part of the nonconsolidated financial statements.
Financial Data
159
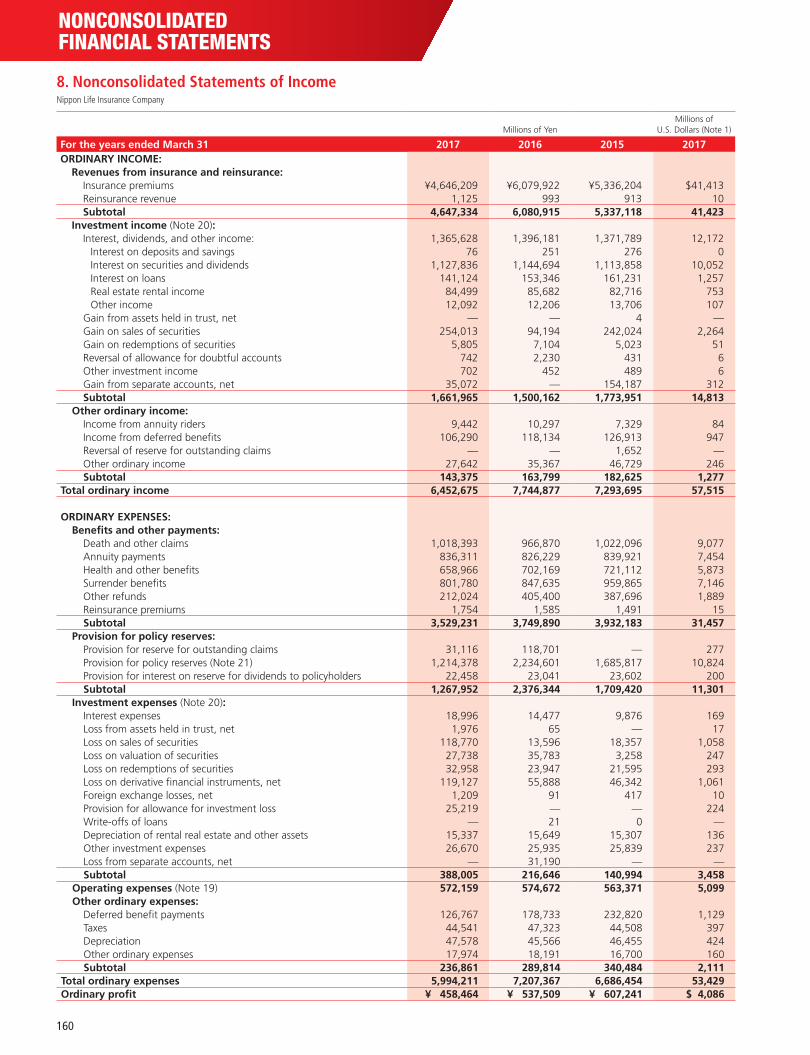
NONCONSOLIDATED FINANCIAL STATEMENTS
8. Nonconsolidated Statements of IncomeNippon Life Insurance Company
Millions of YenMillions of
U.S. Dollars (Note 1)
For the years ended March 31 2017 2016 2015 2017ORDINARY INCOME:
Revenues from insurance and reinsurance:Insurance premiums ¥4,646,209 ¥6,079,922 ¥5,336,204 $41,413Reinsurance revenue 1,125 993 913 10Subtotal 4,647,334 6,080,915 5,337,118 41,423
Investment income (Note 20):Interest, dividends, and other income: 1,365,628 1,396,181 1,371,789 12,172 Interest on deposits and savings 76 251 276 0 Interest on securities and dividends 1,127,836 1,144,694 1,113,858 10,052 Interest on loans 141,124 153,346 161,231 1,257 Real estate rental income 84,499 85,682 82,716 753 Other income 12,092 12,206 13,706 107Gain from assets held in trust, net — — 4 —Gain on sales of securities 254,013 94,194 242,024 2,264Gain on redemptions of securities 5,805 7,104 5,023 51Reversal of allowance for doubtful accounts 742 2,230 431 6Other investment income 702 452 489 6Gain from separate accounts, net 35,072 — 154,187 312Subtotal 1,661,965 1,500,162 1,773,951 14,813
Other ordinary income:Income from annuity riders 9,442 10,297 7,329 84Income from deferred benefits 106,290 118,134 126,913 947Reversal of reserve for outstanding claims — — 1,652 —Other ordinary income 27,642 35,367 46,729 246Subtotal 143,375 163,799 182,625 1,277
Total ordinary income 6,452,675 7,744,877 7,293,695 57,515
ORDINARY EXPENSES:Benefits and other payments:
Death and other claims 1,018,393 966,870 1,022,096 9,077Annuity payments 836,311 826,229 839,921 7,454Health and other benefits 658,966 702,169 721,112 5,873Surrender benefits 801,780 847,635 959,865 7,146Other refunds 212,024 405,400 387,696 1,889Reinsurance premiums 1,754 1,585 1,491 15Subtotal 3,529,231 3,749,890 3,932,183 31,457
Provision for policy reserves:Provision for reserve for outstanding claims 31,116 118,701 — 277Provision for policy reserves (Note 21) 1,214,378 2,234,601 1,685,817 10,824Provision for interest on reserve for dividends to policyholders 22,458 23,041 23,602 200Subtotal 1,267,952 2,376,344 1,709,420 11,301
Investment expenses (Note 20):Interest expenses 18,996 14,477 9,876 169Loss from assets held in trust, net 1,976 65 — 17Loss on sales of securities 118,770 13,596 18,357 1,058Loss on valuation of securities 27,738 35,783 3,258 247Loss on redemptions of securities 32,958 23,947 21,595 293Loss on derivative financial instruments, net 119,127 55,888 46,342 1,061Foreign exchange losses, net 1,209 91 417 10Provision for allowance for investment loss 25,219 — — 224Write-offs of loans — 21 0 —Depreciation of rental real estate and other assets 15,337 15,649 15,307 136Other investment expenses 26,670 25,935 25,839 237Loss from separate accounts, net — 31,190 — —Subtotal 388,005 216,646 140,994 3,458
Operating expenses (Note 19) 572,159 574,672 563,371 5,099Other ordinary expenses:
Deferred benefit payments 126,767 178,733 232,820 1,129Taxes 44,541 47,323 44,508 397Depreciation 47,578 45,566 46,455 424Other ordinary expenses 17,974 18,191 16,700 160Subtotal 236,861 289,814 340,484 2,111
Total ordinary expenses 5,994,211 7,207,367 6,686,454 53,429Ordinary profit ¥ 458,464 ¥ 537,509 ¥ 607,241 $ 4,086
160
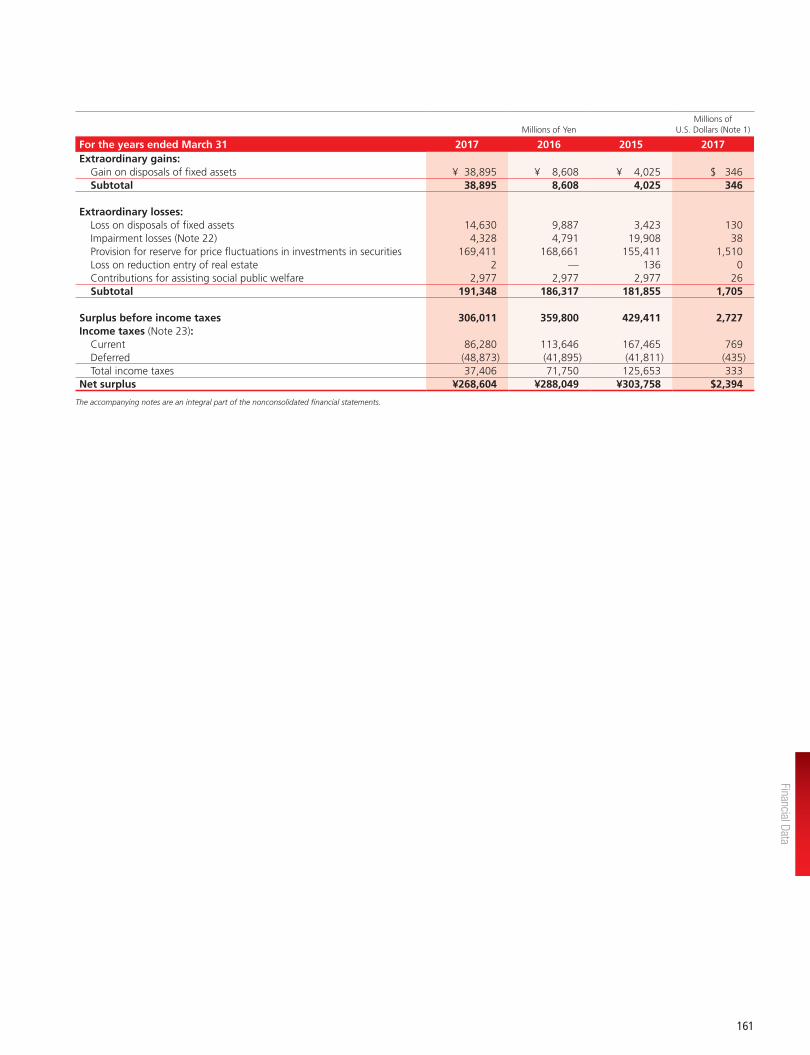
Millions of YenMillions of
U.S. Dollars (Note 1)
For the years ended March 31 2017 2016 2015 2017Extraordinary gains:
Gain on disposals of fixed assets ¥ 38,895 ¥ 8,608 ¥ 4,025 $ 346Subtotal 38,895 8,608 4,025 346
Extraordinary losses:Loss on disposals of fixed assets 14,630 9,887 3,423 130Impairment losses (Note 22) 4,328 4,791 19,908 38Provision for reserve for price fluctuations in investments in securities 169,411 168,661 155,411 1,510Loss on reduction entry of real estate 2 — 136 0Contributions for assisting social public welfare 2,977 2,977 2,977 26Subtotal 191,348 186,317 181,855 1,705
Surplus before income taxes 306,011 359,800 429,411 2,727Income taxes (Note 23):
Current 86,280 113,646 167,465 769Deferred (48,873 ) (41,895 ) (41,811 ) (435 )Total income taxes 37,406 71,750 125,653 333
Net surplus ¥268,604 ¥288,049 ¥303,758 $2,394
The accompanying notes are an integral part of the nonconsolidated financial statements.
Financial Data
161
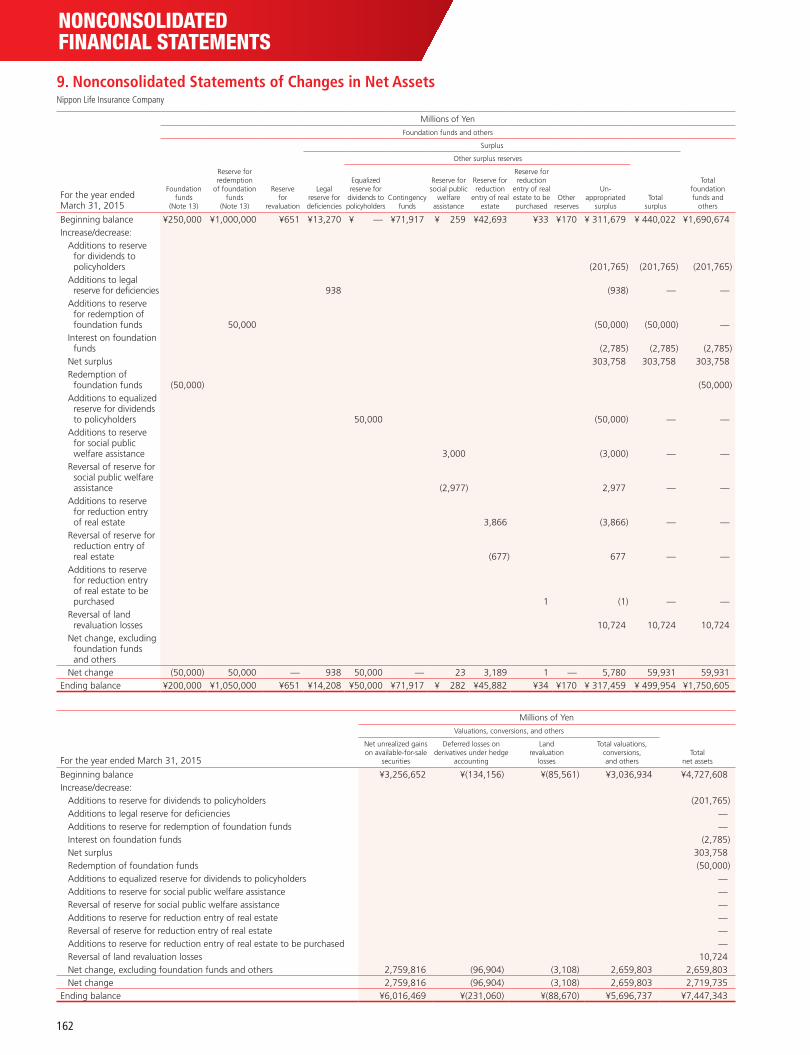
NONCONSOLIDATED FINANCIAL STATEMENTS
9. Nonconsolidated Statements of Changes in Net AssetsNippon Life Insurance Company
Millions of Yen
Foundation funds and others
Foundation funds
(Note 13)
Reserve for redemption
of foundation funds
(Note 13)
Reserve for
revaluation
Surplus
Total foundation funds and
others
Legal reserve for deficiencies
Other surplus reserves
Total surplus
For the year ended March 31, 2015
Equalized reserve for
dividends to policyholders
Contingency funds
Reserve for social public
welfare assistance
Reserve for reduction
entry of real estate
Reserve for reduction
entry of real estate to be purchased
Other reserves
Un- appropriated
surplus
Beginning balance ¥250,000 ¥1,000,000 ¥651 ¥13,270 ¥ — ¥71,917 ¥ 259 ¥42,693 ¥33 ¥170 ¥ 311,679 ¥ 440,022 ¥1,690,674Increase/decrease:
Additions to reserve for dividends to policyholders (201,765 ) (201,765 ) (201,765 )
Additions to legal reserve for deficiencies 938 (938 ) — —
Additions to reserve for redemption of foundation funds 50,000 (50,000 ) (50,000 ) —
Interest on foundation funds (2,785 ) (2,785 ) (2,785 )
Net surplus 303,758 303,758 303,758Redemption of
foundation funds (50,000 ) (50,000 )Additions to equalized
reserve for dividends to policyholders 50,000 (50,000 ) — —
Additions to reserve for social public welfare assistance 3,000 (3,000 ) — —
Reversal of reserve for social public welfare assistance (2,977 ) 2,977 — —
Additions to reserve for reduction entry of real estate 3,866 (3,866 ) — —
Reversal of reserve for reduction entry of real estate (677 ) 677 — —
Additions to reserve for reduction entry of real estate to be purchased 1 (1 ) — —
Reversal of land revaluation losses 10,724 10,724 10,724
Net change, excluding foundation funds and others
Net change (50,000 ) 50,000 — 938 50,000 — 23 3,189 1 — 5,780 59,931 59,931Ending balance ¥200,000 ¥1,050,000 ¥651 ¥14,208 ¥50,000 ¥71,917 ¥ 282 ¥45,882 ¥34 ¥170 ¥ 317,459 ¥ 499,954 ¥1,750,605
Millions of Yen
Valuations, conversions, and others
Total net assetsFor the year ended March 31, 2015
Net unrealized gains on available-for-sale
securities
Deferred losses on derivatives under hedge
accounting
Land revaluation
losses
Total valuations, conversions, and others
Beginning balance ¥3,256,652 ¥(134,156 ) ¥(85,561 ) ¥3,036,934 ¥4,727,608Increase/decrease:
Additions to reserve for dividends to policyholders (201,765 )Additions to legal reserve for deficiencies —Additions to reserve for redemption of foundation funds —Interest on foundation funds (2,785 )Net surplus 303,758Redemption of foundation funds (50,000 )Additions to equalized reserve for dividends to policyholders —Additions to reserve for social public welfare assistance —Reversal of reserve for social public welfare assistance —Additions to reserve for reduction entry of real estate —Reversal of reserve for reduction entry of real estate —Additions to reserve for reduction entry of real estate to be purchased —Reversal of land revaluation losses 10,724Net change, excluding foundation funds and others 2,759,816 (96,904 ) (3,108 ) 2,659,803 2,659,803Net change 2,759,816 (96,904 ) (3,108 ) 2,659,803 2,719,735
Ending balance ¥6,016,469 ¥(231,060 ) ¥(88,670 ) ¥5,696,737 ¥7,447,343
162
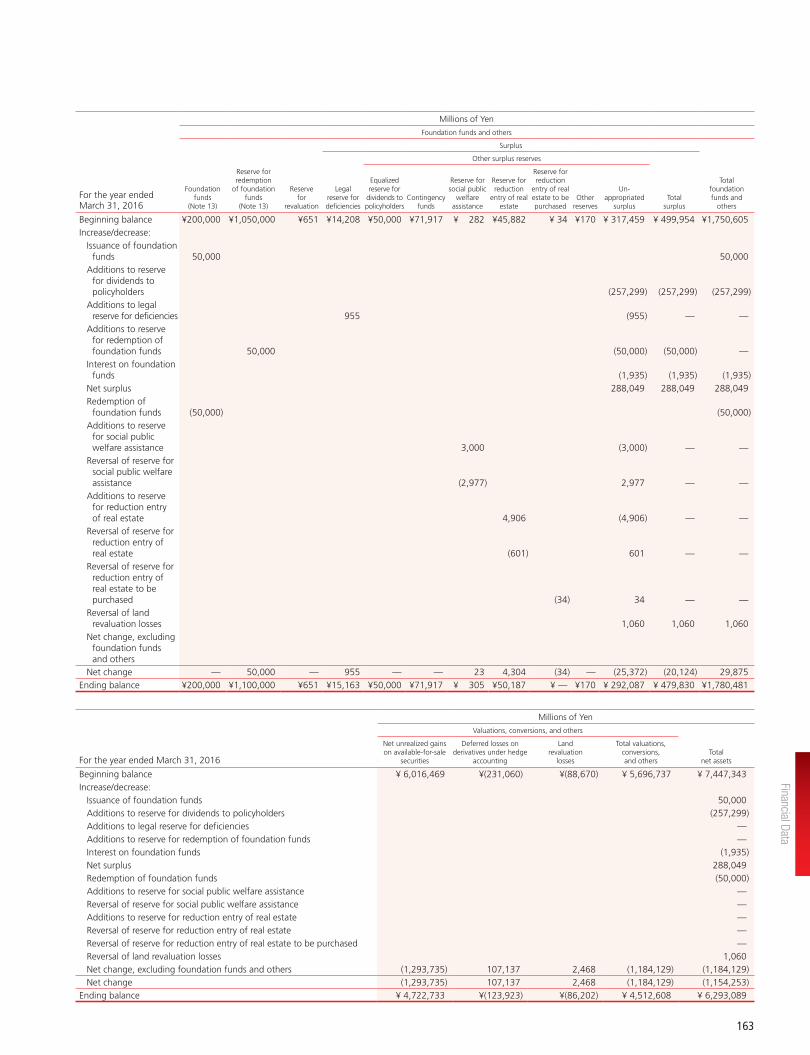
Millions of Yen
Foundation funds and others
Foundation funds
(Note 13)
Reserve for redemption
of foundation funds
(Note 13)
Reserve for
revaluation
Surplus
Total foundation funds and
others
Legal reserve for deficiencies
Other surplus reserves
Total surplus
For the year ended March 31, 2016
Equalized reserve for
dividends to policyholders
Contingency funds
Reserve for social public
welfare assistance
Reserve for reduction
entry of real estate
Reserve for reduction
entry of real estate to be purchased
Other reserves
Un- appropriated
surplus
Beginning balance ¥200,000 ¥1,050,000 ¥651 ¥14,208 ¥50,000 ¥71,917 ¥ 282 ¥45,882 ¥ 34 ¥170 ¥ 317,459 ¥ 499,954 ¥1,750,605Increase/decrease:
Issuance of foundation funds 50,000 50,000
Additions to reserve for dividends to policyholders (257,299 ) (257,299 ) (257,299 )
Additions to legal reserve for deficiencies 955 (955 ) — —
Additions to reserve for redemption of foundation funds 50,000 (50,000 ) (50,000 ) —
Interest on foundation funds (1,935 ) (1,935 ) (1,935 )
Net surplus 288,049 288,049 288,049Redemption of
foundation funds (50,000 ) (50,000 )Additions to reserve
for social public welfare assistance 3,000 (3,000 ) — —
Reversal of reserve for social public welfare assistance (2,977 ) 2,977 — —
Additions to reserve for reduction entry of real estate 4,906 (4,906 ) — —
Reversal of reserve for reduction entry of real estate (601 ) 601 — —
Reversal of reserve for reduction entry of real estate to be purchased (34 ) 34 — —
Reversal of land revaluation losses 1,060 1,060 1,060
Net change, excluding foundation funds and others
Net change — 50,000 — 955 — — 23 4,304 (34 ) — (25,372 ) (20,124 ) 29,875Ending balance ¥200,000 ¥1,100,000 ¥651 ¥15,163 ¥50,000 ¥71,917 ¥ 305 ¥50,187 ¥ — ¥170 ¥ 292,087 ¥ 479,830 ¥1,780,481
Millions of Yen
Valuations, conversions, and others
Total net assetsFor the year ended March 31, 2016
Net unrealized gains on available-for-sale
securities
Deferred losses on derivatives under hedge
accounting
Land revaluation
losses
Total valuations, conversions, and others
Beginning balance ¥ 6,016,469 ¥(231,060 ) ¥(88,670 ) ¥ 5,696,737 ¥ 7,447,343Increase/decrease:
Issuance of foundation funds 50,000Additions to reserve for dividends to policyholders (257,299 )Additions to legal reserve for deficiencies —Additions to reserve for redemption of foundation funds —Interest on foundation funds (1,935 )Net surplus 288,049Redemption of foundation funds (50,000 )Additions to reserve for social public welfare assistance —Reversal of reserve for social public welfare assistance —Additions to reserve for reduction entry of real estate —Reversal of reserve for reduction entry of real estate —Reversal of reserve for reduction entry of real estate to be purchased —Reversal of land revaluation losses 1,060Net change, excluding foundation funds and others (1,293,735 ) 107,137 2,468 (1,184,129 ) (1,184,129 )Net change (1,293,735 ) 107,137 2,468 (1,184,129 ) (1,154,253 )
Ending balance ¥ 4,722,733 ¥(123,923 ) ¥(86,202 ) ¥ 4,512,608 ¥ 6,293,089
Financial Data
163

NONCONSOLIDATED FINANCIAL STATEMENTS
Millions of Yen
Foundation funds and others
Foundation funds
(Note 13)
Reserve for redemption
of foundation funds
(Note 13)
Reserve for
revaluation
Surplus
Total foundation funds and
others
Legal reserve for deficiencies
Other surplus reserves
Total surplus
For the year ended March 31, 2017
Equalized reserve for
dividends to policyholders
Contingency funds
Reserve for social public
welfare assistance
Reserve for reduction
entry of real estate
Reserve for reduction
entry of real estate to be purchased
Other reserves
Un- appropriated
surplus
Beginning balance ¥200,000 ¥1,100,000 ¥651 ¥15,163 ¥50,000 ¥71,917 ¥ 305 ¥50,187 ¥ — ¥170 ¥ 292,087 ¥ 479,830 ¥1,780,481Cumulative effect of
change in accounting policies 1,873 1,873 1,873
Beginning balance after reflecting accounting policy changes 200,000 1,100,000 651 15,163 50,000 71,917 305 50,187 — 170 293,960 481,703 1,782,355
Increase/decrease:Additions to reserve
for dividends to policyholders (229,857 ) (229,857 ) (229,857 )
Additions to legal reserve for deficiencies 879 (879 ) — —
Additions to reserve for redemption of foundation funds 50,000 (50,000 ) (50,000 ) —
Interest on foundation funds (1,698 ) (1,698 ) (1,698 )
Net surplus 268,604 268,604 268,604Redemption of
foundation funds (50,000 ) (50,000 )Additions to reserve
for social public welfare assistance 3,000 (3,000 ) — —
Reversal of reserve for social public welfare assistance (2,977 ) 2,977 — —
Additions to reserve for reduction entry of real estate 1,614 (1,614 ) — —
Reversal of reserve for reduction entry of real estate (606 ) 606 — —
Additions to reserve for reduction entry of real estate to be purchased 5,643 (5,643 ) — —
Reversal of land revaluation losses (28,117 ) (28,117 ) (28,117 )
Net change, excluding foundation funds and others
Net change (50,000 ) 50,000 — 879 — — 23 1,008 5,643 — (48,623 ) (41,068 ) (41,068 )Ending balance ¥150,000 ¥1,150,000 ¥651 ¥16,042 ¥50,000 ¥71,917 ¥ 328 ¥51,196 ¥5,643 ¥170 ¥ 245,337 ¥ 440,635 ¥1,741,286
164
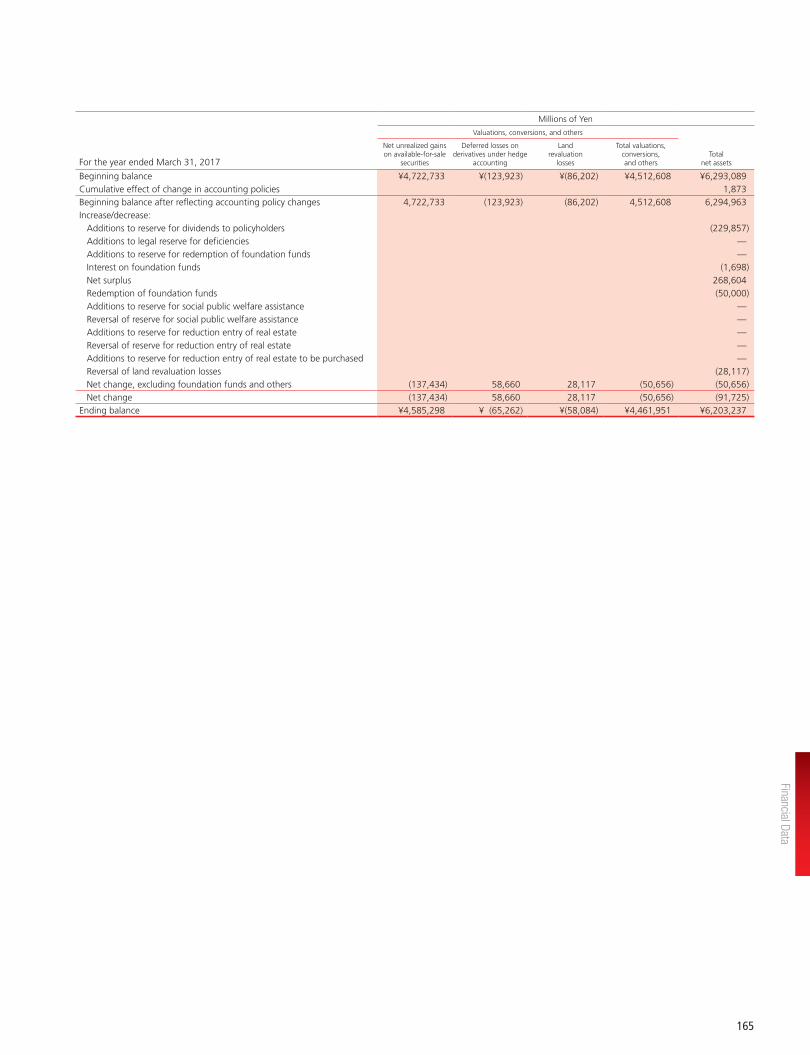
Millions of Yen
Valuations, conversions, and others
Total net assetsFor the year ended March 31, 2017
Net unrealized gains on available-for-sale
securities
Deferred losses on derivatives under hedge
accounting
Land revaluation
losses
Total valuations, conversions, and others
Beginning balance ¥4,722,733 ¥(123,923 ) ¥(86,202 ) ¥4,512,608 ¥6,293,089Cumulative effect of change in accounting policies 1,873Beginning balance after reflecting accounting policy changes 4,722,733 (123,923 ) (86,202 ) 4,512,608 6,294,963Increase/decrease:
Additions to reserve for dividends to policyholders (229,857 )Additions to legal reserve for deficiencies —Additions to reserve for redemption of foundation funds —Interest on foundation funds (1,698 )Net surplus 268,604Redemption of foundation funds (50,000 )Additions to reserve for social public welfare assistance —Reversal of reserve for social public welfare assistance —Additions to reserve for reduction entry of real estate —Reversal of reserve for reduction entry of real estate —Additions to reserve for reduction entry of real estate to be purchased —Reversal of land revaluation losses (28,117 )Net change, excluding foundation funds and others (137,434 ) 58,660 28,117 (50,656 ) (50,656 )Net change (137,434 ) 58,660 28,117 (50,656 ) (91,725 )
Ending balance ¥4,585,298 ¥ (65,262 ) ¥(58,084 ) ¥4,461,951 ¥6,203,237
Financial Data
165
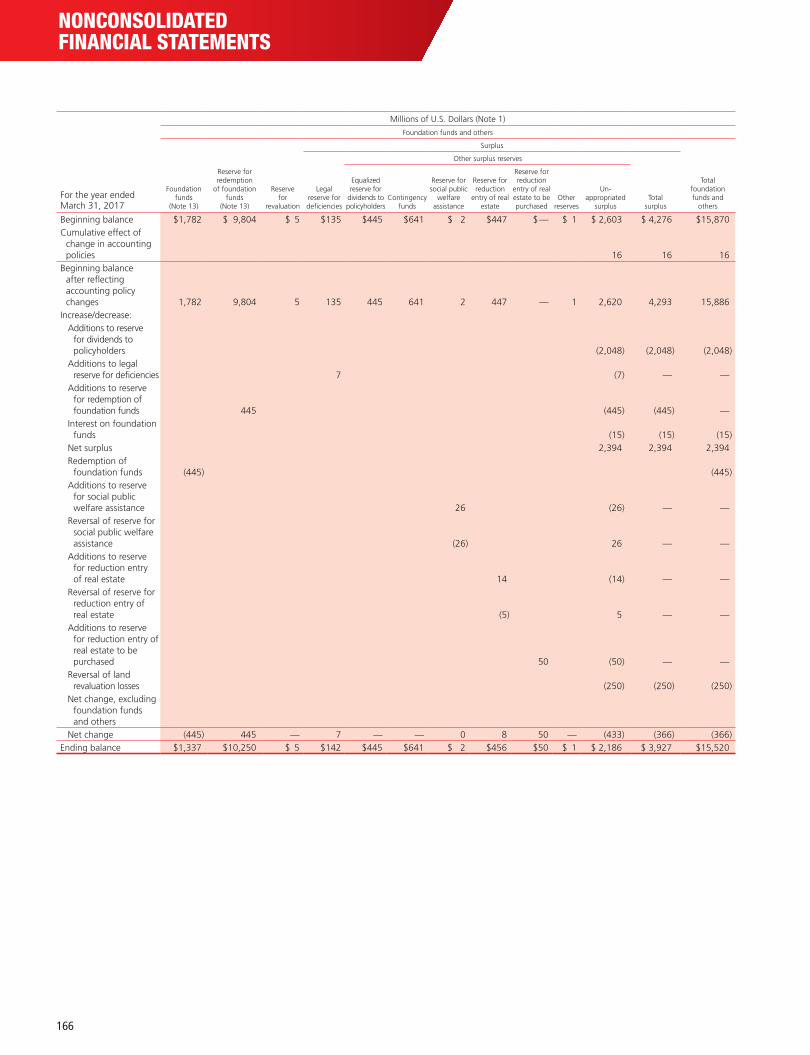
NONCONSOLIDATED FINANCIAL STATEMENTS
Millions of U.S. Dollars (Note 1)
Foundation funds and others
Foundation funds
(Note 13)
Reserve for redemption
of foundation funds
(Note 13)
Reserve for
revaluation
Surplus
Total foundation funds and
others
Legal reserve for deficiencies
Other surplus reserves
Total surplus
For the year ended March 31, 2017
Equalized reserve for
dividends to policyholders
Contingency funds
Reserve for social public
welfare assistance
Reserve for reduction
entry of real estate
Reserve for reduction
entry of real estate to be purchased
Other reserves
Un- appropriated
surplus
Beginning balance $1,782 $ 9,804 $ 5 $135 $445 $641 $ 2 $447 $ — $ 1 $ 2,603 $ 4,276 $15,870Cumulative effect of
change in accounting policies 16 16 16
Beginning balance after reflecting accounting policy changes 1,782 9,804 5 135 445 641 2 447 — 1 2,620 4,293 15,886
Increase/decrease:Additions to reserve
for dividends to policyholders (2,048 ) (2,048 ) (2,048 )
Additions to legal reserve for deficiencies 7 (7 ) — —
Additions to reserve for redemption of foundation funds 445 (445 ) (445 ) —
Interest on foundation funds (15 ) (15 ) (15 )
Net surplus 2,394 2,394 2,394Redemption of
foundation funds (445 ) (445 )Additions to reserve
for social public welfare assistance 26 (26 ) — —
Reversal of reserve for social public welfare assistance (26 ) 26 — —
Additions to reserve for reduction entry of real estate 14 (14 ) — —
Reversal of reserve for reduction entry of real estate (5 ) 5 — —
Additions to reserve for reduction entry of real estate to be purchased 50 (50 ) — —
Reversal of land revaluation losses (250 ) (250 ) (250 )
Net change, excluding foundation funds and others
Net change (445 ) 445 — 7 — — 0 8 50 — (433 ) (366 ) (366 )Ending balance $1,337 $10,250 $ 5 $142 $445 $641 $ 2 $456 $50 $ 1 $ 2,186 $ 3,927 $15,520
166
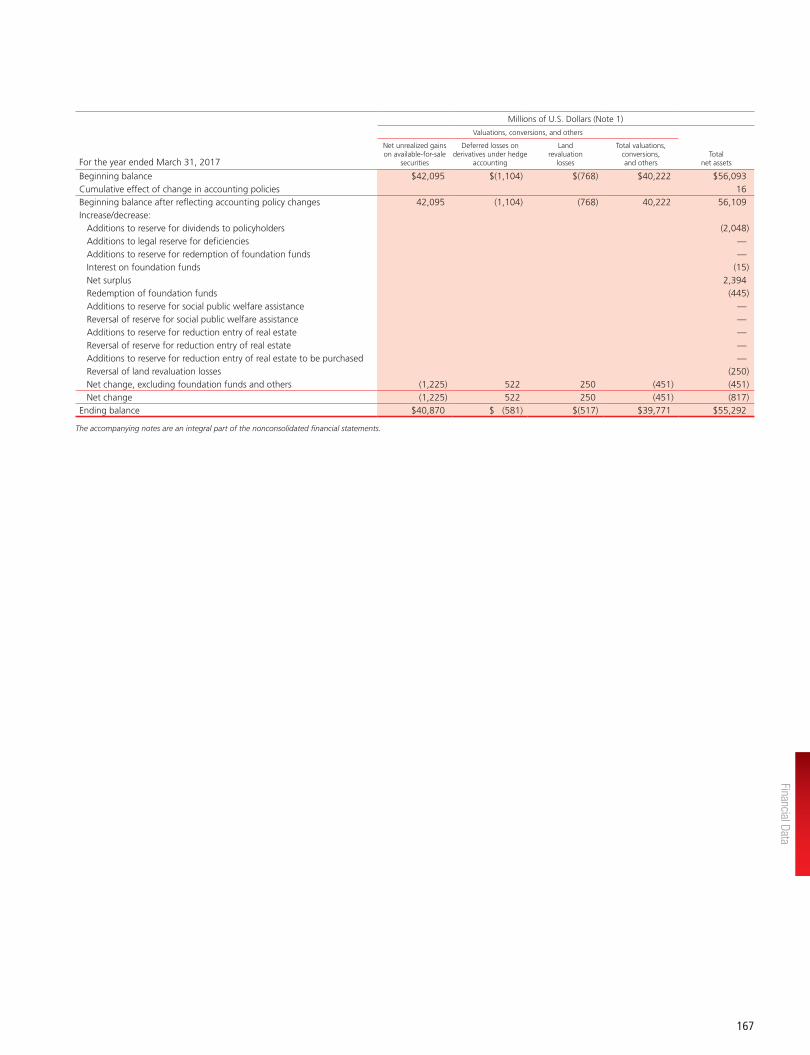
Millions of U.S. Dollars (Note 1)
Valuations, conversions, and others
Total net assetsFor the year ended March 31, 2017
Net unrealized gains on available-for-sale
securities
Deferred losses on derivatives under hedge
accounting
Land revaluation
losses
Total valuations, conversions, and others
Beginning balance $42,095 $(1,104 ) $(768 ) $40,222 $56,093Cumulative effect of change in accounting policies 16Beginning balance after reflecting accounting policy changes 42,095 (1,104 ) (768 ) 40,222 56,109Increase/decrease:
Additions to reserve for dividends to policyholders (2,048 )Additions to legal reserve for deficiencies —Additions to reserve for redemption of foundation funds —Interest on foundation funds (15 )Net surplus 2,394Redemption of foundation funds (445 )Additions to reserve for social public welfare assistance —Reversal of reserve for social public welfare assistance —Additions to reserve for reduction entry of real estate —Reversal of reserve for reduction entry of real estate —Additions to reserve for reduction entry of real estate to be purchased —Reversal of land revaluation losses (250 )Net change, excluding foundation funds and others (1,225 ) 522 250 (451 ) (451 )Net change (1,225 ) 522 250 (451 ) (817 )
Ending balance $40,870 $ (581 ) $(517 ) $39,771 $55,292
The accompanying notes are an integral part of the nonconsolidated financial statements.
Financial Data
167
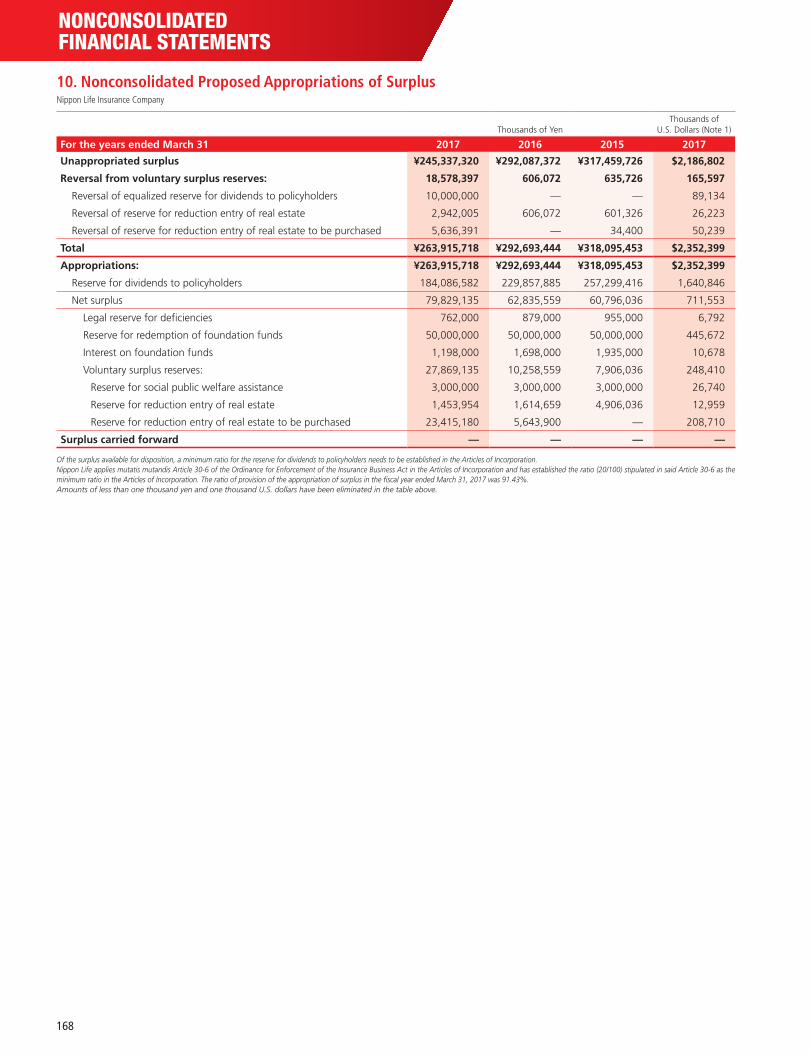
NONCONSOLIDATED FINANCIAL STATEMENTS
Thousands of YenThousands of
U.S. Dollars (Note 1)
For the years ended March 31 2017 2016 2015 2017
Unappropriated surplus ¥245,337,320 ¥292,087,372 ¥317,459,726 $2,186,802
Reversal from voluntary surplus reserves: 18,578,397 606,072 635,726 165,597
Reversal of equalized reserve for dividends to policyholders 10,000,000 — — 89,134
Reversal of reserve for reduction entry of real estate 2,942,005 606,072 601,326 26,223
Reversal of reserve for reduction entry of real estate to be purchased 5,636,391 — 34,400 50,239
Total ¥263,915,718 ¥292,693,444 ¥318,095,453 $2,352,399
Appropriations: ¥263,915,718 ¥292,693,444 ¥318,095,453 $2,352,399
Reserve for dividends to policyholders 184,086,582 229,857,885 257,299,416 1,640,846
Net surplus 79,829,135 62,835,559 60,796,036 711,553
Legal reserve for deficiencies 762,000 879,000 955,000 6,792
Reserve for redemption of foundation funds 50,000,000 50,000,000 50,000,000 445,672
Interest on foundation funds 1,198,000 1,698,000 1,935,000 10,678
Voluntary surplus reserves: 27,869,135 10,258,559 7,906,036 248,410
Reserve for social public welfare assistance 3,000,000 3,000,000 3,000,000 26,740
Reserve for reduction entry of real estate 1,453,954 1,614,659 4,906,036 12,959
Reserve for reduction entry of real estate to be purchased 23,415,180 5,643,900 — 208,710
Surplus carried forward — — — —
Of the surplus available for disposition, a minimum ratio for the reserve for dividends to policyholders needs to be established in the Articles of Incorporation.Nippon Life applies mutatis mutandis Article 30-6 of the Ordinance for Enforcement of the Insurance Business Act in the Articles of Incorporation and has established the ratio (20/100) stipulated in said Article 30-6 as the minimum ratio in the Articles of Incorporation. The ratio of provision of the appropriation of surplus in the fiscal year ended March 31, 2017 was 91.43%.Amounts of less than one thousand yen and one thousand U.S. dollars have been eliminated in the table above.
10. Nonconsolidated Proposed Appropriations of SurplusNippon Life Insurance Company
168
1. Basis of Presenting the Nonconsolidated Financial Statements
(1) Accounting principles and presentation
The accompanying nonconsolidated financial statements have been pre-
pared from the accounts and records maintained by NIPPON LIFE INSUR-
ANCE COMPANY (“Nippon Life” or the “Company”) in accordance with the
provisions set forth in the Insurance Business Act and the related rules and
regulations applicable to the mutual life insurance industry, and in accor-
dance with accounting principles generally accepted in Japan, which are
different in certain respects from the application and disclosure requirements
of International Financial Reporting Standards. Certain accounting and
reporting practices required to be followed by the industry are regulated by
the Financial Services Agency and the related ministry by means of ministe-
rial ordinances and guidance. The accompanying nonconsolidated financial
statements of Nippon Life are in compliance with such requirements. How-
ever, while the business report and supporting schedules have been prepared
by the management of Nippon Life as a part of the disclosures required by
the Japanese Commercial Code and the Insurance Business Act, they are not
provided herein. The information provided in the nonconsolidated financial
statements including the notes to the nonconsolidated financial statements
is limited to information required by the Insurance Business Act and the
related rules and regulations applicable to the mutual life insurance industry
and disclosed as additional information. Amounts of less than one million
yen and one million U.S. dollars have been eliminated for financial statement
presentation. As a result, totals may not add up exactly. As consolidated
statements of cash flows and certain disclosures are presented in the con-
solidated financial statements of the Company, nonconsolidated statements
of cash flows and certain disclosures are not presented herein in accordance
with accounting principles generally accepted in Japan.
(2) U.S. dollar amounts
Nippon Life prepares its nonconsolidated financial statements in Japanese
yen. The U.S. dollar amounts included in the nonconsolidated financial state-
ments and notes thereto represent the arithmetical results of translating
Japanese yen to U.S. dollars on the basis of ¥112.19=U.S.$1, the effective
rate of exchange at the balance sheet date of March 31, 2017. The inclusion
of such U.S. dollar amounts is solely for convenience and is not intended to
imply that Japanese yen amounts have been or could be readily converted,
realized or settled in U.S. dollars at ¥112.19=U.S.$1 or at any other rate.
2. Summary of Significant Accounting Policies(1) Securities and hedging activities
1) Securities (including items such as deposits and monetary receivables
purchased which are treated as securities based on the “Accounting
Standard for Financial Instruments” (The Accounting Standards Board of
Japan (ASBJ) Statement No. 10) and securities within assets held in trust)
are valued as follows:
i) Trading securities are stated at fair value on the balance sheet date.
The moving average method is used for calculating the cost basis.
ii) Held-to-maturity debt securities are valued using the moving average
method, net of accumulated amortization (straight-line).
iii) Policy-reserve-matching bonds are valued using the moving average
method, net of accumulated amortization (straight-line), in accor-
dance with the Industry Audit Committee Report No. 21, “Temporary
Treatment of Accounting and Auditing Concerning Policy-Reserve-
Matching Bonds in the Insurance Industry,” issued by the Japanese
Institute of Certified Public Accountants (JICPA).
iv) Investments in subsidiaries and affiliates (stocks issued by subsidiar-
ies prescribed in Article 2, Paragraph 12 of the Insurance Business Act
or subsidiaries prescribed in Article 13-5-2, Paragraph 3 of the Order
for Enforcement of the Insurance Business Act and stocks issued by
affiliates prescribed in Article 13-5-2, Paragraph 4 of the Order for
Enforcement of the Insurance Business Act) are stated at cost using
the moving average method.
v) Available-for-sale securities
a. Regarding securities with a fair value, stocks (including foreign
stocks) are valued by using the average fair value during the period
of one month before the balance sheet date (the cost basis is calcu-
lated by using the moving average method). Other securities with a
fair value are valued by using the fair value on the balance sheet date
(the cost basis is calculated by using the moving average method).
b. Regarding securities of which the fair value is extremely difficult to
be determined, bonds (including foreign bonds) for which the
difference between the purchase price and face value is due to an
interest rate adjustment are stated at cost using the moving aver-
age method, net of accumulated amortization (straight-line). Other
securities without readily determinable fair values are stated at
cost using the moving average method.
2) Unrealized gains/losses, net of applicable taxes for available-for-sale
securities, are recorded as a separate component of net assets.
Hedge accounting is applied based on the following methods:
1) The Company mainly applies the following hedge accounting methods:
The exceptional accounting treatment (“Tokurei-shori”) for interest rate
swaps is applied to hedge the cash flow volatility of certain loans
denominated in Japanese yen and certain loans denominated in foreign
11. Notes to the Nonconsolidated Financial StatementsNippon Life Insurance Company
Financial Data
169
NONCONSOLIDATED FINANCIAL STATEMENTS
currencies; deferred hedge accounting for interest rate swaps is applied
to hedge the interest rate fluctuation exposures on certain insurance poli-
cies, based on the Industry Audit Committee Report No. 26, “Accounting
and Auditing Treatments related to Application of Accounting for Finan-
cial Instruments in the Insurance Industry” issued by the JICPA; deferred
hedge accounting and designated hedge accounting (“Furiate-shori”)
for currency swaps are applied to hedge the cash flow volatility caused
by foreign exchange rate fluctuations on certain foreign currency-
denominated bonds, certain foreign currency-denominated loans, and
foreign currency-denominated subordinated corporate bonds issued by
the Company; fair value hedge accounting and deferred hedge accounting
for foreign exchange forward contracts are applied to hedge the price
fluctuation exposures related to foreign exchange rate fluctuations on
certain foreign currency-denominated bonds, certain foreign currency-
denominated stocks and certain other foreign currency-denominated
instruments; and fair value hedge accounting for equity forward contracts is
applied to hedge the price fluctuation exposures on certain domestic stocks.
2) Hedging instruments and hedged items
(Hedging instruments) (Hedged items)
Interest rate swaps Loans, foreign currency-denominated loans, and insurance policies
Currency swaps Foreign currency-denominated bonds, foreign currency-denominated loans, and foreign currency-denominated subordinated corporate bonds
Foreign exchange forward contracts
Foreign currency-denominated bonds, foreign currency-denominated stocks and other foreign currency-denominated instruments
Equity forward contracts
Domestic stocks
3) Effectiveness of hedging activities is mainly evaluated by performing a
ratio analysis of fair value movement comparisons based on the hedging
instruments and hedged items taken, which is in accordance with the
Company’s internal risk management policies.
4) Derivative financial instruments and derivative financial instruments
within assets held in trust are stated at fair value.
(2) Policy-reserve-matching bonds
Securities that are held for the purpose of matching the duration of outstand-
ing liabilities within the subgroups (classified by insurance type, maturity
period, and investment policy) of insurance products, such as individual
insurance and annuities, workers’ asset-formation insurance and annuities,
and group insurance and annuities are classified as policy-reserve-matching
bonds in accordance with the Industry Audit Committee Report No. 21,
“Temporary Treatment of Accounting and Auditing Concerning Policy-
Reserve-Matching Bonds in the Insurance Industry,” issued by the JICPA.
(3) Foreign currency translation
Assets and liabilities denominated in foreign currencies are translated into
Japanese yen using the “Accounting Standards for Foreign Currency
Transactions” (Business Accounting Council).
Foreign currency-denominated available-for-sale securities of the
Company, with exchange rates which have significantly fluctuated and
where recovery is not expected, are converted to Japanese yen using either
the rate on the balance sheet date or the average one-month rate prior to
the balance sheet date, whichever indicates a weaker yen. This translation
difference is recorded as a loss on valuation of securities.
(4) Tangible fixed assets
1) Tangible fixed assets are depreciated based on the following methods:
a. Tangible fixed assets (except for lease assets)
(i) Buildings
Straight-line method.
(ii) Assets other than the above
Declining-balance method.
Certain other tangible fixed assets with an acquisition price of less than
¥200,000 are depreciated over a 3 year period on a straight-line basis.
b. Lease assets
(i) Lease assets related to financial leases where ownership is
transferred
The same depreciation method applied to fixed assets owned by
the Company.
(ii) Lease assets related to financial leases where ownership is not
transferred
Straight-line method based on lease period.
The estimated useful lives of major items are as follows:
Buildings 2 to 60 years
Other tangible fixed assets 2 to 20 years
Tangible fixed assets are stated at cost, net of accumulated depreciation
and impairment losses.
2) Revaluation of land used in the operations is performed based on the Act
on Revaluation of Land. The tax effect of the amount related to the valu-
ation difference between book value and the revalued amount for land
revaluation is recognized as a deferred tax liability within the liability
section. The valuation differences, excluding tax, are recognized as land
revaluation losses within the net assets section.
Revaluation date March 31, 2002
Revaluation methodology The amount is calculated by using the listed value of the land and road rate as prescribed by Article 2, Items 1 and 4, respectively, of the Order for Enforcement of the Act on Revaluation of Land.
(5) Software
Capitalized software for internal use, which is included within intangible
fixed assets, is amortized using the straight-line method over its estimated
useful lives as internally determined (5 years).
(6) Leases
Financial leases where ownership is not transferred are capitalized based on
170
the “Accounting Standard for Lease Transactions” (ASBJ Statement No. 13).
Financial leases where the Company is the lessee, ownership is not trans-
ferred, and the lease start date is March 31, 2008, or prior are accounted for
under the accounting treatment applied to ordinary operating leases.
(7) Allowance for doubtful accounts
1) An allowance for doubtful accounts is recognized in accordance with
the Company’s internal Asset Valuation Regulation and Write-Off/
Provision Rule.
i) An allowance for loans to borrowers who are legally or substantially
bankrupt, such as being bankrupt or being in the process of civil
rehabilitation proceedings, is recognized based on the amount of credit
remaining after directly deducting amounts expected to be collected
through the disposal of collateral or the execution of guarantees from
the balance of loans (as mentioned at 3) below).
ii) An allowance for loans to borrowers who are not currently legally
bankrupt but have a significant possibility of bankruptcy is recognized
at the amounts deemed necessary considering an assessment of the
borrowers’ overall solvency and the amounts remaining after deduc-
tion of amounts expected to be collected through the disposal of
collateral or the execution of guarantees.
iii) An allowance for loans to borrowers other than the above is provided
based on the borrowers’ balance multiplied by the historical average
(of a certain period) percentage of bad debt.
2) All credits are assessed by responsible sections in accordance with the
Company’s internal Asset Valuation Regulation. The assessments are
verified by the independent Asset Auditing Department. The results of
the assessments are reflected in the calculation of the allowance for
doubtful accounts.
3) The estimated uncollectible amount calculated by subtracting the amount
of collateral value or the amount collectible by the execution of guaran-
tees from the balance of loans is directly deducted from the balance of
loans (including loans with credits secured and/or guaranteed) made to
legally or substantially bankrupt borrowers. The estimated uncollectible
amounts were ¥531 million (U.S.$4 million) (including ¥94 million
(U.S.$0 million) of credits secured and/or guaranteed), ¥1,036 million
(including ¥124 million of credits secured and/or guaranteed) and ¥501
million (including ¥168 million of credits secured and/or guaranteed) as of
March 31, 2017, 2016 and 2015, respectively.
(8) Allowance for investment loss
To provide for losses on investments, an allowance for investment loss is
recognized for the securities of which the fair value is extremely difficult to
be determined and which are expected to have loss in future, and measured
at the amount of the estimated losses that could arise in the future in accor-
dance with the Company’s internal Asset Valuation Regulation and Write-
off/Provision Rule.
(9) Accrued bonuses for directors and audit and supervisory
board members
Accrued bonuses for directors and audit and supervisory board members are
recognized based on amounts estimated to be paid.
(10) Accrued retirement benefits
1) Accrued retirement benefits are recognized based on the estimated
amount of projected benefit obligations in excess of the fair value of
pension plan assets for future severance payments to employee on the
balance sheet date as of March 31, 2017, 2016 and 2015.
2) The accounting methods used for retirement benefits as of March 31,
2017, 2016 and 2015, are as follows:
i) Attribution method for estimated retirement benefits: Benefit for-
mula basis
ii) Period of amortizing actuarial gains/losses: 5 years
iii) Period of amortizing prior service costs: 5 years
(11) Accrued retirement benefits for directors and
audit and supervisory board members
Accrued retirement benefits for directors and audit and supervisory board
members are recognized based on estimated payment amounts under
internal rules.
(12) Reserve for program points
A reserve for program points is recognized based on the amount projected
to be incurred for expenses from the use of points granted to policyholders.
(13) Reserve for price fluctuations in investments in securities
Reserve for price fluctuations in investments in securities is recognized based
on Article 115 of the Insurance Business Act.
(14) Accounting for consumption taxes
Consumption taxes and local consumption taxes are accounted for by the
tax exclusion method. However, consumption taxes paid on certain asset
transactions, which are not deductible from consumption taxes withheld and
are stipulated to be deferred under the Consumption Tax Act, are deferred as
prepaid expenses and amortized over a 5 year period on a straight-line basis.
Consumption taxes other than deferred consumption taxes are expensed as
incurred.
(15) Policy reserves
Policy reserves of the Company are reserves set forth in accordance with
Article 116 of the Insurance Business Act. Policy reserves are recognized
based on the following methodology:
1) Reserves for contracts concluded in or after April 1996, other than those
in which factors used as a basis for computing policy reserves and insur-
ance premiums are alterable and those for variable insurance, are com-
puted by the net level premium method based on the assumption rates
Financial Data
171
NONCONSOLIDATED FINANCIAL STATEMENTS
locked in at the sales and renewal prescribed by the Insurance Business
Act and the statement of calculation procedures*.
2) Reserves for other contracts are determined by the net level premium
method using the assumption rates locked in at the sales and renewal
prescribed by the statement of calculation procedures*.
* Documents approved by the Financial Services Agency that describe the specific calculation methods for insurance premiums and policy reserves.
Additional policy reserve amounts are included to cover a possible
deficiency in the amount of the reserve for certain individual annuity policy-
holders in accordance with Article 69, Paragraph 5 of the Ordinance for
Enforcement of the Insurance Business Act.
(16) Revenue recognition
Regarding revenues, insurance premiums are recognized when cash is
received and insurance premiums due but not collected are not recognized
as revenues. Unearned insurance premiums are recognized as policy reserves.
(17) Policy acquisition costs
Policy acquisition costs are recorded to expense as incurred.
(18) Income taxes
The provision for income taxes is computed based on the pretax income
included in the nonconsolidated statements of income. The asset and liability
approach is used to recognize deferred tax assets and liabilities for the
expected future tax consequences of temporary differences between the
carrying amounts and the tax bases of assets and liabilities. Deferred taxes
are measured by applying the enacted statutory tax rates to the temporary
differences.
(19) New accounting standards
Effective from the fiscal year ended March 31, 2017, the Company has
applied the “Implementation Guidance on Recoverability of Deferred Tax
Assets” (ASBJ Guidance No. 26, March 28, 2016), which included certain
revisions of the previous accounting and auditing guidance issued by the
JICPA. While the new guidance continues to follow the basic framework of
the previous guidance, it provides new guidance for the application of judg-
ment in assessing the recoverability of deferred tax assets.
The previous guidance provided a basic framework which included cer-
tain specific restrictions on recognizing deferred tax assets depending on the
company’s classification in respect of its profitability, taxable profit and
temporary differences, etc.
The new guidance does not change such basic framework but, in limited
cases, allows companies to recognize deferred tax assets even for a deduct-
ible temporary difference for which it was specifically prohibited to recognize
a deferred tax asset under the previous guidance, if the company can justify,
with reasonable grounds, that it is probable that the deductible temporary
difference will be utilized against future taxable profit in some future period.
The new guidance was effective for the beginning of annual periods
beginning on or after April 1, 2016. The new guidance shall not be applied
retrospectively and any adjustments from the application of the new guid-
ance at the beginning of the reporting period shall be reflected within unap-
propriated surplus or valuations, conversions and others at the beginning of
the reporting period.
Following the new guidance, the Company partially revised its account-
ing treatment of recoverability of deferred tax assets.
As a result, as of April 1, 2016, deferred tax assets increased by ¥1,873
million (U.S.$16 million) and unappropriated surplus increased by ¥1,873
million (U.S.$16 million).
3. Financial InstrumentsRegarding the investment of general accounts (except separate accounts as
provided in Article 118, Paragraph 1 of the Insurance Business Act), in light
of the characteristics of life insurance policies, the Company has built a
portfolio geared towards mid- to long-term investment and formulated an
investment plan considering the outlook of the investment environment.
Based on this, in order to reliably pay benefits and other payments in the
future, the Company has positioned yen-denominated assets that can be
expected to provide stable income, such as bonds and loans, as the Com-
pany’s core assets, and from the viewpoint of improving profit in the mid- to
long-term, the Company invests in domestic stocks and foreign securities.
Also, from the viewpoint of effective investment, the Company mainly uses
derivative transactions for managing asset investment risks. Specifically, the
Company uses interest rate swaps for the Company’s interest rate-related
investments, foreign exchange forward contracts and currency options and
swaps for the Company’s currency-related investments, and equity forward
contracts, equity index futures and equity index options for the Company’s
equity-related investments, and hedge accounting is applied with respect to
a portion thereof.
The Company mainly applies the following hedge accounting methods:
The exceptional accounting treatment (“Tokurei-shori”) for interest rate
swaps is applied to hedge the cash flow volatility of certain loans denomi-
nated in Japanese yen and certain loans denominated in foreign currencies;
deferred hedge accounting for interest rate swaps is applied to hedge the
interest rate fluctuation exposures on certain insurance policies, based on
the Industry Audit Committee Report No. 26, “Accounting and Auditing
Treatments related to Application of Accounting for Financial Instruments in
the Insurance Industry” issued by the JICPA; deferred hedge accounting and
designated hedge accounting (“Furiate-shori”) for currency swaps are
applied to hedge the cash flow volatility caused by foreign exchange rate
fluctuations on certain foreign currency-denominated bonds, certain foreign
currency-denominated loans, and foreign currency-denominated subordi-
nated corporate bonds issued by the Company; fair value hedge accounting
and deferred hedge accounting for foreign exchange forward contracts are
applied to hedge the price fluctuation exposures related to foreign exchange
rate fluctuations on certain foreign currency-denominated bonds, certain
172
foreign currency-denominated stocks and certain other foreign currency-
denominated instruments; and fair value hedge accounting for equity for-
ward contracts is applied to hedge the price fluctuation exposures on certain
domestic stocks. The effectiveness of hedging activities is mainly evaluated
by performing a ratio analysis of fair value movement comparisons based on
the hedging instruments and hedged items taken, which is in accordance
with the Company’s internal risk management policies.
Securities are mainly exposed to market risk and credit risk, loans are
exposed to credit risk, and derivative transactions are exposed to market risk
and credit risk. Market risk refers to the risk of incurring losses when the fair
value of investment assets declines due to such factors as fluctuations in
interest rates, exchange rates, or stock prices. Credit risk refers to the risk of
incurring losses when the value of assets, primarily loans and corporate
bonds, declines due to deterioration of the financial condition of the party to
whom credit has been extended. It includes country risk. These risks are man-
aged according to rules and regulations regarding investment risks.
To manage market risk, the Company has implemented investment limits
based on the nature of the assets in order to avoid excessive losses from
financing and investment transactions. In addition, the Company monitors
and regularly reports on the status of compliance to the Risk Management
Committee, the advisory body of the Management Committee, and has
developed a system to manage risk within acceptable levels in the event of
a breach of the internal rules. Also, to manage market risk in the Company’s
portfolio, the Company uses a statistical analysis method to rationally calcu-
late the market value-at-risk of the portfolio as a whole and conducts
appropriate asset allocation within acceptable boundaries of risk.
To manage credit risk, the Company has built a thorough monitoring
system involving the Assessment Management Department, which is inde-
pendent of the departments handling investment and finance activities. The
Company also continues to build a sound portfolio through the establish-
ment and monitoring of interest guidelines to ensure the returns the Com-
pany obtains are commensurate with the risk, a system of internal ratings for
classifying the creditworthiness of borrowers, and credit ceilings to ensure
that credit risk is not excessively concentrated in a particular company,
group, or country.
In addition, the Company calculates credit value-at-risk as a mea-
surement of the magnitude of credit risk across the Company’s portfolio
as a whole, and monitors whether the magnitude of risk stays within an
appropriate range.
Financial Data
173
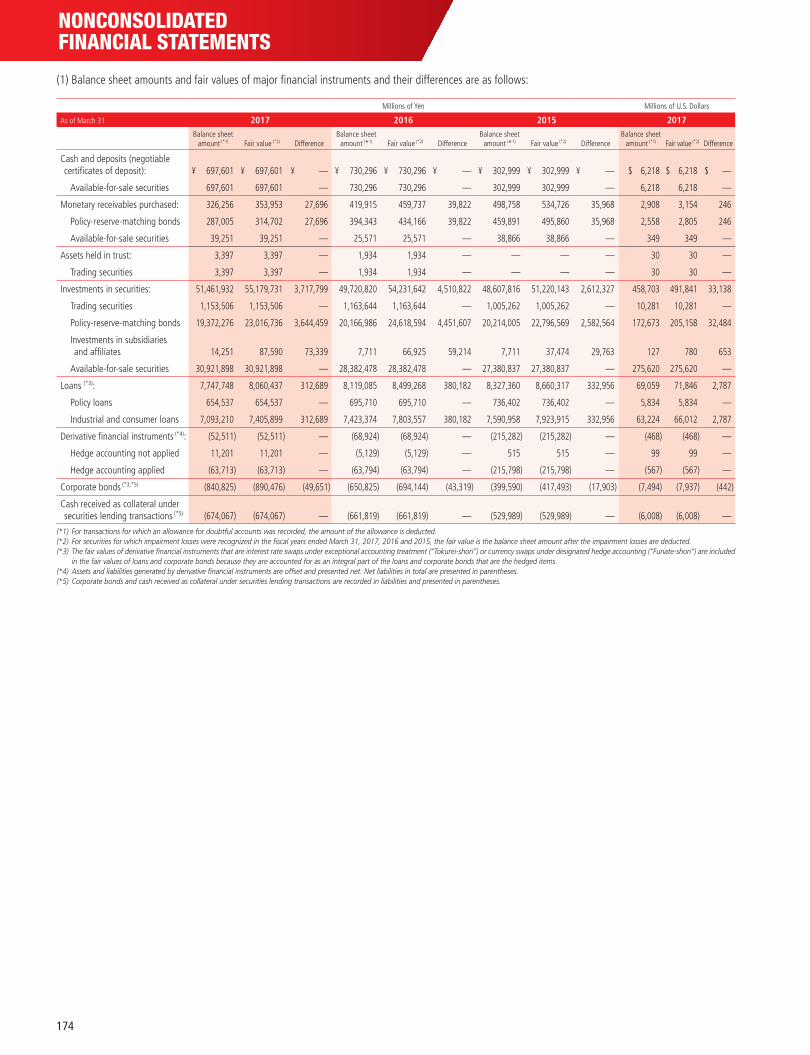
NONCONSOLIDATED FINANCIAL STATEMENTS
(1) Balance sheet amounts and fair values of major financial instruments and their differences are as follows:
Millions of Yen Millions of U.S. Dollars
As of March 31 2017 2016 2015 2017Balance sheet
amount (*1) Fair value (*2) DifferenceBalance sheet
amount (*1) Fair value (*2) DifferenceBalance sheet
amount (*1) Fair value (*2) DifferenceBalance sheet
amount (*1) Fair value (*2) Difference
Cash and deposits (negotiable certificates of deposit): ¥ 697,601 ¥ 697,601 ¥ — ¥ 730,296 ¥ 730,296 ¥ — ¥ 302,999 ¥ 302,999 ¥ — $ 6,218 $ 6,218 $ —
Available-for-sale securities 697,601 697,601 — 730,296 730,296 — 302,999 302,999 — 6,218 6,218 —
Monetary receivables purchased: 326,256 353,953 27,696 419,915 459,737 39,822 498,758 534,726 35,968 2,908 3,154 246
Policy-reserve-matching bonds 287,005 314,702 27,696 394,343 434,166 39,822 459,891 495,860 35,968 2,558 2,805 246
Available-for-sale securities 39,251 39,251 — 25,571 25,571 — 38,866 38,866 — 349 349 —
Assets held in trust: 3,397 3,397 — 1,934 1,934 — — — — 30 30 —
Trading securities 3,397 3,397 — 1,934 1,934 — — — — 30 30 —
Investments in securities: 51,461,932 55,179,731 3,717,799 49,720,820 54,231,642 4,510,822 48,607,816 51,220,143 2,612,327 458,703 491,841 33,138
Trading securities 1,153,506 1,153,506 — 1,163,644 1,163,644 — 1,005,262 1,005,262 — 10,281 10,281 —
Policy-reserve-matching bonds 19,372,276 23,016,736 3,644,459 20,166,986 24,618,594 4,451,607 20,214,005 22,796,569 2,582,564 172,673 205,158 32,484
Investments in subsidiaries and affiliates 14,251 87,590 73,339 7,711 66,925 59,214 7,711 37,474 29,763 127 780 653
Available-for-sale securities 30,921,898 30,921,898 — 28,382,478 28,382,478 — 27,380,837 27,380,837 — 275,620 275,620 —
Loans (*3): 7,747,748 8,060,437 312,689 8,119,085 8,499,268 380,182 8,327,360 8,660,317 332,956 69,059 71,846 2,787
Policy loans 654,537 654,537 — 695,710 695,710 — 736,402 736,402 — 5,834 5,834 —
Industrial and consumer loans 7,093,210 7,405,899 312,689 7,423,374 7,803,557 380,182 7,590,958 7,923,915 332,956 63,224 66,012 2,787
Derivative financial instruments (*4): (52,511 ) (52,511 ) — (68,924 ) (68,924 ) — (215,282 ) (215,282 ) — (468 ) (468 ) —
Hedge accounting not applied 11,201 11,201 — (5,129 ) (5,129 ) — 515 515 — 99 99 —
Hedge accounting applied (63,713 ) (63,713 ) — (63,794 ) (63,794 ) — (215,798 ) (215,798 ) — (567 ) (567 ) —
Corporate bonds (*3,*5) (840,825 ) (890,476 ) (49,651 ) (650,825 ) (694,144 ) (43,319 ) (399,590 ) (417,493 ) (17,903 ) (7,494 ) (7,937 ) (442 )
Cash received as collateral under securities lending transactions (*5) (674,067 ) (674,067 ) — (661,819 ) (661,819 ) — (529,989 ) (529,989 ) — (6,008 ) (6,008 ) —
(*1) For transactions for which an allowance for doubtful accounts was recorded, the amount of the allowance is deducted.(*2) For securities for which impairment losses were recognized in the fiscal years ended March 31, 2017, 2016 and 2015, the fair value is the balance sheet amount after the impairment losses are deducted.(*3) The fair values of derivative financial instruments that are interest rate swaps under exceptional accounting treatment (“Tokurei-shori”) or currency swaps under designated hedge accounting (“Furiate-shori”) are included
in the fair values of loans and corporate bonds because they are accounted for as an integral part of the loans and corporate bonds that are the hedged items.(*4) Assets and liabilities generated by derivative financial instruments are offset and presented net. Net liabilities in total are presented in parentheses.(*5) Corporate bonds and cash received as collateral under securities lending transactions are recorded in liabilities and presented in parentheses.
174
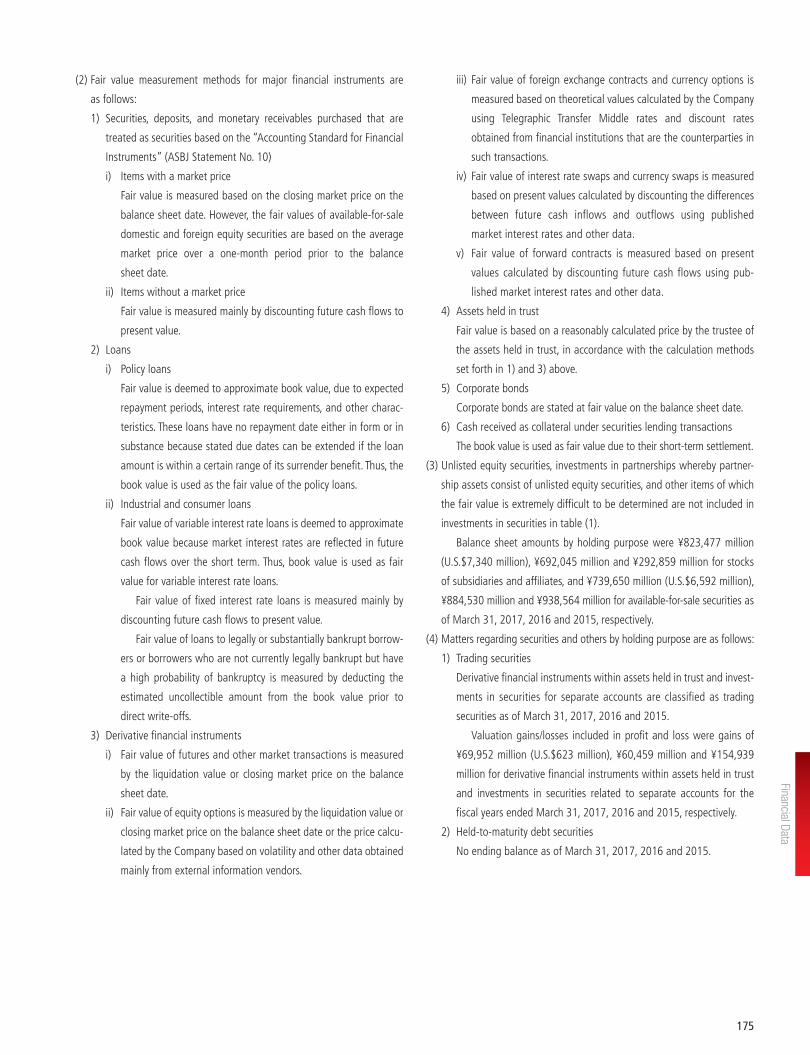
(2) Fair value measurement methods for major financial instruments are
as follows:
1) Securities, deposits, and monetary receivables purchased that are
treated as securities based on the “Accounting Standard for Financial
Instruments” (ASBJ Statement No. 10)
i) Items with a market price
Fair value is measured based on the closing market price on the
balance sheet date. However, the fair values of available-for-sale
domestic and foreign equity securities are based on the average
market price over a one-month period prior to the balance
sheet date.
ii) Items without a market price
Fair value is measured mainly by discounting future cash flows to
present value.
2) Loans
i) Policy loans
Fair value is deemed to approximate book value, due to expected
repayment periods, interest rate requirements, and other charac-
teristics. These loans have no repayment date either in form or in
substance because stated due dates can be extended if the loan
amount is within a certain range of its surrender benefit. Thus, the
book value is used as the fair value of the policy loans.
ii) Industrial and consumer loans
Fair value of variable interest rate loans is deemed to approximate
book value because market interest rates are reflected in future
cash flows over the short term. Thus, book value is used as fair
value for variable interest rate loans.
Fair value of fixed interest rate loans is measured mainly by
discounting future cash flows to present value.
Fair value of loans to legally or substantially bankrupt borrow-
ers or borrowers who are not currently legally bankrupt but have
a high probability of bankruptcy is measured by deducting the
estimated uncollectible amount from the book value prior to
direct write-offs.
3) Derivative financial instruments
i) Fair value of futures and other market transactions is measured
by the liquidation value or closing market price on the balance
sheet date.
ii) Fair value of equity options is measured by the liquidation value or
closing market price on the balance sheet date or the price calcu-
lated by the Company based on volatility and other data obtained
mainly from external information vendors.
iii) Fair value of foreign exchange contracts and currency options is
measured based on theoretical values calculated by the Company
using Telegraphic Transfer Middle rates and discount rates
obtained from financial institutions that are the counterparties in
such transactions.
iv) Fair value of interest rate swaps and currency swaps is measured
based on present values calculated by discounting the differences
between future cash inflows and outflows using published
market interest rates and other data.
v) Fair value of forward contracts is measured based on present
values calculated by discounting future cash flows using pub-
lished market interest rates and other data.
4) Assets held in trust
Fair value is based on a reasonably calculated price by the trustee of
the assets held in trust, in accordance with the calculation methods
set forth in 1) and 3) above.
5) Corporate bonds
Corporate bonds are stated at fair value on the balance sheet date.
6) Cash received as collateral under securities lending transactions
The book value is used as fair value due to their short-term settlement.
(3) Unlisted equity securities, investments in partnerships whereby partner-
ship assets consist of unlisted equity securities, and other items of which
the fair value is extremely difficult to be determined are not included in
investments in securities in table (1).
Balance sheet amounts by holding purpose were ¥823,477 million
(U.S.$7,340 million), ¥692,045 million and ¥292,859 million for stocks
of subsidiaries and affiliates, and ¥739,650 million (U.S.$6,592 million),
¥884,530 million and ¥938,564 million for available-for-sale securities as
of March 31, 2017, 2016 and 2015, respectively.
(4) Matters regarding securities and others by holding purpose are as follows:
1) Trading securities
Derivative financial instruments within assets held in trust and invest-
ments in securities for separate accounts are classified as trading
securities as of March 31, 2017, 2016 and 2015.
Valuation gains/losses included in profit and loss were gains of
¥69,952 million (U.S.$623 million), ¥60,459 million and ¥154,939
million for derivative financial instruments within assets held in trust
and investments in securities related to separate accounts for the
fiscal years ended March 31, 2017, 2016 and 2015, respectively.
2) Held-to-maturity debt securities
No ending balance as of March 31, 2017, 2016 and 2015.
Financial Data
175
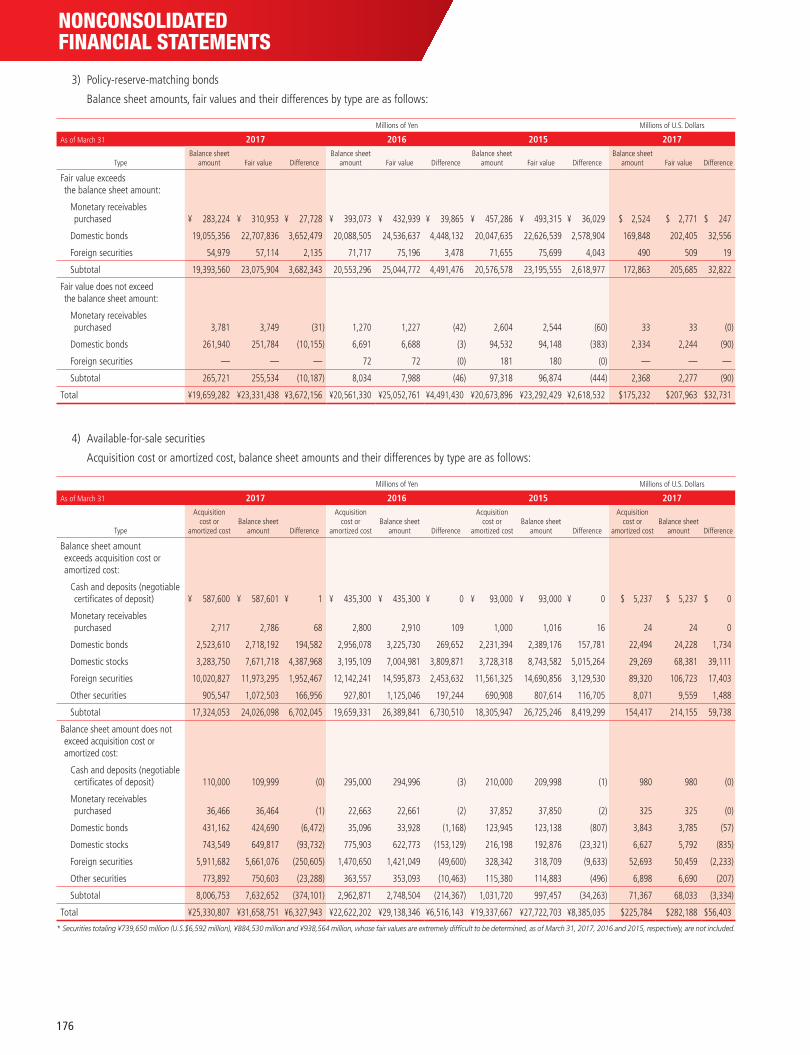
NONCONSOLIDATED FINANCIAL STATEMENTS
3) Policy-reserve-matching bonds
Balance sheet amounts, fair values and their differences by type are as follows:
Millions of Yen Millions of U.S. Dollars
As of March 31 2017 2016 2015 2017
TypeBalance sheet
amount Fair value DifferenceBalance sheet
amount Fair value DifferenceBalance sheet
amount Fair value DifferenceBalance sheet
amount Fair value Difference
Fair value exceeds the balance sheet amount:
Monetary receivables purchased ¥ 283,224 ¥ 310,953 ¥ 27,728 ¥ 393,073 ¥ 432,939 ¥ 39,865 ¥ 457,286 ¥ 493,315 ¥ 36,029 $ 2,524 $ 2,771 $ 247
Domestic bonds 19,055,356 22,707,836 3,652,479 20,088,505 24,536,637 4,448,132 20,047,635 22,626,539 2,578,904 169,848 202,405 32,556
Foreign securities 54,979 57,114 2,135 71,717 75,196 3,478 71,655 75,699 4,043 490 509 19
Subtotal 19,393,560 23,075,904 3,682,343 20,553,296 25,044,772 4,491,476 20,576,578 23,195,555 2,618,977 172,863 205,685 32,822
Fair value does not exceed the balance sheet amount:
Monetary receivables purchased 3,781 3,749 (31 ) 1,270 1,227 (42 ) 2,604 2,544 (60 ) 33 33 (0 )
Domestic bonds 261,940 251,784 (10,155 ) 6,691 6,688 (3 ) 94,532 94,148 (383 ) 2,334 2,244 (90 )
Foreign securities — — — 72 72 (0 ) 181 180 (0 ) — — —
Subtotal 265,721 255,534 (10,187 ) 8,034 7,988 (46 ) 97,318 96,874 (444 ) 2,368 2,277 (90 )
Total ¥19,659,282 ¥23,331,438 ¥3,672,156 ¥20,561,330 ¥25,052,761 ¥4,491,430 ¥20,673,896 ¥23,292,429 ¥2,618,532 $175,232 $207,963 $32,731
4) Available-for-sale securities
Acquisition cost or amortized cost, balance sheet amounts and their differences by type are as follows:
Millions of Yen Millions of U.S. Dollars
As of March 31 2017 2016 2015 2017
Type
Acquisition cost or
amortized costBalance sheet
amount Difference
Acquisition cost or
amortized costBalance sheet
amount Difference
Acquisition cost or
amortized costBalance sheet
amount Difference
Acquisition cost or
amortized costBalance sheet
amount Difference
Balance sheet amount exceeds acquisition cost or amortized cost:
Cash and deposits (negotiable certificates of deposit) ¥ 587,600 ¥ 587,601 ¥ 1 ¥ 435,300 ¥ 435,300 ¥ 0 ¥ 93,000 ¥ 93,000 ¥ 0 $ 5,237 $ 5,237 $ 0
Monetary receivables purchased 2,717 2,786 68 2,800 2,910 109 1,000 1,016 16 24 24 0
Domestic bonds 2,523,610 2,718,192 194,582 2,956,078 3,225,730 269,652 2,231,394 2,389,176 157,781 22,494 24,228 1,734
Domestic stocks 3,283,750 7,671,718 4,387,968 3,195,109 7,004,981 3,809,871 3,728,318 8,743,582 5,015,264 29,269 68,381 39,111
Foreign securities 10,020,827 11,973,295 1,952,467 12,142,241 14,595,873 2,453,632 11,561,325 14,690,856 3,129,530 89,320 106,723 17,403
Other securities 905,547 1,072,503 166,956 927,801 1,125,046 197,244 690,908 807,614 116,705 8,071 9,559 1,488
Subtotal 17,324,053 24,026,098 6,702,045 19,659,331 26,389,841 6,730,510 18,305,947 26,725,246 8,419,299 154,417 214,155 59,738
Balance sheet amount does not exceed acquisition cost or amortized cost:
Cash and deposits (negotiable certificates of deposit) 110,000 109,999 (0 ) 295,000 294,996 (3 ) 210,000 209,998 (1 ) 980 980 (0 )
Monetary receivables purchased 36,466 36,464 (1 ) 22,663 22,661 (2 ) 37,852 37,850 (2 ) 325 325 (0 )
Domestic bonds 431,162 424,690 (6,472 ) 35,096 33,928 (1,168 ) 123,945 123,138 (807 ) 3,843 3,785 (57 )
Domestic stocks 743,549 649,817 (93,732 ) 775,903 622,773 (153,129 ) 216,198 192,876 (23,321 ) 6,627 5,792 (835 )
Foreign securities 5,911,682 5,661,076 (250,605 ) 1,470,650 1,421,049 (49,600 ) 328,342 318,709 (9,633 ) 52,693 50,459 (2,233 )
Other securities 773,892 750,603 (23,288 ) 363,557 353,093 (10,463 ) 115,380 114,883 (496 ) 6,898 6,690 (207 )
Subtotal 8,006,753 7,632,652 (374,101 ) 2,962,871 2,748,504 (214,367 ) 1,031,720 997,457 (34,263 ) 71,367 68,033 (3,334 )
Total ¥25,330,807 ¥31,658,751 ¥6,327,943 ¥22,622,202 ¥29,138,346 ¥6,516,143 ¥19,337,667 ¥27,722,703 ¥8,385,035 $225,784 $282,188 $56,403
* Securities totaling ¥739,650 million (U.S.$6,592 million), ¥884,530 million and ¥938,564 million, whose fair values are extremely difficult to be determined, as of March 31, 2017, 2016 and 2015, respectively, are not included.
176
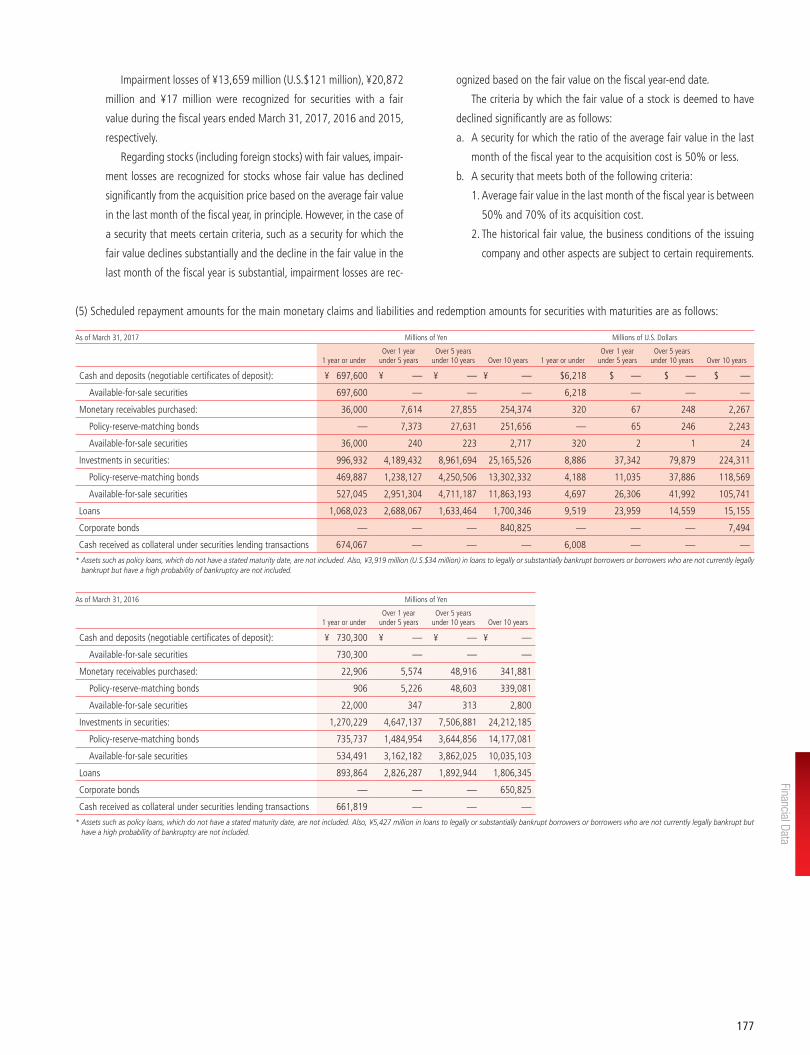
Impairment losses of ¥13,659 million (U.S.$121 million), ¥20,872
million and ¥17 million were recognized for securities with a fair
value during the fiscal years ended March 31, 2017, 2016 and 2015,
respectively.
Regarding stocks (including foreign stocks) with fair values, impair-
ment losses are recognized for stocks whose fair value has declined
significantly from the acquisition price based on the average fair value
in the last month of the fiscal year, in principle. However, in the case of
a security that meets certain criteria, such as a security for which the
fair value declines substantially and the decline in the fair value in the
last month of the fiscal year is substantial, impairment losses are rec-
ognized based on the fair value on the fiscal year-end date.
The criteria by which the fair value of a stock is deemed to have
declined significantly are as follows:
a. A security for which the ratio of the average fair value in the last
month of the fiscal year to the acquisition cost is 50% or less.
b. A security that meets both of the following criteria:
1. Average fair value in the last month of the fiscal year is between
50% and 70% of its acquisition cost.
2. The historical fair value, the business conditions of the issuing
company and other aspects are subject to certain requirements.
(5) Scheduled repayment amounts for the main monetary claims and liabilities and redemption amounts for securities with maturities are as follows:
As of March 31, 2017 Millions of Yen Millions of U.S. Dollars
1 year or underOver 1 year
under 5 yearsOver 5 years
under 10 years Over 10 years 1 year or underOver 1 year
under 5 yearsOver 5 years
under 10 years Over 10 years
Cash and deposits (negotiable certificates of deposit): ¥ 697,600 ¥ — ¥ — ¥ — $6,218 $ — $ — $ —
Available-for-sale securities 697,600 — — — 6,218 — — —
Monetary receivables purchased: 36,000 7,614 27,855 254,374 320 67 248 2,267
Policy-reserve-matching bonds — 7,373 27,631 251,656 — 65 246 2,243
Available-for-sale securities 36,000 240 223 2,717 320 2 1 24
Investments in securities: 996,932 4,189,432 8,961,694 25,165,526 8,886 37,342 79,879 224,311
Policy-reserve-matching bonds 469,887 1,238,127 4,250,506 13,302,332 4,188 11,035 37,886 118,569
Available-for-sale securities 527,045 2,951,304 4,711,187 11,863,193 4,697 26,306 41,992 105,741
Loans 1,068,023 2,688,067 1,633,464 1,700,346 9,519 23,959 14,559 15,155
Corporate bonds — — — 840,825 — — — 7,494
Cash received as collateral under securities lending transactions 674,067 — — — 6,008 — — —
* Assets such as policy loans, which do not have a stated maturity date, are not included. Also, ¥3,919 million (U.S.$34 million) in loans to legally or substantially bankrupt borrowers or borrowers who are not currently legally bankrupt but have a high probability of bankruptcy are not included.
As of March 31, 2016 Millions of Yen
1 year or underOver 1 year
under 5 yearsOver 5 years
under 10 years Over 10 years
Cash and deposits (negotiable certificates of deposit): ¥ 730,300 ¥ — ¥ — ¥ —
Available-for-sale securities 730,300 — — —
Monetary receivables purchased: 22,906 5,574 48,916 341,881
Policy-reserve-matching bonds 906 5,226 48,603 339,081
Available-for-sale securities 22,000 347 313 2,800
Investments in securities: 1,270,229 4,647,137 7,506,881 24,212,185
Policy-reserve-matching bonds 735,737 1,484,954 3,644,856 14,177,081
Available-for-sale securities 534,491 3,162,182 3,862,025 10,035,103
Loans 893,864 2,826,287 1,892,944 1,806,345
Corporate bonds — — — 650,825
Cash received as collateral under securities lending transactions 661,819 — — —
* Assets such as policy loans, which do not have a stated maturity date, are not included. Also, ¥5,427 million in loans to legally or substantially bankrupt borrowers or borrowers who are not currently legally bankrupt but have a high probability of bankruptcy are not included.
Financial Data
177
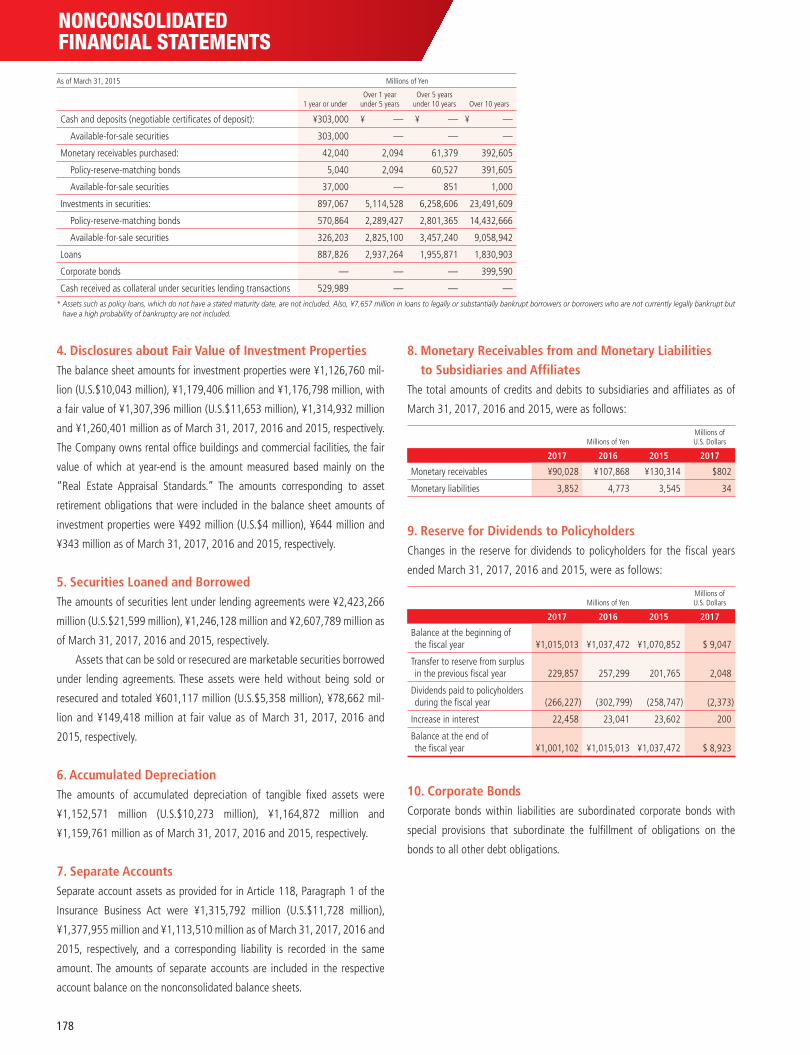
NONCONSOLIDATED FINANCIAL STATEMENTS
As of March 31, 2015 Millions of Yen
1 year or underOver 1 year
under 5 yearsOver 5 years
under 10 years Over 10 years
Cash and deposits (negotiable certificates of deposit): ¥303,000 ¥ — ¥ — ¥ —
Available-for-sale securities 303,000 — — —
Monetary receivables purchased: 42,040 2,094 61,379 392,605
Policy-reserve-matching bonds 5,040 2,094 60,527 391,605
Available-for-sale securities 37,000 — 851 1,000
Investments in securities: 897,067 5,114,528 6,258,606 23,491,609
Policy-reserve-matching bonds 570,864 2,289,427 2,801,365 14,432,666
Available-for-sale securities 326,203 2,825,100 3,457,240 9,058,942
Loans 887,826 2,937,264 1,955,871 1,830,903
Corporate bonds — — — 399,590
Cash received as collateral under securities lending transactions 529,989 — — —
* Assets such as policy loans, which do not have a stated maturity date, are not included. Also, ¥7,657 million in loans to legally or substantially bankrupt borrowers or borrowers who are not currently legally bankrupt but have a high probability of bankruptcy are not included.
4. Disclosures about Fair Value of Investment PropertiesThe balance sheet amounts for investment properties were ¥1,126,760 mil-
lion (U.S.$10,043 million), ¥1,179,406 million and ¥1,176,798 million, with
a fair value of ¥1,307,396 million (U.S.$11,653 million), ¥1,314,932 million
and ¥1,260,401 million as of March 31, 2017, 2016 and 2015, respectively.
The Company owns rental office buildings and commercial facilities, the fair
value of which at year-end is the amount measured based mainly on the
“Real Estate Appraisal Standards.” The amounts corresponding to asset
retirement obligations that were included in the balance sheet amounts of
investment properties were ¥492 million (U.S.$4 million), ¥644 million and
¥343 million as of March 31, 2017, 2016 and 2015, respectively.
5. Securities Loaned and BorrowedThe amounts of securities lent under lending agreements were ¥2,423,266
million (U.S.$21,599 million), ¥1,246,128 million and ¥2,607,789 million as
of March 31, 2017, 2016 and 2015, respectively.
Assets that can be sold or resecured are marketable securities borrowed
under lending agreements. These assets were held without being sold or
resecured and totaled ¥601,117 million (U.S.$5,358 million), ¥78,662 mil-
lion and ¥149,418 million at fair value as of March 31, 2017, 2016 and
2015, respectively.
6. Accumulated DepreciationThe amounts of accumulated depreciation of tangible fixed assets were
¥1,152,571 million (U.S.$10,273 million), ¥1,164,872 million and
¥1,159,761 million as of March 31, 2017, 2016 and 2015, respectively.
7. Separate AccountsSeparate account assets as provided for in Article 118, Paragraph 1 of the
Insurance Business Act were ¥1,315,792 million (U.S.$11,728 million),
¥1,377,955 million and ¥1,113,510 million as of March 31, 2017, 2016 and
2015, respectively, and a corresponding liability is recorded in the same
amount. The amounts of separate accounts are included in the respective
account balance on the nonconsolidated balance sheets.
8. Monetary Receivables from and Monetary Liabilities to Subsidiaries and Affiliates
The total amounts of credits and debits to subsidiaries and affiliates as of
March 31, 2017, 2016 and 2015, were as follows:
Millions of YenMillions of U.S. Dollars
2017 2016 2015 2017
Monetary receivables ¥90,028 ¥107,868 ¥130,314 $802
Monetary liabilities 3,852 4,773 3,545 34
9. Reserve for Dividends to PolicyholdersChanges in the reserve for dividends to policyholders for the fiscal years
ended March 31, 2017, 2016 and 2015, were as follows:
Millions of YenMillions of U.S. Dollars
2017 2016 2015 2017
Balance at the beginning of the fiscal year ¥1,015,013 ¥1,037,472 ¥1,070,852 $ 9,047
Transfer to reserve from surplus in the previous fiscal year 229,857 257,299 201,765 2,048
Dividends paid to policyholders during the fiscal year (266,227 ) (302,799 ) (258,747 ) (2,373 )
Increase in interest 22,458 23,041 23,602 200
Balance at the end of the fiscal year ¥1,001,102 ¥1,015,013 ¥1,037,472 $ 8,923
10. Corporate BondsCorporate bonds within liabilities are subordinated corporate bonds with
special provisions that subordinate the fulfillment of obligations on the
bonds to all other debt obligations.
178
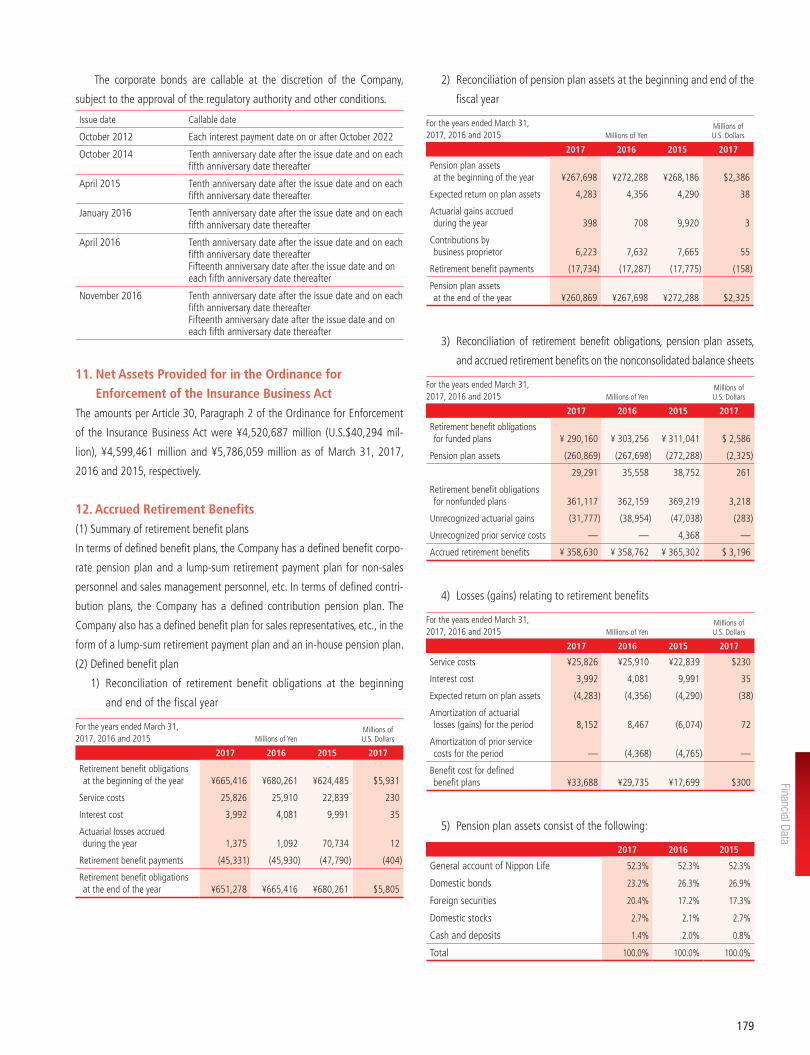
The corporate bonds are callable at the discretion of the Company,
subject to the approval of the regulatory authority and other conditions.
Issue date Callable date
October 2012 Each interest payment date on or after October 2022
October 2014 Tenth anniversary date after the issue date and on each fifth anniversary date thereafter
April 2015 Tenth anniversary date after the issue date and on each fifth anniversary date thereafter
January 2016 Tenth anniversary date after the issue date and on each fifth anniversary date thereafter
April 2016 Tenth anniversary date after the issue date and on each fifth anniversary date thereafterFifteenth anniversary date after the issue date and on each fifth anniversary date thereafter
November 2016 Tenth anniversary date after the issue date and on each fifth anniversary date thereafterFifteenth anniversary date after the issue date and on each fifth anniversary date thereafter
11. Net Assets Provided for in the Ordinance for Enforcement of the Insurance Business Act
The amounts per Article 30, Paragraph 2 of the Ordinance for Enforcement
of the Insurance Business Act were ¥4,520,687 million (U.S.$40,294 mil-
lion), ¥4,599,461 million and ¥5,786,059 million as of March 31, 2017,
2016 and 2015, respectively.
12. Accrued Retirement Benefits(1) Summary of retirement benefit plans
In terms of defined benefit plans, the Company has a defined benefit corpo-
rate pension plan and a lump-sum retirement payment plan for non-sales
personnel and sales management personnel, etc. In terms of defined contri-
bution plans, the Company has a defined contribution pension plan. The
Company also has a defined benefit plan for sales representatives, etc., in the
form of a lump-sum retirement payment plan and an in-house pension plan.
(2) Defined benefit plan
1) Reconciliation of retirement benefit obligations at the beginning
and end of the fiscal year
For the years ended March 31, 2017, 2016 and 2015 Millions of Yen
Millions of U.S. Dollars
2017 2016 2015 2017
Retirement benefit obligations at the beginning of the year ¥665,416 ¥680,261 ¥624,485 $5,931
Service costs 25,826 25,910 22,839 230
Interest cost 3,992 4,081 9,991 35
Actuarial losses accrued during the year 1,375 1,092 70,734 12
Retirement benefit payments (45,331 ) (45,930 ) (47,790 ) (404 )
Retirement benefit obligations at the end of the year ¥651,278 ¥665,416 ¥680,261 $5,805
2) Reconciliation of pension plan assets at the beginning and end of the
fiscal year
For the years ended March 31, 2017, 2016 and 2015 Millions of Yen
Millions of U.S. Dollars
2017 2016 2015 2017
Pension plan assets at the beginning of the year ¥267,698 ¥272,288 ¥268,186 $2,386
Expected return on plan assets 4,283 4,356 4,290 38
Actuarial gains accrued during the year 398 708 9,920 3
Contributions by business proprietor 6,223 7,632 7,665 55
Retirement benefit payments (17,734 ) (17,287 ) (17,775 ) (158 )
Pension plan assets at the end of the year ¥260,869 ¥267,698 ¥272,288 $2,325
3) Reconciliation of retirement benefit obligations, pension plan assets,
and accrued retirement benefits on the nonconsolidated balance sheets
For the years ended March 31, 2017, 2016 and 2015 Millions of Yen
Millions of U.S. Dollars
2017 2016 2015 2017
Retirement benefit obligations for funded plans ¥ 290,160 ¥ 303,256 ¥ 311,041 $ 2,586
Pension plan assets (260,869 ) (267,698 ) (272,288 ) (2,325 )
29,291 35,558 38,752 261
Retirement benefit obligations for nonfunded plans 361,117 362,159 369,219 3,218
Unrecognized actuarial gains (31,777 ) (38,954 ) (47,038 ) (283 )
Unrecognized prior service costs — — 4,368 —
Accrued retirement benefits ¥ 358,630 ¥ 358,762 ¥ 365,302 $ 3,196
4) Losses (gains) relating to retirement benefits
For the years ended March 31, 2017, 2016 and 2015 Millions of Yen
Millions of U.S. Dollars
2017 2016 2015 2017
Service costs ¥25,826 ¥25,910 ¥22,839 $230
Interest cost 3,992 4,081 9,991 35
Expected return on plan assets (4,283 ) (4,356 ) (4,290 ) (38 )
Amortization of actuarial losses (gains) for the period 8,152 8,467 (6,074 ) 72
Amortization of prior service costs for the period — (4,368 ) (4,765 ) —
Benefit cost for defined benefit plans ¥33,688 ¥29,735 ¥17,699 $300
5) Pension plan assets consist of the following:
2017 2016 2015
General account of Nippon Life 52.3% 52.3% 52.3%
Domestic bonds 23.2% 26.3% 26.9%
Foreign securities 20.4% 17.2% 17.3%
Domestic stocks 2.7% 2.1% 2.7%
Cash and deposits 1.4% 2.0% 0.8%
Total 100.0% 100.0% 100.0%
Financial Data
179
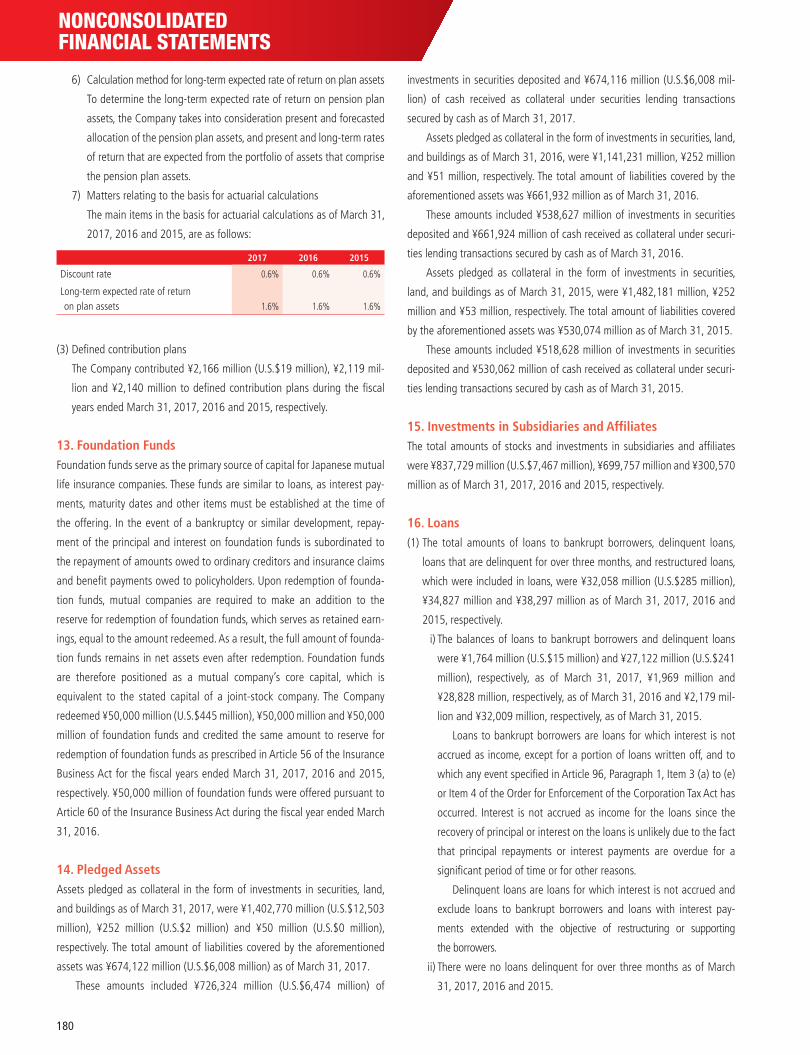
NONCONSOLIDATED FINANCIAL STATEMENTS
6) Calculation method for long-term expected rate of return on plan assets
To determine the long-term expected rate of return on pension plan
assets, the Company takes into consideration present and forecasted
allocation of the pension plan assets, and present and long-term rates
of return that are expected from the portfolio of assets that comprise
the pension plan assets.
7) Matters relating to the basis for actuarial calculations
The main items in the basis for actuarial calculations as of March 31,
2017, 2016 and 2015, are as follows:
2017 2016 2015
Discount rate 0.6% 0.6% 0.6%
Long-term expected rate of return on plan assets 1.6% 1.6% 1.6%
(3) Defined contribution plans
The Company contributed ¥2,166 million (U.S.$19 million), ¥2,119 mil-
lion and ¥2,140 million to defined contribution plans during the fiscal
years ended March 31, 2017, 2016 and 2015, respectively.
13. Foundation FundsFoundation funds serve as the primary source of capital for Japanese mutual
life insurance companies. These funds are similar to loans, as interest pay-
ments, maturity dates and other items must be established at the time of
the offering. In the event of a bankruptcy or similar development, repay-
ment of the principal and interest on foundation funds is subordinated to
the repayment of amounts owed to ordinary creditors and insurance claims
and benefit payments owed to policyholders. Upon redemption of founda-
tion funds, mutual companies are required to make an addition to the
reserve for redemption of foundation funds, which serves as retained earn-
ings, equal to the amount redeemed. As a result, the full amount of founda-
tion funds remains in net assets even after redemption. Foundation funds
are therefore positioned as a mutual company’s core capital, which is
equivalent to the stated capital of a joint-stock company. The Company
redeemed ¥50,000 million (U.S.$445 million), ¥50,000 million and ¥50,000
million of foundation funds and credited the same amount to reserve for
redemption of foundation funds as prescribed in Article 56 of the Insurance
Business Act for the fiscal years ended March 31, 2017, 2016 and 2015,
respectively. ¥50,000 million of foundation funds were offered pursuant to
Article 60 of the Insurance Business Act during the fiscal year ended March
31, 2016.
14. Pledged AssetsAssets pledged as collateral in the form of investments in securities, land,
and buildings as of March 31, 2017, were ¥1,402,770 million (U.S.$12,503
million), ¥252 million (U.S.$2 million) and ¥50 million (U.S.$0 million),
respectively. The total amount of liabilities covered by the aforementioned
assets was ¥674,122 million (U.S.$6,008 million) as of March 31, 2017.
These amounts included ¥726,324 million (U.S.$6,474 million) of
investments in securities deposited and ¥674,116 million (U.S.$6,008 mil-
lion) of cash received as collateral under securities lending transactions
secured by cash as of March 31, 2017.
Assets pledged as collateral in the form of investments in securities, land,
and buildings as of March 31, 2016, were ¥1,141,231 million, ¥252 million
and ¥51 million, respectively. The total amount of liabilities covered by the
aforementioned assets was ¥661,932 million as of March 31, 2016.
These amounts included ¥538,627 million of investments in securities
deposited and ¥661,924 million of cash received as collateral under securi-
ties lending transactions secured by cash as of March 31, 2016.
Assets pledged as collateral in the form of investments in securities,
land, and buildings as of March 31, 2015, were ¥1,482,181 million, ¥252
million and ¥53 million, respectively. The total amount of liabilities covered
by the aforementioned assets was ¥530,074 million as of March 31, 2015.
These amounts included ¥518,628 million of investments in securities
deposited and ¥530,062 million of cash received as collateral under securi-
ties lending transactions secured by cash as of March 31, 2015.
15. Investments in Subsidiaries and AffiliatesThe total amounts of stocks and investments in subsidiaries and affiliates
were ¥837,729 million (U.S.$7,467 million), ¥699,757 million and ¥300,570
million as of March 31, 2017, 2016 and 2015, respectively.
16. Loans(1) The total amounts of loans to bankrupt borrowers, delinquent loans,
loans that are delinquent for over three months, and restructured loans,
which were included in loans, were ¥32,058 million (U.S.$285 million),
¥34,827 million and ¥38,297 million as of March 31, 2017, 2016 and
2015, respectively.
i) The balances of loans to bankrupt borrowers and delinquent loans
were ¥1,764 million (U.S.$15 million) and ¥27,122 million (U.S.$241
million), respectively, as of March 31, 2017, ¥1,969 million and
¥28,828 million, respectively, as of March 31, 2016 and ¥2,179 mil-
lion and ¥32,009 million, respectively, as of March 31, 2015.
Loans to bankrupt borrowers are loans for which interest is not
accrued as income, except for a portion of loans written off, and to
which any event specified in Article 96, Paragraph 1, Item 3 (a) to (e)
or Item 4 of the Order for Enforcement of the Corporation Tax Act has
occurred. Interest is not accrued as income for the loans since the
recovery of principal or interest on the loans is unlikely due to the fact
that principal repayments or interest payments are overdue for a
significant period of time or for other reasons.
Delinquent loans are loans for which interest is not accrued and
exclude loans to bankrupt borrowers and loans with interest pay-
ments extended with the objective of restructuring or supporting
the borrowers.
ii) There were no loans delinquent for over three months as of March
31, 2017, 2016 and 2015.
180
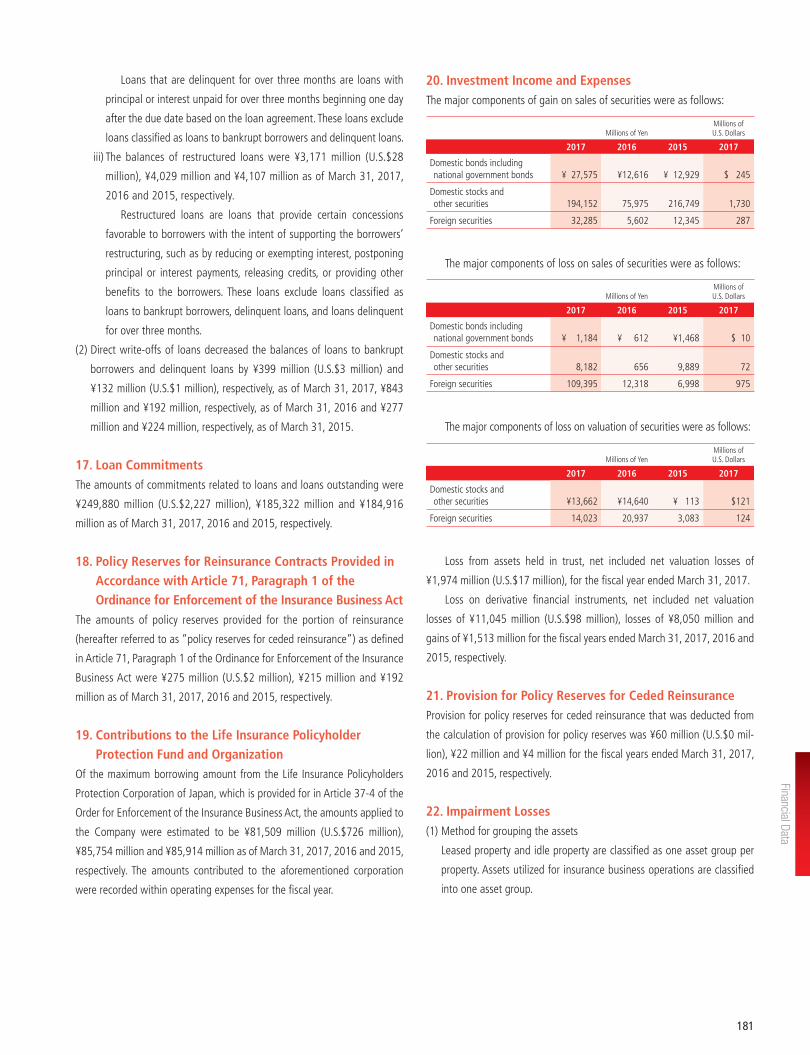
Loans that are delinquent for over three months are loans with
principal or interest unpaid for over three months beginning one day
after the due date based on the loan agreement. These loans exclude
loans classified as loans to bankrupt borrowers and delinquent loans.
iii) The balances of restructured loans were ¥3,171 million (U.S.$28
million), ¥4,029 million and ¥4,107 million as of March 31, 2017,
2016 and 2015, respectively.
Restructured loans are loans that provide certain concessions
favorable to borrowers with the intent of supporting the borrowers’
restructuring, such as by reducing or exempting interest, postponing
principal or interest payments, releasing credits, or providing other
benefits to the borrowers. These loans exclude loans classified as
loans to bankrupt borrowers, delinquent loans, and loans delinquent
for over three months.
(2) Direct write-offs of loans decreased the balances of loans to bankrupt
borrowers and delinquent loans by ¥399 million (U.S.$3 million) and
¥132 million (U.S.$1 million), respectively, as of March 31, 2017, ¥843
million and ¥192 million, respectively, as of March 31, 2016 and ¥277
million and ¥224 million, respectively, as of March 31, 2015.
17. Loan CommitmentsThe amounts of commitments related to loans and loans outstanding were
¥249,880 million (U.S.$2,227 million), ¥185,322 million and ¥184,916
million as of March 31, 2017, 2016 and 2015, respectively.
18. Policy Reserves for Reinsurance Contracts Provided in Accordance with Article 71, Paragraph 1 of the Ordinance for Enforcement of the Insurance Business Act
The amounts of policy reserves provided for the portion of reinsurance
(hereafter referred to as “policy reserves for ceded reinsurance”) as defined
in Article 71, Paragraph 1 of the Ordinance for Enforcement of the Insurance
Business Act were ¥275 million (U.S.$2 million), ¥215 million and ¥192
million as of March 31, 2017, 2016 and 2015, respectively.
19. Contributions to the Life Insurance Policyholder Protection Fund and Organization
Of the maximum borrowing amount from the Life Insurance Policyholders
Protection Corporation of Japan, which is provided for in Article 37-4 of the
Order for Enforcement of the Insurance Business Act, the amounts applied to
the Company were estimated to be ¥81,509 million (U.S.$726 million),
¥85,754 million and ¥85,914 million as of March 31, 2017, 2016 and 2015,
respectively. The amounts contributed to the aforementioned corporation
were recorded within operating expenses for the fiscal year.
20. Investment Income and ExpensesThe major components of gain on sales of securities were as follows:
Millions of YenMillions of U.S. Dollars
2017 2016 2015 2017
Domestic bonds including national government bonds ¥ 27,575 ¥12,616 ¥ 12,929 $ 245
Domestic stocks and other securities 194,152 75,975 216,749 1,730
Foreign securities 32,285 5,602 12,345 287
The major components of loss on sales of securities were as follows:
Millions of YenMillions of U.S. Dollars
2017 2016 2015 2017
Domestic bonds including national government bonds ¥ 1,184 ¥ 612 ¥1,468 $ 10
Domestic stocks and other securities 8,182 656 9,889 72
Foreign securities 109,395 12,318 6,998 975
The major components of loss on valuation of securities were as follows:
Millions of YenMillions of U.S. Dollars
2017 2016 2015 2017
Domestic stocks and other securities ¥13,662 ¥14,640 ¥ 113 $121
Foreign securities 14,023 20,937 3,083 124
Loss from assets held in trust, net included net valuation losses of
¥1,974 million (U.S.$17 million), for the fiscal year ended March 31, 2017.
Loss on derivative financial instruments, net included net valuation
losses of ¥11,045 million (U.S.$98 million), losses of ¥8,050 million and
gains of ¥1,513 million for the fiscal years ended March 31, 2017, 2016 and
2015, respectively.
21. Provision for Policy Reserves for Ceded ReinsuranceProvision for policy reserves for ceded reinsurance that was deducted from
the calculation of provision for policy reserves was ¥60 million (U.S.$0 mil-
lion), ¥22 million and ¥4 million for the fiscal years ended March 31, 2017,
2016 and 2015, respectively.
22. Impairment Losses(1) Method for grouping the assets
Leased property and idle property are classified as one asset group per
property. Assets utilized for insurance business operations are classified
into one asset group.
Financial Data
181
NONCONSOLIDATED FINANCIAL STATEMENTS
(2) Circumstances causing impairment losses
The Company observed a marked decrease in profitability or fair value in
some of the fixed asset groups. The book value of fixed assets was
reduced to the recoverable amount and impairment losses were recog-
nized as extraordinary losses for the fiscal years ended March 31, 2017,
2016 and 2015.
(3) Breakdown of asset groups that recognized impairment losses:
For the year ended March 31, 2017Millions of Yen
Purpose of use LandLand lease
rights Buildings Total
Leased property ¥1,866 ¥— ¥608 ¥2,475
Idle property 1,484 — 368 1,852
Total ¥3,351 ¥— ¥976 ¥4,328
For the year ended March 31, 2016Millions of Yen
Purpose of use LandLand lease
rights Buildings Total
Leased property ¥1,013 ¥— ¥ 439 ¥1,452
Idle property 1,237 — 2,100 3,338
Total ¥2,251 ¥— ¥2,540 ¥4,791
For the year ended March 31, 2015Millions of Yen
Purpose of use LandLand lease
rights Buildings Total
Leased property ¥ 1,846 ¥1,489 ¥2,242 ¥ 5,578
Idle property 13,700 — 628 14,329
Total ¥15,547 ¥1,489 ¥2,871 ¥19,908
For the year ended March 31, 2017Millions of U.S. Dollars
Purpose of use LandLand lease
rights Buildings Total
Leased property $16 $— $5 $22
Idle property 13 — 3 16
Total $29 $— $8 $38
(4) Calculation method of recoverable amount
The recoverable amount used for the measurement of impairment losses
is based on the net realizable value upon sales of the assets or the dis-
counted future cash flows.
The discount rate used in the calculation of future cash flows is 4.0%
for the fiscal years ended March 31, 2017, 2016 and 2015. Net realiz-
able values are determined based on appraisals performed in accordance
with the “Real Estate Appraisal Standards” or posted land prices.
23. Deferred Tax Assets and Liabilities(1) Deferred tax assets/liabilities consisted of the following:
Millions of YenMillions of U.S. Dollars
2017 2016 2015 2017
Deferred tax assets ¥ 1,330,324 ¥ 1,266,576 ¥ 1,254,315 $ 11,857
Valuation allowance for deferred tax assets (53,509 ) (47,177 ) (39,012 ) (476 )
Subtotal 1,276,815 1,219,399 1,215,303 11,380
Deferred tax liabilities (1,840,138 ) (1,863,984 ) (2,447,032 ) (16,401 )
Net deferred tax liabilities ¥ (563,323 ) ¥ (644,585 ) ¥(1,231,729 ) $ (5,021 )
The major components resulting in deferred tax assets/liabilities were
as follows:
Millions of YenMillions of U.S. Dollars
2017 2016 2015 2017
Deferred tax assets:
Policy reserves and other reserves ¥ 785,164 ¥ 763,273 ¥ 758,723 $ 6,998
Reserve for price fluctuations in investments in securities 312,176 265,635 224,272 2,782
Accrued retirement benefits 100,141 100,256 105,207 892
Allowance for doubtful accounts — — 2,234 —
Deferred tax liabilities:
Net unrealized gains on available-for-sale securities ¥1,764,473 ¥1,808,376 ¥2,403,751 $15,727
(2) The statutory tax rate was 28.2% for the fiscal year ended March 31, 2017,
28.8% for the fiscal year ended March 31, 2016 and 30.7% for the fiscal
year ended March 31, 2015. The main factors for the difference between
the statutory tax rates and the effective income tax rates were as follows:
2017 2016 2015
Reserve for dividends to policyholders (17.0)% (18.4)% (18.4)%
Impact from a change in the tax rate — 9.4 % 16.6 %
(3) In conjunction with the enactment of the “Act for Partial Revision to the
Income Tax Act” (Act No. 15 of 2016), the statutory tax rate applied to
the calculation of deferred tax assets and deferred tax liabilities was
changed from 28.8% to 28.2% for collections and payments expected to
be made in the period from April 1, 2016 to March 31, 2018, and to
27.9% for collections and payments expected to be made on or after
April 1, 2018.
As a result of this change, as of March 31, 2016, deferred tax liabili-
ties decreased by ¥23,274 million and deferred tax liabilities for land
revaluation decreased by ¥3,528 million, while net unrealized gains on
available-for-sale securities increased by ¥58,521 million and land
revaluation losses increased by ¥3,528 million. At the same time, income
taxes—deferred increased by ¥33,771 million.
182
In conjunction with the promulgation of the “Act for Partial Revision
to the Income Tax Act” (Act No. 9 of 2015), the statutory tax rate applied
to the calculation of deferred tax assets and deferred tax liabilities of
30.7% was changed to 28.8%.
As a result of this change, as of March 31, 2015, deferred tax liabili-
ties decreased by ¥81,259 million and deferred tax liabilities for land
revaluation decreased by ¥7,615 million, while net unrealized gains on
available-for-sale securities increased by ¥158,817 million and land
revaluation losses increased by ¥7,615 million. At the same time, income
taxes—deferred increased by ¥71,392 million.
24. Transactions with Subsidiaries and AffiliatesThe total income and expenses from transactions with subsidiaries and
affiliates for the fiscal years ended March 31, 2017, 2016 and 2015, were
as follows:
Millions of YenMillions of U.S. Dollars
2017 2016 2015 2017
Total income ¥33,263 ¥17,168 ¥18,423 $296
Total expenses 34,913 33,135 29,908 311
25. Subsequent Events(1) On April 19, 2017, the Company issued corporate bonds as follows:
Yen-denominated subordinated and unsecured corporate bonds due
2047 with interest deferral options and call options (the corporate
bonds were first issued to qualified institutional investors and a small
number of investors in domestic securities markets with a restriction on
a bond split)
Issue price 100% of principal amount
Principal amount ¥100,000 million (U.S.$891 million)
Interest rate A fixed rate of 1.05% per annum before April 19, 2027, and a fixed rate with step-up thereafter (reset every 5 years).
Maturity April 19, 2047 (The corporate bonds are callable on April 19, 2027, and on each fifth anniversary date thereafter at the discretion of the Company, subject to prior approval by the regulatory authority.)
Collateral and guarantees
The corporate bonds are not secured or guaranteed, and there are no specific assets pledged for them.
Use of funds General working capital
(2) On May 24, 2017, the Company reached an agreement with Reliance
Capital Limited, the parent company of Reliance Nippon Life Asset Man-
agement Limited (“Reliance Asset”), to acquire an additional equity
interest of 4.43% in Reliance Asset (44.57% is owned by the Company
as of March 31, 2017). This transaction was completed on July 13, 2017.
(3) The nonconsolidated proposed appropriations of surplus for the fiscal
year ended March 31, 2017, were approved as planned at the annual
meeting of the representatives of policyholders held on July 4, 2017.
(4) During the annual meeting of the representatives of policyholders held
on July 4, 2017, a resolution was passed to partially amend the Articles
of Incorporation in connection with an issuance of foundation funds of
¥50,000 million (U.S.$445 million) during the fiscal year ending March
31, 2018.
Financial Data
183
INDEpENDENT AuDITOr’S rEpOrT(NONCONSOLIDATED FINANCIAL STATEMENTS)
184
INDEpENDENT AuDITOr’S rEpOrT (NONCONSOLIDATED FINANCIAL STATEMENTS)
185
Financial Data