Consolidated Financial Statements and Notes...Consolidated Financial Statements and Notes Notes to...
43
Consolidated Financial Statements and Notes
Transcript of Consolidated Financial Statements and Notes...Consolidated Financial Statements and Notes Notes to...

Consolidated Financial Statements and Notes
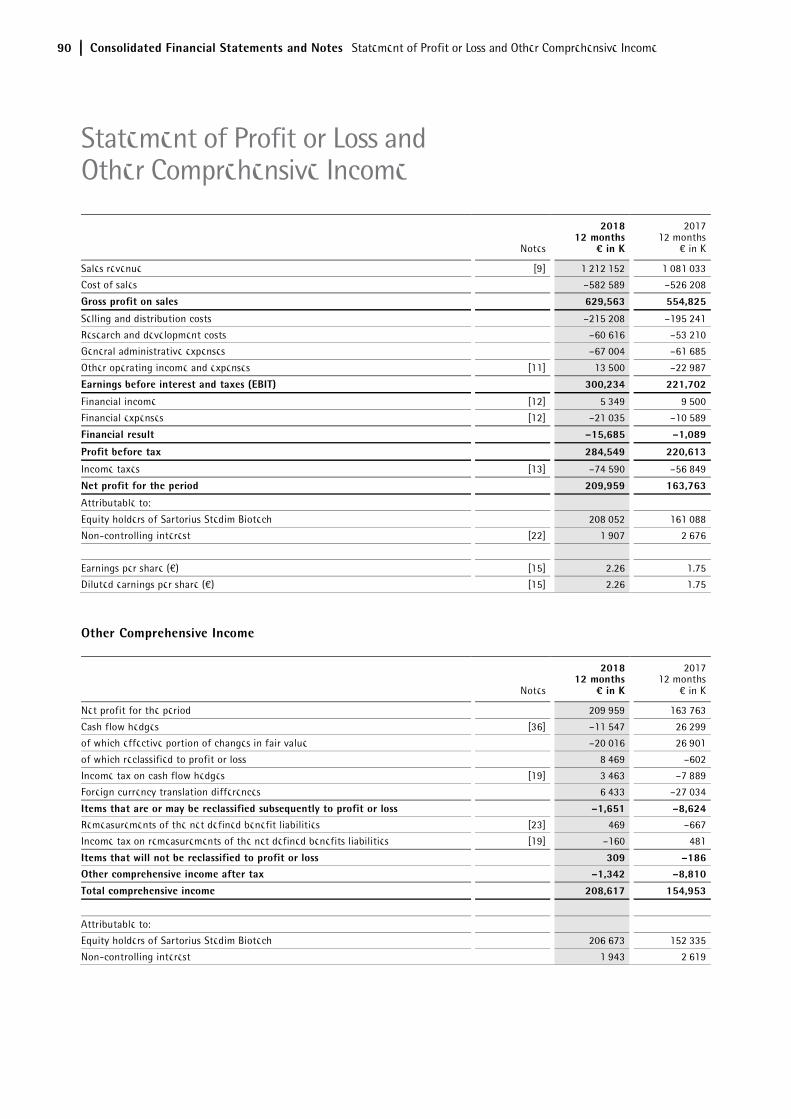
90 Consolidated Financial Statements and Notes Statement of Profit or Loss and Other Comprehensive Income
Notes
2018 12 months
¤ in K
2017 12 months
€ in K
Sales revenue [9] 1,212,152 1,081,033
Cost of sales –582,589 –526,208
Gross profit on sales 629,563 554,825
Selling and distribution costs –215,208 –195,241
Research and development costs –60,616 –53,210
General administrative expenses –67,004 –61,685
Other operating income and expenses [11] 13,500 –22,987
Earnings before interest and taxes (EBIT) 300,234 221,702
Financial income [12] 5,349 9,500
Financial expenses [12] –21,035 –10,589
Financial result –15,685 –1,089
Profit before tax 284,549 220,613
Income taxes [13] –74,590 –56,849
Net profit for the period 209,959 163,763
Attributable to:
Equity holders of Sartorius Stedim Biotech 208,052 161,088
Non-controlling interest [22] 1,907 2,676
Earnings per share (€) [15] 2.26 1.75
Diluted earnings per share (€) [15] 2.26 1.75
Other Comprehensive Income
Notes
2018 12 months
¤ in K
2017 12 months
€ in K
Net profit for the period 209,959 163,763
Cash flow hedges [36] –11,547 26,299
of which effective portion of changes in fair value –20,016 26,901
of which reclassified to profit or loss 8,469 –602
Income tax on cash flow hedges [19] 3,463 –7,889
Foreign currency translation differences 6,433 –27,034
Items that are or may be reclassified subsequently to profit or loss –1,651 –8,624 Remeasurements of the net defined benefit liabilities [23] 469 –667
Income tax on remeasurements of the net defined benefits liabilities [19] –160 481
Items that will not be reclassified to profit or loss 309 –186 Other comprehensive income after tax –1,342 –8,810
Total comprehensive income 208,617 154,953
Attributable to:
Equity holders of Sartorius Stedim Biotech 206,673 152,335
Non-controlling interest 1,943 2,619
Statement of Profit or Loss and Other Comprehensive Income

Consolidated Financial Statements and Notes Statement of Financial Position
91
Notes Dec. 31, 2018
¤ in K Dec. 31, 2017
€ in K
Non-current assets Goodwill [16] 384,695 386,045
Other Intangible Assets [16] 177,492 172,906
Property, plant and equipment [17] 435,980 331,295
Financial Assets 5,644 11,808
Other Assets 632 18
Deferred tax assets [19] 14,490 10,989
1,018,932 913,060 Current assets Inventories [20] 252,002 185,604
Trade receivables [28] 220,231 211,616
Other financial assets [29] 22,036 20,049
Current tax assets 12,950 24,465
Other assets 21,334 16,561
Cash and cash equivalents [27] 23,975 32,552
552,529 490,845
Total assets 1,571,461 1,403,905
Equity Equity attributable to SSB S.A. shareholders 1,036,398 872,028 Issued capital [21] 18,436 18,436
Capital reserves 231,526 231,526
Retained earnings (including net profit) 786,436 622,066
Non-controlling interest [22] 8,476 7,426 1,044,874 879,454 Non-current liabilities Pension provisions [23] 35,595 35,446
Other provisions [24] 2,877 3,103
Loans and borrowings [30] 43,125 46,250
Finance lease liabilities 14,976 15,829
Other financial liabilities [31] 8,889 30,392
Deferred tax liabilities [19] 39,150 42,987
144,612 174,007 Current liabilities Provisions [24] 12,283 9,558
Trade payables [32] 154,568 117,959
Loans and borrowings [30] 89,817 95,933
Finance lease liabilities 1,717 1,658
Other financial liabilities [33] 14,312 34,964
Employee benefits 39,335 31,895
Current tax liabilities 33,070 31,791
Other liabilities 36,873 26,686
381,975 350,444
Total equity and liabilities 1,571,461 1,403,905
Statement of Financial Position

92 Consolidated Financial Statements and Notes Statement of Cash Flows
Notes 2018 12 months
¤ in K
2017 12 months
€ in K
Profit before tax 284,549 220,613
Financial result [12] 15,685 1,089
Earnings before interest and taxes (EBIT) 300,234 221,702 Depreciation | amortization of fixed assets [16][17] 60,914 50,678
Increase | decrease in provisions [23][24] 2,361 655
Income taxes paid [13] –65,537 –49,248
Other non-cash items –32,909 3,489
Gross cash flows from operating activities 265,062 227,276 Increase | decrease in receivables and other assets [28][29] –21,604 –46,316
Increase | decrease in inventories [20] –64,962 –21,091
Increase | decrease in liabilities [31][32][33] 48,793 14,819
Net cash flow from operating activities 227,289 174,689
Acquisitions of intangible and tangible assets [16][17] –176,540 –126,826
Net cash flow from investing activities –176,540 –126,826 Payments for acquisitions of consolidated subsidiaries and other business operations; net of cash acquired [8] 0 –68,100
Net cash flow from investing activities and acquisitions –176,540 –194,926
Interest received [12] 2,569 290
Interest paid and other financial charges [12] –8,995 –1,914
Dividends paid to:
- Shareholders of Sartorius Stedim Biotech SA –42,403 –38,713
- Non-controlling interest –783 –704
Gross cash flows from financing activities –49,612 –41,041 Proceeds from loans and borrowings raised [6][30] 12,829 60,994
Repayments of loans and borrowings [6][30] –22,811 –3,333
Net cash flow from financing activities –59,594 16,620
Net increase | decrease in cash and cash equivalents –8,845 –3,617
Cash and cash equivalents at the beginning of the period 32,552 34,756
Net effect of currency translation on cash and cash equivalents 268 1,414
Cash and cash equivalents at the end of the period 23,975 32,552
The Notes to the Consolidated Financial Statements are an integral part of these statements.
Statement of Cash Flows

Consolidated Financial Statements and Notes Statement of Changes in Equity 93
€ in K Issued
capital Capital
reserves Hedging reserves
Pension reserves
Retained earnings
Foreign currency
trans-lation
reserves Group equity
Non-control-
ling interest
Total equity
Balance at Jan. 1, 2017 18,083 231,526 –6,961 –10,983 490,275 36,064 758,004 5,551 763,555 Net profit for the period 0 0 0 0 161,088 0 161,088 2,676 163,763
Cash flow hedges 0 0 26,299 0 0 0 26,299 0 26,299
Remeasurements of the net defined benefit liabilities 0 0 0 –667 0 0 –667 0 –667
Foreign currency translation differences 0 0 0 0 0 –26,977 –26,977 –57 –27,034
Deferred taxes 0 0 –7,889 481 0 0 –7,408 0 –7,408
Other comprehensive income for the period 0 0 18,410 –186 0 –26,977 –8,753 –57 –8,810 Total comprehensive income 0 0 18,410 –186 161,088 –26,977 152,335 2,619 154,953 Dividends 0 0 0 0 –38,713 0 –38,713 –704 –39,417
Changes in non-controlling interest 0 0 0 0 40 0 40 –40 0
Other changes 353 0 0 0 9 0 362 0 362
Balance at Dec. 31, 2017 18,436 231,526 11,449 –11,169 612,699 9,087 872,027 7,426 879,453
Adjustment on adoption of IFRS 9 321 321 321
Balance at Jan. 1, 2018 18,436 231,526 11,449 –11,169 613,020 9,087 872,349 7,426 879,775 Net profit for the period 0 0 0 0 208,052 0 208,052 1,907 209,959
Cash flow hedges 0 0 –11,547 0 0 0 –11,547 0 –11,547
Remeasurements of the net defined benefit liabilities 0 0 0 469 0 0 469 0 469
Foreign currency translation differences 0 0 0 0 0 6,396 6,396 37 6,433
Deferred taxes 0 0 3,463 –160 0 0 3,303 0 3,303
Other comprehensive income for the period 0 0 –8,084 309 0 6,396 –1,379 37 –1,342 Total comprehensive income 0 0 –8,084 309 208,052 6,396 206,673 1,943 208,617 Dividends 0 0 0 0 –42,403 0 –42,403 –783 –43,186
Other changes 0 0 0 –221 0 –221 –110 –331
Balance at December 31, 2018 18,436 231,526 3,365 –10,860 778,448 15,483 1,036,398 8,476 1,044,874
Statement of Changes in Equity
94 Consolidated Financial Statements and Notes Notes to the Financial Statements
1. General Information
Sartorius Stedim Biotech is a leading international supplier of products and services that enable the biopharmaceutical industry to develop and manu-facture drugs safely and efficiently. As a total solutions provider, Sartorius Stedim Biotech offers a portfolio covering nearly all steps of biopharmaceutical manufacture. The company focuses on single-use technologies and value-added services to meet the rapidly changing technology requirements of the industry it serves. With its own manufacturing and R&D sites in Europe, North America and Asia and an international network of sales companies, Sartorius Stedim Biotech has a global reach.
Headquartered in Aubagne, France, Sartorius Stedim Biotech S.A. is listed on the Euronext Paris (ISIN code: FR 0000053266).
Sartorius Stedim Biotech S.A.'s ultimate parent company is Sartorius AG, headquartered in Goettingen, Germany, and listed at several German stock exchanges (ISIN codes: 0007165607 ordinary shares, 0007165631 preference shares).
In compliance with the European Regulation 1606/2002 of July 19, 2002, requiring listed companies to use International Accounting Standards, the consolidated financial statements of the Sartorius Stedim Biotech Group for the year ended December 31, 2018, are compliant with the Standards and Interpretations IFRS and IFRIC of the IASB as adopted by the European Union, which are available at the following site:
https://ec.europa.eu/commission/index_fr.
The consolidated financial statements are prepared in euros. Unless otherwise specified, all amounts are disclosed in thousands of euros (abbreviated as € in K). In some cases, the sum of the figures given in this report may not precisely equal the stated totals and percentages may not be exact due to rounding.
These consolidated financial statements were approved by the Board of Directors on February 7, 2019 and will be submitted for approval by the Shareholders' Meeting on March 26, 2019.
2. Effects of New Financial Reporting Standards
The following major new accounting rules were applicable for the first time to the present consolidated financial statements of the Group:
– IFRS 9, Financial Instruments
This standard changes the accounting for financial instruments. For detailed information on these changes and the initial application of IFRS 9, see note 26.
– IFRS 15, Revenue from Contracts with Customers
– Clarifications to IFRS 15, Revenue from Contracts with Customers
This standard defines when and in which amount revenue is recognized. For detailed information on the related changes and the initial application of IFRS 15, see note 9.
The following new accounting rules were applicable for the first time to the present financial statements and had no material impact on the presentation of the company’s financial position and financial performance:
– Annual Improvements to IFRSs 2014 - 2016 Cycle, Amendments to IFRS 1 and IAS 28
The amendments are related to the first-time application of IFRS (IFRS 1) as well as the option for venture capital organizations and similar organizations to measure investments in associates or joint ventures at fair value through profit or loss (IAS 28).
– Amendments to IFRS 2, Classification and Measurement of Share-based Payment Transactions
The amendments include clarifications with regard to the accounting for share-based payment transactions.
– Amendments to IAS 40, Transfers of Investment Property
The amendments intend to clarify the guidance regarding transfers to, or from, investment properties.
Notes to the Financial Statements

Consolidated Financial Statements and Notes Notes to the Financial Statements 95
– IFRIC 22, Foreign Currency Transactions and Advance Consideration
The interpretation addresses a question in relation to IAS 21. It clarifies which exchange rate is used for foreign currency transactions that involve advance payments received or made.
The following standards, interpretations and amendments were not yet applied to the consolidated financial statements of the reporting year as they had not yet been adopted by the EU or their application was not mandatory for 2018:
Standard | Interpretation Title
Applicable for financial years from1)
Endorsement by the
EU Commission
IFRS 14 Regulatory Deferral Accounts January 1, 2016 No
IFRS 16 Leases January 1, 2019 Yes
IFRIC 23 Uncertainty over Income Tax Treatments January 1, 2019 Yes
Amendments to IFRS 9 Prepayment Features with Negative Compensation January 1, 2019 Yes
Amendments to IFRS 28 Long-term Interests in Associates and Joint Ventures January 1, 2019 No
Amendments to IFRS 3, IFRS 11, IAS 12 and IAS 23
Annual Improvements to IFRSs 2015 - 2017 Cycle (issued in Dec. 2017) January 1, 2019 No
Amendments to IAS 19 Plan Amendment, Curtailment or Settlement January 1, 2019 No
Amendments to IAS 1 and IAS 8 Definition of Material January 1, 2020 No
Various Standards / Framework
Amendments to References to the Conceptual Framework in IFRS Standards January 1, 2020 No
Amendments to IFRS 3 Definition of a Business January 1, 2020 No
IFRS 17 Insurance Contracts January 1, 2021 No
Amendments to IFRS 10 and IAS 28
Sale or Contribution of Assets between an Investor and its Associate or Joint Venture n/a No
1) These are required to be applied once they are endorsed by the EU Commission.
The dates mentioned above are those required by the standard themselves (IASB effective dates).
IFRS 16, Leases
The Group did not yet apply IFRS 16, Leases. The application of the standard is mandatory for periods from 2019 onwards. IFRS 16 introduces a standardized ac-counting model according to which leases are generally to be recognized on the lessee's balance sheet.
A lessee recognizes a right-of-use asset representing its right to use a lease asset, as well as a liability resulting from the lease, which represents its obligation to make lease payments. There are exemptions for short-term leases and leases of low-value assets. Accounting for the lessor is comparable to that of the current standard; i.e., lessors continue to classify leases as financial or operating leases.
The Group has analyzed the effects of this new standard on the consolidated financial statements during the year 2018. The Group did not apply the standard early. The Group does not plan to apply the standard retrospectively in accordance with IAS 8, but rather plans to recognize the effect from initially applying IFRS 16 in retained earnings at the date of
initial application. The Group will use the exemptions for short-term leases and leases of low-value assets and recognize the corresponding lease payments as an expense generally on a straight-line basis over the particular lease term.
IFRS 16 will lead to an increase in fixed assets and financial liabilities. Based on its present level of knowledge, the Group does not expect any significant impact overall on its most important key figures, such as equity ratio or underlying EBITDA.
For example, on the basis of a differentiated analysis of the operating lease commitments (see also note 18) conducted in the course of the preparation of the present consolidated financial statements, total assets would increase by approx. €35 million as of December 31, 2018. This would result in a reduction of the equity ratio by approx. 1.5%. On this basis, the EBITDA margin would increase by about 0.5 - 1% for the year 2018.

96 Consolidated Financial Statements and Notes Notes to the Financial Statements
3. Significant Accounting Policies
Basis of Preparation
The consolidated financial statements of the Group are based on the principle of the historical cost of acquisition, construction or production, with the exception of the items reflected at fair value, such as derivative financial instruments.
Consolidation
The consolidated financial statements of the Sartorius Stedim Biotech Group include the annual financial statements of all companies, which are controlled directly or indirectly by Sartorius Stedim Biotech S.A. In terms of IFRS 10, Consolidated Financial Statements, the Group Sartorius Stedim Biotech controls an entity when it is exposed to, or has rights to, variable returns from its involvement with the entity and has the ability to affect those returns through its power over the entity.
Such entities are included in the consolidated financial statements from the time when Sartorius Stedim Biotech S.A. or its subsidiaries obtain such control until the date on which control ceases .
Subsidiaries have been included on the basis of their annual financial statements for the same reporting period as the parent company, using uniform Group recognition and measurement methods.
All intragroup assets and liabilities, equity, income, expenses and cash flows relating to transactions be-tween members of the Group are eliminated on consolidation.
Business Combinations
Business combinations are accounted according to the acquisition method. The identifiable acquired assets and assumed liabilities are generally recorded at fair value on the date of acquisition.
For significant acquisitions, the purchase price allocation is carried out with assistance from independent third-party valuation specialists. The valuations are based on the information available at the acquisition date.
The Group determines goodwill at the acquisition date as:
– the fair value of the consideration transferred; and
– the amount recognized for any non-controlling interest in the acquiree; and
– if the business combination is carried out in stages, the fair value of any previously held equity interest in the acquiree; less
– the net recognized amount for the identifiable assets acquired and liabilities assumed.
When the difference is negative, the purchase gain is recognized immediately in income. Expenses directly related to business combinations are recorded in the profit or loss as they are incurred.
Foreign Currency Transactions
The presentation currency of the consolidated financial statements of the Sartorius Stedim Biotech Group is the euro (financial statements presented in thousands of euros). In the financial statements of each company, transactions denominated in foreign currencies have been translated into the functional currency of the subsidiary at the exchange rate applicable on the date of the transaction. Monetary assets and debts denominated in a foreign currency have been translated at the exchange rate on the balance sheet date. Rate gains and losses have been recognized in profit or loss for the period.
Translation of financial statements prepared in foreign currencies
Subsidiaries’ financial statements prepared in foreign currencies have been translated pursuant to IAS 21, The Effects of Changes in Foreign Exchange Rates, in accordance with the concept of a functional currency. Foreign subsidiaries have been regarded as independent subdivisions of the Sartorius Stedim Biotech Group. The assets (including goodwill) and liabilities of the entities that have a functional currency different from the presentation currency are translated at the exchange rate prevailing at the balance sheet date. The incomes, expenses, and cash flows of these entities have been translated using the average rate for the year, to the extent that this rate represents an approximate value of exchange rates used as of the date of the transaction in the absence of significant fluctuations. Resulting translation differences are recognized in other comprehensive income.
Consolidated Financial Statements and Notes Notes to the Financial Statements 97
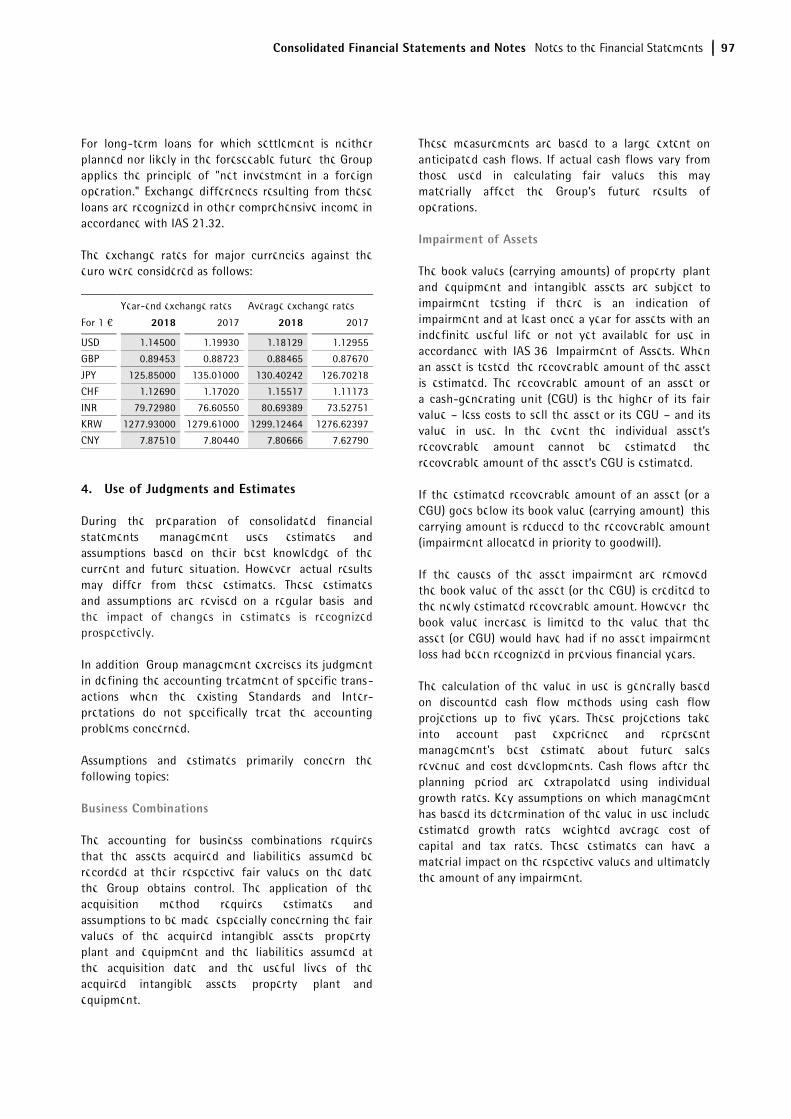
For long-term loans for which settlement is neither planned nor likely in the foreseeable future, the Group applies the principle of "net investment in a foreign operation." Exchange differences resulting from these loans are recognized in other comprehensive income in accordance with IAS 21.32.
The exchange rates for major currencies against the euro were considered as follows:
Year-end exchange rates Average exchange rates
For 1 € 2018 2017 2018 2017
USD 1.14500 1.19930 1.18129 1.12955
GBP 0.89453 0.88723 0.88465 0.87670
JPY 125.85000 135.01000 130.40242 126.70218
CHF 1.12690 1.17020 1.15517 1.11173
INR 79.72980 76.60550 80.69389 73.52751
KRW 1277.93000 1279.61000 1299.12464 1276.62397
CNY 7.87510 7.80440 7.80666 7.62790
4. Use of Judgments and Estimates
During the preparation of consolidated financial statements, management uses estimates and assumptions based on their best knowledge of the current and future situation. However, actual results may differ from these estimates. These estimates and assumptions are revised on a regular basis, and the impact of changes in estimates is recognized prospectively.
In addition, Group management exercises its judgment in defining the accounting treatment of specific trans-actions when the existing Standards and Inter-pretations do not specifically treat the accounting problems concerned.
Assumptions and estimates primarily concern the following topics:
Business Combinations
The accounting for business combinations requires that the assets acquired and liabilities assumed be recorded at their respective fair values on the date the Group obtains control. The application of the acquisition method requires estimates and assumptions to be made, especially concerning the fair values of the acquired intangible assets, property, plant and equipment and the liabilities assumed at the acquisition date, and the useful lives of the acquired intangible assets, property, plant and equipment.
These measurements are based to a large extent on anticipated cash flows. If actual cash flows vary from those used in calculating fair values, this may materially affect the Group’s future results of operations.
Impairment of Assets
The book values (carrying amounts) of property, plant and equipment and intangible assets are subject to impairment testing if there is an indication of impairment and at least once a year for assets with an indefinite useful life or not yet available for use in accordance with IAS 36, Impairment of Assets. When an asset is tested, the recoverable amount of the asset is estimated. The recoverable amount of an asset or a cash-generating unit (CGU) is the higher of its fair value – less costs to sell the asset or its CGU – and its value in use. In the event the individual asset’s recoverable amount cannot be estimated, the recoverable amount of the asset’s CGU is estimated.
If the estimated recoverable amount of an asset (or a CGU) goes below its book value (carrying amount), this carrying amount is reduced to the recoverable amount (impairment allocated in priority to goodwill).
If the causes of the asset impairment are removed, the book value of the asset (or the CGU) is credited to the newly estimated recoverable amount. However, the book value increase is limited to the value that the asset (or CGU) would have had if no asset impairment loss had been recognized in previous financial years.
The calculation of the value in use is generally based on discounted cash flow methods using cash flow projections up to five years. These projections take into account past experience and represent management's best estimate about future sales revenue and cost developments. Cash flows after the planning period are extrapolated using individual growth rates. Key assumptions on which management has based its determination of the value in use include estimated growth rates, weighted average cost of capital and tax rates. These estimates can have a material impact on the respective values and ultimately the amount of any impairment.

98 Consolidated Financial Statements and Notes Notes to the Financial Statements
Intangible Assets
The capitalization of self-constructed intangible assets also includes a significant level of judgment, e.g. the evaluation of feasibility of a development project, the expected market prospects and the determination of useful lives.
Employee Benefits - Pension Provisions
Obligations for pension and other post-employment benefits are determined in accordance with actuarial valuations. These valuations rely on key assumptions including discount rates, expected salary increases and mortality rates. The discount rate assumptions are determined by reference to yields on high-quality corporate bonds of appropriate duration and currency at the end of the reporting period.
Due to changing market and economic conditions the underlying key assumptions may differ from actual developments and may lead to significant changes in pension and other post-employment benefit obligations.
Such differences are recognized in other compre-hensive income in the period in which they occur. For a sensitivity analysis, see note 23, Pension and Employee Benefits Provisions.
Provisions, Contingent Liabilities and Contingent Assets
Provisions are recognized for legal or constructive obligations that exist as of the balance sheet date. To determine the amount of the obligations, certain estimates and assumptions have to be applied, including the determination of the probability and the amount of future outflows of resources. Typically, significant estimates are involved in the determination of provisions related to onerous contracts, warranty costs, asset retirement obligations and legal proceedings.
Income Taxes
The Group operates in various tax jurisdictions and therefore has to determine tax positions under respective local tax laws and tax authorities’ views which can be complex and subject to different interpretations of taxpayers and local tax authorities. Deferred tax assets have to be recognized for all deductible temporary differences and unused tax losses to the extent that it is probable that future taxable profit will be available against which the deductible temporary differences and unused tax losses can be utilized. As future developments are uncertain and partly beyond management’s control,
assumptions are necessary to estimate future taxable profits as well as the period in which deferred tax assets will be recovered.
Estimates are revised in the period in which there is sufficient evidence to revise the assumption. If management considers it probable that all or a portion of a deferred tax asset cannot be realized, the corresponding amount is not recorded as an asset.
Fair Value Measurement
A number of the Group’s accounting policies and disclosures may require the measurement of fair values, for both financial and non-financial assets and liabilities, including Level 3 fair values (unobservable inputs).
If third party information, such as broker quotes or pricing services, is used to measure fair values, then management assesses the evidence obtained from the third parties to support the conclusion that these valuations meet the requirements of IFRS, including the level in the fair value hierarchy in which the valuations should be classified.
When measuring the fair value of an asset or a liability, the Group uses observable market data as far as possible. If the inputs used to measure the fair value of an asset or a liability fall into different levels of the fair value hierarchy, then the fair value measurement is categorized in its entirety in the same level of the fair value hierarchy as the lowest level input that is significant to the entire measurement.
5. Operating Segments
According to IFRS 8, Operating Segments the identification of reportable operating segments is based on the "management approach"; i.e. the segments are defined analogously to the internal financial reporting of an entity. Therefore, an area of activity is to be considered an operating segment if its business activities may result in revenues and expenses, its operating results are regularly reviewed by the entity's chief operating decision maker (= the Executive Members of the Board of Directors) and discrete financial information is available in its internal reporting. Internal control and reporting within Sartorius Stedim Biotech is based on the approach of operating as a "total solution provider" for its customers. Accordingly, there is only one single segment to be identified for Sartorius Stedim Biotech, driven by the product and customer perspective: Biopharm.
Consolidated Financial Statements and Notes Notes to the Financial Statements 99
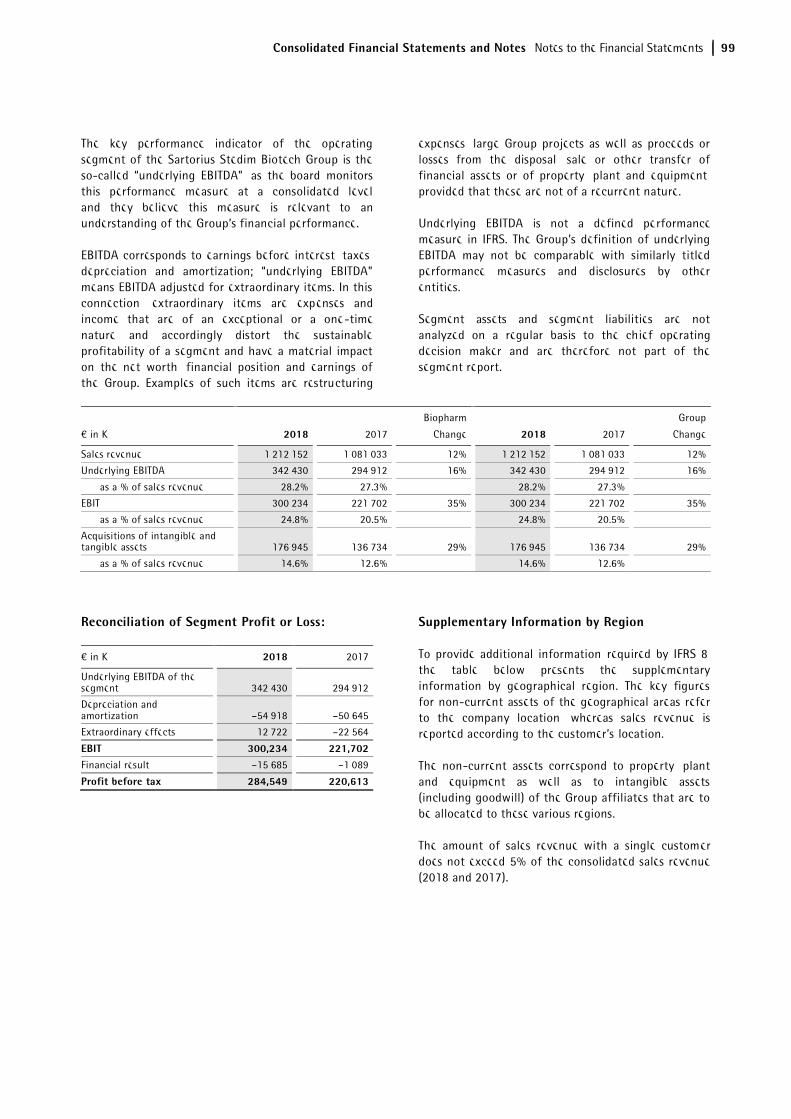
The key performance indicator of the operating segment of the Sartorius Stedim Biotech Group is the so-called “underlying EBITDA”, as the board monitors this performance measure at a consolidated level and they believe this measure is relevant to an understanding of the Group’s financial performance.
EBITDA corresponds to earnings before interest, taxes, depreciation and amortization; “underlying EBITDA” means EBITDA adjusted for extraordinary items. In this connection, extraordinary items are expenses and income that are of an exceptional or a one-time nature and accordingly distort the sustainable profitability of a segment and have a material impact on the net worth, financial position and earnings of the Group. Examples of such items are restructuring
expenses, large Group projects as well as proceeds or losses from the disposal, sale or other transfer of financial assets or of property, plant and equipment, provided that these are not of a recurrent nature.
Underlying EBITDA is not a defined performance measure in IFRS. The Group’s definition of underlying EBITDA may not be comparable with similarly titled performance measures and disclosures by other entities.
Segment assets and segment liabilities are not analyzed on a regular basis to the chief operating decision maker and are therefore not part of the segment report.
Biopharm Group
€ in K 2018 2017 Change 2018 2017 Change
Sales revenue 1,212,152 1,081,033 12% 1,212,152 1,081,033 12%
Underlying EBITDA 342,430 294,912 16% 342,430 294,912 16%
as a % of sales revenue 28.2% 27.3% 28.2% 27.3%
EBIT 300,234 221,702 35% 300,234 221,702 35%
as a % of sales revenue 24.8% 20.5% 24.8% 20.5%
Acquisitions of intangible and tangible assets 176,945 136,734 29% 176,945 136,734 29%
as a % of sales revenue 14.6% 12.6% 14.6% 12.6%
Reconciliation of Segment Profit or Loss:
€ in K 2018 2017
Underlying EBITDA of the segment 342,430 294,912
Depreciation and amortization –54,918 –50,645
Extraordinary effects 12,722 –22,564
EBIT 300,234 221,702 Financial result –15,685 –1,089
Profit before tax 284,549 220,613
Supplementary Information by Region
To provide additional information required by IFRS 8, the table below presents the supplementary information by geographical region. The key figures for non-current assets of the geographical areas refer to the company location, whereas sales revenue is reported according to the customer’s location.
The non-current assets correspond to property, plant and equipment as well as to intangible assets (including goodwill) of the Group affiliates that are to be allocated to these various regions.
The amount of sales revenue with a single customer does not exceed 5% of the consolidated sales revenue (2018 and 2017).

100 Consolidated Financial Statements and Notes Notes to the Financial Statements
Sales revenue Non-current assets
€ in K 2018 2017 2018 2017
EMEA 508,241 460,664 816,639 756,242
thereof Germany 144,602 130,454 340,599 296,567
thereof France 54,977 56,955 331,371 305,508
Americas 422,625 368,817 159,484 113,722
thereof USA 396,509 339,319 159,484 113,722
Asia | Pacific 281,286 251,552 22,044 20,281
thereof China 83,904 66,978 1,474 1,526
thereof South Korea 72,824 76,585 7,502 7,109
Group 1,212,152 1,081,033 998,167 890,245
6. Statement of Cash Flows
The statement of cash flows shows the impact of cash inflows and outflows on the cash and cash equivalents of the Group. The cash flows are classified by operating, investing and financing activities according to IAS 7 (Statement of Cash Flows).
In this context cash equivalents are assets that can be converted into cash within a short maturity (generally less than three months). The amount considered in the
statement of cash flows is equal to the amount of cash and cash equivalents in the statement of financial position.
The impact resulting from the modified agreement with Lonza in the field of cell culture media posted in 2018 had no impact on the statement of cash flows (see note 11).
The following table summarizes the development of the liabilities arising from financing activities during the reporting period:
Balance at Dec. 31, 2016
€ in K cash flows Currency
effects other non-cash
changes
Balance at Dec. 31, 2017
¤ in K
Loans and borrowings 84,052 58,347 –215 0 142,184
Finance lease liabilities 18,270 –686 –173 76 17,487
Liability for phantom units in connection with the AllPure acquisition 5,833 0 –706 155 5,282
Total financial liabilities from financing activities 108,155 57,661 –1,094 231 164,952
Balance at Dec. 31, 2017
€ in K cash flows Currency
effects other non-cash
changes
Balance at Dec. 31, 2018
¤ in K
Loans and borrowings 142,184 –9,229 –12 0 132,943
Finance lease liabilities 17,487 –754 –40 0 16,693
Liability for phantom units in connection with the AllPure acquisition 5,282 0 250 3,206 8,739
Total financial liabilities from financing activities 164,953 –9,982 198 3,206 158,375
7. Scope of Consolidation
The 2018 financial statements of the following entities:
– TAP Biosystems (PHC) Ltd., UK
– TAP Biosystems Ltd., UK
– Distribo GmbH, Germany
were not included in the scope of consolidation, because the figures were of minor importance for assessing the financial position of the Group.
The sales revenue and total assets of the non-consolidated companies are below 1% of the Group figures.
Consolidated Financial Statements and Notes Notes to the Financial Statements 101
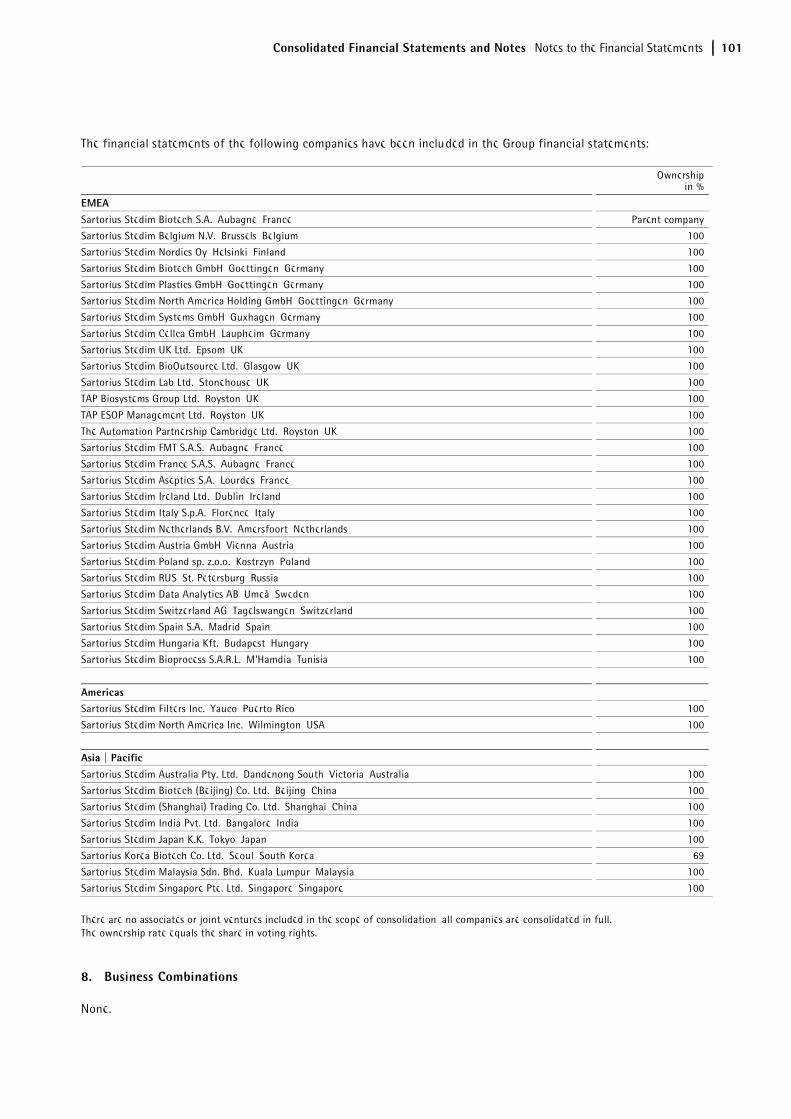
The financial statements of the following companies have been included in the Group financial statements:
Ownership
in %
EMEA Sartorius Stedim Biotech S.A., Aubagne, France Parent company
Sartorius Stedim Belgium N.V., Brussels, Belgium 100
Sartorius Stedim Nordics Oy, Helsinki, Finland 100
Sartorius Stedim Biotech GmbH, Goettingen, Germany 100
Sartorius Stedim Plastics GmbH, Goettingen, Germany 100
Sartorius Stedim North America Holding GmbH, Goettingen, Germany 100
Sartorius Stedim Systems GmbH, Guxhagen, Germany 100
Sartorius Stedim Cellca GmbH, Laupheim, Germany 100
Sartorius Stedim UK Ltd., Epsom, UK 100
Sartorius Stedim BioOutsource Ltd., Glasgow, UK 100
Sartorius Stedim Lab Ltd., Stonehouse, UK 100
TAP Biosystems Group Ltd., Royston, UK 100
TAP ESOP Management Ltd., Royston, UK 100
The Automation Partnership Cambridge Ltd., Royston, UK 100
Sartorius Stedim FMT S.A.S., Aubagne, France 100
Sartorius Stedim France S.A.S., Aubagne, France 100
Sartorius Stedim Aseptics S.A., Lourdes, France 100
Sartorius Stedim Ireland Ltd., Dublin, Ireland 100
Sartorius Stedim Italy S.p.A., Florence, Italy 100
Sartorius Stedim Netherlands B.V., Amersfoort, Netherlands 100
Sartorius Stedim Austria GmbH, Vienna, Austria 100
Sartorius Stedim Poland sp. z.o.o., Kostrzyn, Poland 100
Sartorius Stedim RUS, St. Petersburg, Russia 100
Sartorius Stedim Data Analytics AB, Umeå, Sweden 100
Sartorius Stedim Switzerland AG, Tagelswangen, Switzerland 100
Sartorius Stedim Spain S.A., Madrid, Spain 100
Sartorius Stedim Hungaria Kft., Budapest, Hungary 100
Sartorius Stedim Bioprocess S.A.R.L., M'Hamdia, Tunisia 100
Americas Sartorius Stedim Filters Inc., Yauco, Puerto Rico 100
Sartorius Stedim North America Inc., Wilmington, USA 100
Asia | Pacific Sartorius Stedim Australia Pty. Ltd., Dandenong South, Victoria, Australia 100
Sartorius Stedim Biotech (Beijing) Co. Ltd., Beijing, China 100
Sartorius Stedim (Shanghai) Trading Co. Ltd., Shanghai, China 100
Sartorius Stedim India Pvt. Ltd., Bangalore, India 100
Sartorius Stedim Japan K.K., Tokyo, Japan 100
Sartorius Korea Biotech Co. Ltd., Seoul, South Korea 69
Sartorius Stedim Malaysia Sdn. Bhd., Kuala Lumpur, Malaysia 100
Sartorius Stedim Singapore Pte. Ltd., Singapore, Singapore 100
There are no associates or joint ventures included in the scope of consolidation, all companies are consolidated in full. The ownership rate equals the share in voting rights.
8. Business Combinations
None.

102 Consolidated Financial Statements and Notes Notes to the Statement of Profit or Loss
9. Sales Revenue
Initial Application of IFRS 15, Revenue from Contracts with Customers
IFRS 15, Revenue from Contracts with Customers, defines a comprehensive model to determine when to recognize revenue and in which amount. It replaces existing guidelines for recognition of revenue, including IAS 18, Revenue; IAS 11, Construction Contracts; and IFRIC 13, Customer Loyalty Programmes.
The Group applied IFRS 15 for the first time as of January 1, 2018 on the basis of the modified retrospective method. Accordingly, the comparative period is presented in line with previous standards. Any effects of the initial application of IFRS 15 are recorded as an adjustment to the opening balance of retained earnings at the date of initial application. Furthermore, upon initial adoption, the Group has been applying IFRS 15 only to contracts that are not considered completed contracts at the date of initial application. Besides, the Group used the practical expedients offered regarding contract modifications that occurred prior to the date of initial application of IFRS 15 and did not retrospectively restate such contracts. As the impact of the new standard on the Group’s consolidated financial statements is low, the use of this practical expedient is expected not to have a material impact.
There are no material effects as a result of the application of the new standard. However, as of the date of initial application, there are certain effects with regard to construction contracts in the company's project business. Sales revenue of approximately €5 million, which was recognized in the past, is not recognized over time according to IFRS 15, but rather at a point in time. This results from new criteria introduced by IFRS 15 for revenue recognition over time for contracts on the construction of customer-specific goods. The effects resulted in a balance sheet extension by about €2 million at the date of initial application. There were no effects to be recognized in equity. The effects of applying the modified retrospective method on the opening statement of financial position as of January 1, 2018 are shown in the following table.
Effects from the application of IFRS 15 on the opening balances of the statement of financial position as of Jan. 1, 2018
Carrying amount
Dec. 31, 2017
Adjustments on adoption of
IFRS 15
Carrying amount
Jan. 1, 2018 € in mn € in mn € in mn3)
Inventories 185.6 4.1 189.7 Amounts due from customers for contract work1) 7.0 –1.9 5.0
Trade receivables 204.6 204.6
Trade receivables 211.6 –1.9 209.7
Trade payables | payments received for orders2) 40.7 2.2 42.9
Trade payables 77.2 77.2
Trade payables 118.0 2.2 120.2
1) Contract assets according to IFRS 15. 2) Contract liabilities according to IFRS 15. 3) Carrying amount without adjustments for the new credit impairment model according to IFRS 9.
Notes to the Statement of Profit or Loss

Consolidated Financial Statements and Notes Notes to the Statement of Profit or Loss 103
If the Group had applied the previous standards, IAS 18 and IAS 11, respectively, during the reporting period, sales revenue as well as cost of sales would have been higher by about €0.6 million while there would be no impact on the net result. Total assets and total liabilities would have been lower by about €2 million. The effects result from the revised criteria
for revenue recognition over time according to which revenue is now recognized at a point in time rather than over time for one project. The following table presents the impact on the consolidated statement of financial position as of December 31, 2018 that the continued application of the previous standards would have had in comparison with IFRS 15.
Effects from the application of IFRS 15 on the consolidated statement of financial position as of December 31, 2018
Carrying amount
December 31, 2018
(IFRS 15)
Adjustments on adoption of
IFRS 15
Carrying amount
December 31, 2018
(IAS 18, IAS 11)
€ in mn € in mn € in mn
Inventories 252.0 –5.1 246.9 Amounts due from customers for contract work1) 3.9 2.9 6.8
Trade receivables 216.3 216.3
Trade receivables 220.2 2.9 223.1
Trade payables | payments received for orders2) 51.0 –2.2 48.8
Trade payables 103.6 103.6
Trade payables 154.6 –2.2 152.4
1) Contract assets according to IFRS 15. 2) Contract liabilities according to IFRS 15.
Other Disclosures
The revenues from contracts with customers according to IFRS 15 are disaggregated into geographical regions (see Segment Report, note 5). For details on the impairments on trade receivables and contract assets recognized in the reporting period see note 38.
The following table presents the opening balances as of January 1, 2018, and the balances as of December 31, 2018 for the Group’s contract liabilities. The balances of trade receivables and contract assets are presented in note 28.
Line item in statement of
financial position
Carrying amount as of
January 1, 2018
Carrying amount as of December 31,
2018 € in k € in k
Deferred revenue Other liabilities 10,153 16,235
Payments received on account of orders Trade payables 42,949 51,000
Contract liabilities (total) 53,101 67,234
There were no extraordinary changes in the carrying amounts of the contract liabilities and contract assets in the reporting period. Revenue in the amount of 41,182 k euros was recognized in the reporting period that was included in the contract liability balance at the beginning of the reporting period.
The Group produces and sells instruments and consumables for customers in the Biopharm segment.
The Group satisfies its performance obligations depending on the goods to be transferred and the promised services. The far majority of the revenues from sales of products is recognized at a point in time when the customer obtains control over the goods. This is typically the case when the significant risks and rewards of ownership of the goods are transferred to the customer. Therefore, the point in time may vary

104 Consolidated Financial Statements and Notes Notes to the Statement of Profit or Loss
depending on the agreement with the individual customer.
For complex products that require installation at the customer’s site, revenue is recognized upon formal customer acceptance. To a low extent, revenue is recognized over time in the customer-specific project business. In these cases, revenue is recognized according to the project progress which is measured based on the percentage of costs to date compared to the total estimated contract costs. The amount of actual costs incurred to date reflects the progress and the transfer of control to the customer appropriately as the Group has a right to a reimbursement of cost to date plus an appropriate margin, if the project is cancelled by the customer without cause.
Revenue from services is generally recognized when the services are performed or have been performed. When the services are performed continuously over a period of time, the Group recognizes the related revenue over time. In this case, revenue is generally recognized pro rata temporis in relation to the total contract period. Product sales are typically accompanied by the legally required warranty. Any material extended warranties are accounted for as separate performance obligations.
According to the general payment terms, customer payments are due in the short-term, typically within 30 days. To some extent, the Group obtains advance payments, e.g. to avoid credit risks. Therefore, the Group regularly has contract liabilities (payments received on account of orders). In addition, the Group recognizes contract liabilities in connection with service contracts (deferred revenues) when customers pay in advance.
There are no material effects from contracts with significant financing components. The Group uses the practical expedient regarding the existence of a significant financing component. This means that a financing component is only taken into consideration when the length of time between the transfer of goods or services and the receipt of consideration is expected to exceed one year and the effect is material. As of December 31, 2018, the Group has refund liabilities in the amount of 5,755 k euros as a result from incentive agreements with customers.
The aggregate amount of the transaction price allocated to the performance obligations that are unsatisfied (or partially unsatisfied) at the end of the reporting period (orders on hand) amounts to 489.0 million euros. The Group expects that these unsatisfied performance obligations will be satisfied to a large extent in 2019.
10. Functional Costs
The statement of profit or loss has been presented according to the "cost of sales format", i.e. expenses have been allocated to the relevant functions production, sales & marketing, research & development and general administration.
Expenses relating to cross-functional initiatives or projects are assigned to the respective functional costs based on an appropriate allocation principle.
The caption "cost of sales" includes the costs of products sold and the acquisition costs of merchandise sold. In addition to directly attributable expenses, such as raw materials and supplies, employee benefits expense and energy expenses, cost of sales also includes overhead, which can be allocated to the manufacturing area, and the corresponding depreciation and amortization.
The selling and distribution costs pertain, in particular, to the costs of the sales and marketing function, distribution and market research.
Research and development costs comprise the costs of research and product and process development, unless they are recognized as assets.
The item "general administrative expenses" mainly includes employee benefits expense and the cost of materials of the general administrative area.
All profit and loss items that cannot be allocated to one of the mentioned functional areas are recognized as other income and expenses. This includes essentially effects from translation of transactions in foreign currencies, sale of fixed assets, allowances on trade receivables and reorganization and other non-recurring expenses. Income from grants related to income is recognized as other income, when there is reasonable assurance that the conditions attached to the grants are complied with and the grants will be received. They are recognized systematically as income over the period in which the related costs are recorded.
Operating expenses by nature are presented in the Profit or Loss Statement by nature in note 14.

Consolidated Financial Statements and Notes Notes to the Statement of Profit or Loss 105
The material expense and personnel cost are as follows:
Raw Materials and Supplies
This caption consists of the following:
2018 12 months
¤ in K
2017 12 months
€ in K
Purchases consumed 237,889 235,762
Cost of purchased services 54,079 48,353
Total 291,968 284,114
Personnel Cost
This caption can be broken down as follows:
11. Other Operating Income and Expenses
2018 12 months
¤ in K
2017 12 months
€ in K
Currency translation gains 10,392 7,652
Extraordinary income 35,248 0
Income from the decrease in allowances for bad debts 475 780
Income from release of provisions and liabilities 353 973
Income from grants 4,235 8,013
Other income 1,921 1,139
Other operating income 52,624 18,557
Currency translation losses –10,403 –14,762
Extraordinary expenses –22,526 –22,564
Allowances for bad debts –2,041 –801
Other expenses –4,153 –3,416
Other operating expenses –39,124 –41,543 Total other operating income and expenses 13,500 –22,987
The item reported as income from grants discloses the grants for expenses (essentially related to research and development projects).
Extraordinary items amounted to €12.7 million (net) (previous year: €–22.6 million). The extraordinary income in 2018 refers mainly to the derecognition of the liability for the acquisition of the cell culture media business as a consequence of the modified cooperation agreement with Lonza; extraordinary expenses essentially cover one-time expenses for strategic Group projects and integration and acquisition-related items.
12. Financial Result
2018 12 months
¤ in K
2017 12 months
€ in K
Interest and similar income 385 274
- of which from affiliated companies 126 18
Income from derivative financial instruments 2,798 801
Other financial income 2,167 8,425
Financial income 5,349 9,500 Interest and similar expenses –3,344 –3,834
- of which from affiliated companies –1,378 –1,814
Expenses for derivative financial instruments –5,779 –1,706
Interest expense for pensions –649 –585
Other financial expenses –11,263 –4,465
Financial expenses –21,035 –10,589 Total –15,685 –1,089
The other financial income in 2017 (other financial expenses in 2018) includes mainly foreign exchange gains (losses) in connection with bank deposits, loans denominated in foreign currencies as well as the Lonza liability. Furthermore, in 2018 an increase in the liability for the phantom units in AllPure has been posted with an amount of approx. €3 mn (see note 31).
The interest expenses to affiliated companies are in connection with the loan granted by the Group's ultimate parent Sartorius AG (see also chapter 41).
.
2018 12 months
¤ in K
2017 12 months
€ in K
Wages and salaries 274,115 244,438
Social security 59,877 54,481
Expenses for retirement benefits and pensions 6,861 8,088
Total 340,853 307,007

106 Consolidated Financial Statements and Notes Notes to the Statement of Profit or Loss
13. Income Taxes
2018 12 months
¤ in K
2017 12 months
€ in K
Current income taxes –78,330 –56,173
Deferred taxes 3,740 –676
Total –74,590 –56,849
Current income taxes are determined based on the respective local taxable income of the period and local tax rules. In addition, current income taxes include adjustments for uncertain tax payments or tax refunds for periods not yet assessed. Changes in deferred tax assets and liabilities are included in income taxes except for changes recognized in other comprehensive income or equity.
Income taxes in France are calculated at 33.33% of the estimated taxable profit for the year. For Germany, a rate of approx. 30% was applied to the taxable income. Income generated outside France and Germany is taxed at rates applicable in the corresponding country.
Considering the French and German average tax rates and the impact of other tax legislations, the expected tax rate for the Sartorius Stedim Biotech Group is roughly 26% (29% in 2017). The reduction of 3% in the expected tax rate is mainly in connection with the reduced corporate tax rate in the US. The following table describes the difference between the expected tax expense and the income tax expenses reported for the particular financial year.
2018 12 months
¤ in K
2017 12 months
€ in K
Expected tax rate 26% 29%
Expected tax expense –73,983 –63,978
Differences from the Group average income tax rate 9,771 8,638
Permanent differences –11,172 –1,551
Tax-free income and other tax exemptions 1,222 1,262
Taxes for previous years 604 –853
Withholding and similar taxes –404 –596
Other –628 228
Total –74,590 –56,849
Effective tax rate –26.2% –25.8%
14. Profit or Loss Statement by Nature
2018 12 months
¤ in K
2017 12 months
€ in K
Sales revenue 1,212,152 1,081,033 Purchases consumed –237,889 –235,762
Cost of purchased services –54,079 –48,353
Personnel costs –340,853 –307,007
Amortization and depreciation –60,914 –50,678
Other operating costs –218,183 –217,531
Subtotal –911,918 –859,331 Operating profit (EBIT) 300,234 221,702 Financial income I expenses –15,685 –1,089
Income tax –74,590 –56,849
Non-controlling interest –1,907 –2,676
Net profit after non-controlling interest 208,052 161,088
15. Earnings per Share
According to IAS 33, the earnings per share must be determined as follows: The basic earnings per share (basic EPS) are calculated on the basis of the weighted average number of ordinary shares during the period.
2018 2017
Net profit after tax (€ in K) 209,959 163,763
Group net profit after tax (€ in K) 208,052 161,088
Earnings per share (€) 2.26 1.75
Diluted earnings per share (€) 2.26 1.75
Number of shares (statutory level) 92,180,190 92,180,190
Treasury shares –3,416 0
Weighted average number of shares used in earnings per share calculation 92,176,774 92,180,190 Weighted average number of shares used in diluted earnings per share calculation 92,176,774 92,180,190

Consolidated Financial Statements and Notes Notes to the Individual Balance Sheet Items 107
16. Goodwill and Other Intangible Assets
Goodwill
Goodwill ¤ in K
Gross book values at Jan. 1, 2017 344,777 Currency translation –4,791
Business combinations 46,059
Gross book values at Dec. 31, 2017 386,045 Impairment losses at Jan. 1, 2017 0 Currency translation 0
Impairment losses 0
Impairment losses at Dec. 31, 2017 0 Net book values at Dec. 31, 2017 386,045
Goodwill ¤ in K
Gross book values at Jan. 1, 2018 386,045 Currency translation –1,350
Business combinations 0
Gross book values at Dec. 31, 2018 384,695 Impairment losses at Jan. 1, 2018 0 Currency translation 0
Impairment losses 0
Impairment losses at Dec. 31, 2018 0
Net book values at Dec. 31, 2018 384,695
The caption reported as goodwill in the amount of €384,695 K is the capitalized difference in assets resulting from business combinations. According to IAS 36, goodwill acquired in a business combination may not be amortized, but rather, must be tested annually for impairment and as soon as there is any indication of asset impairment. The increase recorded in 2017 concerns the acquisition of Umetrics.
For the purpose of impairment testing, goodwill must be allocated to each of the acquirer’s cash-generating units (CGUs) that are expected to benefit from the synergies of the combination. The CGU represents the lowest level within the entity at which goodwill is monitored for internal management purposes and may not be larger than a segment. Sartorius Stedim Biotech
Group follows the strategy to be a total solution provider for its customers. Because of the various interdependencies within the business, the lowest level at which goodwill is monitored is that of the Biopharm segment. Therefore, the acquired goodwill is allocated to this group of CGU’s.
As in 2017, the impairment test conducted for 2018 measures the recoverable amount on the basis of the value in use of the particular cash-generating unit (Biopharm segment). The cash flow forecasts consider previous experiences and are generally based on Group management's forecasts for a period of four years. The calculations were based on a terminal year growth rate of 2.5% for the years after 2022. This rate is derived from market expectations, which forecast significant growth rates for the targeted biopharmaceutical market. The major growth driver for the Sartorius Stedim Biotech Group will be the aging and increase in population and the improved access to drugs in the emerging markets as well as the ongoing paradigm shift from reusable products to single-use products utilized in bio manufacturing by the biopharmaceutical industry.
The discount rates applied correspond to the weighted capital cost rates and were recognized as follows:
2018 2017
Before
tax After tax Before tax After tax
Biopharm segment 8.9% 7.2% 8.5% 6.8%
In 2018, our impairment test did not result in recognition of impairment losses. In this context, various sensitivity analyses based on realistic variations of the assumptions disclosed above did not result in an impairment either. The following variations would theoretically represent the “break-even point”:
2018 2017
Discount rates 22.9% 20.4%
Terminal growth rate –29.6% –28.4%
Cash flows –78.5% –80.2%
Notes to the Individual Balance Sheet Items

108 Consolidated Financial Statements and Notes Notes to the Individual Balance Sheet Items
Intangible Assets
Patents, licenses and
similar rights € in K
Brand name € in K
Customer relationships
€ in K
Capitalized development
costs € in K
Payments on account
€ in K Total
€ in K
Gross book values at Jan. 1, 2017 74,664 11,061 121,351 68,054 36 275,165 Currency translation –2,817 –47 –1,006 –387 0 –4,257
Business combinations 11,614 892 14,486 0 0 26,992
Acquisitions 5,767 0 469 20,788 0 27,024
Disposals –34 0 0 –2,685 0 –2,720
Transfers –143 0 0 155 0 12
Gross book values at Dec. 31, 2017 89,051 11,906 135,300 85,924 36 322,216 Amortization and impairment losses at Jan. 1, 2017 –27,813 –68 –67,710 –35,556 0 –131,147 Currency translation 1,298 5 410 139 0 1,853
Amortization and impairment losses –7,306 –98 –10,072 –5,176 0 –22,652
Disposals 34 0 0 2,607 0 2,641
Transfers –5 0 0 0 0 –5
Amortization and impairment losses at Dec. 31, 2017 –33,792 –160 –77,372 –37,986 0 –149,310 Net book values at Dec. 31, 2017 55,259 11,746 57,928 47,937 36 172,906
Patents, licenses and
similar rights € in K
Brand name € in K
Customer relationships
€ in K
Capitalized development
costs € in K
Payments on account
€ in K Total ¤ in K
Gross book values at Jan. 1, 2018 89,051 11,906 135,300 85,924 36 322,216 Currency translation 246 –32 172 –52 1 335
Business combinations 0 0 0 0 0 0
Acquisitions 20,443 0 0 22,839 19 43,301
Disposals –11,010 0 –11,804 –1,089 0 –23,902
Transfers 363 0 0 0 0 363
Gross book values at Dec. 31, 2018 99,094 11,874 123,669 107,622 55 342,313 Amortization and impairment losses at Jan. 1, 2018 –33,792 –160 –77,372 –37,986 0 –149,310 Currency translation –444 1 –41 28 0 –455
Amortization and impairment losses –11,519 –152 –13,991 –4,341 0 –30,004
Disposals 8,183 0 5,680 1,089 0 14,952
Transfers –3 0 0 0 0 –3
Amortization and impairment losses at Dec. 31, 2018 –37,576 –311 –85,724 –41,210 0 –164,821 Net book values at Dec. 31, 2018 61,518 11,563 37,944 66,412 55 177,492

Consolidated Financial Statements and Notes Notes to the Individual Balance Sheet Items 109
Intangible assets acquired are recorded at cost less the accumulated, regular amortization that is calculated according to the straight-line method and any impairment loss. The useful life of an intangible asset is the period during which the Group expects to use the asset.
Amortization of intangible assets is based on the following estimated useful lives:
Software 2 to 5 years
Capitalized R&D expenses 4 to 6 years
Customer relations and technologies 5 to 15 years
Brand name 5 years to indefinite
Costs incurred within the scope of the development of new products and methods were capitalized as internally generated intangible assets if the following criteria were met:
– The technical feasibility of completing the intangible assets so that it will be available for use or sale;
– The intention to complete the intangible asset and use or sell it;
– The ability to use or sell the intangible asset;
– The demonstration of how the intangible asset will generate probable future economic benefits;
– The availability of adequate technical, financial and other resources to complete the development and to use or sell the intangible asset;
– The ability to measure reliably the expenditure attributable to the intangible asset during its development.
The capitalized development costs essentially cover the costs that were allocated to the staff involved in R&D, raw materials and supplies, outside services and directly attributable overhead. Intangible assets generated internally are amortized on a straight line basis over their useful lives, which generally do not exceed six years.
If an internally generated intangible asset may not be recognized, the development costs are expensed in the period in which they are incurred. Costs for research activities are reported as expenses in the period in which they are incurred.
The Stedim brand name acquired in 2007 is considered to have an indefinite useful life and is therefore not amortized. There is no foreseeable limit to the period over which the brand name is expected to generate net cash inflows for the Group. The brand name is tested annually for impairment at the level of the "Biopharm segment" cash-generating unit (CGU).
In 2018, the development costs of €22,839 K were recognized as assets (€20,788 K in 2017).
Amortization of intangible assets is allocated to the corresponding functions in the statement of profit or loss. For capitalized development costs, amortization is disclosed in the line "cost of sales".
As a consequence of the modified agreement with Lonza in the cell culture media business, the related intangible assets (technology and customer relationships) have been recognized as disposals (see note 11).
In 2018, impairments were recognized in the amount of €5.8 million. The impairments relate mainly to technologies and customer relationships.

110 Consolidated Financial Statements and Notes Notes to the Individual Balance Sheet Items
17. Property, Plant and Equipment
Land, buildings and
improvements € in K
Technical machinery and
equipment € in K
Factory and office
equipment and other
equipment € in K
Payments on account and
construction in progress
€ in K Total
€ in K
Gross book values at Jan. 1, 2017 171,308 152,063 81,784 36,704 441,860 Currency translation –4,127 –2,165 –2,873 –4,742 –13,907
Business combinations 0 0 141 0 141
Acquisitions 2,317 7,438 10,995 88,958 109,708
Disposals –454 –2,683 –3,153 –1,797 –8,087
Transfers 7,494 7,209 1,710 –15,944 469
Gross book values at Dec. 31, 2017 176,538 161,862 88,603 103,179 530,183 Depreciation at Jan. 1, 2017 –52,038 –78,460 –49,899 1 –180,396 Currency translation 1,033 764 2,246 0 4,042
Depreciation –6,947 –12,687 –8,393 0 –28,026
Disposals 436 2,553 2,978 0 5,967
Transfers –405 190 –260 0 –475
Depreciation at Dec. 31, 2017 –57,921 –87,641 –53,327 1 –198,888 Net book values at Dec. 31, 2017 118,617 74,222 35,275 103,181 331,295
Land, buildings and
improvements € in K
Technical machinery and
equipment € in K
Factory and office
equipment and other
equipment € in K
Payments on account and
construction in progress
€ in K Total ¤ in K
Gross book values at Jan. 1, 2018 176,538 161,862 88,603 103,179 530,183 Currency translation 386 –302 445 3,709 4,238
Business combinations 0 0 0 0 0
Acquisitions 20,018 11,247 9,137 93,242 133,644
Disposals –3,643 –7,316 –9,959 –299 –21,218
Transfers 6,035 11,899 852 –19,113 –326
Gross book values at Dec. 31, 2018 199,335 177,390 89,078 180,718 646,521 Depreciation at Jan. 1, 2018 –57,921 –87,641 –53,327 1 –198,888 Currency translation 35 –242 –133 0 –341
Depreciation –8,490 –13,443 –8,980 0 –30,913
Disposals 3,320 6,712 9,257 0 19,290
Transfers –11 72 250 0 311
Depreciation at Dec. 31, 2018 –63,067 –94,542 –52,933 1 –210,541 Net book values at Dec. 31, 2018 136,268 82,848 36,146 180,719 435,980
The “Property, plant and equipment” caption is recorded at cost, and related assets are depreciated over their estimated useful life using the straight line method. Tangible assets are subject to impairment tests whenever there are indicators of impairment.
Depreciation of fixed assets is based on the following periods of useful life:
Buildings 15 to 50 years
Machinery 5 to 15 years
Factory and office equipment 3 to 13 years

Consolidated Financial Statements and Notes Notes to the Individual Balance Sheet Items 111
Depreciation is included in the statement of profit or loss according to use of the assets in the cost of sales, selling and distribution costs, research and development costs, general administrative expenses and other operating expenses.
Borrowing costs are expensed as incurred unless they are directly attributable to the acquisition, construction or production of a qualifying asset and are therefore part of the cost of that asset. A qualifying asset is defined as an asset that takes a substantial period of time (six to twelve months) to get ready for its intended use.
Grants related to assets are deducted from the cost of the related asset.
In 2018, as for fiscal 2017, there were no significant impairment losses to be recognized with regard to property, plant and equipment.
18. Leases
A lease is an arrangement whereby the lessor conveys to the lessee in return for a payment or series of payments the right to use an asset for an agreed period of time. According to IAS 17 a lease is classified as either an operating or a finance lease. A finance lease is a lease that transfers substantially all the risks and rewards incidental to ownership of an asset. All other leases are designated as operating leases.
When the Group is a lessee in a finance lease, the amount equal to the fair value of the leased property, or if lower, the present value of the minimum lease payments is recognized as an asset on the balance sheet and simultaneously recognized as a financial liability. The minimum lease payments essentially consist of the finance charge and the reduction of the outstanding liability, which are measured according to the effective interest method. A leased asset is depreciated on a straight-line basis over the period of its expected useful life or over the shorter lease term.
For an operating lease, the lease instalments to be paid by the lessee are recognized as expenses over the lease term and the lease payments received by the lessor are recognized as income, respectively. The leased asset continues to be recognized on the lessor's balance sheet as property, plant and equipment.
Capitalized property, plant and equipment for assets held under finance leases amount to €14,599 K (2017: €15,672). The cost of acquisition of these assets totals €19,631 K (2017: €19,682 K).
In 2018 rental payments amounting to €14.0 million (2017: €11.3 million) were made for assets leased under operating leases.
For the new lease accounting rules according to IFRS 16 (applicable from 2019 on) please refer to note 2.
The Group's financial obligations from operating lease commitments (future minimum lease payments under non-cancellable leases), are as follows:
Dec. 31, 2018 ¤ in K
Dec. 31, 2017 € in K
Operate leases
- due within one year 11,434 8,682
- due within 2 to 5 years 22,145 13,900
- due thereafter 8,813 4,817
112 Consolidated Financial Statements and Notes Notes to the Individual Balance Sheet Items
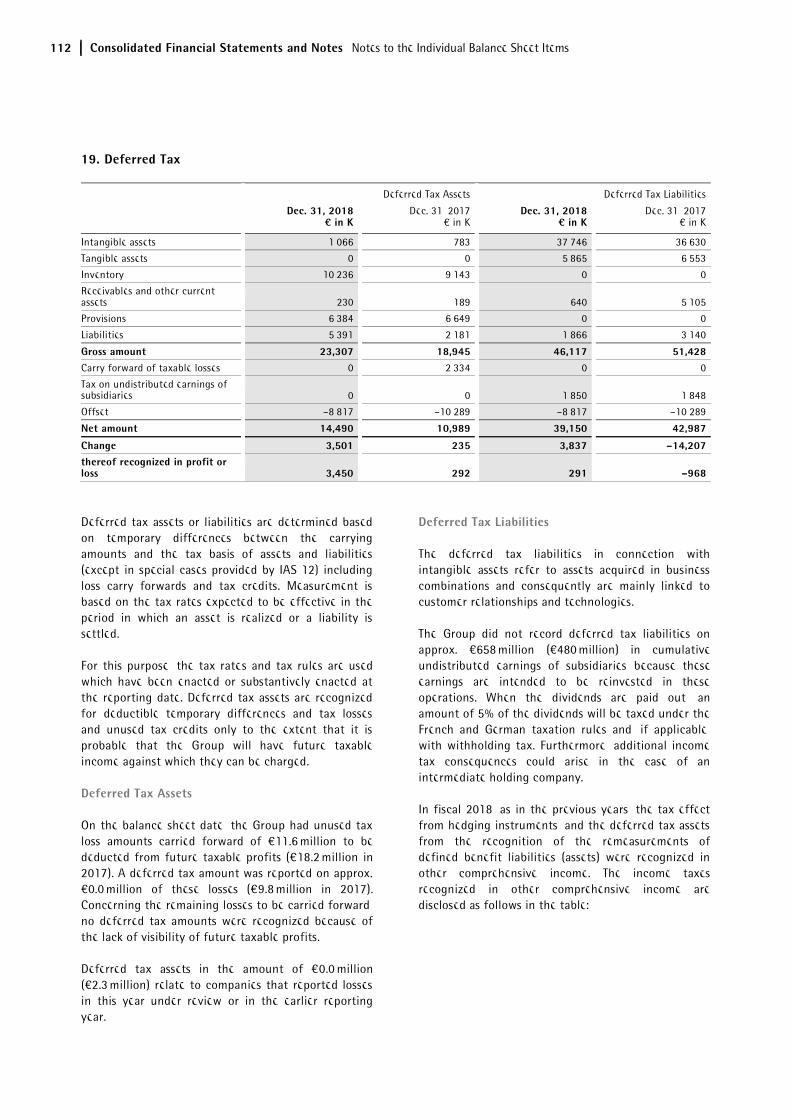
19. Deferred Tax
Deferred Tax Assets Deferred Tax Liabilities
Dec. 31, 2018
¤ in K Dec. 31, 2017
€ in K Dec. 31, 2018
¤ in K Dec. 31, 2017
€ in K
Intangible assets 1,066 783 37,746 36,630
Tangible assets 0 0 5,865 6,553
Inventory 10,236 9,143 0 0
Receivables and other current assets 230 189 640 5,105
Provisions 6,384 6,649 0 0
Liabilities 5,391 2,181 1,866 3,140
Gross amount 23,307 18,945 46,117 51,428 Carry forward of taxable losses 0 2,334 0 0
Tax on undistributed earnings of subsidiaries 0 0 1,850 1,848
Offset –8,817 –10,289 –8,817 –10,289
Net amount 14,490 10,989 39,150 42,987
Change 3,501 235 3,837 –14,207 thereof recognized in profit or loss 3,450 292 291 –968
Deferred tax assets or liabilities are determined based on temporary differences between the carrying amounts and the tax basis of assets and liabilities (except in special cases provided by IAS 12) including loss carry forwards and tax credits. Measurement is based on the tax rates expected to be effective in the period in which an asset is realized or a liability is settled.
For this purpose, the tax rates and tax rules are used which have been enacted or substantively enacted at the reporting date. Deferred tax assets are recognized for deductible temporary differences and tax losses and unused tax credits only to the extent that it is probable that the Group will have future taxable income against which they can be charged.
Deferred Tax Assets
On the balance sheet date, the Group had unused tax loss amounts carried forward of €11.6 million to be deducted from future taxable profits (€18.2 million in 2017). A deferred tax amount was reported on approx. €0.0 million of these losses (€9.8 million in 2017). Concerning the remaining losses to be carried forward, no deferred tax amounts were recognized because of the lack of visibility of future taxable profits.
Deferred tax assets in the amount of €0.0 million (€2.3 million) relate to companies that reported losses in this year under review or in the earlier reporting year.
Deferred Tax Liabilities
The deferred tax liabilities in connection with intangible assets refer to assets acquired in business combinations and consequently are mainly linked to customer relationships and technologies.
The Group did not record deferred tax liabilities on approx. €658 million (€480 million) in cumulative undistributed earnings of subsidiaries because these earnings are intended to be reinvested in these operations. When the dividends are paid out, an amount of 5% of the dividends will be taxed under the French and German taxation rules and, if applicable, with withholding tax. Furthermore, additional income tax consequences could arise in the case of an intermediate holding company.
In fiscal 2018, as in the previous years, the tax effect from hedging instruments, and the deferred tax assets from the recognition of the remeasurements of defined benefit liabilities (assets) were recognized in other comprehensive income. The income taxes recognized in other comprehensive income are disclosed as follows in the table:
Consolidated Financial Statements and Notes Notes to the Individual Balance Sheet Items 113
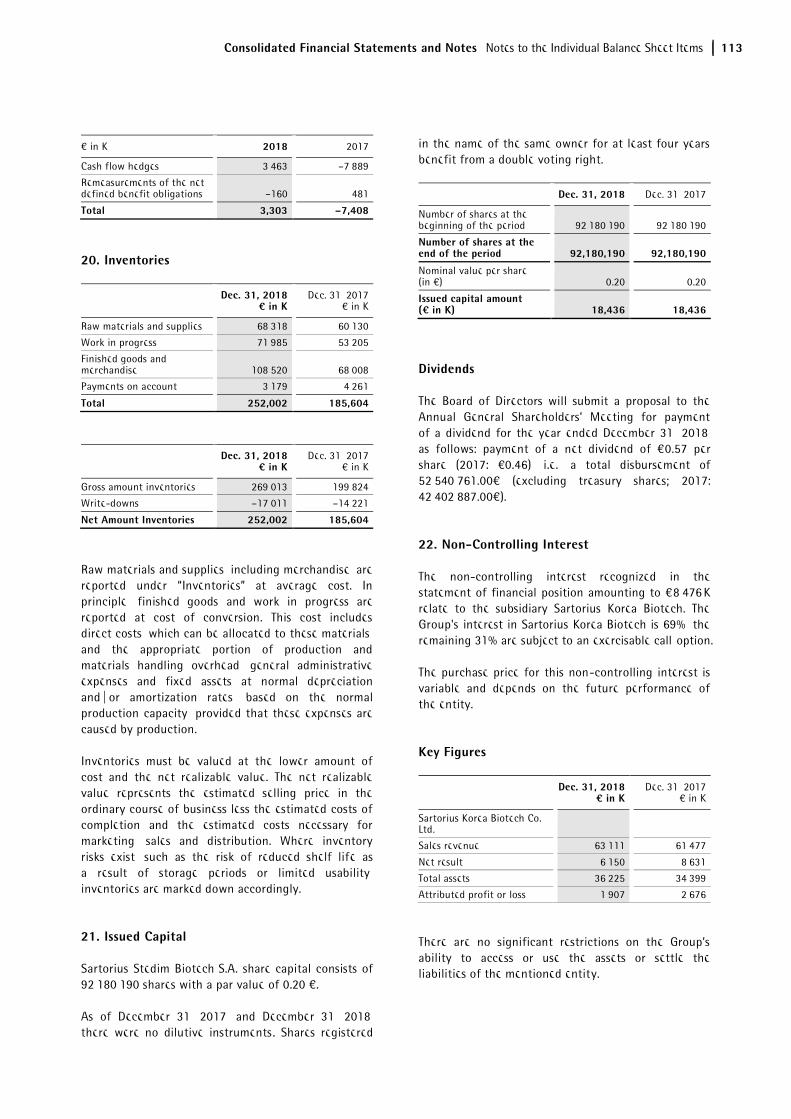
€ in K 2018 2017
Cash flow hedges 3,463 –7,889
Remeasurements of the net defined benefit obligations –160 481
Total 3,303 –7,408
20. Inventories
Dec. 31, 2018 ¤ in K
Dec. 31, 2017 € in K
Raw materials and supplies 68,318 60,130
Work in progress 71,985 53,205
Finished goods and merchandise 108,520 68,008
Payments on account 3,179 4,261
Total 252,002 185,604
Dec. 31, 2018
¤ in K Dec. 31, 2017
€ in K
Gross amount inventories 269,013 199,824
Write-downs –17,011 –14,221
Net Amount Inventories 252,002 185,604
Raw materials and supplies, including merchandise, are reported under “Inventories” at average cost. In principle, finished goods and work in progress are reported at cost of conversion. This cost includes direct costs, which can be allocated to these materials, and the appropriate portion of production and materials handling overhead, general administrative expenses and fixed assets at normal depreciation and | or amortization rates, based on the normal production capacity, provided that these expenses are caused by production.
Inventories must be valued at the lower amount of cost and the net realizable value. The net realizable value represents the estimated selling price in the ordinary course of business less the estimated costs of completion and the estimated costs necessary for marketing, sales and distribution. Where inventory risks exist, such as the risk of reduced shelf life as a result of storage periods or limited usability, inventories are marked down accordingly.
21. Issued Capital
Sartorius Stedim Biotech S.A. share capital consists of 92,180,190 shares with a par value of 0.20 €.
As of December 31, 2017, and December 31, 2018, there were no dilutive instruments . Shares registered
in the name of the same owner for at least four years benefit from a double voting right.
Dec. 31, 2018 Dec. 31, 2017
Number of shares at the beginning of the period 92,180,190 92,180,190
Number of shares at the end of the period 92,180,190 92,180,190
Nominal value per share (in €) 0.20 0.20
Issued capital amount (¤ in K) 18,436 18,436
Dividends
The Board of Directors will submit a proposal to the Annual General Shareholders’ Meeting for payment of a dividend for the year ended December 31, 2018, as follows: payment of a net dividend of €0.57 per share (2017: €0.46), i.e., a total disbursement of 52,540,761.00€ (excluding treasury shares; 2017: 42,402,887.00€).
22. Non-Controlling Interest
The non-controlling interest recognized in the statement of financial position amounting to €8,476 K relate to the subsidiary Sartorius Korea Biotech. The Group's interest in Sartorius Korea Biotech is 69%, the remaining 31% are subject to an exercisable call option.
The purchase price for this non-controlling interest is variable and depends on the future performance of the entity.
Key Figures
Dec. 31, 2018
¤ in K Dec. 31, 2017
€ in K
Sartorius Korea Biotech Co. Ltd.
Sales revenue 63,111 61,477
Net result 6,150 8,631
Total assets 36,225 34,399
Attributed profit or loss 1,907 2,676
There are no significant restrictions on the Group’s ability to access or use the assets or settle the liabilities of the mentioned entity.

114 Consolidated Financial Statements and Notes Notes to the Individual Balance Sheet Items
23. Pension and Employee Benefits Provisions
Pension Obligations
Pension provisions and similar obligations are recognized in the consolidated financial statements of Sartorius Stedim Biotech Group in accordance with actuarial principles. IAS 19, Employee Benefits, stipulates the Projected Unit Credit Method as the method of measurement. In addition to known pensions and life expectancies, this expected cash value method takes into account future salary and pension increases.
All remeasurements of the net defined benefit liability are recognized in other comprehensive income (pension reserves) in accordance with the standard IAS 19.
Defined Contribution Plans
Most of the Sartorius Stedim Biotech Group companies make payments under defined contributions plans, primarily related to government-run pension plans. In 2018, the total expense recognized for the defined contribution plans amounted to €20,807 K (2017: €19,527 K).
Defined Benefit Plans
The remeasurements of defined benefit liabilities (asset) are shown in other comprehensive income according to the standard IAS 19. The actuarial losses, which were transferred to the pension reserves, essentially resulted from a change in the discount rate and totaled €469 K (€–667 K in 2017).
An amount of €24,441 K relates in particular to pension provisions for retirement pension plans in Germany. These provisions totaled €25,068 K in 2017 and primarily relate to direct commitments under defined benefit pension plans. Under these commitments, the employees earn benefits for each year of service rendered to the company. The benefits earned depend on the salary level and the age of the respective employees. The pension benefits are generally not funded with assets.
The assumed discount rates reflect the interest rates payable on the reporting date for high-quality corporate bonds with matching maturities and denominated in the relevant currencies (mainly Euro). If such corporate bonds are not available with matching long-term maturities or are insufficiently
available, their matching interest rates are determined by extrapolation.
Measurement of the post-employment benefit obligations is based on the following actuarial assumptions:
For Germany:
in % Dec. 31, 2018 Dec. 31, 2017
Discount rate 1.81 1.75
Future salary increases 3.00 3.00
Future pension increases 2.00 2.00
With regard to the assumptions for mortality and disability the tables "Richttafeln (RT) 2018 G" by Klaus Heubeck were applied.
For France:
in % Dec. 31, 2018 Dec. 31, 2017
Discount rate 1.80 1.70
Future salary increases 2.00 2.50
Future pension increases 2.00 2.00
The amounts reported in the statement of profit or loss and other comprehensive income consist of the following:
2018 ¤ in K
2017 € in K
Current service cost –1,978 –1,856
Past service cost 485 408
Net interest expenses –531 –509
Components of defined benefit costs recognized in profit or loss –2,023 –1,958 Return on plan assets (excl. interest) 56 57
Remeasurements 413 –723
Components of defined benefit costs recognized in other comprehensive income 469 –667 Total –1,554 –2,624
In the statement of profit or loss, the current service cost is disclosed according to the assignment of employees to the respective functions.

Consolidated Financial Statements and Notes Notes to the Individual Balance Sheet Items 115
The amount included in the consolidated statement of financial position arising from the Group's obligation in respect of defined benefit plans is as follows:
Dec. 31, 2018
¤ in K Dec. 31, 2017
€ in K
Present value of the obligations 46,459 43,752
Fair value of the plan assets –10,865 –8,306
Net Liability 35,595 35,446
The present value of the defined benefit obligation developed as follows:
2018 ¤ in K
2017 € in K
Present value of the obligations as of Jan. 1 43,752 40,841 Current service cost 1,978 1,856
Past service cost –485 –408
Interest cost 649 585
Remeasurements –548 745
Foreign currency translation differences 386 –725
Retirement benefits paid in the reporting year –1,011 –852
Employee contributions 261 220
Contributions by plan participants 1,466 1,550
Other changes 14 –60
Present value of the obligations as of Dec. 31 46,459 43,752
The remeasurements of defined benefit liability (asset) can be allocated as follows:
2018 ¤ in K
2017 € in K
Experience adjustments 367 850
Changes in demographic assumptions 306 632
Changes in financial assumptions –1,221 –737
Total –548 745
Plan Assets
2018 ¤ in K
2017 € in K
Plan assets as of Jan. 1 8,306 6,622 Interest income 118 75
Return on plan assets (excl. interest) 56 57
Remeasurements –136 22
Group contribution & payments –887 –709
Foreign currency translation differences 279 –481
Employee contributions 261 220
Employer contributions 1,402 894
Contributions by plan participants 1,466 1,606
Other changes 0 0
Plan assets as of Dec. 31 10,865 8,306
Composition of Plan Assets
The plan assets do primarily refer to insurance contracts in Germany and Switzerland, there are no major equity or debt investments included. The subsidiary in South Korea has deposited an amount of €2.4 million (€1.8 million in 2017) to local banks as cash and cash equivalents.
Sensitivity Analysis
An increase | decrease of the actuarial assumptions would have the following impacts on the defined benefit obligations (a positive sign (+) means an increase of the obligation):
2017:
€ in K
Demographic assumptions Life expectancy +1 year –1 year
Effect 874 –870
Financial assumptions Discount rate +100 bps –100 bps
Effect –6,105 7,848
Future salary increases +50 bps –50 bps
Effect 865 –803
Future pension increases +25 bps –25 bps
Effect 984 –937

116 Consolidated Financial Statements and Notes Notes to the Individual Balance Sheet Items
2018:
€ in K
Demographic assumptions Life expectancy +1 year –1 year
Effect 1,053 –1,052
Financial assumptions Discount rate +100 bps –100 bps
Effect –6,389 8,171
Future salary increases +50 bps –50 bps
Effect 938 –861
Future pension increases +25 bps –25 bps
Effect 1,020 –972
The sensitivity analysis presented above might not be representative of the actual change in the defined benefit obligation as it is unlikely that the change in assumptions would occur in isolation of one another. Furthermore, the present value of the defined benefit obligation has been calculated using the same method that was applied in calculating the defined benefit obligation liability recognized in the statement of financial position (projected unit credit method).
Maturity Analysis
The undiscounted cash flows from defined benefits obligations can be allocated to maturities as follows:
Dec. 31, 2018
¤ in K Dec. 31, 2017
€ in K
<1 year 1,664 1,477
1-5 years 8,336 7,616
6-10 years 12,430 11,564
>10 years 73,605 58,288
Total 96,035 78,944
The weighted average duration of the defined benefit obligations is 16.6 years (2017: 17.6 years).
24. Other Provisions
A provision is recognized when a present legal or constructive obligation to third parties arising from past events has been incurred, an outflow of resources is probable and the amount of the obligation can be reasonably estimated. The amount recognized as a provision represents the best estimate of the obligation at the closing date.
Restructuring provisions are set up in connection with programs that materially change the scope of business performed by a segment or business unit or the manner in which business is conducted. In most cases, restructuring expenses include termination benefits and compensation payments due to the termination of agreements with suppliers and dealers, including leasing contracts. Restructuring provisions are recognized when the Group has a detailed formal plan that has either commenced implementation or been announced.
Other Non-current Provisions
Payments to employees on
early retirement plan
€ in K Other € in K
Total € in K
Balance at Jan. 1, 2017 2,331 752 3,083
Currency translation 0 –11 –11
Consumption –1,035 –16 –1,051
Additions 877 205 1,082
Balance at Dec. 31, 2017 2,173 930 3,103

Consolidated Financial Statements and Notes Notes to the Individual Balance Sheet Items 117
Payments to employees on
early retirement plan
€ in K Other € in K
Total ¤ in K
Balance at Jan. 1, 2018 2,173 930 3,103
Currency translation 0 9 9
Consumption –1,124 –41 –1,165
Additions 824 105 929
Balance at Dec. 31, 2018 1,873 1,004 2,877
The non-current provisions comprise mainly provisions for partial retirement and employee anniversary bonuses (included in the item "other"). These obligations arise mainly in German Group companies. The partial retirement plans allow employees to work part-time for 3 - 5 years before their actual retirement.
According to IAS 19 these obligations are treated as severance payments to be earned in future periods and
are therefore recognized in profit or loss over the respective period of service. Actuarial gains and losses, as well as past service costs, on these obligations are recognized as income or expense.
Non-current provisions are reported at their present value on the reporting date. The discount rate for em-ployees on the early retirement plan is 0.1% (2017: 0.0%).
Current Provisions
During financial 2017 and 2018, the current provisions developed as follows:
Warranties € in K
Other € in K
Total € in K
Balance at Jan. 1, 2017 4,914 4,367 9,281
Currency translation –56 –73 –129
Consumption –1,362 –1,095 –2,457
Release –837 –1,539 –2,377
Additions 2,165 3,651 5,816
Other changes 0 –577 –577
Balance at Dec. 31, 2017 4,824 4,735 9,558
Warranties € in K
Other € in K
Total ¤ in K
Balance at Jan. 1, 2018 4,824 4,735 9,558
Currency translation 4 –14 –9
Consumption –934 –1,045 –1,980
Release –2,550 –649 –3,199
Additions 5,021 2,892 7,913
Other changes 0 0 0
Balance at Dec. 31, 2018 6,364 5,919 12,283
Warranty provisions contain expenses for replacement deliveries and repairs. Specific risks are recognized when the occurrence is more likely than not. General warranty risks are considered on the basis of experiences in the past. The other provisions contain mainly onerous contracts and uncertain liabilities to employees.

118 Consolidated Financial Statements and Notes Notes to the Individual Balance Sheet Items
25. Other Financial Obligations | Contingent Assets and Liabilities
As was the case in the previous years there are no significant contingent liabilities or contingent assets to be reported.
Financial Instruments | Financial Risks
A financial instrument is any contract that gives rise to a financial asset of one entity and a financial liability or equity instrument of another entity. The following sections give an overview of the impact of financial instruments on the financial statements of the Sartorius Stedim Biotech Group and provide additional information on the balance sheet items, which contain financial instruments.
26. Initial Application of IFRS 9, Financial Instruments: Transition Effects and Accounting Policies
The initial date of application of IFRS 9, Financial Instruments is January 1, 2018. The Group applies IFRS 9 retrospectively without restating the prior-year figures. The comparative period is presented in line with previous rules (IAS 39). The aggregate effects from the transition to IFRS 9 are accounted for by way of an adjustment to the opening balance of retained earnings. The effect from the initial application of IFRS 9 results from the adjustment of the credit impairment approach for trade receivables and amounts to €0.3 million. As a result, this increased retained earnings from €612.7 million as of December 31, 2017 to €613.0 million as of January 1, 2018.
IFRS 9 replaces the existing guidelines in IAS 39, Financial Instruments: recognition and measurement. IFRS 9 includes revised guidelines for classification and measurement of financial instruments, including a new model of expected credit losses for the calculation of impairments of financial assets, as well as the new general guidelines for hedge accounting. This standard also adopts the guidance of IAS 39 for recognition and derecognition of financial instruments.
Under IFRS 9, the new classification and measurement approach for financial assets reflects both the entity's business model (held-to-collect, held-to-collect-and-sell, other) within the scope of which assets are held and the contractual cash flow characteristics (so-called "SPPI" criterion, solely payments of principal and interest). For each class of the Group's financial assets, the following table provides an overview of the categories according to IAS 39 and IFRS 9, as well as the respective carrying amounts at the date of initial application of IFRS 9.

Consolidated Financial Statements and Notes Notes to the Individual Balance Sheet Items 119
Carrying amounts of financial assets at the date of initial application of IFRS 9
Category acc. to IAS 39
Carrying amount
acc. to IAS 39 Dec. 31, 2017 Reclassification
Remeasure-ment
Carrying amount acc.
to IFRS 9 Jan. 1, 2018
Category acc. to IFRS 9
€ in mn € in mn € in mn ¤ in mn
Cash and cash equivalents Loans and receivables 32.6 32.6
Measured at amortized cost
Receivables and other assets Loans and receivables 12.8 12.8
Measured at amortized cost
Derivative financial instruments in hedge relationships n/a 7.2 7.2 n/a
Other financial assets (current) 20.0 20.0
Trade receivables Loans and receivables 204.6 0.3 205.0
Measured at amortized cost
Amounts due from customers for contract work n/a 7.0 0.0 7.0 n/a
Trade receivables 211.6 0.3 211.9
Financial assets Loans and receivables 2.7 0.7 3.4
Measured at amortized cost
Financial assets Available for sale 1.6 –1.0 0.6
Debt instruments at fair value through profit or loss
Financial assets Available for sale 0.1 0.1
Equity instruments at fair value through profit or loss
Financial assets (investments in non-consolidated subsidiaries) n/a 0.1 0.1
n/a (investments in non-consolidated subsidiaries)
Derivative financial instruments in hedge relationships n/a 7.3 7.3 n/a
Financial assets (non-current) 11.8 –0.4 11.5
There were no effects on the Group's financial liabilities. The few reclassifications of financial assets were determined on the basis of individual assessments of the financial instruments, especially with regard to the contractual cash flow characteristics. For equity instruments that existed as of the date of initial application of the Standard and that were not held for trading, the Group decided to recognize future changes in the fair value of those instruments in profit or loss. This choice is generally to be made on an instrument-by-instrument basis upon initial recognition of the instrument. Reclassification at the date of initial application did not lead to measurement effects. The measurement effects presented result from the adjustment of the impairment approach for trade receivables. There were no reclassifications of financial instruments during the reporting period.
With regard to the impairment of financial assets, IFRS 9 replaces the incurred-loss model by the expected-loss model. Financial assets are generally regarded as credit-impaired when there are objective
indications that cast doubt about the full collection of the cash flows of the respective financial assets . With regard to the financial assets of the Group, the simplified approach which is applied to trade receivables is especially of relevance.
At the date of initial application of IFRS 9, the allowance for expected credit losses amounted to €0.1 million. This amount includes the expected credit loss in relation to contract assets according to IFRS 15 that do not contain a significant financing component. In the course of the transition to IFRS 9, the Group also analyzed and revised its approach for the recognition of incurred losses, given its low level of historical losses. At the date of initial application of IFRS 9, the total effect from the adjustments to the impairment approach for trade receivables amounted to €0.3 million and increased the Group's retained earnings as of January 1, 2018.

120 Consolidated Financial Statements and Notes Notes to the Individual Balance Sheet Items
The following table illustrates the effects from the adjusted impairment model for trade receivables:
Valuation allowances at the date of initial application of IFRS 9
Category acc. to IAS 39
Loss allowances acc. to IAS 39 Dec. 31, 2017
Remeasure-ment due to implementa-
tion of IFRS 9
Loss allowances acc. to IFRS 9
Jan. 1, 2018 Category acc.
to IFRS 9
€ in mn € in mn € in mn
Trade receivables Loans and receivables –2.4 0.3 –2.1
Measured at amortized cost
Amounts due from customers for contract work n/a 0.0 0.0 0.0 n/a
Trade receivables –2.4 0.3 –2.1
Besides trade receivables, cash and cash equivalents are the most material financial assets on the Group's statement of financial position as of the date of initial application of IFRS 9 and as of the reporting date, December 31, 2018. No impairment is recognized for these financial assets due to materiality considerations.
For the remaining financial assets that are measured at amortized cost, no impairment is recognized as of the date of initial application of IFRS 9 and as of December 31, 2018, for the 12-month expected credit losses, given the Group's immaterial historical losses.
Derivatives are measured at fair value determined according to the mark-to-market method in which recognized mathematical methods are used. The fair values are based on the market data available at the time the value of these derivatives is calculated and reflect the estimates of the market conditions at the end of the year. Those instruments that are not designated as hedging instruments and for which no hedge accounting is applied, are categorized as held for trading. Changes of the fair values of derivative financial instruments are either recognized in profit or loss or, in case of hedging relationships, in other comprehensive income.
The Group applies the new hedge accounting rules of IFRS 9 prospectively. The Group uses forward transactions to hedge cash flow risks that result from changes in foreign exchange rates in relation to sales of products and the procurement of materials, and designates only the spot element of the hedging instrument. No transition effects resulted from the application of the new hedge accounting requirements.
Financial Assets
Financial assets of the Group mainly include cash and cash equivalents, trade and loan receivables and derivative financial instruments with a positive fair value.
27. Cash and Cash Equivalents
The Group considers all highly liquid investments with less than three months maturity from the date of acquisition to be cash equivalents. This mainly includes checks, cash on hand and deposits in banks. Cash and cash equivalents are measured at cost. For purposes of the consolidated cash flow statement, cash and cash equivalents include cash and cash equivalents as defined above. As of December 31, 2018, cash and cash equivalents amounted to €23,975 K (2017: €32,552 K).

Consolidated Financial Statements and Notes Notes to the Individual Balance Sheet Items 121
28. Current Trade Receivables | Other Receivables
Dec. 31, 2018
¤ in K Dec. 31, 2017
€ in K
Trade receivables from third parties 204,931 192,866
Amounts due from customers for contract work* 3,902 6,967
Receivables from subsidiaries of the Sartorius AG Group 11,399 11,782
Trade receivables 220,231 211,616
*Contract assets according to IFRS 15.
The book values of trade receivables and other receivables are representative of their fair value considering the maturity date and the credit risks. The contract assets are recognized in connection with customer-specific construction contracts that meet the requirements for revenue recognition over time according to IFRS 15 (see section 9). The "Receivables from subsidiaries of the Sartorius AG Group" item refers to other companies of the Sartorius Group (please refer to section 41). Impairment losses on trade and other receivables are recognized using separate allowance accounts. For details on the determination of the impairment allowances see section 38.
29. Other Financial Assets
Dec. 31, 2018
¤ in K Dec. 31, 2017
€ in K
Derivative financial instruments 2,824 7,207
Other financial assets 19,212 12,842
Current financial assets 22,036 20,049
The amount shown as derivative financial instruments represents the fair value of foreign currency hedging instruments, mainly forward contracts (for details refer to section 35).
Other financial assets are measured at amortized cost using the effective interest method less any impairment losses. The item "Other financial assets" includes loan receivables to other entities of the Sartorius AG Group in the amount of €2,588 K (2017: €1,542 K).
Financial Liabilities
Financial liabilities of the Group mainly comprise loans borrowed from Sartorius AG, trade payables, finance lease liabilities and derivative financial instruments with a negative fair value. The financial liabilities other than derivative financial instruments are measured at amortized cost.
30. Loans and Borrowings
Balance at Dec. 31, 2018
¤ in K
of which current
Dec. 31, 2018 ¤ in K
Balance at Dec. 31, 2017
€ in K
of which current Dec. 31, 201
€ in K
Liabilities to banks 38,278 35,153 29,367 23,117
Loans from Sartorius AG 94,501 54,501 109,481 69,481
Other loans from Sartorius Group companies 163 163 3,335 3,335
Total loans and borrowings 132,942 89,817 142,183 95,933
Sartorius Stedim Biotech Group has signed a loan agreement with its parent company Sartorius AG which secures the financing of the Sartorius Stedim Biotech Group over the long term. The credit volume of this agreement is approx. 300 million euros and the interest rate is variable with a credit margin based on arms’-length principles.
The non-current loans and borrowings do not include the liabilities in connection with acquisitions which are presented in the caption “other non-current liabilities”.
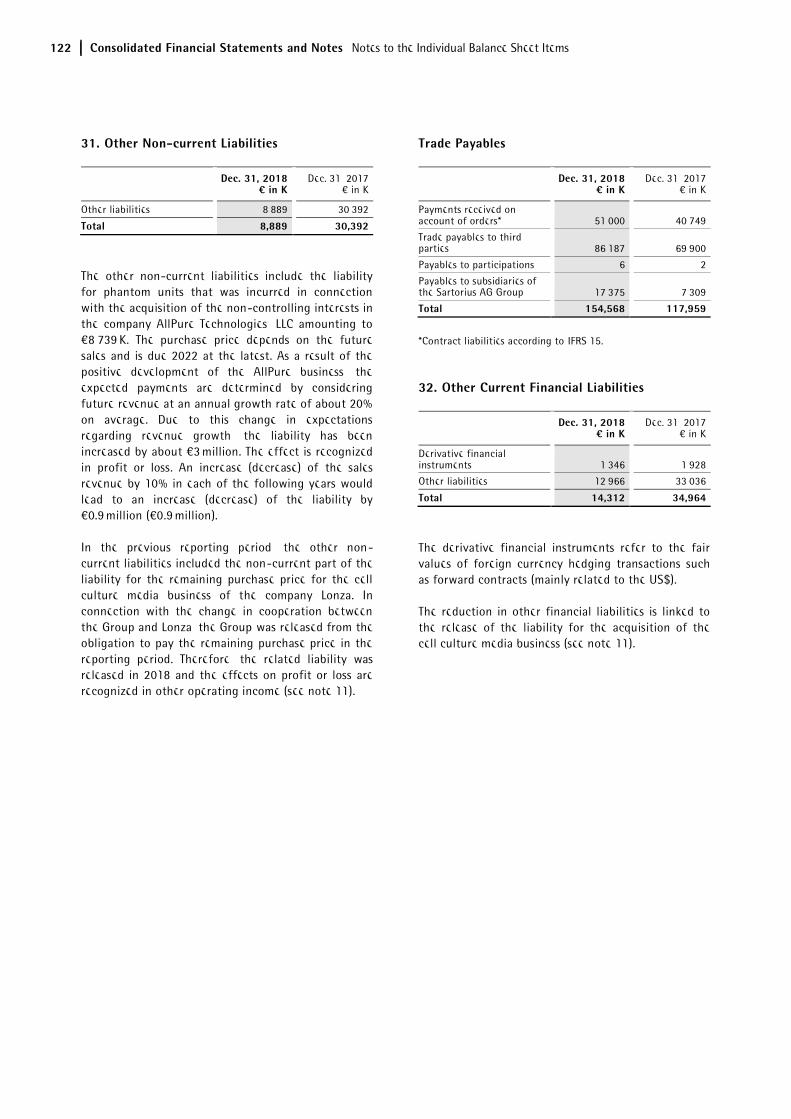
122 Consolidated Financial Statements and Notes Notes to the Individual Balance Sheet Items
31. Other Non-current Liabilities
Dec. 31, 2018
¤ in K Dec. 31, 2017
€ in K
Other liabilities 8,889 30,392
Total 8,889 30,392
The other non-current liabilities include the liability for phantom units that was incurred in connection with the acquisition of the non-controlling interests in the company AllPure Technologies, LLC amounting to €8,739 K. The purchase price depends on the future sales and is due 2022 at the latest. As a result of the positive development of the AllPure business, the expected payments are determined by considering future revenue at an annual growth rate of about 20% on average. Due to this change in expectations regarding revenue growth, the liability has been increased by about €3 million. The effect is recognized in profit or loss. An increase (decrease) of the sales revenue by 10% in each of the following years would lead to an increase (decrease) of the liability by €0.9 million (€0.9 million).
In the previous reporting period, the other non-current liabilities included the non-current part of the liability for the remaining purchase price for the cell culture media business of the company Lonza. In connection with the change in cooperation between the Group and Lonza, the Group was released from the obligation to pay the remaining purchase price in the reporting period. Therefore, the related liability was released in 2018 and the effects on profit or loss are recognized in other operating income (see note 11).
Trade Payables
Dec. 31, 2018 ¤ in K
Dec. 31, 2017 € in K
Payments received on account of orders* 51,000 40,749
Trade payables to third parties 86,187 69,900
Payables to participations 6 2
Payables to subsidiaries of the Sartorius AG Group 17,375 7,309
Total 154,568 117,959
*Contract liabilities according to IFRS 15.
32. Other Current Financial Liabilities
Dec. 31, 2018
¤ in K Dec. 31, 2017
€ in K
Derivative financial instruments 1,346 1,928
Other liabilities 12,966 33,036
Total 14,312 34,964
The derivative financial instruments refer to the fair values of foreign currency hedging transactions such as forward contracts (mainly related to the US$).
The reduction in other financial liabilities is linked to the release of the liability for the acquisition of the cell culture media business (see note 11).
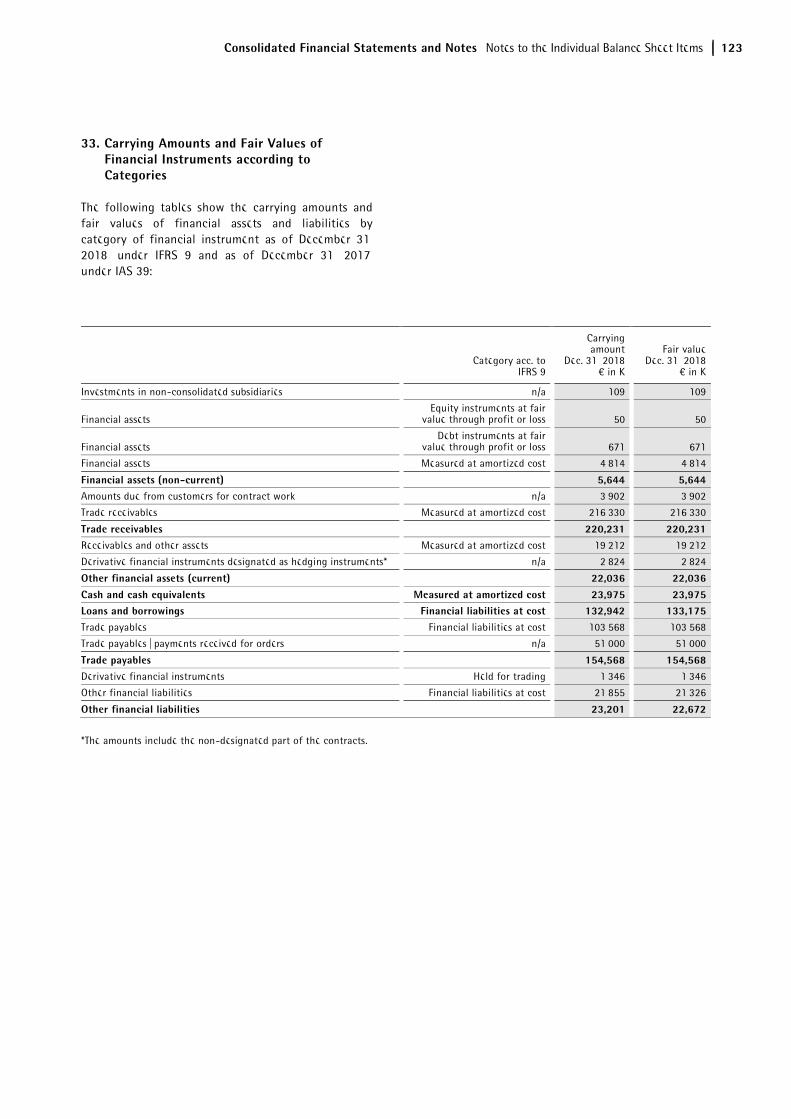
Consolidated Financial Statements and Notes Notes to the Individual Balance Sheet Items 123
33. Carrying Amounts and Fair Values of Financial Instruments according to Categories
The following tables show the carrying amounts and fair values of financial assets and liabilities by category of financial instrument as of December 31, 2018, under IFRS 9 and as of December 31, 2017, under IAS 39:
Category acc. to
IFRS 9
Carrying amount
Dec. 31, 2018 € in K
Fair value Dec. 31, 2018
€ in K
Investments in non-consolidated subsidiaries n/a 109 109
Financial assets Equity instruments at fair
value through profit or loss 50 50
Financial assets Debt instruments at fair
value through profit or loss 671 671
Financial assets Measured at amortized cost 4,814 4,814
Financial assets (non-current) 5,644 5,644 Amounts due from customers for contract work n/a 3,902 3,902
Trade receivables Measured at amortized cost 216,330 216,330
Trade receivables 220,231 220,231 Receivables and other assets Measured at amortized cost 19,212 19,212
Derivative financial instruments designated as hedging instruments* n/a 2,824 2,824
Other financial assets (current) 22,036 22,036 Cash and cash equivalents Measured at amortized cost 23,975 23,975 Loans and borrowings Financial liabilities at cost 132,942 133,175 Trade payables Financial liabilities at cost 103,568 103,568
Trade payables | payments received for orders n/a 51,000 51,000
Trade payables 154,568 154,568 Derivative financial instruments Held for trading 1,346 1,346
Other financial liabilities Financial liabilities at cost 21,855 21,326
Other financial liabilities 23,201 22,672
*The amounts include the non-designated part of the contracts.

124 Consolidated Financial Statements and Notes Notes to the Individual Balance Sheet Items
Category acc.
to IAS 39
Carrying amount
Dec. 31, 2017 € in K
Fair value Dec. 31, 2017
€ in K
Financial Assets Available for
sale 1,813 1,813
Financial Assets Loans and
receivables 2,734 2,734
Derivative financial instruments in hedging relationship Hedging
Instruments* 7,260 7,260
Non-current financial assets 11,808 11,808
Trade receivables Loans and
receivables 211,616 211,616
Financial Assets Loans and
receivables 12,842 12,842
Derivative financial instruments in hedging relationship Hedging
Instruments* 7,207 7,207
Other financial assets 20,049 20,049
Cash and cash equivalents Loans and
receivables 32,552 32,552
Loans and borrowings
Financial liabilities at
cost 142,183 142,671
Finance lease liabilities IAS 17 17,487 28,086
Trade payables
Financial liabilities at
cost 77,211 77,211
Trade payables n/a 40,749 40,749
Trade payables 117,959 117,959
Derivative financial instruments Held for trading 552 552
Derivative financial instruments in hedging relationship Hedging
Instruments* 1,376 1,376
Other financial liabilities
Financial liabilities at
cost 63,428 67,719
Other financial liabilities 65,356 69,647
*The amounts include the non-designated part of the contracts.
The fair values of the financial instruments were determined on the basis of the market information available on the reporting date and are to be allocated to one of the three levels of the fair value hierarchy in accordance with IFRS 13.
Level 1 financial instruments are measured on the basis of prices quoted on active markets for identical assets and liabilities. In Level 2, financial instruments are measured on the basis of input factors which are derivable from observable market data or on the basis of market prices for similar instruments. Level 3 financial instruments are measured on the basis of input factors that cannot be derived from observable market data.
The financial instruments to be recognized at fair value on the reporting date are mainly derivatives in the form of forward contracts. They were measured on the basis of their quoted exchange rates and market yield curves (Level 2).
The fair values to be disclosed for financial liabilities recognized at amortized cost, especially liabilities to banks and finance leases, were measured on the basis of the market interest rate, taking the current indicative credit spreads into account (Level 2).
The fair values of the remaining financial assets and liabilities to be disclosed approximate the carrying amounts on account of their predominantly short-term maturity. The maximum credit loss risk is reflected by the carrying amounts of the financial assets recognized in the Statement of Financial Position.
The Group recognizes transfers between the levels of the fair value hierarchies at the end of the reporting period during which a change has occurred. In the current reporting period, there were no transfers between the levels.

Consolidated Financial Statements and Notes Notes to the Individual Balance Sheet Items 125
34. Net Gains and Losses from Financial Instruments
The net gains and losses of the various categories of financial instruments are presented in the following table:
Categories according to IFRS 9
2018 12 months
¤ in K
Financial assets measured at amortized cost 2,771
Financial assets and liabilities measured at fair value through profit or loss 552
Financial liabilities measured at amortized cost –12,733
Categories according to IAS 39
2017 12 months
€ in K
Loans and receivables –4,121
Financial assets and liabilities held for trading 2,358
Financial liabilities at cost 1,606
The net result from financial assets measured at amortized cost mainly includes the effects of currency translation and changes in allowances.
The net result from financial assets and liabilities held for trading predominantly comprises changes in the fair value of derivative financial instruments as well as interest income and interest expenses for these financial instruments.
The net result from liabilities measured at amortized cost mainly comprises the effects of foreign currency translation.
Total interest income and expenses for financial assets and liabilities that are not measured at fair value through profit or loss were as follows:
2018 12 months
¤ in K
2017 12 months
€ in K
Interest income 463 282
Interest expenses –4,563 –5,454
Capital and Financial Risk Management
Capital Risk Management
In the Sartorius Stedim Biotech Group, capital is managed in order to maximize earnings of those participating in the company by optimizing the ratio of equity to liabilities. Furthermore, we ensure that all Group companies operate under the premise of the going-concern principle.
The financial liabilities detailed above are regarded as managed capital and, furthermore, so are the cash and cash equivalents as well as equity capital.
Goals of Financial Risk Management
The Treasury Department of the Sartorius Stedim Biotech Group is centrally focused in Sartorius Corporate Administration GmbH, a subsidiary of Sartorius AG. This centralized Treasury Department performs services for all companies of the Sartorius Group, including the Sartorius Stedim Biotech Group, and coordinates access to national and international financial markets. In addition, the Treasury Department monitors and controls financial risks by internal risk reporting, which analyzes risks according to their degree and scope. Essentially, these risks entail currency, interest rate and liquidity risks as well as credit risks.
The Sartorius Stedim Biotech Group strives to minimize the impact of currency and interest rate risks using appropriate derivative financial instruments. Hedging transactions and their controlling are carried out by different staff members. Moreover, the Group’s Internal Auditing Department regularly monitors the use of such financial instruments. Trading with derivative financial instruments is done for hedging purposes only.
35. Management of Exchange Rate Risks and Hedge Accounting
The Group is exposed to currency risks as more than one third of sales revenue is generated in U.S. dollars or currencies linked to the U.S. dollar and, to a lesser extent, in other foreign currencies. At the same time, the Group is able to compensate the major part of the revenues denominated in foreign currencies with costs incurred in the same currencies due its global production network. The share of revenues generated in foreign currencies that exceeds such costs, the so-called net currency exposure, is hedged with derivative
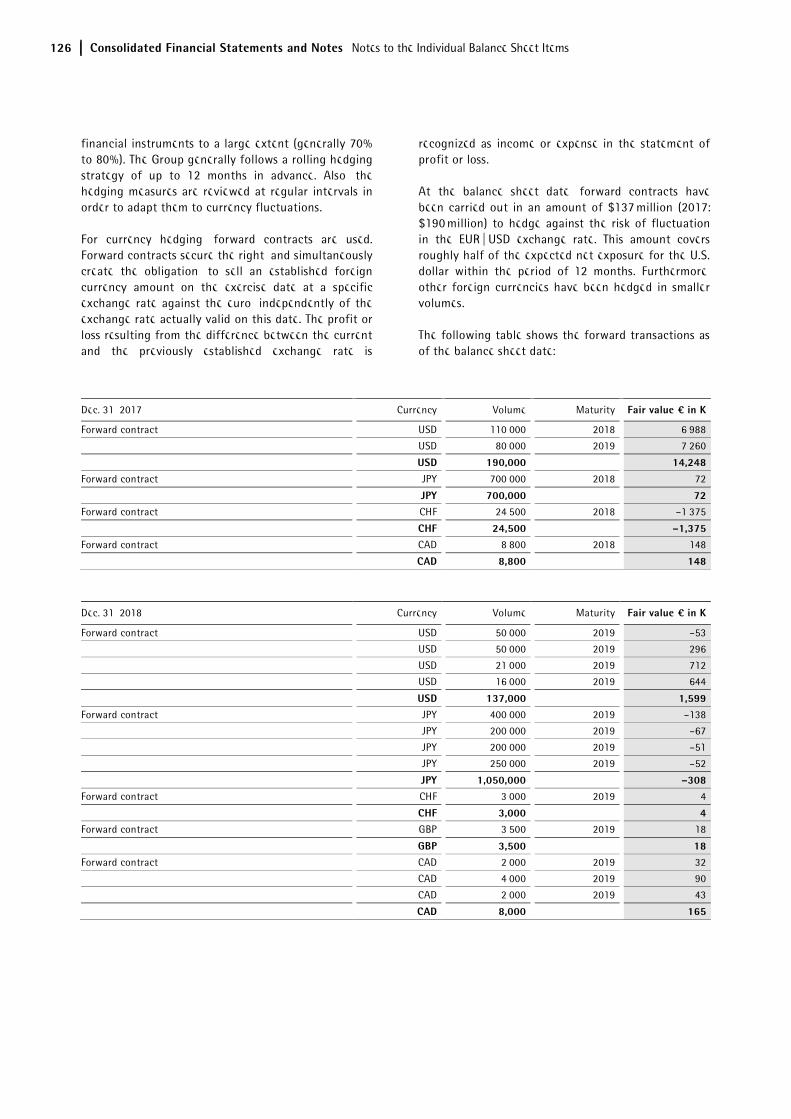
126 Consolidated Financial Statements and Notes Notes to the Individual Balance Sheet Items
financial instruments to a large extent (generally 70% to 80%). The Group generally follows a rolling hedging strategy of up to 12 months in advance. Also, the hedging measures are reviewed at regular intervals in order to adapt them to currency fluctuations.
For currency hedging, forward contracts are used. Forward contracts secure the right, and simultaneously create the obligation, to sell an established foreign currency amount on the exercise date at a specific exchange rate against the euro, independently of the exchange rate actually valid on this date. The profit or loss resulting from the difference between the current and the previously established exchange rate is
recognized as income or expense in the statement of profit or loss.
At the balance sheet date, forward contracts have been carried out in an amount of $137 million (2017: $190 million) to hedge against the risk of fluctuation in the EUR | USD exchange rate. This amount covers roughly half of the expected net exposure for the U.S. dollar within the period of 12 months. Furthermore, other foreign currencies have been hedged in smaller volumes.
The following table shows the forward transactions as of the balance sheet date:
Dec. 31, 2017 Currency Volume Maturity Fair value ¤ in K
Forward contract USD 110,000 2018 6,988
USD 80,000 2019 7,260
USD 190,000 14,248 Forward contract JPY 700,000 2018 72
JPY 700,000 72 Forward contract CHF 24,500 2018 –1,375
CHF 24,500 –1,375 Forward contract CAD 8,800 2018 148
CAD 8,800 148
Dec. 31, 2018 Currency Volume Maturity Fair value ¤ in K
Forward contract USD 50,000 2019 –53
USD 50,000 2019 296
USD 21,000 2019 712
USD 16,000 2019 644
USD 137,000 1,599 Forward contract JPY 400,000 2019 –138
JPY 200,000 2019 –67
JPY 200,000 2019 –51
JPY 250,000 2019 –52
JPY 1,050,000 –308 Forward contract CHF 3,000 2019 4
CHF 3,000 4 Forward contract GBP 3,500 2019 18
GBP 3,500 18 Forward contract CAD 2,000 2019 32
CAD 4,000 2019 90
CAD 2,000 2019 43
CAD 8,000 165

Consolidated Financial Statements and Notes Notes to the Individual Balance Sheet Items 127
Derivative financial instruments are measured at the time of acquisition at cost and at fair value on subsequent balance sheet dates. The changes in value of the derivative financial instruments are generally recognized in the statement of profit or loss on the reporting date. If the derivative financial instruments serve to hedge against cash flow risk arising from exchange rate risks and a qualified hedging relationship exists based on the criteria of IFRS 9, the valuation adjustments of the effective portion of the instrument are recognized in other comprehensive income (cumulative amount in 2018: €4.8 million; 2017: €16.4 million). Only the spot element of the forward contracts used to hedge the cash flow risks is designated as hedging instrument. The amounts recognized in equity are included in the profit or loss in the period in which the hedged transactions affect profit or loss. The changes of the hedging reserves are explained below as well as in the statement of changes
in equity. The non-designated or ineffective portion of the hedging instruments is recognized within the financial result in profit or loss.
The economic relationship between hedging instrument and hedged item and the effectiveness of the hedge relationship is determined based on consistency of the significant contractual features of the transactions (“Critical Terms Match”). In this regard, the Group performs a qualitative assessment. Hedge ineffectiveness may possibly arise when the timing of future transactions deviates from the original assumptions or the credit risk of the counterparties of the hedging instrument changes.
The following table presents the effects of the hedging instruments related to exchange rate risks on the financial position and performance of the Group:
Currency
Carrying amount
(asset) as of Dec. 31,
2018
Carrying amount
(liability) as of Dec. 31, 2018
Hedge ratio
Change in value of hedging
instruments
Change in value of hedged
item Nominal amount
Maturity: 1-6
months Maturity:
7-12
Average exercise
price
€ in K € in K € in K € in K
in K of respective
currency
USD 5,554 –661 100% 4,893 4,893 137,000 100,000 37,000 1.14
CHF 5 0 100% 5 5 3,000 3,000 0 1.13
CAD 194 0 100% 194 194 8,000 6,000 2,000 1.52
JPY 0 –302 100% –302 –302 1,050,000 600,000 450,000 130.33
GBP 16 0 100% 16 16 3,500 3,500 0 0.90
Hedging instruments that have a positive fair value are shown in the line item “financial assets (non-current)” or “other financial assets (current)” in the statement of financial position. Hedging instruments that have a negative fair value are shown in the line item “other financial liabilities (non-current)” or “other financial liabilities (current)” in the statement of financial position.
The amounts that are recognized in the reporting period in connection with the cash flow hedges in other comprehensive income as well as those amounts that were reclassified from other comprehensive income to profit or loss (in the line item "sales revenue") are presented in the statement of other comprehensive income and the statement of changes in equity.
If the U.S. dollar would have depreciated 10% against the euro, the equity would have increased by €10.7 million (2017: increase by €13.2 million), the
impact on the result would have been +€1,6 million (2017: €0.1 million). Vice versa, if the U.S. dollar would have appreciated 10% against the euro, the resulting impact on the result would have been - €2.0 million (2017: - €0.1 million) and on the other comprehensive income - €13.1 million (2017: - €16.1 million).
36. Interest Risk Management
Sartorius Stedim Biotech is mainly financed through its parent company Sartorius AG. This major loan is taken out at variable interest rates; therefore the Group continues to be exposed to interest rate risks. To control the interest risk, an appropriate ratio between fixed and variable loans is maintained. As of December 31, 2018, the Group has no open interest rate derivative contracts to hedge the risk of increasing interest rates.

128 Consolidated Financial Statements and Notes Notes to the Individual Balance Sheet Items
As of Dec. 31, 2018 the raised loans with variable interest rates amount to approx. €95 million.
If the market interest rate had been 1.0 percentage point higher, the interest expenses in the statement of profit or loss would have been €0.95 million (2017: €0.8 million) higher.
With regard to a decrease in interest rates a base interest rate of 0% has been considered. The impact on the financial result would have been €0.0 million (2017: - €0.2 million).
37. Liquidity Risk Management
The maturity of the financial liabilities excluding derivative financial instruments shows the following pattern:
The cash flows shown in the above tables include the undiscounted expected payments in connection with the respective financial liabilities including the associated interest payments based on the interest rates as of the balance sheet date.
The loans and borrowings include the loan raised from the parent company Sartorius AG. The other liabilities include the liability for the phantom units in AllPure.
The following tables illustrate the liquidity analysis for derivative financial instruments based on undiscounted cash flows:
Carrying amount
Dec. 31, 2017 € in K
Cash Flow Dec. 31, 2017 € in K
< 1 year € in K
1 - 5 years € in K
> 5 years € in K
Loans and borrowings 142,183 142,723 96,224 46,499 0
Finance Leases 17,487 32,825 1,900 7,558 23,368
Trade payables 77,211 77,211 77,211 0 0
Other liabilities (excluding derivatives) 63,428 68,965 33,036 35,780 150
Financial Liabilities 300,309 321,724 208,370 89,837 23,518
Carrying amount
Dec. 31, 2018 ¤ in K
Cash Flow Dec. 31, 2018
¤ in K < 1 year
€ in K 1 - 5 years
€ in K > 5 years
€ in K
Loans and borrowings 132,942 133,191 89,997 43,194 0
Finance Leases 16,693 33,100 1,988 9,374 21,738
Trade payables 103,568 103,568 103,568 0 0
Other liabilities (excluding derivatives) 21,855 22,208 17,515 4,542 150
Financial Liabilities 275,059 292,068 213,069 57,111 21,888

Consolidated Financial Statements and Notes Notes to the Individual Balance Sheet Items 129
Carrying amount
Dec. 31, 2017 € in K
Cash Flow Dec. 31, 2017 € in K
< 1 year € in K
1 - 5 years € in K
> 5 years € in K
Gross fulfilment Forward contracts 1,376 1,375 1,375 0 0 Payment obligation 22,308 22,308 0 0
Payment claim –20,932 –20,932 0 0
Net fulfilment Interest rate swaps 552 552 552 0 0
Derivatives 1,928 1,927 1,927 0 0
Carrying amount
Dec. 31, 2018 ¤ in K
Cash Flow Dec. 31, 2018
¤ in K < 1 year
€ in K 1 - 5 years
€ in K > 5 years
€ in K
Gross fulfilment Forward contracts 1,344 1,344 1,344 0 0 Payment obligation 42,177 42,177
Payment claim –40,833 –40,833
Derivatives 1,344 1,344 1,344 0 0
The Group controls liquidity risks by maintaining credit lines and additional facilities with banks, by continuously tracking the forecasted and actual cash flows and by managing the maturity profiles of financial assets and liabilities. It is not expected that
the cash outflows will occur at significantly different times or at significantly different amounts.
The table below provides an overview of the credit lines available on the reporting date:
Credit line at Dec. 31, 2017
< 1 year € in K
1 - 5 years € in K
> 5 years € in K
Interest rate
Credit line used at
Dec. 31, 2017
Credit line unused as of
Dec. 31, 2017
Loan from Sartorius AG 300,000 0 300,000 0 Variable 109,481 190,519
Bilateral loans 9,375 2,344 7,031 0 fix 9,375 0
Bilateral credit line 31,335 31,335 0 0 Variable 19,235 12,100
Total 340,710 33,679 307,031 0 138,091 202,619
Credit line at
Dec. 31, 2018 < 1 year
€ in K 1 - 5 years
€ in K > 5 years
€ in K Interest rate
Credit line used at
Dec. 31, 2018
Credit line unused as of
Dec. 31, 2018
Loan from Sartorius AG 309,601 0 309,601 0 Variable 94,500 215,101
Bilateral loans 6,250 3,125 3,125 0 fix 6,250 0
Bilateral credit line 23,163 23,163 0 0 Variable 16,750 6,413
Total 339,014 26,288 312,726 0 117,500 221,514
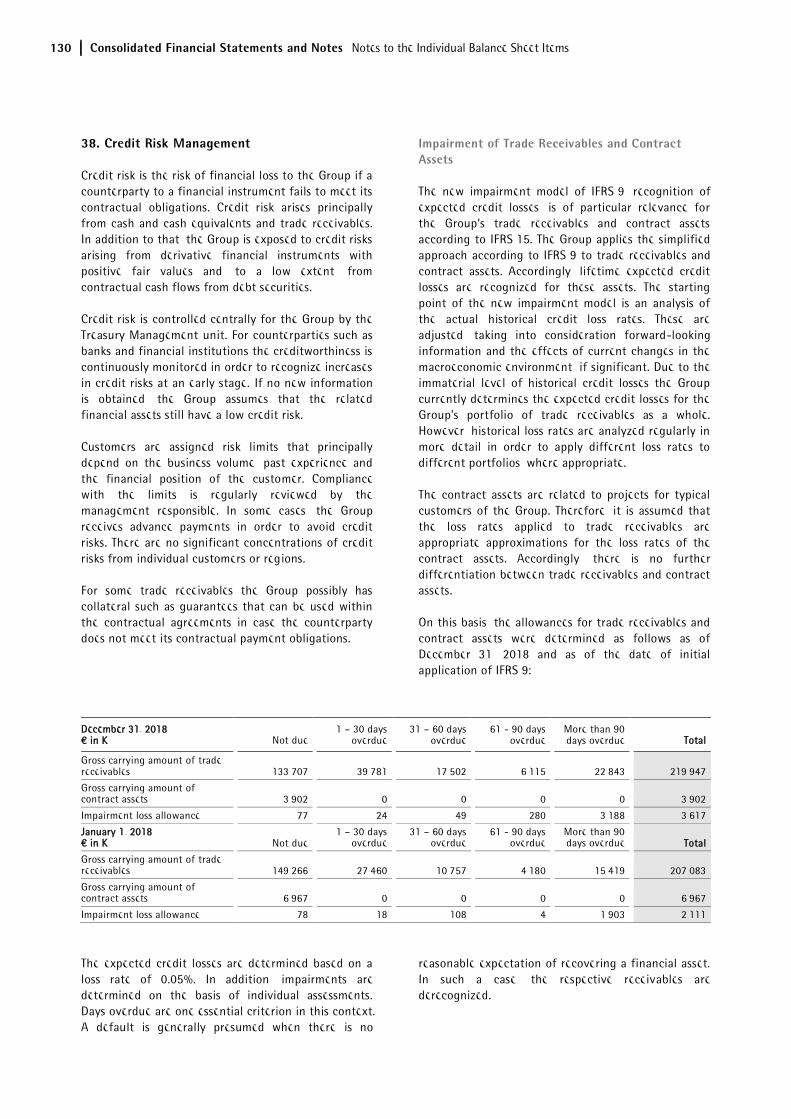
130 Consolidated Financial Statements and Notes Notes to the Individual Balance Sheet Items
38. Credit Risk Management
Credit risk is the risk of financial loss to the Group if a counterparty to a financial instrument fails to meet its contractual obligations. Credit risk arises principally from cash and cash equivalents and trade receivables. In addition to that, the Group is exposed to credit risks arising from derivative financial instruments with positive fair values and, to a low extent, from contractual cash flows from debt securities.
Credit risk is controlled centrally for the Group by the Treasury Management unit. For counterparties such as banks and financial institutions the creditworthiness is continuously monitored in order to recognize increases in credit risks at an early stage. If no new information is obtained, the Group assumes that the related financial assets still have a low credit risk.
Customers are assigned risk limits that principally depend on the business volume, past experience and the financial position of the customer. Compliance with the limits is regularly reviewed by the management responsible. In some cases, the Group receives advance payments in order to avoid credit risks. There are no significant concentrations of credit risks from individual customers or regions.
For some trade receivables the Group possibly has collateral such as guarantees that can be used within the contractual agreements in case the counterparty does not meet its contractual payment obligations.
Impairment of Trade Receivables and Contract Assets
The new impairment model of IFRS 9, recognition of expected credit losses, is of particular relevance for the Group’s trade receivables and contract assets according to IFRS 15. The Group applies the simplified approach according to IFRS 9 to trade receivables and contract assets. Accordingly, lifetime expected credit losses are recognized for these assets. The starting point of the new impairment model is an analysis of the actual historical credit loss rates. These are adjusted, taking into consideration forward-looking information and the effects of current changes in the macroeconomic environment, if significant. Due to the immaterial level of historical credit losses the Group currently determines the expected credit losses for the Group's portfolio of trade receivables as a whole. However, historical loss rates are analyzed regularly in more detail in order to apply different loss rates to different portfolios, where appropriate.
The contract assets are related to projects for typical customers of the Group. Therefore, it is assumed that the loss rates applied to trade receivables are appropriate approximations for the loss rates of the contract assets. Accordingly, there is no further differentiation between trade receivables and contract assets.
On this basis, the allowances for trade receivables and contract assets were determined as follows as of December 31, 2018 and as of the date of initial application of IFRS 9:
December 31, 2018 € in K Not due
1 – 30 days overdue
31 – 60 days overdue
61 - 90 days overdue
More than 90 days overdue Total
Gross carrying amount of trade receivables 133,707 39,781 17,502 6,115 22,843 219,947
Gross carrying amount of contract assets 3,902 0 0 0 0 3,902
Impairment loss allowance 77 24 49 280 3,188 3,617
January 1, 2018 € in K Not due
1 – 30 days overdue
31 – 60 days overdue
61 - 90 days overdue
More than 90 days overdue Total
Gross carrying amount of trade receivables 149,266 27,460 10,757 4,180 15,419 207,083
Gross carrying amount of contract assets 6,967 0 0 0 0 6,967
Impairment loss allowance 78 18 108 4 1,903 2,111
The expected credit losses are determined based on a loss rate of 0.05%. In addition, impairments are determined on the basis of individual assessments. Days overdue are one essential criterion in this context. A default is generally presumed when there is no
reasonable expectation of recovering a financial asset. In such a case, the respective receivables are derecognized.
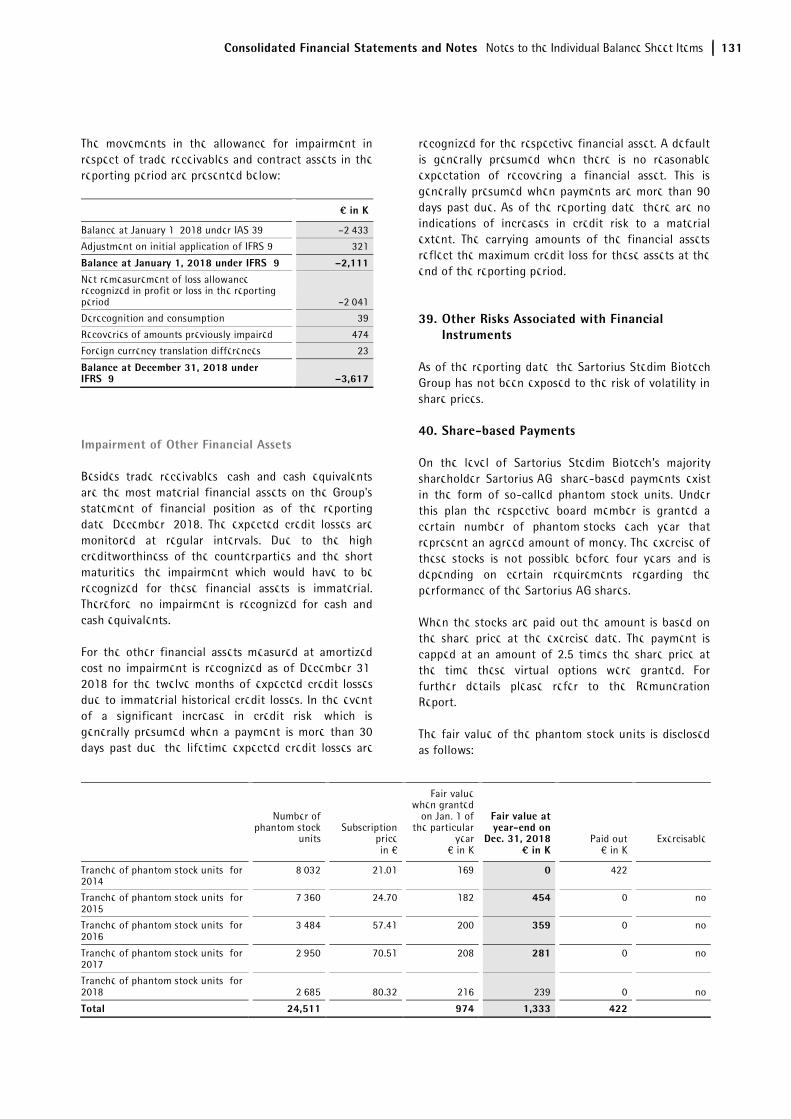
Consolidated Financial Statements and Notes Notes to the Individual Balance Sheet Items 131
The movements in the allowance for impairment in respect of trade receivables and contract assets in the reporting period are presented below:
¤ in K
Balance at January 1, 2018 under IAS 39 –2,433
Adjustment on initial application of IFRS 9 321
Balance at January 1, 2018 under IFRS 9 –2,111 Net remeasurement of loss allowance recognized in profit or loss in the reporting period –2,041
Derecognition and consumption 39
Recoveries of amounts previously impaired 474
Foreign currency translation differences 23
Balance at December 31, 2018 under IFRS 9 –3,617
Impairment of Other Financial Assets
Besides trade receivables, cash and cash equivalents are the most material financial assets on the Group's statement of financial position as of the reporting date, December, 2018. The expected credit losses are monitored at regular intervals. Due to the high creditworthiness of the counterparties and the short maturities, the impairment which would have to be recognized for these financial assets is immaterial. Therefore, no impairment is recognized for cash and cash equivalents.
For the other financial assets measured at amortized cost no impairment is recognized as of December 31, 2018 for the twelve months of expected credit losses due to immaterial historical credit losses. In the event of a significant increase in credit risk, which is generally presumed when a payment is more than 30 days past due, the lifetime expected credit losses are
recognized for the respective financial asset. A default is generally presumed when there is no reasonable expectation of recovering a financial asset. This is generally presumed when payments are more than 90 days past due. As of the reporting date, there are no indications of increases in credit risk to a material extent. The carrying amounts of the financial assets reflect the maximum credit loss for these assets at the end of the reporting period.
39. Other Risks Associated with Financial Instruments
As of the reporting date, the Sartorius Stedim Biotech Group has not been exposed to the risk of volatility in share prices.
40. Share-based Payments
On the level of Sartorius Stedim Biotech's majority shareholder Sartorius AG, share-based payments exist in the form of so-called phantom stock units. Under this plan the respective board member is granted a certain number of phantom stocks each year that represent an agreed amount of money. The exercise of these stocks is not possible before four years and is depending on certain requirements regarding the performance of the Sartorius AG shares.
When the stocks are paid out the amount is based on the share price at the exercise date. The payment is capped at an amount of 2.5 times the share price at the time these virtual options were granted. For further details please refer to the Remuneration Report.
The fair value of the phantom stock units is disclosed as follows:
Number of phantom stock
units
Subscription price in €
Fair value when granted
on Jan. 1 of the particular
year € in K
Fair value at year-end on
Dec. 31, 2018 ¤ in K
Paid out € in K
Exercisable
Tranche of phantom stock units for 2014
8,032 21.01 169 0 422
Tranche of phantom stock units for 2015
7,360 24.70 182 454 0 no
Tranche of phantom stock units for 2016
3,484 57.41 200 359 0 no
Tranche of phantom stock units for 2017
2,950 70.51 208 281 0 no
Tranche of phantom stock units for 2018 2,685 80.32 216 239 0 no
Total 24,511 974 1,333 422