Consolidated Financial Statements and Information on ......Consolidated Statement of Cash Flows,...
46
LEHIGH UNIVERSITY Consolidated Financial Statements and Information on Federal Awards June 30, 2019 (with comparative financial information for June 30, 2018) (With Independent Auditors’ Report Thereon)
Transcript of Consolidated Financial Statements and Information on ......Consolidated Statement of Cash Flows,...

LEHIGH UNIVERSITY
Consolidated Financial Statements and Information on Federal Awards
June 30, 2019 (with comparative financial information for June 30, 2018)
(With Independent Auditors’ Report Thereon)

LEHIGH UNIVERSITY
Table of Contents
Page
Independent Auditors’ Report 1
Consolidated Statement of Financial Position, June 30, 2019 (with comparative financial
information for June 30, 2018) 3
Consolidated Statement of Activities, Year ended June 30, 2019 (with summarized
comparative financial information for year ended June 30, 2018) 4
Consolidated Statement of Cash Flows, Year ended June 30, 2019 (with comparative financial
information for year ended June 30, 2018) 5
Notes to Consolidated Financial Statements 6
Schedule of Expenditures of Federal Awards, Year ended June 30, 2019 34
Notes to Schedule of Expenditures of Federal Awards 38
Independent Auditors Report on Internal Control over Financial Reporting and on Compliance
and Other Matters Based on an Audit of Financial Statements Performed in Accordance
with Government Auditing Standards 39
Independent Auditors’ Report on Compliance for the Major Federal Program; Report on
Internal Control Over Compliance; and Report on Schedule of Expenditures of Federal
Awards Required by the Uniform Guidance 41
Schedule of Findings and Questioned Costs, Year ended June 30, 2019 44

KPMG LLP is a Delaware limited liability partnership and the U.S. member firm of the KPMG network of independent member firms affiliated with KPMG International Cooperative (“KPMG International”), a Swiss entity.
KPMG LLP1601 Market StreetPhiladelphia, PA 19103-2499
Independent Auditors’ Report
The Board of Trustees
Lehigh University:
Report on the Consolidated Financial Statements
We have audited the accompanying consolidated financial statements of Lehigh University and its subsidiaries,
which comprise the consolidated statement of financial position as of June 30, 2019, and the related
consolidated statements of activities and cash flows for the year then ended, and the related notes to the
consolidated financial statements.
Management’s Responsibility for the Consolidated Financial Statements
Management is responsible for the preparation and fair presentation of these consolidated financial statements
in accordance with U.S. generally accepted accounting principles; this includes the design, implementation, and
maintenance of internal control relevant to the preparation and fair presentation of consolidated financial
statements that are free from material misstatement, whether due to fraud or error.
Auditors’ Responsibility
Our responsibility is to express an opinion on these consolidated financial statements based on our audit. We
conducted our audit in accordance with auditing standards generally accepted in the United States of America
and the standards applicable to financial audits contained in Government Auditing Standards, issued by the
Comptroller General of the United States. Those standards require that we plan and perform the audit to obtain
reasonable assurance about whether the consolidated financial statements are free from material
misstatement.
An audit involves performing procedures to obtain audit evidence about the amounts and disclosures in the
consolidated financial statements. The procedures selected depend on the auditors’ judgment, including the
assessment of the risks of material misstatement of the consolidated financial statements, whether due to fraud
or error. In making those risk assessments, the auditor considers internal control relevant to the entity’s
preparation and fair presentation of the consolidated financial statements in order to design audit procedures
that are appropriate in the circumstances, but not for the purpose of expressing an opinion on the effectiveness
of the entity’s internal control. Accordingly, we express no such opinion. An audit also includes evaluating the
appropriateness of accounting policies used and the reasonableness of significant accounting estimates made
by management, as well as evaluating the overall presentation of the consolidated financial statements.
We believe that the audit evidence we have obtained is sufficient and appropriate to provide a basis for our
audit opinion.
Opinion
In our opinion, the consolidated financial statements referred to above present fairly, in all material respects,
the consolidated financial position of Lehigh University and its subsidiaries as of June 30, 2019, and the
changes in its net assets and its cash flows for the year then ended in accordance with U.S. generally accepted
accounting principles.

2
Emphasis of Matter
As discussed in Note 1(n) to the consolidated financial statements, in 2019, the University adopted new
accounting guidance Accounting Standards Update No. 2016-14 (ASU 2016-14), Not-for-Profit Entities (Topic
958) Presentation of Financial Statements of Not-for-Profit Entities. Our opinion is not modified with respect to
this matter.
Report on Summarized Comparative Information
We have previously audited the University’s 2018 consolidated financial statements, and we expressed an
unmodified audit opinion on those audited consolidated financial statements in our report dated October 24,
2018. In our opinion, the summarized comparative information presented herein as of and for the year ended
June 30, 2018 is consistent, in all material respects, with the audited consolidated financial statements from
which it has been derived before the adjustments to adopt ASU 2016-14. As part of our audit of the 2019
consolidated financial statements, we also audited the adjustments described in Note 1(n) that were applied to
adopt ASU 2016-14 retrospectively in the 2018 consolidated financial statements. In our opinion such
adjustments are appropriate and have been properly applied.
Other Reporting Required by Government Auditing Standards
In accordance with Government Auditing Standards, we have also issued our report dated October 18, 2019 on
our consideration of the University’s internal control over financial reporting and our tests of its compliance with
certain provisions of laws, regulations, contracts, and grant agreements and other matters. The purpose of that
report is solely to describe the scope of our testing of internal control over financial reporting and compliance
and the results of that testing, and not to provide an opinion of the effectiveness of the University’s internal
control over financial reporting or on compliance. That report is an integral part of an audit performed in
accordance with Government Auditing Standards in considering Lehigh University and its subsidiaries’ internal
control over financial reporting and compliance.
Philadelphia, Pennsylvania
October 18, 2019

LEHIGH UNIVERSITY
Consolidated Statement of Financial Position
June 30, 2019(with comparative financial information for June 30, 2018)
(In thousands)
Assets 2019 2018
Cash and cash equivalents (note 1(c)) $ 50,690 58,037 Accounts receivable, net (note 6) 13,517 14,245 Prepaid expenses and other assets 9,883 13,734 Contributions receivable, net (note 9) 41,574 31,039 Notes receivable, net (note 7) 9,410 9,358 Investments (notes 3 and 5) 1,955,620 1,898,895 Funds held in trust by others 4,908 4,842 Property, plant, and equipment, net (note 8) 537,294 451,383
Total assets $ 2,622,896 2,481,533
Liabilities and Net Assets
Accounts payable and accrued expenses $ 49,709 46,702 Deferred revenues 18,592 23,862 Annuity payment obligations 18,118 18,100 Other liabilities (notes 11, 12, and 14) 102,422 59,226 Deposits held for others 1,179 1,217 Refundable federal student loan funds 1,359 1,434 Bonds, loans, and notes payable (note 11) 368,731 375,091
Total liabilities 560,110 525,632
Net assets (notes 4 and 10):Without donor restrictions 1,026,825 995,046 With donor restrictions 1,035,961 960,855
Total net assets 2,062,786 1,955,901
Total liabilities and net assets $ 2,622,896 2,481,533
See accompanying notes to consolidated financial statements.
3

LEHIGH UNIVERSITY
Consolidated Statement of Activities
Year ended June 30, 2019(with summarized comparative financial information for year ended June 30, 2018)
(In thousands)
2019Without Withdonor donor
restrictions restrictions Total 2018
Support and revenues:Tuition and fees, net (note 1(h)) $ 196,477 — 196,477 197,046 Federal grants and contracts (note 1(e)) 28,643 — 28,643 28,100 State and local grants and contracts (note 1(e)) 7,526 — 7,526 7,214 Private grants and contracts 5,222 — 5,222 6,180 Contributions (note 1(e)) 14,326 — 14,326 16,253 Investment return, net (note 3) 90,948 — 90,948 86,392 Auxiliary enterprises, net (note 1(i)) 44,491 — 44,491 43,235 Independent operations (note 1(a)) 11,441 — 11,441 21,974 Other sources 9,827 — 9,827 9,923 Net assets released from restrictions 3,161 (3,161) — —
Total support and revenues 412,062 (3,161) 408,901 416,317
Expenses:Salaries and wages 180,186 — 180,186 175,241 Employee benefits 59,508 — 59,508 61,178 Purchased services 35,753 — 35,753 34,458 Occupancy 34,274 — 34,274 32,999 Depreciation 29,997 — 29,997 28,549 Interest 13,636 — 13,636 13,886 Independent operations 10,458 — 10,458 11,054 Other business expenses 51,626 — 51,626 47,910
Total expenses (note 13) 415,438 — 415,438 405,275
Operating (loss) income (3,376) (3,161) (6,537) 11,042
Nonoperating activity:Investment return, net (note 3):
University 45,154 26,460 71,614 61,561 Independent operations (262) — (262) (2,606)
Gifts and trusts 2,582 51,440 54,022 32,779 Net assets released from restrictions and changes in donor intent 216 (216) — — Change in fair value of interest rate swaps (note 12) (9,262) — (9,262) 7,008 Postretirement plan changes other than net periodic benefit
costs (note 14):University (3,405) — (3,405) 941 Independent operations (93) — (93) 50
Other (3,465) 583 (2,882) (635)
Nonoperating income 31,465 78,267 109,732 99,098
Increase in net assets 28,089 75,106 103,195 110,140
Net assets at beginning of year, as reported 995,046 960,855 1,955,901 1,845,761 Impact of change in accounting policy (note 1(n)) 3,690 — 3,690 —
Balance as of beginning of year 998,736 960,855 1,959,591 1,845,761
Net assets at end of year $ 1,026,825 1,035,961 2,062,786 1,955,901
See accompanying notes to consolidated financial statements.
4

LEHIGH UNIVERSITY
Consolidated Statement of Cash Flows
Year ended June 30, 2019(with comparative financial information for year ended June 30, 2018)
(In thousands)
2019 2018
Cash flows from operating activities:Change in net assets $ 103,195 110,140 Adjustments to reconcile change in net assets to net cash used in operating activities:
Gifts and trusts restricted for long-term investment (41,258) (29,411) Noncash contributions (1,690) (4,553) Investment earnings restricted for long-term investment (727) (360) Net realized and unrealized gains on investments (148,762) (139,678) Change in fair value of interest rate swap agreements 9,196 (5,716) Payment of annuity obligations 1,337 1,320 Other nonoperating activity 1,791 251 Depreciation and amortization 31,057 30,020 Independent operations provision for uncollectible accounts (86) 740 University provision for uncollectible accounts 186 77 Change in operating assets and liabilities:
Decrease in accounts receivable 1,255 3,076 (Increase) decrease in contributions receivable (10,535) 2,862 (Decrease) increase in accounts payable and accrued expenses (840) 4,394 Decrease in deferred revenues (1,580) (1,492) Increase (decrease) in annuity payment obligations 18 (331) Decrease in deposits held for others (38) (129) Increase in accrued postretirement benefit cost 5,941 1,305 Increase in prepaid expenses and other assets (864) (1,500) Increase (decrease) in other liabilities 9 (1,288)
Net cash used in operating activities (52,395) (30,273)
Cash flows from investing activities:Proceeds from sale and maturity of investments 1,426,946 1,499,661 Purchases of investments (1,334,497) (1,387,477) Student loans and other notes advanced (1,464) (966) Independent operations loans advanced (1,179) (1,469) Student loans and other notes collected 1,134 3,303 Independent operations loans collected 642 393 Purchase of land, buildings, and equipment (80,822) (55,895)
Net cash provided by investing activities 10,760 57,550
Cash flows from financing activities:Proceeds from issuance of indebtedness — 2,307 Repayments of principal of indebtedness (6,285) (23,119) Gifts and trusts restricted for long-term investment 41,258 29,411 Investment earnings restricted for long-term investment 727 360 Decrease in refundable loan funds (75) (584) Payment of annuity obligations (1,337) (1,320)
Net cash provided by financing activities 34,288 7,055
Net (decrease) increase in cash and cash equivalents (7,347) 34,332
Cash and cash equivalents at beginning of year 58,037 23,705
Cash and cash equivalents at end of year $ 50,690 58,037
Supplemental data:Cash paid for interest $ 13,959 14,341 Increase in accounts payable and accrued expenses for property, plant, and equipment 3,432 — Increase in other liabilities for property, plant, and equipment 32,763 7,358
See accompanying notes to consolidated financial statements.
5

LEHIGH UNIVERSITY
Notes to Consolidated Financial Statements
June 30, 2019
(with comparative financial information for June 30, 2018)
6 (Continued)
(1) Summary of Significant Accounting Policies
(a) Organization
Lehigh University (the University), an independent, nondenominational, coeducational university, is
incorporated in the Commonwealth of Pennsylvania as a nonprofit corporation and is a tax-exempt
organization as described in Section 501(c)(3) of the Internal Revenue Code of 1986, as amended. The
University is accredited by the Middle States Association of Colleges and Schools.
Founded in 1865, the University has approximately 5,000 undergraduates within its three major units –
the College of Arts and Sciences, the College of Business, and the P.C. Rossin College of Engineering
and Applied Science – and approximately 1,800 students enrolled in graduate programs offered
through these colleges and in the College of Education.
The University’s subsidiary organization, LU Properties, LLC (LU Properties), a Pennsylvania limited
liability company, serves as Manager for twenty-three limited liability companies that were established
as a result of a real estate gift. The University is the sole member of all of the limited liability
companies. As Manager, LU Properties is responsible for the strategic and operational aspects of the
real estate investment. The results of their operations are shown as nonoperating investment return in
the University’s consolidated statement of activities.
LU Properties also serves as Manager for South River Investments LLC (South River) and So-Beth
Funding LLC (So-Beth Funding). South River, a Pennsylvania limited liability company, was formed to
own and develop certain real estate properties in the local community. The results of South River’s
operations appear in note 13, Functional Allocation of Expenses.
So-Beth Funding was formed to improve the condition of residential properties and quality of property
management in the South Bethlehem community in order to create a more attractive and safe
neighborhood for University students and the greater community. The results of So-Beth Funding’s
operations appear primarily as investment return in the University’s consolidated statement of activities.
The Ben Franklin Technology Partners of Northeastern PA (BFTP) and Manufacturers Resource
Center (MRC) are also wholly owned subsidiaries of the University. The results of their operations are
shown as independent operations in the University’s consolidated statement of activities.
BFTP is an entity that encourages public and private sector cooperation in stimulating economic
growth. BFTP provides funds to its clients under the terms of its early stage loan programs and
manufacturer grants. Considering the nature of the loans and collection history, BFTP has recorded an
estimated allowance for doubtful collections.
MRC provides resources to help small and medium-sized regional manufacturing companies enhance
their ability to compete successfully by providing consulting, education, and strategic partnering
services.
The majority of the independent operations operating revenue reported in the University’s consolidated
statement of activities relates to BFTP and MRC revenue received in the form of federal and state
grants, client fees for services, and investment return.

LEHIGH UNIVERSITY
Notes to Consolidated Financial Statements
June 30, 2019
(with comparative financial information for June 30, 2018)
7 (Continued)
The assets and liabilities of all subsidiary organizations appear in the appropriate line items of the
consolidated statement of financial position.
(b) Basis of Presentation
The accompanying consolidated financial statements of the University include all subsidiary
organizations and have been prepared on the accrual basis of accounting and in conformity with
U.S. generally accepted accounting principles (GAAP). All significant inter-organizational balances and
transactions have been eliminated.
The University’s consolidated financial statements are presented in accordance with the external
financial reporting requirements for not-for-profit organizations, which include three basic financial
statements and the classification of resources into two separate classes of net assets, as follows:
Without Donor Restrictions – Net assets that are free of donor-imposed restrictions. Net assets
without donor restrictions may be designated for specific purposes by action of the Board of
Trustees or senior management.
With Donor Restrictions – This category includes net assets subject to donor-imposed restrictions
that may be met by actions of the University or by the passage of time. Also included in this
category are net assets subject to donor-imposed restrictions to be maintained permanently by the
University. Donors of these assets generally permit the University to use all or part of the
investment income on related investments for general or specific purposes in accordance with a
Board approved spending policy.
Note 10, Net Assets, provides additional information regarding the composition of net assets with
and without donor restrictions.
Nonoperating activities reflect transactions of a long-term investment or capital nature, including
contributions restricted for acquisitions of facilities and equipment, contributions restricted with
donor-imposed stipulations, change in the fair value of interest rate swaps, gains and losses on
investments net of the University’s spending policy, and certain postretirement benefits-related
changes in net assets.
(c) Cash Equivalents
All highly liquid investments with an original maturity of three months or less, except those held for
long-term investment purposes, are considered to be cash equivalents.
(d) Investments
Investments are stated at fair value or net asset value (NAV) as a practical expedient to fair value
(note 5).
Unrealized gains and losses on investments are included in nonoperating investment return in the
consolidated statement of activities.

LEHIGH UNIVERSITY
Notes to Consolidated Financial Statements
June 30, 2019
(with comparative financial information for June 30, 2018)
8 (Continued)
The University’s investments are exposed to various risks such as interest rate, market, and credit
risks. Such risks, and the resulting investment security values, may be influenced by changes in
economic conditions and market perceptions and expectations. Accordingly, it is at least reasonably
possible that changes in the values of investment securities will occur in the near term and that such
changes could materially affect the amounts reported in the consolidated statement of financial
position.
(e) Contributions and Government Grants
Contributions received, including unconditional promises to give, are recognized as revenues when the
donor’s commitment is received. Unconditional promises to give are recognized at the estimated
present value of the future cash flows, net of allowances. Allowances for uncollectible amounts are
recorded based on management’s estimate of realizability of the underlying pledges.
Unconditional contributions, gifts, and grants with no purpose or time restrictions are reported as
revenues without donor restrictions. Contributions made towards long-lived assets are held as donor
restricted until the asset is completed and available for use. At such time, the contribution is considered
to be released from restriction and reclassified to net assets without donor restrictions. Contributions
that are released from restriction within the year received are classified as net assets without donor
restrictions. Gifts of noncash assets are recorded at their fair value.
A contribution, gift, or grant is conditional if an agreement includes a barrier that must be overcome and
either a right of return of assets transferred or a right of release of a promisor’s obligation to transfer
assets. The presence of both a barrier and a right of return or right of release indicates that a recipient
is not entitled to the contribution until it has overcome the barrier(s) in the agreement. Conditional
promises to give are not recognized until they become unconditional, that is, when the barrier(s) in the
agreement are overcome.
Contributions from federal and state government agencies are included as federal and state grants and
contracts in the consolidated statement of activities.
(f) Split-Interest Agreements and Annuities Payable
The University’s split-interest agreements with donors consist primarily of annuity, life income, and
charitable trusts for which the University serves as trustee. A majority of the assets held in these trusts
are included in investments. Contribution revenues are recognized at the date the trusts are
established after recording liabilities for the present value of the estimated future payments to be made
to the donors and/or other beneficiaries. The liabilities are adjusted during the term of the trusts for
changes in the value of the assets and changes in the estimated present value of future cash outflows
and other changes in the estimates of future benefits.

LEHIGH UNIVERSITY
Notes to Consolidated Financial Statements
June 30, 2019
(with comparative financial information for June 30, 2018)
9 (Continued)
The annuities payable represent the net present value of future cash outflows over the annuitant’s life
expectancy, as required by the annuity agreements. The net present value is calculated using a
discount rate range of 1.57% to 7.50%. The University is required by the laws of certain states to
register and maintain reserves against charitable gift annuities. Such required reserves amounted to
approximately $11.3 million and $11.1 million as of June 30, 2019 and 2018, respectively, and are
reported within investments in the consolidated statement of financial position. Actual reserves meet or
exceed the requirements and are invested in accordance with the laws of the state in which the
University offers gift annuities. These assets are managed internally in a conservative and disciplined
manner.
(g) Property, Plant, and Equipment
Property, plant, and equipment are carried at cost or at the fair market value at the date of the gift, less
accumulated depreciation. Depreciation is computed on a straight-line basis over the estimated useful
lives of the related asset. Depreciation is not recorded on land or collections. Depreciable assets and
lives generally are as follows:
Buildings 50 to 60 years
Equipment and books 5 to 10 years
Leasehold and other improvements 10 to 20 years
(h) Tuition and Fees
Tuition and fees are reported net of financial aid that effectively reduces the amount of tuition and fees
collected from students. Net tuition and fees are recorded as revenue during the year that the related
academic services are rendered. Financial aid amounts offset against gross tuition and fees for 2019
and 2018 were $106.4 million and $99.6 million, respectively.
(i) Auxiliary Enterprises
Auxiliary enterprises revenue, primarily from room and board, is reported net of financial aid that
effectively reduces the amount collected from students. Net room and board revenues are reported in
the fiscal year in which the academic programs and services are delivered.
(j) Asset Retirement Liabilities
The University recognizes a liability for legal obligations associated with asset retirements in the period
in which the obligation is incurred if a reasonable estimate of the fair value of the obligation can be
made. When the liability is initially recorded, the University capitalizes the cost of the asset retirement
obligation by increasing the carrying amount of the related long-lived asset. The liability is accreted to
its present value each period, and the capitalized cost associated with the retirement obligation is
depreciated over the useful life of the asset. Upon settlement of the obligation, any difference between
the cost to settle the asset retirement obligation and the liability recorded is recognized as a gain or
loss in the consolidated statement of activities.
LEHIGH UNIVERSITY
Notes to Consolidated Financial Statements
June 30, 2019
(with comparative financial information for June 30, 2018)
10 (Continued)
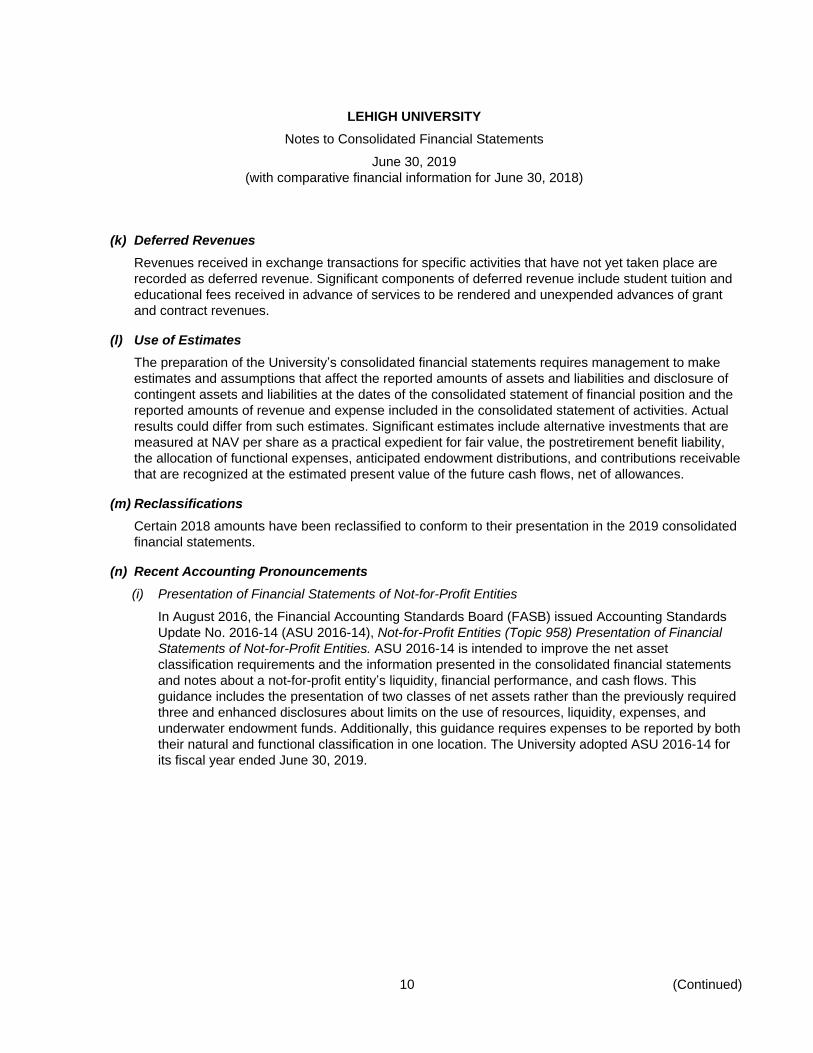
(k) Deferred Revenues
Revenues received in exchange transactions for specific activities that have not yet taken place are
recorded as deferred revenue. Significant components of deferred revenue include student tuition and
educational fees received in advance of services to be rendered and unexpended advances of grant
and contract revenues.
(l) Use of Estimates
The preparation of the University’s consolidated financial statements requires management to make
estimates and assumptions that affect the reported amounts of assets and liabilities and disclosure of
contingent assets and liabilities at the dates of the consolidated statement of financial position and the
reported amounts of revenue and expense included in the consolidated statement of activities. Actual
results could differ from such estimates. Significant estimates include alternative investments that are
measured at NAV per share as a practical expedient for fair value, the postretirement benefit liability,
the allocation of functional expenses, anticipated endowment distributions, and contributions receivable
that are recognized at the estimated present value of the future cash flows, net of allowances.
(m) Reclassifications
Certain 2018 amounts have been reclassified to conform to their presentation in the 2019 consolidated
financial statements.
(n) Recent Accounting Pronouncements
(i) Presentation of Financial Statements of Not-for-Profit Entities
In August 2016, the Financial Accounting Standards Board (FASB) issued Accounting Standards
Update No. 2016-14 (ASU 2016-14), Not-for-Profit Entities (Topic 958) Presentation of Financial
Statements of Not-for-Profit Entities. ASU 2016-14 is intended to improve the net asset
classification requirements and the information presented in the consolidated financial statements
and notes about a not-for-profit entity’s liquidity, financial performance, and cash flows. This
guidance includes the presentation of two classes of net assets rather than the previously required
three and enhanced disclosures about limits on the use of resources, liquidity, expenses, and
underwater endowment funds. Additionally, this guidance requires expenses to be reported by both
their natural and functional classification in one location. The University adopted ASU 2016-14 for
its fiscal year ended June 30, 2019.

LEHIGH UNIVERSITY
Notes to Consolidated Financial Statements
June 30, 2019
(with comparative financial information for June 30, 2018)
11 (Continued)
A recap of the net asset reclassifications driven by the adoption of ASU 2016-14 as of June 30,
2018 follows:
ASU 2016-14 Classifications
Without donor With donor Total
Net Assets Classifications restrictions restrictions net assets
As previously presented:
Unrestricted $ 988,590 — 988,590
Temporarily restricted — 397,169 397,169
Permanently restricted — 570,142 570,142
Net assets as previously
presented 988,590 967,311 1,955,901
Reclassifications to implement ASU
2016-14:
Underwater endowments 6,456 (6,456) —
Net assets, as reclassified $ 995,046 960,855 1,955,901
(ii) Clarifying the Scope and the Accounting Guidance for Contributions Received and Contributions
Made
In June 2018, the FASB issued Accounting Standards Update No. 2018-08 (ASU 2018-08),
Not-for-Profit Entities (Topic 958) Clarifying the Scope and the Accounting Guidance for
Contributions Received and Contributions Made. ASU 2018-08 is intended to assist entities in
evaluating whether transactions should be accounted for as contributions or exchange transactions
and in determining whether a contribution is conditional. The University adopted ASU 2018-08 for
its fiscal year ended June 30, 2019. This ASU did not significantly impact the University’s
consolidated financial statements.
(iii) Revenue from Contracts with Customers
In May 2014, the FASB issued Accounting Standards Update No. 2014-09 (ASU 2014-09),
Revenue from Contracts with Customers (Topic 606). ASU 2014-09 is intended to improve revenue
recognition standards. The University adopted ASU 2014-09 for its fiscal year ended June 30,
2019. The University applied ASU 2014-09 modified retrospective method by recognizing the
cumulative effect of initially applying ASU 2014-09 to the opening net assets balance at July 1,
2018. The cumulative effect of the adoption results in an increase of $3.7 million to the beginning
net assets balance. This ASU did not significantly impact the University’s consolidated financial
statements.
LEHIGH UNIVERSITY
Notes to Consolidated Financial Statements
June 30, 2019
(with comparative financial information for June 30, 2018)
12 (Continued)
(o) Prior Year Summarized Financial Information
The consolidated statement of activities includes certain prior year summarized comparative
information in total but not by net asset class. Such information does not include sufficient detail to
constitute a presentation in conformity with GAAP. Accordingly, such information should be read in
conjunction with the University’s consolidated financial statements for the year ended June 30, 2018,
from which the summarized information was derived.
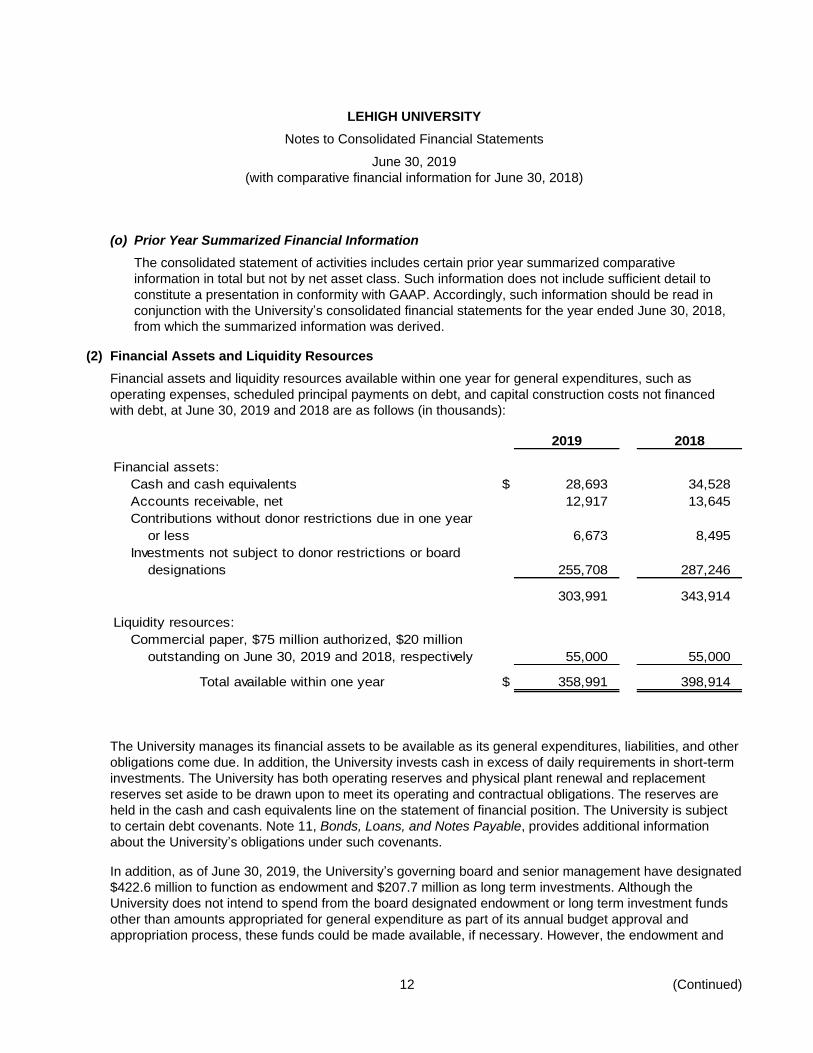
(2) Financial Assets and Liquidity Resources
Financial assets and liquidity resources available within one year for general expenditures, such as
operating expenses, scheduled principal payments on debt, and capital construction costs not financed
with debt, at June 30, 2019 and 2018 are as follows (in thousands):
2019 2018
Financial assets:
Cash and cash equivalents $ 28,693 34,528
Accounts receivable, net 12,917 13,645
Contributions without donor restrictions due in one year
or less 6,673 8,495
Investments not subject to donor restrictions or board
designations 255,708 287,246
303,991 343,914
Liquidity resources:
Commercial paper, $75 million authorized, $20 million
outstanding on June 30, 2019 and 2018, respectively 55,000 55,000
Total available within one year $ 358,991 398,914
The University manages its financial assets to be available as its general expenditures, liabilities, and other
obligations come due. In addition, the University invests cash in excess of daily requirements in short-term
investments. The University has both operating reserves and physical plant renewal and replacement
reserves set aside to be drawn upon to meet its operating and contractual obligations. The reserves are
held in the cash and cash equivalents line on the statement of financial position. The University is subject
to certain debt covenants. Note 11, Bonds, Loans, and Notes Payable, provides additional information
about the University’s obligations under such covenants.
In addition, as of June 30, 2019, the University’s governing board and senior management have designated
$422.6 million to function as endowment and $207.7 million as long term investments. Although the
University does not intend to spend from the board designated endowment or long term investment funds
other than amounts appropriated for general expenditure as part of its annual budget approval and
appropriation process, these funds could be made available, if necessary. However, the endowment and

LEHIGH UNIVERSITY
Notes to Consolidated Financial Statements
June 30, 2019
(with comparative financial information for June 30, 2018)
13 (Continued)
long term investment funds contain investments with provisions that limit or prevent liquidation that would
reduce the total investments that could be made available (note 5).
Distributions from endowments with donor restrictions for the fiscal year ending June 30, 2020 are
anticipated to be approximately $39.8 million. Such distributions will be funded from fiscal year 2020 net
investment return and from endowment investment return earned in prior years if income is less than the
University’s spending policy. Note 4, Endowment Net Assets, provides additional information about the
University’s endowment spending policy.
Student loans receivable are not considered to be available to meet general expenditures because
principal and interest on these loans are used solely to make new loans.
(3) Investments
Investments by major category at June 30, 2019 and 2018 are as follows (in thousands):
2019 2018
Short-term investments $ 100,496 132,093
Fixed income investments:
U.S. government 188,595 175,888
Corporate 123,244 164,711
Other 3,099 3,312
Corporate stocks 15,556 14,359
Mutual and exchange-traded funds 168,505 163,528
Real estate 42,071 21,158
Alternative investments:
Public equity 610,297 581,031
Absolute return 318,527 301,981
Private investments 381,257 336,968
Life insurance and other investments 3,973 3,866
Total investments $ 1,955,620 1,898,895
The University’s investments are comprised of the assets of the University’s endowment, assets supporting
certain split interest agreements, and other investments for general operating purposes. Investments are
reported at fair value or NAV as a practical expedient to fair value. Note 5, Fair Value Measurements,
provides additional information about inputs used to determine fair value and about investments reported at
NAV.
The majority of endowment and annuity fund investments are combined in investment pools with each
individual account subscribing to or disposing of shares on the basis of the fair value per share. The
investment objective is to maximize long-term total return through a combination of income and capital
appreciation in a manner consistent with sound investment practices.

LEHIGH UNIVERSITY
Notes to Consolidated Financial Statements
June 30, 2019
(with comparative financial information for June 30, 2018)
14 (Continued)
The components of total investment return are reflected below (in thousands). Investment earnings at both
June 30, 2019 and 2018 are net of investment expenses.
2019 2018
Investment earnings $ 15,656 15,060
Net realized and unrealized gains 146,906 132,893
162,562 147,953
Independent operations 2,255 7,650
Total $ 164,817 155,603
Investment return, as reflected in the consolidated statement of activities, consists of the following
components (in thousands):
2019 2018
Operating:
Endowment spending distribution $ 66,871 66,083
Spending distribution – other 11,736 11,742
Other investment earnings 12,341 8,567
90,948 86,392
Independent operations 2,517 10,256
Total operating 93,465 96,648
Nonoperating:
Endowment spending distribution 883 775
Other investment losses (net) (155) (415)
Net realized and unrealized gains, net of spending
distribution 70,886 61,201
71,614 61,561
Independent operations (262) (2,606)
Total nonoperating 71,352 58,955
Total investment return $ 164,817 155,603

LEHIGH UNIVERSITY
Notes to Consolidated Financial Statements
June 30, 2019
(with comparative financial information for June 30, 2018)
15 (Continued)
(4) Endowment Net Assets
The University’s endowment consists of approximately 2,800 individual funds established for a variety of
purposes. Its endowment includes both donor-restricted funds and funds designated by the Board of
Trustees or senior management to function as endowments (board-designated). Net assets associated with
endowment funds are classified and reported based upon the existence or absence of donor-imposed
restrictions.
From time to time, the fair value of assets associated with donor restricted endowment funds may fall below
the original gift amount. Deficiencies of this nature are reported in net assets with donor restrictions. These
deficiencies resulted from unfavorable market fluctuations that occurred after the investment of the new
donor restricted contributions.
Underwater donor restricted endowment funds at June 30, 2019 and 2018 are as follows (in thousands):
2019 2018
Fair value of underwater endowment funds $ 91,662 106,359
Original endowment gift amounts 95,813 112,829
Underwater amounts $ (4,151) (6,470)
Endowment funds include funds actively managed by the University as part of a single commingled
investment pool as well as a limited number of individual funds that are separately invested or held in trust
by others. The principal financial objective of the endowment pool is that the real purchasing power of the
endowment principal should be preserved and, if possible, enhanced, to help ensure the University’s
financial future. The productivity of the endowment pool must strike a balance between the preservation of
principal in real terms for perpetuity and supporting a spending policy that sustains the educational mission
of the University.
The Prudent Investor Rule of the Commonwealth of Pennsylvania views investment prudence on the part
of the fiduciary from the standpoint of the total portfolio. Therefore, any reasonable investment may be
considered for endowment pool assets as long as the risk and return tradeoff of the entire portfolio is
prudent. The University’s investment policy includes a target asset allocation, well diversified among
suitable asset classes that is expected to generate, on average, the level of expected return necessary to
meet endowment objectives at a responsible level of volatility consistent with achieving that return. To
monitor the effectiveness of the investment strategy of the endowment pool, performance goals are
established to exceed the expected real rate of return, established benchmark indices, and the median
return of comparable endowment funds.
Commonwealth of Pennsylvania law permits the University to allocate to operating income a minimum of
2% and a maximum of 7% of a three-year moving average of the market value of the endowed assets.
Unless the terms of the gift instrument state otherwise, accumulated endowment gains may be spent over
time by the University. Net gains in excess of the spending policy are reflected as nonoperating investment
return activity.

LEHIGH UNIVERSITY
Notes to Consolidated Financial Statements
June 30, 2019
(with comparative financial information for June 30, 2018)
16 (Continued)
The University has an endowment spending policy based on 5% of a three-year moving average market
value with a minimum increase of 0% per year and a maximum increase of 10% per year over the prior
year’s spending rate.
Any income earned in excess of the spending limit is reinvested while funds may be withdrawn from
investment return earned in prior years if income is less than the spending policy provision. This is
designed to insulate investment policy from budgetary pressures, and to insulate program spending from
fluctuations in capital markets. Average annual spending rates per share were 5.1% for fiscal years 2019
and 2018, respectively.
Endowment net asset composition as of June 30, 2019 (in thousands):
Without With
donor donor
restrictions restrictions Total
Donor-restricted endowment funds (corpus) $ — 553,202 553,202
Board-designated endowment funds
(corpus) 226,379 — 226,379
Accumulated gains on endowment funds 196,179 379,029 575,208
Total endowment net assets $ 422,558 932,231 1,354,789
Endowment net asset composition as of June 30, 2018 (in thousands):
Without With
donor donor
restrictions restrictions Total
Donor-restricted endowment funds (corpus) $ — 531,644 531,644
Board-designated endowment funds
(corpus) 224,896 — 224,896
Accumulated gains on endowment funds 190,027 355,072 545,099
Total endowment net assets $ 414,923 886,716 1,301,639

LEHIGH UNIVERSITY
Notes to Consolidated Financial Statements
June 30, 2019
(with comparative financial information for June 30, 2018)
17 (Continued)
Changes in endowment net assets for the year ended June 30, 2019 (in thousands):
Without With
donor donor
restrictions restrictions Total
Net assets, June 30, 2018 $ 414,923 886,716 1,301,639
Investment return, net 41,519 63,336 104,855
Contributions and other additions, net 457 21,087 21,544
Endowment distributions (28,848) (38,906) (67,754)
Other changes (5,493) (2) (5,495)
Total change in endowment
funds 7,635 45,515 53,150
Net assets, June 30, 2019 $ 422,558 932,231 1,354,789
Changes in endowment net assets for the year ended June 30, 2018 (in thousands):
Without With
donor donor
restrictions restrictions Total
Net assets, June 30, 2017 $ 396,445 831,541 1,227,986
Investment return, net 49,938 68,552 118,490
Contributions and other additions, net 1,131 23,330 24,461
Endowment distributions (29,871) (36,987) (66,858)
Other changes (2,720) 280 (2,440)
Total change in endowment
funds 18,478 55,175 73,653
Net assets, June 30, 2018 $ 414,923 886,716 1,301,639
(5) Fair Value Measurements
The three levels of the fair value hierarchy are described below. The hierarchy gives the highest priority to
unadjusted quoted or published prices in active markets for identical assets or liabilities (Level 1
measurements) and lowest priority to unobservable inputs (Level 3 measurements):
Level 1 – Unadjusted quoted or published prices in active markets that are accessible at the measurement
date for identical assets or liabilities.

LEHIGH UNIVERSITY
Notes to Consolidated Financial Statements
June 30, 2019
(with comparative financial information for June 30, 2018)
18 (Continued)
Level 2 – Quoted prices for instruments that are identical or similar in markets that are not active and
model-derived valuations for which all significant inputs are observable, either directly or indirectly
in active markets.
Level 3 – Prices or valuations that require inputs that are both significant to the fair value measurement and
are unobservable.
The hierarchy requires the use of observable market data when available. The level in the fair value
hierarchy within which a fair value measurement in its entirety falls is based on the lowest level input that is
significant to the measurement.
The following discussion describes the valuation methodologies used for assets and liabilities measured at
fair value:
(a) Short-Term Assets and Liabilities
The carrying amount of student accounts receivable, accounts payable and accrued expenses, and the
commercial paper component of the University’s debt approximates fair value due to the short maturity
of these financial instruments.
(b) Notes Receivable
Notes receivable are carried at face value less an allowance for doubtful accounts. A reasonable
estimate of the fair value of loans receivable under student loan programs is not practical to determine
because the federally sponsored loans are subject to significant government restrictions as to
marketability, interest rates, and repayment terms. Because of the early stage nature of the companies
to which program loans are provided by BFTP and the lack of a secondary market for such securities, it
is not practical to determine their fair value.
(c) Contributions Receivable
The University values contributions receivable at fair value on the date the pledge is received using the
present value of future cash flows. Contributions receivable are not measured at fair value subsequent
to this initial measurement, because the discount rate selected for each contribution remains constant
over time.
(d) Funds Held in Trust by Others
Funds held in trust by others are held and administered by outside trustees, with the University deriving
income or a residual interest from the assets of such funds. Funds held in trust by others are
recognized at the estimated fair value of the assets or the present value of the future cash flows when
the irrevocable trust is established or the University is notified of its existence. As of June 30, 2019 and
2018, the inputs to fair value of these funds are classified as Level 2 or Level 3, depending on whether
the assets will ultimately be distributed to the University.

LEHIGH UNIVERSITY
Notes to Consolidated Financial Statements
June 30, 2019
(with comparative financial information for June 30, 2018)
19 (Continued)
(e) Split-Interest Agreements
Depending on the type of agreement, fair value measurements for split-interest agreements are
performed either at inception or on a recurring basis. Fair value of the residual gift is generally based
on the present value of expected future cash flows including payments to beneficiaries and investment
return, and Level 3 inputs include the life expectancy of the donor and other beneficiaries as well as
financial assumptions.
(f) Interest Rate Swaps
The fair value of the University’s interest rate swap obligation is based on valuations provided by an
independent party, taking into account current interest rates and the current creditworthiness of the
swap counterparties, which are considered Level 2 inputs to fair value.
(g) Investments
Fair value of equity securities has been determined from observable market or published quotations,
when available. Fair value for fixed maturity securities is based upon prices provided by the University’s
investment managers and custodian banks. Both the investment managers and the custodian banks
use a variety of pricing sources to determine fixed maturity market valuations.
Estimated fair value of alternative investments that are not readily marketable is recorded at the NAV
as provided by external investment managers as a practical expedient for fair value. The University
reviews and evaluates the values provided by external investment managers and agrees with the
valuation methods and assumptions used in determining the NAV of those investments.
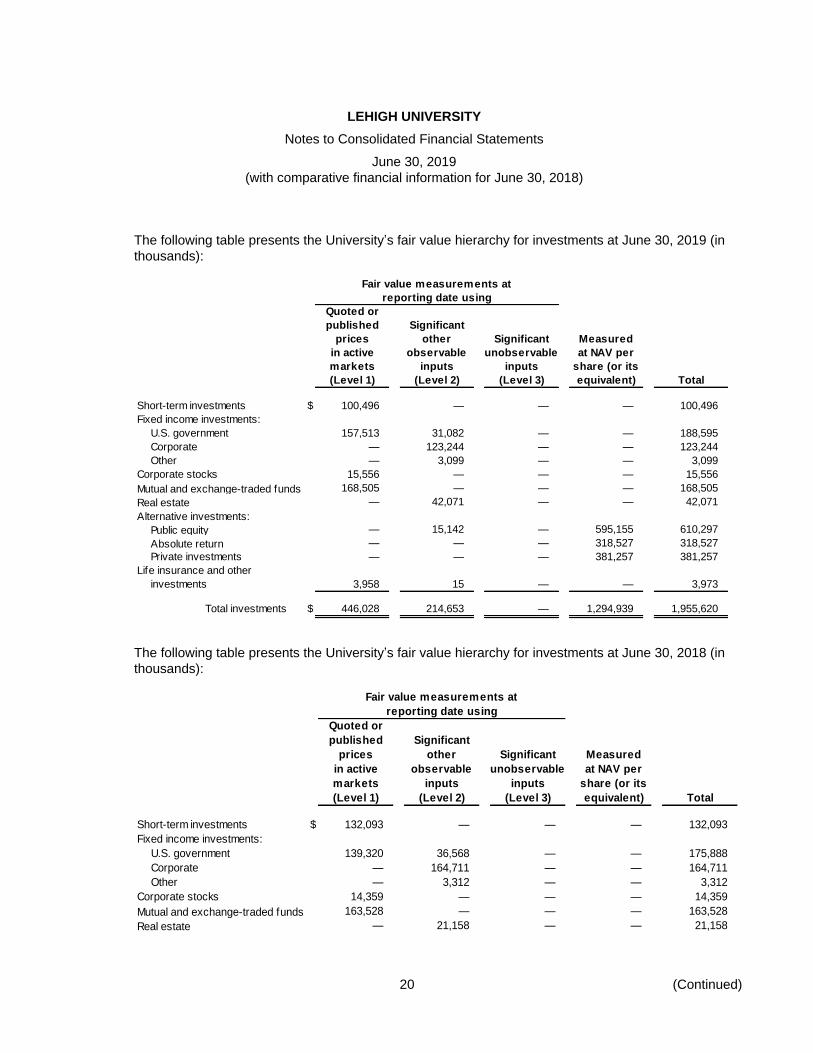
Certain investments that are measured at fair value using the NAV per share (or its equivalent)
practical expedient have not been categorized in the fair value hierarchy. The fair value amounts
presented in the tables below are intended to permit reconciliation of the fair value hierarchy to the
amounts presented in the statement of financial position.
LEHIGH UNIVERSITY
Notes to Consolidated Financial Statements
June 30, 2019
(with comparative financial information for June 30, 2018)
20 (Continued)
The following table presents the University’s fair value hierarchy for investments at June 30, 2019 (in
thousands):
Fair value measurements at
reporting date using
Quoted or
published Significant
prices other Significant Measured
in active observable unobservable at NAV per
markets inputs inputs share (or its
(Level 1) (Level 2) (Level 3) equivalent) Total
Short-term investments $ 100,496 — — — 100,496
Fixed income investments:
U.S. government 157,513 31,082 — — 188,595
Corporate — 123,244 — — 123,244
Other — 3,099 — — 3,099
Corporate stocks 15,556 — — — 15,556
Mutual and exchange-traded funds 168,505 — — — 168,505
Real estate — 42,071 — — 42,071
Alternative investments:
Public equity — 15,142 — 595,155 610,297
Absolute return — — — 318,527 318,527
Private investments — — — 381,257 381,257
Life insurance and other
investments 3,958 15 — — 3,973
Total investments $ 446,028 214,653 — 1,294,939 1,955,620
The following table presents the University’s fair value hierarchy for investments at June 30, 2018 (in
thousands):
Fair value measurements at
reporting date using
Quoted or
published Significant
prices other Significant Measured
in active observable unobservable at NAV per
markets inputs inputs share (or its
(Level 1) (Level 2) (Level 3) equivalent) Total
Short-term investments $ 132,093 — — — 132,093
Fixed income investments:
U.S. government 139,320 36,568 — — 175,888
Corporate — 164,711 — — 164,711
Other — 3,312 — — 3,312
Corporate stocks 14,359 — — — 14,359
Mutual and exchange-traded funds 163,528 — — — 163,528
Real estate — 21,158 — — 21,158

LEHIGH UNIVERSITY
Notes to Consolidated Financial Statements
June 30, 2019
(with comparative financial information for June 30, 2018)
21 (Continued)
Fair value measurements at
reporting date using
Quoted or
published Significant
prices other Significant Measured
in active observable unobservable at NAV per
markets inputs inputs share (or its
(Level 1) (Level 2) (Level 3) equivalent) Total
Alternative investments: $
Public equity — 14,695 — 566,336 581,031
Absolute return — — — 301,981 301,981
Private investments — — — 336,968 336,968
Life insurance and other
investments 3,861 5 — — 3,866
Total investments $ 453,161 240,449 — 1,205,285 1,898,895
The following redemption table clarifies the nature, risk, and liquidity of the University’s investments in
alternative investment vehicles that are reported at NAV per share (or its equivalent) at June 30, 2019
(in thousands):
Estimated Redemptionremaining Unfunded Redemption notice
Fair value lives commitments (4) terms period
Public equity (1) $ 595,155 N/A $ — weekly – 2 years 0–120 Days
Absolute return (2):
Monthly – annually280,914 N/A 5,000 when eligible 45–90 Days
37,613 up to 5 years 52,911 Generally not eligible —
318,527 57,911
Private investments (3) 381,257 up to 10 years 250,371 Generally not eligible —
Total $ 1,294,939 $ 308,282
(1) This category’s primary objective is to capture the returns of publicly traded equities on a global
market basis in order to provide long-term growth to the endowment.
(2) The primary objective of this category is to capture the returns associated with skill-based active
management by exploiting the inefficiencies associated with marketable securities, thus providing a
diversifying return stream with low correlation to returns of stocks. These funds should also provide
principal protection in equity sell-offs.

LEHIGH UNIVERSITY
Notes to Consolidated Financial Statements
June 30, 2019
(with comparative financial information for June 30, 2018)
22 (Continued)
(3) This category includes investments in private equity and real estate funds. The primary objective of
private equity funds is to achieve long-term returns in excess of public equity investments in part by
earning an illiquidity premium. The primary objective of real estate funds is to provide portfolio
diversification, with long-term returns expected to be between that of stocks and bonds. These
funds will also potentially offer some protection for the endowment in the event of inflation. Private
investments typically have commitment periods up to 12 years.
(4) The University is obligated under certain investment agreements to periodically advance additional
funding up to contractual levels. The investment agreements do not specify exact funding dates,
however, it is likely that funding will occur over the next several years. Funds to meet these
commitments will be generated from rebalancing the investment pool asset allocation, as well as
donor gifts and existing cash.
(6) Accounts Receivable, Net
Accounts receivable at June 30, 2019 and 2018 (net of allowances for doubtful accounts) are as follows (in
thousands):
2019 2018
Accounts receivable, net:
Student accounts $ 533 398
Grants and contracts 7,201 6,997
Investment income 2,329 2,327
Other 3,454 4,523
$ 13,517 14,245
Allowances for doubtful accounts were $2.4 million and $3.1 million in 2019 and 2018, respectively.

LEHIGH UNIVERSITY
Notes to Consolidated Financial Statements
June 30, 2019
(with comparative financial information for June 30, 2018)
23 (Continued)
(7) Notes Receivable, Net
Notes receivable at June 30, 2019 and 2018 are as follows (in thousands):
2019 2018
Notes receivable, net:
University:
Student loans $ 6,841 7,436
Other 1,102 250
Less allowance for doubtful loans (271) (271)
Total University 7,672 7,415
Independent operations:
Program loans 11,115 11,399
Less allowance for doubtful accounts (9,377) (9,456)
Total independent operations 1,738 1,943
$ 9,410 9,358
Independent operations notes receivable primarily consist of loans provided by BFTP to early stage firms.
The majority of these loans are fully reserved.
(8) Property, Plant, and Equipment, Net
Property, plant, and equipment are summarized as follows at June 30, 2019 and 2018 (in thousands):
2019 2018
Land and improvements $ 70,868 66,646
Buildings and improvements 723,012 685,779
Furniture, equipment, books, and collections 220,397 215,404
Construction in progress 100,974 35,415
1,115,251 1,003,244
Less accumulated depreciation (577,957) (551,861)
Total $ 537,294 451,383
Depreciation expense totaled $31.6 million and $30.0 million for the years ended June 30, 2019 and 2018,
respectively. Interest expense that was capitalized totaled $1.1 million and $0.5 million for the years ended
June 30, 2019 and 2018, respectively.

LEHIGH UNIVERSITY
Notes to Consolidated Financial Statements
June 30, 2019
(with comparative financial information for June 30, 2018)
24 (Continued)
(9) Contributions Receivable, Net
Unconditional promises to give are included in the consolidated financial statements as contributions
receivable and revenue of the appropriate net asset category. Contributions arising from unconditional
promises to give are recorded at fair value determined based on the present value of estimated future cash
flows. Contributions receivable also include charitable remainder trusts where the University is not the
trustee of the assets of the trust, but will receive a distribution upon its termination. The net present value of
contributions receivable is calculated using a discount rate range of 1.76% to 4.40%. Unconditional
promises are expected to be realized in the following periods (in thousands):
2019 2018
In one year or less $ 16,087 16,074
Between one year and five years 23,177 13,841
More than five years 6,462 3,968
45,726 33,883
Less:
Unamortized discount (1,839) (639)
Allowance for uncollectible accounts (2,313) (2,205)
$ 41,574 31,039
Contributions receivable from federal and state government agencies are included in grants receivable
(note 6). Outstanding amounts related to conditional federal grants as of June 30, 2019 were approximately
$39.7 million. Outstanding pledges that were conditional amounted to $11.4 million and $11.3 million as of
June 30, 2019 and 2018, respectively.
(10) Net Assets
Net assets without donor restrictions include the following at June 30, 2019 and 2018 (in thousands):
2019 2018
Undesignated $ 242,150 216,202
Board designated endowment funds 422,558 414,923
Annuity and life income funds 3,301 3,215
Plant funds and capital project reserves 300,874 302,894
Independent operations 57,942 57,812
$ 1,026,825 995,046

LEHIGH UNIVERSITY
Notes to Consolidated Financial Statements
June 30, 2019
(with comparative financial information for June 30, 2018)
25 (Continued)
Net assets with donor restrictions include the following at June 30, 2019 and 2018 (in thousands):
2019 2018
Contributions receivable $ 41,574 31,039
Loan funds 2,670 2,520
Annuity and life income funds 31,579 29,046
Endowment funds- corpus 553,202 531,644
Accumulated gains on endowment funds 379,029 355,072
Other – related to time and purpose restrictions 27,907 11,534
$ 1,035,961 960,855
Based upon spending restrictions in effect as of June 30, 2019, endowment funds and accumulated gains
on donor restricted endowment funds are restricted for the following future spending purposes.
. With donor restrictions
Accumulated
gains on
Endowment endowment
funds funds
Scholarships and fellowships 45 % 36 %
Professorships and chairs 12 12
Without donor purpose restrictions 19 37
Other 24 15
(11) Bonds, Loans, and Notes Payable
Bonds, loans, and notes payable are reported net of any unamortized premiums, discounts, or issuance
costs. Net unamortized premiums were $2.9 million and $3.1 million at June 30, 2019 and 2018,
respectively. Net unamortized bond issuance costs were $1.6 million and $1.7 million at June 30, 2019 and
2018, respectively. The following table presents bonds, loans, and notes payable at June 30, 2019 and
2018 (in thousands):
2019 2018
Taxable Commercial Paper Series A, up to $75 million,
weighted average interest rate of 2.35% and 2.02% on
June 30, 2019 and 2018, respectively; average duration of
63 days for the years ended June 30, 2019 and 2018 $ 20,000 20,000

LEHIGH UNIVERSITY
Notes to Consolidated Financial Statements
June 30, 2019
(with comparative financial information for June 30, 2018)
26 (Continued)
2019 2018
Northampton County General Purpose Authority (NCGPA):
Series 2000B bonds; tax-exempt variable rate revenue
bonds, $25,000 due serially from December 1, 2003 to
December 1, 2030, variable rates of 1.55% and 1.40%
on June 30, 2019 and 2018, respectively;
bonds are supported with a standby bond purchase
agreement, which expires on September 16, 2020 $ 14,752 15,632
Series 2001 bonds; tax-exempt variable rate revenue
bonds, $21,780 due serially from October 15, 2006 to
October 15, 2019, variable rate of 1.55% and 1.40%
on June 30, 2019 and 2018, respectively;
bonds are supported with a standby bond purchase
agreement, which expires on October 15, 2019 1,944 5,037
Series 2004 bonds; tax-exempt index rate revenue bonds,
$50,000 due serially from May 15, 2025 to May 15, 2034,
rates of 2.45% and 2.10% on June 30, 2019 and 2018,
respectively 49,795 49,776
Series 2006A bonds; tax-exempt variable rate revenue
bonds, $16,820 due serially from November 15, 2007
to November 15, 2021, variable rates of 1.50% and
1.36% on June 30, 2019 and 2018, respectively 5,497 7,196
Series 2007 bonds; tax-exempt revenue bonds,
$24,615 variable rate CPI bonds due serially from
November 15, 2019 to November 15, 2025, variable rates
of 3.03% and 3.53% on June 30, 2019 and 2018
respectively 24,557 24,541
Series 2016A bonds; 4.00% to 5.00% tax-exempt fixed
rate revenue bonds, $26,715 due serially from
November 15, 2026 to November 15, 2036 29,475 29,649
Series 2016B bonds; tax-exempt variable rate revenue
bonds, $74,950 due serially from November 15, 2017
to November 15, 2039, variable rate of 2.48%
and 2.16% on June 30, 2019 and 2018, respectively 73,531 74,111
Series 2016 taxable bonds; $150,000 due serially
from November 15, 2044 to November 15, 2046,
fixed rate 3.48% 149,180 149,149
$ 368,731 375,091
LEHIGH UNIVERSITY
Notes to Consolidated Financial Statements
June 30, 2019
(with comparative financial information for June 30, 2018)
27 (Continued)
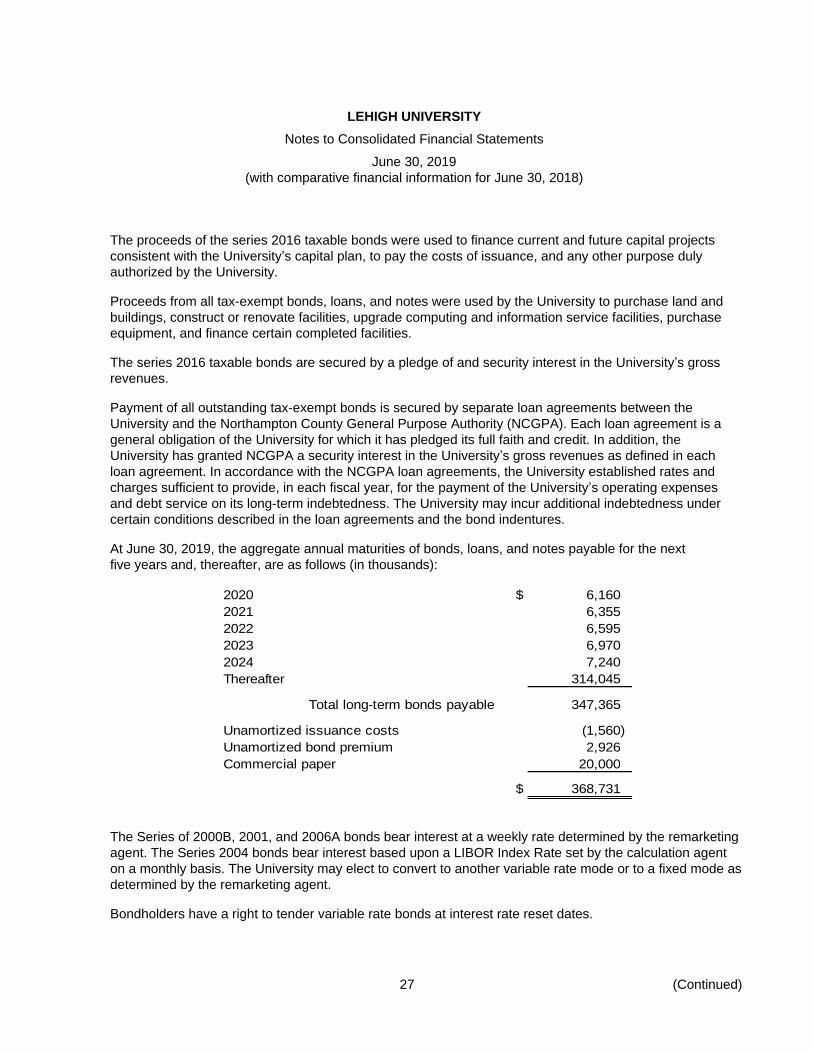
The proceeds of the series 2016 taxable bonds were used to finance current and future capital projects
consistent with the University’s capital plan, to pay the costs of issuance, and any other purpose duly
authorized by the University.
Proceeds from all tax-exempt bonds, loans, and notes were used by the University to purchase land and
buildings, construct or renovate facilities, upgrade computing and information service facilities, purchase
equipment, and finance certain completed facilities.
The series 2016 taxable bonds are secured by a pledge of and security interest in the University’s gross
revenues.
Payment of all outstanding tax-exempt bonds is secured by separate loan agreements between the
University and the Northampton County General Purpose Authority (NCGPA). Each loan agreement is a
general obligation of the University for which it has pledged its full faith and credit. In addition, the
University has granted NCGPA a security interest in the University’s gross revenues as defined in each
loan agreement. In accordance with the NCGPA loan agreements, the University established rates and
charges sufficient to provide, in each fiscal year, for the payment of the University’s operating expenses
and debt service on its long-term indebtedness. The University may incur additional indebtedness under
certain conditions described in the loan agreements and the bond indentures.
At June 30, 2019, the aggregate annual maturities of bonds, loans, and notes payable for the next
five years and, thereafter, are as follows (in thousands):
2020 $ 6,160
2021 6,355
2022 6,595
2023 6,970
2024 7,240
Thereafter 314,045
Total long-term bonds payable 347,365
Unamortized issuance costs (1,560)
Unamortized bond premium 2,926
Commercial paper 20,000
$ 368,731
The Series of 2000B, 2001, and 2006A bonds bear interest at a weekly rate determined by the remarketing
agent. The Series 2004 bonds bear interest based upon a LIBOR Index Rate set by the calculation agent
on a monthly basis. The University may elect to convert to another variable rate mode or to a fixed mode as
determined by the remarketing agent.
Bondholders have a right to tender variable rate bonds at interest rate reset dates.

LEHIGH UNIVERSITY
Notes to Consolidated Financial Statements
June 30, 2019
(with comparative financial information for June 30, 2018)
28 (Continued)
The University entered into separate standby bond purchase agreements with banks to provide liquidity in
case of tender of the 2000B or 2001 bonds. These agreements expire prior to the maturity of the bonds and
may be extended at the University’s request. However, the banks have no obligation to agree to the
extended purchase period.
The University serves as the liquidity facility for its 2006A bonds and the Commercial Paper program. As of
June 30, 2019, the University estimates that $90.1 million of liquid assets were available on a same day
basis and an additional $79.6 million was available within 7 days.
Included in other liabilities is a finance lease obligation of $40.1 million related to the construction of a
student housing residence facility on the University’s land. The related construction costs are capitalized
and included in property, plant, and equipment, net on the consolidated statement of financial position.
As a component of the tax-exempt debt portfolio, the University entered into interest rate swap agreements
that effectively convert certain variable rate revenue bond obligations to fixed rates or reduce the
University’s effective interest rate. Significant terms of each of the swap agreements are as follows (in
thousands):
Current
Effective notional University University Expiration
Series Counterparty date amount pays receives date
2000B bonds JPMorgan Chase 12/7/2000 $ 14,815 4.530 % 67% of USD- 12/1/2030
Bank, N.A. 1-month
LIBOR-BBA
2001 bonds JPMorgan Chase 9/4/2001 1,945 4.400 67% of USD- 10/15/2019
Bank, N.A. 1-month
LIBOR-BBA
2004 bonds Wells Fargo 12/18/2008 50,000 1.953 67% of USD- 5/15/2034
Bank, N.A. 3-month
LIBOR-BBA
2006A bonds JPMorgan Chase 8/24/2006 5,505 3.392 67% of USD- 11/15/2021
Bank, N.A. 1-month
LIBOR-BBA
2007 CPI bonds JPMorgan Chase 2/1/2007 24,615 3.980 to Variable rate various
Bank, N.A. 4.530 based on through
CPI-U 11/15/2025
2016B bonds Wells Fargo 10/6/2016 73,770 1.148 70% of USD- 11/15/2039
Bank, N.A. 1-month
LIBOR-BBA
$ 170,650

LEHIGH UNIVERSITY
Notes to Consolidated Financial Statements
June 30, 2019
(with comparative financial information for June 30, 2018)
29 (Continued)
(12) Derivative Instruments
The University employs derivatives, primarily interest rate swap agreements, to manage interest rate risk
associated with outstanding debt. The net fair value of the University’s swap agreements is included in
other assets or other liabilities in the statement of financial position, and was recorded as a $4.5 million
liability and a $4.7 million asset at June 30, 2019 and 2018, respectively. The change in fair value of the
interest rate swaps is reflected in nonoperating activity on the statement of activities and was $(9.3) million
and $7.0 million for the years ended June 30, 2019 and 2018, respectively.
Certain of the University’s interest rate swap agreements contain provisions that require the University’s
debt to maintain an investment grade credit rating from each of the major credit rating agencies. If the
University’s debt were to fall below investment grade, it would be a violation of these provisions, and the
counterparties to the rate swap agreement could request next-day full collateralization on all rate swaps in
net liability positions. To date, the University has not posted collateral for any rate swap agreements. If the
credit-risk-related contingent features underlying these agreements were triggered on June 30, 2019, the
University would be required to post an additional $7.2 million of collateral to its counterparties.

LEHIGH UNIVERSITY
Notes to Consolidated Financial Statements
June 30, 2019
(with comparative financial information for June 30, 2018)
30 (Continued)
(13) Functional Allocation of Expenses
The following table includes operating expenses by type and function for the year ended June 30, 2019 and by function for the year ended
June 30, 2018 (in thousands):
Public Academic Student Institutional Auxiliary Independent
Instruction Research service support services support enterprises operations Total
Salaries and w ages $ 87,945 18,799 831 15,537 17,101 35,790 4,183 3,624 183,810
Employee benefits 30,450 3,758 208 5,659 5,485 12,748 1,200 1,027 60,535
Purchased services 2,501 4,957 198 2,335 2,321 10,394 13,047 1,769 37,522
Occupancy 10,506 2,273 241 2,470 2,516 4,739 11,529 635 34,909
Depreciation 9,386 5,033 185 3,376 3,052 5,353 3,612 1,611 31,608
Interest 6,658 1,450 62 1,167 1,289 2,689 321 — 13,636
Other expenses 13,075 7,675 1,290 8,754 8,601 5,542 6,689 1,792 53,418
Total $ 160,521 43,945 3,015 39,298 40,365 77,255 40,581 10,458 415,438
2018 Total $ 156,074 44,138 2,618 38,237 39,029 75,170 38,955 11,054 405,275
The consolidated financial statements report certain categories of expenses that are attributable to more than one function. Therefore, these
expenses require allocation on a reasonable basis that is consistently applied. The expenses that are allocated include employee benefits,
interest, and certain occupancy expenses, which are allocated on the basis of salary and wage expense.
Fund-raising costs were approximately $14.4 million and $11.1 million in 2019 and 2018, respectively, and are included in institutional
support.

LEHIGH UNIVERSITY
Notes to Consolidated Financial Statements
June 30, 2019
(with comparative financial information for June 30, 2018)
31 (Continued)
(14) Postretirement and Postemployment Benefits Other than Pensions
The University pays for a portion of the cost of medical insurance for retired employees and their eligible
dependents. During fiscal year 2019, the University reimbursed retirees a maximum of $102.30 per month
for premium expenses. The maximum monthly reimbursement amount will increase each year at the lesser
of medical Consumer Price Index (CPI) or 8%. These postretirement medical benefits accrue from the later
of date of hire or age 30. The University uses a July 1 measurement date for its plan. Summarized plan
information is stated below (in thousands):
The following shows the reconciliation of the beginning and ending balances of the benefit obligation (in
thousands):
2019 2018
Benefit obligation at beginning of year $ 46,295 44,990
Operating:
Service cost 1,602 1,548
Interest cost 2,034 1,849
Benefits paid (1,193) (1,101)
Total operating 2,443 2,296
Nonoperating:
Actuarial gain — (92)
Assumption changes 3,498 (899)
Total nonoperating loss (gain) 3,498 (991)
Benefit obligation at end of year $ 52,236 46,295
The following table sets forth the status of the plan, which is unfunded, at June 30, 2019 and 2018:
2019 2018
Accumulated postretirement benefit obligation:
Retirees $ 17,300 17,155
Fully eligible active plan participants 16,521 15,034
Other active plan participants 18,415 14,106
Total 52,236 46,295
Plan assets at fair value — —
Accumulated postretirement benefit liability $ 52,236 46,295

LEHIGH UNIVERSITY
Notes to Consolidated Financial Statements
June 30, 2019
(with comparative financial information for June 30, 2018)
32 (Continued)
Weighted average assumptions for the years ended June 30, 2019 and 2018 are as follows:
2019 2018
Discount rate for net periodic postretirement benefit cost 4.45 % 4.16 %
Discount rate for accumulated postretirement benefit obligation 3.90 4.45
Maximum increase in reimbursement rate lesser of lesser of
medical CPI medical CPI
or 8% or 8%
Assumed healthcare cost trend rate at June 30, 2019 and 2018 is as follows:
2019 2018
Healthcare cost trend rate assumed for next year 4.25 % 4.25 %
Rate to which the cost trend rate is assumed to decline
(ultimate rate) 4.25 4.25
Year that ultimate rate is reached N/A N/A
Impact of 1% increase in assumed healthcare cost trend rate at June 30, 2019 and 2018 is as follows (in
thousands):
2019 2018
Increase in accumulated postretirement benefit obligation $ 10,117 8,966
Increase in net periodic postretirement benefit cost 948 905
Estimated future University contributions reflecting expected future service are as follows (in thousands):
Fiscal year ending June 30:
2020 $ 1,274
2021 1,380
2022 1,489
2023 1,607
2024 1,725
2025 through 2029 10,593

LEHIGH UNIVERSITY
Notes to Consolidated Financial Statements
June 30, 2019
(with comparative financial information for June 30, 2018)
33
(15) Retirement Plans
The University provides pensions to substantially all salaried faculty and staff through a
defined-contribution plan administered by Teacher’s Insurance and Annuity Association/College Retirement
Equities Fund. The plan features base contributions from the University and voluntary employee
contributions with a University match. Total expense for this plan was $14.8 million and $14.6 million in
2019 and 2018, respectively.
(16) Grants and Contracts
The University receives grant and contract revenue from various government agencies and private sources
for the support of research, training, and other sponsored programs. Revenues associated with the direct
costs of these programs are recognized as the related costs are incurred. Indirect cost reimbursements
from federal agencies are based on predetermined rates negotiated with the University’s cognizant agency,
the Office of Naval Research, and are in effect through fiscal year 2020. These rates are also used for
other sponsored programs except where separately negotiated. Indirect cost reimbursements from all
sources totaled $9.1 million and $8.6 million in 2019 and 2018, respectively.
(17) Commitments and Contingencies
Open commitments with general contractors, engineering firms, and other vendors related to the
construction, renovation, and repair of certain facilities amounted to approximately $22.1 million and
$52.6 million as of June 30, 2019 and 2018, respectively.
The University leases certain equipment and real property. These leases are classified as operating leases
and have lease terms ranging from one to ten years. Total lease expenses were approximately $2.9 million
and $1.6 million in 2019 and 2018, respectively.
(18) Income Taxes
The University has been recognized by the Internal Revenue Service (IRS) as exempt from federal income
tax under Section 501(c)(3) of the U.S. Internal Revenue Code, except for taxes on income from activities
unrelated to its exempt purpose. There was no provision for income taxes due on unrelated business
income in the accompanying consolidated financial statements. Accounting principles generally accepted in
the United States of America require management to evaluate tax positions taken by the University and
recognize a tax liability (or asset) if the University has taken an uncertain tax position that more likely than
not would not be sustained upon examination by the IRS. Management has analyzed the tax positions
taken by the University, and has concluded that as of June 30, 2019 there are no uncertain positions taken
or expected to be taken that would require recognition of a liability (or asset) or disclosure in the
consolidated financial statements. The University is subject to routine audits by taxing jurisdictions;
however, there are currently no audits for any tax periods in progress.
(19) Subsequent Events
The University has evaluated subsequent events through October 18, 2019, the date the consolidated
financial statements were issued, and concluded that there are no items requiring disclosure.

LEHIGH UNIVERSITY
Schedule of Expenditures of Federal Awards
Year ended June 30, 2019
PassedPass-through entity through to Total
Program: Federal sponsor/project title CFDA # Identifying number Pass-through Entity subrecipients expenditures
Student Financial Assistance ClusterU.S. Department of Education:
Federal Supplemental Education Opportunity Grant 84.007 $ — 462,742 Federal Perkins Loan Program 84.038 — 2,105,699 Federal Work Study Program 84.033 — 574,635 Federal Pell Grant Program 84.063 — 4,090,684 Federal Direct Loan Program 84.268 — 19,706,332
Total Student Financial Assistance Cluster — 26,940,092
Research and Development Cluster:Department of Commerce:
Ocean Exploration 11.011 2,914 26,912 Golf Coast Ecosystem Restoration Science, Observation, Monitoring, and Technology 11.451 80,462 325,931 Center for Sponsored Coastal Ocean Research_Coastal Ocean Program 11.478 3,270 514,800
DOD – U.S. Air Force:Air Force Defense Research Sciences Program 12.800 74,737 485,693 Air Force Defense Research Sciences Program 12.800 FA8650-15-C-1855 National Center for Defense Manufacturing and Machining — 45,818 Air Force Defense Research Sciences Program 12.800 FA9550-18-1-0363 University of Nevada, Reno — 57,571 Air Force Defense Research Sciences Program 12.800 FA9550-17-1-0367 Virginia Polytechnic Institute and State University — 88,258
Subtotal 74,737 677,340
DOD-U.S. Army-Research Laboratory:Basic Scientific Research 12.431 80,269 441,528
DOD – U.S. Navy:Basic and Applied Scientific Research 12.300 112,657 1,365,261 Basic and Applied Scientific Research 12.300 N00014-18-1-2407 University of Utah — 43,309 Basic and Applied Scientific Research 12.300 N00014-16-1-2515 University of Virginia — 236,897
Subtotal 112,657 1,645,467
Basic, Applied, and Advanced Research in Science and Engineering 12.630 W911NF-12-2-0022 Johns Hopkins University — 102,928
DOD-Defense Advanced Research Projects Agency:Research and Technology Development 12.910 N660011824026 Northwestern University — 149,039 Research and Technology Development 12.910 HR0011-12-C-0035 The Boeing Company — 23,104
Subtotal — 172,143
U.S. Dept of Energy:Office of Science Financial Assistance Program 81.049 — 1,413,126 Office of Science Financial Assistance Program 81.049 DE-SC0017232 Advanced Cooling Technologies, Inc. — 164,459 Office of Science Financial Assistance Program 81.049 DE-SC0019664 Advanced Cooling Technologies, Inc. — 4,677 Office of Science Financial Assistance Program 81.049 DE-SC0001057 Carnegie Institute of Washington — 25,701 Office of Science Financial Assistance Program 81.049 DE-SC0018592 Energy Research Company — 34,714 Office of Science Financial Assistance Program 81.049 DE-SC0012577 Georgia Institute of Technology — 180,682 Office of Science Financial Assistance Program 81.049 DE-AC52-07NA27344 Lawrence Livermore National Laboratory — 32,883
Subtotal — 1,856,242
Renewable Energy Research and Development 81.087 — 25,337
Fossil Energy Research and Development 81.089 80,235 178,752 Fossil Energy Research and Development 81.089 DE-FE0031673 Trustees of the University of Pennsylvania — 89,077
Subtotal 80,235 267,829
34 (Continued)

LEHIGH UNIVERSITY
Schedule of Expenditures of Federal Awards
Year ended June 30, 2019
PassedPass-through entity through to Total
Program: Federal sponsor/project title CFDA # Identifying number Pass-through Entity subrecipients expenditures
Stewardship Science Grant Program 81.112 $ — 225,203 Energy Efficiency and Renewable Energy Information Dissemination, Outreach,
Training and Technical Analysis/Assistance 81.117 — 358,518 Electricity Delivery and Energy Reliability, Research Development and Analysis (B) 81.122 DE-OE0000779 University of Arkansas — 757,172 National Nuclear Security Administration (NNSA) Minority Serving
Institutions (MSI) Program 81.123 DE-AC52-07NA27344 Lawrence Livermore National Laboratory — 47,623
Advanced Research Projects Agency – Energy 81.135 DE-AR0000582 Advanced Cooling Technologies, Inc. 1,530 16,343 Advanced Research Projects Agency – Energy 81.135 — 36,479
Subtotal 1,530 52,822
U.S. Department of Education:Graduate Assistance in Areas of National Need 84.200 — 223,902
Education Research, Development and Dissemination 84.305 R305A140356 Ohio University — 259,848 Education Research, Development and Dissemination 84.305 R305A160080 University of Minnesota — 45,504
Subtotal — 305,352
Research in Special Education 84.324 398,358 900,925
National Institutes of Health:Oral Diseases and Disorders Research 93.121 — 229,301 Research Related to Deafness and Communication Disorders 93.173 — 182,643 Mental Health Research Grants 93.242 5R01MH094435-05 University of North Carolina at Greensboro — (81) Alcohol Research Programs 93.273 66,793 166,283
Drug Abuse and Addiction Research Programs 93.279 5R01DA043567-02 Dignity Health – St. Joseph’s Hospital and Medical Center — 125,170 Drug Abuse and Addiction Research Programs 93.279 5R25DA028567-09 Regents of the University of California — 12,258
Subtotal — 137,428
Discovery and Applied Resh for Tech Innovations to Improve Human Health 93.286 13,306 279,903
Minority Health and Health Disparities Research 93.307 277,754 402,159 Minority Health and Health Disparities Research 93.307 5R01MD011573-03 Medical College of Wisconsin — 35,669 Minority Health and Health Disparities Research 93.307 1R01MD008940 University of Arizona — 40,483
Subtotal 277,754 478,311
Cancer Biology Research 93.396 2,069 14,530 Cardiovascular Diseases Research 93.837 — 139,692
Blood Diseases and Resources Research 93.839 14,636 170,515 Blood Diseases and Resources Research 93.839 5R01HL082808-13 Emory University — 73,643
Subtotal 14,636 244,158
Arthritis Musculoskeletal and Skin Diseases Research 93.846 5U54AR055073-13 Rutgers University — 383,934 Arthritis Musculoskeletal and Skin Diseases Research 93.846 2U54AR055073-12 University of Medicine & Dentistry of New Jersey — 5,141
Subtotal — 389,075
Extramural Research Programs in the Neurosciences and Neurological Disorders 93.853 — 389,990 Extramural Research Programs in the Neurosciences and Neurological Disorders 93.853 1R21NS096948-02 Massachusetts General Hospital — 57,861
Subtotal — 447,851
Allergy and Infectious Diseases Research 93.855 — 94,360
35 (Continued)

LEHIGH UNIVERSITY
Schedule of Expenditures of Federal Awards
Year ended June 30, 2019
PassedPass-through entity through to Total
Program: Federal sponsor/project title CFDA # Identifying number Pass-through Entity subrecipients expenditures
Biomedical Research and Research Training 93.859 $ 68,634 1,780,010 Biomedical Research and Research Training 93.859 1R01GM120537-01A1 Arizona State University — 36,973 Biomedical Research and Research Training 93.859 5R01GM118530-03 Brown University — 29,840 Biomedical Research and Research Training 93.859 U54GM087519 University of Chicago — 33,390 Biomedical Research and Research Training 93.859 5R01GM103695-11 University of Michigan — 160,831
Subtotal 68,634 2,041,044
Child Health and Human Development Extramural Research 93.865 58,383 333,448 Medical Library Assistance 93.879 — 17,984
U.S. Department of Interior:Earthquake Hazards Program Assistance 15.807 — 70,935
U.S. Department of Transportation:Highway Research and Development Program (B) 20.200 — (36,625) Recreational Trails Program 20.219 — 25,655 University Transportation Centers Program 20.701 69A3551847103 The Pennsylvania State University — 24,983 Transportation Planning, Research and Education (B) 20.931 69A3551747118 Colorado School of Mines — 194,255
National Aeronautics and Space Administration:Science 43.001 — 22,739 Science 43.001 80NSSC18M094 Penn State University — 32,490 Science 43.001 80NSSC18K0544 Regents of the University of California 11,350 27,866
Subtotal 11,350 83,095
Education 43.008 NNX16AM18G Nurture Nature Center, Inc. — 25,948 Education 43.008 NNX15AK06H Penn State University — 7,444
Subtotal — 33,392
National Science Foundation:Engineering Grants 47.041 1,636 5,340,459 Engineering Grants 47.041 IIP-1456358 Brighton Technologies Group, Inc. — (25,831) Engineering Grants 47.041 IIP-1831220 Dynalene, Inc. — 13,416 Engineering Grants 47.041 EFMA-1433459 Purdue University — 105,488 Engineering Grants 47.041 CMMI-16628616 University of Arizona — 183,044 Engineering Grants 47.041 CBET-1821389 University of Virginia — 204,489
Subtotal 1,636 5,821,065
Mathematical and Physical Sciences 47.049 — 1,455,839
Geosciences 47.050 1,854 578,656 Geosciences 47.050 OCE-1450528 Columbia University — 41,344 Geosciences 47.050 EAR-1624280 University of California, San Diego — 64,425
Subtotal 1,854 684,425
Computer and Information Science and Engineering 47.070 — 1,406,183 Computer and Information Science and Engineering 47.070 IIS-1421498 Cornell University — 3,855 Computer and Information Science and Engineering 47.070 ACI-1639529 Northern Arizona University — 25,445
Subtotal — 1,435,483
Biological Sciences 47.074 5,265 1,152,666 Biological Sciences 47.074 EF#1137306 Massachusetts Institute of Technology — 15,984
Subtotal 5,265 1,168,650
Social Behavioral and Economic Sciences 47.075 — 129,517 Social Behavioral and Economic Sciences 47.075 SMA-1416651 Yale University — 2,368
Subtotal — 131,885
36 (Continued)

LEHIGH UNIVERSITY
Schedule of Expenditures of Federal Awards
Year ended June 30, 2019
PassedPass-through entity through to Total
Program: Federal sponsor/project title CFDA # Identifying number Pass-through Entity subrecipients expenditures
Education and Human Resources 47.076 $ 31,761 504,468 Education and Human Resources 47.076 DRL-1420532 Michigan State University — 16,829 Education and Human Resources 47.076 DGE-1835307 Worcester Polytechnic Institute — 28,501
Subtotal 31,761 549,798
Office of International Science and Engineering 47.079 OISE-1743701 Kansas State University — 27,915 Office of Integrative Activities 47.083 OISE-1545903 Boise State University — 22,782
Total Research And Development Cluster 1,387,873 25,817,436
Other:Department of Agriculture:
Agriculture and Food Research Initiative (AFRI) 10.310 48,843 67,656 Child and Adult Care Food Program 10.558 300-48-383-0 PA-Department of Education — 7,606
National Endowment for the Humanities:Promotion of the Humanities Challenge Grants 45.130 — 415,340
DOD-Defense Logistics Agency:Procurement Technical Assistance 12.002 SP4701-19-P-0048 Advanced Cooling Technologies, Inc. — 3,945 Procurement Technical Assistance 12.002 SP4800-18-2-1831 Kutztown University of Pennsylvania — 26,390 Procurement Technical Assistance 12.002 SP4800-16-2-1736 University of Pennsylvania — 5,423
Subtotal — 35,758
Department of State:Academic Exchange Programs – Undergraduate Programs 19.009 S-ECAGD-18-CA-0022 IREX — 46,215
Small Business Administration:Small Business Development Centers 59.037 SBAHQ-18-B-0074 Kutztown University of Pennsylvania — 229,394 Small Business Development Centers 59.037 SBAHQ-19B-0027 Kutztown University of Pennsylvania — 10,090
Subtotal — 239,484
Department of Education:Special Education – Personnel Development to Improve Services and Results
for Children with Disabilities 84.325 — 125,842 Supporting Effective Instruction State Grant (formerly Improving Teacher
Quality State Grants) 84.367 S367A180051 PA-Department of Education — 46,175
Department of Health and Human Services:Head Start 93.600 — 26,436
Total other 48,843 1,010,512
Total expenditures of federal awards $ 1,436,716 53,768,040
See accompanying independent auditors’ report.
37

LEHIGH UNIVERSITY
Notes to Schedule of Expenditures of Federal Awards
Year ended June 30, 2019
38
(1) Basis of Presentation
The accompanying schedule of expenditures of federal awards (Schedule) includes the federal award
activity of Lehigh University (the University) under programs of the federal government for the year ended
June 30, 2019 in accordance with the requirements of Title 2 U.S. Code of Federal Regulations Part 200,
Uniform Administrative Requirements, Cost Principles, and Audit Requirements for Federal Awards
(Uniform Guidance). Because the Schedule presents only a selected portion of the operations of the
University, it is not intended to, and does not, present the financial position, changes in net assets, or cash
flows of the University. The schedule of expenditures of federal awards does not present the activity for the
University’s subsidiary Manufacturers Resource Center that expended $678,416 in federal awards and
submits a separate audit report in accordance with the Uniform Guidance if certain thresholds are met.
(2) Summary of Significant Accounting Policies
Expenditures reported on the Schedule are reported on the accrual basis of accounting. Such expenditures
are recognized following, as applicable, either the cost principles in Office of Management and Budget
Circular A-21, Cost Principles for Educational Institutions, or the cost principles contained in the Uniform
Guidance, wherein certain types of expenditures are not allowable or are limited as to reimbursement.
(3) Indirect Cost Rate
The University has not elected to use the 10-percent de minimis indirect cost rate allowed under the
Uniform Guidance.
(4) Federal Perkins Loan Program
Perkins loans are administered directly by the University, and balances and transactions relating to Perkins
loans are included in the University’s consolidated financial statements. Perkins loan expenditures reported
on the Schedule include the balance of outstanding loans at June 30, 2018, and the administrative cost
allowance claimed during the year ended June 30, 2019 of $87,620. The outstanding balance of Federal
Perkins Loans at June 30, 2019 was $1,434,269.
There were no federal or institutional capital contributions to the Perkins revolving loan fund for the year
ended June 30, 2019.
(5) Direct Loans
Direct Loans are made by the Secretary of Education, and therefore, balances and transactions relating to
Direct Loans are not included in the University’s consolidated financial statements. The University is
responsible for the performance of certain administrative duties under the Direct Loan program, including
origination and disbursement of loans.

KPMG LLP is a Delaware limited liability partnership and the U.S. member firm of the KPMG network of independent member firms affiliated with KPMG International Cooperative (“KPMG International”), a Swiss entity.
KPMG LLP1601 Market StreetPhiladelphia, PA 19103-2499
39
Independent Auditors’ Report on Internal Control Over Financial Reporting and on Compliance and
Other Matters Based on an Audit of Financial Statements Performed in Accordance With Government
Auditing Standards
The Board of Trustees
Lehigh University:
We have audited, in accordance with the auditing standards generally accepted in the United States of America
and the standards applicable to financial audits contained in Government Auditing Standards, issued by the
Comptroller General of the United States, the consolidated financial statements of Lehigh University and its
subsidiaries (the University), which comprise the consolidated statement of financial position as of June 30,
2019, and the related consolidated statements of activities, and cash flows for the year then ended, and the
related notes to the consolidated financial statements, and have issued our report thereon dated October 18,
2019. This report contained an emphasis of matter paragraph relating to the University’s adoption of new
accounting guidance, Accounting Standards Update No. 2016-14, Not-for-Profit Entities (Topic 958)
Presentation of Financial Statements of Not-for-Profit Entities.
Internal Control Over Financial Reporting
In planning and performing our audit of the consolidated financial statements, we considered the University’s
internal control over financial reporting (internal control) to determine the audit procedures that are appropriate
in the circumstances for the purpose of expressing our opinion on the consolidated financial statements, but not
for the purpose of expressing an opinion on the effectiveness of the University’s internal control. Accordingly,
we do not express an opinion on the effectiveness of the University’s internal control.
A deficiency in internal control exists when the design or operation of a control does not allow management or
employees, in the normal course of performing their assigned functions, to prevent, or detect and correct,
misstatements on a timely basis. A material weakness is a deficiency, or a combination of deficiencies, in
internal control, such that there is a reasonable possibility that a material misstatement of the entity’s financial
statements will not be prevented, or detected and corrected on a timely basis. A significant deficiency is a
deficiency, or a combination of deficiencies, in internal control that is less severe than a material weakness, yet
important enough to merit attention by those charged with governance.
Our consideration of internal control was for the limited purpose described in the first paragraph of this section
and was not designed to identify all deficiencies in internal control that might be material weaknesses or
significant deficiencies. Given these limitations, during our audit we did not identify any deficiencies in internal
control that we consider to be material weaknesses. However, material weaknesses may exist that have not
been identified.
Compliance and Other Matters
As part of obtaining reasonable assurance about whether the University’s consolidated financial statements are
free from material misstatement, we performed tests of its compliance with certain provisions of laws,
regulations, contracts, and grant agreements, noncompliance with which could have a direct and material effect
on the determination of financial statement amounts. However, providing an opinion on compliance with those
provisions was not an objective of our audit, and accordingly, we do not express such an opinion. The results of
our tests disclosed no instances of noncompliance or other matters that are required to be reported under
Government Auditing Standards.

40
Purpose of this Report
The purpose of this report is solely to describe the scope of our testing of internal control and compliance and
the results of that testing, and not to provide an opinion on the effectiveness of the University’s internal control
or on compliance. This report is an integral part of an audit performed in accordance with Government Auditing
Standards in considering the University’s internal control and compliance. Accordingly, this communication is
not suitable for any other purpose.
Philadelphia, Pennsylvania
October 18, 2019

KPMG LLP is a Delaware limited liability partnership and the U.S. member firm of the KPMG network of independent member firms affiliated with KPMG International Cooperative (“KPMG International”), a Swiss entity.
KPMG LLP1601 Market StreetPhiladelphia, PA 19103-2499
41
Independent Auditors’ Report on Compliance for Each Major Federal Program; Report on Internal
Control Over Compliance; and Report on Schedule of Expenditures of Federal Awards Required by the
Uniform Guidance
The Board of Trustees
Lehigh University:
Report on Compliance for Each Major Federal Program
We have audited Lehigh University’s (the University’s) compliance with the types of compliance requirements
described in the OMB Compliance Supplement that could have a direct and material effect on the University’s
major federal program for the year ended June 30, 2019. The University’s major federal program is identified in
the summary of auditors’ results section of the accompanying schedule of findings and questioned costs.
The University’s consolidated financial statements include the operations of Manufacturers Resource Center
(the subsidiary), which expended $678,416 in federal awards which are not included in the schedule of
expenditures of federal awards for the year ended June 30, 2019. Our audit, described below, did not include
the operations of this subsidiary because it separately engaged us to perform audits in accordance with the
Uniform Guidance.
Management’s Responsibility
Management is responsible for compliance with federal statutes, regulations, and the terms and conditions of
its federal awards applicable to its federal programs.
Auditors’ Responsibility
Our responsibility is to express an opinion on compliance for the University’s major federal program based on
our audit of the types of compliance requirements referred to above. We conducted our audit of compliance in
accordance with auditing standards generally accepted in the United States of America; the standards
applicable to financial audits contained in Government Auditing Standards, issued by the Comptroller General
of the United States; and the audit requirements of Title 2 U.S. Code of Federal Regulations Part 200, Uniform
Administrative Requirements, Cost Principles, and Audit Requirements for Federal Awards (Uniform Guidance).
Those standards and the Uniform Guidance require that we plan and perform the audit to obtain reasonable
assurance about whether noncompliance with the types of compliance requirements referred to above that
could have a direct and material effect on a major federal program occurred. An audit includes examining, on a
test basis, evidence about the University’s compliance with those requirements and performing such other
procedures as we considered necessary in the circumstances.
We believe that our audit provides a reasonable basis for our opinion on compliance for the major federal
program. However, our audit does not provide a legal determination of the University’s compliance.
Opinion on Each Major Federal Program
In our opinion, Lehigh University complied, in all material respects, with the types of compliance requirements
referred to above that could have a direct and material effect on its major federal programs for the year ended
June 30, 2019.

42
Report on Internal Control Over Compliance
Management of the University is responsible for establishing and maintaining effective internal control over
compliance with the types of compliance requirements referred to above. In planning and performing our audit
of compliance, we considered the University’s internal control over compliance with the types of requirements
that could have a direct and material effect on each major federal program to determine the auditing
procedures that are appropriate in the circumstances for the purpose of expressing an opinion on compliance
for each major federal program and to test and report on internal control over compliance in accordance with
the Uniform Guidance, but not for the purpose of expressing an opinion on the effectiveness of internal control
over compliance. Accordingly, we do not express an opinion on the effectiveness of the University’s internal
control over compliance.
A deficiency in internal control over compliance exists when the design or operation of a control over
compliance does not allow management or employees, in the normal course of performing their assigned
functions, to prevent, or detect and correct, noncompliance with a type of compliance requirement of a federal
program on a timely basis. A material weakness in internal control over compliance is a deficiency, or a
combination of deficiencies, in internal control over compliance, such that there is a reasonable possibility that
material noncompliance with a type of compliance requirement of a federal program will not be prevented, or
detected and corrected, on a timely basis. A significant deficiency in internal control over compliance is a
deficiency, or a combination of deficiencies, in internal control over compliance with a type of compliance
requirement of a federal program that is less severe than a material weakness in internal control over
compliance, yet important enough to merit attention by those charged with governance.
Our consideration of internal control over compliance was for the limited purpose described in the first
paragraph of this section and was not designed to identify all deficiencies in internal control over compliance
that might be material weaknesses or significant deficiencies. We did not identify any deficiencies in internal
control over compliance that we consider to be material weaknesses. However, material weaknesses may exist
that have not been identified.
The purpose of this report on internal control over compliance is solely to describe the scope of our testing of
internal control over compliance and the results of that testing based on the requirements of the Uniform
Guidance. Accordingly, this report is not suitable for any other purpose.

43
Report on Schedule of Expenditures of Federal Awards Required by the Uniform Guidance
We have audited the consolidated financial statements of Lehigh University as of and for the year ended
June 30, 2019, and have issued our report thereon dated October 18, 2019, which contained an unmodified
opinion on those consolidated financial statements. This report contained emphasis of matter paragraph
relating to the University’s adoption of new accounting guidance, Accounting Standards Update No. 2016-14,
Not-for-Profit Entities (Topic 958) Presentation of Financial Statements of Not-for-Profit Entities. Our audit was
conducted for the purpose of forming an opinion on the consolidated financial statements as a whole. The
accompanying schedule of expenditures of federal awards is presented for purposes of additional analysis as
required by the Uniform Guidance and is not a required part of the consolidated financial statements. Such
information is the responsibility of management and was derived from and relates directly to the underlying
accounting and other records used to prepare the consolidated financial statements. The information has been
subjected to the auditing procedures applied in the audit of the consolidated financial statements and certain
additional procedures, including comparing and reconciling such information directly to the underlying
accounting and other records used to prepare the consolidated financial statements or to the consolidated
financial statements themselves, and other additional procedures in accordance with auditing standards
generally accepted in the United States of America. In our opinion, the schedule of expenditures of federal
awards is fairly stated in all material respects in relation to the consolidated financial statements as a whole.
Philadelphia, Pennsylvania
January 31, 2020

LEHIGH UNIVERSITY
Schedule of Findings and Questioned Costs
Year ended June 30, 2019
44
(1) Summary of Auditors’ Results
a. Type of report issued on whether the consolidated financial statements were prepared in accordance
with generally accepted accounting principles: Unmodified
b. Internal control deficiencies over financial reporting disclosed by the audit of the consolidated financial
statements:
Material weaknesses: No
Significant deficiencies: None Reported
c. Noncompliance material to the financial statements: No
d. Internal control deficiencies over major programs disclosed by the audit:
Material weaknesses: No
Significant deficiencies: None reported
e. Type of report issued on compliance for major programs: Unmodified
f. Audit findings that are required to be reported in accordance with 2 CFR 200.516(a): No
g. Major program:
Research and Development Cluster – various CFDA numbers
h. Dollar threshold used to distinguish between Type A and Type B programs: $1,459,199
i. Auditee qualified as a low risk auditee: Yes
(2) Findings Relating to the Financial Statements Reported in Accordance with Government Auditing
Standards
No matters were reported.
(3) Findings and Questioned Costs Relating to Federal Awards
No matters were reported.