Consolidated Financial Statements 1H 2019
20
Hrvatska elektroprivreda More than electricity Consolidated Financial Statements 1H 2019
Transcript of Consolidated Financial Statements 1H 2019

Hrvatska elektroprivreda More than electricity
Consolidated Financial Statements
1H 2019
1H 2019 Key highlights
Operations results
Financial results
Q&A
Contents
2
3
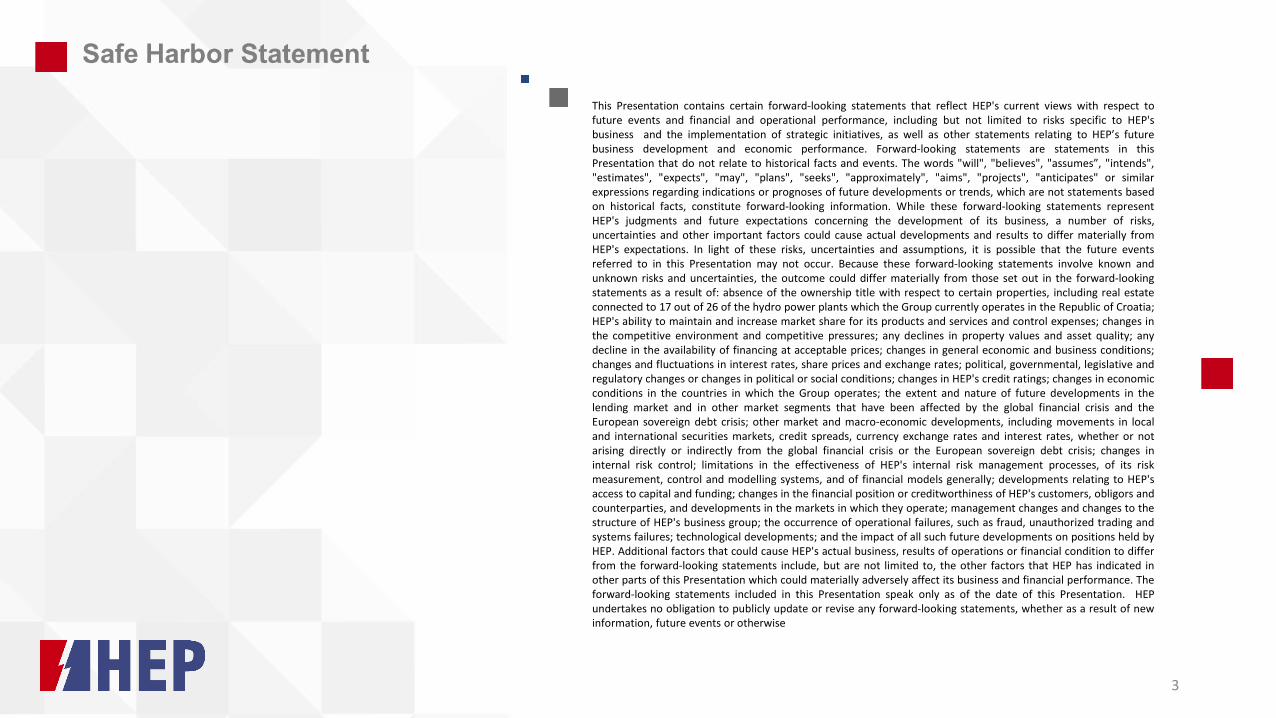
This Presentation contains certain forward-looking statements that reflect HEP's current views with respect to future events and financial and operational performance, including but not limited to risks specific to HEP's business and the implementation of strategic initiatives, as well as other statements relating to HEP’s future business development and economic performance. Forward-looking statements are statements in this Presentation that do not relate to historical facts and events. The words "will", "believes", "assumes”, "intends", "estimates", "expects", "may", "plans", "seeks", "approximately", "aims", "projects", "anticipates" or similar expressions regarding indications or prognoses of future developments or trends, which are not statements based on historical facts, constitute forward-looking information. While these forward-looking statements represent HEP's judgments and future expectations concerning the development of its business, a number of risks, uncertainties and other important factors could cause actual developments and results to differ materially from HEP's expectations. In light of these risks, uncertainties and assumptions, it is possible that the future events referred to in this Presentation may not occur. Because these forward-looking statements involve known and unknown risks and uncertainties, the outcome could differ materially from those set out in the forward-looking statements as a result of: absence of the ownership title with respect to certain properties, including real estate connected to 17 out of 26 of the hydro power plants which the Group currently operates in the Republic of Croatia; HEP's ability to maintain and increase market share for its products and services and control expenses; changes in the competitive environment and competitive pressures; any declines in property values and asset quality; any decline in the availability of financing at acceptable prices; changes in general economic and business conditions; changes and fluctuations in interest rates, share prices and exchange rates; political, governmental, legislative and regulatory changes or changes in political or social conditions; changes in HEP's credit ratings; changes in economic conditions in the countries in which the Group operates; the extent and nature of future developments in the lending market and in other market segments that have been affected by the global financial crisis and the European sovereign debt crisis; other market and macro-economic developments, including movements in local and international securities markets, credit spreads, currency exchange rates and interest rates, whether or not arising directly or indirectly from the global financial crisis or the European sovereign debt crisis; changes in internal risk control; limitations in the effectiveness of HEP's internal risk management processes, of its risk measurement, control and modelling systems, and of financial models generally; developments relating to HEP's access to capital and funding; changes in the financial position or creditworthiness of HEP's customers, obligors and counterparties, and developments in the markets in which they operate; management changes and changes to the structure of HEP's business group; the occurrence of operational failures, such as fraud, unauthorized trading and systems failures; technological developments; and the impact of all such future developments on positions held by HEP. Additional factors that could cause HEP's actual business, results of operations or financial condition to differ from the forward-looking statements include, but are not limited to, the other factors that HEP has indicated in other parts of this Presentation which could materially adversely affect its business and financial performance. The forward-looking statements included in this Presentation speak only as of the date of this Presentation. HEP undertakes no obligation to publicly update or revise any forward-looking statements, whether as a result of new information, future events or otherwise
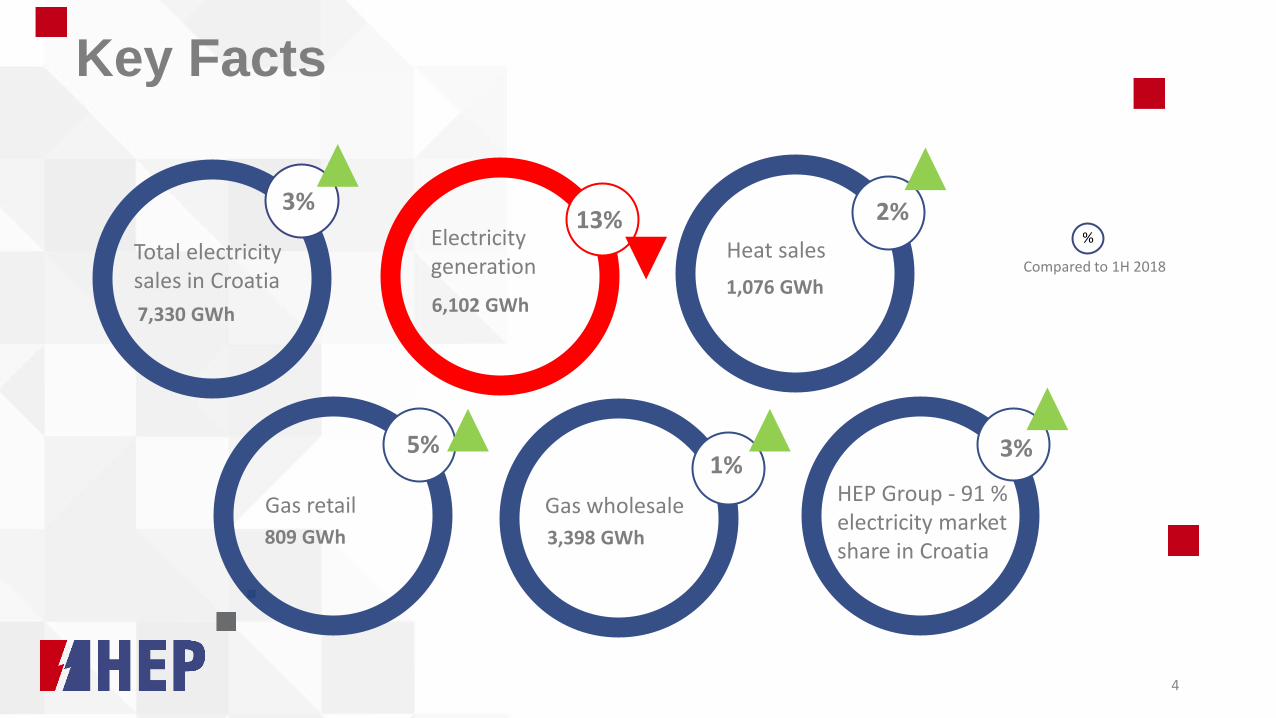
Key Facts
Total electricity sales in Croatia
7,330 GWh
3%
Gas retail
809 GWh
5%
Electricity generation
6,102 GWh
13% Heat sales
1,076 GWh
2%
Gas wholesale
3,398 GWh
1%
Compared to 1H 2018
%
4
HEP Group - 91 % electricity market share in Croatia
3%
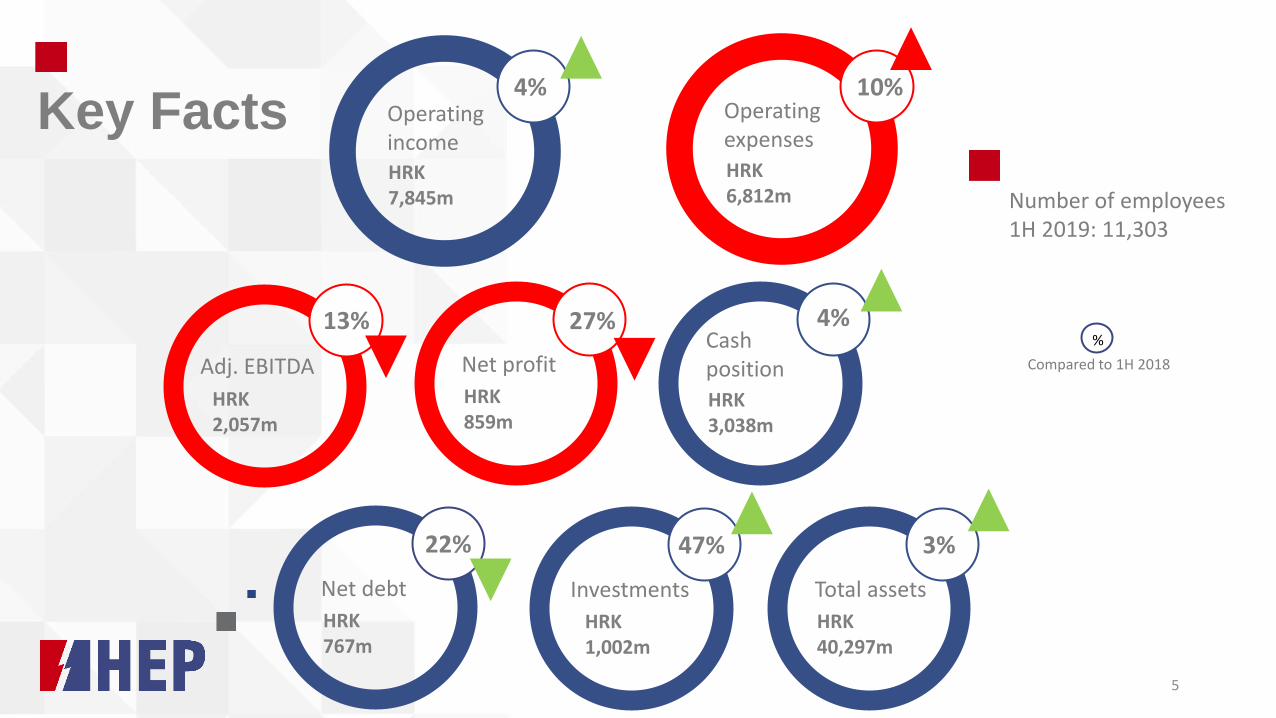
Key Facts Operating income
Operating expenses
HRK 7,845m
4% 10%
HRK 6,812m
Adj. EBITDA
HRK 2,057m
13%
Net profit
HRK 859m
27%
Net debt
HRK 767m
22%
Cash position
HRK 3,038m
4%
Total assets
HRK 40,297m
3%
Investments
HRK 1,002m
47%
Number of employees 1H 2019: 11,303
Compared to 1H 2018
%
5
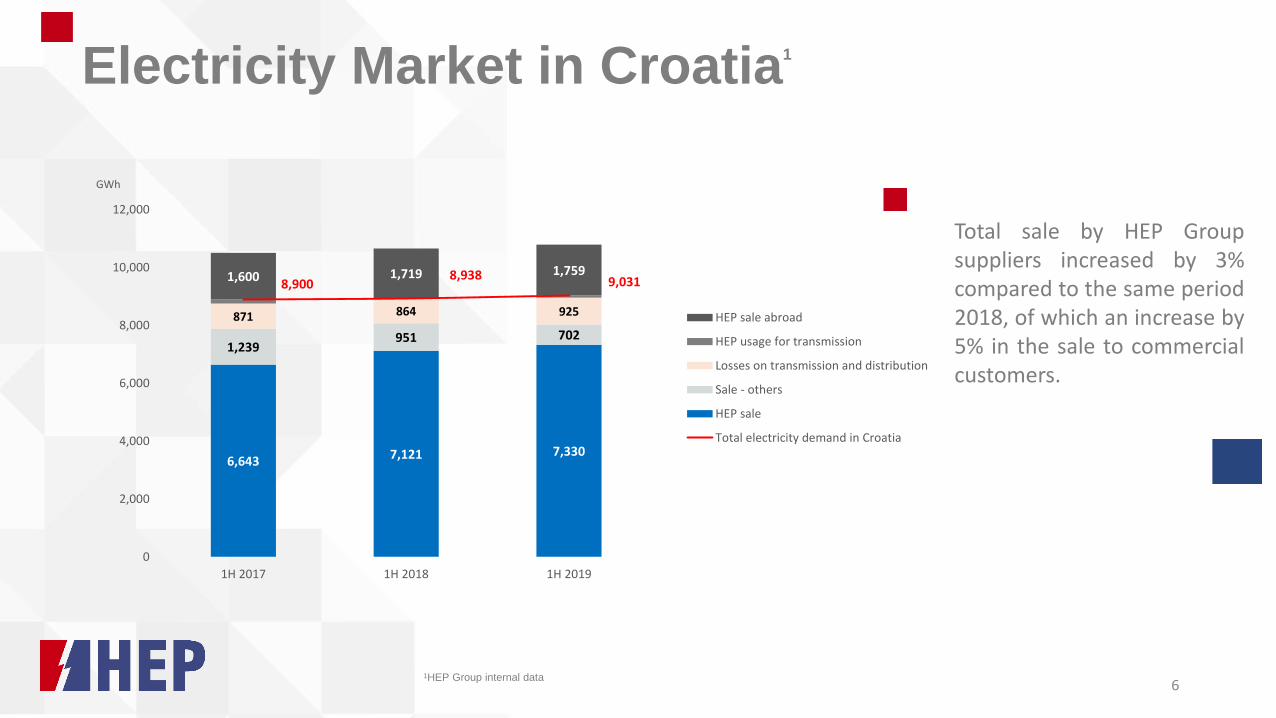
Electricity Market in Croatia1
Total sale by HEP Group suppliers increased by 3% compared to the same period 2018, of which an increase by 5% in the sale to commercial customers.
1HEP Group internal data 6
6,643 7,121 7,330
1,239 951 702
871 864 925
1,600 1,719 1,759 8,900
8,938 9,031
0
2,000
4,000
6,000
8,000
10,000
12,000
1H 2017 1H 2018 1H 2019
GWh
HEP sale abroad
HEP usage for transmission
Losses on transmission and distribution
Sale - others
HEP sale
Total electricity demand in Croatia
1H 2019 Key highlights
Operations results
Financial results
Q&A
Contents
7

Power Generation in 1H 2019
Compared to the year before HPP generation was 34% lower
TPP generated 23% more electricity while NPP generation was 18% higher compared to the same period last year
Generation of heat energy was 4% higher
1HEP Group internal data
8
48%
25%
27%
Electricity generation 1H 20191
6,102 GWh 48%
8%
44%
Electricity - installed capacity 1H 20191
HPP
NPP
TPP
4,775 MWe
2,398
4,425
2,929
2,038
1,349
1,659
1,473
1,235
1,504
1,258 1,263 1,316
1H 2017 1H 2018 1H 2019
0
1,000
2,000
3,000
4,000
5,000
6,000
7,000
8,000GWh
RES
Heat
NPP
TPP
HPP

Electricity Generation from HPP
26 HPP operated 2,281 MWe total installed capacity
Not significant influence on EBITDA
1HEP Group internal data
2Adjusted EBITDA consists of operating profit/(loss) and depreciation and amortization for the period excluding financial expense, financial income,
corporate income tax expense.
9
2,398
4,425
2,929
0
1,000
2,000
3,000
4,000
5,000
1H 2017 1H 2018 1H 2019
GWh HPP generation1
-34% 84%
0
200
400
600
800
1000
1200
1400
1.I
.14
1.I
V.1
4
1.V
II.1
4
1.X
.14
1.I
.15
1.I
V.1
5
1.V
II.1
5
1.X
.15
1.I
.16
1.I
.16
1.I
V.1
6
1.V
II.1
6
1.X
.16
1.I
.17
1.I
V.1
7
1.V
II.1
7
1.X
.17
1.I
.18
1.I
V.1
8
1.V
II.1
8
1.X
.18
1.I
.19
1.I
V.1
9
Accumulation levels, GWH1
(1.1.2014-01.07.2019)
3,518 2,398 4,425 2,929
2,637 2,807
2,372
2,057
-
500
1,000
1,500
2,000
2,500
3,000
0
500
1,000
1,500
2,000
2,500
3,000
3,500
4,000
4,500
5,000
1H 2016 1H 2017 1H 2018 1H 2019
HRK m GWh HPP generation and Adj. EBITDA2 correlation
HPP Generation
Adj. EBITDA

Electricity Generation from TPP
7 TPP with total installed capacity of 2,130 MWe2
23% higher generation
All cogeneration plants have obtained environmental permits
1HEP Group internal data 2Total installed capacity at 1H2019, HEP Group internal data
10
2,038
1,349
1,659
0
500
1,000
1,500
2,000
2,500
1H 2017 1H 2018 1H 2019
GWh TPP generation1
-34% 23%
5%
24%
70%
1%
TPP by fuel type, installed capacity2
Crude oil
Coal
Gas
Wood biomass
3,303
2,678 2,763
368 191
304
21 35 -
500
1,000
1,500
2,000
2,500
3,000
3,500
-
500
1,000
1,500
2,000
2,500
3,000
3,500
1H 2017 1H 2018 1H 2019
GWh x103 tons TPP fuel consumption1
Gas (GWh)
Coal (000 tons)
Wood biomass (000 tons)
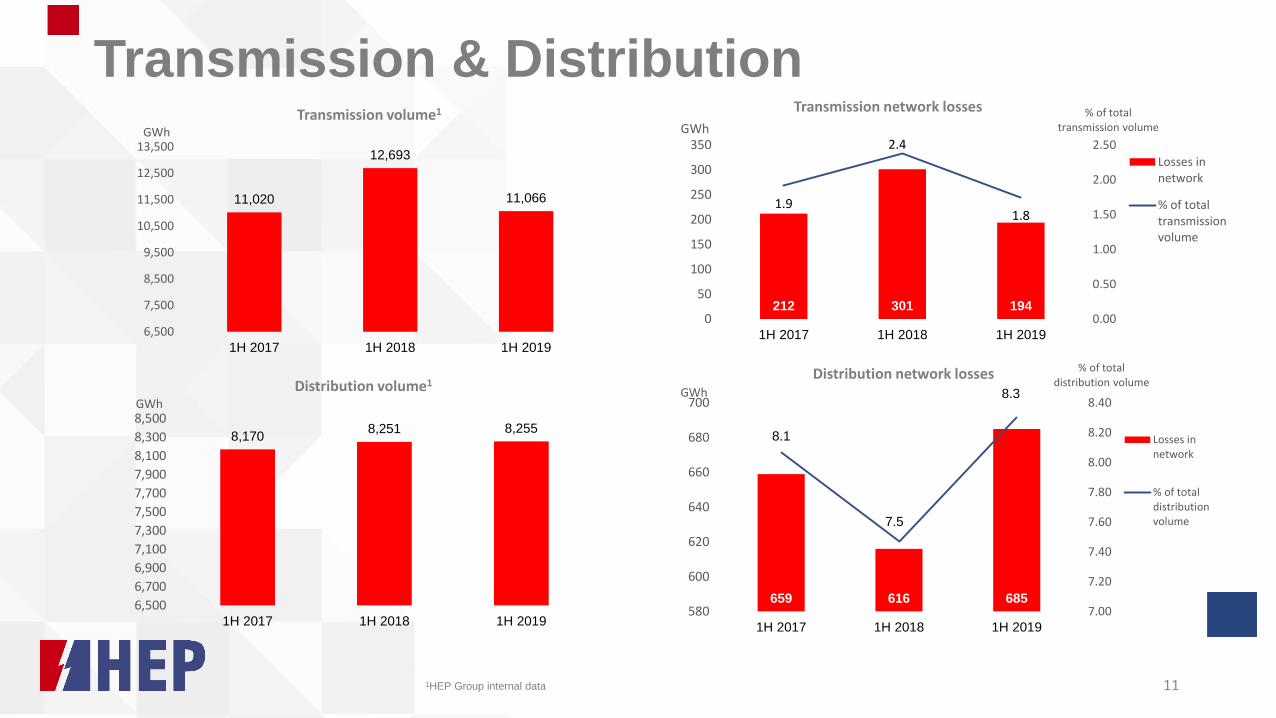
Transmission & Distribution
1HEP Group internal data 11
8,170 8,251 8,255
6,500
6,700
6,900
7,100
7,300
7,500
7,700
7,900
8,100
8,300
8,500
1H 2017 1H 2018 1H 2019
GWh
Distribution volume1
659 616 685
8.1
7.5
8.3
7.00
7.20
7.40
7.60
7.80
8.00
8.20
8.40
580
600
620
640
660
680
700
1H 2017 1H 2018 1H 2019
% of total distribution volume
GWh
Distribution network losses
Losses innetwork
% of totaldistributionvolume
11,020
12,693
11,066
6,500
7,500
8,500
9,500
10,500
11,500
12,500
13,500
1H 2017 1H 2018 1H 2019
GWh
Transmission volume1
212 301 194
1.9
2.4
1.8
0.00
0.50
1.00
1.50
2.00
2.50
0
50
100
150
200
250
300
350
1H 2017 1H 2018 1H 2019
% of total transmission volume GWh
Transmission network losses
Losses innetwork
% of totaltransmissionvolume
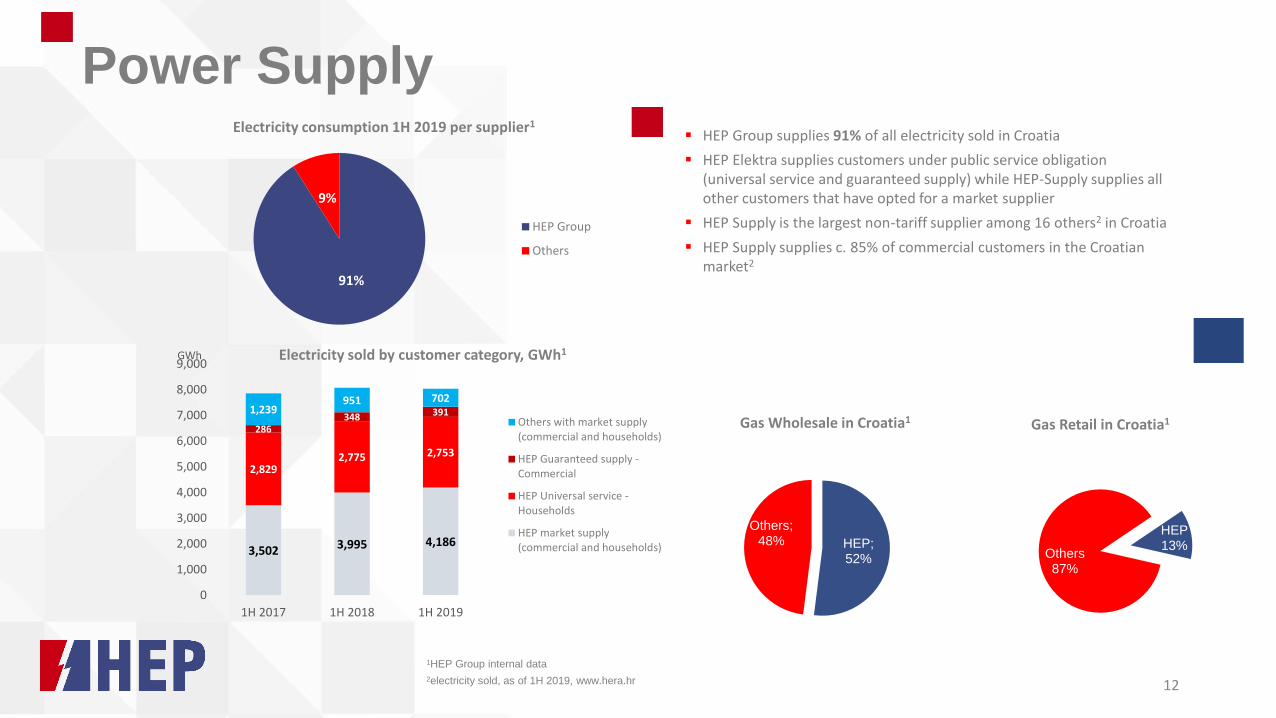
Power Supply HEP Group supplies 91% of all electricity sold in Croatia
HEP Elektra supplies customers under public service obligation (universal service and guaranteed supply) while HEP-Supply supplies all other customers that have opted for a market supplier
HEP Supply is the largest non-tariff supplier among 16 others2 in Croatia
HEP Supply supplies c. 85% of commercial customers in the Croatian market2
1HEP Group internal data
2electricity sold, as of 1H 2019, www.hera.hr 12
HEP; 52%
Others; 48%
Gas Wholesale in Croatia1
HEP 13%
Others 87%
Gas Retail in Croatia1
91%
9%
Electricity consumption 1H 2019 per supplier1
HEP Group
Others
3,502 3,995 4,186
2,829 2,775 2,753
286 348 391 1,239 951 702
0
1,000
2,000
3,000
4,000
5,000
6,000
7,000
8,000
9,000
1H 2017 1H 2018 1H 2019
GWh Electricity sold by customer category, GWh1
Others with market supply(commercial and households)
HEP Guaranteed supply -Commercial
HEP Universal service -Households
HEP market supply(commercial and households)
1H 2019 Key highlights
Operations results
Financial results
Q&A
Contents
13
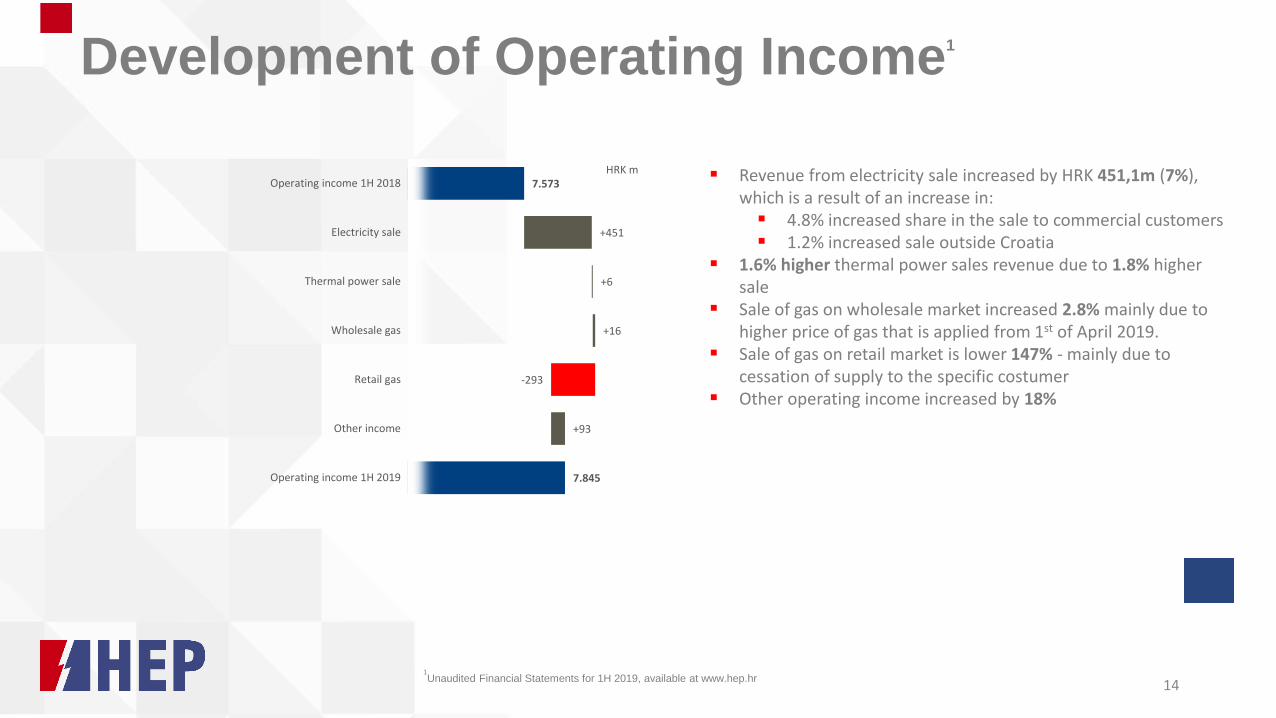
Development of Operating Income1
1Unaudited Financial Statements for 1H 2019, available at www.hep.hr
Revenue from electricity sale increased by HRK 451,1m (7%), which is a result of an increase in: 4.8% increased share in the sale to commercial customers 1.2% increased sale outside Croatia
1.6% higher thermal power sales revenue due to 1.8% higher sale
Sale of gas on wholesale market increased 2.8% mainly due to higher price of gas that is applied from 1st of April 2019.
Sale of gas on retail market is lower 147% - mainly due to cessation of supply to the specific costumer
Other operating income increased by 18%
14
-293
+451
+6
+16
+93
7.573
7.845
Operating income 1H 2018
Electricity sale
Thermal power sale
Wholesale gas
Retail gas
Other income
Operating income 1H 2019
HRK m

Financial Performance 1H 2019
1Unaudited Financial Statements for 1H 2019, available at www.hep.hr
2Adjusted EBITDA consists of operating profit/(loss) and depreciation and amortization for the period excluding financial expense, financial income, corporate
income tax expense 3Includes depreciation and amortization 15
7,848 7,573 7,845
5,997 6,192 6,812
-
1,000
2,000
3,000
4,000
5,000
6,000
7,000
8,000
9,000
1H 2017 1H 2018 1H 2019
HRK m Operating income and expenses1
Operatingincome
Operatingexpenses
-4% 3% 4% 10%
19%
12%
15% 15%
16%
23%
26%
13%
10% 14%
15%
22%
Total operating expenses split 1H 2019 vs 1H 20181
Electricity purchase cost
Fuel cost
Costs of gas sold
Staff cost
Depreciation andamortization costs
Other operating expenses
1H 2019
1H 2018
-275
250
244
+356
31
96
+574
+156
356
+6
239
72
+272
34
2.807
2.372
2.057
Adj. Ebitda 1H 2017²
Total operating income
Electricity purchase cost
Fuel cost
Costs of gas sold
Staff cost
Other Costs³
Depreciation
Adj. Ebitda 1H 2018²
Total operating income
Electricity purchase cost
Fuel cost
Costs of gas sold
Staff cost
Other Costs³
Depreciation
Adj. Ebitda 1H 2019²
HRK m
76%
5%
7% 7% 5%
79%
5%
7% 3%
6%
Total operating income split H1 2019 vs H1 20181
Revenue from elecitritysales
Revenue from thermalsales
Revenue from sale of gason wholesale market
Revenue from sale of gasto customers
1H 2019
1H 2018

Cash flow1
1Unaudited Financial Statements for 1H 2019, available at www.hep.hr
Strong liquidity position
Additional liquidity HRK 1 billion under short term financing sources with local banks
Continuous capital expenditures Wind farm Korlat Solar power plant Cres Modernization and
revitalization of distribution and district heating network
Smart meters
16
-681
-188
-1,527
-1,548
-1.002
-87
1,282
1,878
1,760
2.017
2.908
2.955
3.038
Cash at FY 2017
Net cash from operations
Net cash from investing
Net cash from financing activities
Cash at 1H 2018
Net cash from operations
Net cash from investing
Net cash from financing activities
Cash at FY 2018
Net cash from operations
Net cash from investing
Net cash from financing activities
Cash at 1H 2019
HRK m

HEP Group Debt
1Unaudited Financial Statements for 1H 2019, available at www.hep.hr
2Adjusted EBITDA consists of operating profit/(loss) and depreciation and amortization for the period excluding financial expense,
financial income, corporate income tax expense
17
1,734
1,105 767
2,807
2,372 2,057
0.6x
0.5x
0.4x
0.0
0.1
0.2
0.3
0.4
0.5
0.6
0.7
0
500
1,000
1,500
2,000
2,500
3,000
1H 2017 1H 2018 1H 2019
HRK m Net debt/Adj. EBITDA development1
Net Debt
Adj. EBITDA²
Net Debt/ Adj.EBITDA²
Credit Rating Agency Issue date Rating
Standard & Poor's 26 March 2019 BB+/Stable – SACP bb
Moody's 30 April 2019 Ba2/Positive outlook
115 39 40 43 43 43
3,503
0
500
1,000
1,500
2,000
2,500
3,000
3,500
4,000
2019 2020 2021 2022 2023 2024
HRK m Debt maturity profile1
Bonds
Loans

1H 2019 Key highlights
Operations results
Financial results
Q&A
Contents
18

Q&A
Contacts for Institutional Investors & Financial Analysts – [email protected]
Marko Ćosić
Board Member and
CFO
+385 1 632 28 31
Alina Kosek
Finance and Treasury
Director
+385 1 632 22 07
Ivana Sučić Funko
Head of Investor
Relations
+385 1 632 22 31
Ivan Dodig
Investor Relations
+385 1 632 27 98
19
This presentation contains information relating HEP Group ("HEP") that must not be relied upon for any purpose and may not be redistributed, reproduced, published, or passed on to any other person or used in whole or in part for any other purpose. By accessing this document you agree to abide by the limitations set out in this document as well as any limitations set out on the webpage of HEP on which this presentation has been made available.
This document is being presented solely for informational purposes. It should not be treated as giving investment advice, nor is it intended to provide the basis for any evaluation or any securities and should not be considered as a recommendation that any person should purchase any securities.
This presentation may contain forward-looking statements based on current assumptions and forecasts made by HEP management and other information currently available to HEP. Various known and unknown risks, uncertainties and other factors could lead to material differences between the actual future results, financial situation, development or performance of the company and the estimates given here. HEP does not intend, and does not assume any liability whatsoever, to update these forward-looking statements or to conform them to future events or developments.
Neither HEP nor any respective partners of HEP undertake any obligation to provide the recipient with access to any additional information or to update this presentation or any information or to correct any inaccuracies in any such information.
Certain numerical data, financial information and market data (including percentages) in this presentation have been rounded according to established commercial standards. As a result, the aggregate amounts (sum totals or interim totals or differences or if numbers are put in relation) in this presentation may not correspond in all cases to the amounts contained in the underlying (unrounded) figures appearing in the consolidated financial statements.
Furthermore, in tables and charts, these rounded figures may not add up exactly to the totals contained in the respective tables and charts.
Disclaimer
20