Consolidated Financial Results for FY2014 and …...2015/05/15 · Chief Financial Officer May 15,...
23
Consolidated Financial Results for FY2014 and Guidance for FY2015 François-Xavier Roger Chief Financial Officer May 15, 2015 | Consolidated Financial Results for FY2014 and Guidance for FY2015| Announced May 15, 2015 1 Important notice Forward-Looking Statements This presentation contains forward-looking statements regarding the Company's plans, outlook, strategies, and results for the future. All forward-looking statements are based on judgments derived from the information available to the Company at this time. Forward looking statements can sometimes be identified by the use of forward-looking words such as "may," "believe," "will," "expect," "project," "estimate," "should," "anticipate," "plan," "continue," "seek," "pro forma," "potential," "target, " "forecast," or "intend" or other similar words or expressions of the negative thereof. Certain risks and uncertainties could cause the Company's actual results to differ materially from any forward looking statements contained in this presentation. These risks and uncertainties include, but are not limited to, (1) the economic circumstances surrounding the Company's business, including general economic conditions in the US and worldwide; (2) competitive pressures; (3) applicable laws and regulations; (4) the success or failure of product development programs; (5) decisions of regulatory authorities and the timing thereof; (6) changes in exchange rates; (7) claims or concerns regarding the safety or efficacy of marketed products or product candidates; and (8) integration activities with acquired companies. We assume no obligation to update or revise any forward-looking statements or other information contained in this presentation, whether as a result of new information, future events, or otherwise. Medical Information This presentation contains information about products that may not be available in all countries, or may be available under different trademarks, for different indications, in different dosages, or in different strengths. Nothing contained herein should be considered a solicitation, promotion or advertisement for any prescription drug including the ones under development.
Transcript of Consolidated Financial Results for FY2014 and …...2015/05/15 · Chief Financial Officer May 15,...

Consolidated Financial Results for FY2014and Guidance for FY2015
François-Xavier RogerChief Financial Officer
May 15, 2015
| Consolidated Financial Results for FY2014 and Guidance for FY2015| Announced May 15, 20151
Important notice
Forward-Looking StatementsThis presentation contains forward-looking statements regarding the Company's plans, outlook, strategies, and results for the future.
All forward-looking statements are based on judgments derived from the information available to the Company at this time. Forward looking statements can sometimes be identified by the use of forward-looking words such as "may," "believe," "will," "expect," "project," "estimate," "should," "anticipate," "plan," "continue," "seek," "pro forma," "potential," "target, " "forecast," or "intend" or other similar words or expressions of the negative thereof.
Certain risks and uncertainties could cause the Company's actual results to differ materially from any forward looking statements contained in this presentation. These risks and uncertainties include, but are not limited to, (1) the economic circumstances surrounding the Company's business, including general economic conditions in the US and worldwide; (2) competitive pressures; (3) applicable laws and regulations; (4) the success or failure of product development programs; (5) decisions of regulatory authorities and the timing thereof; (6) changes in exchange rates; (7) claims or concerns regarding the safety or efficacy of marketed products or product candidates; and (8) integration activities with acquired companies.
We assume no obligation to update or revise any forward-looking statements or other information contained in this presentation, whether as a result of new information, future events, or otherwise.
Medical InformationThis presentation contains information about products that may not be available in all countries, or may be available under different trademarks, for different indications, in different dosages, or in different strengths. Nothing contained herein should be considered a solicitation, promotion or advertisement for any prescription drug including the ones under development.

- Underlying performance aims at understanding the real performance of the business.
- Core Earnings is calculated from operating profit by excluding the impact of exceptional items, such as purchase accounting, amortization and impairment loss of intangible assets, restructuring costs and litigation costs
- Underlying Revenue and Underlying Core Earnings excludes the same items plus product divestments and foreign exchange
Please note these terms are non-GAAP items, used for internal evaluation purposes and are not audited
Definitions of disclosure terms
Underlying Revenue & Underlying Core Earnings
| Consolidated Financial Results for FY2014 and Guidance for FY2015| Announced May 15, 20152
| Consolidated Financial Results for FY2014 and Guidance for FY2015| Announced May 15, 2015
Underlying Year-on-Year
Revenue:
Core Earnings:
OPERATIONALGUIDANCE
MET
$2.7 bln for the Actos settlement and associated costs
Product/pipeline impairments and Japanese tax reform
EXCEPTIONALITEMS
Project Summit
EFFICIENCY GAINS ABOVE
TARGET
ENTYVIO
BRINTELLIX
CONTRAVE
AZILVA
TAKECAB
GROWTHSUPPORTED
BYINNOVATION
US/EU:
US:
US:
Japan:
Japan:
Sales to date support more than $2 bln target
Outperforming two recent brands 1-yr after launch
Promising start
Strong growth +80% (YoY)
Launched in February 2015
FY2014 results in line with guidance, with successful launches and enhanced cost efficiency
+2.8%
- 2.1%
in line with guidance (2~4%) [+3.8% in Q4]
in line with guidance (flat to slightly declining)
Fast execution, achieved in 2 years more than half of 5-year savings target (¥120 bln)
3

FY2014 Underlying Performance
| Consolidated Financial Results for FY2014 and Guidance for FY2015| Announced May 15, 20154
Underlying revenue growth at +2.8% in line with guidance; new products drive momentum
| Consolidated Financial Results for FY2014 and Guidance for FY2015| Announced May 15, 20155
1,675.7
1,721.9
+ 97.2
- 51.0
FY 2013 New products * Base business FY 2014
(billion yen)
* New products: Represent products launched in and after 2009, excluding new formulation or fixed dose combination of existing drugs: DEXILANT, COLCRYS, AZILVA, NESINA, ULORIC, ENTYVIO, ADCETRIS, LOTRIGA, BRINTELLIX, TAKECAB, CONTRAVE etc.
+2.8%Pricing pressure
and generic impact in Japan
+ 5.8%
Underlying growth
- 3%

0.0
1.0
2.0
3.0
4.0
5.0
6.0
7.0
8.0
9.0
10.0
Q1 Q2 Q3 Q4
Europe
U.S.
ENTYVIO®
ENTYVIO® growth supports the sales target of more than $2 bln
(Sales generated from 18 countries as of end of March 2015)
@Constant currency
| Consolidated Financial Results for FY2014 and Guidance for FY2015| Announced May 15, 2015
Revenue(billion yen)
6
Steady growth of BRINTELLIX® and ADCETRIS®
| Consolidated Financial Results for FY2014 and Guidance for FY2015| Announced May 15, 20157
0
1
2
3
4
Q4 Q1 Q2 Q3 Q4
FY2013 FY2014
@Constant currency
BRINTELLIX®
(U.S.)
Revenue(billion yen)
0
5
10
15
20
25
FY2012 FY2013 FY2014
ADCETRIS®*(EU, Japan, EM)
* Including Named Patient Program (NPP) sales
Revenue(billion yen)

COLCRYS: Limited volume loss; some pricing pressure
• Authorized Generics (AG) gained 2/3 of market volume
• Takeda (Brand and AG) above 95% volume share of colchicine market in Q4
• Price levels down
• 6% YoY decline in Takeda colchicine net sales in Q4
• Sales decline could continue in FY2015, with additional price pressure
| Consolidated Financial Results for FY2014 and Guidance for FY2015| Announced May 15, 20158
290.3 281.3
571.2 548.1
297.9 341.0
237.8 250.6
278.4 300.9
FY 2013 FY 2014
Growth driven by innovation in the U.S. and EU, and by value brands in Emerging Markets
(billion yen)
+ 14.5%
- 4.1%
+ 5.4%
+ 8.1%
- 3.1%
Growth rate
+ 2.8%
Underlying growth
* Others: Representing licensees business and Consumer Healthcare business, etc.
Emerging markets
Europe and Canada
U.S.
Japan
Others*
| Consolidated Financial Results for FY2014 and Guidance for FY2015| Announced May 15, 20159

301.1
294.9
+ 21.3
+ 1.6 + 4.6
- 30.4
- 3.3
FY 2013 Revenue(gross margin impact)
S&M G&A R&D Other FY 2014
Underlying Core Earnings evolution reflecting investment for product launches
FY2013 FY2014
(billion yen)
- 2.1%
10| Consolidated Financial Results for FY2014 and Guidance for FY2015| Announced May 15, 2015
Growth Investment for new products
(+7.6%) (-1.1%) (+1.0%)
OPEX +3.6% vs PY
*Costs related to Long-term incentive plan are included in "Other"
*
| Consolidated Financial Results for FY2014 and Guidance for FY2015| Announced May 15, 201511
Stable underlying Core Earnings and underlying Core EPS
FY2013 FY2014 Growth
301.1 294.9 -2.1%
18.0% 17.1% -0.9 pts
29.5% 31.9% +2.4 pts
202.4 194.1 -4.1%
256 yen 247 yen -3.7%
Underlying Core tax rate
Underlying Core net profit
Underlying Core EPS
Underlying Core Earnings
% of Revenue
billion yen

FY2014 Reported Income Statement
| Consolidated Financial Results for FY2014 and Guidance for FY2015| Announced May 15, 201512
13 *Other expenses include amortization and impairment associated with products.
FY2013 FY2014
1,691.7 1,777.8 + 5.1%
1,201.4 1,256.8 + 4.6%
71.0% 70.7% -0.3 pts
(556.2) (612.6) + 10.1%
(341.6) (382.1) + 11.9%
23.9 107.2 -
(188.2) (498.6) -
139.3 -129.3 -
8.2% -7.3% -15.5 pts
19.6 (16.2) -
158.9 -145.4 -
(49.3) 2.4 -
(2.9) (2.7) - 5.5%
106.7 -145.8 -
135 yen - 185 yen -
Yen per USD 100 109Yen per EUR 133 139
Non-controlling interests
Financial income/expenses, other
Exchange Rate
Revenue
Gross profit% of Revenue
SG&A
EPS
Profit before tax
billion yen Change
Operating profit% of Revenue
Net profit
R&D
Other income
Other expenses*
Income tax
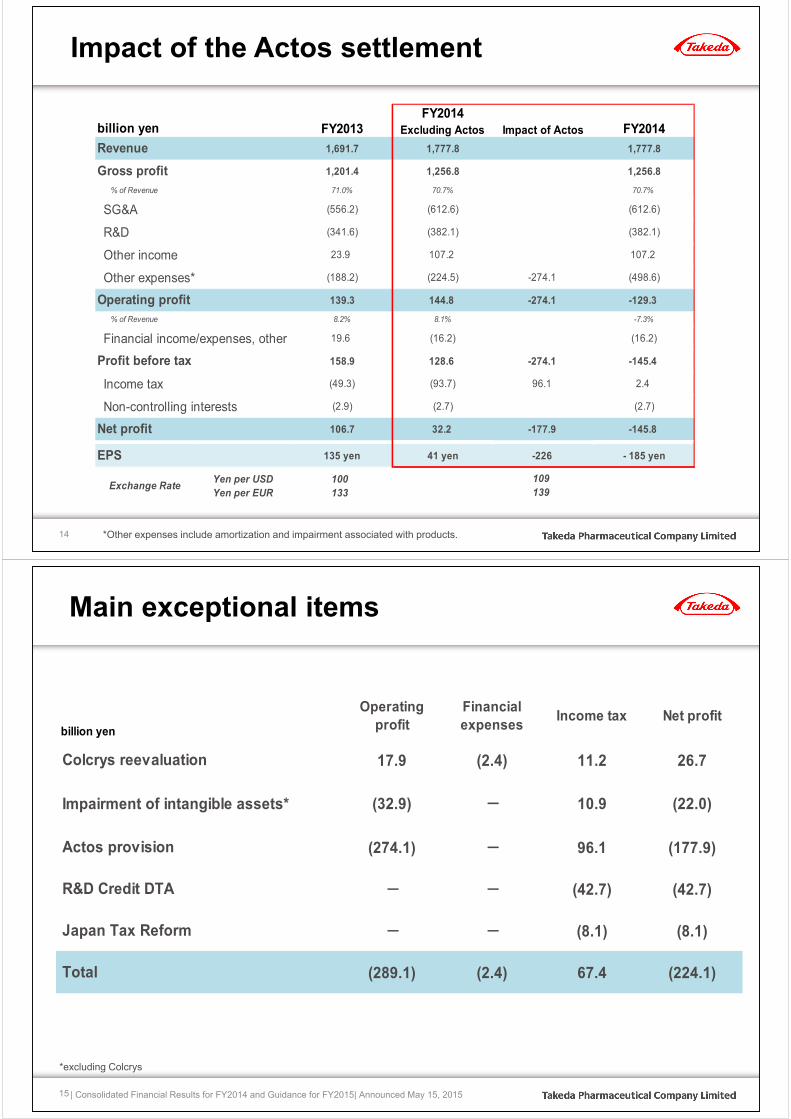
Reported income statement:one-time loss due to Actos settlement
Impairment of motesanib (10.9)
Sales of real estate assets+26.0
COLCRYS +53.8
COLCRYS (36.0)
ACTOS provision (274.1)
Gain on sales of securities(40.3)
14 *Other expenses include amortization and impairment associated with products.
Impact of the Actos settlement
FY2013FY2014
Excluding Actos Impact of Actos FY2014
1,691.7 1,777.8 1,777.8
1,201.4 1,256.8 1,256.8
71.0% 70.7% 70.7%
(556.2) (612.6) (612.6)
(341.6) (382.1) (382.1)
23.9 107.2 107.2
(188.2) (224.5) -274.1 (498.6)
139.3 144.8 -274.1 -129.3
8.2% 8.1% -7.3%
19.6 (16.2) (16.2)
158.9 128.6 -274.1 -145.4
(49.3) (93.7) 96.1 2.4
(2.9) (2.7) (2.7)
106.7 32.2 -177.9 -145.8
135 yen 41 yen -226 - 185 yen
Yen per USD 100Yen per EUR 133
Non-controlling interests
R&D
SG&A
Revenue
Gross profit% of Revenue
Other income
Other expenses*
Operating profit% of Revenue
Financial income/expenses, other
billion yen
139
Profit before tax
Income tax
Net profit
EPS
Exchange Rate109
Main exceptional items
| Consolidated Financial Results for FY2014 and Guidance for FY2015| Announced May 15, 2015
*excluding Colcrys
15
Operatingprofit
Financialexpenses
Income tax Net profit
17.9 (2.4) 11.2 26.7
(32.9) - 10.9 (22.0)
(274.1) - 96.1 (177.9)
- - (42.7) (42.7)
- - (8.1) (8.1)
(289.1) (2.4) 67.4 (224.1) Total
R&D Credit DTA
Japan Tax Reform
billion yen
Colcrys reevaluation
Impairment of intangible assets*
Actos provision

| Consolidated Financial Results for FY2014 and Guidance for FY2015| Announced May 15, 201516
Bridge from reported to underlying, OP to CE
billion yen FY2013 FY2014 Growth
Revenue 1,691.7 1,777.8 + 5.1%
Fx effects 6.0 (40.0)
Divestments (22.1) (16.0)
Underlying Growth
+ 2.8%
Operating profit 139.3 -129.3 -
Actos one off 274.1
Amortization of intangibles 119.7 123.8
Impairment of intangibles 23.1 63.5
Disposal of unused property (6.7) (32.8)
Restructuring costs 21.7 31.2
Contingent consideration 5.6 (51.3)
Litigation costs, etc. 11.6 9.2
Core Earnings 314.2 288.3 - 8.2%
Fx effects 3.0 13.8
Divestments and other (16.1) (7.3)
Underlying Growth
- 2.1%
Underlying Revenue 1,675.7 1,721.9
Underlying Core Earnings 301.1 294.9
Revenue/Core Earnings guidance met
| Consolidated Financial Results for FY2014 and Guidance for FY2015| Announced May 15, 201517
* Guidance announced on February 5, 2015
FY2014Guidance*
FY2014Actual
1,725.0 1,777.8 +3.1%
(350.0) (382.1) +9.2%
170.0 -129.3 -
160.0 -145.4 -
65.0 -145.8 -
83 yen -185 yen -
280.0 288.3 +3.0%
% of Revenue 16.2% 16.2%
180.0 176.7 -1.8%
228 yen 225 yen -1.4%
Yen per USD 109 109
Yen per EUR 141 139Exchange Rate
R&D expenses
Operating profit
Net profit
EPS
Core Earnings
Core EPS
Core net profit
Profit before tax
billion yen
Revenue

Project Summit Update
| Consolidated Financial Results for FY2014 and Guidance for FY2015| Announced May 15, 201518
Project Summit - strong results with good execution
• Reduced ERP systems from 4 to 3, and continued consolidation of Global IT networks
• Transformed procurement process across 13 global category teams and 3 regional hubs
• Implemented Shared Service units in US and JP, and completed 2/3 of consolidation in EU
• Reconfigured Emerging Markets Business Unit including merger of Greater China and APAC
• Created global functions and eliminated redundancy in G&A
• Initiated Manufacturing & Supply site optimization with closures in Belgium, Denmark, and Norway
• Finalized consolidation of R&D development
• Completed commercial restructuring in Philippines and ongoing restructuring continues in Australia
FY14 Results
• Q4 savings:
¥8 bln
• FY14 savings:
¥28 bln
• FY14 implementation costs: ¥28 bln
| Consolidated Financial Results for FY2014 and Guidance for FY2015| Announced May 15, 201519

Summit 2-year cumulative savings > 50% of 5-year target with all functions and regions contributing
• Savings: ¥62 bln (¥34bln in FY13 and ¥28bln in FY14)
• Implementation costs: ¥45 bln (¥17bln in FY13 and ¥28bln in FY14)
R&D
30%
G&A
16%Commercial
47%
Manufacturing & Supply
7%
by Function
36%
Europe and Canada
27%
United States
Japan 23%
14%
Emerging Markets
| Consolidated Financial Results for FY2014 and Guidance for FY2015| Announced May 15, 2015
by Region
2-year cumulative savings
20
Fast execution of Summit to continue over the next three years
• Execute reorganization of select commercial areas to enhance operational efficiency
• Leverage procurement transformation through the implementation of global process & systems
• Streamline production facility network and align global manufacturing, supply chain, and quality organizations
• Optimize G&A functions by utilizing low cost shared service units and harmonizing process and systems
• Look beyond Summit to formalize new savings ideas that drive continuous operational efficiency
• >¥20 bln average savings
• >¥15 bln average implementation costs
Continue to...FY15-17 (each year)
• >¥120 bln savings
• Up to ¥100 blnimplementation costs
FY13-17 (cumulative)
| Consolidated Financial Results for FY2014 and Guidance for FY2015| Announced May 15, 201521

Cash Flow and Cash Position
| Consolidated Financial Results for FY2014 and Guidance for FY2015| Announced May 15, 201522
23 | Consolidated Financial Results for FY2014 and Guidance for FY2015| Announced May 15, 2015
Operating Free Cash Flow based on Core Earnings
• FY13 Income taxes paid does not include exceptional items which are tax refund related to Prevacid transactions and tax payments related to advance pricing agreement (APA). (74.6 bil yen)
FY2013 FY2014 Change
Core Earnings 314.2 288.3 - 8.2%
Depreciation Core business + 73.0 + 73.7
Net trade working capital - 57.1 - 54.1
Capital expenditures - 50.1 - 48.2
Acquisition of intangible assets (Milestone payments) - 28.4 - 60.5
Provision + 25.4 - 22.0
LTIP expenses - 3.4 + 0.6
Income taxes paid* (normalized) - 92.7 - 74.1
Operating free cash flow (normalized) 180.8 103.8 - 42.6%
billion yen

Cash position
| Consolidated Financial Results for FY2014 and Guidance for FY2015| Announced May 15, 201524
100.0
179.4
140.0
0.0
120.0 130.0
0.0
50.0
100.0
150.0
200.0
FY2015 FY2016 FY2017 FY2018 FY2019 FY2020* Debt figures in this slide represent Bonds and loans FX rate hedged basis** Cash and cash equivalents: Includes short-term investments which mature or become due within one year from the reporting date
(billion yen) Average debt* maturity at 2.8 years
Debt repayment schedule
billion yen Mar. 2014 Mar. 2015
Gross debt* (790.3) (668.7)
Cash and cash equivalents** 805.7 657.2
Net cash / (Net debt) 15.4 (11.5)
Net debt / EBITDA ratio 0.0 (0.1)
Actos settlement
| Consolidated Financial Results for FY2014 and Guidance for FY2015| Announced May 15, 201525

Actos settlement
| Consolidated Financial Results for FY2014 and Guidance for FY2015| Announced May 15, 2015
• More than 9,250 plaintiffs filed lawsuits against Takeda
• Nearly all mass tort litigations eventually end with a settlement
• $2.7 billion provision booked in FY2014 covers the settlement and
estimated costs associated with remaining cases and other related litigation
• Settlement will become effective if 95% of current plaintiffs opt in
• Expected product liability insurance coverage of approximately $400 mil
• Takeda believes that Actos' benefit/risk profile is positive for the treatment of
type 2 diabetes. Actos is available as a treatment option in the U.S. and
other countries
26
FY2015 Guidance
| Consolidated Financial Results for FY2014 and Guidance for FY2015| Announced May 15, 201527

FY2015 Management Guidance
Revenue Low single digit
FY2015 Management Guidance(underlying growth)
Core EPSHigher than core earnings growth
| Consolidated Financial Results for FY2014 and Guidance for FY2015| Announced May 15, 201528
Core Earnings Higher than revenue growth
FY2015 Reported Guidance
| Consolidated Financial Results for FY2014 and Guidance for FY2015| Announced May 15, 2015
*Our operations are exposed to various risks at present and in the future, such as changes in the business environment and fluctuation of foreign exchange rates. All guidance in this presentation are based on information currently available to the management, and various factors could cause actual results to differ.
FY2015Guidance*
1,820.0
(330.0)
105.0
115.0
68.0
87 yen
Yen per USD 120
Yen per EUR 130
Revenue
Exchange Rate
R&D expenses
Operating profit
Net profit for the year
EPS
Profit before tax
29
(billion yen)

Sustainable dividend policy
FY2015 180 yen
| Consolidated Financial Results for FY2014 and Guidance for FY2015| Announced May 15, 2015
The Actos settlement will not affect Takeda's ability to pay dividends
after FY2015 at least maintain 180 yen
Annual dividend per share
30
IR Communications
| Consolidated Financial Results for FY2014 and Guidance for FY2015| Announced May 15, 201531

IR communications
Future IR events planned
– Investor day previously planned in June in Tokyo will be rescheduled to accommodate both investors' interest in oncology, and the timing of announcement of clinical trial results for ixazomib
– Annual general meeting of shareholders on June 26 in Osaka
– FY2015 Q1 conference call on July 30
| Consolidated Financial Results for FY2014 and Guidance for FY2015| Announced May 15, 2015
IR materials
– Additional financial data available on our website as a spreadsheet
32
Appendix
| Consolidated Financial Results for FY2014 and Guidance for FY2015| Announced May 15, 201533

Appendix 1. FY2014 Supplemental
| Consolidated Financial Results for FY2014 and Guidance for FY2015| Announced May 15, 201534
24.3 26.0
85.3 100.3
77.478.2
91.596.4
278.4300.9
FY 2013 FY 2014
+ 5.4%
+ 17.6%
+ 1.1%
+ 7.2%
+ 8.1%
Region
EM sales for 2014
(billion yen)
Underlying growth
Russia
+ 10%
Brazil
+ 5%
China
+ 26%
Main countriesLocal currency
Russia/CIS
Latin America
Asia
Middle East, Oceania & Africa
| Consolidated Financial Results for FY2014 and Guidance for FY2015| Announced May 15, 201535

Underlying core tax rate
| Consolidated Financial Results for FY2014 and Guidance for FY2015| Announced May 15, 201536
Takeda anticipates underlying core tax rate of less than 30% from FY2017 onward*Includes reversal of COLCRYS contingent consideration.**mainly revaluation of NOLs and US ACA Fee Legislation.
FY2013 FY2014 Change
31.0% 1.7% -29.3 pts
Impact of other non-core items(PPA, restructuring, disposals, etc.)*
-1.3% +18.0% +19.3 pts
Impact of ACTOS settlement - +34.2% +34.2 pts
Impact of FY2015 Japan tax reform - -2.9% -2.9 pts
Impact of R&D credit - -15.2% -15.2 pts
29.7% 35.8% +6.1 pts
Impact of other normalizationAdjustments**
-0.2% -3.9% -3.7 pts
29.5% 31.9% +2.4 ptsUnderlying core tax rate
Reported tax rate
Core tax rate
Appendix 2. FY2014 Q4
| Consolidated Financial Results for FY2014 and Guidance for FY2015| Announced May 15, 201537

398.4
413.5
+ 26.1
- 11.1
Q4 2013 New products * Base business Q4 2014
Q4 underlying revenue growth at +3.8%
(billion yen)
| Consolidated Financial Results for FY2014 and Guidance for FY2015| Announced May 15, 2015
* New products: Represent products launched in and after 2009, excluding new formulation or fixed dose combination of existing drugs: DEXILANT, COLCRYS, AZILVA, NESINA, ENTYVIO, ULORIC, ADCETRIS, LOTRIGA, BRINTELLIX, TAKECAB, CONTRAVE etc.
Underlying growth
38
+ 6.6%
- 2.8%
+3.8%
Pricing pressure and generic impact
in Japan
67.1 66.0
125.8 121.8
75.5 86.8
57.8 61.3
72.377.6
FY2013 Q4 FY2014 Q4
Q4 underlying revenue growth in U.S. and Europe driven by innovation
(billion yen)
+ 15.0%
- 3.1%
+ 6.0%
+ 7.3%
- 1.7%
Growth rate
+ 3.8%
Underlying growth
*Others: Representing licensees business and Consumer Healthcare business, etc.
Emerging markets
Europe and Canada
U.S.
Japan
Others*
| Consolidated Financial Results for FY2014 and Guidance for FY2015| Announced May 15, 201539
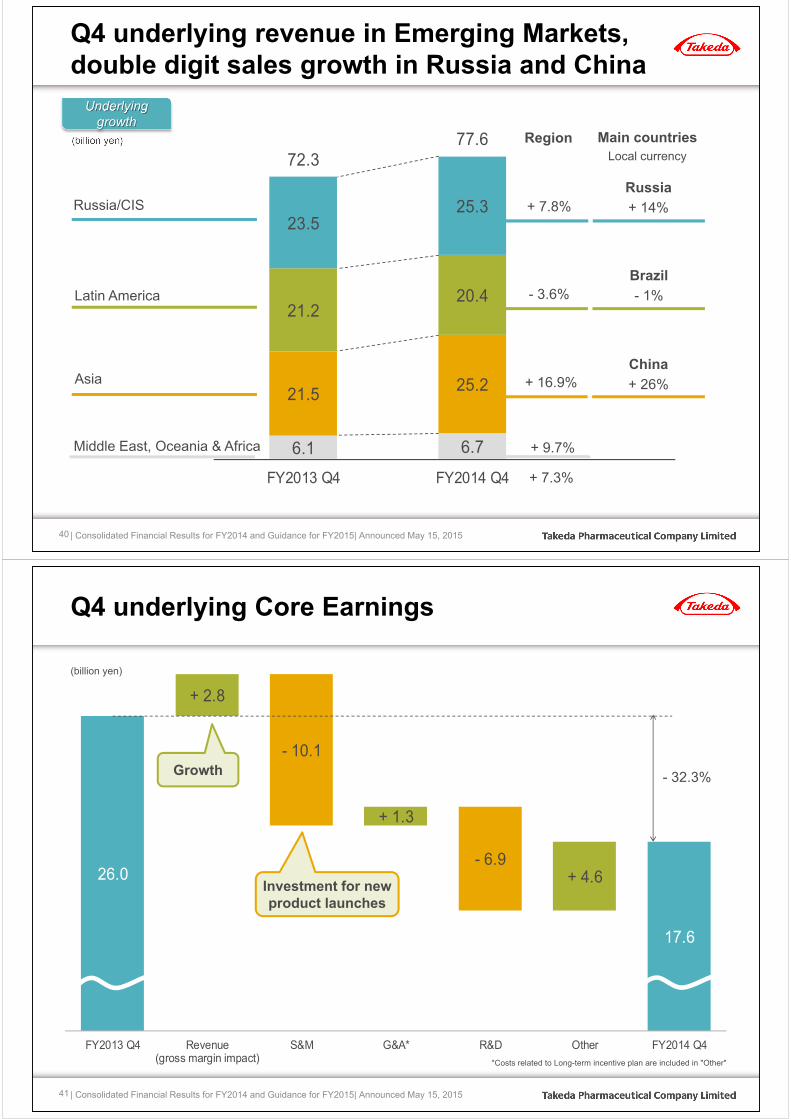
6.1 6.7
21.5 25.2
21.220.4
23.525.3
72.377.6
FY2013 Q4 FY2014 Q4
+ 7.8%
+ 16.9%
- 3.6%
+ 9.7%
+ 7.3%
Region
Q4 underlying revenue in Emerging Markets, double digit sales growth in Russia and China
(billion yen)
Underlying growth
Russia/CIS
Latin America
Asia
Middle East, Oceania & Africa
Russia
+ 14%
Brazil
- 1%
China
+ 26%
Main countriesLocal currency
| Consolidated Financial Results for FY2014 and Guidance for FY2015| Announced May 15, 201540
26.0
17.6
+ 2.8
+ 1.3
+ 4.6
- 10.1
- 6.9
FY2013 Q4 Revenue(gross margin impact)
S&M G&A* R&D Other FY2014 Q4
Q4 underlying Core Earnings
(billion yen)
- 32.3%
| Consolidated Financial Results for FY2014 and Guidance for FY2015| Announced May 15, 2015
Growth
Investment for new product launches
41
*Costs related to Long-term incentive plan are included in "Other"

| Consolidated Financial Results for FY2014 and Guidance for FY2015| Announced May 15, 201542
Q4 reported to underlying
billion yen FY2013 Q4 FY2014 Q4 Growth
Revenue 404.8 437.8 + 8.2%
Fx effects (4.9) (16.1)
Divestments (1.5) (8.3)
Underlying Growth
+ 3.8%
Operating profit -37.4 -328.3 -
Actos one off 274.1
Amortization of intangibles 31.3 29.6
Impairment of intangibles 23.1 29.7
Disposal of unused property (6.7) (7.4)
Restructuring costs 7.6 11.2
Contingent consideration 5.8 2.5
Litigation costs, etc. 1.6 1.5
Core Earnings 25.3 12.9 - 48.8%
Fx effects 1.0 11.3
Divestments (0.2) (6.7)
Underlying Growth
- 32.3%
Underlying Revenue 398.4 413.5
Underlying Core Earnings 26.0 17.6
Appendix 3.Definition of Core Earnings
| Consolidated Financial Results for FY2014 and Guidance for FY2015| Announced May 15, 201543

Adjustment items of Core Earnings
Adjustment items from Operating profit Note
1 Amortization of intangibles recognized through acquisition and in-licensing
Amortization costs of • Intangibles of launched product derived from corporate
acquisition• Intangibles of upfront payments and any milestone payment (e.g.
stage-up, NDA, approval) derived from in-licensing contract• Intangibles of platform technology
2 Impairments of intangibles recognized through acquisition and in-licensing
Impairments of • Intangibles (launched products and R&D pipeline) derived from
corporate acquisition and in-licensing contract• Goodwill
3 Other purchase accounting effects • Inventory step-up amortization• Fair value adjustment of contingent consideration
4 Profits and losses from the disposal of affiliates, business and others
• Disposal of businesses, affiliates, real estate and securities** Adjustment item of Core net profit
5 Costs of major restructuring programs • Integration costs• Implementation costs
6 Gains and charges from large sized legal settlements/judgments/fines and large sized litigation expense (payment to lawyer)
• e.g. Actos settlement provision, litigation expense (payment to lawyer), etc.
7 Gains and losses not related to underlying business performance which the company deems exceptional
• Global issues outside the healthcare sector beyond the Group’s control (ex. disaster, etc.)
• Expense caused by product recall• Government grants• Tax refund/ dispute, etc.
| Consolidated Financial Results for FY2014 and Guidance for FY2015| Announced May 15, 201544
2015/5/15