Consolidated financial report for the nine-month period ... · Title: Consolidated financial report...
71
This English translation of the financial report was prepared for reference purposes only and is qualified in its entirety by the original Japanese version. The financial information contained in this report is derived from our unaudited consolidated financial statements appearing in item 3 of this report. SoftBank Group Corp. Consolidated Financial Report For the nine-month period ended December 31, 2017 (IFRS) Tokyo, February 7, 2018 1. Financial Highlights (Millions of yen; amounts are rounded to the nearest million yen) (1) Results of Operations (Percentages are shown as year-on-year changes) Net sales Operating income Income before income tax Net income Net income attributable to owners of the parent Total comprehensive income Amount % Amount % Amount % Amount % Amount % Amount % Nine-month period ended December 31, 2017 ¥6,811,274 3.5 ¥1,148,829 23.6 ¥563,804 (41.0) ¥1,202,745 34.8 ¥1,014,944 20.0 ¥1,641,278 74.7 Nine-month period ended December 31, 2016 ¥6,581,466 (0.3) ¥929,328 15.5 ¥954,925 12.6 ¥892,276 74.6 ¥845,773 97.2 ¥939,277 110.9 Basic earnings per share (yen) Diluted earnings per share (yen) Nine-month period ended December 31, 2017 ¥918.29 ¥894.15 Nine-month period ended December 31, 2016 ¥758.90 ¥751.58 Note: Net sales, operating income, and income before income tax are presented based on the amounts from continuing operations only. (2) Financial Position Total assets Total equity Equity attributable to owners of the parent Ratio of equity attributable to owners of the parent to total assets (%) As of December 31, 2017 ¥29,412,718 ¥6,568,877 ¥5,505,689 18.7 As of March 31, 2017 ¥24,634,212 ¥4,469,730 ¥3,586,352 14.6 2. Dividends Dividends per share First quarter Second quarter Third quarter Fourth quarter Total (yen) (yen) (yen) (yen) (yen) Fiscal year ended March 31, 2017 - 22.00 - 22.00 44.00 Fiscal year ending March 31, 2018 - 22.00 - Fiscal year ending March 31, 2018 (Forecasted) 22.00 44.00 Note: Revision of forecasts on the dividends: No
Transcript of Consolidated financial report for the nine-month period ... · Title: Consolidated financial report...

This English translation of the financial report was prepared for reference purposes only and is qualified in its entirety by the original Japanese version. The financial information contained in this report is derived from our unaudited consolidated financial statements appearing in item 3 of this report.
SoftBank Group Corp. Consolidated Financial Report
For the nine-month period ended December 31, 2017 (IFRS)
Tokyo, February 7, 2018 1. Financial Highlights (Millions of yen; amounts are rounded to the nearest million yen)
(1) Results of Operations
(Percentages are shown as year-on-year changes)
Net sales Operating income
Income before income
tax Net income
Net income attributable to owners of the
parent
Total comprehensive
income
Amount % Amount % Amount % Amount % Amount % Amount %
Nine-month period ended December 31, 2017 ¥6,811,274 3.5 ¥1,148,829 23.6 ¥563,804 (41.0) ¥1,202,745 34.8 ¥1,014,944 20.0 ¥1,641,278 74.7
Nine-month period ended December 31, 2016 ¥6,581,466 (0.3) ¥929,328 15.5 ¥954,925 12.6 ¥892,276 74.6 ¥845,773 97.2 ¥939,277 110.9
Basic earnings per share (yen)
Diluted earnings per share (yen)
Nine-month period ended December 31, 2017 ¥918.29 ¥894.15
Nine-month period ended December 31, 2016 ¥758.90 ¥751.58
Note: Net sales, operating income, and income before income tax are presented based on the amounts from continuing operations only.
(2) Financial Position
Total assets Total equity Equity
attributable to owners of the
parent
Ratio of equity attributable to
owners of the parent to total assets (%)
As of December 31, 2017 ¥29,412,718 ¥6,568,877 ¥5,505,689 18.7
As of March 31, 2017 ¥24,634,212 ¥4,469,730 ¥3,586,352 14.6
2. Dividends Dividends per share
First quarter Second quarter Third quarter Fourth quarter Total (yen) (yen) (yen) (yen) (yen)
Fiscal year ended March 31, 2017 - 22.00 - 22.00 44.00
Fiscal year ending March 31, 2018 - 22.00 -
Fiscal year ending March 31, 2018 (Forecasted)
22.00 44.00
Note: Revision of forecasts on the dividends: No

* Notes
(1) Significant changes in scope of consolidation (changes in scope of consolidation of specified subsidiaries): Yes Newly consolidated: None Excluded from consolidation: One company SoftBank Group Japan GK Please refer to page 33 “(1) Significant Changes in Scope of Consolidation for the Nine-month Period Ended December 31, 2017” under “2. Notes to Summary Information” for details.
(2) Changes in accounting policies and accounting estimates [1] Changes in accounting policies required by IFRSs: Yes [2] Changes in accounting policies other than those in [1]: No [3] Changes in accounting estimates: Yes
Please refer to page 33 “(2) Changes in Accounting Policies” and “(3) Changes in Accounting Estimates” under “2. Notes to Summary Information” for details.
(3) Number of shares issued (common stock) [1] Number of shares issued (including treasury stock):
As of December 31, 2017: 1,100,660,365 shares As of March 31, 2017: 1,100,660,365 shares
[2] Number of shares of treasury stock: As of December 31, 2017: 11,161,873 shares As of March 31, 2017: 11,378,076 shares
[3] Number of average shares outstanding during nine-month period (April-December): As of December 31, 2017: 1,089,453,785 shares As of December 31, 2016: 1,114,476,150 shares
* This interim consolidated financial report is not subject to interim review procedures. * Note to forecasts on the consolidated results of operations and other items
Allocation of the consideration related to the consolidation of Arm in September 2016 was completed during the three-month period ended June 30, 2017. As a result, each financial figure has been revised retrospectively for the nine-month period ended December 31, 2016. Descriptions regarding the future are estimated based on the information that the Company is able to obtain at the present point in time and assumptions which are deemed to be reasonable. However, actual results may be different due to various factors. On February 7, 2018, the Company will hold an earnings results briefing for the media, institutional investors, and financial institutions. This earnings results briefing will be broadcast live on our website in both Japanese and English at https://www.softbank.jp/en/corp/irinfo/. The Data Sheet will also be posted on the Company’s website around 4 p.m. on the same day at https://www.softbank.jp/en/corp/irinfo/presentations/.

(Appendix)
Contents
1. Results of Operations ............................................................................................................................................... P. 2
(1) Overview of Results of Operations ................................................................................................................... P. 2
a. Consolidated Results of Operations ................................................................................................................ P. 3
b. Results by Segment ........................................................................................................................................ P. 8
(2) Overview of Financial Position ........................................................................................................................ P. 25
(3) Overview of Cash Flows .................................................................................................................................. P. 31
(4) Forecasts ........................................................................................................................................................... P. 32
2. Notes to Summary Information ............................................................................................................................... P. 33
(1) Significant Changes in Scope of Consolidation for the Nine-month Period Ended December 31, 2017 ............ P. 33
(2) Changes in Accounting Policies ........................................................................................................................ P. 33
(3) Changes in Accounting Estimates ..................................................................................................................... P. 33
3. Condensed Interim Consolidated Financial Statements and Primary Notes .......................................................... P. 34
(1) Condensed Interim Consolidated Statement of Financial Position .................................................................... P. 36
(2) Condensed Interim Consolidated Statement of Income and Condensed Interim Consolidated Statement of
Comprehensive Income .................................................................................................................................... P. 38
(3) Condensed Interim Consolidated Statement of Changes in Equity ................................................................... P. 42
(4) Condensed Interim Consolidated Statement of Cash Flows .............................................................................. P. 44
(5) Significant Doubt about Going Concern Assumption ....................................................................................... P. 46
(6) Notes to Condensed Interim Consolidated Financial Statements ...................................................................... P. 46
Definition of Company Names and Abbreviations Used in this Appendix
Company names and abbreviations used in this appendix, except as otherwise stated or interpreted differently in the
context, are as follows:
Company names / Abbreviations Definition
SoftBank Group Corp. SoftBank Group Corp. (standalone basis)
The Company SoftBank Group Corp. and its subsidiaries
*Each of the following abbreviations indicates the respective company, and its subsidiaries, if any.
Sprint Sprint Corporation
Brightstar Brightstar Global Group Inc.
Arm Arm Holdings plc
SoftBank Vision Fund
SoftBank Vision Fund L.P.
SoftBank Vision Fund (AIV M1) L.P.
SoftBank Vision Fund (AIV M2) L.P.
SoftBank Vision Fund (AIV S1) L.P.
Delta Fund SB Delta Fund (Jersey) L.P.
Fortress Fortress Investment Group LLC
Alibaba Alibaba Group Holding Limited
The third quarter Three-month period ended December 31, 2017
The period Nine-month period ended December 31, 2017
The end of the third quarter December 31, 2017
The previous fiscal year Fiscal year ended March 31, 2017
The previous fiscal year-end March 31, 2017
SoftBank Group Corp. Consolidated Financial Report For the nine-month period ended December 31, 2017
1

1. Results of Operations
(1) Overview of Results of Operations
1. Sales and income increased yoy
Net sales increased 3.5%
- Sales increased in all segments
Operating income increased 23.6%
- Income from SoftBank Vision Fund and Delta Fund of ¥236.4 billion
- Sprint’s operating income surged
Net income attributable to owners of the parent increased 20.0%
- U.S. tax reform boosted Sprint’s income by ¥687.7 billion
2. $27.5 billion invested to date at the SoftBank Vision Fund and Delta Fund segment
3. Consolidated Fortress
About the SoftBank Vision Fund and Delta Fund segment
The Company established the SoftBank Vision Fund and Delta Fund segment as a new reportable segment during the three
months ended June 30, 2017 (the “first quarter”) upon the first major closing of SoftBank Vision Fund on May 20, 2017.
About the Consolidation of Fortress
The Company acquired Fortress on December 27, 2017 for $3,162 million (¥358,612 million), making it a subsidiary.
Consideration for the acquisition of $2,650 million (¥300,484 million), excluding the payment of $512 million (¥58,128
million) for a transaction that remunerates employees and principals of Fortress on the condition of continuing employment,
has been allocated to the acquired assets and assumed liabilities based on the fair value as of the acquisition date (December
27, 2017), as follows. For details, see “Fortress” under “3. Business Combinations” in “(6) Notes to Condensed Interim
Consolidated Financial Statements” in “3. Condensed Interim Consolidated Financial Statements and Primary Notes.”
Fair value on acquisition date (Dec. 27, 2017)
Millions of U.S. dollars Millions of yen
Consideration transferred 2,650 300,484
Fair value of assets and liabilities, and goodwill on the acquisition date
Intangible assets 1,558 176,690
Other assets and liabilities (net) 797 90,383
Non-controlling interests 131 14,850
Goodwill 164 18,561
Note: The main component of intangible assets is management contracts of ¥128,323 million. The management contracts reflect excessive
earnings power in the future expected from the agreement which Fortress entered into regarding the asset managements through funds. The
management contracts will be amortized over 1.5 to 10 years on a straight-line method.
The results of operations of Fortress have been reflected since December 28, 2017 in “Other” in the Company’s segments.
Operating loss of Fortress was ¥4,262 million for the period. This included a one-time expense of ¥3,788 million for
settlement of the restricted stock units held by employees and principals of Fortress prior to the acquisition date.
SoftBank Group Corp. Consolidated Financial Report For the nine-month period ended December 31, 2017
2

a. Consolidated Results of Operations
(Millions of yen)
Nine months ended December 31
2016 2017 Change Change %
Continuing operations
Net sales 6,581,466 6,811,274 229,808 3.5%
Operating income (excluding income from
SoftBank Vision Fund and Delta Fund) 929,328 912,402 (16,926) (1.8%)
Operating income from SoftBank Vision
Fund and Delta Fund - 236,427 236,427 -
Operating income 929,328 1,148,829 219,501 23.6%
Income before income tax 954,925 563,804 (391,121) (41.0%)
Net income from continuing operations 338,971 1,202,745 863,774 254.8%
Discontinued operations
Net income from discontinued operations 553,305 - (553,305) -
Net income 892,276 1,202,745 310,469 34.8%
Net income attributable to owners of the parent 845,773 1,014,944 169,171 20.0%
Reference: Average exchange rates used for translations
Fiscal year ended March 2017
Fiscal year ending March 2018
Q1 Q2 Q3 Q4 Q1 Q2 Q3
USD / JPY ¥109.07 ¥102.91 ¥108.72 ¥113.76 ¥111.61 ¥111.38 ¥112.74
An overview of the consolidated results of operations for the period is as follows:
Continuing Operations
(a) Net Sales
Net sales increased by ¥229,808 million (3.5%) year on year to ¥6,811,274 million. Net sales increased at the Domestic
Telecommunications segment, the Sprint segment, the Yahoo Japan segment, the Distribution segment, and the Arm seg-
ment. Arm’s net sales reflected results of operations of Arm since September 6, 2016.
(b) Operating Income (excluding income from SoftBank Vision Fund and Delta Fund)
Operating income (excluding income from SoftBank Vision Fund and Delta Fund) decreased by ¥16,926 million (1.8%)
year on year to ¥912,402 million. Segment income increased by ¥146,655 million in the Sprint segment. Meanwhile, seg-
ment income deteriorated by ¥38,786 million in the Domestic Telecommunications segment, ¥7,888 million in the Yahoo
Japan segment, ¥59,781 million in the Distribution segment, and ¥31,787 million in the Arm segment. Segment loss of the
Distribution segment included impairment loss of ¥ 50,497 million for Brightstar.
(c) Operating Income from SoftBank Vision Fund and Delta Fund
Operating income from SoftBank Vision Fund and Delta Fund was ¥236,427 million (not recorded in the same period of
the previous fiscal year). This included unrealized gain on valuation of investments of ¥251,108 million, interest and divi-
dend income from investments of ¥3,744 million, and operating expenses of ¥18,425 million. Unrealized gain on valuation
of investments mainly reflected an increase in the fair value of NVIDIA Corporation (“NVIDIA”) shares held by SoftBank
SoftBank Group Corp. Consolidated Financial Report For the nine-month period ended December 31, 2017
3

Vision Fund and recorded as financial assets accounted for using FVTPL.
(d) Operating Income
As a result of (b) and (c), operating income increased by ¥219,501 million (23.6%) year on year to ¥1,148,829 million.
(e) Finance Cost
Finance cost increased by ¥39,974 million (11.6%) year on year to ¥383,337 million, mainly due to increases in interest
expense of ¥33,255 million at SoftBank Group Corp. and ¥2,536 million at Sprint. Interest expense at Sprint declined year
on year in U.S. dollar terms but increased in yen terms due to the weaker yen against the U.S. dollar.
(f) Income on Equity Method Investments
Income on equity method investments increased by ¥113,603 million (55.2%) year on year to ¥319,591 million. This was
mainly due to an increase in income on equity method investments related to Alibaba of ¥123,644 million (59.0%) year on
year to ¥333,256 million.
The difference between Alibaba’s net income (IFRS basis) for the nine months ended September 30, 2017 ((A) in the
table below) and net income (U.S. GAAP basis) ((B) below) is mainly due to a gain from remeasurement relating to busi-
ness combination of CNY 22,400 million that arose in relation to consolidation of Cainiao Smart Logistics Network Limited
in October 2017. This was recorded in net income in accordance with IFRSs as an out-of-period transaction.
Reference: Net Income of Alibaba and the Company’s Income on Equity Method Investments
Nine months ended September 301
2016 2017 Change
Alibaba
Net income (US GAAP) Million CNY
20,538 Million CNY
(B) 42,998 Million CNY
22,460
Net income (IFRSs) Million CNY
41,913 Million CNY
(A) 66,696 Million CNY
24,783
Nine months ended December 31
2016 2017 Change
Income on equity method investments related to Alibaba
(Reference) Interest ratio as of September 30 30.26% 29.41% (0.85%)
Income on equity method investments Million CNY
13,224
Million CNY
19,736
Million CNY
6,512
(Reference) Effective exchange rate CNY/JPY ¥15.85 ¥16.89 ¥1.04
Income on equity method investments Million yen
209,612
Million yen
333,256
Million yen
123,644
1 The Company applies the equity method to the financial statements of Alibaba on a three-month time lag, as it is impracticable to conform the report-
ing period of Alibaba due to the contract with Alibaba, among other reasons. The Company performs necessary adjustments for material transactions
or events arising during the lag period and publicly announced by Alibaba.
SoftBank Group Corp. Consolidated Financial Report For the nine-month period ended December 31, 2017
4

(g) Gain on Sales of Shares of Associates
Gain on sales of shares of associates was ¥1,804 million (gain of ¥238,101 million in the same period of the previous fiscal
year). In the same period of the previous fiscal year, the Company sold a portion of Alibaba shares to Alibaba, two Singa-
porean sovereign wealth funds, and Alibaba Partnership.2
(h) Foreign Exchange Gain and Loss
Foreign exchange gain was ¥20,100 million (gain of ¥34,222 million in the same period of the previous fiscal year).
(i) Derivative Gain and Loss
Derivative loss was ¥485,198 million (loss of ¥95,875 million in the same period of the previous fiscal year). This was
mainly attributable to a loss of ¥510,278 million recorded in relation to a collar transaction embedded in a variable prepaid
forward contract for Alibaba shares (see Note below).
The collar transaction is measured at the end of each quarter based on fair value (primarily linked to the share price of
Alibaba). The cumulative derivative gain and loss for the three years, from the conclusion of the variable prepaid forward
contract on June 10, 2016 until the settlement date, will be a loss of $900 million, equal to the amount of derivative assets
initially recognized.
Note: For details of the variable prepaid forward contract, see “(2) Transaction for sale of Alibaba shares by variable prepaid forward
contract” under “8. Interest-bearing debt” in “(6) Notes to Condensed Interim Consolidated Financial Statements” in “3. Condensed
Interim Consolidated Financial Statements and Primary Notes.”
(j) Changes in Third-party Interests in SoftBank Vision Fund and Delta Fund
Changes in third-party interests in SoftBank Vision Fund and Delta Fund increased ¥108,163 million (negative impact on
income; not recorded in the same period of the previous fiscal year). Of the third-party interests in SoftBank Vision Fund
and Delta Fund presented in Condensed Interim Consolidated Statement of Financial Position, the fluctuations arising from
SoftBank Vision Fund and Delta Fund’s business activities was recorded as the changes.
(k) Other Non-operating Income and Loss
Other non-operating income was ¥50,178 million compared to a loss of ¥13,476 million in the same period of the previous
fiscal year. The primary components for the period were as follows:
(Millions of yen)
Nine months ended December 31
2016 2017 Primary components
Dilution gain from
changes in equity interest
75,060 38,922 Private placement of new shares by Alibaba
Gain (loss) from financial
instruments at FVTPL
(39,281) 8,069 Recognition of gain in the fair value of investments, primarily in Southeast Asia and India
Impairment loss on assets
classified as held for sale
(42,540) - Loss due to a difference between the valuation of the 248,300,000 GungHo Online Entertainment, Inc. shares tendered by the Company in the same period of the previous fiscal year at the tender offer price of ¥294 per share and their carrying amount
Note: See “16. Other non-operating income (loss)” under “(6) Notes to Condensed Interim Consolidated Financial Statements” in “3.
Condensed Interim Consolidated Financial Statements and Primary Notes” for details.
2 Alibaba Partnership is not an affiliate of Alibaba.
SoftBank Group Corp. Consolidated Financial Report For the nine-month period ended December 31, 2017
5

(l) Income before Income Tax
As a result of (d) to (k), income before income tax decreased by ¥391,121 million (41.0%) year on year to ¥563,804 million.
(m) Income Taxes
Income taxes were credited ¥638,941 million (profit), compared with an expense of ¥615,954 million for the same period
of the previous fiscal year. Following the enactment of the U.S. Tax Cuts and Jobs Act in December 2017, deferred tax
liabilities of ¥829,762 million was reversed at Sprint, resulting in a decline in income taxes of ¥818,342 million and an
increase in other comprehensive income of ¥8,244 million. Details are as follows.
Reduction in the U.S. federal corporate tax rate
From January 1, 2018, the federal corporate tax rate was reduced from 35% to 21%. This resulted in a partial reversal of
deferred tax liabilities of ¥593,137 million related to FCC licenses and other assets of Sprint that were recognized based
on the previous income tax rate at the time of its acquisition in 2013. Income taxes decreased by ¥591,773 million.
Abolition of time limit on use of future loss carryforwards
Net operating losses generated in tax years beginning after December 31, 2017 may be carried forward indefinitely. For
Sprint, its tax year starts from April, therefore net operating losses generated after April 1, 2018 may be carried forward
indefinitely. In Sprint, for certain deductible temporary differences where deferred tax assets could not be previously real-
ized, it was likely to be recoverable because the taxable temporary differences from assets with indefinite lives, such as
FCC licenses, may be a source of future taxable income. As a result of this change, ¥236,625 million of deferred tax assets
was recognized (offset by deferred tax liabilities). Income taxes decreased by ¥226,569 million, and other comprehensive
income increased by ¥8,244 million.
(n) Net Income from Continuing Operations
As a result of (l) and (m), net income from continuing operations increased by ¥863,774 million (254.8%) year on year to
¥1,202,745 million.
Discontinued Operations
(o) Net Income from Discontinued Operations
Net income from discontinued operations was zero (income of ¥553,305 million in the same period of the previous fiscal
year). Income after income tax from Supercell Oy of ¥28,246 million and after-tax gain on sale of Supercell shares of
¥525,059 million were recorded in the same period of the previous fiscal year. Supercell Oy was excluded from the scope
of consolidation on July 29, 2016.
(p) Net Income
As a result of (n) and (o), net income increased by ¥310,469 million (34.8%) year on year to ¥1,202,745 million.
SoftBank Group Corp. Consolidated Financial Report For the nine-month period ended December 31, 2017
6

(q) Net Income Attributable to Owners of the Parent
After deducting net income attributable to non-controlling interests such as those of Sprint and Yahoo Japan Corporation
from (p), net income attributable to owners of the parent increased by ¥169,171 million (20.0%) year on year to ¥1,014,944
million.
Of Sprint’s decrease in income taxes of ¥818,342 million described in (m), ¥687,744 million was included in net income
attributable to owners of the parent, corresponding to SoftBank Group Corp.’s 84.04% ownership stake in Sprint.
(r) Comprehensive Income
Comprehensive income increased by ¥702,001 million year on year to ¥1,641,278 million. Of this, comprehensive income
attributable to owners of the parent increased by ¥566,901 million to ¥1,450,381 million.
SoftBank Group Corp. Consolidated Financial Report For the nine-month period ended December 31, 2017
7

b. Results by Segment
The Company’s reportable segments are components of business activities for which decisions on resource allocation and
assessment of performance are made. The Company has six reportable segments: Domestic Telecommunications, Sprint,
Yahoo Japan, Distribution, Arm, and SoftBank Vision Fund and Delta Fund. The Company established the SoftBank
Vision Fund and Delta Fund segment during the first quarter.
The main businesses and core companies of each reportable segment are as follows:
Segments Main businesses Core companies
Reportable segments
Domestic Telecom-
munications
· Provision of mobile communications services in Japan
· Sale of mobile devices in Japan
· Provision of broadband services to retail customers in Japan
· Provision of telecom services to corporate customers in Japan,
such as data communications and fixed-line telephone services
SoftBank Corp.
Wireless City Planning Inc.
Sprint · Provision of mobile communications services in the U.S.
· Sale and lease of mobile devices and sale of accessories in the
U.S.
· Provision of fixed-line telecommunications services in the U.S.
Sprint Corporation
Yahoo Japan · Internet advertising
· e-commerce business
· Membership services
Yahoo Japan Corporation
ASKUL Corporation
Distribution · Distribution of mobile devices overseas
· Sale of PC software, peripherals, and mobile device accessories
in Japan
Brightstar Corp.
SoftBank Commerce & Service
Corp.
Arm · Design of microprocessor intellectual property and related tech-
nology
· Sale of software tools
Arm Holdings plc
SoftBank Vision
Fund and Delta Fund
· Investment activities by SoftBank Vision Fund and Delta Fund SoftBank Vision Fund L.P.
SB Delta Fund (Jersey) L.P.
Other · Alternative investment management business
· Fukuoka SoftBank HAWKS-related businesses
Fortress Investment Group LLC
Fukuoka SoftBank HAWKS Corp.
Note: Income and adjusted EBITDA of reportable segments are calculated as follows:
Segments excluding the SoftBank Vision Fund and Delta Fund segment
Segment income = net sales - operating expenses (cost of sales + selling, general and administrative expenses) ± gain and loss from
remeasurement relating to business combination ± other operating income and loss, for each segment
Adjusted EBITDA =segment income (loss) + depreciation and amortization ± other adjustments
SoftBank Vision Fund and Delta Fund segment
Segment income = gain and loss from investments at SoftBank Vision Fund and Delta Fund - operating expenses
Adjusted EBITDA =segment income (loss) + depreciation and amortization ± unrealized gain and loss on valuation of investments
± other adjustments
For historical principal operational data of each segment, their calculation methods, and definitions of terms, see the Data Sheet
on the Company’s website at www.softbank.jp/en/corp/irinfo/presentations/.
SoftBank Group Corp. Consolidated Financial Report For the nine-month period ended December 31, 2017
8

(a) Domestic Telecommunications Segment
(Millions of yen)
Nine months ended December 31
2016 2017 Change Change %
Net sales 2,400,670 2,406,870 6,200 0.3%
Segment income 651,484 612,698 (38,786) (6.0%)
Depreciation and amortization 343,205 351,322 8,117 2.4%
Adjusted EBITDA 994,689 964,020 (30,669) (3.1%)
Capital expenditures
(acceptance basis) 182,556 216,999 34,443 18.9%
Free cash flow 434,896 399,868 (35,028) (8.1%)
Reference:
Adjusted free cash flow 480,825 427,540 (53,285) (11.1%)
Note: Adjusted free cash flow is calculated by adding proceeds from the borrowings through the securitization of handset install-
ment sales receivables and deducting repayments of such borrowings, to/from free cash flow.
OVERVIEW
Even as Japan’s telecommunications market approaches maturity, to achieve medium- to long-term growth, the domestic
telecommunications business is working to strengthen the foundation for future earnings by expanding smartphone and
broadband subscribers and advancing investment for creating new earnings opportunities, while aiming to generate a
stable free cash flow.
Main Initiatives
Expand sales of Home Bundle Discount Hikari Set
- Provide a discount on a smartphone and broadband bundle subscription
Promote SoftBank brand differentiation strategy
- High-volume flat-rate data plans Giga Monster (20GB) and Ultra Giga Monster (50G)
- Half Price Support that effectively enables purchase of smartphones at half price
Expand sales of sister brand Y!mobile
Collaborate with Yahoo Japan Corporation focusing on e-commerce
Expand business domain
- Collaborate with the Company’s investees such as WeWork Companies Inc. and Alibaba, and others
- Invest in growth domains such as cyber security and FinTech
1. Subscriber increase of 1.13 million for smartphones and 1.07 million for SoftBank Hikari from previ-
ous fiscal year end
- Upfront investments of Home Bundle Discount Hikari Set, Giga Monster and collaboration with Yahoo
Japan contributed, as well as the introduction of Half Price Support
2. Sales increased 0.3% yoy. Segment income declined 6.0% yoy, within the range of the full-year fore-
cast (maximum yoy decline of 7%)
3. Free cash flow of ¥399.9 billion, a steady progress on full-year forecast of over ¥500 billion
SoftBank Group Corp. Consolidated Financial Report For the nine-month period ended December 31, 2017
9

FINANCIAL RESULTS
(Millions of yen)
Nine months ended December 31
2016 2017 Change Change %
Telecom service revenue 1,828,791 1,803,061 (25,730) (1.4%)
Mobile communications 1,434,260 1,362,173 (72,087) (5.0%)
Telecom3 1,261,380 1,192,402 (68,978) (5.5%)
Service4 172,880 169,771 (3,109) (1.8%)
Broadband 194,749 240,022 45,273 23.2%
Fixed-line telecommunications 199,782 200,866 1,084 0.5%
Product and other sales 571,879 603,809 31,930 5.6%
Total net sales 2,400,670 2,406,870 6,200 0.3%
Net sales increased by ¥6,200 million (0.3%) year on year to ¥2,406,870 million. Of this, telecom service revenue
decreased by ¥25,730 million (1.4%) to ¥1,803,061 million, and product and other sales increased by ¥31,930 million
(5.6%) to ¥603,809 million.
Telecom service revenue decreased due to a ¥72,087 million (5.0%) year-on-year decrease in mobile communications
revenue, reflecting a decrease in mobile data devices, an increase in the total amount of discounts (negative impact on
revenue) associated with the growth in the cumulative number of applications of the Home Bundle Discount Hikari Set,
and the introduction of Half Price Support.5 Broadband revenue increased by ¥45,273 million (23.2%) in line with
subscriber growth for the SoftBank Hikari fiber-optic service.
Product and other sales increased mainly due to an increase in sales of customer-premises equipment for broadband
services and smartphones. Sales of smartphones increased due to an increase in the average shipment price of
smartphones, despite a decline in the number of units shipped.
Segment income decreased by ¥38,786 million (6.0%) year on year to ¥612,698 million. This was due to an increase
in operating expenses (cost of sales and selling, general and administrative expenses) of ¥44,986 million (2.6%) year on
year, despite the increase in net sales.
The main year-on-year fluctuations in operating expenses were an increase of ¥21,983 million (11.6%) in telecom-
munications network charges, which accompanied the growth in the number of SoftBank Hikari subscribers. Cost of
products also increased by ¥10,023 million (2.3%) due to an increase in the average purchase price of smartphones,
despite a decline in the number of units shipped. Depreciation and amortization expenses increased by ¥8,117 million
(2.4%) due to accelerating the depreciation of equipment that had become unnecessary ahead of the termination of 3G
on 1.7 GHz services planned in March 2018. Expenses also increased by ¥7,845 million (73.2%) related to Yahoo!
Premium6 membership service offerings to smartphone customers and optional services for SoftBank Hikari. On the
3 Telecom revenue of mobile communications services, etc., under the SoftBank and Y!mobile brands 4 Device warranty service revenue, content-related revenues, advertising revenues, etc. 5 Please see the next page for details regarding the impact of the Half Price Support program and the 48 monthly installment sales. 6 An offering that allows smartphone subscribers an unlimited use of special offers without additional charges under Yahoo! Premium membership
service, which is usually provided at a monthly charge of ¥462 by Yahoo Japan Corporation
SoftBank Group Corp. Consolidated Financial Report For the nine-month period ended December 31, 2017
10

other hand, sales commission fees decreased by ¥12,587 million (5.3%) due to a decline in the average cost of sales
commission fees for smartphones.
Adjusted EBITDA decreased by ¥30,669 million (3.1%) year on year to ¥964,020 million.
Capital expenditures (acceptance basis) increased by ¥34,443 million (18.9%) to ¥216,999 million due to the expan-
sion of service areas and improvement of quality for LTE network.
Free cash flow decreased by ¥35,028 million (8.1%) year on year to ¥399,868 million, mainly due to the decrease
of adjusted EBITDA and an increase in the amount of income taxes paid. The amount of income taxes paid increased
because the loss carryforwards fully utilized in the fiscal year ended March 2016 had subdued the amount of income
taxes paid in the same period of the fiscal year. The loss carryforwards were exhausted in the fiscal year ended March
2016.
Forecast for the Fiscal Year Ending March 2018
Segment income: maximum year-on-year decline of 7%
Capital expenditure (acceptance basis): ¥392.5 billion (¥320.6 billion in the previous fiscal year)
Free cash flow: continue to be over ¥500 billion (¥561.8 billion in the previous fiscal year)
- Down year on year due to a negative impact from: a decrease in adjusted EBITDA due to upfront investments, an
increase in income taxes paid due to the reason mentioned above, an increase in working capital mainly associated
with the expansion of smartphone sales, and an increase in investments for expanding earnings opportunities
Reference: Impact of the Half Price Support program and 48 monthly installment sales
The Half Price Support program, which was launched in September 2017, enables customers to purchase eligible
smartphones in 48 monthly installments, with the remaining monthly payments waived if the customer trades in
their used handset to upgrade to a designated new model after 24 monthly installments.
Revenues
Negative impact: The estimated waiver amount of installment payments less the estimated trade-in value of
handsets is deducted from telecom revenue in the contract months. The impact is not included in the calculation
of ARPU.
Positive impact: The monthly discount (negative impact on telecomm revenue) at 48 months installment payment
program is less than the discount at 24 months installment program.
Cash flow from operating activities
Negative impact: The amount of handset payment received each month at 48 months installment payment pro-
gram is less than that at 24 months installment program.
Positive impact: The monthly discount (negative impact on telecom revenue) at 48 months installment payment
program is less than the discount at 24 months installment program.
SoftBank Group Corp. Consolidated Financial Report For the nine-month period ended December 31, 2017
11

OPERATIONS
Mobile Communications Service
Subscribers (Main Subscribers7)
(Thousands)
December 31, 2017 Change from March 31, 2017
Cumulative subscribers 32,996 596
Cumulative subscribers increased from the previous fiscal year-end, with smartphone net additions of 1,128,000.8 In
smartphones, the number of Y!mobile subscribers continued to grow steadily, while SoftBank subscribers also grew due
to a successful promotion encouraging feature phone users to switch to smartphones. Conversely, subscribers for feature
phones and mobile data communications devices declined from the previous fiscal year-end. Demand for mobile data
communications devices continued to decline due to the impact of introducing Giga Monster.
Cumulative subscribers at the end of the third quarter included 182,000 subscribers to Wireless Home Phone, a new
home-phone voice calling service using the mobile network, which was launched in July 2017.
Home Bundle Discount Hikari Set Applications
(Thousands)
December 31, 2017
Change from March 31, 2017
Mobile communications service 7,617 1,588
Broadband service 3,671 766
Number of Units Sold (Main Subscribers)
(Thousands)
Nine months ended
December 31, 2017 YoY Change
Number of units sold 7,782 (61)
New subscriptions 3,419 70
Device upgrades 4,363 (131)
The number of units sold for mobile devices of main subscribers decreased year on year, reflecting the decrease in the
number of feature phones and mobile data communications devices sold, despite an increase in sales of smartphones,
due to the reasons described above.
7 The number of main subscribers includes subscribers to the Wireless Home Phone service. Number of units sold, ARPU, and churn rate are calculated
and presented excluding this service. 8 Net addition of cumulative smartphone subscribers. Includes device upgrades.
SoftBank Group Corp. Consolidated Financial Report For the nine-month period ended December 31, 2017
12

ARPU (Main Subscribers)
Three months ended
December 31, 2017 YoY Change
Total ARPU ¥4,380 ¥(160)
Telecom ARPU ¥3,820 ¥(160)
Service ARPU ¥560 ¥0
Total ARPU declined year on year, due to the dilutive impact of an increased proportion of Y!mobile smartphones, which
have a lower service charge. Further penetration of the Home Bundle Discount Hikari Set within the cumulative sub-
scriber base also lowered total ARPU by increasing the discount amount in telecom ARPU.
Churn Rate (Main Subscribers)
Three months ended
December 31, 2017 YoY Change
Phone churn rate 0.83% 0.06 pp improvement
Churn rate 1.10% 0.14 pp improvement
The phone churn rate improved year on year, reflecting improved churn rates for both feature phones and smartphones.
The improvement in the feature phone churn rate mainly reflected a successful promotion encouraging feature phone
users to switch to smartphones. The improvement in smartphones reflected the expansion of Home Bundle Discount
Hikari Set and a smaller-than-usual adverse impact from an increased churn rate in the autumn sales competition season.
Along with the improvement in the phone churn rate, cancellations for mobile data communications devices also
declined, leading to a year-on-year improvement in the churn rate of main subscribers as well.
Broadband Service
Subscribers
December 31, 2017
Change from
March 31, 2017
Cumulative subscribers 6,832 687
SoftBank Hikari 4,666 1,074
The number of broadband service subscribers increased during the period, led by SoftBank Hikari. The number of Soft-
Bank Hikari subscribers successfully increased due to focused efforts to expand sales of the Home Bundle Discount
Hikari Set, and to encourage users to switch over from other telecom carriers’ fiber-optic services.
SoftBank Group Corp. Consolidated Financial Report For the nine-month period ended December 31, 2017
13

(b) Sprint Segment
(Millions of yen)
Nine months ended December 31
2016 2017 Change Change %
Net sales 2,652,009 2,722,153 70,144 2.6%
Segment income 145,186 291,841 146,655 101.0%
Depreciation and amortization 645,486 708,307 62,821 9.7%
Other adjustments9 (2,949) (61,323) (58,374) -
Adjusted EBITDA 787,723 938,825 151,102 19.2%
U.S. dollar-based results (IFRSs) (Millions of U.S. dollars)
Net sales 24,808 24,323 (485) (2.0%)
Cost of sales, and selling, general and ad-
ministrative expenses (23,139) (22,070) 1,069 4.6%
Other operating income (loss) (304) 355 659 -
Gain on spectrum license exchange 354 479 125 35.3%
Litigation - 366 366 -
Gain (loss) on contract termination (113) 5 118 -
Loss on disposal of property, plant and equipment (370) (522) (152) -
Others (175) 27 202 -
Segment income 1,365 2,608 1,243 91.1%
Depreciation and amortization 6,038 6,329 291 4.8%
Other adjustments9 (38) (547) (509) -
Adjusted EBITDA 7,365 8,390 1,025 13.9%
Reference: Disclosed by Sprint (U.S. GAAP) (Millions of U.S. dollars) Capital expenditure (cash base) 2,951 4,286 1,335 45.2%
Telecommunications network equipment 1,421 2,499 1,078 75.9%
Leased devices 1,530 1,787 257 16.8%
Adjusted free cash flow 527 1,056 529 100.4%
OVERVIEW
Sprint has been continuing its effort to establish a trajectory for long-term growth by increasing net sales together with
implementing large-scale cost reductions. The Company continues to regard Sprint as a strategically important business.
After considering various strategic options, the Company ceased merger discussions between Sprint and U.S. mobile
operator T-Mobile US, Inc. in November 2017. Sprint will continue making a fullest use of its ample spectrum holdings
9 Primary components include gain/loss from non-recurring factors, such as gain from spectrum license exchanges and income and loss on contract
termination among items included in other operating income and loss, and negative impacts from hurricanes included in net sales and cost of sales
and selling, general and administrative expenses.
1. Segment income doubled yoy, with one-time gains and progress in cost reductions
2. Postpaid phone net additions for the 10th consecutive quarter
3. Aiming to increase cash capex for further network improvement
SoftBank Group Corp. Consolidated Financial Report For the nine-month period ended December 31, 2017
14

to further improve network quality and increase customer values, aiming to expand sales by increasing the number of
postpaid phone subscribers, which are its largest source of revenue and profit. In the fiscal year ending March 2019,
Sprint expects to continue to increase network cash capital expenditure for promoting effective use of its spectrum. At
the same time, Sprint will continue to reduce costs by increasing the efficiency of operational management. Sprint is
also endeavoring to generate medium- to long-term synergies with the Company’s other subsidiaries and investees.
FINANCIAL RESULTS
Results in U.S. dollars
Net sales decreased by $485 million (2.0%) year on year to $24,323 million. An increase in device revenue, which
was driven by increases of sales of used devices to third parties and mobile handset lease revenues, was outweighed by
a decline in telecom service revenue resulting from a change in the device insurance service and the introduction of
sales promotions to acquire new customers.
Segment income increased by $1,243 million (91.1%) year on year to $2,608 million. Operating expenses (cost of
sales and selling, general and administrative expenses) decreased by $1,069 million (4.6%) year on year due to a decline
in expenses, mainly in relation to the network and the change in the device insurance service, more than offsetting the
decrease in net sales. In addition, other operating income and loss improved by $659 million year on year.
The improvement in other operating income and loss was due to receiving settlements for certain patent infringement
lawsuits, an increase in gain from spectrum license exchanges, and a decrease in loss on contract termination, among
other factors, despite an increase in loss on disposal of property, plant and equipment due to changes of network plans.
Adjusted EBITDA increased by $1,025 million (13.9%) year on year to $8,390 million.
Adjusted free cash flow increased by $529 million (100.4%) year on year to $1,056 million (disclosed by Sprint,
U.S. GAAP). The increase reflected an increase in net cash provided by operating activities, despite an increase in
expenditure for acquisition of telecommunications network equipment and leased devices. Going forward, in order to
differentiate itself from other operators, Sprint plans to invest more aggressively in its network and making full use of
its ample spectrum.
Results in yen
In yen terms, net sales increased by ¥70,144 million (2.6%) year on year to ¥2,722,153 million, segment income in-
creased by ¥146,655 million (101.0%) year on year to ¥291,841 million. Adjusted EBITDA also increased by ¥151,102
million (19.2%) year on year to ¥938,825 million. These increases reflected the weaker yen against the U.S. dollar
compared to the same period of the previous fiscal year.
SoftBank Group Corp. Consolidated Financial Report For the nine-month period ended December 31, 2017
15

OPERATIONS
Cumulative Subscribers10 11
(Thousands)
December 31, 2017
Change from March 31, 2017
Postpaid 31,942 366
(incl.) Phone 26,616 537
Prepaid 8,997 309
Wholesale and affiliate 13,642 267
Total 54,581 942
Net Additions (Excluding special factors11)
(Thousands)
Postpaid phone subscriber net additions were subdued at 184,000 mostly due to an increase in deactivations. Prepaid
subscribers marked net additions for the fourth consecutive quarter.
10 Sprint is no longer reporting Lifeline program subscribers due to recent regulatory changes resulting in tighter program restrictions. Sprint has ex-
cluded them from its disclosure of the number of prepaid and wholesale and affiliate subscribers from the first quarter. Past figures have been retro-
spectively revised. The Lifeline program is a program where carriers in the U.S. receive a subsidy from a government fund to provide discounted
services to low-income subscribers. 11 Cumulative subscribers are impacted by the following special factors; however, these are not included in net additions (losses).
Factor 1: In May 2016, Sprint’s affiliate company acquired another operator. An affiliate company refers to a local wireless operator that sells and
provides Sprint-branded services and products with its own self-operated telecom network while paying Sprint for brand and spectrum usage. This
resulted in adjustments to subscriber numbers that continued to occur during the period.
Factor 2: During the first quarter, 2,000 Wi-Fi connections were excluded from the postpaid subscriber base.
Factor 3: During the three-month period ended September 30, 2017, one of the prepaid data plans was discontinued. Accordingly, 49,000 prepaid
subscribers for the plan were excluded from the prepaid subscriber base
Factor 4: During the third quarter, Sprint established a joint venture with PRWireless HoldCo, LLC. As a result, 169,000 prepaid subscribers were
added.
Three months ended December 31, 2017 YoY Change
Postpaid 256 (149)
(incl.) Phone 184 (184)
Prepaid 63 523
Wholesale and affiliate 66 (553)
Total 385 (179)
SoftBank Group Corp. Consolidated Financial Report For the nine-month period ended December 31, 2017
16

Churn Rate12 (Postpaid)
Three months ended December 31, 2017 YoY Change
Postpaid phone churn rate 1.71% 0.14 pp deterioration
Postpaid churn rate 1.80% 0.13 pp deterioration
The postpaid phone churn rate deteriorated due to network quality in certain areas which has not sufficiently improved
and the company’s decision to shift its focus to selectively manage both higher ARPU customers and increasing cus-
tomers rolling off device commitments, in order to maximize the net present value of the base. Introduction of unlimited
data plans by other carriers in February 2017, which has followed Sprint, also gave an impact.
ABPU (Postpaid Phone)
Three months ended December 31, 2017 YoY Change
ARPU $51.26 $(5.86)
Average equipment billings per user $17.28 $2.63
Postpaid phone ABPU $68.54 $(3.23)
Postpaid phone ABPU decreased primarily due to the impacts of the change in the device insurance program in January
2017, promotions for new customers with multiple line subscriptions, and hurricane-related credits. Normalizing for the
device insurance program change and hurricane-related credits, ABPU would have decreased less than 1% year on year.
(c) Yahoo Japan Segment
(Millions of yen)
Nine months ended December 31
2016 2017 Change Change %
Net sales 630,800 651,544 20,744 3.3%
Segment income 150,544 142,656 (7,888) (5.2%)
Depreciation and amortization 28,631 31,959 3,328 11.6%
Gain from remeasurement
relating to business combination (19) - 19 -
Other adjustments - (7,896) (7,896) -
Adjusted EBITDA 179,156 166,719 (12,437) (6.9%)
12 In the first quarter, Sprint changed the definition of certain gross additions and deactivation for postpaid subscribers. A newly acquired customer who
leaves shortly after activation was previously counted as a deactivation but is now counted as a deduction to gross additions. This change has no
impact on net additions but resulted in lower gross additions and lower deactivations by an equal amount in the quarter.
More information about Sprint’s U.S. GAAP-based financial results and business operations is available on the investor
relations section of its website at investors.sprint.com/.
More information about Yahoo Japan Corporation’s financial results and business operations is available on the investor
relations section of its website at about.yahoo.co.jp/ir/en/.
SoftBank Group Corp. Consolidated Financial Report For the nine-month period ended December 31, 2017
17

(d) Distribution Segment
(Millions of yen)
Nine months ended December 31
2016 2017 Change Change %
Net sales 939,586 1,024,811 85,225 9.1%
Segment income (loss) 19,108 (40,673) (59,781) -
Depreciation and amortization 5,337 5,175 (162) (3.0%)
Other adjustments - 50,497 50,497 -
Adjusted EBITDA 24,445 14,999 (9,446) (38.6%)
Impairment losses totaling ¥50,497 million was recorded on Brightstar’s goodwill, intangible assets, and property, plant
and equipment as their recoverable amounts fell below their carrying amounts as a result of a revision to Brightstar’s
business plan during the period. This dragged down segment income by ¥59,781 million year on year, resulting in a loss
of ¥40,673 million for the period. Meanwhile, results of operations of SoftBank Commerce & Service Corp. have been
solid, mainly due to a contribution from sales of PCs and servers to corporate customers.
(e) Arm Segment
1. U.S. dollar-based revenue increased 2% yoy in the third quarter
- Solid adoption of Arm technology continued in target markets of mobile, networking, servers and IoT
2. Continued reinforcement of R&D capability
- Headcount increased 856 (17.6%) from the previous fiscal year-end
(Millions of yen)
Nine months ended December 31
2016 2017 Change Change %
Net sales 68,855 152,422 83,567 121.4%
Segment income (loss) 9,922 (21,865) (31,787) -
Depreciation and amortization 18,199 46,158 27,959 153.6%
Gain from remeasurement
relating to business combination (18,168) - 18,168 -
Other adjustments 25,780 - (25,780) -
Adjusted EBITDA 35,733 24,293 (11,440) (32.0%)
Note: The Arm segment reflects Arm’s results of operations since September 6, 2016. Retrospective adjustments were made to the
figures for the same period of the previous fiscal year due to the completion of the purchase price allocation related to the acquisition of
Arm.
OVERVIEW
Arm’s operations are primarily the licensing of semiconductor intellectual property (IP), including the designs of energy-
efficient microprocessors and associated technologies. Since the acquisition, Arm has been accelerating investment in
research and development by hiring more engineers. With the expansion of its engineering capability, Arm intends to
develop new technologies faster, with a focus on artificial intelligence, computer vision, and augmented reality. Arm is
also investing in creating new revenue streams from adjacent markets, especially in the Internet of Things (IoT).
Net sales are comprised of (i) licenses to Arm technology, (ii) royalties arising from the resulting sale of licensees’
products based on Arm technology, and (iii) revenues from the sale of software tools.
SoftBank Group Corp. Consolidated Financial Report For the nine-month period ended December 31, 2017
18

FINANCIAL RESULTS
Net sales increased by ¥83,567 million (121.4%) year on year to ¥152,422 million. The main factor behind the increase
was that Arm’s results were reflected only since September 6 to December 31, 2016 in the same period of the previous
fiscal year, while its results were reflected for the full nine months in the period.
Segment loss was ¥21,865 million, a deterioration of ¥31,787 million from the same period of the previous fiscal year.
During the period, Arm increased the number of its employees, mainly engineers, by a net 856 people, up 17.6% overall
from the end of the previous fiscal year, as it continues to strengthen its R&D capability. Arm has also been enhancing
its employee compensation system, including the start of a new performance-linked incentive program. Operating ex-
penses in the period also included ¥40,672 million in amortization expenses recorded for intangible assets recognized
in the purchase price allocation for the Arm acquisition.
Adjusted EBITDA was ¥24,293 million, a decrease of ¥11,440 million (32.0%) year on year.
Reference: Net sales in U.S. dollars
Net sales in this section are presented in U.S.-dollar terms as Arm’s revenue is primarily U.S. dollar-based.
(Millions of U.S. dollars)
Fiscal year ended
March 2017 Fiscal year ending
March 2018
Q2 Q3 Full year Q2 Q3
Pro forma
Post-acquisition Sep 6 -30, 2016
Pro forma
Technology licensing 89 38 229 601 123 190
Technology royalties 240 82 248 974 271 297
Software and services 24 20 31 114 28 33
Total net sales 353 140 508 1,689 422 520
Net sales for the third quarter were $520 million. Technology licensing revenue in the third quarter was up 54% from
the prior quarter to $190 million. Technology licensing revenue was down 17% year on year. This was primarily caused
by a strong quarter in the same period of the previous fiscal year due to a recovery in technology licensing following
uncertainty in the previous period related to the acquisition of Arm by the Company.
Technology licensing revenue tends to fluctuate quarter-to-quarter; however, Arm expects that it will be higher for
this fiscal year than the previous fiscal year (April 1, 2016 to March 31, 2017 on a pro forma basis including the periods
prior to the acquisition of Arm by the Company), and that it will continue to grow over the long term.
Impact of Security Issues on Financial Results
Arm has been working with Intel Corporation, Advanced Micro Devices, Inc. and operating system vendors to de-
velop mitigations for new methods (“Spectre” and “Meltdown”) identified by third-party security researchers that can
exploit certain high-end chips, some of which are based on a limited set of Arm Cortex-A processors. As a result,
software mitigation measures have already been shared with Arm’s partners.
The majority of Arm processors, including Cortex-M processors, which are pervasive in IoT devices, are not impacted
by these methods. The Company does not expect any meaningful impact on revenue or segment income for the fiscal
year ending March 2018.
SoftBank Group Corp. Consolidated Financial Report For the nine-month period ended December 31, 2017
19

OPERATIONS
Licensing
Licenses signed
October 1 to December 31, 2017
Cumulative number of
licenses signed
December 31, 2017
Classic (Arm7, Arm9, Arm11) 0 500
Cortex-A 19 322
Cortex-R 5 92
Cortex-M 17 472
Mali 7 166
Number of processor licenses signed 48 1,552
Note: Cumulative number of licenses signed includes extant licenses that are expected to generate royalties.
During the third quarter, Arm signed 48 processor licenses, reflecting the ongoing demand for Arm’s latest technology.
Of the customers signing licenses, 10 were new customers purchasing their very first Arm processor license. The cus-
tomers who signed licenses with Arm in the third quarter intend to use Arm technology in a very broad range of end
markets, including 5G cellular modems, automotive camera modules, digital TVs, IoT applications, and smartcards.
Royalty Units
The following analyses are based on the actual shipments of royalty units (chips incorporating Arm technology) by Arm
licensees for the three-month period ended September 30, 2017 as reported by licensees in royalty reports. Arm’s licen-
sees report their actual shipments of royalty units one quarter in arrears; therefore, the current quarter’s royalty unit
analyses are based on chips shipped in the prior quarter. In contrast, royalty revenues are accrued in the same quarter
the chips are shipped, based on estimates. This section is prepared solely for reference purposes to facilitate understand-
ing of Arm’s operations and includes information prior to acquisition by the Company on September 5, 2016.
2016 2017
Jul 1 to Sep 30
Oct 1 to Dec 31
Jan 1 to Mar 31
Apr 1 to Jun 30
Jul 1 to Sep 30
Royalty units as reported by
Arm’s licensees
4.9 billion 5.1 billion 4.7 billion 5.1 billion 5.7 billion
Growth rate (yoy) 20% 24% 28% 25% 17%
Breakdown by processor family
Classic (Arm7, Arm9, Arm11) 23% 19% 17% 18% 17%
Cortex-A 16% 22% 22% 20% 17%
Cortex-R 9% 7% 8% 9% 7%
Cortex-M 52% 52% 53% 53% 59%
The semiconductor industry experiences some seasonality due to OEMs buying an increased number of chips particu-
larly from July to December for consumer products sold over the Christmas and Chinese New Year shopping seasons.
Arm is gaining share and thus grows faster than the overall industry; however, being particularly exposed to consumer
SoftBank Group Corp. Consolidated Financial Report For the nine-month period ended December 31, 2017
20

electronics markets, Arm can also be impacted by the industry’s seasonality. As a result, unit shipments usually grow
throughout the year, although unit shipments in the three months ending March 31 can be lower than the prior quarter.
Arm’s licensees reported shipments of 5.7 billion Arm-based chips for the three-month period ended September 30,
2017. This reflects normal seasonality in terms of growth versus the previous quarter, up 12%, and strong growth of
approximately 17% over the same period of the previous fiscal year reflecting strong demand for Arm-based chips.
More information about Arm, its business and its technology can be found on the investor relations section of Arm’s website
at www.arm.com/company/investors.
SoftBank Group Corp. Consolidated Financial Report For the nine-month period ended December 31, 2017
21

(f) SoftBank Vision Fund and Delta Fund Segment
1. Segment income of ¥236.4 billion, with a contribution from a rise in NVIDIA’s share price
2. $27.5 billion invested to date in tech companies, including NVIDIA, Arm, and WeWork
3. Total committed capital of $97.7 billion
OVERVIEW
The Company established the SoftBank Vision Fund and Delta Fund segment as a new reportable segment during the
first quarter upon the first major closing of SoftBank Vision Fund on May 20, 2017. SoftBank Vision Fund aims to
invest in companies across a wide range of technology sectors.
Outline of Funds in the Segment
As of December 31, 2017
SoftBank Vision Fund Delta Fund
Major limited partnership SoftBank Vision Fund L.P. SB Delta Fund (Jersey) L.P.
Total committed capital $91.7 billion *1 $6.0 billion *1
SoftBank Group Corp.: $28.1 billion *2 SoftBank Group Corp.: $4.4 billion
Third-party investors: $63.6 billion *1 Third-party investors: $1.6 billion *1
Limited partners SoftBank Group Corp.
Public Investment Fund
Mubadala Investment Company
Apple
Foxconn Technology Group
Qualcomm Incorporated
Sharp Corporation
SoftBank Group Corp.
Mubadala Investment Company
General partners SVF GP (Jersey) Limited
(The Company’s wholly-owned over-
seas subsidiary)
SB Delta Fund GP (Jersey) Limited
(The Company’s wholly-owned overseas
subsidiary)
Advisory company The Company’s wholly-owned subsidiaries (in Japan and the U.S.)
Management company The Company’s wholly-owned subsidiary (in the U.K.)
Investment period Five years from the final closing13 (in principle)
Minimum fund life 12 years from the final closing13 (in principle)
Notes:
1. A portion of the capital committed by Mubadala Investment Company in SoftBank Vision Fund and Delta Fund has been com-
mitted in consideration of the total capital committed for both funds; hence, the total committed capital and remaining committed
capital for each fund will change according to the status of contribution by Mubadala Investment Company in each fund.
2. The amount includes approximately $8.2 billion of an in-kind contribution of Arm shares.
13 The Company expects the final closing of SoftBank Vision Fund to complete in the three month period ending June 30, 2018. The final closing of
Delta Fund completed on September 27, 2017.
SoftBank Group Corp. Consolidated Financial Report For the nine-month period ended December 31, 2017
22

FINANCIAL RESULTS
(Millions of Yen)
Nine months ended December 31
2016 2017
Gain and loss on investments at SoftBank Vision Fund and Delta Fund
Unrealized gain and loss on valuation of investments - 251,108
Interest and dividend income from investments - 3,744
Operating expenses - (18,425)
Segment income - 236,427
Unrealized loss (gain) on valuation of investments - (251,108)
Adjusted EBITDA - (14,681)
Note: The segment’s results are calculated as follows:
Segment income = gain and loss on investments at SoftBank Vision Fund and Delta Fund - operating expenses
Adjusted EBITDA = segment income (loss) + depreciation and amortization ± unrealized gain and loss on valuation of investments
± other adjustments
Segment income for the period was ¥236,427 million due to the recording of an unrealized gain on valuation of invest-
ments of ¥251,108 million, mainly reflecting an increase in fair value of NVIDIA shares as a result of a rise in its market
price.
Adjusted EBITDA was negative ¥14,681 million. Adjusted EBITDA is calculated by deducting unrealized gain and
loss on valuation of investments from segment income.
Capital Deployment
As of December 31, 2017 (Billions of U.S. dollars)
Total The Company Third-party investors
Committed capital
SoftBank Vision Fund 91.7 *1 28.1 *2 63.6 *1
Delta Fund 6.0 *1 4.4 1.6 *1
Contributions from limited partners
SoftBank Vision Fund 20.8 6.3 14.5
Delta Fund 5.0 3.7 *3 1.3
Remaining committed capital
SoftBank Vision Fund 70.9 21.8 49.1
Delta Fund 1.0 0.7 0.3
Notes:
1. A portion of the capital committed by Mubadala Investment Company in SoftBank Vision Fund and Delta Fund has been com-
mitted in consideration of the total capital committed for both funds; hence, the total committed capital and remaining committed
capital for each fund will change according to the status of contribution by Mubadala Investment Company in each fund.
2. The amount includes approximately $8.2 billion of an in-kind contribution of Arm shares.
3. The Company acquired investment securities in Xiaoju Kuaizhi Inc. (DiDi) and then transferred them to Delta Fund. The value
of this transfer was offset against the amount of the Company's capital obligation to Delta Fund.
SoftBank Group Corp. Consolidated Financial Report For the nine-month period ended December 31, 2017
23

Investment Status
The following are the investments acquired by SoftBank Vision Fund and Delta Fund or agreed to be transferred from
the Company as of December 31, 2017. These exclude those investments subject to certain regulatory approvals.
(Billions of U.S. dollars)
Acquisi-
tion cost
Fair value
Investees
Name (in alphabetical order) Businesses
Investments acquired 27.4 29.7
SoftBank Vision Fund Arm Holdings plc Semiconductor technology de-
signer
Brain Corporation AI-based autonomous driving
system developer
Fanatics Holdings, Inc.
Online retailer of licensed
sports merchandise
Flipkart Limited (Flipkart) e-commerce
Guardant Health, Inc. Cancer diagnosis through ge-
nomic analysis
Improbable Worlds Limited VR/AR development tools
MapBox Inc. Geographical information
platform
Nauto, Inc. AI-based safe-driving support
services
NVIDIA Corporation GPU developer
One97 Communications Limited
(PayTM)
Online payment services
Oravel Stays Private Limited
(OYO Rooms)
Hotel booking site
OSIsoft LLC Industrial IoT solutions
PingAn Health Cloud Co. Limited Online healthcare portal
Plenty United Inc. Indoor farm plant
Roivant Sciences Ltd. Biopharmaceutical drug de-
veloper
Slack Technologies, Inc. Business chat tool
Vir Biotechnology, Inc. Pharmaceutical drug develop-
ment for infectious diseases
using AI
WeWork Companies Inc.
(WeWork)
Co-working space services
Zhongan Online P&C Insurance Online insurance
Delta Fund Xiaoju Kuaizhi Inc. (DiDi) Ridesharing services
Investments agreed to be
transferred from the Company 0.1 0.1
Total 27.5 29.8
Note: SoftBank Vision Fund made some investments through investment holding entities that are subsidiaries, but not wholly-
owned subsidiaries, of SoftBank Vision Fund. Regardless of the ownership percentage of SoftBank Vision Fund, all investments
made through the investment holding entities are presented as investments made by SoftBank Vision Fund. Of the fair values in the
above table, the values attributable to shareholders other than SoftBank Vision Fund is $1.2 billion.
SoftBank Group Corp. Consolidated Financial Report For the nine-month period ended December 31, 2017
24

(2) Overview of Financial Position
1. Progress on investments
- ¥2,658.0 billion in investments from SoftBank Vision Fund and Delta Fund accounted for using FVTPL
2. Financed ¥2,734.0 billion mainly for refinancing of the acquisition funds for Sprint and Arm
- Extended the borrowing periods
3. Sprint reversed deferred tax liabilities of ¥829.8 billion following the U.S. tax reform
(Millions of yen)
March 31, 2017 December 31, 2017 Change Change %
Total assets 24,634,212 29,412,718 4,778,506 19.4%
Total liabilities 20,164,482 22,843,841 2,679,359 13.3%
Total equity 4,469,730 6,568,877 2,099,147 47.0%
Reference: Exchange rate at the end of the period used for translation
USD / JPY ¥112.19 ¥113.00 ¥0.81 0.7%
GBP / JPY ¥140.08 ¥151.95 ¥11.87 8.5%
(a) Current Assets
(Millions of yen)
March 31, 2017 December 31, 2017 Change
Cash and cash equivalents 2,183,102 3,340,352 1,157,250
Trade and other receivables 2,121,619 2,331,915 210,296
Other financial assets 794,689 208,117 (586,572)
Inventories 341,344 362,412 21,068
Other current assets 283,221 306,253 23,032
Total current assets 5,723,975 6,549,049 825,074
Primary components of the change
Components Primary changes from the previous fiscal year-end
Cash and cash equivalents See “(3) Overview of Cash Flows” for details.
Other financial assets Sprint sold part of commercial paper held for short-term investment and cancelled
time deposits.
SoftBank Group Corp. Consolidated Financial Report For the nine-month period ended December 31, 2017
25

(b) Non-current Assets
(Millions of yen)
March 31, 2017 December 31, 2017 Change
Property, plant and equipment 3,977,254 3,960,657 (16,597)
Goodwill 4,175,464 4,383,103 207,639
(incl.) Arm 2,691,818 2,921,831 230,013
Intangible assets 6,946,639 7,168,311 221,672
Investments accounted for using the
equity method 1,670,799 2,303,274 632,475
Investments from SoftBank Vision
Fund and Delta Fund accounted for
using FVTPL - 2,658,043 2,658,043
Investment securities 1,106,409 1,116,746 10,337
Other financial assets 445,858 515,613 69,755
Deferred tax assets 404,994 526,978 121,984
Other non-current assets 182,820 230,944 48,124
Total non-current assets 18,910,237 22,863,669 3,953,432
Primary components of the change
Components Primary changes from the previous fiscal year-end
Property, plant and equipment Telecommunications network equipment at Sprint and SoftBank Corp. decreased
due to depreciation exceeding the amount of newly acquired assets. On the other
hand, leased mobile devices increased at Sprint due to new acquisitions.
Goodwill Goodwill for Arm increased due to the weaker yen against the pound. On the other
hand, goodwill for Brightstar was impaired.
Intangible assets The Company newly recognized management contracts with the consolidation of
Fortress. FCC licenses and others increased due to the weaker yen against the U.S.
dollar.
Investments accounted for
using the equity method
In addition to recording gain on equity-method investments, the consolidated car-
rying amount for Alibaba increased due to the weaker yen against the Chinese
yuan.
Investments from SoftBank
Vision Fund and Delta Fund
accounted for using FVTPL
Delta Fund made investments in DiDi and SoftBank Vision Fund made invest-
ments in WeWork and Flipkart, among others. NVIDIA shares were reclassified
from “Investment securities” upon transfer from the Company.
Investment securities NVIDIA shares were reclassified as “Investments from SoftBank Vision Fund
and Delta Fund accounted for using FVTPL” upon transfer to SoftBank Vision
Fund. On the other hand, the Company newly acquired ¥346,403 million in in-
vestment securities. This was executed with a plan to transfer around half of them
to SoftBank Vision Fund.
Deferred tax assets Deferred tax assets increased due to recording of a derivative loss in relation to a
collar transaction included in a variable prepaid forward contract for Alibaba
shares.
SoftBank Group Corp. Consolidated Financial Report For the nine-month period ended December 31, 2017
26

(c) Current Liabilities
(Millions of yen)
March 31, 2017 December 31, 2017 Change
Interest-bearing debt 2,694,093 2,991,052 296,959
SoftBank Group Corp. 1,139,734 1,281,438 141,704
Short-term borrowings 505,802 556,900 51,098
Current portion of long-term borrowings 433,983 214,962 (219,021)
Current portion of corporate bonds 119,947 409,576 289,629
Others 80,002 100,000 19,998
Sprint 536,897 427,595 (109,302)
Current portion of long-term borrowings 307,178 208,306 (98,872)
Current portion of corporate bonds 219,365 209,666 (9,699)
Others 10,354 9,623 (731)
SoftBank Vision Fund and Delta Fund - 308,450 308,450
Short-term borrowings - 210,225 210,225
Current portion of long-term borrowings - 98,225 98,225
Others 1,017,462 973,569 (43,893)
Short-term borrowings 161,862 98,767 (63,095)
Current portion of long-term borrowings 387,349 405,171 17,822
Lease obligations 431,522 453,320 21,798
Others 36,729 16,311 (20,418)
Trade and other payables 1,607,453 1,744,082 136,629
Other financial liabilities 13,701 22,752 9,051
Income taxes payables 256,218 105,208 (151,010)
Provisions 56,362 50,614 (5,748)
Other current liabilities 599,096 674,935 75,839
Total current liabilities 5,226,923 5,588,643 361,720
Primary components of the change
Components Primary changes from the previous fiscal year-end
Interest-bearing debt SoftBank Group Corp.:
Current portion of long-term borrowings decreased due to borrowing mainly for refinancing
of the acquisition funds for Sprint and Arm. Meanwhile, current portion of corporate bonds
increased due to transfers from non-current liabilities.
Sprint:
Current portion of long-term borrowings decreased, mainly due to repayment of borrowings
utilizing certain network equipment.
SoftBank Vision Fund and Delta Fund:
Borrowings were made mainly to increase capital efficiency in investments.
Income taxes
payables
During the period, the Company paid income taxes recognized and accrued at the previous
fiscal year-end, such as income taxes on gains from the sale of Supercell Oy shares.
SoftBank Group Corp. Consolidated Financial Report For the nine-month period ended December 31, 2017
27

(d) Non-current Liabilities
(Millions of yen)
March 31, 2017 December 31, 2017 Change
Interest-bearing debt 12,164,277 12,813,901 649,624
SoftBank Group Corp. 6,378,194 7,050,030 671,836
Long-term borrowings 2,133,705 2,478,143 344,438
Corporate bonds 4,244,488 4,571,887 327,399
Others 1 - (1)
Sprint 4,024,390 3,708,896 (315,494)
Long-term borrowings 1,044,116 1,072,189 28,073
Corporate bonds 2,954,300 2,613,149 (341,151)
Others 25,974 23,558 (2,416)
SoftBank Vision Fund and Delta Fund - 64,234 64,234
Long-term borrowings - 64,234 64,234
Others 1,761,693 1,990,741 229,048
Long-term borrowings 199,804 378,802 178,998
Financial liabilities relating to sale of shares
by variable prepaid forward contract 715,448 729,234 13,786
Lease obligations 787,124 766,368 (20,756)
Others 59,317 116,337 57,020
Third-party interests in SoftBank Vision Fund and
Delta Fund - 1,870,841 1,870,841
Derivative financial liabilities 254,146 721,775 467,629
Other financial liabilities 33,083 40,043 6,960
Defined benefit liabilities 108,172 107,247 (925)
Provisions 138,730 134,703 (4,027)
Deferred tax liabilities 1,941,380 1,265,430 (675,950)
Other non-current liabilities 297,771 301,258 3,487
Total non-current liabilities 14,937,559 17,255,198 2,317,639
Primary components of the change
Components Primary changes from the previous fiscal year-end
Interest-bearing debt SoftBank Group Corp.:
Long-term borrowings increased due to borrowing mainly for refinancing of the acqui-
sition funds for Sprint and Arm. Corporate bonds also increased due to the issuance of
foreign currency-denominated straight corporate bonds of ¥676,558 million.
Sprint:
Corporate bonds decreased due to early redemptions of certain corporate bonds.
SoftBank Vision Fund and Delta Fund:
Borrowings were made to increase the capital efficiency of investments.
Third-party interests in
SoftBank Vision Fund and
Delta Fund
An amount of equity attributable to the third-party investors in SoftBank Vision Fund
and Delta Fund was recorded.
SoftBank Group Corp. Consolidated Financial Report For the nine-month period ended December 31, 2017
28

Derivative financial liabili-
ties
Derivative liabilities increased by ¥518,173 million due to recording derivative loss in
relation to a collar transaction included in a variable prepaid forward contract for
Alibaba shares.
Deferred tax liabilities Sprint reversed deferred tax liabilities of ¥829,762 million following the enactment of
the U.S. Tax Cuts and Jobs Act in December 2017.
Reduction in U.S. federal corporate tax rate
From January 1, 2018, the U.S. federal corporate tax rate was reduced from 35% to 21%.
This resulted in a partial reversal of deferred tax liabilities of ¥593,137 million related
to FCC licenses and other assets of Sprint that were recognized based on the previous
income tax rate at the time of its acquisition in 2013.
Abolition of time limit on use of future loss carryforwards
Net operating losses generated in tax years beginning after December 31, 2017 may be
carried forward indefinitely. For Sprint, its tax year starts from April, therefore net op-
erating losses generated after April 1, 2018 may be carried forward indefinitely. In
Sprint, for certain deductible temporary differences where deferred tax assets could not
be previously realized, it was likely to be recoverable because the taxable temporary
differences from assets with indefinite lives, such as FCC licenses, may be a source of
future taxable income. As a result of this change, ¥236,625 million of deferred tax assets
was recognized (offset by deferred tax liabilities).
Note: For details about the transaction for sale of Alibaba shares by variable prepaid forward contract, see “(2) Transaction for sale
of Alibaba shares by variable prepaid forward contract” under “8. Interest-bearing debt” in “(6) Notes to Condensed Interim Consol-
idated Financial Statements” in “3. Condensed Interim Consolidated Financial Statements and Primary Notes.”
SoftBank Group Corp. Consolidated Financial Report For the nine-month period ended December 31, 2017
29

(e) Equity
(Millions of yen)
March 31, 2017 December 31, 2017 Change
Total equity attributable to owners of the parent 3,586,352 5,505,689 1,919,337
Non-controlling interests 883,378 1,063,188 179,810
Total equity 4,469,730 6,568,877 2,099,147
Ratio of equity attributable to owners of the parent 14.6% 18.7% 4.1 pp
Equity attributable to owners of the parent
(Millions of yen)
March 31, 2017 December 31, 2017 Change
Common stock 238,772 238,772 -
Capital surplus 245,706 265,171 19,465
Other equity instruments - 496,876 496,876
Retained earnings 2,958,355 3,931,828 973,473
Treasury stock (67,727) (66,453) 1,274
Accumulated other comprehensive income 211,246 639,495 428,249
Available-for-sale financial assets 11,983 74,938 62,955
Cash flow hedges (44,877) (56,477) (11,600)
Exchange differences on translating foreign
operations 244,140 621,034 376,894
Total equity attributable to owners of the parent 3,586,352 5,505,689 1,919,337
Primary components of the change
Components Primary changes from the previous fiscal year-end
Other equity instruments Newly recorded for USD-denominated Undated Subordinated Notes (the “Hy-
brid Notes”) issued in July 2017 by SoftBank Group Corp. The Hybrid Notes
are classified as equity instruments in accordance with IFRSs.
Retained earnings Retained earnings increased as the Company recorded net income attributable
to owners of the parent of ¥1,014,944 million.
Accumulated other comprehen-
sive income
The weaker yen against the pound caused an increase in exchange differences
on translating foreign operations related to Arm.
SoftBank Group Corp. Consolidated Financial Report For the nine-month period ended December 31, 2017
30

(3) Overview of Cash Flows
1. Progress on investments
- Payments for acquisition of investments by SoftBank Vision Fund and Delta Fund of ¥2,021.3 billion
2. Long-term borrowings resulted in proceeds of ¥3,687.6 billion and repayments of ¥3,378.2 billion
- Borrowing mainly for refinancing of the acquisition funds for Sprint and Arm
3. SoftBank Group Corp. issued foreign currency denominated straight corporate bonds of ¥665.8 billion
and hybrid bonds of ¥496.9 billion.
(Millions of yen)
Nine months ended December 31
2016 2017 Change
Cash flows from operating activities 1,127,433 883,775 (243,658)
Cash flows from investing activities (3,380,593) (2,728,404) 652,189
Cash flows from financing activities 2,210,330 2,975,356 765,026
(a) Cash Flows from Operating Activities
Net cash provided by operating activities decreased by ¥243,658 million year on year. This mainly reflects the Com-
pany’s receipt of a refund of ¥293,489 million for withholding income tax related to dividends within the group com-
panies in the same period of the previous fiscal year. An additional factor was a year-on-year increase of ¥117,556
million in income taxes paid due to the payment in the period of income taxes related to the sale of Supercell Oy shares
in the previous fiscal year.
(b) Cash Flows from Investing Activities
Primary components for the period
Components Primary details
Outlays for purchase of property, plant and
equipment and intangible assets
¥(791,629) million
Sprint acquired telecommunications network equipment and leased
devices, and SoftBank Corp. acquired telecommunications network
equipment.
Payments for acquisition of investments
¥(346,403) million
The Company acquired investment securities, around half of which
was conducted with a plan of transferring to SoftBank Vision Fund.
Payments for acquisition of investment by
SoftBank Vision Fund and Delta Fund
¥(2,021,298) million
This represents the payments for investments acquired by SoftBank
Vision Fund and Delta Fund or agreed to be transferred from the Com-
pany. These mainly included investments in DiDi by Delta Fund, and
WeWork and Flipkart by SoftBank Vision Fund.
Decrease from acquisition of control over
subsidiaries
¥(261,859) million
This is primarily associated with acquisition of Fortress.
Payments for acquisition of marketable
securities for short-term trading
¥(127,788) million Proceeds from sales/redemption of market-
able securities for short-term trading
¥384,231 million Payments into time deposits
¥(103,771) million Proceeds from withdrawal of time deposits
¥467,499 million
These proceeds and payments are mainly associated with Sprint’s
short-term trading.
SoftBank Group Corp. Consolidated Financial Report For the nine-month period ended December 31, 2017
31

(c) Cash Flows from Financing Activities
Primary components of the period
Component Primary details
Increases in short-term interest-bearing debt, net
¥312,582 million
Proceeds from long-term interest-bearing debt
¥4,785,202 million
Proceeds from long-term borrowings
¥3,687,621 million
SoftBank Group Corp. conducted borrowings mainly for refi-
nancing of the acquisition funds for Sprint and Arm. In addi-
tion, SoftBank Corp. and Sprint conducted borrowings through
securitization of receivables.
Proceeds from issuance of bonds
¥735,804 million
SoftBank Group Corp. issued foreign currency-denominated
straight corporate bonds and Yahoo Japan Corporation issued
straight corporate bonds.
Proceeds from sale and leaseback of newly
acquired equipment
¥361,777 million
SoftBank Corp. conducted a sale and leaseback for a purchase
of telecommunications network equipment by finance lease.
Repayment of long-term interest-bearing debt
¥(4,238,546) million
Repayment of long-term borrowings
¥(3,378,241) million
SoftBank Group Corp. conducted borrowings mainly for refi-
nancing the acquisition funds for Sprint and Arm. In addition,
SoftBank Corp. and Sprint repaid borrowings made through se-
curitization of receivables.
Redemption of corporate bonds
¥(459,903) million
Sprint redeemed corporate bonds (including early redemptions),
and SoftBank Group Corp. redeemed corporate bonds upon ma-
turity.
Repayment of lease obligations
¥(367,238) million
SoftBank Corp. repaid lease obligations for telecommunica-
tions network equipment.
Proceeds from contributions from third-party
investors in SoftBank Vision Fund and Delta
Fund
¥1,765,404 million
Cash contributions were received from third-party investors
based on capital calls.
Proceeds from other equity instruments
¥496,876 million
SoftBank Group Corp. issued the Hybrid Notes. The Hybrid
Notes are classified as equity instruments in accordance with
IFRSs.
(4) Forecasts
The Company does not give forecasts of consolidated results of operations as they are difficult to project due to numerous
uncertainties affecting earnings.
For the forecasts of the Domestic Telecommunications segment, see “Forecast for the Fiscal Year Ending March 2018”
under “(a) Domestic Telecommunications Segment” in “b. Results by Segment” in “(1) Overview of Results of Operations.”
SoftBank Group Corp. Consolidated Financial Report For the nine-month period ended December 31, 2017
32

2. Notes to Summary Information
(1) Significant Changes in Scope of Consolidation for the Nine-month Period Ended December 31, 2017 (Specified subsidiary (one company) excluded from the scope of consolidation) SoftBank Group International GK and SoftBank Group Japan GK conducted an absorption-type merger, with SoftBank
Group International GK as the surviving company, effective on April 24, 2017. As a result of the merger, SoftBank Group Japan GK was dissolved and excluded from the scope of consolidation.
(2) Changes in Accounting Policies
(Changes in accounting policies required by IFRSs) The following standard is adopted from the nine-month period ended December 31, 2017.
Standard Interpretation Outline of the new/revised standard
IAS 7 (amendment)
Statement of Cash Flows Requirement for additional disclosure related to changes in
liabilities arising from financing activities. There is no significant impact on the condensed interim consolidated financial statements due to the adoption of the above standard.
(3) Changes in Accounting Estimates
(Assessment of useful lives of property, plant and equipment and intangible assets)
As a result of reviewing the efficient operation of communication equipment in SoftBank Corp., it became highly probable that certain communications equipment will be disposed and removed, and therefore, the useful lives were revised. With this change “Cost of sales” in the condensed interim consolidated statement of income for the nine-month period ended December 31, 2017 increased by ¥14,010 million.
(Assessment of recoverability of deferred tax assets)
Net operating losses generated in tax years after December 31, 2017 may be carried forward indefinitely due to the enactment of the Tax Reform Act in December 2017 in the U.S. As a result of the reassessment of the recoverability of deferred tax assets in Sprint, certain deductible temporary differences from assets with indefinite lives, such as FCC licenses, where deferred tax assets were not recognized previously, are likely to be recoverable and deferred tax assets were recognized (offset by deferred tax liabilities). The details are described in “Note 7. Income taxes” under “3. Condensed Interim Consolidated Financial Statements and Primary Notes (6) Notes to Condensed Interim Consolidated Financial Statements.”
(Impairment loss on goodwill and non-current assets)
As a result of revising the business plan of Brightstar in the Distribution segment, the recoverable amount of goodwill and non-current assets was less than its carrying amount and, therefore, the impairment loss was recognized for the three-month period ended December 31 2017. The details are described in “Note 13. Other operating loss Note 5” under “3. Condensed Interim Consolidated Financial Statements and Primary Notes (6) Notes to Condensed Interim Consolidated Financial Statements.”
(Write-down of inventories)
As a result of revising the business plan of Sports Live Entertainment Corporation which operates a sports content distribution business, the net realizable value of inventories was less than its carrying amount and, therefore, the write-down was recognized for the three-month period ended December 31 2017. The details are described in “Note 13. Other operating loss Note 7” under “3. Condensed Interim Consolidated Financial Statements and Primary Notes (6) Notes to Condensed Interim Consolidated Financial Statements.”
SoftBank Group Corp. Consolidated Financial Report For the nine-month period ended December 31, 2017
33
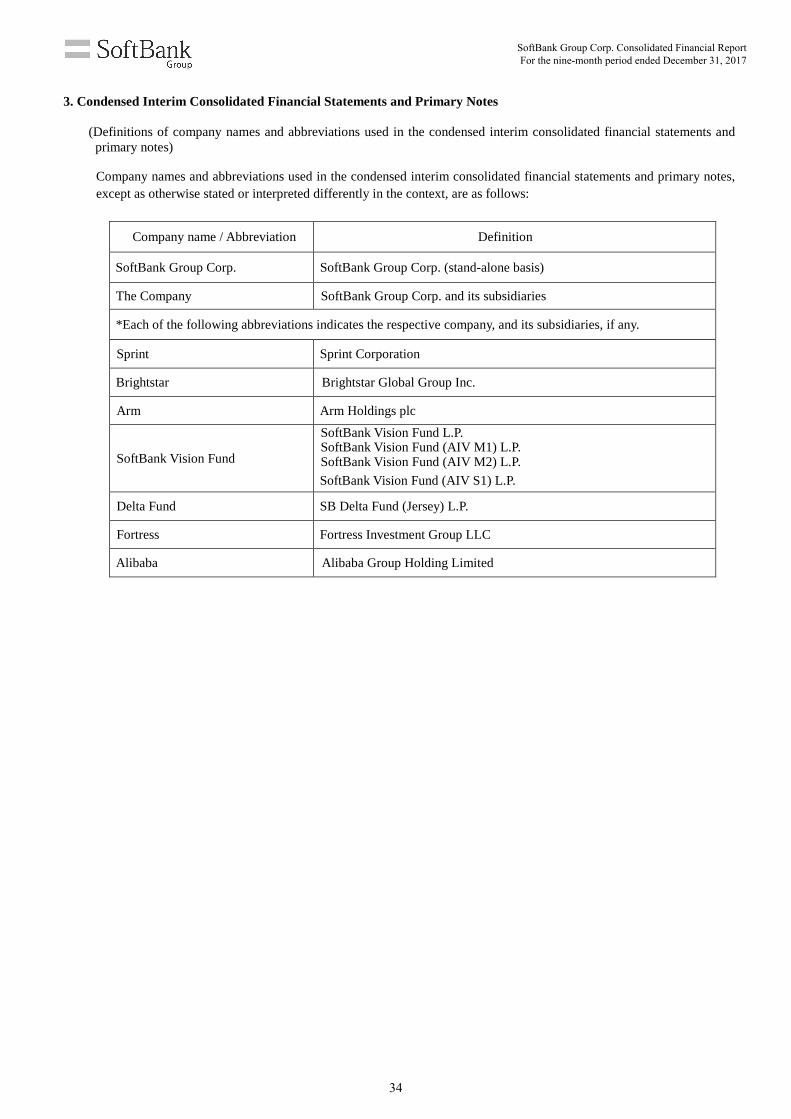
3. Condensed Interim Consolidated Financial Statements and Primary Notes
(Definitions of company names and abbreviations used in the condensed interim consolidated financial statements and
primary notes)
Company names and abbreviations used in the condensed interim consolidated financial statements and primary notes, except as otherwise stated or interpreted differently in the context, are as follows:
Company name / Abbreviation Definition
SoftBank Group Corp. SoftBank Group Corp. (stand-alone basis)
The Company SoftBank Group Corp. and its subsidiaries
*Each of the following abbreviations indicates the respective company, and its subsidiaries, if any.
Sprint Sprint Corporation
Brightstar Brightstar Global Group Inc.
Arm Arm Holdings plc
SoftBank Vision Fund
SoftBank Vision Fund L.P. SoftBank Vision Fund (AIV M1) L.P. SoftBank Vision Fund (AIV M2) L.P. SoftBank Vision Fund (AIV S1) L.P.
Delta Fund SB Delta Fund (Jersey) L.P.
Fortress Fortress Investment Group LLC
Alibaba Alibaba Group Holding Limited
SoftBank Group Corp. Consolidated Financial Report For the nine-month period ended December 31, 2017
34

“SVF” which was presented in the previous quarter has been changed to “SoftBank Vision Fund and Delta Fund” from three-month period ended December 31, 2017. Accordingly, the name of each account, segment and other item on these condensed interim consolidated financial statements is as the follows;
Condensed Interim Consolidated Statement of Financial Position
Previous Current
Investments from SVF accounted for using FVTPL Investments from SoftBank Vision Fund and Delta Fund accounted for using FVTPL
Third-party interests in SVF Third-party interests in SoftBank Vision Fund and Delta Fund
Condensed Interim Consolidated Statement of Income
Previous Current
Operating income (excluding income from SVF) Operating income (excluding income from SoftBank Vision Fund and Delta Fund)
Operating income from SVF Operating income from SoftBank Vision Fund and Delta Fund
Change in third-party interests in SVF Change in third-party interests in SoftBank Vision Fund and Delta Fund
Condensed Interim Consolidated Statement of Cash Flows
Previous Current
Gain on investments at SVF Gain on investments at SoftBank Vision Fund and Delta Fund
Change in third-party interests in SVF Change in third-party interests in SoftBank Vision Fund and Delta Fund
Payments for acquisition of investments by SVF Payments for acquisition of investments by SoftBank Vision Fund and Delta Fund
Contributions into SVF from third-party investors Contributions into SoftBank Vision Fund and Delta Fund from third-party investors
Segment information
Previous Current
The SVF segment The SoftBank Vision Fund and Delta Fund segment
Unrealized gain and loss on valuation of investments in SVF
Unrealized gain and loss on valuation of investments in SoftBank Vision Fund and Delta Fund
SoftBank Group Corp. Consolidated Financial Report For the nine-month period ended December 31, 2017
35

(1) Condensed Interim Consolidated Statement of Financial Position
(Millions of yen)
As of
March 31, 2017 As of
December 31, 2017 Assets
Current assets
Cash and cash equivalents
2,183,102 3,340,352 Trade and other receivables
2,121,619 2,331,915
Other financial assets
794,689 208,117 Inventories
341,344 362,412
Other current assets
283,221 306,253 Total current assets 5,723,975 6,549,049
Non-current assets
Property, plant and equipment
3,977,254 3,960,657
Goodwill
4,175,464 4,383,103 Intangible assets
6,946,639 7,168,311
Investments accounted for using the equity method
1,670,799 2,303,274 Investments from SoftBank Vision Fund and Delta Fund
accounted for using FVTPL
- 2,658,043 Investment securities 1,106,409 1,116,746 Other financial assets
445,858 515,613
Deferred tax assets
404,994 526,978 Other non-current assets
182,820 230,944
Total non-current assets
18,910,237 22,863,669 Total assets
24,634,212 29,412,718
SoftBank Group Corp. Consolidated Financial Report For the nine-month period ended December 31, 2017
36

(Millions of yen)
As of
March 31, 2017 As of
December 31, 2017 Liabilities and equity
Current liabilities
Interest-bearing debt 2,694,093 2,991,052
Trade and other payables 1,607,453 1,744,082 Other financial liabilities 13,701 22,752 Income taxes payables 256,218 105,208 Provisions 56,362 50,614 Other current liabilities 599,096 674,935
Total current liabilities 5,226,923 5,588,643
Non-current liabilities Interest-bearing debt 12,164,277 12,813,901
Third-party interests in SoftBank Vision Fund and Delta Fund - 1,870,841
Derivative financial liabilities 254,146 721,775 Other financial liabilities 33,083 40,043 Defined benefit liabilities 108,172 107,247 Provisions 138,730 134,703 Deferred tax liabilities 1,941,380 1,265,430 Other non-current liabilities 297,771 301,258
Total non-current liabilities 14,937,559 17,255,198 Total liabilities 20,164,482 22,843,841
Equity
Equity attributable to owners of the parent
Common stock
238,772 238,772 Capital surplus
245,706 265,171
Other equity instruments - 496,876 Retained earnings
2,958,355 3,931,828
Treasury stock (67,727) (66,453) Accumulated other comprehensive income
211,246 639,495
Total equity attributable to owners of the parent
3,586,352 5,505,689 Non-controlling interests
883,378 1,063,188
Total equity
4,469,730 6,568,877 Total liabilities and equity 24,634,212 29,412,718
SoftBank Group Corp. Consolidated Financial Report For the nine-month period ended December 31, 2017
37

(2) Condensed Interim Consolidated Statement of Income and Condensed Interim Consolidated Statement of
Comprehensive Income
For the nine-month period ended December 31 Condensed Interim Consolidated Statement of Income
(Millions of yen)
Nine-month period ended
December 31, 2016* Nine-month period ended
December 31, 2017 Continuing operations Net sales
6,581,466 6,811,274
Cost of sales
(3,990,070) (4,044,184) Gross profit
2,591,396 2,767,090
Selling, general and administrative expenses
(1,612,620) (1,827,083) Gain from remeasurement relating to business
combination 18,187 -
Other operating loss
(67,635) (27,605) Operating income (excluding income from SoftBank
Vision Fund and Delta Fund)
929,328 912,402 Operating income from SoftBank Vision Fund and Delta
Fund
- 236,427 Operating income
929,328 1,148,829
Finance cost
(343,363) (383,337) Income on equity method investments
205,988 319,591
Gain on sales of shares of associates 238,101 1,804 Foreign exchange gain 34,222 20,100 Derivative loss (95,875) (485,198) Change in third-party interests in SoftBank Vision Fund
and Delta Fund
- (108,163) Other non-operating income (loss) (13,476) 50,178
Income before income tax
954,925 563,804 Income taxes
(615,954) 638,941
Net income from continuing operations 338,971 1,202,745 Discontinued operations Net income from discontinued operations 553,305 - Net income
892,276 1,202,745
Net income attributable to
Owners of the parent
845,773 1,014,944
Non-controlling interests
46,503 187,801
892,276 1,202,745
Earnings per share
Basic earnings per share (yen)
Continuing operations 268.17 918.29 Discontinued operations 490.73 - Total basic earnings per share 758.90 918.29 Diluted earnings per share (yen)
Continuing operations 261.16 894.15 Discontinued operations 490.42 - Total diluted earnings per share 751.58 894.15
Note: * Retrospective adjustments are made due to the completion of allocation of the consideration related to the consolidation of Arm
in September 2016 during the three-month period ended June 30, 2017.
SoftBank Group Corp. Consolidated Financial Report For the nine-month period ended December 31, 2017
38

Condensed Interim Consolidated Statement of Comprehensive Income
(Millions of yen)
Nine-month period ended
December 31, 2016* Nine-month period ended
December 31, 2017
Net income
892,276
1,202,745 Other comprehensive income, net of tax
Items that will not be reclassified to profit or loss Remeasurements of defined benefit plan - 8,552
Total items that will not be reclassified to profit or loss
- 8,552 Items that may be reclassified subsequently to
profit or loss
Available-for-sale financial assets 29,043 48,156 Cash flow hedges (4,369) (10,804) Exchange differences on translating foreign
operations 49,953 382,058
Share of other comprehensive income of associates
(27,626) 10,571
Total items that may be reclassified subsequently to profit or loss
47,001 429,981
Total other comprehensive income, net of tax 47,001 438,533
Total comprehensive income 939,277 1,641,278
Total comprehensive income attributable to
Owners of the parent
883,480 1,450,381 Non-controlling interests
55,797 190,897
939,277 1,641,278
Note: * Retrospective adjustments are made due to the completion of allocation of the consideration related to the consolidation of Arm
in September 2016 during the three-month period ended June 30, 2017.
SoftBank Group Corp. Consolidated Financial Report For the nine-month period ended December 31, 2017
39

For the three-month period ended December 31 Condensed Interim Consolidated Statement of Income
(Millions of yen)
Three-month period ended
December 31, 2016* Three-month period ended
December 31, 2017 Continuing operations Net sales
2,309,632 2,400,139
Cost of sales
(1,421,900) (1,490,002) Gross profit
887,732 910,137
Selling, general and administrative expenses
(588,534) (639,305) Other operating loss
(17,233) (47,031)
Operating income (excluding income from SoftBank Vision Fund and Delta Fund )
281,965 223,801
Operating income from SoftBank Vision Fund and Delta Fund
- 50,189
Operating income
281,965 273,990 Finance cost
(121,341) (139,879)
Income on equity method investments
100,814 211,301 Foreign exchange gain (loss) (48,849) 9,158 Derivative gain 74,183 19,483 Change in third-party interests in SoftBank Vision Fund
and Delta Fund
- (31,006) Other non-operating income 9,109 1,736
Income before income tax
295,881 344,783 Income taxes
(198,540) 714,220
Net income from continuing operations 97,341 1,059,003 Discontinued operations Net income from discontinued operations (5,280) - Net income
92,061 1,059,003
Net income attributable to
Owners of the parent
80,257 912,322
Non-controlling interests
11,804 146,681
92,061 1,059,003
Earnings per share
Basic earnings per share (yen)
Continuing operations 78.55 829.96 Discontinued operations (4.85) - Total basic earnings per share 73.70 829.96 Diluted earnings per share (yen)
Continuing operations 75.00 809.15 Discontinued operations (4.85) - Total diluted earnings per share 70.15 809.15
Note: * Retrospective adjustments are made due to the completion of allocation of the consideration related to the consolidation of Arm
in September 2016 during the three-month period ended June 30, 2017.
SoftBank Group Corp. Consolidated Financial Report For the nine-month period ended December 31, 2017
40

Condensed Interim Consolidated Statement of Comprehensive Income
(Millions of yen)
Three-month period ended
December 31, 2016* Three-month period ended
December 31, 2017
Net income
92,061
1,059,003 Other comprehensive income, net of tax
Items that will not be reclassified to profit or loss
Remeasurements of defined benefit plan - 8,552
Total items that will not be reclassified to profit or loss
- 8,552
Items that may be reclassified subsequently to profit or loss
Available-for-sale financial assets 22,504 11,101 Cash flow hedges 318 1,119 Exchange differences on translating foreign
operations 762,632 45,882
Share of other comprehensive income of associates
(8,201) 1,030
Total items that may be reclassified subsequently to profit or loss
777,253 59,132
Total other comprehensive income, net of tax 777,253 67,684
Total comprehensive income 869,314 1,126,687
Total comprehensive income attributable to
Owners of the parent
816,138 977,370 Non-controlling interests
53,176 149,317
869,314 1,126,687
Note: * Retrospective adjustments are made due to the completion of allocation of the consideration related to the consolidation of Arm
in September 2016 during the three-month period ended June 30, 2017.
SoftBank Group Corp. Consolidated Financial Report For the nine-month period ended December 31, 2017
41

(3) Condensed Interim Consolidated Statement of Changes in Equity
For the nine-month period ended December 31, 2016*
(Millions of yen)
Equity attributable to owners of the parent Non-
controlling interests
Total equity
Common
stock Capital surplus
Retained earnings
Treasury stock
Accumulated other
comprehensive income Total
As of April 1, 2016 238,772 261,234 2,166,623 (314,752) 261,736 2,613,613 891,658 3,505,271
Comprehensive income
Net income - - 845,773 - - 845,773 46,503 892,276
Other comprehensive income
- - - - 37,707 37,707 9,294 47,001
Total comprehensive income
- - 845,773 - 37,707 883,480 55,797 939,277
Transactions with owners and other transactions
Cash dividends - - (48,042) - - (48,042) (43,416) (91,458) Purchase and disposal of
treasury stock
- - (844) (349,302) - (350,146) - (350,146)
Retirement of treasury stock
- - (595,195) 595,195 - - - -
Changes from business combination
- - - - - - 2,218 2,218
Changes from loss of control
- - - - - - (25,565) (25,565)
Changes in interests in subsidiaries
- (170) - - - (170) 3,019 2,849
Changes in associates’ interests in their subsidiaries
- (475) - - - (475) - (475)
Changes in interests in associates’ capital surplus
- (15,595) - - - (15,595) - (15,595)
Share-based payment transactions
- 1,728 - - - 1,728 2,284 4,012
Other - - - - - - (906) (906)
Total transactions with owners and other transactions
- (14,512) (644,081) 245,893 - (412,700) (62,366) (475,066)
As of December 31, 2016 238,772 246,722 2,368,315 (68,859) 299,443 3,084,393 885,089 3,969,482
Note: * Retrospective adjustments are made due to the completion of allocation of the consideration related to the consolidation of Arm
in September 2016 during the three-month period ended June 30, 2017.
SoftBank Group Corp. Consolidated Financial Report For the nine-month period ended December 31, 2017
42

For the nine-month period ended December 31, 2017
(Millions of yen)
Equity attributable to owners of the parent
Common stock
Capital surplus
Other equity instruments
Retained earnings
Treasury stock
Accumulated other
comprehensive income Total
As of April 1, 2017 238,772 245,706 - 2,958,355 (67,727) 211,246 3,586,352
Comprehensive income
Net income - - - 1,014,944 - - 1,014,944
Other comprehensive income
- - - - - 435,437 435,437
Total comprehensive income - - - 1,014,944 - 435,437 1,450,381
Transactions with owners and other transactions
Issuance of other equity
instruments - - 496,876 - - - 496,876
Cash dividends - - - (47,933) - - (47,933)
Transfer of accumulated other comprehensive income to retained earnings
- - - 7,188 - (7,188) -
Purchase and disposal of treasury stock
- - - (726) 1,274 - 548 Changes from business
combination - - - - - - - Changes in interests
in subsidiaries
- (20,423) - - - - (20,423)
Changes in associates’ interests in their subsidiaries
- (3,174) - - - - (3,174)
Changes in interests in associates’ capital surplus
- 38,397 - - - - 38,397
Share-based payment transactions - 4,665 - - - - 4,665
Other - - - - - - -
Total transactions with owners and other transactions
- 19,465 496,876 (41,471) 1,274 (7,188) 468,956
As of December 31, 2017 238,772 265,171 496,876 3,931,828 (66,453) 639,495 5,505,689
Non-
controlling interests
Total equity
As of April 1, 2017 883,378 4,469,730
Comprehensive income
Net income 187,801 1,202,745
Other comprehensive income
3,096 438,533
Total comprehensive income 190,897 1,641,278
Transactions with owners and other transactions
Issuance of other equity instruments
- 496,876
Cash dividends (30,781) (78,714)
Transfer of accumulated other comprehensive income to retained earnings
- -
Purchase and disposal of treasury stock
- 548 Changes from business
combination 14,972 14,972 Changes in interests
in subsidiaries
(2,091) (22,514)
Changes in associates’ interests in their subsidiaries
- (3,174)
Changes in interests in associates’ capital surplus
- 38,397
Share-based payment transactions 7,522 12,187
Other (709) (709)
Total transactions with owners and other transactions
(11,087) 457,869 As of December 31, 2017
1,063,188 6,568,877
SoftBank Group Corp. Consolidated Financial Report For the nine-month period ended December 31, 2017
43

(4) Condensed Interim Consolidated Statement of Cash Flows
(Millions of yen)
Nine-month period ended December 31, 2016*
Nine-month period ended December 31, 2017
Cash flows from operating activities Net income 892,276 1,202,745
Depreciation and amortization 1,056,559 1,152,375 Gain from remeasurement relating to business combination (18,187) - Gain on investments at SoftBank Vision Fund and Delta
Fund - (254,852)
Finance cost 343,363 383,337 Income on equity method investments (205,988) (319,591) Gain on sales of shares of associates (238,101) (1,804) Derivative loss 95,875 485,198 Change in third-party interests in SoftBank Vision Fund
and Delta Fund - 108,163
Foreign exchange (gain) and other non-operating (income) and loss (22,837) (70,278)
Gain on sales of discontinued operations (636,216) - Income taxes 733,526 (638,941) Increase in trade and other receivables (223,664) (161,386) Increase in inventories (292,832) (391,455) Increase in trade and other payables 40,194 165,207 Other 3,044 (18,602)
Subtotal 1,527,012 1,640,116 Interest and dividends received 16,738 21,674 Interest paid (378,065) (397,073) Income taxes paid (354,655) (472,211) Income taxes refunded 316,403 91,269
Net cash provided by operating activities 1,127,433 883,775 Cash flows from investing activities
Purchase of property, plant and equipment, and intangible assets (671,797) (791,629)
Payments for acquisition of investments (440,211) (346,403) Payments for acquisition of investments by SoftBank
Vision Fund and Delta Fund - (2,021,298)
Proceeds from sales/redemption of investments 464,037 24,657 Decrease from acquisition of control over subsidiaries (3,253,000) (261,859) Increase from loss of control over subsidiaries 725,302 - Payments for acquisition of marketable securities for
short-term trading (250,902) (127,788) Proceeds from sales/redemption of marketable securities
for short-term trading 119,063 384,231
Payments into time deposits (290,570) (103,771) Proceeds from withdrawal of time deposits 172,797 467,499 Other 44,688 47,957
Net cash used in investing activities (3,380,593) (2,728,404)
SoftBank Group Corp. Consolidated Financial Report For the nine-month period ended December 31, 2017
44

(Millions of yen)
Nine-month period ended December 31, 2016*
Nine-month period ended December 31, 2017
Cash flows from financing activities Increase in short-term interest-bearing debt, net 355,024 312,582 Proceeds from long-term interest-bearing debt 3,585,651 4,785,202 Repayment of long-term interest-bearing debt (1,245,267) (4,238,546) Contributions into SoftBank Vision Fund and Delta Fund
from third-party investors - 1,765,404 Distribution/redemption from SoftBank Vision Fund and
Delta Fund to third-party investors - (20,918) Proceeds from issuance of other equity instruments - 496,876 Purchase of treasury stock (350,843) (36) Cash dividends paid (46,098) (47,785) Cash dividends paid to non-controlling interests (41,934) (29,577) Other (46,203) (47,846)
Net cash provided by financing activities 2,210,330 2,975,356 Effect of exchange rate changes on cash and cash equivalents (28,032) 26,523
(Decrease) increase in cash and cash equivalents (70,862) 1,157,250
Cash and cash equivalents at the beginning of the period 2,569,607 2,183,102 Cash and cash equivalents at the end of the period 2,498,745 3,340,352
Note: * Retrospective adjustments are made due to the completion of allocation of the consideration related to the consolidation of Arm
in September 2016 during the three-month period ended June 30, 2017.
SoftBank Group Corp. Consolidated Financial Report For the nine-month period ended December 31, 2017
45

(5) Significant Doubt about Going Concern Assumption
There are no applicable items. (6) Notes to Condensed Interim Consolidated Financial Statements 1. Significant accounting policies
The SoftBank Vision Fund completed the initial closing in May 2017. Accordingly, the Company adopted accounting policies for SoftBank Vision Fund and Delta Fund as follows.
(1) Scope of consolidation for SoftBank Vision Fund and Delta Fund business
SoftBank Vision Fund and Delta Fund is managed by SB Investment Advisers (UK) Limited (“SBIA”) which is regulated by the UK Financial Conduct Authority. Investment decisions for the various entities comprising SoftBank Vision Fund and Delta Fund are made by the Investment Committee established as a committee of SBIA. SBIA is a wholly-owned subsidiary of the Company, and as such the Company has control over limited partnerships and investment holding entities comprising SoftBank Vision Fund and Delta Fund as stipulated in IFRS 10 “Consolidated Financial Statements.” Accordingly, all entities that comprise SoftBank Vision Fund and Delta Fund are consolidated by the Company. Intercompany transactions such as management fees and performance fees to SBIA paid or to be paid from SoftBank Vision Fund and Delta Fund, are eliminated in consolidation.
(2) Portfolio company investments made by SoftBank Vision Fund and Delta Fund
a. Investments in subsidiaries The portfolio companies that the Company is deemed to control under IFRS 10 “Consolidated Financial Statements,” are treated as subsidiaries of the Company. Accordingly, their results of operations, assets and liabilities are included in the Company’s consolidated financial statements.
b. Investments other than subsidiaries
Investments other than subsidiaries made by SoftBank Vision Fund and Delta Fund including investments in associates of the Company are measured at fair value at the end of each quarter with the change during the reporting period recognized in profit or loss. Such investments that SoftBank Vision Fund and Delta Fund made are presented as “Investments from SoftBank Vision Fund and Delta Fund accounted for using FVTPL” in the condensed interim consolidated statement of financial position. The payments for these investments are presented as “Payments for acquisition of investments by SoftBank Vision Fund and Delta Fund” under cash flows from investing activities in the condensed interim consolidated statement of cash flows.
c. Investments made by the Company to transfer to SoftBank Vision Fund and Delta Fund Investments made by SoftBank Group Corp. or its subsidiaries with the purpose of transferring to SoftBank Vision Fund and Delta Fund are presented as “Investment securities” in the condensed interim consolidated statement of financial position. Payments for the investments are presented as “Payments for acquisition of investments” under cash flows from investing activities in the condensed interim consolidated statement of cash flows. Once the investments are agreed to be transferred from the Company to SoftBank Vision Fund or Delta Fund, and regulatory approvals to make the investments by SoftBank Vision Fund or Delta Fund are obtained(such investments, “Agreed Transferable Investments”), the Company retroactively changes the presentation of these investments and the payments for the investments to the presentation as described in the above “b. Investments except for subsidiaries” from the date when the Company initially made these investments. In cases where the Company’s subsidiaries are investees and the Company is transferring those investments to SoftBank Vision Fund or Delta Fund, the investments are accounted for in accordance with the above “a. Investments in subsidiaries”, regardless of whether the investments are Agreed Transferable Investments.
SoftBank Group Corp. Consolidated Financial Report For the nine-month period ended December 31, 2017
46

(3) Results from SoftBank Vision Fund and Delta Fund
Income and loss arising from SoftBank Vision Fund and Delta Fund business are separated from operating income and loss arising from other segments, recognized as a component of operating income, and presented as “Operating income from SoftBank Vision Fund and Delta Fund” in the condensed interim consolidated statement of income. Gain and loss on investments at SoftBank Vision Fund and Delta Fund (realized gain and loss on sales of investments, unrealized gain and loss on valuation of investments, interest and dividend income from investments, except for gain and loss on investments in subsidiaries) and operating expenses such as incorporation expenses of entities that comprise SoftBank Vision Fund and Delta Fund, investment research expenses arising from SBIA and other advisory companies, and administrative expenses arising from each entity, are included in “Operating income and loss from SoftBank Vision Fund and Delta Fund.” The details are described in “Note 12. Operating income from SoftBank Vision Fund and Delta Fund.” Gain and loss arising from investments, which are made by SoftBank Vision Fund and Delta Fund although are not Agreed Transferable Investments, are presented as “Other non-operating income (loss) (or Gain (loss) from financial instruments at FVTPL)” in the condensed interim consolidated statement of income. Once the investments become Agreed Transferable Investments, the Company retroactively changes the presentation of gain and loss arising from the investments as “Operating income from SoftBank Vision Fund and Delta Fund” from the date when the Company initially made these investments.
(4) Contribution from Limited Partners to SoftBank Vision Fund and Delta Fund
a. Contribution from the Company to SoftBank Vision Fund and Delta Fund
Contribution from the Company to SoftBank Vision Fund and Delta Fund as a limited partner is eliminated at consolidation.
(Execution of contribution using shares of Arm) The Company will contribute approximately 24.99% of the total number of issued shares of Arm (the “Arm Shares”), all of which are owned by the Company, to SoftBank Vision Fund through an in-kind contribution (the “In-kind Contribution”) in satisfaction of approximately $8.2 billion of the Company’s commitment to SoftBank Vision Fund. The In-kind Contribution will be effectuated through the transfer of Arm Shares to SoftBank Vision Fund subject to the satisfaction of preconditions related to regulatory approvals prescribed in SoftBank Vision Fund’s governing documents. Such conditions include clearance from the Committee on Foreign Investments in the United States in respect of the transfer of the Arm Shares. Pending the delivery of the Arm Shares to SoftBank Vision Fund following the satisfaction of such conditions, a portion of the Arm Shares has been pledged and, pursuant to future capital calls, will be pledged in favor of SoftBank Vision Fund. After the completion of the In-kind Contribution of Arm Shares, Arm will continue to be a consolidated subsidiary of the Company.
b. Contribution from limited partners other than the Company to SoftBank Vision Fund and Delta Fund (“Third-Party Investors”)
The interests attributable to Third-Party Investors are classified as financial liabilities, “Third-party interests in SoftBank Vision Fund and Delta Fund” in the condensed interim consolidated statement of financial position. Changes in the interests of Third-Party Investors are recognized through net profit or loss and presented as “Changes in third-party interests in SoftBank Vision Fund and Delta Fund” in non-operating income and loss in the condensed interim consolidated statement of income.
Contributions from Third-Party Investors to SoftBank Vision Fund and Delta Fund are included in “Contributions into SoftBank Vision Fund and Delta Fund from third-party investors” under cash flows from financing activities in the condensed interim consolidated statement of cash flows. The distribution to Third-Party investors and the redemption of investment from Third-Party investors are included in “Distribution/redemption from SoftBank Vision Fund and Delta Fund to third-party investors” under cash flows from financing activities in the condensed interim consolidated statement of cash flows.
SoftBank Group Corp. Consolidated Financial Report For the nine-month period ended December 31, 2017
47

2. Segment information (1) Description of reportable segments
The Company’s reportable segments are components of business activities for which discrete financial information is available, and such information is regularly reviewed by the Company’s Board of Directors in order to make decisions about the allocation of resources and assess its performance. The Company has six reportable segments: the Domestic telecommunications segment, the Sprint segment, the Yahoo Japan segment, the Distribution segment, the Arm segment, and the SoftBank Vision Fund and Delta Fund segment.
The Domestic Telecommunications segment provides, mainly through SoftBank Corp., mobile communications services, sale of mobile devices, telecommunication services such as fixed-line telephone and data communications services for corporate customers, and broadband services for retail customers in Japan. The Sprint segment provides, through Sprint, mobile communications services, sale and lease of mobile devices, sale of mobile device accessories, and fixed-line telecommunications services in the U.S.
The Yahoo Japan segment provides, mainly through Yahoo Japan Corporation, an Internet-based advertising business, an e-commerce business, and membership services.
The Distribution segment provides, through Brightstar, distribution of mobile devices overseas, and through SoftBank Commerce & Service Corp., sale of mobile device accessories, PC software, and peripherals in Japan.
The Arm segment provides, through Arm, designs of microprocessor intellectual property and related technology, and the sale of software tools. The SoftBank Vision Fund and Delta Fund segment conducts investment activities in a wide range of technology sectors. The SoftBank Vision Fund and Delta Fund segment was newly established from the three-month period ended June 30, 2017, due to the completion of the Initial Closing for SoftBank Vision Fund in May 2017. The segment income of the SoftBank Vision Fund and Delta Fund segment consists of gain and loss arising from investments held by SoftBank Vision Fund and Delta Fund or the Agreed Transferable Investments (gain and loss on investments at SoftBank Vision Fund and Delta Fund), and operating expenses occurred in SoftBank Vision Fund and Delta Fund, SBIA and advisers. Information on business segments which are not included in the reportable segments is classified in “Other.” “Other” includes mainly Fortress and the Fukuoka SoftBank HAWKS-related business. “Reconciliations” include an elimination of intersegment transactions and the corporate general expenses unallocated to each reportable segment. Expenses arising mainly from SoftBank Group Corp. and SB Group US, Inc., which manages and supervises investment activities in the Internet, communication, and media fields overseas, are included in corporate general expenses.
(2) Net sales and income of reportable segments
Income of reportable segments is defined as “Operating income.” Intersegment transaction prices are determined under the same general business conditions as applied for external customers.
The Company also discloses EBITDA (i.e., segment income and loss after addition of depreciation and amortization) and Adjusted EBITDA (i.e., EBITDA after addition or deduction of unrealized gain and loss on valuation of investments in SoftBank Vision Fund and Delta Fund and other adjustments (gains are deducted)) by each reportable segment. “Other adjustments” are special items, such as acquisition-related costs and impairment loss mainly included in other operating income and loss.
Income and loss, which are not attributable to operating income and loss, such as financial cost and income and loss on equity method investments, are not managed by each reportable segment and therefore these income and losses are excluded from the segment performance. Discontinued operations are not included.
SoftBank Group Corp. Consolidated Financial Report For the nine-month period ended December 31, 2017
48

For the nine-month period ended December 31, 2016
(Millions of yen) Reportable segments
Domestic Telecommu-
nications Sprint
Yahoo Japan
Distribution
Arm
SoftBank Vision Fund
and Delta Fund Total Net sales
Customers 2,375,500 2,548,215 622,039 890,168 68,854 - 6,504,776 Intersegment 25,170 103,794 8,761 49,418 1
- 187,144 Total 2,400,670 2,652,009 630,800 939,586 68,855 - 6,691,920
Segment income 651,484 145,186 150,544 19,108 9,922 - 976,244 Reconciliation from segment income to adjusted EBITDA Segment income 651,484 145,186 150,544 19,108 9,922 - 976,244 Depreciation and amortization
343,205 645,486
28,631
5,337
18,199 - 1,040,858
EBITDA 994,689 790,672 179,175 24,445 28,121 - 2,017,102 Gain from remeasurement
relating to business combination
- -
(19)
-
(18,168) - (18,187) Other adjustments - (2,949) - - 25,780 - 22,831
Adjusted EBITDA 994,689 787,723 179,156 24,445 35,733 - 2,021,746
(Millions of yen)
Other
Reconcili-
ations Consoli-
dated Net sales
Customers 76,690 - 6,581,466 Intersegment 16,958 (204,102) -
Total 93,648 (204,102) 6,581,466
Segment income (8,036) (38,880) 929,328 Reconciliation from segment income to adjusted EBITDA Segment income (8,036) (38,880) 929,328 Depreciation and amortization 7,452 1,189 1,049,499
EBITDA (584) (37,691) 1,978,827 Gain from remeasurement relating to business combination - - (18,187)
Other adjustments - 8,283 31,114
Adjusted EBITDA (584) (29,408) 1,991,754
SoftBank Group Corp. Consolidated Financial Report For the nine-month period ended December 31, 2017
49

For the nine-month period ended December 31, 2017
(Millions of yen) Reportable segments
Domestic Telecommu-
nications Sprint
Yahoo Japan
Distribution
Arm
SoftBank Vision Fund
and Delta Fund Total
Net sales Customers 2,378,916 2,573,024 639,127 982,331 152,420 - 6,725,818 Intersegment 27,954 149,129 12,417 42,480 2
- 231,982 Total 2,406,870 2,722,153 651,544 1,024,811 152,422 - 6,957,800
Segment income 612,698 291,841 142,656 (40,673) (21,865) 236,427 1,221,084 Reconciliation from segment income to adjusted EBITDA Segment income 612,698 291,841 142,656 (40,673) (21,865) 236,427 1,221,084 Depreciation and amortization
351,322 708,307
31,959
5,175
46,158 - 1,142,921
EBITDA 964,020 1,000,148 174,615 (35,498) 24,293 236,427 2,364,005 Unrealized gain and loss on valuation of investments in SoftBank Vision Fund and Delta Fund
- -
-
-
- (251,108) (251,108) Other adjustments - (61,323) (7,896) 50,497 - - (18,722)
Adjusted EBITDA 964,020 938,825 166,719 14,999 24,293 (14,681) 2,094,175
(Millions of yen)
Other
Reconcili-
ations Consoli-
dated Net sales
Customers 85,456 - 6,811,274 Intersegment 18,947 (250,929) -
Total 104,403 (250,929) 6,811,274
Segment income (35,047) (37,208) 1,148,829 Reconciliation from segment income to adjusted EBITDA Segment income (35,047) (37,208) 1,148,829 Depreciation and amortization 8,252 1,202 1,152,375
EBITDA (26,795) (36,006) 2,301,204 Unrealized gain and loss on valuation of investments in SoftBank Vision Fund and Delta Fund - - (251,108)
Other adjustments 23,496 1,427 6,201
Adjusted EBITDA (3,299) (34,579) 2,056,297
SoftBank Group Corp. Consolidated Financial Report For the nine-month period ended December 31, 2017
50

For the three-month period ended December 31, 2016
(Millions of yen) Reportable segments
Domestic Telecommu-
nications Sprint
Yahoo Japan
Distribution
Arm
SoftBank Vision Fund
and Delta Fund Total Net sales
Customers 835,111 882,906 218,386 294,938 54,498 - 2,285,839 Intersegment 10,993 46,566 2,917 18,292 1
- 78,769 Total 846,104 929,472 221,303 313,230 54,499 - 2,364,608
Segment income 185,551 40,621 51,173 4,803 15,045 - 297,193 Reconciliation from segment income to adjusted EBITDA Segment income 185,551 40,621 51,173 4,803 15,045 - 297,193 Depreciation and amortization
117,800 225,435
9,477
1,780
13,723 - 368,215
EBITDA 303,351 266,056 60,650 6,583 28,768 - 665,408 Other adjustments - 4,743 - - 314 - 5,057
Adjusted EBITDA 303,351 270,799 60,650 6,583 29,082 - 670,465
(Millions of yen)
Other
Reconcili-
ations Consoli-
dated Net sales
Customers 23,793 - 2,309,632 Intersegment 5,722 (84,491) -
Total 29,515 (84,491) 2,309,632
Segment income (5,247) (9,981) 281,965 Reconciliation from segment income to adjusted EBITDA Segment income (5,247) (9,981) 281,965 Depreciation and amortization 2,674 386 371,275
EBITDA (2,573) (9,595) 653,240 Other adjustments - 176 5,233
Adjusted EBITDA (2,573) (9,419) 658,473
SoftBank Group Corp. Consolidated Financial Report For the nine-month period ended December 31, 2017
51

For the three-month period ended December 31, 2017
(Millions of yen) Reportable segments
Domestic Telecommu-
nications Sprint
Yahoo Japan
Distribution
Arm
SoftBank Vision Fund
and Delta Fund Total
Net sales Customers 865,620 860,741 221,480 365,856 58,745 - 2,372,442 Intersegment 12,290 68,085 4,625 14,103 1
- 99,104 Total 877,910 928,826 226,105 379,959 58,746 - 2,471,546
Segment income 178,730 89,665 49,966 (48,036) (7,071) 50,189 313,443 Reconciliation from segment income to adjusted EBITDA Segment income 178,730 89,665 49,966 (48,036) (7,071) 50,189 313,443 Depreciation and amortization
125,629 244,316
11,146
1,684
15,873 - 398,648
EBITDA 304,359 333,981 61,112 (46,352) 8,802 50,189 712,091 Unrealized gain and loss on valuation of investments in SoftBank Vision Fund and Delta Fund
- -
-
-
- (56,772) (56,772) Other adjustments - (24,187) (2,967) 50,497 - - 23,343
Adjusted EBITDA 304,359 309,794 58,145 4,145 8,802 (6,583) 678,662
(Millions of yen)
Other
Reconcili-
ations Consoli-
dated Net sales
Customers 27,697 - 2,400,139 Intersegment 5,749 (104,853) -
Total 33,446 (104,853) 2,400,139
Segment income (26,834) (12,619) 273,990 Reconciliation from segment income to adjusted EBITDA Segment income (26,834) (12,619) 273,990 Depreciation and amortization 2,843 377 401,868
EBITDA (23,991) (12,242) 675,858 Unrealized gain and loss on valuation of investments in SoftBank Vision Fund and Delta Fund - - (56,772)
Other adjustments 23,496 (110) 46,729
Adjusted EBITDA (495) (12,352) 665,815
SoftBank Group Corp. Consolidated Financial Report For the nine-month period ended December 31, 2017
52

3. Business combinations
For the nine-month period ended December 31, 2016
Arm (1) Overview of consolidation
On July 18, 2016 (GMT), the Company and Arm, located in the United Kingdom, entered into an agreement on the terms of a recommended all cash acquisition of the entire issued and to be issued share capital of Arm by the Company for a total acquisition price of approximately £24.0 billion (approximately ¥3.3 trillion) by means of an English court-sanctioned scheme of arrangement (“Acquisition”). The Acquisition was approved at Arm’s general meeting of shareholders held on August 30, 2016, and at the English court hearing held on September 1, 2016, and came into effect on September 5, 2016.
As a result of the transaction, Arm became a wholly-owned subsidiary of the Company.
(2) Purpose of consolidation
The Company believes Arm is one of the world’s leading technology companies, with strong capabilities in global semiconductor intellectual property and the “Internet of Things,” and a proven track record of innovation.
The board and management of the Company believe that the acquisition of Arm by the Company will deliver the following benefits:
・Support and accelerate Arm’s position as the global leader in intellectual property licensing and R&D
outsourcing for semiconductor companies
The Company’s deep industry expertise and global network of relationships will accelerate adoption of Arm’s intellectual property across existing and new markets.
・Maintain Arm’s dedication to innovation
The Company intends to sustain Arm’s long-term focus on generating more value per device, and driving licensing wins and future royalty streams in new growth categories, specifically “Enterprise and Embedded Intelligence.”
・Increased investment to drive the next wave of innovation
The Company intends to support Arm’s multiple growth initiatives by investing in engineering talent and complementary acquisitions with the aim of ensuring Arm maintains an R&D edge over existing and emerging competitors. The Company believes such an investment strategy in long-term growth will be easier to execute as a non-listed company.
・Shared culture and long-term vision
The Company believes the two companies share the same technology-oriented culture, long-term vision, focus on innovation and commitment to attracting, developing and retaining top talent. These common values will be the foundation for a strong strategic partnership necessary to capture the significant opportunities ahead.
・Maintain and grow the UK’s leadership in science and technology
The Company is investing in the UK as a world leader in science and technology development and innovation and, as evidence of this, intends to invest in multiple Arm growth initiatives, at least doubling the number of Arm employees in the UK over the next five years.
SoftBank Group Corp. Consolidated Financial Report For the nine-month period ended December 31, 2017
53

(3) Summary of Arm
(a) Name Arm Holdings plc
(b) Address 110 Fulbourn Road, Cambridge CB1 9NJ, United Kingdom
(c) Name and title of representative Simon Segars, Chief Executive Officer
(d) Nature of business ・Design of microprocessor intellectual property and related technology ・Sale of software tools
(e) Share capital £0.7 million (as of December 31, 2015)
(f) Date of incorporation October 16, 1990
(g) Consolidated net sales £968 million (for the fiscal year ended December 31, 2015 under IFRSs)
(4) Acquisition date
September 5, 2016
(5) Consideration transferred and the component (Millions of yen)
Acquisition date
(September 5, 2016) Payment for the acquisition by cash 3,319,137 Fair value of equity interest in Arm already held at the
time of the acquisition 47,867
Total consideration transferred A 3,367,004
Acquisition-related costs of ¥25,780 million arising from the business combination are recognized in “Other operating loss.”
As a result of the reevaluation of the 1.4% equity interest already held by the Company at the time of the acquisition of control in Arm at fair value, the Company recognized a gain of ¥18,168 million through the step acquisition. This gain is presented as “Gain from remeasurement relating to business combination” in the condensed interim consolidated statement of income.
SoftBank Group Corp. Consolidated Financial Report For the nine-month period ended December 31, 2017
54

(6) Fair value of assets and liabilities, and goodwill on the acquisition date1 (Millions of yen)
Acquisition date
(September 5, 2016) Cash and cash equivalents 16,984 Trade and other receivables 59,782 Other current assets 119,090 Intangible assets2 698,682 Other non-current assets 23,649 Total assets 918,187 Current liabilities 61,930 Deferred tax liabilities 128,580 Other non-current liabilities 7,292 Total liabilities 197,802 Net assets B 720,385 Goodwill3 A-B 2,646,619
The above amount is translated at the exchange rate (GBP = JPY138.15) as of the acquisition date.
Notes: 1. Adjustment of the provisional amount
Consideration transferred is allocated to acquired assets and assumed liabilities based on the fair value on the acquisition date. Allocation of the consideration was completed during the three-month period ended June 30, 2017. The details of the adjustments from the provisional amounts are as follows. Due to additional analysis on the fair value of technologies, intangible assets increased by ¥5,250 million and deferred tax liabilities increased by ¥958 million. As a result, goodwill decreased by ¥4,292 million.
2. Intangible assets
The components of intangible assets are as follows; the estimated useful lives are from 8 to 20 years for technologies, 13 years for customer relationships, and 8 years for trademarks.
(Millions of yen)
Acquisition date
(September 5, 2016) Technologies 542,930 Customer relationships 148,649 Trademarks 5,940 Other 1,163
Total 698,682
3. Goodwill
Goodwill reflects excess earning power expected from future business development, congregative human resources related to research and development, and the synergy between the Company and the acquiree.
SoftBank Group Corp. Consolidated Financial Report For the nine-month period ended December 31, 2017
55

(7) Payment for acquisition of control over subsidiaries (Millions of yen)
Nine-month period ended
December 31, 2016 Payment for the acquisition by cash (3,319,137)
Foreign currency exchange gain relating to settlement* 52,856 Cash and cash equivalents held by the acquiree at the time of
acquisition of control 16,984
Payment for the acquisition of control over the subsidiary by cash (3,249,297)
Note: *Fluctuation in foreign currency exchange rates arising from the acquisition date to the settlement date
(September 15, 2016).
(8) Sales and net income of the acquiree
The amounts of the acquiree’s sales and net income before elimination of inter-company transactions after the acquisition date, which are recorded in the condensed interim consolidated statement of income for the nine-month period ended December 31, 2016, are ¥68,855 million and ¥18,566 million, respectively. In addition, amortization expenses related to intangible assets recognized on the acquisition date are included in the aforementioned net income.
For the nine-month period ended December 31, 2017
Fortess (1) Overview of consolidation
The Company and Fortress entered into a definitive merger agreement under which the Company acquires Fortress for $3.3 billion in cash in February 2017. Under the term of the merger agreement, on December 27, 2017 the completion followed the satisfaction of all conditions to the closing of the transaction, including approval of the transaction by Fortress shareholders on July 12, 2017 and receipt of all necessary regulatory approvals. Each outstanding Fortress share was converted into the right to receive $8.08 per share in cash, with merger proceeds to be distributed in accordance with payment procedures outlined in Fortress’s Definitive Proxy dated June 7, 2017 and the merger agreement incorporated. Actual payment amounted to $3.2 billion as a result of adjusting the impact of distributions and other after the date of merger agreement.
As a result of the transaction, the Company owned all equity interests of Fortress and Fortress became a wholly-owned subsidiary of the Company.
(2) Purpose of consolidation
The Company looks forward to benefitting from its leadership, road-based expertise and world-class investment platform. For the Company, this opportunity will immediately help expand our group capabilities, and, alongside SoftBank Vision Fund and Delta Fund platform, will accelerate our SoftBank 2.0 transformation strategy of bold, disciplined investment and world class execution to drive sustainable long-term growth.
SoftBank Group Corp. Consolidated Financial Report For the nine-month period ended December 31, 2017
56

(3) Summary of Fortress
(a) Name Fortress Investment Group LLC
(b) Address 1345 Avenue of the Americas, New York, NY
(c) Name and title of representative Peter L. Briger, Jr., Principal and Co-Chief Executive Officer Wesley R. Edens, Co-Founder, Principal and Co-Chief Executive Officer Randal A. Nardone, Co-Founder and Principal
(d) Nature of business Alternative investment management business
(e) Date of incorporation 1998
(f) Consolidated net sales $1,163,806 thousand (for the fiscal year ended December 31, 2016 under US GAAP)
(4) Acquisition date
December 27, 2017
(5) Consideration transferred and the component
(Millions of yen)
Acquisition date
(December 27, 2017) Payment by cash 358,612 Payment not included in consideration transferred * (58,128) Total consideration transferred A 300,484
Acquisition-related costs of ¥6,123 million arising from the business combination are recognized in “Other operating loss.” Note: * Payment not included in consideration transferred is the payment for a transaction, separate from the business
combination, that remunerates employees and former owners of Fortress. For the payment, continuing employment is a condition. Depending on the period set in the condition, the Company recognized the payments of ¥16,954 million as “Other current assets” and ¥41,174 million as “Other non-current assets,” respectively.
(6) Fair value of assets and liabilities, and goodwill on the acquisition date (Millions of yen)
Acquisition date
(December 27, 2017) Cash and cash equivalents 45,572 Trade and other receivables 43,851 Other current assets 11,021 Investments accounted for using the equity method 97,156 Intangible assets1 176,690 Non-current assets 30,621 Total assets 404,911 Current liabilities 60,048 Non-current liabilities 48,090 Total liabilities 108,138 Net assets B 296,773 Non-controlling interests C 14,850 Goodwill2 A-(B-C) 18,561
SoftBank Group Corp. Consolidated Financial Report For the nine-month period ended December 31, 2017
57

Consideration transferred is allocated to acquired assets and assumed liabilities based on the fair value on the acquisition date. Moreover, the above amounts, which are fair values based on the best estimate at present, may change in a year from the acquisition date when additional information related to facts and circumstances that existed as of the acquisition date may be obtained.
The above amount is translated at the exchange rate (USD = JPY113.41) as of the acquisition date.
Notes: 1. Intangible assets
The components of intangible assets are as follows; the estimated useful lives are 3 years for software, from 1.5 to 10 years for management contracts, and 10 years for trademarks. The management contracts reflect excessive earnings in the future expected from the agreements which Fortress entered into regarding the asset management of their funds. (Millions of yen)
Acquisition date
(December 27, 2017) Software 1,762 Management contracts 128,323 Trademarks 5,103 Other 41,502
Total 176,690
2. Goodwill Goodwill reflects excess earning power expected from future business development and the synergy with existing businesses.
(7) Payment for acquisition of control over subsidiaries (Millions of yen)
Nine-month period ended
December 31, 2017 Payment for the acquisition by cash (300,484) Cash and cash equivalents held by the acquiree at the time of
acquisition of control 45,572
Payment for the acquisition of control over the subsidiary by cash (254,912)
(8) Sales and net loss of the acquiree
The amount of the acquiree’s net loss before elimination of inter-company transactions after the acquisition date, which is recorded in the condensed interim consolidated statement of income for the nine-month period ended December 31, 2017, is ¥2,639 million. No sales are recorded. In addition, amortization expenses related to intangible assets and other recognized on the acquisition date are included in the aforementioned net loss.
(9) Collateral
Based on a term loan agreement of $1.4 billion which was entered into to finance this acquisition, the equity interests of Fortress and 4 wholly-owned subsidiaries within this acquisition structure are pledged as collateral.
SoftBank Group Corp. Consolidated Financial Report For the nine-month period ended December 31, 2017
58

4. Other financial assets
The components of the carrying amounts of other financial assets are as follows: (Millions of yen)
As of
March 31, 2017 As of
December 31, 2017 Current
Marketable securities 277,895 29,080 Time deposits (maturities of three-month over) 458,495 103,006 Other 58,299 76,031
Total 794,689 208,117 5. Property, plant and equipment
The components of the carrying amounts of property, plant and equipment are as follows:
(Millions of yen)
As of
March 31, 2017 As of
December 31, 2017 Buildings and structures 263,061 242,828 Telecommunications equipment 2,654,096 2,442,925 Furniture, fixtures, and equipment 627,730 815,590 Land 99,905 89,646 Construction in progress 302,177 301,385 Other 30,285 68,283
Total 3,977,254 3,960,657 6. Intangible assets
The components of the carrying amounts of intangible assets are as follows: (Millions of yen)
As of
March 31, 2017 As of
December 31, 2017 Intangible assets with indefinite useful lives
FCC licenses 4,100,651 4,209,572 Trademarks 703,031 705,442
Other - 41,143 Intangible assets with finite useful lives
Software 722,934 749,579 Technologies 522,894 542,469 Customer relationships 448,806 367,706 Management contracts* - 127,639 Spectrum migration costs 103,814 98,820 Favorable lease contracts 104,754 97,461 Trademarks 57,532 61,528 Other 182,223 166,952
Total 6,946,639 7,168,311
Note: * The management contracts reflect excessive earnings in the future expected from the agreements which Fortress entered
into regarding the asset management of their funds.
SoftBank Group Corp. Consolidated Financial Report For the nine-month period ended December 31, 2017
59

7. Income taxes
Due to the enactment of the Tax Reform Act in December 2017 in the U. S., in Sprint, deferred tax liability of
¥829,762 million was reversed. Also income taxes decreased by ¥818,342 million and other comprehensive income
increased by ¥8,244 million. The details are as follows.
(1) Reduction in the federal corporate tax rate The federal corporate tax rate was reduced from 35% to 21% effective January 1, 2018. Due to the reduction, ¥593,137 million of a part of deferred tax liabilities related to FCC license and others, which was calculated based on the tax rate as of the acquisition of Sprint in 2013, was reversed. Also income taxes are decreased by ¥591,773 million.
(2) Abolition of time limit on use of future loss carryforwards Net operating losses generated in tax years beginning after December 31, 2017 may be carried forward indefinitely. For Sprint, its tax year starts from April, therefore net operating losses generated after April 1, 2018 may be carried forward indefinitely.
In Sprint, for certain deductible temporary differences where deferred tax assets could not be previously realized, it was likely to be recoverable because the taxable temporary differences from assets with indefinite lives, such as FCC licenses, may be a source of future taxable income. As a result of this change, ¥236,625 million of deferred tax assets were recognized (offset by deferred tax liabilities). Also income taxes decreased by ¥226,569 million and other comprehensive income increased by ¥8,244 million.
8. Interest-bearing debt
(1) Components of interest-bearing debt The components of interest-bearing debt are as follows:
(Millions of yen)
As of March 31, 2017
As of December 31, 2017
Current Short-term borrowings1 667,664 865,892 Commercial paper 80,000 100,000 Current portion of long-term borrowings1 1,128,510 926,664 Current portion of corporate bonds 339,462 619,292 Current portion of lease obligations 438,284 458,812 Current portion of installment payables 40,173 20,392
Total 2,694,093 2,991,052 Non-current
Long-term borrowings1 3,377,625 3,993,368 Corporate bonds 7,233,838 7,290,036 Lease obligations 807,606 782,973 Financial liabilities relating to sale of shares by variable
prepaid forward contract2 715,448 729,234
Installment payables 29,760 18,290 Total 12,164,277 12,813,901
SoftBank Group Corp. Consolidated Financial Report For the nine-month period ended December 31, 2017
60

Notes: 1. The amounts of SoftBank Vision Fund and Delta Fund interest-bearing debt included in the above components of
interest-bearing debt are as follows:
As of March 31, 2017
As of December 31, 2017
Current Short-term borrowings - 213,735 Current portion of long-term borrowings - 98,225
Total - 311,960 Non-current
Long-term borrowings - 66,494 Total - 66,494
SoftBank Vision Fund and Delta Fund interest-bearing debt (before elimination of inter-company transactions)
- 378,454
Eliminated amount of inter-company transactions - (5,770) SoftBank Vision Fund and Delta Fund interest-bearing debt
(after elimination of inter-company transactions) - 372,684
¥ 659,658 million of investments from SoftBank Vision Fund and Delta Fund accounted for using FVTPL is pledged as collateral for ¥326,309 million of interest-bearing debt and the amount is included in the above table.
2. The details are described in “(2) Transaction for sale of Alibaba shares by variable prepaid forward contract.”
(2) Transaction for sale of Alibaba shares by variable prepaid forward contract
On June 10, 2016, West Raptor Holdings, LLC (“WRH LLC”), a wholly-owned subsidiary of the Company, entered into a variable prepaid forward contract to sell Alibaba shares with a newly formed trust, Mandatory Exchangeable Trust (the “Trust”), and received proceeds of ¥578,436 million ($5.4 billion) as advances received on the sale. The Trust, on the other hand, utilized Alibaba shares scheduled to be transferred from WRH LLC at the time of settlement under the contract and issued $6.6 billion of Mandatory Exchangeable Trust Securities (“Trust Securities”) which are mandatorily exchangeable into American depositary shares (“ADSs”) of Alibaba. The proceeds from the sale received by WRH LLC from the Trust was $5.4 billion, which is after certain amounts from the $6.6 billion total of Trust Securities were deducted in order to purchase U.S. Treasury securities, which would fund distributions on the Trust Securities, and to cover expenses for the issuance of the Trust Securities. The settlement of the Alibaba shares based on the variable prepaid forward contract is conducted concurrently with the exchange of Trust Securities. At the exchange date, which is expected to be the first scheduled trading day after June 1, 2019, Trust Securities are exchanged for a certain number of ADSs, determined by reference to the trading price of the ADSs at that time, and the number of Alibaba shares sold by the variable prepaid forward contract is determined by this number of ADSs. A cap and a floor are set for the number of shares settled, and the variable prepaid forward contract is classified as a hybrid financial instrument with embedded derivatives of collar transaction. The Company accounts for the variable prepaid forward contract by bifurcating the main contracts and embedded derivatives. The Company received ¥578,436 million and initially recognized ¥674,023 million as financial liabilities relating to the sale of shares through the variable prepaid forward contract and ¥95,587 million as derivative assets. Subsequent to initial recognition, financial liabilities relating to the sale of shares through the variable prepaid forward contract are measured at amortized cost and embedded derivatives are measured at fair value; ¥729,234 million (¥715,448 million as of March 31, 2017) is recognized as financial liabilities relating to the sale of shares through the variable prepaid forward contract in interest-bearing debt (non-current liabilities) and ¥662,108 million (¥143,935 million as of March 31, 2017) is recognized as derivative financial liabilities
SoftBank Group Corp. Consolidated Financial Report For the nine-month period ended December 31, 2017
61

(non-current liabilities) in the condensed interim consolidated statement of financial position as of December 31, 2017; ¥510,278 million (¥72,293 million of derivative loss for the nine-month period ended December 31, 2016) is recognized as a derivative loss in the condensed interim consolidated statement of income for the nine-month period ended December 31, 2017. WRH LLC has the option (“cash settlement option”) to settle the variable prepaid forward contract by either delivering cash or a combination of cash and Alibaba shares. If WRH LLC elects the cash settlement option, the cash equivalent to the fair value of the number of shares for the settlement, which is determined by the transaction price of ADSs, will be paid. Also, WRH LLC has the option (“early settlement option”) to settle the variable prepaid forward contract prior to the scheduled settlement date. Settlement of the variable prepaid forward contract may be made prior to the scheduled settlement date if WRH LLC elects the early settlement option or under certain other circumstances. Alibaba shares held by WRH LLC are pledged as collateral. The Company applies the equity method to these shares and they are included in “Investments accounted for using the equity method” in the condensed interim consolidated statement of financial position as of December 31, 2017. The carrying amount of Alibaba shares pledged as collateral by the Company is ¥209,464 million as of December 31, 2017 (¥154,440 million as of March 31, 2017). Outline of the transaction
(3) Components of increase and decrease in short-term interest-bearing debt
The components of “Increase in short-term interest-bearing debt, net” in the condensed interim consolidated statement of cash flows are as follows:
(Millions of yen) Nine-month period ended
December 31, 2016 Nine-month period ended
December 31, 2017 Net increase of short-term borrowings 300,024 292,582 Net increase of commercial paper 55,000 20,000
Total 355,024 312,582
West Raptor Holdings, LLC
Alibaba shares pledged as collateral by variable prepaid forward contract
Approximately $5.4 billionfor advances received
for the sale of Alibaba sharesby variable prepaid forward contract
Offering of Mandatory Exchangeable Trust Securities (“Trust Securities”)
$6.6 billion for the total issuance amount of Trust Securities
subsidiarywholly-owned subsidiary
Mandatory Exchangeable Trust
Investors
third party to SoftBank
SoftBank Group Corp. Consolidated Financial Report For the nine-month period ended December 31, 2017
62

(4) Components of proceeds from long-term interest-bearing debt
The components of “Proceeds from long-term interest-bearing debt” in the condensed interim consolidated statement of cash flows are as follows:
(Millions of yen) Nine-month period ended
December 31, 2016 Nine-month period ended
December 31, 2017 Proceeds from long-term borrowings 2,113,485 3,687,621 Proceeds from issuance of corporate bonds 521,000 735,804 Proceeds from sale and leaseback of newly acquired
equipment 372,730 361,777
Proceeds from advances received for sale of shares by variable prepaid forward contract 578,436 -
Total 3,585,651 4,785,202
(5) Components of repayment of long-term interest-bearing debt
The components of “Repayment of long-term interest-bearing debt” in the condensed interim consolidated statement of cash flows are as follows:
(Millions of yen) Nine-month period ended
December 31, 2016 Nine-month period ended
December 31, 2017 Repayment of long-term borrowings (519,536) (3,378,241) Redemption of corporate bonds (350,081) (459,903) Repayment of lease obligations (338,717) (367,238) Payment of installment payables (36,933) (33,164)
Total (1,245,267) (4,238,546) 9. Foreign currency exchange rates
Exchange rates of the major currencies used for translating financial statements of foreign operations are as follows:
(1) Rate at the end of the period (yen) As of
March 31, 2017 As of
December 31, 2017 USD 112.19 113.00 GBP 140.08 151.95
(2) Average rate for the quarter
For the nine-month period ended December 31, 2016 (yen) Three-month period ended
June 30, 2016 Three-month period ended
September 30, 2016 Three-month period ended
December 31, 2016 USD 109.07 102.91 108.72 GBP* - 132.95 135.56
Note:
* Average rate described for the three-month period ended September 30, 2016 is the average rate for a month period of September 2016.
SoftBank Group Corp. Consolidated Financial Report For the nine-month period ended December 31, 2017
63

For the nine-month period ended December 31, 2017 (yen) Three-month period ended
June 30, 2017 Three-month period ended
September 30, 2017 Three-month period ended
December 31, 2017 USD 111.61 111.38 112.74 GBP 142.92 146.20 150.77
10. Equity
The components of accumulated other comprehensive income are as follows: (Millions of yen)
As of March 31, 2017
As of December 31, 2017
Available-for-sale financial assets 11,983 74,938 Cash flow hedges (44,877) (56,477) Exchange differences on translating
foreign operations 244,140 621,034
Total 211,246 639,495 11. Other equity instruments
On July 19, 2017, the Company issued USD-denominated Undated Subordinated NC6 Resettable Notes and USD-denominated Undated Subordinated NC10 Resettable Notes (collectively, the “Hybrid Notes”).
The Hybrid Notes are classified as equity instruments in accordance with International Financial Reporting Standards because the Company has the option to defer interest payments, the notes have no maturity date, and the Company has an unconditional right to avoid delivering cash or another financial asset except for distribution of residual assets on liquidation. As a result of this transaction, ¥496,876 million (after deducting ¥7,034 million of transaction costs) of “Other equity instruments” is increased in equity in the condensed interim consolidated statement of financial position. The corresponding amount is recorded as “Proceeds from issuance of other equity instruments” under cash flows from financing activities in the condensed interim consolidated statement of cash flows.
Also, as of December 31, 2017, accrued interest, which is not recognized as distribution to owners of other equity instruments because the payment has not been determined yet, is ¥14,508 million. In addition, the payment was determined after January 1, 2018 and ¥15,852 million of the payment including the above accrued interest has been completed on the interest payment date, January 19, 2018.
SoftBank Group Corp. Consolidated Financial Report For the nine-month period ended December 31, 2017
64

The details of the Hybrid Notes are as follows: Undated Subordinated NC6
Resettable Notes Undated Subordinated NC10
Resettable Notes
1. Total amount of issue USD 2.75 billion (JPY 307.9 billion)
USD 1.75 billion (JPY 196.0 billion)
2. Issue price 100% of the principal amount 100% of the principal amount 3. Initial interest rate* 6.000% per annum 6.875% per annum 4. Maturity date None (Perpetual) None (Perpetual) 5. Optional redemption The Company may, at its discretion, redeem
the NC6 Notes on the first call date on July 19, 2023 or any interest payment date thereafter.
The Company may, at its discretion, redeem the NC10 Notes on the first call date on July 19, 2027 or any interest payment date thereafter
6. Interest payment Payable semi-annually in arrear on January 19 and July 19 each year 7. Closing date July 19, 2017 8. Collateral None
9. Guarantee None
10. Covenants None
11. Subordination In the event of bankruptcy, etc., the Hybrid Notes shall be subordinated to all the Company’s senior indebtedness (including domestic subordinated bonds issued in 2014 and 2015 by the Company) and shall rank substantially pari passu with the domestic hybrid bonds issued in 2016 by the Company and its senior preference shares (if issued in the future) and senior to the Company’s common stock.
12. Listing Singapore Exchange Securities Trading Limited 13. Use of proceeds The Company used the proceeds of issuance of the Hybrid Notes for general corporate
purposes. Note: * There is a step-up interest provision on the Undated Subordinated NC6 Resettable Note of 25bps on July 19, 2023 and
additional 75bps on July 19, 2038, and on the Undated Subordinated NC10 Resettable Note of 25bps on July 19, 2027 and additional 75bps on July 19, 2042.
12. Operating income from SoftBank Vision Fund and Delta Fund
The components of operating income from SoftBank Vision Fund and Delta Fund are as follows: (Millions of yen)
Nine-month period ended December 31, 2016
Nine-month period ended December 31, 2017
Gain and loss on investments at SoftBank Vision Fund and Delta Fund*
Unrealized gain and loss on valuation of investments -
251,108
Interest and dividend income from investments - 3,744 Operating expenses - (18,425)
Total - 236,427 Note: * “Realized gain and loss on sales of investments” is not recognized for the nine-month period ended December 31,
2017.
SoftBank Group Corp. Consolidated Financial Report For the nine-month period ended December 31, 2017
65

13. Other operating loss
The components of other operating income and loss are as follows: (Millions of yen)
Nine-month period ended December 31, 2016
Nine-month period ended December 31, 2017
Sprint segment Gain on spectrum license exchange1 36,385 53,435 Litigation2 - 41,247 Gain and loss on contract termination (12,287) 558 Loss on disposal of property, plant and
equipment3 (39,617) (58,344)
U.S. state tax charge (10,600) - Other (7,453) 3,023
Yahoo Japan segment Insurance income4 - 4,929 Other - 2,967
Distribution segment Impairment loss on goodwill5 - (43,128) Impairment loss on non-current assets5 - (7,369)
Arm segment Acquisition-related costs (25,780) -
Company-wide Expenses resulting from resignation of director6 (8,283) (1,427)
Other Write-down of inventories7 - (13,585) Acquisition-related costs8 - (6,123) Other - (3,788)
Total (67,635) (27,605)
Notes: 1. License exchange gain resulting from the exchange of a certain portion of the telecommunications spectrum with
other carriers (non-cash transaction). The spectrum is recorded as FCC licenses in intangible assets. 2. Mainly, net benefit in litigation associated with legal settlements for patent infringement lawsuits. 3. For the nine-month period ended December 31, 2017, mainly, ¥20,171 million of loss related to cell site
construction costs that are no longer expected to be used as a result of changes in Sprint’s network plans and ¥38,842 million of loss resulted from the write-off of leased devices related to lease cancellations prior to the scheduled customer lease terms where customers did not return the devices to Sprint are recognized.
4. Insurance proceeds related to a fire incident which occurred at a logistics center of ASKUL Corporation (ASKUL
Logi PARK Tokyo Metropolitan) in February 2017. 5. Impairment losses at Brightstar. Goodwill of Brightstar is allocated to the entirety of Brightstar (a group of
cash-generating units), which had bundled four cash-generating units (Brightstar’s US & Canada, Latin America, Asia & Oceania, and Europe & Africa), and intangible assets with indefinite useful lives other than goodwill are allocated to three cash generating units (Brightstar’s US & Canada, Asia & Oceania, and Europe & Africa), respectively. The business plan of Brightstar was revised for the nine-month period ended December 31, 2017, and indicators of impairment existed at all cash-generating units and a group of cash-generating units of Brightstar wherein goodwill and intangible assets with indefinite useful lives of Brightstar are allocated, therefore the impairment test was conducted on all cash-generating units and a group of cash-generating units. As a result of the impairment test, an impairment loss was recognized because the recoverable amounts of Brightstar (a group of cash-generating units) and Brightstar’s Europe & Africa cash-generating unit were less than those carrying amounts. Impairment losses on goodwill, intangible assets, and property, plant and equipment were ¥43,128 million, ¥6,630 million, and ¥739 million, respectively.
SoftBank Group Corp. Consolidated Financial Report For the nine-month period ended December 31, 2017
66

Fair value less disposal cost is used as the recoverable amount and measured with the income approach and the market approach. Under the income approach, it is measured by discounting cash flows which are estimated based on business plans for the next 10 years while taking into account future cash flows that market participants would expect to receive in accordance with their assumptions discounted to the present value using a post-tax discount rate of 10.5-11%. The cash flows from after 10 years are assumed on the basis of a 3% growth rate. Under the market approach, EV/EBITDA of similar companies which are comparable to Brightstar Global Group Inc. is used.
6. Expense resulting from the resignation of Nikesh Arora from his position as a director. Resignation expense
consists of expenses whose payment amounts are defined and expenses whose payment amounts are to be defined depending on the future share price of SoftBank Group Corp. shares. Expenses based on the share price are settled in two installments in June 2017 and March 2018. Payment amount is determined based on the share price in June 2017 and March 2018, respectively.
In addition to the entire expense whose payment amount is defined, the Company measured the expense based on the SoftBank Group Corp. share price as of December 31, 2016 and recorded an expense of ¥3,266 million during the nine-month period ended December 31, 2016. The expense is remeasured every quarter end based on the share price of SoftBank Group Corp. until the determination of the payment amount, and the changes are recognized through profit or loss.
7. As a result of revising the business plan of Sports Live Entertainment Corporation which operates a sports
content distribution business, the net realizable value of inventories was less than its carrying amount and, therefore, a write-down was recognized.
8. Expenses arising from the business combination of Fortress. The details are described in “Note 3. Business
combinations.” 14. Finance cost
The components of finance cost are as follows:
(Millions of yen) Nine-month period ended
December 31, 2016 Nine-month period ended
December 31, 2017
Interest expenses* (343,363) (383,337)
Note: *¥(1,665) million of interest expenses recorded in SoftBank Vision Fund and Delta Fund is included in the above
interest expense for the nine-month period ended December 31, 2017 (¥(1,708) million before elimination of inter-company transactions).
15. Derivative loss
¥510,278 million of derivative loss (¥72,293 million of derivative loss for the nine-month period ended December 31, 2016) related to Alibaba shares collar transaction included in variable prepaid forward contract was recorded. The details are described in “(2) Transaction for sale of Alibaba shares by variable prepaid forward contract” under “Note 8. Interest-bearing debt.”
SoftBank Group Corp. Consolidated Financial Report For the nine-month period ended December 31, 2017
67

16. Other non-operating income (loss)
The components of other non-operating income and loss are as follows: (Millions of yen)
Nine-month period ended December 31, 2016
Nine-month period ended December 31, 2017
Dilution gain from changes in equity interest1 75,060 38,922 Gain and loss from financial instruments at
FVTPL2 (39,281) 8,069
Impairment loss on assets classified as held for sale (42,540) -
Other (6,715) 3,187 Total (13,476) 50,178
Notes: 1. Mainly, gain arising from changes in Alibaba’s equity interest held by the Company, due to the exercise of stock
options and the allocation of new shares to a third party in Alibaba.
2. Gain and loss arising from financial instruments at FVTPL consist mainly of changes in fair value of preferred stock investments including embedded derivatives designated as financial assets at FVTPL.
17. Supplemental information to the condensed interim consolidated statement of cash flows
(1) Payments for acquisition of investments by SoftBank Vision Fund and Delta Fund For the nine-month period ended December 31, 2017
¥812,042 million which was included in “Payments for acquisition of investments” in cash flows from investing activities for the three-month period ended June 30, 2017 is reclassified as investments transferred to SoftBank Vision Fund and Delta Fund from the Company or the Agreed Transferable Investments for the three-month period ended September 30, 2017, and accordingly the amount is reclassified as “Payments for acquisition of investments by SoftBank Vision Fund and Delta Fund” under cash flows from investing activities in the condensed interim consolidated statement of cash flows for the nine-month period ended December 31, 2017.
(2) Contributions into SoftBank Vision Fund and Delta Fund from third-party investors
For the nine-month period ended December 31, 2017
The amount is after deducting ¥15,450 million that was returned to Third-Party Investors of SoftBank Vision Fund due to the change in an investment plan after the contribution from Third-Party Investors.
18. Significant subsequent events
(1) Acquisition of shares of Uber Technologies, Inc. (“Uber”)
An overseas subsidiary of SoftBank Group Corp. and Uber, an operator of a ride-sharing service, entered into an agreement by December 31, 2017 that the overseas subsidiary purchases issued and to be issued share capital of Uber for a total amount of $7.67 billion and the acquisition was completed on January 18, 2018.
Uber is not classified as a subsidiary nor an associate of the Company.
The impact of this agreement on the operating results as of March 31, 2018, has not been determined at present.
SoftBank Group Corp. Consolidated Financial Report For the nine-month period ended December 31, 2017
68

(2) Acquisition of shares of Xiaoju Kuaizhi Inc. (“DiDi”)
An overseas subsidiary of SoftBank Group Corp. and DiDi, an operator of a ride-sharing service in China, entered into an agreement that an overseas subsidiary would purchase issued and to be issued share capital of DiDi for a total amount of $4.58 billion and of this, $3.59 billion of shares were purchased on January 11, 2018. Agreements with DiDi and existing shareholders relating to $4.39 billion of $4.58 billion were executed by December 31, 2017, and the remaining $0.19 billion were executed in January, 2018.
DiDi is not classified as a subsidiary nor an associate of the Company after the closing of this transaction.
The impact of this agreement on the operating results as of March 31, 2018, has not been determined at present.
(3) Consolidation of The Japan Net Bank, Limited
Yahoo Japan Corporation consolidated The Japan Net Bank, Limited (“The Japan Net Bank”) by appointing the majority of The Japan Net Bank’s directors, through a resolution in an Extraordinary Meeting of the Shareholders’ of The Japan Net Bank held on February 1, 2018. In addition, calculation of fair value of acquired assets and assumed liabilities on the acquisition date has not been completed at present and therefore detailed information on the accounting treatment for the business combination including fair values of goodwill, acquired assets, and assumed liabilities on the acquisition date has not been disclosed.
a. Overview of consolidation
In the Yahoo Japan segment, since its commencement of new strategies in the Commerce Business in October 2013, transaction volume has rapidly increased by means of various measures such as waiving store tenant fees, point reward measures, and start of the Credit Card business. It is believed to strengthen its financial and payment business further is necessary in order to revitalize the Commerce Business from here on. The ecosystem of its services in the Yahoo Japan segment is reinforced through the consolidation of The Japan Net Bank.
In addition, Yahoo Japan Corporation leads the management of The Japan Net Bank through the consolidation and utilizes the customer base and multi big data that Yahoo Group has fostered thus far to provide high value-added financial services for The Japan Net Bank customers.
The voting rights ratio in The Japan Net Bank held by the Company remains the same as before at 41.16% and the Company does not hold a majority. However, the Company made The Japan Net Bank its consolidated subsidiary by appointing the majority of The Japan Net Bank’s directors through a resolution in an Extraordinary Meeting of the Shareholders’ of The Japan Net Bank held on February 1, 2018.
b. Summary of acquiree
Name The Japan Net Bank, Limited Nature of business Banking business
c. Acquisition date
February 1, 2018
SoftBank Group Corp. Consolidated Financial Report For the nine-month period ended December 31, 2017
69