Consolidated financial report for the fiscal year ended ... · * This consolidated financial report...
77
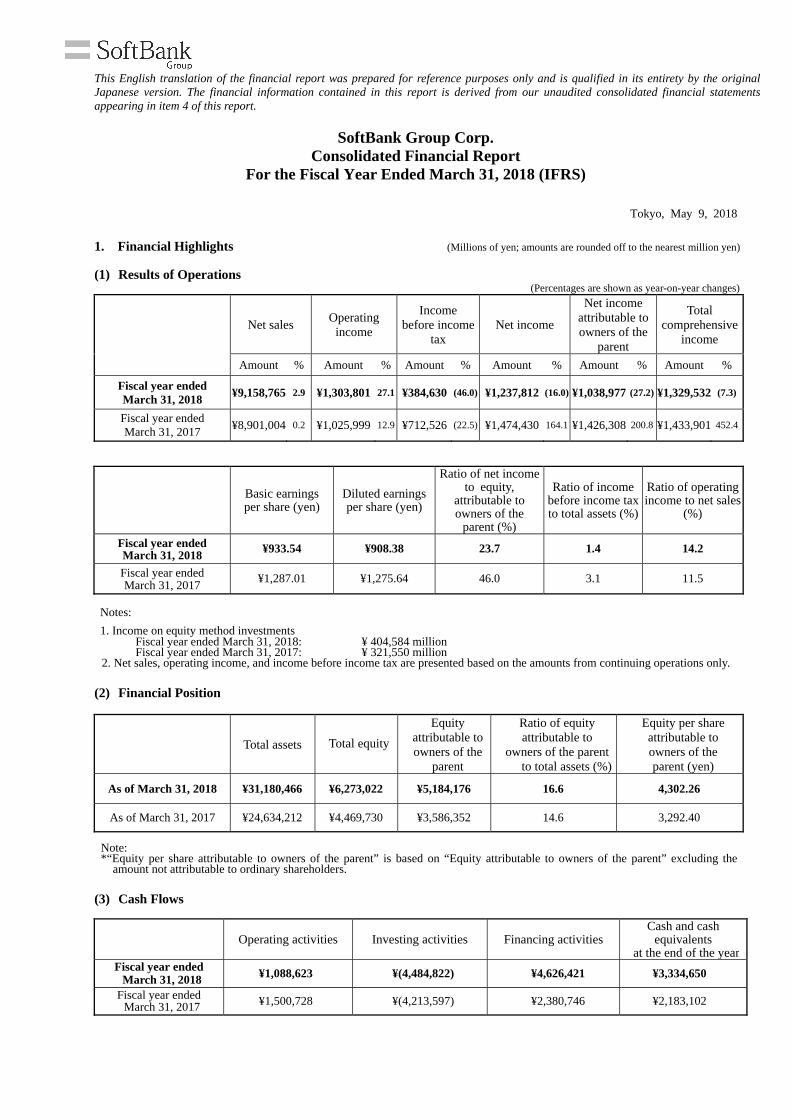
This English translation of the financial report was prepared for reference purposes only and is qualified in its entirety by the original Japanese version. The financial information contained in this report is derived from our unaudited consolidated financial statements appearing in item 4 of this report. SoftBank Group Corp. Consolidated Financial Report For the Fiscal Year Ended March 31, 2018 (IFRS) Tokyo, May 9, 2018 1. Financial Highlights (Millions of yen; amounts are rounded off to the nearest million yen) (1) Results of Operations (Percentages are shown as year-on-year changes) Net sales Operating income Income before income tax Net income Net income attributable to owners of the parent Total comprehensive income Amount % Amount % Amount % Amount % Amount % Amount % Fiscal year ended March 31, 2018 ¥9,158,765 2.9 ¥1,303,801 27.1 ¥384,630 (46.0) ¥1,237,812 (16.0) ¥1,038,977 (27.2) ¥1,329,532 (7.3) Fiscal year ended March 31, 2017 ¥8,901,004 0.2 ¥1,025,999 12.9 ¥712,526 (22.5) ¥1,474,430 164.1 ¥1,426,308 200.8 ¥1,433,901 452.4 Basic earnings per share (yen) Diluted earnings per share (yen) Ratio of net income to equity, attributable to owners of the parent (%) Ratio of income before income tax to total assets (%) Ratio of operating income to net sales (%) Fiscal year ended March 31, 2018 ¥933.54 ¥908.38 23.7 1.4 14.2 Fiscal year ended March 31, 2017 ¥1,287.01 ¥1,275.64 46.0 3.1 11.5 Notes: 1. Income on equity method investments Fiscal year ended March 31, 2018: ¥ 404,584 million Fiscal year ended March 31, 2017: ¥ 321,550 million 2. Net sales, operating income, and income before income tax are presented based on the amounts from continuing operations only. (2) Financial Position Total assets Total equity Equity attributable to owners of the parent Ratio of equity attributable to owners of the parent to total assets (%) Equity per share attributable to owners of the parent (yen) As of March 31, 2018 ¥31,180,466 ¥6,273,022 ¥5,184,176 16.6 4,302.26 As of March 31, 2017 ¥24,634,212 ¥4,469,730 ¥3,586,352 14.6 3,292.40 Note: *“Equity per share attributable to owners of the parent” is based on “Equity attributable to owners of the parent” excluding the amount not attributable to ordinary shareholders. (3) Cash Flows Operating activities Investing activities Financing activities Cash and cash equivalents at the end of the year Fiscal year ended March 31, 2018 ¥1,088,623 ¥(4,484,822) ¥4,626,421 ¥3,334,650 Fiscal year ended March 31, 2017 ¥1,500,728 ¥(4,213,597) ¥2,380,746 ¥2,183,102
Transcript of Consolidated financial report for the fiscal year ended ... · * This consolidated financial report...
This English translation of the financial report was prepared for reference purposes only and is qualified in its entirety by the original Japanese version. The financial information contained in this report is derived from our unaudited consolidated financial statements appearing in item 4 of this report.
SoftBank Group Corp. Consolidated Financial Report
For the Fiscal Year Ended March 31, 2018 (IFRS)
Tokyo, May 9, 2018
1. Financial Highlights (Millions of yen; amounts are rounded off to the nearest million yen)
(1) Results of Operations(Percentages are shown as year-on-year changes)
Net sales Operating
income
Income before income
tax Net income
Net income attributable to owners of the
parent
Total comprehensive
income
Amount % Amount % Amount % Amount % Amount % Amount %
Fiscal year ended March 31, 2018 ¥9,158,765 2.9 ¥1,303,801 27.1 ¥384,630 (46.0) ¥1,237,812 (16.0) ¥1,038,977 (27.2) ¥1,329,532 (7.3)
Fiscal year ended March 31, 2017 ¥8,901,004 0.2 ¥1,025,999 12.9 ¥712,526 (22.5) ¥1,474,430 164.1 ¥1,426,308 200.8 ¥1,433,901 452.4
Basic earnings per share (yen)
Diluted earnings per share (yen)
Ratio of net income to equity,
attributable to owners of the
parent (%)
Ratio of income before income tax to total assets (%)
Ratio of operating income to net sales
(%)
Fiscal year ended March 31, 2018
¥933.54 ¥908.38 23.7 1.4 14.2
Fiscal year ended March 31, 2017
¥1,287.01 ¥1,275.64 46.0 3.1 11.5
Notes:
1. Income on equity method investmentsFiscal year ended March 31, 2018: ¥ 404,584 millionFiscal year ended March 31, 2017: ¥ 321,550 million
2. Net sales, operating income, and income before income tax are presented based on the amounts from continuing operations only.
(2) Financial Position
Total assets Total equity
Equity attributable to owners of the
parent
Ratio of equity attributable to
owners of the parent to total assets (%)
Equity per share attributable to owners of the parent (yen)
As of March 31, 2018 ¥31,180,466 ¥6,273,022 ¥5,184,176 16.6 4,302.26
As of March 31, 2017 ¥24,634,212 ¥4,469,730 ¥3,586,352 14.6 3,292.40
Note: *“Equity per share attributable to owners of the parent” is based on “Equity attributable to owners of the parent” excluding the
amount not attributable to ordinary shareholders.
(3) Cash Flows
Operating activities Investing activities Financing activities Cash and cash
equivalents at the end of the year
Fiscal year ended March 31, 2018 ¥1,088,623 ¥(4,484,822) ¥4,626,421 ¥3,334,650
Fiscal year ended March 31, 2017 ¥1,500,728 ¥(4,213,597) ¥2,380,746 ¥2,183,102
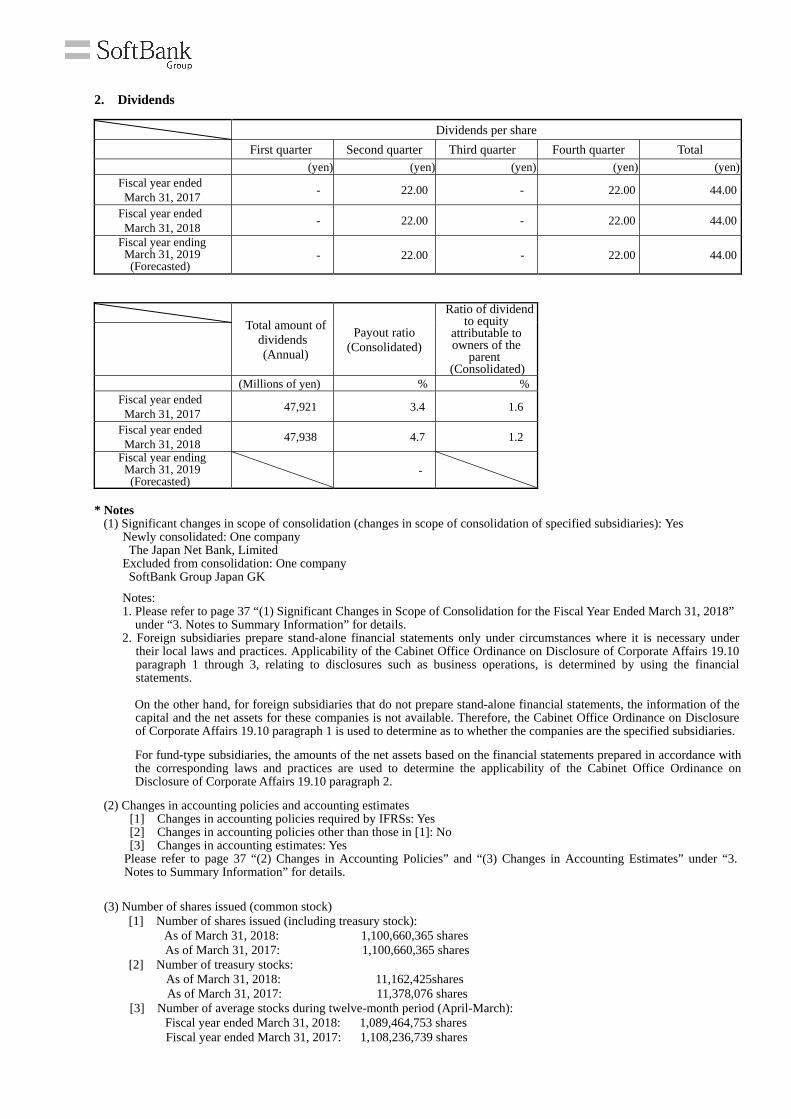
2. Dividends Dividends per share
First quarter Second quarter Third quarter Fourth quarter Total (yen) (yen) (yen) (yen) (yen)
Fiscal year ended March 31, 2017
- 22.00 - 22.00 44.00
Fiscal year ended March 31, 2018
- 22.00 - 22.00 44.00
Fiscal year ending March 31, 2019 (Forecasted)
- 22.00 - 22.00 44.00
Total amount of
dividends (Annual)
Payout ratio (Consolidated)
Ratio of dividend to equity
attributable to owners of the
parent (Consolidated)
(Millions of yen) % % Fiscal year ended March 31, 2017
47,921 3.4 1.6
Fiscal year ended March 31, 2018
47,938 4.7 1.2
Fiscal year ending March 31, 2019 (Forecasted)
-
* Notes
(1) Significant changes in scope of consolidation (changes in scope of consolidation of specified subsidiaries): Yes Newly consolidated: One company
The Japan Net Bank, Limited Excluded from consolidation: One company SoftBank Group Japan GK
Notes: 1. Please refer to page 37 “(1) Significant Changes in Scope of Consolidation for the Fiscal Year Ended March 31, 2018”
under “3. Notes to Summary Information” for details. 2. Foreign subsidiaries prepare stand-alone financial statements only under circumstances where it is necessary under
their local laws and practices. Applicability of the Cabinet Office Ordinance on Disclosure of Corporate Affairs 19.10 paragraph 1 through 3, relating to disclosures such as business operations, is determined by using the financial statements.
On the other hand, for foreign subsidiaries that do not prepare stand-alone financial statements, the information of the
capital and the net assets for these companies is not available. Therefore, the Cabinet Office Ordinance on Disclosure of Corporate Affairs 19.10 paragraph 1 is used to determine as to whether the companies are the specified subsidiaries.
For fund-type subsidiaries, the amounts of the net assets based on the financial statements prepared in accordance with the corresponding laws and practices are used to determine the applicability of the Cabinet Office Ordinance on Disclosure of Corporate Affairs 19.10 paragraph 2.
(2) Changes in accounting policies and accounting estimates
[1] Changes in accounting policies required by IFRSs: Yes [2] Changes in accounting policies other than those in [1]: No [3] Changes in accounting estimates: Yes
Please refer to page 37 “(2) Changes in Accounting Policies” and “(3) Changes in Accounting Estimates” under “3. Notes to Summary Information” for details.
(3) Number of shares issued (common stock) [1] Number of shares issued (including treasury stock):
As of March 31, 2018: 1,100,660,365 shares As of March 31, 2017: 1,100,660,365 shares
[2] Number of treasury stocks: As of March 31, 2018: 11,162,425shares As of March 31, 2017: 11,378,076 shares
[3] Number of average stocks during twelve-month period (April-March): Fiscal year ended March 31, 2018: 1,089,464,753 shares Fiscal year ended March 31, 2017: 1,108,236,739 shares
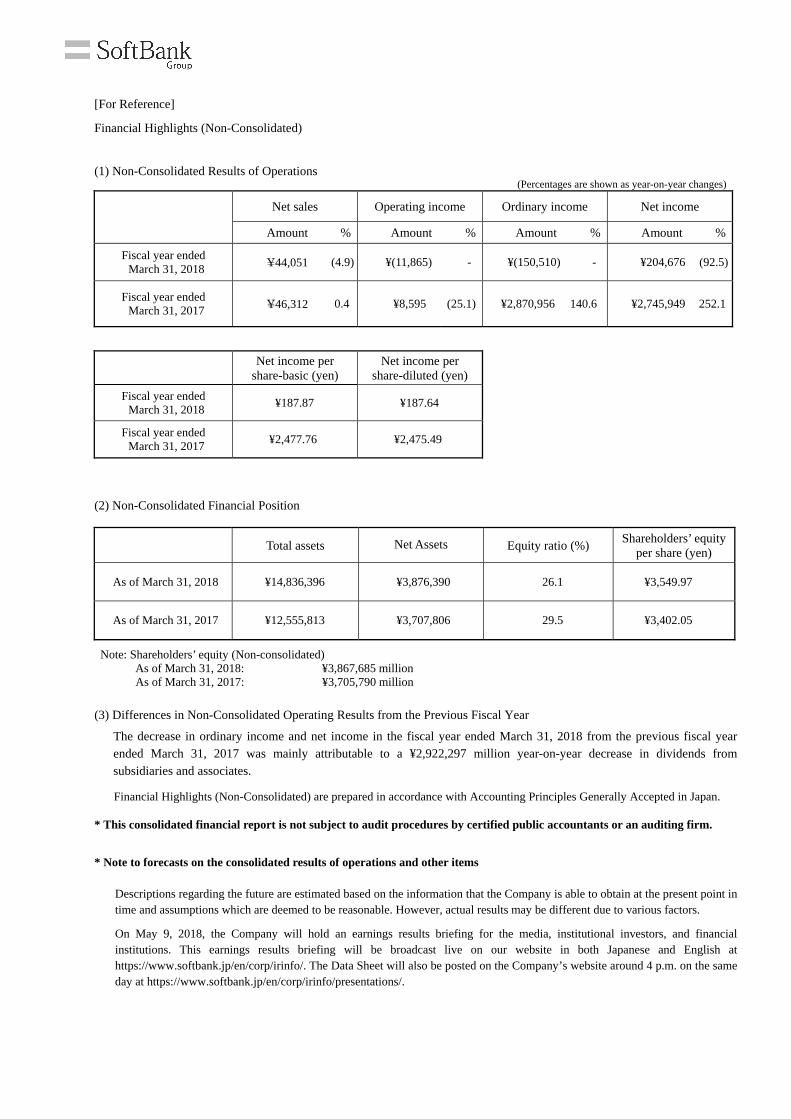
[For Reference]
Financial Highlights (Non-Consolidated)
(1) Non-Consolidated Results of Operations (Percentages are shown as year-on-year changes)
Net sales Operating income Ordinary income Net income
Amount % Amount % Amount % Amount %
Fiscal year ended March 31, 2018 ¥44,051 (4.9) ¥(11,865) - ¥(150,510) - ¥204,676 (92.5)
Fiscal year ended March 31, 2017 ¥46,312 0.4 ¥8,595 (25.1) ¥2,870,956 140.6 ¥2,745,949 252.1
Net income per
share-basic (yen) Net income per
share-diluted (yen)
Fiscal year ended March 31, 2018
¥187.87 ¥187.64
Fiscal year ended March 31, 2017
¥2,477.76 ¥2,475.49
(2) Non-Consolidated Financial Position
Total assets Net Assets Equity ratio (%) Shareholders’ equity
per share (yen)
As of March 31, 2018 ¥14,836,396 ¥3,876,390 26.1 ¥3,549.97
As of March 31, 2017 ¥12,555,813 ¥3,707,806 29.5 ¥3,402.05
Note: Shareholders’ equity (Non-consolidated) As of March 31, 2018: ¥3,867,685 million As of March 31, 2017: ¥3,705,790 million
(3) Differences in Non-Consolidated Operating Results from the Previous Fiscal Year
The decrease in ordinary income and net income in the fiscal year ended March 31, 2018 from the previous fiscal year ended March 31, 2017 was mainly attributable to a ¥2,922,297 million year-on-year decrease in dividends from subsidiaries and associates.
Financial Highlights (Non-Consolidated) are prepared in accordance with Accounting Principles Generally Accepted in Japan.
* This consolidated financial report is not subject to audit procedures by certified public accountants or an auditing firm.
* Note to forecasts on the consolidated results of operations and other items
Descriptions regarding the future are estimated based on the information that the Company is able to obtain at the present point in time and assumptions which are deemed to be reasonable. However, actual results may be different due to various factors. On May 9, 2018, the Company will hold an earnings results briefing for the media, institutional investors, and financial institutions. This earnings results briefing will be broadcast live on our website in both Japanese and English at https://www.softbank.jp/en/corp/irinfo/. The Data Sheet will also be posted on the Company’s website around 4 p.m. on the same day at https://www.softbank.jp/en/corp/irinfo/presentations/.
(Appendix)
Contents
1. Results of Operations ............................................................................................................................................... P. 3
(1) Overview of Results of Operations ................................................................................................................... P. 3
a. Consolidated Results of Operations ................................................................................................................ P. 4
b. Results by Segment ........................................................................................................................................ P. 9
(2) Overview of Financial Position ........................................................................................................................ P. 28
(3) Overview of Cash Flows .................................................................................................................................. P. 34
(4) Forecasts ........................................................................................................................................................... P. 36
2.Basic Approach to the Selection of Accounting Standards ........................................................................P. 36
3. Notes to Summary Information ............................................................................................................................... P. 37
(1) Significant Changes in Scope of Consolidation for the Fiscal Year Ended March 31, 2018 ............................... P. 37
(2) Changes in Accounting Policies ........................................................................................................................ P. 37
(3) Changes in Accounting Estimates ..................................................................................................................... P. 37
4. Consolidated Financial Statements and Primary Notes ........................................................................................... P. 38
(1) Consolidated Statement of Financial Position ................................................................................................... P. 39
(2) Consolidated Statement of Income and Consolidated Statement of
Comprehensive Income .................................................................................................................................... P. 41
(3) Consolidated Statement of Changes in Equity .................................................................................................. P. 43
(4) Consolidated Statement of Cash Flows ............................................................................................................. P. 45
(5) Significant Doubt about Going Concern Assumption ....................................................................................... P. 47
(6) Notes to Consolidated Financial Statements ..................................................................................................... P. 47
SoftBank Group Corp. Consolidated Financial Report For the Fiscal Year Ended March 31, 2018
1
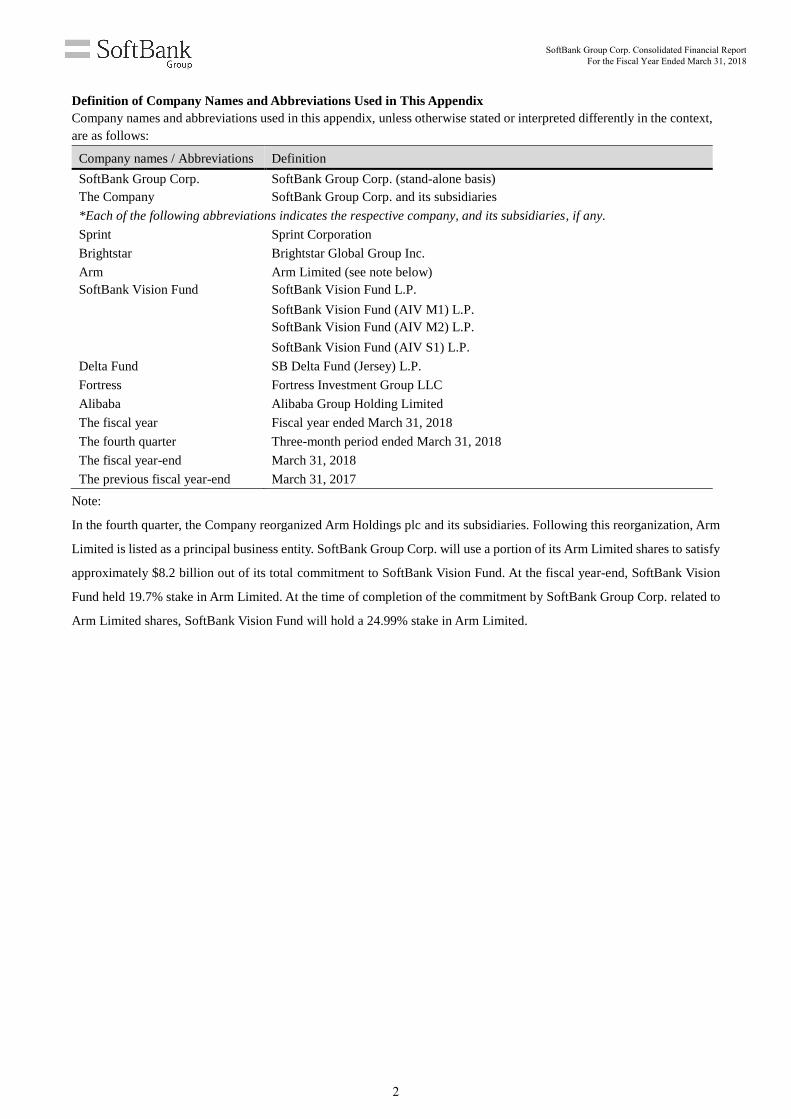
Definition of Company Names and Abbreviations Used in This Appendix
Company names and abbreviations used in this appendix, unless otherwise stated or interpreted differently in the context,
are as follows:
Company names / Abbreviations Definition
SoftBank Group Corp. SoftBank Group Corp. (stand-alone basis)
The Company SoftBank Group Corp. and its subsidiaries
*Each of the following abbreviations indicates the respective company, and its subsidiaries, if any.
Sprint Sprint Corporation
Brightstar Brightstar Global Group Inc.
Arm Arm Limited (see note below)
SoftBank Vision Fund
SoftBank Vision Fund L.P.
SoftBank Vision Fund (AIV M1) L.P.
SoftBank Vision Fund (AIV M2) L.P.
SoftBank Vision Fund (AIV S1) L.P.
Delta Fund SB Delta Fund (Jersey) L.P.
Fortress Fortress Investment Group LLC
Alibaba Alibaba Group Holding Limited
The fiscal year Fiscal year ended March 31, 2018
The fourth quarter Three-month period ended March 31, 2018
The fiscal year-end March 31, 2018
The previous fiscal year-end March 31, 2017
Note:
In the fourth quarter, the Company reorganized Arm Holdings plc and its subsidiaries. Following this reorganization, Arm
Limited is listed as a principal business entity. SoftBank Group Corp. will use a portion of its Arm Limited shares to satisfy
approximately $8.2 billion out of its total commitment to SoftBank Vision Fund. At the fiscal year-end, SoftBank Vision
Fund held 19.7% stake in Arm Limited. At the time of completion of the commitment by SoftBank Group Corp. related to
Arm Limited shares, SoftBank Vision Fund will hold a 24.99% stake in Arm Limited.
SoftBank Group Corp. Consolidated Financial Report For the Fiscal Year Ended March 31, 2018
2
1. Results of Operations
(1) Overview of Results of Operations
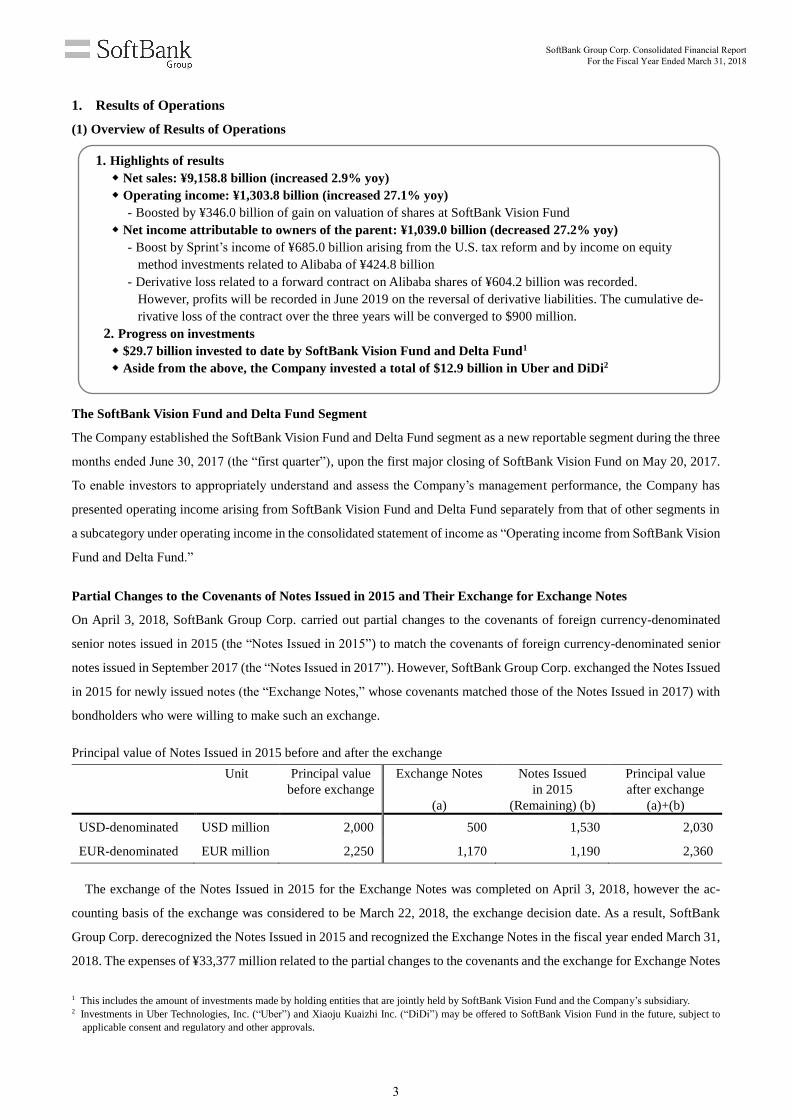
1. Highlights of results
Net sales: ¥9,158.8 billion (increased 2.9% yoy)
Operating income: ¥1,303.8 billion (increased 27.1% yoy)
- Boosted by ¥346.0 billion of gain on valuation of shares at SoftBank Vision Fund
Net income attributable to owners of the parent: ¥1,039.0 billion (decreased 27.2% yoy)
- Boost by Sprint’s income of ¥685.0 billion arising from the U.S. tax reform and by income on equity
method investments related to Alibaba of ¥424.8 billion
- Derivative loss related to a forward contract on Alibaba shares of ¥604.2 billion was recorded.
However, profits will be recorded in June 2019 on the reversal of derivative liabilities. The cumulative de-
rivative loss of the contract over the three years will be converged to $900 million.
2. Progress on investments
$29.7 billion invested to date by SoftBank Vision Fund and Delta Fund1
Aside from the above, the Company invested a total of $12.9 billion in Uber and DiDi2
The SoftBank Vision Fund and Delta Fund Segment
The Company established the SoftBank Vision Fund and Delta Fund segment as a new reportable segment during the three
months ended June 30, 2017 (the “first quarter”), upon the first major closing of SoftBank Vision Fund on May 20, 2017.
To enable investors to appropriately understand and assess the Company’s management performance, the Company has
presented operating income arising from SoftBank Vision Fund and Delta Fund separately from that of other segments in
a subcategory under operating income in the consolidated statement of income as “Operating income from SoftBank Vision
Fund and Delta Fund.”
Partial Changes to the Covenants of Notes Issued in 2015 and Their Exchange for Exchange Notes
On April 3, 2018, SoftBank Group Corp. carried out partial changes to the covenants of foreign currency-denominated
senior notes issued in 2015 (the “Notes Issued in 2015”) to match the covenants of foreign currency-denominated senior
notes issued in September 2017 (the “Notes Issued in 2017”). However, SoftBank Group Corp. exchanged the Notes Issued
in 2015 for newly issued notes (the “Exchange Notes,” whose covenants matched those of the Notes Issued in 2017) with
bondholders who were willing to make such an exchange.
Principal value of Notes Issued in 2015 before and after the exchange
Unit Principal value
before exchange
Exchange Notes
(a)
Notes Issued
in 2015
(Remaining) (b)
Principal value
after exchange
(a)+(b)
USD-denominated USD million 2,000 500 1,530 2,030
EUR-denominated EUR million 2,250 1,170 1,190 2,360
The exchange of the Notes Issued in 2015 for the Exchange Notes was completed on April 3, 2018, however the ac-
counting basis of the exchange was considered to be March 22, 2018, the exchange decision date. As a result, SoftBank
Group Corp. derecognized the Notes Issued in 2015 and recognized the Exchange Notes in the fiscal year ended March 31,
2018. The expenses of ¥33,377 million related to the partial changes to the covenants and the exchange for Exchange Notes
1 This includes the amount of investments made by holding entities that are jointly held by SoftBank Vision Fund and the Company’s subsidiary.
2 Investments in Uber Technologies, Inc. (“Uber”) and Xiaoju Kuaizhi Inc. (“DiDi”) may be offered to SoftBank Vision Fund in the future, subject to
applicable consent and regulatory and other approvals.
SoftBank Group Corp. Consolidated Financial Report For the Fiscal Year Ended March 31, 2018
3
(loss on exchange of corporate bonds, consent fees about changing certain conditions of covenants, and loss arising from
cancelation of hedge accounting for the currency swaps) were recognized in the consolidated statement of income of the
fiscal year ended March 31, 2018.
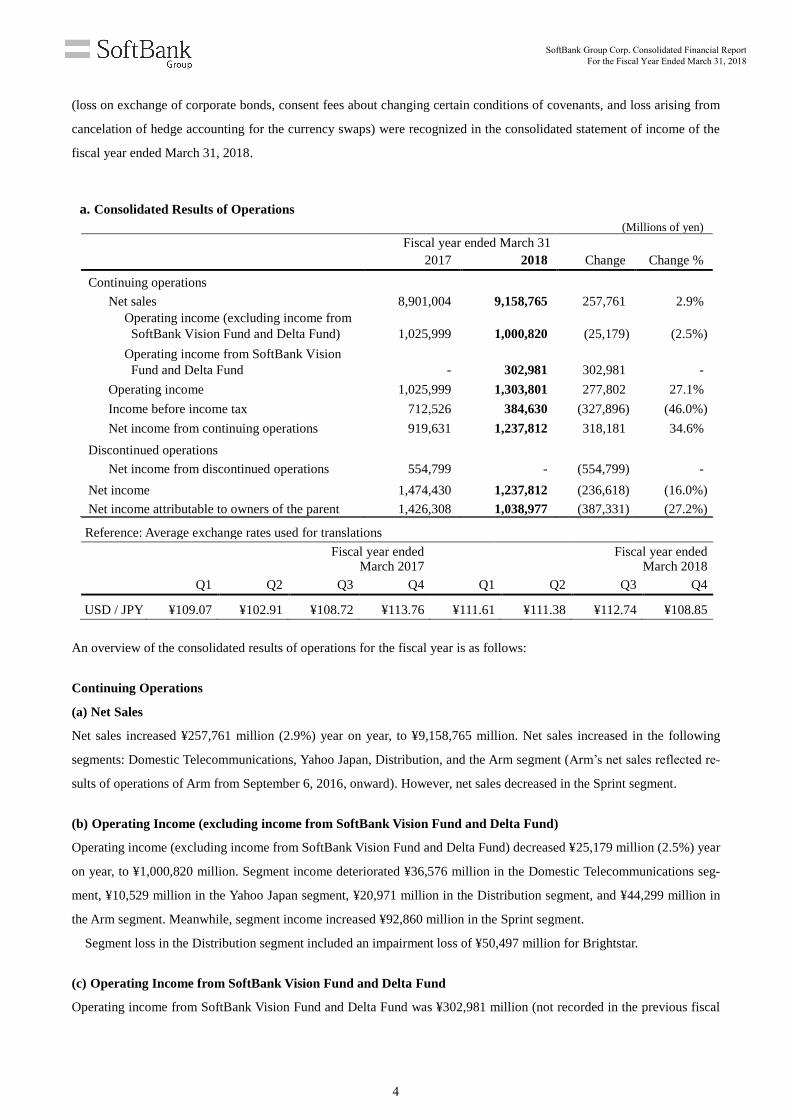
a. Consolidated Results of Operations
(Millions of yen)
Fiscal year ended March 31
2017 2018 Change Change %
Continuing operations
Net sales 8,901,004 9,158,765 257,761 2.9%
Operating income (excluding income from
SoftBank Vision Fund and Delta Fund) 1,025,999 1,000,820 (25,179) (2.5%)
Operating income from SoftBank Vision
Fund and Delta Fund - 302,981 302,981 -
Operating income 1,025,999 1,303,801 277,802 27.1%
Income before income tax 712,526 384,630 (327,896) (46.0%)
Net income from continuing operations 919,631 1,237,812 318,181 34.6%
Discontinued operations
Net income from discontinued operations 554,799 - (554,799) -
Net income 1,474,430 1,237,812 (236,618) (16.0%)
Net income attributable to owners of the parent 1,426,308 1,038,977 (387,331) (27.2%)
Reference: Average exchange rates used for translations
Fiscal year ended March 2017
Fiscal year ended March 2018
Q1 Q2 Q3 Q4 Q1 Q2 Q3 Q4
USD / JPY ¥109.07 ¥102.91 ¥108.72 ¥113.76 ¥111.61 ¥111.38 ¥112.74 ¥108.85
An overview of the consolidated results of operations for the fiscal year is as follows:
Continuing Operations
(a) Net Sales
Net sales increased ¥257,761 million (2.9%) year on year, to ¥9,158,765 million. Net sales increased in the following
segments: Domestic Telecommunications, Yahoo Japan, Distribution, and the Arm segment (Arm’s net sales reflected re-
sults of operations of Arm from September 6, 2016, onward). However, net sales decreased in the Sprint segment.
(b) Operating Income (excluding income from SoftBank Vision Fund and Delta Fund)
Operating income (excluding income from SoftBank Vision Fund and Delta Fund) decreased ¥25,179 million (2.5%) year
on year, to ¥1,000,820 million. Segment income deteriorated ¥36,576 million in the Domestic Telecommunications seg-
ment, ¥10,529 million in the Yahoo Japan segment, ¥20,971 million in the Distribution segment, and ¥44,299 million in
the Arm segment. Meanwhile, segment income increased ¥92,860 million in the Sprint segment.
Segment loss in the Distribution segment included an impairment loss of ¥50,497 million for Brightstar.
(c) Operating Income from SoftBank Vision Fund and Delta Fund
Operating income from SoftBank Vision Fund and Delta Fund was ¥302,981 million (not recorded in the previous fiscal
SoftBank Group Corp. Consolidated Financial Report For the Fiscal Year Ended March 31, 2018
4
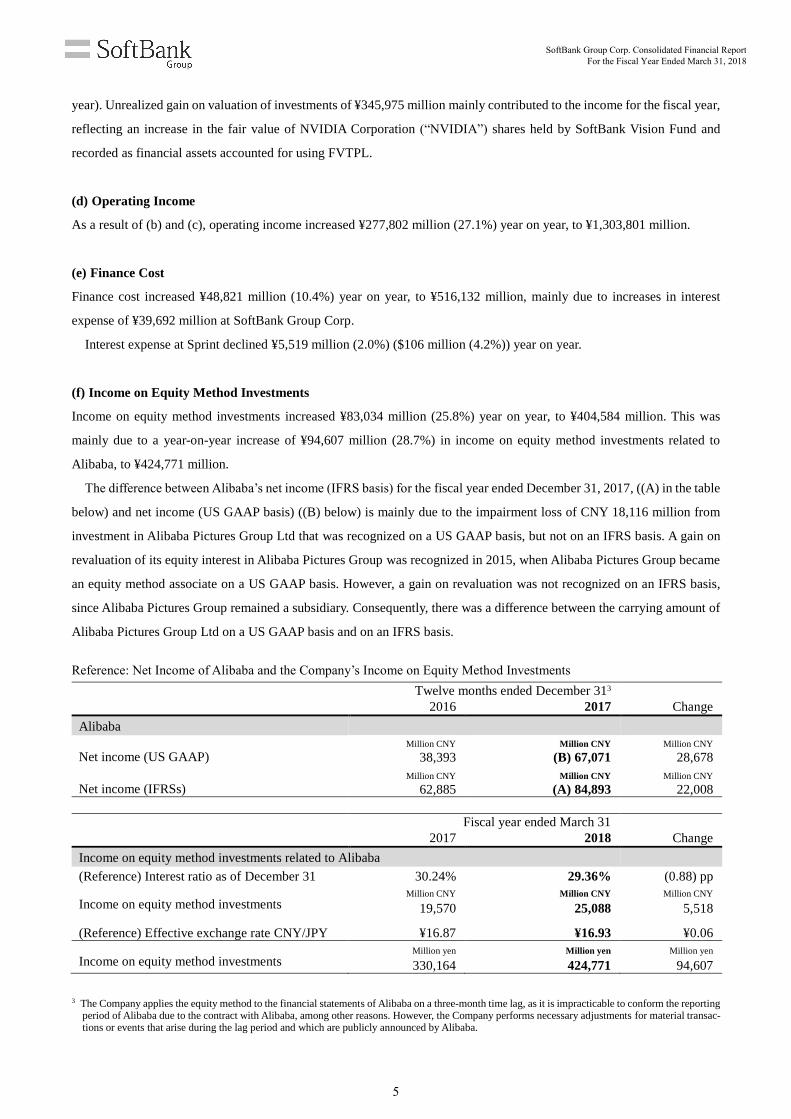
year). Unrealized gain on valuation of investments of ¥345,975 million mainly contributed to the income for the fiscal year,
reflecting an increase in the fair value of NVIDIA Corporation (“NVIDIA”) shares held by SoftBank Vision Fund and
recorded as financial assets accounted for using FVTPL.
(d) Operating Income
As a result of (b) and (c), operating income increased ¥277,802 million (27.1%) year on year, to ¥1,303,801 million.
(e) Finance Cost
Finance cost increased ¥48,821 million (10.4%) year on year, to ¥516,132 million, mainly due to increases in interest
expense of ¥39,692 million at SoftBank Group Corp.
Interest expense at Sprint declined ¥5,519 million (2.0%) ($106 million (4.2%)) year on year.
(f) Income on Equity Method Investments
Income on equity method investments increased ¥83,034 million (25.8%) year on year, to ¥404,584 million. This was
mainly due to a year-on-year increase of ¥94,607 million (28.7%) in income on equity method investments related to
Alibaba, to ¥424,771 million.
The difference between Alibaba’s net income (IFRS basis) for the fiscal year ended December 31, 2017, ((A) in the table
below) and net income (US GAAP basis) ((B) below) is mainly due to the impairment loss of CNY 18,116 million from
investment in Alibaba Pictures Group Ltd that was recognized on a US GAAP basis, but not on an IFRS basis. A gain on
revaluation of its equity interest in Alibaba Pictures Group was recognized in 2015, when Alibaba Pictures Group became
an equity method associate on a US GAAP basis. However, a gain on revaluation was not recognized on an IFRS basis,
since Alibaba Pictures Group remained a subsidiary. Consequently, there was a difference between the carrying amount of
Alibaba Pictures Group Ltd on a US GAAP basis and on an IFRS basis.
Reference: Net Income of Alibaba and the Company’s Income on Equity Method Investments
Twelve months ended December 313
2016 2017 Change
Alibaba
Net income (US GAAP) Million CNY
38,393 Million CNY
(B) 67,071 Million CNY
28,678
Net income (IFRSs) Million CNY
62,885 Million CNY
(A) 84,893 Million CNY
22,008
Fiscal year ended March 31
2017 2018 Change
Income on equity method investments related to Alibaba
(Reference) Interest ratio as of December 31 30.24% 29.36% (0.88) pp
Income on equity method investments Million CNY
19,570
Million CNY
25,088
Million CNY
5,518
(Reference) Effective exchange rate CNY/JPY ¥16.87 ¥16.93 ¥0.06
Income on equity method investments Million yen
330,164
Million yen
424,771
Million yen
94,607
3 The Company applies the equity method to the financial statements of Alibaba on a three-month time lag, as it is impracticable to conform the reporting period of Alibaba due to the contract with Alibaba, among other reasons. However, the Company performs necessary adjustments for material transac-tions or events that arise during the lag period and which are publicly announced by Alibaba.
SoftBank Group Corp. Consolidated Financial Report For the Fiscal Year Ended March 31, 2018
5
(g) Gain on Sales of Shares of Associates
Gain on sales of shares of associates was ¥1,804 million (gain of ¥238,103 million in the previous fiscal year). In the
previous fiscal year, the Company sold a portion of Alibaba shares to Alibaba, two Singaporean sovereign wealth funds,
and Alibaba Partnership.4
(h) Foreign Exchange Gain and Loss
Foreign exchange loss was ¥34,518 million (gain of ¥53,336 million in the previous fiscal year).
(i) Derivative Gain and Loss
Derivative loss was ¥630,190 million (loss of ¥252,815 million in the previous fiscal year). This was mainly attributable
to a loss of ¥604,156 million recorded in relation to a collar transaction embedded in a variable prepaid forward contract
for Alibaba shares (see note below).
Regarding the collar transaction, the fair value (primarily linked to the share price of Alibaba) are measured at the end
of each quarter and recognized as derivative liabilities, while changes are recognized as a gain or loss. However, the total
amount of derivative liabilities will be reversed on the settlement date of the collar transaction (June 2019), and the same
amount will be recognized as a gain. Consequently, the cumulative derivative gain and loss for the three years, from the
conclusion of the variable prepaid forward contract in June 2016 until the settlement date, will be a loss of $900 million,
equal to the amount of derivative assets initially recognized.
Note: See “(2) Transaction for sale of Alibaba shares by variable prepaid forward contract” under “7. Interest-bearing debt” in “(6) Notes
to Consolidated Financial Statements” in “4. Consolidated Financial Statements and Primary Notes” for details of the variable prepaid
forward contract.
(j) Gain and Loss from Financial Instruments at FVTPL
Loss from financial instruments at FVTPL was ¥68 million (loss of ¥160,419 million in the previous fiscal year). In the
previous fiscal year, loss was recognized due to the change in the fair value of investments in India.
(k) Changes in Third-party Interests in SoftBank Vision Fund and Delta Fund
Changes in third-party interests in SoftBank Vision Fund and Delta Fund increased ¥160,382 million (negative impact on
income; not recorded in the previous fiscal year). Of the third-party interests in SoftBank Vision Fund and Delta Fund
presented in consolidated statement of financial position, the fluctuations arising from SoftBank Vision Fund and Delta
Fund’s results were recorded as the changes.
4 Alibaba Partnership is not an affiliate of Alibaba.
SoftBank Group Corp. Consolidated Financial Report For the Fiscal Year Ended March 31, 2018
6
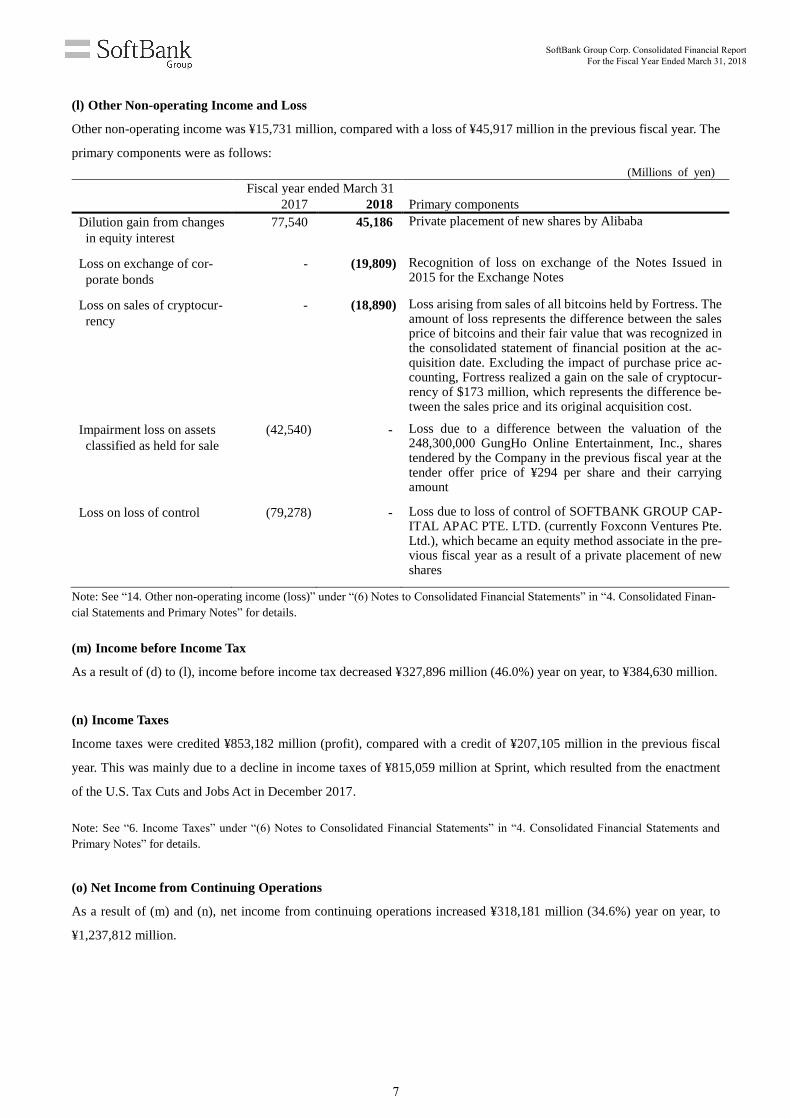
(l) Other Non-operating Income and Loss
Other non-operating income was ¥15,731 million, compared with a loss of ¥45,917 million in the previous fiscal year. The
primary components were as follows:
(Millions of yen)
Fiscal year ended March 31
2017 2018 Primary components
Dilution gain from changes
in equity interest
77,540 45,186 Private placement of new shares by Alibaba
Loss on exchange of cor-
porate bonds
- (19,809) Recognition of loss on exchange of the Notes Issued in 2015 for the Exchange Notes
Loss on sales of cryptocur-
rency
- (18,890) Loss arising from sales of all bitcoins held by Fortress. The amount of loss represents the difference between the sales price of bitcoins and their fair value that was recognized in the consolidated statement of financial position at the ac-quisition date. Excluding the impact of purchase price ac-counting, Fortress realized a gain on the sale of cryptocur-rency of $173 million, which represents the difference be-tween the sales price and its original acquisition cost.
Impairment loss on assets
classified as held for sale
(42,540) - Loss due to a difference between the valuation of the 248,300,000 GungHo Online Entertainment, Inc., shares tendered by the Company in the previous fiscal year at the tender offer price of ¥294 per share and their carrying amount
Loss on loss of control (79,278) - Loss due to loss of control of SOFTBANK GROUP CAP-ITAL APAC PTE. LTD. (currently Foxconn Ventures Pte. Ltd.), which became an equity method associate in the pre-vious fiscal year as a result of a private placement of new shares
Note: See “14. Other non-operating income (loss)” under “(6) Notes to Consolidated Financial Statements” in “4. Consolidated Finan-
cial Statements and Primary Notes” for details.
(m) Income before Income Tax
As a result of (d) to (l), income before income tax decreased ¥327,896 million (46.0%) year on year, to ¥384,630 million.
(n) Income Taxes
Income taxes were credited ¥853,182 million (profit), compared with a credit of ¥207,105 million in the previous fiscal
year. This was mainly due to a decline in income taxes of ¥815,059 million at Sprint, which resulted from the enactment
of the U.S. Tax Cuts and Jobs Act in December 2017.
Note: See “6. Income Taxes” under “(6) Notes to Consolidated Financial Statements” in “4. Consolidated Financial Statements and
Primary Notes” for details.
(o) Net Income from Continuing Operations
As a result of (m) and (n), net income from continuing operations increased ¥318,181 million (34.6%) year on year, to
¥1,237,812 million.
SoftBank Group Corp. Consolidated Financial Report For the Fiscal Year Ended March 31, 2018
7

Discontinued Operations
(p) Net Income from Discontinued Operations
Net income from discontinued operations was not recorded (income of ¥554,799 million in the previous fiscal year). In-
come after income tax from Supercell Oy of ¥28,246 million and after-tax gain on sale of Supercell shares of ¥526,553
million were recorded in the previous fiscal year. Supercell Oy was excluded from the scope of consolidation on July 29,
2016.
(q) Net Income
As a result of (o) and (p), net income decreased ¥236,618 million (16.0%) year on year, to ¥1,237,812 million.
(r) Net Income Attributable to Owners of the Parent
After deducting net income attributable to non-controlling interests such as those of Sprint and Yahoo Japan Corporation
from (q), net income attributable to owners of the parent decreased ¥387,331 million (27.2%) year on year, to ¥1,038,977
million.
Of Sprint’s decrease in income taxes of ¥815,059 million described in (n), ¥684,964 million was included in net income
attributable to owners of the parent, corresponding to the Company’s ownership stake in Sprint.
(s) Comprehensive Income
Comprehensive income decreased ¥104,369 million year on year, to ¥1,329,532 million. Of this, comprehensive income
attributable to owners of the parent decreased ¥232,830 million, to ¥1,153,128 million.
SoftBank Group Corp. Consolidated Financial Report For the Fiscal Year Ended March 31, 2018
8
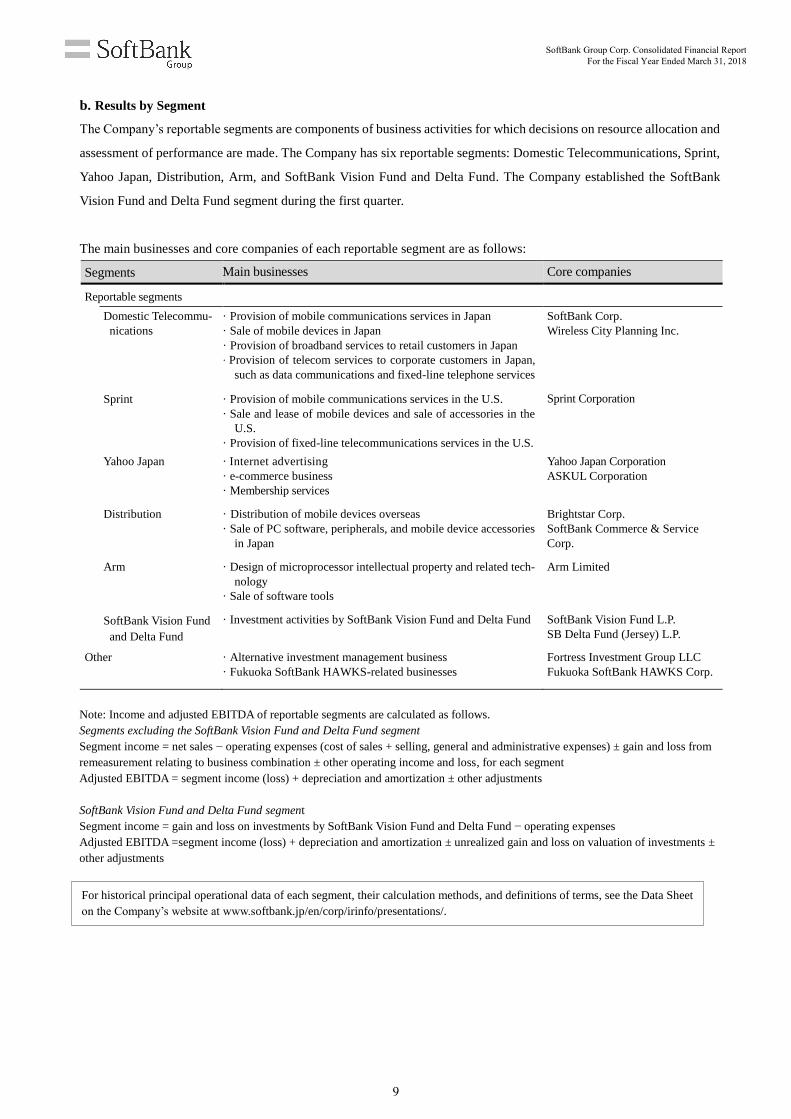
b. Results by Segment
The Company’s reportable segments are components of business activities for which decisions on resource allocation and
assessment of performance are made. The Company has six reportable segments: Domestic Telecommunications, Sprint,
Yahoo Japan, Distribution, Arm, and SoftBank Vision Fund and Delta Fund. The Company established the SoftBank
Vision Fund and Delta Fund segment during the first quarter.
The main businesses and core companies of each reportable segment are as follows:
Segments Main businesses Core companies
Reportable segments
Domestic Telecommu-
nications
· Provision of mobile communications services in Japan
· Sale of mobile devices in Japan
· Provision of broadband services to retail customers in Japan
· Provision of telecom services to corporate customers in Japan,
such as data communications and fixed-line telephone services
SoftBank Corp.
Wireless City Planning Inc.
Sprint · Provision of mobile communications services in the U.S.
· Sale and lease of mobile devices and sale of accessories in the
U.S.
· Provision of fixed-line telecommunications services in the U.S.
Sprint Corporation
Yahoo Japan · Internet advertising
· e-commerce business
· Membership services
Yahoo Japan Corporation
ASKUL Corporation
Distribution · Distribution of mobile devices overseas
· Sale of PC software, peripherals, and mobile device accessories
in Japan
Brightstar Corp.
SoftBank Commerce & Service
Corp.
Arm · Design of microprocessor intellectual property and related tech-
nology
· Sale of software tools
Arm Limited
SoftBank Vision Fund
and Delta Fund
· Investment activities by SoftBank Vision Fund and Delta Fund SoftBank Vision Fund L.P.
SB Delta Fund (Jersey) L.P.
Other · Alternative investment management business
· Fukuoka SoftBank HAWKS-related businesses
Fortress Investment Group LLC
Fukuoka SoftBank HAWKS Corp.
Note: Income and adjusted EBITDA of reportable segments are calculated as follows.
Segments excluding the SoftBank Vision Fund and Delta Fund segment
Segment income = net sales − operating expenses (cost of sales + selling, general and administrative expenses) ± gain and loss from
remeasurement relating to business combination ± other operating income and loss, for each segment
Adjusted EBITDA = segment income (loss) + depreciation and amortization ± other adjustments
SoftBank Vision Fund and Delta Fund segment
Segment income = gain and loss on investments by SoftBank Vision Fund and Delta Fund − operating expenses
Adjusted EBITDA =segment income (loss) + depreciation and amortization ± unrealized gain and loss on valuation of investments ±
other adjustments
For historical principal operational data of each segment, their calculation methods, and definitions of terms, see the Data Sheet
on the Company’s website at www.softbank.jp/en/corp/irinfo/presentations/.
SoftBank Group Corp. Consolidated Financial Report For the Fiscal Year Ended March 31, 2018
9
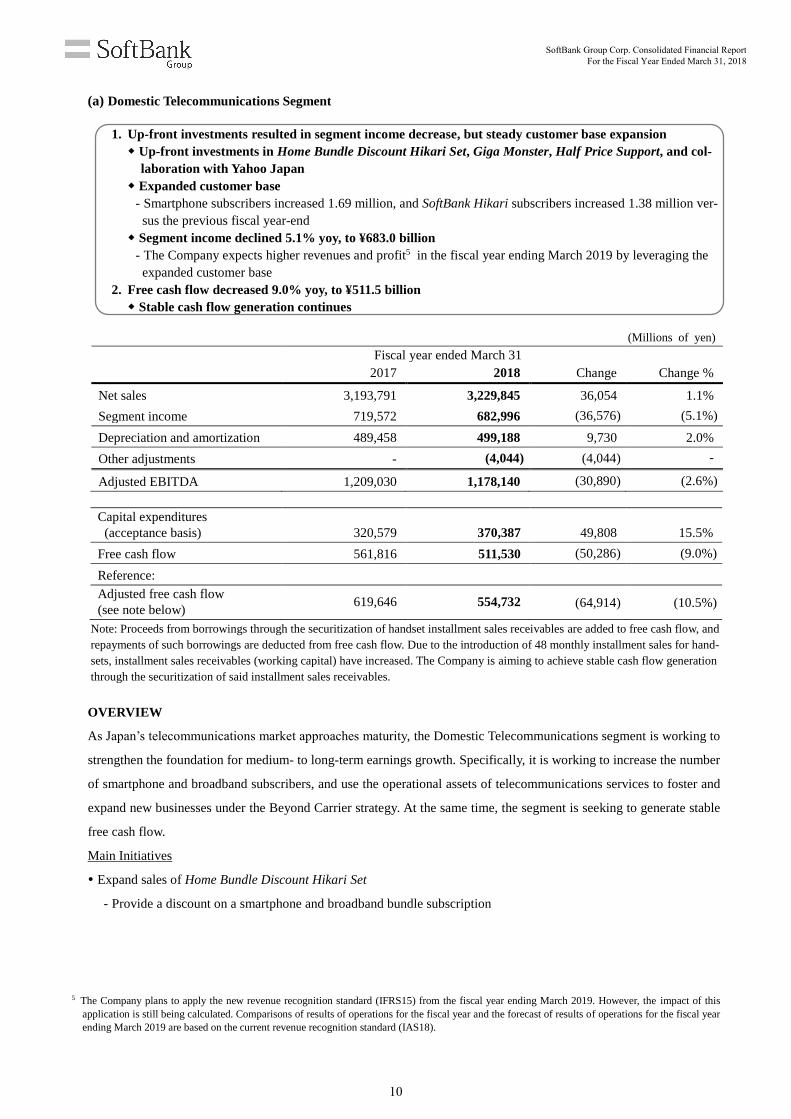
(a) Domestic Telecommunications Segment
1. Up-front investments resulted in segment income decrease, but steady customer base expansion
Up-front investments in Home Bundle Discount Hikari Set, Giga Monster, Half Price Support, and col-
laboration with Yahoo Japan
Expanded customer base
- Smartphone subscribers increased 1.69 million, and SoftBank Hikari subscribers increased 1.38 million ver-
sus the previous fiscal year-end
Segment income declined 5.1% yoy, to ¥683.0 billion
- The Company expects higher revenues and profit5 in the fiscal year ending March 2019 by leveraging the
expanded customer base
2. Free cash flow decreased 9.0% yoy, to ¥511.5 billion
Stable cash flow generation continues
(Millions of yen)
Fiscal year ended March 31
2017 2018 Change Change %
Net sales 3,193,791 3,229,845 36,054 1.1%
Segment income 719,572 682,996 (36,576) (5.1%)
Depreciation and amortization 489,458 499,188 9,730 2.0%
Other adjustments - (4,044) (4,044) -
Adjusted EBITDA 1,209,030 1,178,140 (30,890) (2.6%)
Capital expenditures
(acceptance basis) 320,579 370,387 49,808 15.5%
Free cash flow 561,816 511,530 (50,286) (9.0%)
Reference:
Adjusted free cash flow
(see note below) 619,646 554,732 (64,914) (10.5%)
Note: Proceeds from borrowings through the securitization of handset installment sales receivables are added to free cash flow, and
repayments of such borrowings are deducted from free cash flow. Due to the introduction of 48 monthly installment sales for hand-
sets, installment sales receivables (working capital) have increased. The Company is aiming to achieve stable cash flow generation
through the securitization of said installment sales receivables.
OVERVIEW
As Japan’s telecommunications market approaches maturity, the Domestic Telecommunications segment is working to
strengthen the foundation for medium- to long-term earnings growth. Specifically, it is working to increase the number
of smartphone and broadband subscribers, and use the operational assets of telecommunications services to foster and
expand new businesses under the Beyond Carrier strategy. At the same time, the segment is seeking to generate stable
free cash flow.
Main Initiatives
Expand sales of Home Bundle Discount Hikari Set
- Provide a discount on a smartphone and broadband bundle subscription
5 The Company plans to apply the new revenue recognition standard (IFRS15) from the fiscal year ending March 2019. However, the impact of this
application is still being calculated. Comparisons of results of operations for the fiscal year and the forecast of results of operations for the fiscal year
ending March 2019 are based on the current revenue recognition standard (IAS18).
SoftBank Group Corp. Consolidated Financial Report For the Fiscal Year Ended March 31, 2018
10
Promote SoftBank brand differentiation strategy
- High-volume flat-rate data plans Giga Monster (20 GB) and Ultra Giga Monster (50 GB)
- Half Price Support that effectively enables the purchase of smartphones at half price
Expand sales of sister brand Y!mobile proactively
Advance capital and operational tie-up with LINE MOBILE Corporation (became a consolidated subsidiary on April
2, 2018)
Collaborate with Yahoo Japan Corporation focusing on e-commerce
Expand business domain: Develop new businesses through the establishment of joint ventures or capital and opera-
tional tie-ups with the Company’s investees
- Participate in domestic operations of WeWork Companies Inc. through a joint venture with the company
- Provide cloud services through a joint venture with Alibaba
- Expand and improve security services for corporations through establishment of a joint venture with Cybereason Inc.
- Participate in the FinTech field through the establishment of joint venture with Mizuho Bank, Ltd.
- Establish an operational tie-up in the RPA6 field with RPA Holdings, Inc.
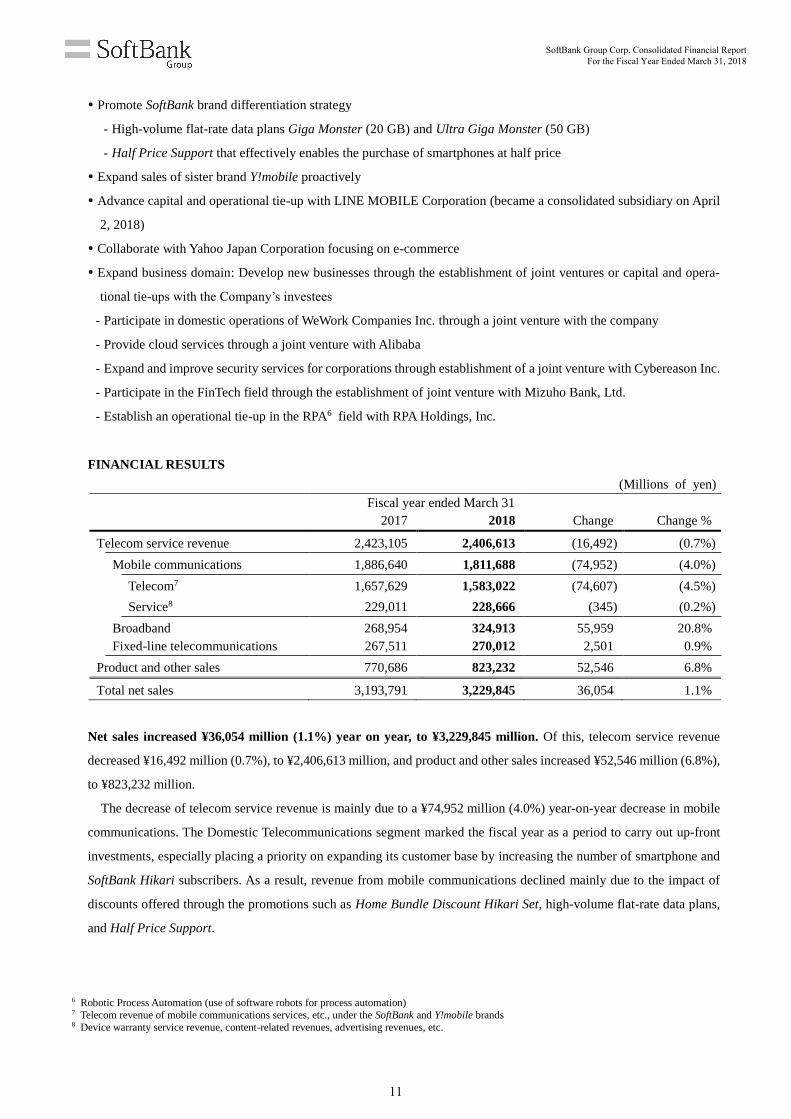
FINANCIAL RESULTS
(Millions of yen)
Fiscal year ended March 31
2017 2018 Change Change %
Telecom service revenue 2,423,105 2,406,613 (16,492) (0.7%)
Mobile communications 1,886,640 1,811,688 (74,952) (4.0%)
Telecom7 1,657,629 1,583,022 (74,607) (4.5%)
Service8 229,011 228,666 (345) (0.2%)
Broadband 268,954 324,913 55,959 20.8%
Fixed-line telecommunications 267,511 270,012 2,501 0.9%
Product and other sales 770,686 823,232 52,546 6.8%
Total net sales 3,193,791 3,229,845 36,054 1.1%
Net sales increased ¥36,054 million (1.1%) year on year, to ¥3,229,845 million. Of this, telecom service revenue
decreased ¥16,492 million (0.7%), to ¥2,406,613 million, and product and other sales increased ¥52,546 million (6.8%),
to ¥823,232 million.
The decrease of telecom service revenue is mainly due to a ¥74,952 million (4.0%) year-on-year decrease in mobile
communications. The Domestic Telecommunications segment marked the fiscal year as a period to carry out up-front
investments, especially placing a priority on expanding its customer base by increasing the number of smartphone and
SoftBank Hikari subscribers. As a result, revenue from mobile communications declined mainly due to the impact of
discounts offered through the promotions such as Home Bundle Discount Hikari Set, high-volume flat-rate data plans,
and Half Price Support.
6 Robotic Process Automation (use of software robots for process automation) 7 Telecom revenue of mobile communications services, etc., under the SoftBank and Y!mobile brands 8 Device warranty service revenue, content-related revenues, advertising revenues, etc.
SoftBank Group Corp. Consolidated Financial Report For the Fiscal Year Ended March 31, 2018
11
On the other hand, the customer base is steadily expanding as planned, driven by continued improvement in churn
rate and effective customer acquisition. The number of smartphone and SoftBank Hikari subscribers increased 1.69
million and 1.38 million, respectively, compared with the previous fiscal year. The Company expects to increase telecom
service revenue in the fiscal year ending March 2019 by leveraging the growing customer base.5
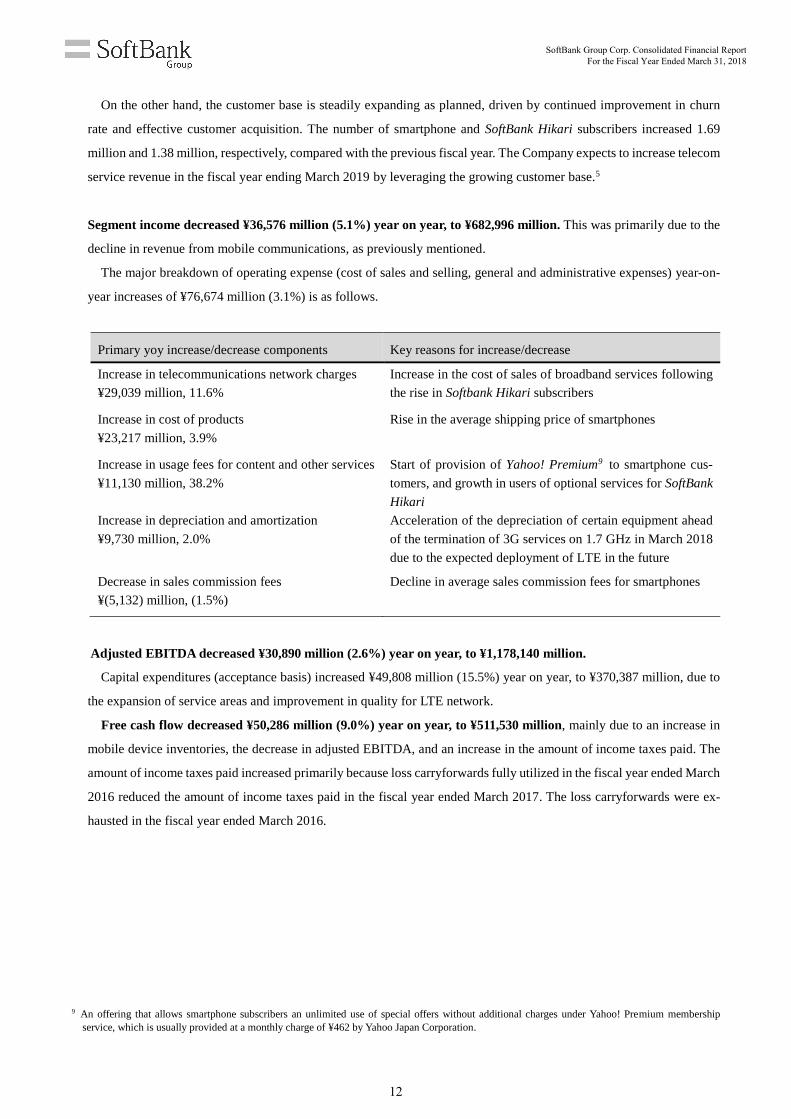
Segment income decreased ¥36,576 million (5.1%) year on year, to ¥682,996 million. This was primarily due to the
decline in revenue from mobile communications, as previously mentioned.
The major breakdown of operating expense (cost of sales and selling, general and administrative expenses) year-on-
year increases of ¥76,674 million (3.1%) is as follows.
Primary yoy increase/decrease components Key reasons for increase/decrease
Increase in telecommunications network charges
¥29,039 million, 11.6%
Increase in the cost of sales of broadband services following
the rise in Softbank Hikari subscribers
Increase in cost of products
¥23,217 million, 3.9%
Rise in the average shipping price of smartphones
Increase in usage fees for content and other services
¥11,130 million, 38.2%
Start of provision of Yahoo! Premium9 to smartphone cus-
tomers, and growth in users of optional services for SoftBank
Hikari
Increase in depreciation and amortization
¥9,730 million, 2.0%
Acceleration of the depreciation of certain equipment ahead
of the termination of 3G services on 1.7 GHz in March 2018
due to the expected deployment of LTE in the future
Decrease in sales commission fees
¥(5,132) million, (1.5%)
Decline in average sales commission fees for smartphones
Adjusted EBITDA decreased ¥30,890 million (2.6%) year on year, to ¥1,178,140 million.
Capital expenditures (acceptance basis) increased ¥49,808 million (15.5%) year on year, to ¥370,387 million, due to
the expansion of service areas and improvement in quality for LTE network.
Free cash flow decreased ¥50,286 million (9.0%) year on year, to ¥511,530 million, mainly due to an increase in
mobile device inventories, the decrease in adjusted EBITDA, and an increase in the amount of income taxes paid. The
amount of income taxes paid increased primarily because loss carryforwards fully utilized in the fiscal year ended March
2016 reduced the amount of income taxes paid in the fiscal year ended March 2017. The loss carryforwards were ex-
hausted in the fiscal year ended March 2016.
9 An offering that allows smartphone subscribers an unlimited use of special offers without additional charges under Yahoo! Premium membership
service, which is usually provided at a monthly charge of ¥462 by Yahoo Japan Corporation.
SoftBank Group Corp. Consolidated Financial Report For the Fiscal Year Ended March 31, 2018
12
Forecast for the Fiscal Year Ending March 2019
・ Higher revenues and profit (see note below)
・ Adjusted free cash flow: Minimum ¥500 billion
Note: The Company plans to apply the new revenue recognition standard (IFRS15) from the fiscal year ending March 2019. However,
the impact of this application is still being calculated. Comparisons of results of operations for the fiscal year and the forecast of
results of operations for the fiscal year ending March 2019 are based on the current revenue recognition standard (IAS18).
Reference: Impact of the Half Price Support program and 48 monthly installment sales
The Half Price Support program, which was launched in September 2017, enables customers to purchase eligible
smartphones in 48 monthly installments, with the remaining monthly payments waived if the customer trades in their
used handset to upgrade to a designated new model after 24 monthly installments.
Revenues
Negative impact: The estimated waiver amount of installment payments less the estimated trade-in value of handsets is
deducted from telecom revenue in the contract months. The impact is not included in the calculation of ARPU.
Positive impact: The monthly discount (negative impact on telecom revenue) from the 48-month installment payment
program is less than the discount from the 24-month installment payment program.
Cash flow from operating activities
Negative impact: The amount of handset payment received each month from the 48-month installment payment program
is less than that from the 24-month installment payment program.
Positive impact: The monthly discount (negative impact on telecom revenue) from the 48-month installment payment
program is less than the discount from the 24-month installment payment program.
OPERATIONS
Mobile Communications Service
Subscribers (Main Subscribers10)
(Thousands)
March 31, 2018 Change from March 31, 2017
Cumulative subscribers 33,175 775
Cumulative subscribers increased from the previous fiscal year-end due to smartphone net additions of 1,691,000.11
Regarding smartphones, the number of Y!mobile subscribers continued to grow steadily, while SoftBank subscribers also
grew due to a successful promotion encouraging feature phone users to switch to smartphones. In addition, tablets con-
tributed to net additions. However, subscribers to feature phones and mobile data communications devices declined
from the previous fiscal year-end. As for mobile data communications devices, a decrease in subscribers reflected the
termination of 3G service on 1.7 GHz as well as a decline in demand from customers with both smartphone and data
device subscription due to the introduction of Giga Monster for smartphones.
10 The number of main subscribers includes subscribers to the Wireless Home Phone service. Number of units sold, ARPU, and churn rate are calculated
and presented excluding this service. 11 Net addition of cumulative smartphone subscribers, including device upgrades.
SoftBank Group Corp. Consolidated Financial Report For the Fiscal Year Ended March 31, 2018
13
Cumulative subscribers at the fiscal year-end included 265,000 subscribers to Wireless Home Phone, a new home-
phone voice calling service using the mobile network, which was launched in July 2017.
Home Bundle Discount Hikari Set Applications
(Thousands)
March 31, 2018
Change from March 31, 2017
Mobile communications service 8,148 2,118
Broadband service 3,887 983
Number of Units Sold (Main Subscribers)
(Thousands)
Fiscal year ended
March 31, 2018 YoY Change
Number of units sold 11,056 (23)
New subscriptions 5,050 122
Device upgrades 6,006 (145)
The number of units sold for mobile devices of main subscribers decreased year on year, reflecting a decrease in the
number of feature phones and mobile data communications devices sold, despite an increase in sales of smartphones,
due to the reasons described above.
ARPU (Main Subscribers)
Fiscal year ended
March 31, 2018 YoY Change
Total ARPU ¥4,350 ¥(150)
Telecom ARPU ¥3,800 ¥(150)
Service ARPU ¥560 ¥0
Total ARPU declined year on year, mainly due to the dilutive impact of an increased proportion of Y!mobile smartphones,
which have a lower service charge. The increase of applications for Home Bundle Discount Hikari Set within the cumu-
lative subscriber base also lowered total ARPU by increasing the discount amount in telecom ARPU.
However, on a sequential basis, the discount amount in telecom ARPU for the Home Bundle Discount Hikari Set has
started to decrease since the three-month period ended December 31, 2017 (the “third quarter”).
Churn Rate (Main Subscribers)
Fiscal year ended
March 31, 2018 YoY Change
Phone churn rate 0.86% 0.03 pp improvement
Churn rate 1.22% 0.02 pp improvement
SoftBank Group Corp. Consolidated Financial Report For the Fiscal Year Ended March 31, 2018
14
The phone churn rate improved year on year, reflecting improved churn rates for both feature phones and smartphones.
The improvement in the feature phone churn rate reflected a decline in deactivations resulting from a successful promo-
tion encouraging feature phone users to switch to smartphones. The improvement in the smartphone churn rate is due
to the expansion of Home Bundle Discount Hikari Set.
Broadband Service
Subscribers
(Thousands)
March 31, 2018
Change from
March 31, 2017
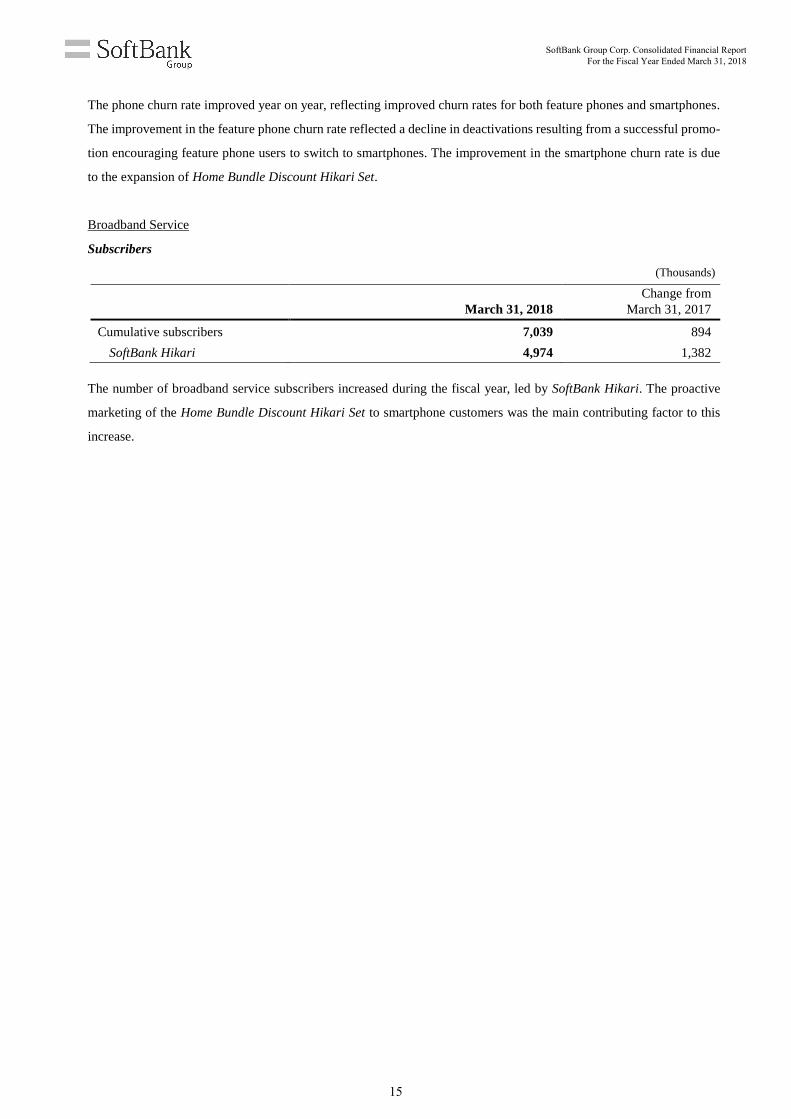
Cumulative subscribers 7,039 894
SoftBank Hikari 4,974 1,382
The number of broadband service subscribers increased during the fiscal year, led by SoftBank Hikari. The proactive
marketing of the Home Bundle Discount Hikari Set to smartphone customers was the main contributing factor to this
increase.
SoftBank Group Corp. Consolidated Financial Report For the Fiscal Year Ended March 31, 2018
15
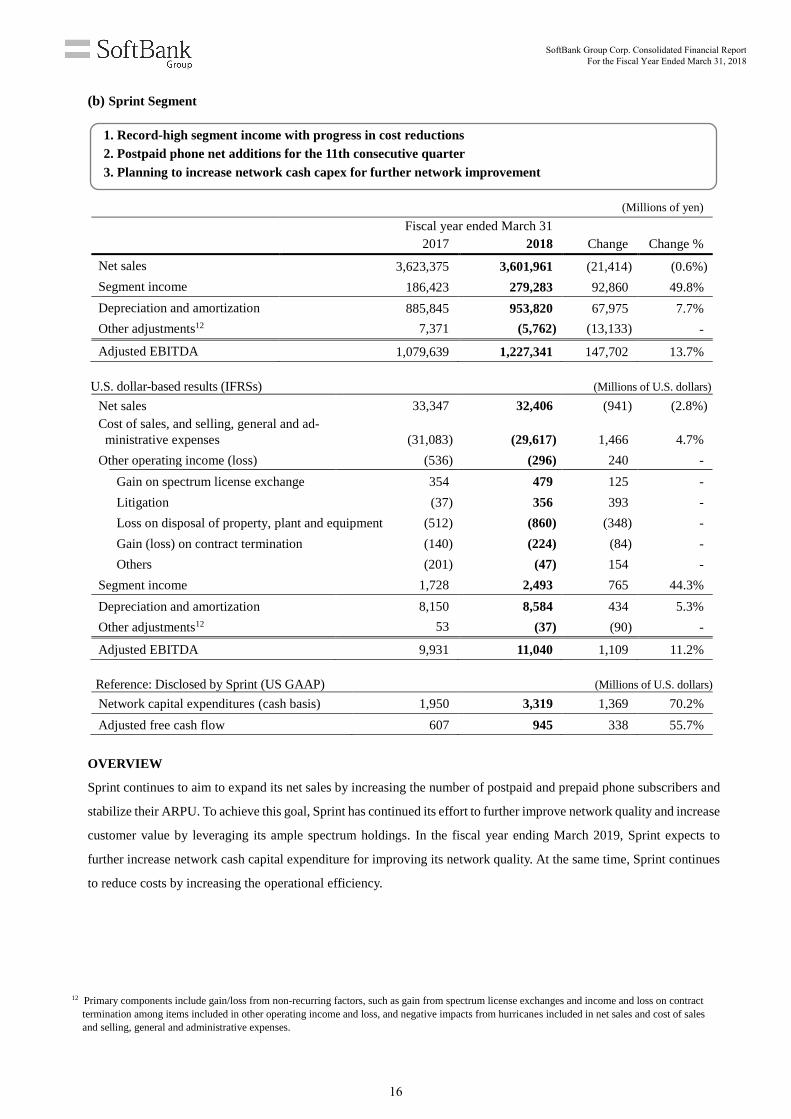
(b) Sprint Segment
1. Record-high segment income with progress in cost reductions
2. Postpaid phone net additions for the 11th consecutive quarter
3. Planning to increase network cash capex for further network improvement
(Millions of yen)
Fiscal year ended March 31
2017 2018 Change Change %
Net sales 3,623,375 3,601,961 (21,414) (0.6%)
Segment income 186,423 279,283 92,860 49.8%
Depreciation and amortization 885,845 953,820 67,975 7.7%
Other adjustments12 7,371 (5,762) (13,133) -
Adjusted EBITDA 1,079,639 1,227,341 147,702 13.7%
U.S. dollar-based results (IFRSs) (Millions of U.S. dollars)
Net sales 33,347 32,406 (941) (2.8%)
Cost of sales, and selling, general and ad-
ministrative expenses (31,083) (29,617) 1,466 4.7%
Other operating income (loss) (536) (296) 240 -
Gain on spectrum license exchange 354 479 125 -
Litigation (37) 356 393 -
Loss on disposal of property, plant and equipment (512) (860) (348) -
Gain (loss) on contract termination (140) (224) (84) -
Others (201) (47) 154 -
Segment income 1,728 2,493 765 44.3%
Depreciation and amortization 8,150 8,584 434 5.3%
Other adjustments12 53 (37) (90) -
Adjusted EBITDA 9,931 11,040 1,109 11.2%
Reference: Disclosed by Sprint (US GAAP) (Millions of U.S. dollars) Network capital expenditures (cash basis) 1,950 3,319 1,369 70.2%
Adjusted free cash flow 607 945 338 55.7%
OVERVIEW
Sprint continues to aim to expand its net sales by increasing the number of postpaid and prepaid phone subscribers and
stabilize their ARPU. To achieve this goal, Sprint has continued its effort to further improve network quality and increase
customer value by leveraging its ample spectrum holdings. In the fiscal year ending March 2019, Sprint expects to
further increase network cash capital expenditure for improving its network quality. At the same time, Sprint continues
to reduce costs by increasing the operational efficiency.
12 Primary components include gain/loss from non-recurring factors, such as gain from spectrum license exchanges and income and loss on contract
termination among items included in other operating income and loss, and negative impacts from hurricanes included in net sales and cost of sales
and selling, general and administrative expenses.
SoftBank Group Corp. Consolidated Financial Report For the Fiscal Year Ended March 31, 2018
16
FINANCIAL RESULTS
Results in U.S. dollars
Net sales decreased by $941 million (2.8%) year on year to $32,406 million. A decline in telecom service revenue
resulted from the introduction of sales promotions to acquire new customers and a change in the device insurance service.
This was partially offset by an increase in equipment rental revenue.
Segment income increased $765 million (44.3%) year on year, to $2,493 million. Operating expenses (cost of sales
and selling, general and administrative expenses) decreased $1,466 million (4.7%) year on year due to a decline in
expenses, mainly relating to the network and the change in the device insurance service, more than offsetting the de-
crease in net sales. In addition, other operating loss improved $240 million year on year.
Within other operating loss, loss on contract termination totaling $229 million was recorded in the fourth quarter,
when the contract cancellation was determined. Furthermore, under US GAAP, expenses are recorded in accordance
with the actual decommissioning of equipment. As a result, under IFRSs, operating loss of $115 million was recorded,
while under US GAAP, operating income of $236 million was recorded.
Adjusted EBITDA increased $1,109 million (11.2%) year on year, to $11,040 million.
Adjusted free cash flow increased $338 million (55.7%) year on year, to $945 million (disclosed by Sprint, US
GAAP). The increase reflected an increase in net cash provided by operating activities, despite an increase in expendi-
tures for the acquisition of rental devices and telecommunications network equipment. Going forward, in order to dif-
ferentiate itself from other operators, Sprint will invest more aggressively in its network and leverage its ample spectrum
holdings while building new cell sites to expand its coverage footprint.
Results in yen
In yen terms, net sales decreased ¥21,414 million (0.6%) year on year, to ¥3,601,961 million, and segment income
increased ¥92,860 million (49.8%) year on year, to ¥279,283 million. Adjusted EBITDA also increased ¥147,702 million
(13.7%) year on year, to ¥1,227,341 million.
SoftBank Group Corp. Consolidated Financial Report For the Fiscal Year Ended March 31, 2018
17
OPERATIONS
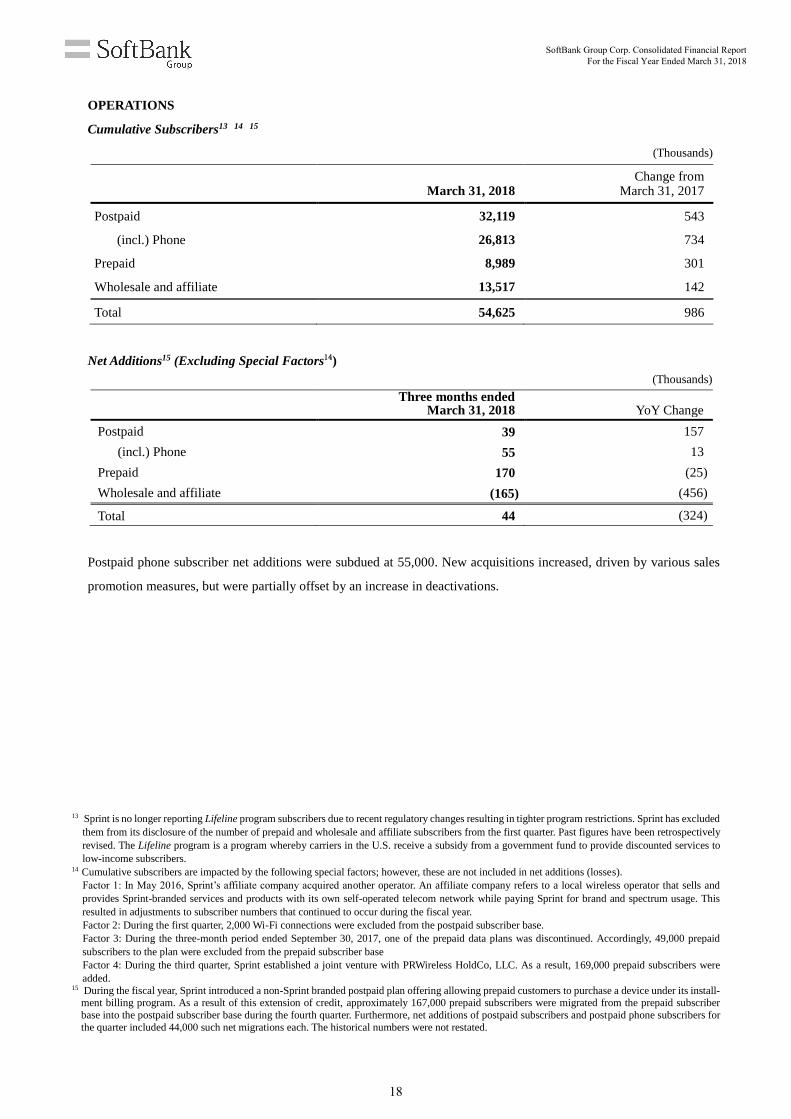
Cumulative Subscribers13 14 15
(Thousands)
March 31, 2018
Change from March 31, 2017
Postpaid 32,119 543
(incl.) Phone 26,813 734
Prepaid 8,989 301
Wholesale and affiliate 13,517 142
Total 54,625 986
Net Additions15 (Excluding Special Factors14)
(Thousands)
Postpaid phone subscriber net additions were subdued at 55,000. New acquisitions increased, driven by various sales
promotion measures, but were partially offset by an increase in deactivations.
13 Sprint is no longer reporting Lifeline program subscribers due to recent regulatory changes resulting in tighter program restrictions. Sprint has excluded
them from its disclosure of the number of prepaid and wholesale and affiliate subscribers from the first quarter. Past figures have been retrospectively
revised. The Lifeline program is a program whereby carriers in the U.S. receive a subsidy from a government fund to provide discounted services to
low-income subscribers. 14 Cumulative subscribers are impacted by the following special factors; however, these are not included in net additions (losses).
Factor 1: In May 2016, Sprint’s affiliate company acquired another operator. An affiliate company refers to a local wireless operator that sells and
provides Sprint-branded services and products with its own self-operated telecom network while paying Sprint for brand and spectrum usage. This
resulted in adjustments to subscriber numbers that continued to occur during the fiscal year.
Factor 2: During the first quarter, 2,000 Wi-Fi connections were excluded from the postpaid subscriber base.
Factor 3: During the three-month period ended September 30, 2017, one of the prepaid data plans was discontinued. Accordingly, 49,000 prepaid
subscribers to the plan were excluded from the prepaid subscriber base
Factor 4: During the third quarter, Sprint established a joint venture with PRWireless HoldCo, LLC. As a result, 169,000 prepaid subscribers were
added. 15 During the fiscal year, Sprint introduced a non-Sprint branded postpaid plan offering allowing prepaid customers to purchase a device under its install-
ment billing program. As a result of this extension of credit, approximately 167,000 prepaid subscribers were migrated from the prepaid subscriber
base into the postpaid subscriber base during the fourth quarter. Furthermore, net additions of postpaid subscribers and postpaid phone subscribers for
the quarter included 44,000 such net migrations each. The historical numbers were not restated.
Three months ended March 31, 2018 YoY Change
Postpaid 39 157
(incl.) Phone 55 13
Prepaid 170 (25)
Wholesale and affiliate (165) (456)
Total 44 (324)
SoftBank Group Corp. Consolidated Financial Report For the Fiscal Year Ended March 31, 2018
18
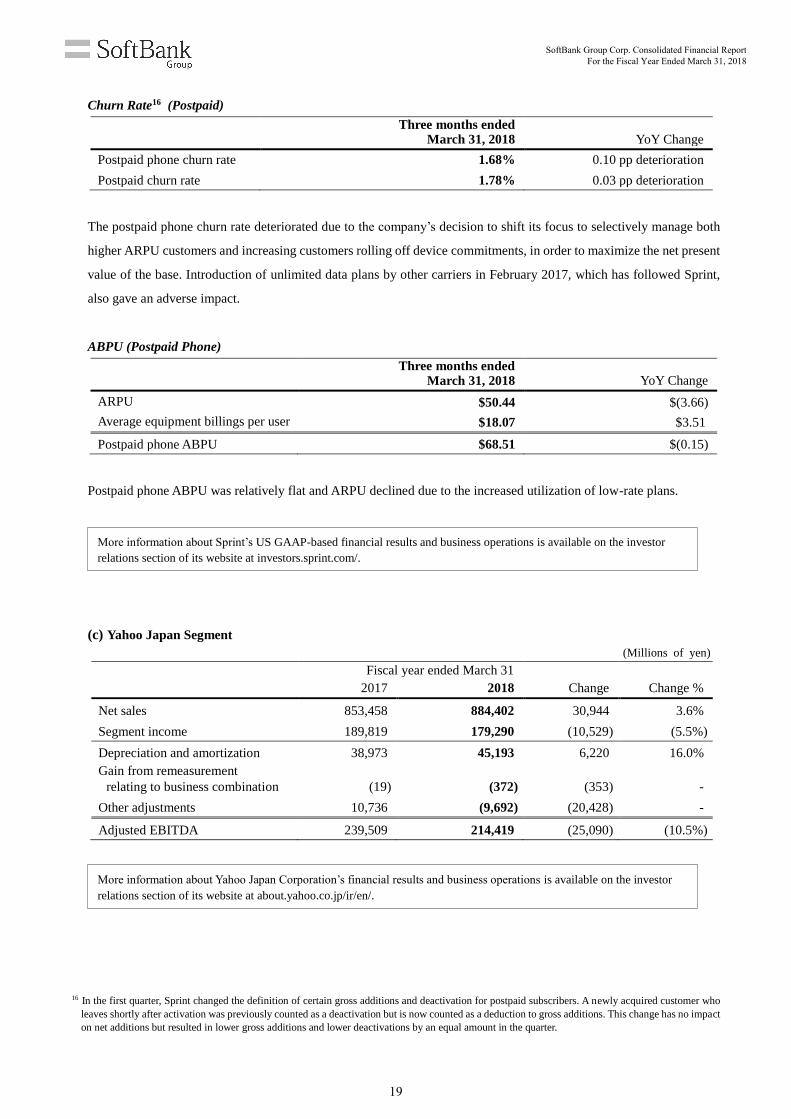
Churn Rate16 (Postpaid)
Three months ended March 31, 2018 YoY Change
Postpaid phone churn rate 1.68% 0.10 pp deterioration
Postpaid churn rate 1.78% 0.03 pp deterioration
The postpaid phone churn rate deteriorated due to the company’s decision to shift its focus to selectively manage both
higher ARPU customers and increasing customers rolling off device commitments, in order to maximize the net present
value of the base. Introduction of unlimited data plans by other carriers in February 2017, which has followed Sprint,
also gave an adverse impact.
ABPU (Postpaid Phone)
Three months ended March 31, 2018 YoY Change
ARPU $50.44 $(3.66)
Average equipment billings per user $18.07 $3.51
Postpaid phone ABPU $68.51 $(0.15)
Postpaid phone ABPU was relatively flat and ARPU declined due to the increased utilization of low-rate plans.
(c) Yahoo Japan Segment
(Millions of yen)
Fiscal year ended March 31
2017 2018 Change Change %
Net sales 853,458 884,402 30,944 3.6%
Segment income 189,819 179,290 (10,529) (5.5%)
Depreciation and amortization 38,973 45,193 6,220 16.0%
Gain from remeasurement
relating to business combination (19) (372) (353) -
Other adjustments 10,736 (9,692) (20,428) -
Adjusted EBITDA 239,509 214,419 (25,090) (10.5%)
16 In the first quarter, Sprint changed the definition of certain gross additions and deactivation for postpaid subscribers. A newly acquired customer who
leaves shortly after activation was previously counted as a deactivation but is now counted as a deduction to gross additions. This change has no impact
on net additions but resulted in lower gross additions and lower deactivations by an equal amount in the quarter.
More information about Sprint’s US GAAP-based financial results and business operations is available on the investor
relations section of its website at investors.sprint.com/.
More information about Yahoo Japan Corporation’s financial results and business operations is available on the investor
relations section of its website at about.yahoo.co.jp/ir/en/.
SoftBank Group Corp. Consolidated Financial Report For the Fiscal Year Ended March 31, 2018
19
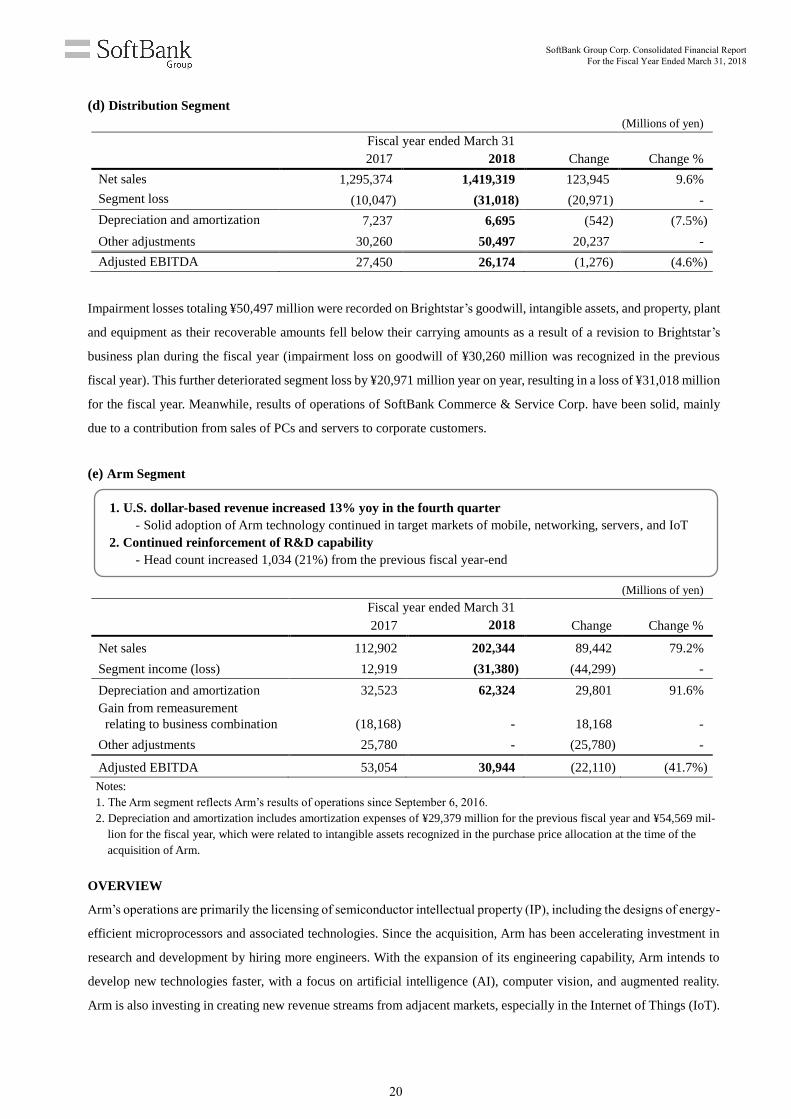
(d) Distribution Segment
(Millions of yen)
Fiscal year ended March 31
2017 2018 Change Change %
Net sales 1,295,374 1,419,319 123,945 9.6%
Segment loss (10,047) (31,018) (20,971) -
Depreciation and amortization 7,237 6,695 (542) (7.5%)
Other adjustments 30,260 50,497 20,237 -
Adjusted EBITDA 27,450 26,174 (1,276) (4.6%)
Impairment losses totaling ¥50,497 million were recorded on Brightstar’s goodwill, intangible assets, and property, plant
and equipment as their recoverable amounts fell below their carrying amounts as a result of a revision to Brightstar’s
business plan during the fiscal year (impairment loss on goodwill of ¥30,260 million was recognized in the previous
fiscal year). This further deteriorated segment loss by ¥20,971 million year on year, resulting in a loss of ¥31,018 million
for the fiscal year. Meanwhile, results of operations of SoftBank Commerce & Service Corp. have been solid, mainly
due to a contribution from sales of PCs and servers to corporate customers.
(e) Arm Segment
1. U.S. dollar-based revenue increased 13% yoy in the fourth quarter
- Solid adoption of Arm technology continued in target markets of mobile, networking, servers, and IoT
2. Continued reinforcement of R&D capability
- Head count increased 1,034 (21%) from the previous fiscal year-end
(Millions of yen)
Fiscal year ended March 31
2017 2018 Change Change %
Net sales 112,902 202,344 89,442 79.2%
Segment income (loss) 12,919 (31,380) (44,299) -
Depreciation and amortization 32,523 62,324 29,801 91.6%
Gain from remeasurement
relating to business combination (18,168) - 18,168 -
Other adjustments 25,780 - (25,780) -
Adjusted EBITDA 53,054 30,944 (22,110) (41.7%)
Notes:
1. The Arm segment reflects Arm’s results of operations since September 6, 2016.
2. Depreciation and amortization includes amortization expenses of ¥29,379 million for the previous fiscal year and ¥54,569 mil-
lion for the fiscal year, which were related to intangible assets recognized in the purchase price allocation at the time of the
acquisition of Arm.
OVERVIEW
Arm’s operations are primarily the licensing of semiconductor intellectual property (IP), including the designs of energy-
efficient microprocessors and associated technologies. Since the acquisition, Arm has been accelerating investment in
research and development by hiring more engineers. With the expansion of its engineering capability, Arm intends to
develop new technologies faster, with a focus on artificial intelligence (AI), computer vision, and augmented reality.
Arm is also investing in creating new revenue streams from adjacent markets, especially in the Internet of Things (IoT).
SoftBank Group Corp. Consolidated Financial Report For the Fiscal Year Ended March 31, 2018
20
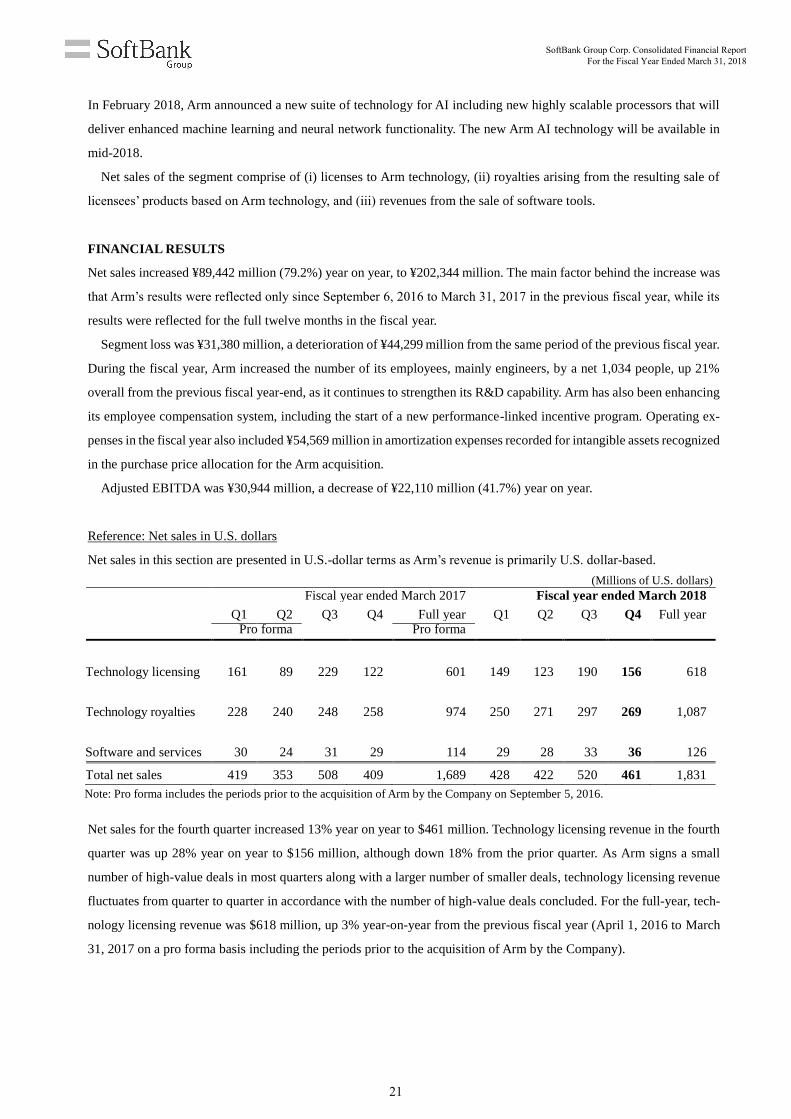
In February 2018, Arm announced a new suite of technology for AI including new highly scalable processors that will
deliver enhanced machine learning and neural network functionality. The new Arm AI technology will be available in
mid-2018.
Net sales of the segment comprise of (i) licenses to Arm technology, (ii) royalties arising from the resulting sale of
licensees’ products based on Arm technology, and (iii) revenues from the sale of software tools.
FINANCIAL RESULTS
Net sales increased ¥89,442 million (79.2%) year on year, to ¥202,344 million. The main factor behind the increase was
that Arm’s results were reflected only since September 6, 2016 to March 31, 2017 in the previous fiscal year, while its
results were reflected for the full twelve months in the fiscal year.
Segment loss was ¥31,380 million, a deterioration of ¥44,299 million from the same period of the previous fiscal year.
During the fiscal year, Arm increased the number of its employees, mainly engineers, by a net 1,034 people, up 21%
overall from the previous fiscal year-end, as it continues to strengthen its R&D capability. Arm has also been enhancing
its employee compensation system, including the start of a new performance-linked incentive program. Operating ex-
penses in the fiscal year also included ¥54,569 million in amortization expenses recorded for intangible assets recognized
in the purchase price allocation for the Arm acquisition.
Adjusted EBITDA was ¥30,944 million, a decrease of ¥22,110 million (41.7%) year on year.
Reference: Net sales in U.S. dollars
Net sales in this section are presented in U.S.-dollar terms as Arm’s revenue is primarily U.S. dollar-based.
(Millions of U.S. dollars)
Fiscal year ended March 2017 Fiscal year ended March 2018
Q1 Q2 Q3 Q4 Full year Q1 Q2 Q3 Q4 Full year
Pro forma Pro forma
Technology licensing 161 89 229 122 601 149 123 190 156 618
Technology royalties 228 240 248 258 974 250 271 297 269 1,087
Software and services 30 24 31 29 114 29 28 33 36 126
Total net sales 419 353 508 409 1,689 428 422 520 461 1,831
Note: Pro forma includes the periods prior to the acquisition of Arm by the Company on September 5, 2016.
Net sales for the fourth quarter increased 13% year on year to $461 million. Technology licensing revenue in the fourth
quarter was up 28% year on year to $156 million, although down 18% from the prior quarter. As Arm signs a small
number of high-value deals in most quarters along with a larger number of smaller deals, technology licensing revenue
fluctuates from quarter to quarter in accordance with the number of high-value deals concluded. For the full-year, tech-
nology licensing revenue was $618 million, up 3% year-on-year from the previous fiscal year (April 1, 2016 to March
31, 2017 on a pro forma basis including the periods prior to the acquisition of Arm by the Company).
SoftBank Group Corp. Consolidated Financial Report For the Fiscal Year Ended March 31, 2018
21
OPERATIONS
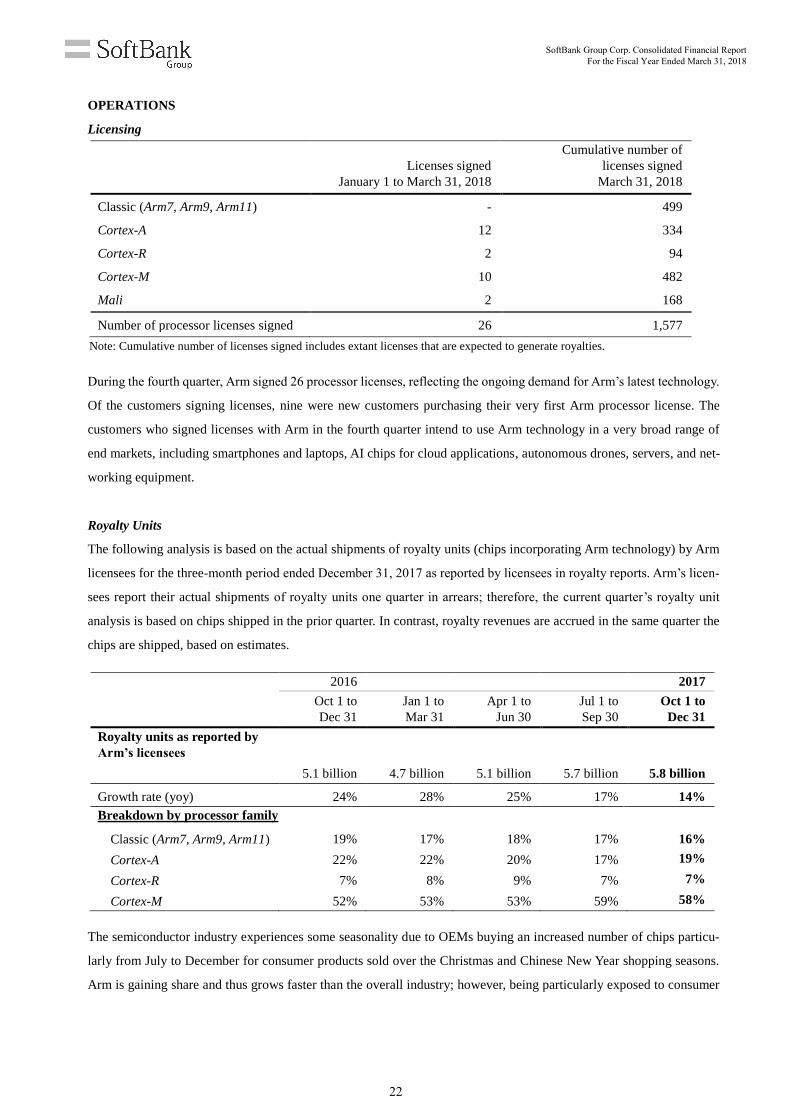
Licensing
Licenses signed
January 1 to March 31, 2018
Cumulative number of
licenses signed
March 31, 2018
Classic (Arm7, Arm9, Arm11) - 499
Cortex-A 12 334
Cortex-R 2 94
Cortex-M 10 482
Mali 2 168
Number of processor licenses signed 26 1,577
Note: Cumulative number of licenses signed includes extant licenses that are expected to generate royalties.
During the fourth quarter, Arm signed 26 processor licenses, reflecting the ongoing demand for Arm’s latest technology.
Of the customers signing licenses, nine were new customers purchasing their very first Arm processor license. The
customers who signed licenses with Arm in the fourth quarter intend to use Arm technology in a very broad range of
end markets, including smartphones and laptops, AI chips for cloud applications, autonomous drones, servers, and net-
working equipment.
Royalty Units
The following analysis is based on the actual shipments of royalty units (chips incorporating Arm technology) by Arm
licensees for the three-month period ended December 31, 2017 as reported by licensees in royalty reports. Arm’s licen-
sees report their actual shipments of royalty units one quarter in arrears; therefore, the current quarter’s royalty unit
analysis is based on chips shipped in the prior quarter. In contrast, royalty revenues are accrued in the same quarter the
chips are shipped, based on estimates.
2016 2017
Oct 1 to
Dec 31
Jan 1 to
Mar 31
Apr 1 to
Jun 30
Jul 1 to
Sep 30
Oct 1 to
Dec 31
Royalty units as reported by
Arm’s licensees
5.1 billion 4.7 billion 5.1 billion 5.7 billion 5.8 billion
Growth rate (yoy) 24% 28% 25% 17% 14%
Breakdown by processor family
Classic (Arm7, Arm9, Arm11) 19% 17% 18% 17% 16%
Cortex-A 22% 22% 20% 17% 19%
Cortex-R 7% 8% 9% 7% 7%
Cortex-M 52% 53% 53% 59% 58%
The semiconductor industry experiences some seasonality due to OEMs buying an increased number of chips particu-
larly from July to December for consumer products sold over the Christmas and Chinese New Year shopping seasons.
Arm is gaining share and thus grows faster than the overall industry; however, being particularly exposed to consumer
SoftBank Group Corp. Consolidated Financial Report For the Fiscal Year Ended March 31, 2018
22
electronics markets, Arm can also be impacted by the industry’s seasonality. As a result, unit shipments usually grow
throughout the year, although unit shipments in the three months ending March 31 can be lower than the prior quarter.
Arm’s licensees reported shipments of 5.8 billion Arm-based chips for the three-month period ended December 31,
2017. This reflects normal seasonality in terms of growth versus the previous quarter, up 2%, and strong growth of 14%
over the same period of the previous fiscal year reflecting strong demand for Arm-based chips.
More information about Arm, its business and its technology can be found on the investor relations section of Arm’s website
at www.arm.com/company/investors.
SoftBank Group Corp. Consolidated Financial Report For the Fiscal Year Ended March 31, 2018
23
(f) SoftBank Vision Fund and Delta Fund Segment
1. Segment income of ¥303.0 billion, driven by a valuation gain from a rise in NVIDIA share price
2. $29.7 billion17 invested to date in technology companies, including NVIDIA, Arm, and WeWork
3. Total committed capital of $97.7 billion
OVERVIEW
The Company established the SoftBank Vision Fund and Delta Fund segment as a new reportable segment during the
first quarter upon the first major closing of SoftBank Vision Fund on May 20, 2017. SoftBank Vision Fund aims to
invest in companies across a wide range of technology sectors.
Outline of Funds in the Segment
As of March 31, 2018
SoftBank Vision Fund Delta Fund
Major limited partnership SoftBank Vision Fund L.P. SB Delta Fund (Jersey) L.P.
Total committed capital $91.7 billion *1 $6.0 billion *1
SoftBank Group Corp.: $28.1 billion *2 SoftBank Group Corp.: $4.4 billion
Third-party investors: $63.6 billion *1 Third-party investors: $1.6 billion *1
Limited partners SoftBank Group Corp.
Public Investment Fund
Mubadala Investment Company
Apple
Foxconn Technology Group
Qualcomm Incorporated
Sharp Corporation
SoftBank Group Corp.
Mubadala Investment Company
General partners SVF GP (Jersey) Limited
(The Company’s wholly owned overseas
subsidiary)
SB Delta Fund GP (Jersey) Limited
(The Company’s wholly owned overseas
subsidiary)
Advisory company The Company’s wholly owned subsidiaries (in Japan and the U.S.)
Management company The Company’s wholly owned subsidiary (in the U.K.)
Investment period Five years from the final closing*3 of SoftBank Vision Fund (in principle)
Minimum fund life Twelve years from the final closing*3 of SoftBank Vision Fund (in principle)
Notes:
1. A portion of the capital committed by Mubadala Investment Company in both SoftBank Vision Fund and Delta Fund has been
committed in consideration of the total capital committed for both separate funds; hence, the total committed capital and remaining
committed capital for each separate fund will change according to the status of contribution by Mubadala Investment Company in
each fund.
2. The amount includes approximately $8.2 billion of an obligation to be satisfied by using Arm Limited shares.
3. The Company expects the final closing of SoftBank Vision Fund to complete in the three month period ending June 30, 2018. The
first and final closing of Delta Fund was completed on September 27, 2017.
17 This includes the amount of investments made by holding entities that are jointly held by SoftBank Vision Fund and the Company’s subsidiary.
SoftBank Group Corp. Consolidated Financial Report For the Fiscal Year Ended March 31, 2018
24
FINANCIAL RESULTS
(Millions of yen)
Fiscal year ended March 31
2017 2018
Gain and loss on investments at SoftBank Vision Fund and Delta Fund
Unrealized gain and loss on valuation of investments - 345,975
Interest and dividend income from investments - 6,120
Operating expenses - (49,114)
Segment income - 302,981
Depreciation and amortization - 1
Unrealized loss (gain) on valuation of investments - (345,975)
Other adjustments - 20,502
Adjusted EBITDA - (22,491)
Note: The segment’s results are calculated as follows:
Segment income = gain and loss on investments at SoftBank Vision Fund and Delta Fund - operating expenses
Adjusted EBITDA = segment income (loss) + depreciation and amortization ± unrealized gain and loss on valuation of investments
± other adjustments
Segment income was ¥302,981 million due to the recording of unrealized gain on valuation of investments of ¥345,975
million, mainly reflecting an increase in the fair value of NVIDIA shares as a result of a rise in its market price.
Adjusted EBITDA, which is calculated by deducting unrealized gain and loss on valuation of investments and other
adjustments from segment income, was negative ¥22,491 million. Other adjustments represents expenses related to the
establishment of SoftBank Vision Fund and Delta Fund, which was included in operating expenses.
Capital Deployment
As of March 31, 2018
(Billions of U.S. dollars)
Total The Company Third-party investors
Committed capital
SoftBank Vision Fund 91.7 *1 28.1 *2 63.6 *1
Delta Fund 6.0 *1 4.4 1.6 *1
Contributions from limited partners*3
SoftBank Vision Fund 21.2 6.4 14.8
Delta Fund 5.1 3.7 *4 1.4
Remaining committed capital
SoftBank Vision Fund 70.5 21.7 48.8
Delta Fund 0.9 *5 0.7 0.2
*5
Notes:
1. A portion of the capital committed by Mubadala Investment Company in both SoftBank Vision Fund and Delta Fund has been
committed in consideration of the total capital committed for both separate funds; hence, the total committed capital and remaining
committed capital for each separate fund will change according to the status of contribution by Mubadala Investment Company in
each fund.
2. The amount includes approximately $8.2 billion of an obligation to be satisfied by using Arm Limited shares.
3. The amount excludes the amount that was repaid to limited partners due to investment plan changes and other reasons after the
contribution had been made.
4. The amount includes the value of the investment securities in DiDi acquired by the Company and then transferred to Delta Fund.
The value of this transfer was offset against the amount of the Company's capital obligation to Delta Fund.
5. The remaining committed capital of third-party investors at Delta Fund may be used for SoftBank Vision Fund.
SoftBank Group Corp. Consolidated Financial Report For the Fiscal Year Ended March 31, 2018
25
Investment Status
As of the fiscal year-end, the total acquisition cost and fair value of investments of SoftBank Vision Fund and Delta
Fund was $29.7 billion and $33.0 billion, respectively (see note below). The following are the investees of the respective
funds, as of the fiscal year-end.
Fund Name Name (in alphabetical order) Business
SoftBank Vision Fund Arm Limited Semiconductor technology designer
Auto1 Group GmbH Used car wholesaler in Europe
Brain Corporation AI-based autonomous driving system devel-
oper
Fanatics Holdings, Inc. Online retailer of licensed sports merchandise
Flipkart Limited (Flipkart) e-commerce
Guardant Health, Inc. Cancer diagnosis through genomic analysis
HealthKonnect Medical and Health
Technology Management Company
Limited (Ping An Medical and Healthcare)
Managed care platform
Improbable Worlds Limited VR/AR development tools
Katerra Inc. End-to-end design & architecture technology
platform
MapBox Inc. Geographical information platform
Nauto, Inc. AI-based safe-driving support services
NVIDIA Corporation GPU developer
One97 Communications Limited
(PayTM)
Online payment services
Oravel Stays Private Limited
(OYO Rooms)
Hotel booking site
OSIsoft LLC Industrial IoT solutions
Ping An Healthcare and Technology
Company Limited
Online healthcare portal
Plenty United Inc. Indoor farm plant
Roivant Sciences Ltd. Biopharmaceutical drug developer
Slack Technologies, Inc. Business chat tool
Urban Compass, Inc. (Compass) Real estate big data platform
Vir Biotechnology, Inc. Pharmaceutical drug development for infec-
tious diseases using AI
Wag Labs, Inc On-demand dog walking & dog care app
WeWork Companies Inc.
(and its 3 affiliates)
Co-working space services
Zhongan Online P&C Insurance Co., Ltd Online insurance
Delta Fund Xiaoju Kuaizhi Inc. (DiDi) Ridesharing services
Note: SoftBank Vision Fund made some investments through investment holding entities that are subsidiaries, but not wholly owned
subsidiaries, of SoftBank Vision Fund. Regardless of the ownership percentage of SoftBank Vision Fund, all investments made through
the investment holding entities are calculated as investments made by SoftBank Vision Fund. Of the fair values of investments by
SoftBank Vision Fund and Delta Fund at the fiscal year-end, the values attributable to shareholders other than SoftBank Vision Fund
was $1.2 billion.
SoftBank Group Corp. Consolidated Financial Report For the Fiscal Year Ended March 31, 2018
26
Investments Transferred from the Company to SoftBank Vision Fund or Delta Fund
There are certain cases in which investments of SoftBank Vision Fund or Delta Fund are made through the Company
transferring its investment (the “Bridge Investments”) to respective funds. The Bridge Investments are transferred to
SoftBank Vision Fund or Delta Fund only if all the necessary approvals by the investment committee of respective funds,
among others, are obtained. The price of the Bridge Investments used for the transfer from the Company to SoftBank
Vision Fund or Delta Fund is based on fair values at the time the Company and respective funds agreed on the transfer.
As of the fiscal year-end, the total acquisition cost and fair value of the investments of SoftBank Vision Fund or Delta
Fund segment, including those agreed to be transferred from the Company out of the Bridge Investments, was $29.8
billion and $33.1 billion, respectively.
SoftBank Group Corp. Consolidated Financial Report For the Fiscal Year Ended March 31, 2018
27
(2) Overview of Financial Position
1. Progress on investments
- $29.7 billion invested to date by SoftBank Vision Fund and Delta Fund18
- Aside from the above, the Company invested a total of $12.9 billion (¥1,378.8 billion) in Uber and DiDi19
2. Refinancing and diversified financings excecuted to secure funds for investments with extended periods
- Borrowed ¥2,734.0 billion mainly for refinancing of the acquisition funds for Sprint and Arm
- Raised $8 billion by using Alibaba shares, $3.35 billion and €2.25 billion through issuance of foreign cur-
rency-denominated bonds, and $4.5 billion through issuance of the Hybrid Notes
3. Consolidation of The Japan Net Bank brought ¥818.8 billion in assets and ¥754.9 billion in liabilities on
February 1, 2018
(Millions of yen)
March 31, 2017 March 31, 2018 Change Change %
Total assets 24,634,212 31,180,466 6,546,254 26.6%
Total liabilities 20,164,482 24,907,444 4,742,962 23.5%
Total equity 4,469,730 6,273,022 1,803,292 40.3%
Reference: Exchange rate at the fiscal year-end used for translations
USD / JPY ¥112.19 ¥106.24 ¥(5.95) (5.3%)
GBP / JPY ¥140.08 ¥148.84 ¥8.76 6.3%
(a) Current Assets
(Millions of yen)
March 31, 2017 March 31, 2018 Change
Cash and cash equivalents 2,183,102 3,334,650 1,151,548
Trade and other receivables 2,121,619 2,314,353 192,734
Other financial assets 794,689 519,444 (275,245)
Inventories 341,344 362,041 20,697
Other current assets 283,221 344,374 61,153
Total current assets 5,723,975 6,874,862 1,150,887
Primary components of the change
Components Primary changes from the previous fiscal year-end
Cash and cash equivalents See “(3) Overview of Cash Flows” for details.
Other financial assets Commercial paper held for short-term investment and time deposits decreased at
Sprint.
18 This includes the amount of investments made by holding entities that are jointly held by SoftBank Vision Fund and the Company’s subsidiary. 19 The investments may be offered to SoftBank Vision Fund in the future, subject to applicable consent and regulatory and other approvals.
SoftBank Group Corp. Consolidated Financial Report For the Fiscal Year Ended March 31, 2018
28
(b) Non-current Assets
(Millions of yen)
March 31, 2017 March 31, 2018 Change
Property, plant and equipment 3,977,254 3,856,847 (120,407)
Goodwill 4,175,464 4,302,553 127,089
(incl.) Arm 2,691,818 2,860,738 168,920
Intangible assets 6,946,639 6,784,550 (162,089)
Investments accounted for using the
equity method 1,670,799 2,328,617 657,818
Investments from SoftBank Vision
Fund and Delta Fund accounted for
using FVTPL - 2,827,784 2,827,784
Investment securities 1,106,409 2,660,115 1,553,706
Other financial assets 445,858 676,392 230,534
Deferred tax assets 404,994 647,514 242,520
Other non-current assets 182,820 221,232 38,412
Total non-current assets 18,910,237 24,305,604 5,395,367
Primary components of the change
Components Primary changes from the previous fiscal year-end
Property, plant and equipment Telecommunications network equipment at SoftBank Corp. decreased due to de-
preciation exceeding the amount of newly acquired assets.
Goodwill Goodwill for Arm increased due to the weaker yen against the pound. On the other
hand, goodwill for Brightstar was impaired.
Intangible assets FCC licenses and others decreased due to a stronger yen against the U.S. dollar.
Meanwhile, the Company newly recognized management contracts of ¥115,333
million with the consolidation of Fortress.
Investments accounted for
using the equity method
In addition to recording gain on equity method investments, the consolidated car-
rying amount for Alibaba increased due to a weaker yen against the Chinese yuan.
Investments from SoftBank
Vision Fund and Delta Fund
accounted for using FVTPL
SoftBank Vision Fund made investments in WeWork Companies Inc. and Flipkart
Limited, among others, and Delta Fund made investments in DiDi. NVIDIA
shares were reclassified from “Investment securities” upon transfer from the
Company.
Investment securities NVIDIA shares were reclassified as “Investments from SoftBank Vision Fund
and Delta Fund accounted for using FVTPL” upon transfer to SoftBank Vision
Fund. On the other hand, the Company invested a total of $12.9 billion
(¥1,378,831 million) in Uber and DiDi, which may be offered to SoftBank Vision
Fund in the future.20
Deferred tax assets Deferred tax assets increased due to recording of a derivative loss in relation to a
collar transaction included in a variable prepaid forward contract for Alibaba
shares.
20 Subject to applicable consent and regulatory and other approvals
SoftBank Group Corp. Consolidated Financial Report For the Fiscal Year Ended March 31, 2018
29
(c) Current Liabilities
(Millions of yen)
March 31, 2017 March 31, 2018 Change
Interest-bearing debt 2,694,093 3,217,405 523,312
SoftBank Group Corp. 1,139,734 1,485,852 346,118
Short-term borrowings 505,802 771,275 265,473
Current portion of long-term borrowings 433,983 214,747 (219,236)
Current portion of corporate bonds 119,947 399,830 279,883
Others 80,002 100,000 19,998
Sprint 536,897 364,245 (172,652)
Current portion of long-term borrowings 307,178 164,466 (142,712)
Current portion of corporate bonds 219,365 190,396 (28,969)
Others 10,354 9,383 (971)
SoftBank Vision Fund and Delta Fund - 397,095 397,095
Short-term borrowings - 83,952 83,952
Current portion of long-term borrowings - 313,143 313,143
Others 1,017,462 970,213 (47,249)
Short-term borrowings 161,862 102,346 (59,516)
Current portion of long-term borrowings 387,349 401,349 14,000
Lease obligations 431,522 450,611 19,089
Others 36,729 15,907 (20,822)
Deposits for banking business - 684,091 684,091
Third-party interests in SoftBank Vision Fund
and Delta Fund - 40,713 40,713
Trade and other payables 1,607,453 1,816,010 208,557
Other financial liabilities 13,701 97,887 84,186
Income taxes payables 256,218 147,979 (108,239)
Provisions 56,362 65,709 9,347
Other current liabilities 599,096 658,961 59,865
Total current liabilities 5,226,923 6,728,755 1,501,832
Primary components of the change
Components Primary changes from the previous fiscal year-end
Interest-bearing debt SoftBank Group Corp.:
Short-term borrowings increased mainly through the use of a commitment line, and the cur-
rent portion of corporate bonds increased due to transfers from non-current liabilities.
Meanwhile, current portion of long-term borrowings decreased due to borrowing mainly for
refinancing of the acquisition funds for Sprint and Arm.
SoftBank Vision Fund and Delta Fund:
Borrowings were made mainly to increase the capital efficiency of investments.
Sprint:
Current portion of long-term borrowings decreased, mainly due to repayment of borrowings
utilizing certain network equipment.
Deposits for banking
business This was newly recognized in conjunction with The Japan Net Bank, which was formerly
an equity method associate, becoming a subsidiary of Yahoo Japan Corporation.
Income taxes payables The Company paid income taxes, such as those on gains from the sale of Supercell Oy
shares and others, which were recognized and accrued at the previous fiscal year-end.
SoftBank Group Corp. Consolidated Financial Report For the Fiscal Year Ended March 31, 2018
30
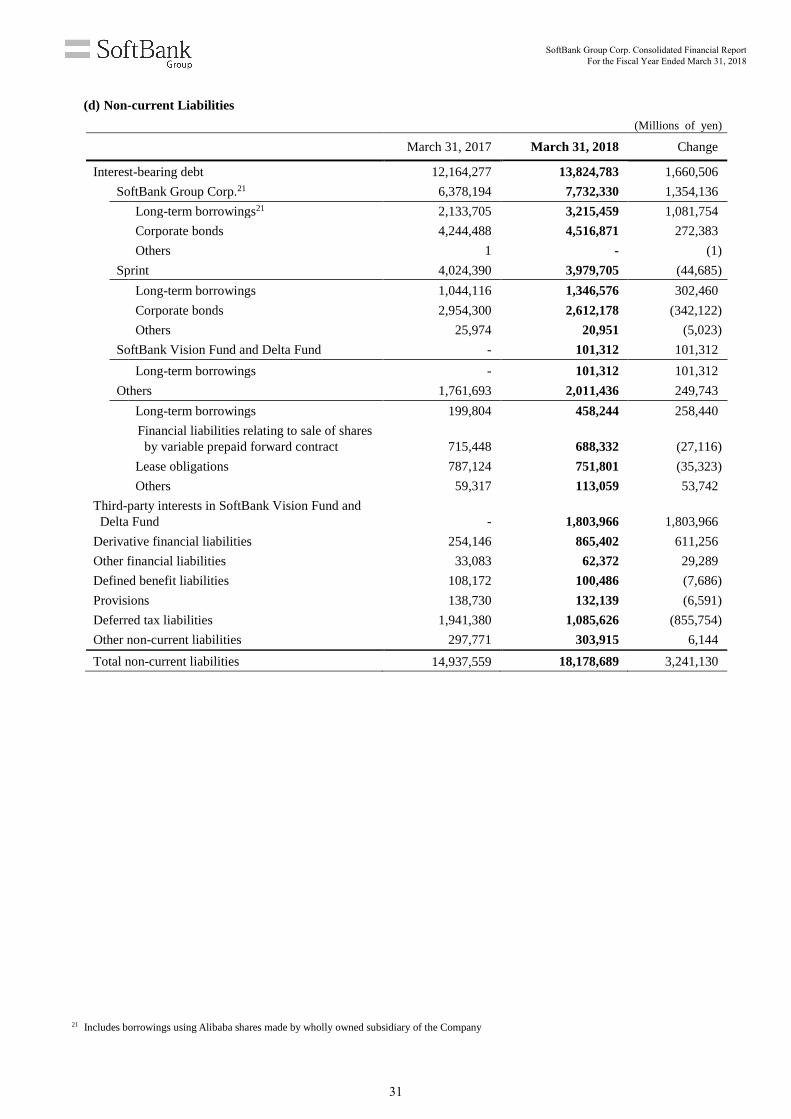
(d) Non-current Liabilities
(Millions of yen)
March 31, 2017 March 31, 2018 Change
Interest-bearing debt 12,164,277 13,824,783 1,660,506
SoftBank Group Corp.21 6,378,194 7,732,330 1,354,136
Long-term borrowings21 2,133,705 3,215,459 1,081,754
Corporate bonds 4,244,488 4,516,871 272,383
Others 1 - (1)
Sprint 4,024,390 3,979,705 (44,685)
Long-term borrowings 1,044,116 1,346,576 302,460
Corporate bonds 2,954,300 2,612,178 (342,122)
Others 25,974 20,951 (5,023)
SoftBank Vision Fund and Delta Fund - 101,312 101,312
Long-term borrowings - 101,312 101,312
Others 1,761,693 2,011,436 249,743
Long-term borrowings 199,804 458,244 258,440
Financial liabilities relating to sale of shares
by variable prepaid forward contract 715,448 688,332 (27,116)
Lease obligations 787,124 751,801 (35,323)
Others 59,317 113,059 53,742
Third-party interests in SoftBank Vision Fund and
Delta Fund - 1,803,966 1,803,966
Derivative financial liabilities 254,146 865,402 611,256
Other financial liabilities 33,083 62,372 29,289
Defined benefit liabilities 108,172 100,486 (7,686)
Provisions 138,730 132,139 (6,591)
Deferred tax liabilities 1,941,380 1,085,626 (855,754)
Other non-current liabilities 297,771 303,915 6,144
Total non-current liabilities 14,937,559 18,178,689 3,241,130
21 Includes borrowings using Alibaba shares made by wholly owned subsidiary of the Company
SoftBank Group Corp. Consolidated Financial Report For the Fiscal Year Ended March 31, 2018
31
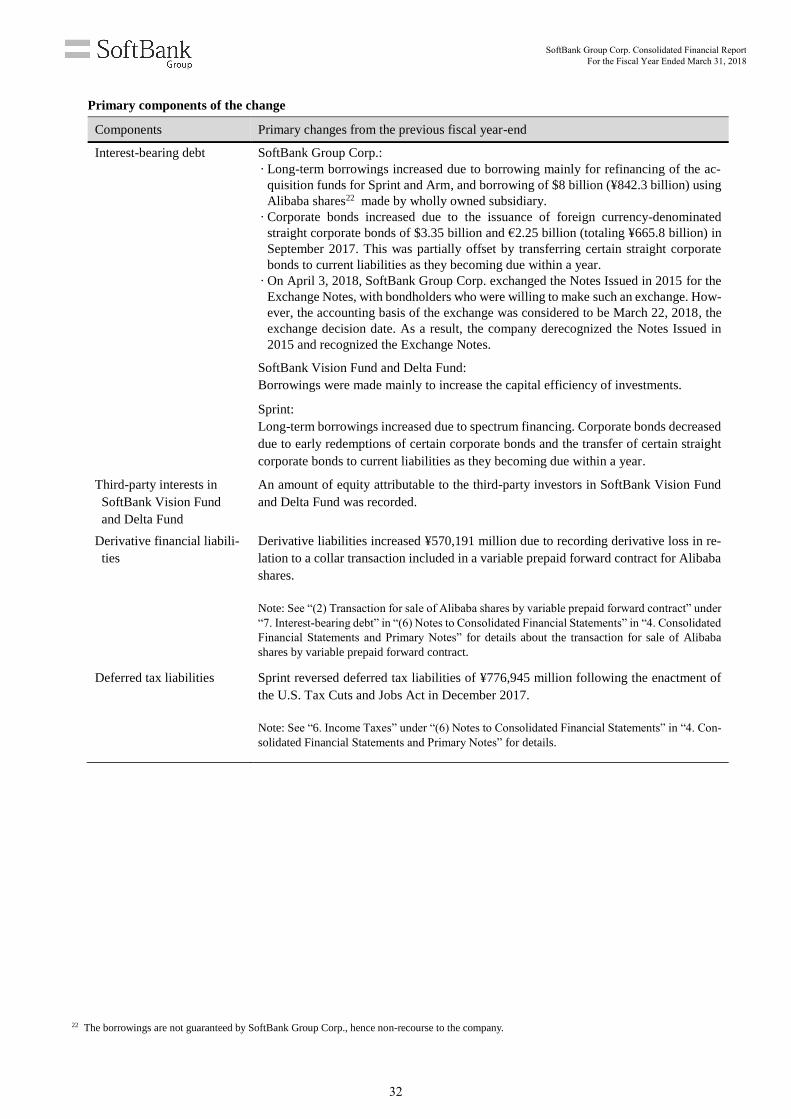
Primary components of the change
Components Primary changes from the previous fiscal year-end
Interest-bearing debt SoftBank Group Corp.:
· Long-term borrowings increased due to borrowing mainly for refinancing of the ac-
quisition funds for Sprint and Arm, and borrowing of $8 billion (¥842.3 billion) using
Alibaba shares22 made by wholly owned subsidiary.
· Corporate bonds increased due to the issuance of foreign currency-denominated
straight corporate bonds of $3.35 billion and €2.25 billion (totaling ¥665.8 billion) in
September 2017. This was partially offset by transferring certain straight corporate
bonds to current liabilities as they becoming due within a year.
· On April 3, 2018, SoftBank Group Corp. exchanged the Notes Issued in 2015 for the
Exchange Notes, with bondholders who were willing to make such an exchange. How-
ever, the accounting basis of the exchange was considered to be March 22, 2018, the
exchange decision date. As a result, the company derecognized the Notes Issued in
2015 and recognized the Exchange Notes.
SoftBank Vision Fund and Delta Fund:
Borrowings were made mainly to increase the capital efficiency of investments.
Sprint:
Long-term borrowings increased due to spectrum financing. Corporate bonds decreased
due to early redemptions of certain corporate bonds and the transfer of certain straight
corporate bonds to current liabilities as they becoming due within a year.
Third-party interests in
SoftBank Vision Fund
and Delta Fund
An amount of equity attributable to the third-party investors in SoftBank Vision Fund
and Delta Fund was recorded.
Derivative financial liabili-
ties
Derivative liabilities increased ¥570,191 million due to recording derivative loss in re-
lation to a collar transaction included in a variable prepaid forward contract for Alibaba
shares.
Note: See “(2) Transaction for sale of Alibaba shares by variable prepaid forward contract” under
“7. Interest-bearing debt” in “(6) Notes to Consolidated Financial Statements” in “4. Consolidated
Financial Statements and Primary Notes” for details about the transaction for sale of Alibaba
shares by variable prepaid forward contract.
Deferred tax liabilities Sprint reversed deferred tax liabilities of ¥776,945 million following the enactment of
the U.S. Tax Cuts and Jobs Act in December 2017.
Note: See “6. Income Taxes” under “(6) Notes to Consolidated Financial Statements” in “4. Con-
solidated Financial Statements and Primary Notes” for details.
22 The borrowings are not guaranteed by SoftBank Group Corp., hence non-recourse to the company.
SoftBank Group Corp. Consolidated Financial Report For the Fiscal Year Ended March 31, 2018
32
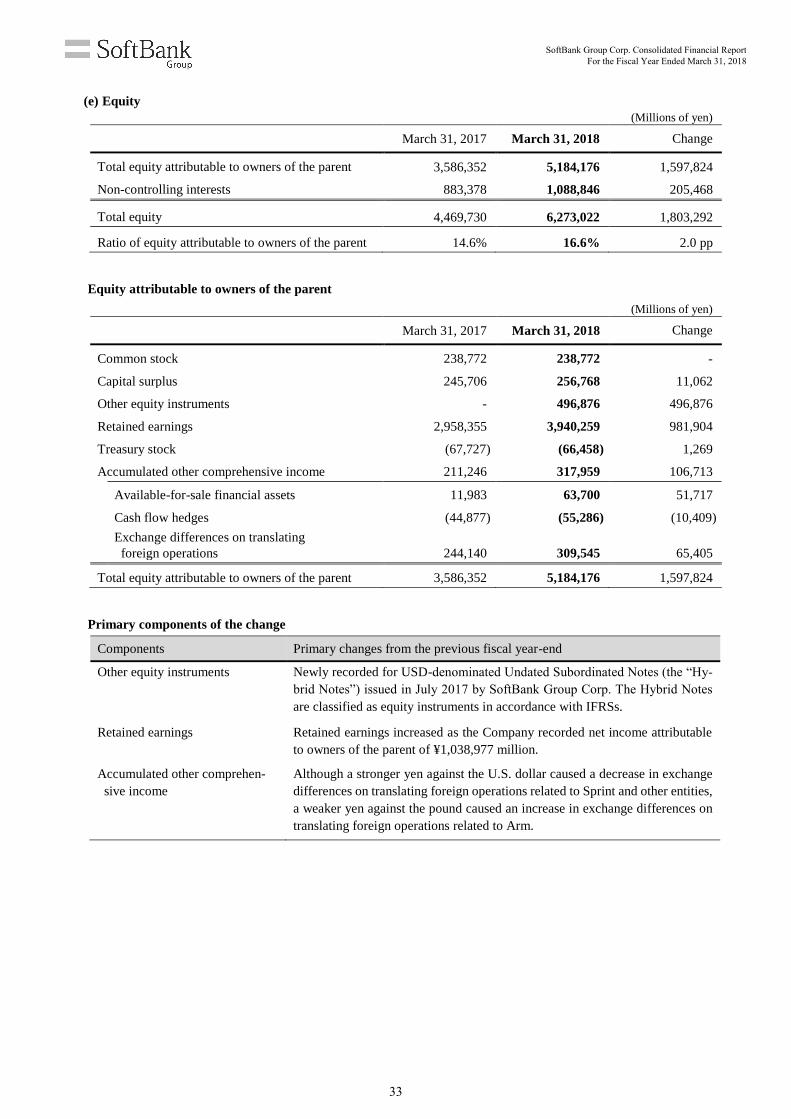
(e) Equity
(Millions of yen)
March 31, 2017 March 31, 2018 Change
Total equity attributable to owners of the parent 3,586,352 5,184,176 1,597,824
Non-controlling interests 883,378 1,088,846 205,468
Total equity 4,469,730 6,273,022 1,803,292
Ratio of equity attributable to owners of the parent 14.6% 16.6% 2.0 pp
Equity attributable to owners of the parent
(Millions of yen)
March 31, 2017 March 31, 2018 Change
Common stock 238,772 238,772 -
Capital surplus 245,706 256,768 11,062
Other equity instruments - 496,876 496,876
Retained earnings 2,958,355 3,940,259 981,904
Treasury stock (67,727) (66,458) 1,269
Accumulated other comprehensive income 211,246 317,959 106,713
Available-for-sale financial assets 11,983 63,700 51,717
Cash flow hedges (44,877) (55,286) (10,409)
Exchange differences on translating
foreign operations 244,140 309,545 65,405
Total equity attributable to owners of the parent 3,586,352 5,184,176 1,597,824
Primary components of the change
Components Primary changes from the previous fiscal year-end
Other equity instruments Newly recorded for USD-denominated Undated Subordinated Notes (the “Hy-
brid Notes”) issued in July 2017 by SoftBank Group Corp. The Hybrid Notes
are classified as equity instruments in accordance with IFRSs.
Retained earnings Retained earnings increased as the Company recorded net income attributable
to owners of the parent of ¥1,038,977 million.
Accumulated other comprehen-
sive income
Although a stronger yen against the U.S. dollar caused a decrease in exchange
differences on translating foreign operations related to Sprint and other entities,
a weaker yen against the pound caused an increase in exchange differences on
translating foreign operations related to Arm.
SoftBank Group Corp. Consolidated Financial Report For the Fiscal Year Ended March 31, 2018
33
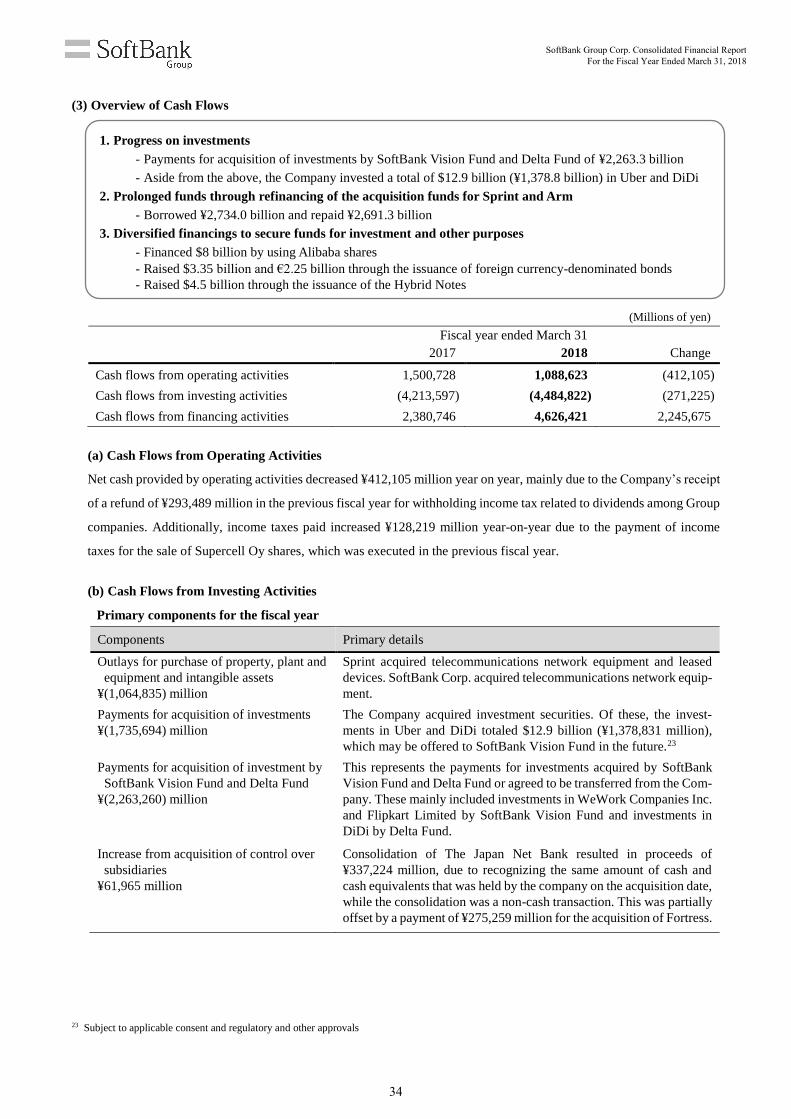
(3) Overview of Cash Flows
1. Progress on investments
- Payments for acquisition of investments by SoftBank Vision Fund and Delta Fund of ¥2,263.3 billion
- Aside from the above, the Company invested a total of $12.9 billion (¥1,378.8 billion) in Uber and DiDi
2. Prolonged funds through refinancing of the acquisition funds for Sprint and Arm
- Borrowed ¥2,734.0 billion and repaid ¥2,691.3 billion
3. Diversified financings to secure funds for investment and other purposes
- Financed $8 billion by using Alibaba shares
- Raised $3.35 billion and €2.25 billion through the issuance of foreign currency-denominated bonds
- Raised $4.5 billion through the issuance of the Hybrid Notes
(Millions of yen)
Fiscal year ended March 31
2017 2018 Change
Cash flows from operating activities 1,500,728 1,088,623 (412,105)
Cash flows from investing activities (4,213,597) (4,484,822) (271,225)
Cash flows from financing activities 2,380,746 4,626,421 2,245,675
(a) Cash Flows from Operating Activities
Net cash provided by operating activities decreased ¥412,105 million year on year, mainly due to the Company’s receipt
of a refund of ¥293,489 million in the previous fiscal year for withholding income tax related to dividends among Group
companies. Additionally, income taxes paid increased ¥128,219 million year-on-year due to the payment of income
taxes for the sale of Supercell Oy shares, which was executed in the previous fiscal year.
(b) Cash Flows from Investing Activities
Primary components for the fiscal year
Components Primary details
Outlays for purchase of property, plant and
equipment and intangible assets
¥(1,064,835) million
Sprint acquired telecommunications network equipment and leased
devices. SoftBank Corp. acquired telecommunications network equip-
ment.
Payments for acquisition of investments
¥(1,735,694) million
The Company acquired investment securities. Of these, the invest-
ments in Uber and DiDi totaled $12.9 billion (¥1,378,831 million),
which may be offered to SoftBank Vision Fund in the future.23
Payments for acquisition of investment by
SoftBank Vision Fund and Delta Fund
¥(2,263,260) million
This represents the payments for investments acquired by SoftBank
Vision Fund and Delta Fund or agreed to be transferred from the Com-
pany. These mainly included investments in WeWork Companies Inc.
and Flipkart Limited by SoftBank Vision Fund and investments in
DiDi by Delta Fund.
Increase from acquisition of control over
subsidiaries
¥61,965 million
Consolidation of The Japan Net Bank resulted in proceeds of
¥337,224 million, due to recognizing the same amount of cash and
cash equivalents that was held by the company on the acquisition date,
while the consolidation was a non-cash transaction. This was partially
offset by a payment of ¥275,259 million for the acquisition of Fortress.
23 Subject to applicable consent and regulatory and other approvals
SoftBank Group Corp. Consolidated Financial Report For the Fiscal Year Ended March 31, 2018
34
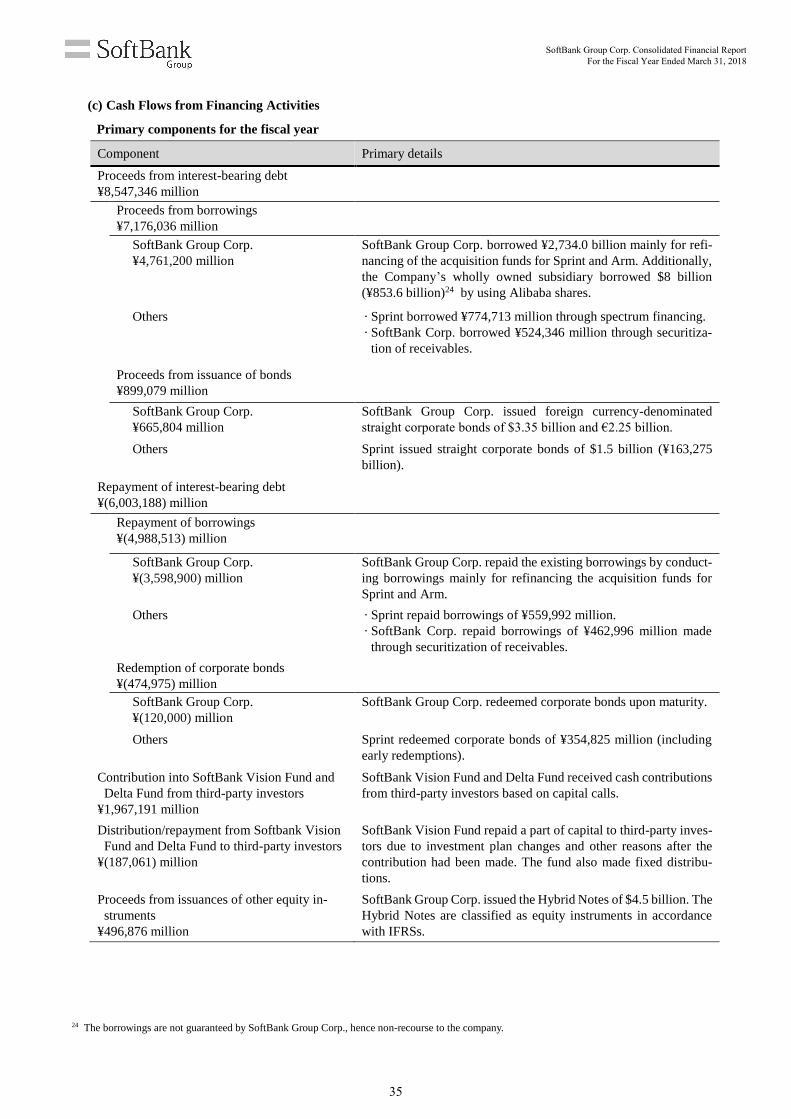
(c) Cash Flows from Financing Activities
Primary components for the fiscal year
Component Primary details
Proceeds from interest-bearing debt
¥8,547,346 million
Proceeds from borrowings
¥7,176,036 million
SoftBank Group Corp.
¥4,761,200 million
SoftBank Group Corp. borrowed ¥2,734.0 billion mainly for refi-
nancing of the acquisition funds for Sprint and Arm. Additionally,
the Company’s wholly owned subsidiary borrowed $8 billion
(¥853.6 billion)24 by using Alibaba shares.
Others
· Sprint borrowed ¥774,713 million through spectrum financing.
· SoftBank Corp. borrowed ¥524,346 million through securitiza-
tion of receivables.
Proceeds from issuance of bonds
¥899,079 million
SoftBank Group Corp.
¥665,804 million
SoftBank Group Corp. issued foreign currency-denominated
straight corporate bonds of $3.35 billion and €2.25 billion.
Others
Sprint issued straight corporate bonds of $1.5 billion (¥163,275
billion).
Repayment of interest-bearing debt
¥(6,003,188) million
Repayment of borrowings
¥(4,988,513) million
SoftBank Group Corp.
¥(3,598,900) million
SoftBank Group Corp. repaid the existing borrowings by conduct-
ing borrowings mainly for refinancing the acquisition funds for
Sprint and Arm.
Others
· Sprint repaid borrowings of ¥559,992 million.
· SoftBank Corp. repaid borrowings of ¥462,996 million made
through securitization of receivables.
Redemption of corporate bonds
¥(474,975) million
SoftBank Group Corp.
¥(120,000) million
SoftBank Group Corp. redeemed corporate bonds upon maturity.
Others
Sprint redeemed corporate bonds of ¥354,825 million (including
early redemptions).
Contribution into SoftBank Vision Fund and
Delta Fund from third-party investors
¥1,967,191 million
SoftBank Vision Fund and Delta Fund received cash contributions
from third-party investors based on capital calls.
Distribution/repayment from Softbank Vision
Fund and Delta Fund to third-party investors
¥(187,061) million
SoftBank Vision Fund repaid a part of capital to third-party inves-
tors due to investment plan changes and other reasons after the
contribution had been made. The fund also made fixed distribu-
tions.
Proceeds from issuances of other equity in-
struments
¥496,876 million
SoftBank Group Corp. issued the Hybrid Notes of $4.5 billion. The
Hybrid Notes are classified as equity instruments in accordance
with IFRSs.
24 The borrowings are not guaranteed by SoftBank Group Corp., hence non-recourse to the company.
SoftBank Group Corp. Consolidated Financial Report For the Fiscal Year Ended March 31, 2018
35
(4) Forecasts
The Company does not give forecasts of consolidated results of operations as they are difficult to project due to numerous
uncertainties affecting earnings.
For a forecast of the Domestic Telecommunications segment in the fiscal year ending March 2019, see “Forecast for the
Fiscal Year Ending March 2019” under “Financial Results” in “(a) Domestic Telecommunications Segment” in “b. Results
by Segment” in “ (1) Overview of Results of Operations.”
2. Basic Approach to the Selection of Accounting Standards
The Company has adopted International Financial Reporting Standards (“IFRSs”).
SoftBank Group Corp. Consolidated Financial Report For the Fiscal Year Ended March 31, 2018
36
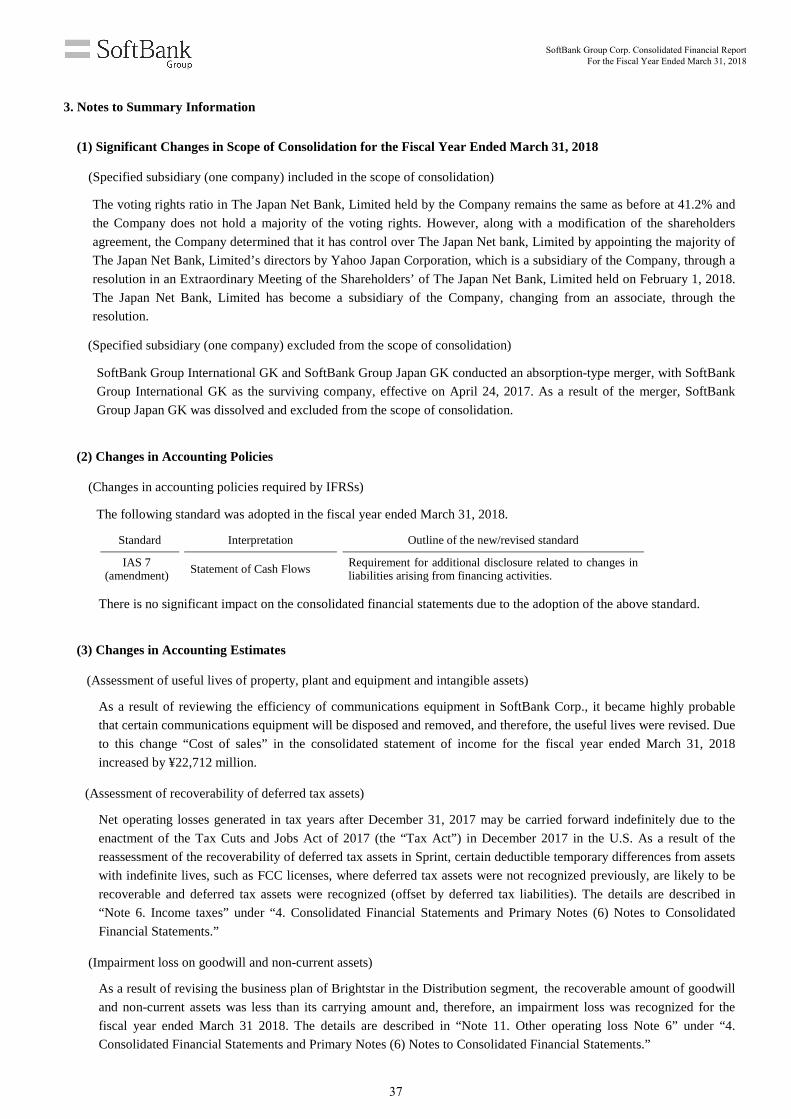
3. Notes to Summary Information
(1) Significant Changes in Scope of Consolidation for the Fiscal Year Ended March 31, 2018
(Specified subsidiary (one company) included in the scope of consolidation)
The voting rights ratio in The Japan Net Bank, Limited held by the Company remains the same as before at 41.2% and
the Company does not hold a majority of the voting rights. However, along with a modification of the shareholders
agreement, the Company determined that it has control over The Japan Net bank, Limited by appointing the majority of
The Japan Net Bank, Limited’s directors by Yahoo Japan Corporation, which is a subsidiary of the Company, through a
resolution in an Extraordinary Meeting of the Shareholders’ of The Japan Net Bank, Limited held on February 1, 2018.
The Japan Net Bank, Limited has become a subsidiary of the Company, changing from an associate, through the
resolution. (Specified subsidiary (one company) excluded from the scope of consolidation) SoftBank Group International GK and SoftBank Group Japan GK conducted an absorption-type merger, with SoftBank
Group International GK as the surviving company, effective on April 24, 2017. As a result of the merger, SoftBank
Group Japan GK was dissolved and excluded from the scope of consolidation.
(2) Changes in Accounting Policies
(Changes in accounting policies required by IFRSs) The following standard was adopted in the fiscal year ended March 31, 2018.
Standard Interpretation Outline of the new/revised standard
IAS 7 (amendment)
Statement of Cash Flows Requirement for additional disclosure related to changes in
liabilities arising from financing activities. There is no significant impact on the consolidated financial statements due to the adoption of the above standard.
(3) Changes in Accounting Estimates
(Assessment of useful lives of property, plant and equipment and intangible assets)
As a result of reviewing the efficiency of communications equipment in SoftBank Corp., it became highly probable
that certain communications equipment will be disposed and removed, and therefore, the useful lives were revised. Due
to this change “Cost of sales” in the consolidated statement of income for the fiscal year ended March 31, 2018
increased by ¥22,712 million.
(Assessment of recoverability of deferred tax assets)
Net operating losses generated in tax years after December 31, 2017 may be carried forward indefinitely due to the
enactment of the Tax Cuts and Jobs Act of 2017 (the “Tax Act”) in December 2017 in the U.S. As a result of the
reassessment of the recoverability of deferred tax assets in Sprint, certain deductible temporary differences from assets
with indefinite lives, such as FCC licenses, where deferred tax assets were not recognized previously, are likely to be
recoverable and deferred tax assets were recognized (offset by deferred tax liabilities). The details are described in
“Note 6. Income taxes” under “4. Consolidated Financial Statements and Primary Notes (6) Notes to Consolidated
Financial Statements.”
(Impairment loss on goodwill and non-current assets)
As a result of revising the business plan of Brightstar in the Distribution segment, the recoverable amount of goodwill
and non-current assets was less than its carrying amount and, therefore, an impairment loss was recognized for the
fiscal year ended March 31 2018. The details are described in “Note 11. Other operating loss Note 6” under “4.
Consolidated Financial Statements and Primary Notes (6) Notes to Consolidated Financial Statements.”
SoftBank Group Corp. Consolidated Financial Report For the Fiscal Year Ended March 31, 2018
37
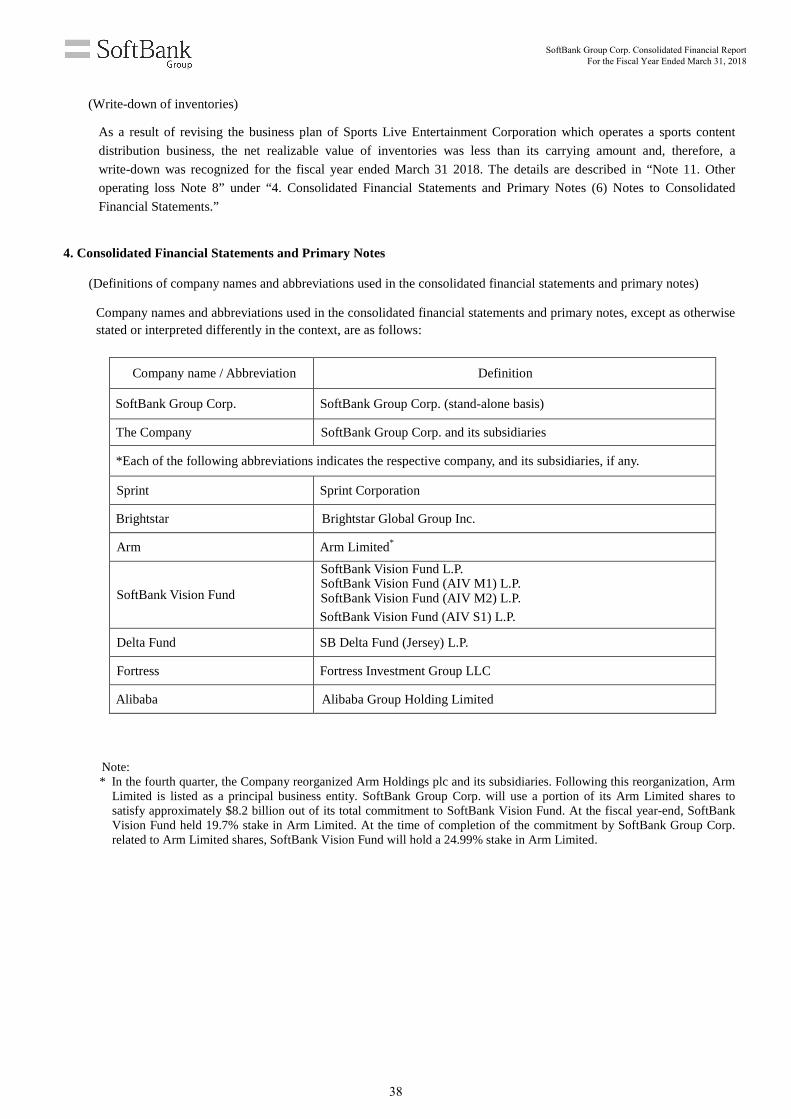
(Write-down of inventories)
As a result of revising the business plan of Sports Live Entertainment Corporation which operates a sports content
distribution business, the net realizable value of inventories was less than its carrying amount and, therefore, a
write-down was recognized for the fiscal year ended March 31 2018. The details are described in “Note 11. Other
operating loss Note 8” under “4. Consolidated Financial Statements and Primary Notes (6) Notes to Consolidated
Financial Statements.”
4. Consolidated Financial Statements and Primary Notes
(Definitions of company names and abbreviations used in the consolidated financial statements and primary notes)
Company names and abbreviations used in the consolidated financial statements and primary notes, except as otherwise stated or interpreted differently in the context, are as follows:
Company name / Abbreviation Definition
SoftBank Group Corp. SoftBank Group Corp. (stand-alone basis)
The Company SoftBank Group Corp. and its subsidiaries
*Each of the following abbreviations indicates the respective company, and its subsidiaries, if any.
Sprint Sprint Corporation
Brightstar Brightstar Global Group Inc.
Arm Arm Limited*
SoftBank Vision Fund
SoftBank Vision Fund L.P. SoftBank Vision Fund (AIV M1) L.P. SoftBank Vision Fund (AIV M2) L.P.
SoftBank Vision Fund (AIV S1) L.P.
Delta Fund SB Delta Fund (Jersey) L.P.
Fortress Fortress Investment Group LLC
Alibaba Alibaba Group Holding Limited
Note: * In the fourth quarter, the Company reorganized Arm Holdings plc and its subsidiaries. Following this reorganization, Arm
Limited is listed as a principal business entity. SoftBank Group Corp. will use a portion of its Arm Limited shares to satisfy approximately $8.2 billion out of its total commitment to SoftBank Vision Fund. At the fiscal year-end, SoftBank Vision Fund held 19.7% stake in Arm Limited. At the time of completion of the commitment by SoftBank Group Corp. related to Arm Limited shares, SoftBank Vision Fund will hold a 24.99% stake in Arm Limited.
SoftBank Group Corp. Consolidated Financial Report For the Fiscal Year Ended March 31, 2018
38
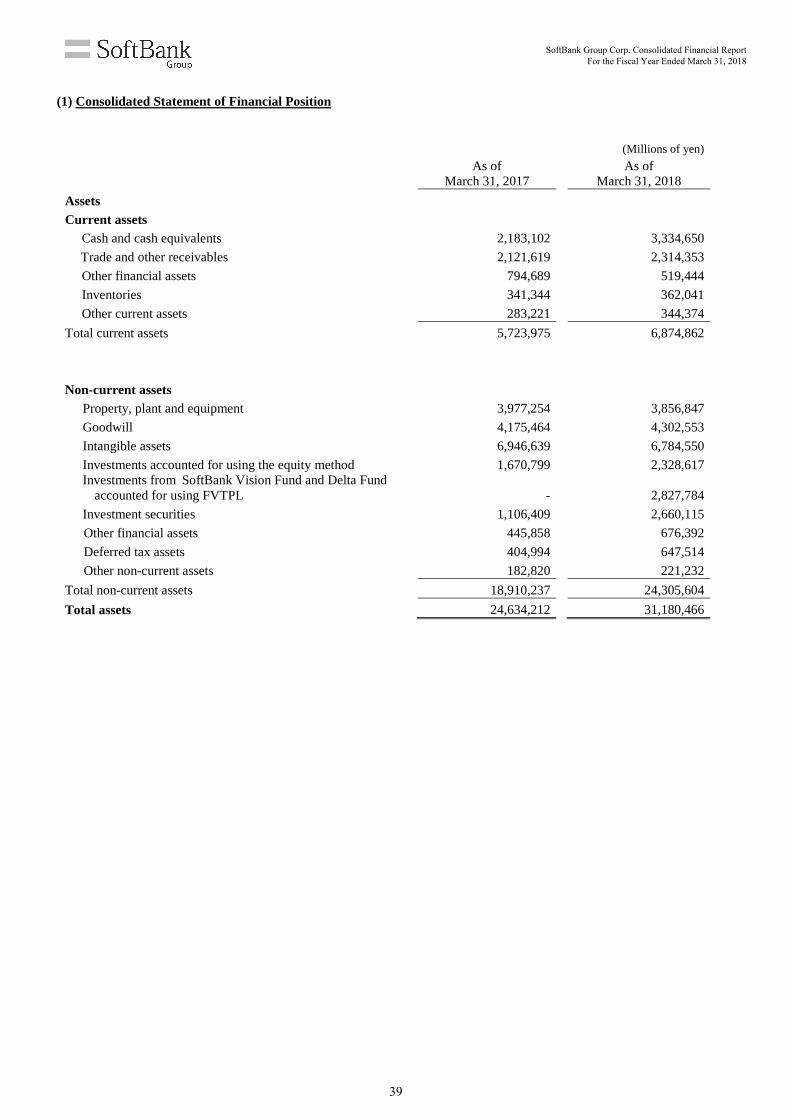
(1) Consolidated Statement of Financial Position
(Millions of yen)
As of
March 31, 2017 As of
March 31, 2018
Assets
Current assets
Cash and cash equivalents
2,183,102 3,334,650
Trade and other receivables
2,121,619 2,314,353
Other financial assets
794,689 519,444
Inventories
341,344 362,041
Other current assets
283,221 344,374
Total current assets 5,723,975 6,874,862
Non-current assets
Property, plant and equipment
3,977,254 3,856,847
Goodwill
4,175,464 4,302,553
Intangible assets
6,946,639 6,784,550
Investments accounted for using the equity method
1,670,799 2,328,617 Investments from SoftBank Vision Fund and Delta Fund
accounted for using FVTPL
- 2,827,784
Investment securities 1,106,409 2,660,115
Other financial assets
445,858 676,392
Deferred tax assets
404,994 647,514
Other non-current assets
182,820 221,232
Total non-current assets
18,910,237 24,305,604
Total assets
24,634,212 31,180,466
SoftBank Group Corp. Consolidated Financial Report For the Fiscal Year Ended March 31, 2018
39
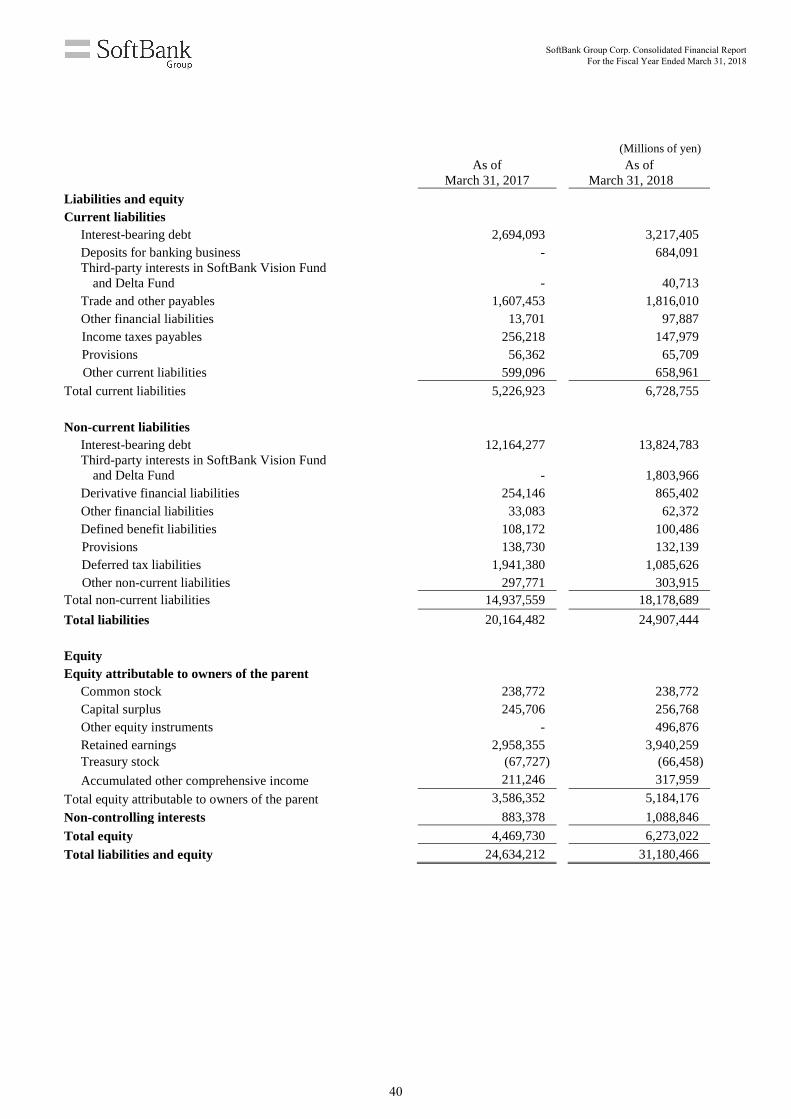
(Millions of yen)
As of
March 31, 2017 As of
March 31, 2018
Liabilities and equity
Current liabilities
Interest-bearing debt 2,694,093 3,217,405 Deposits for banking business - 684,091 Third-party interests in SoftBank Vision Fund
and Delta Fund
- 40,713 Trade and other payables 1,607,453 1,816,010 Other financial liabilities 13,701 97,887 Income taxes payables 256,218 147,979 Provisions 56,362 65,709 Other current liabilities 599,096 658,961
Total current liabilities 5,226,923 6,728,755
Non-current liabilities Interest-bearing debt 12,164,277 13,824,783
Third-party interests in SoftBank Vision Fund and Delta Fund
- 1,803,966
Derivative financial liabilities 254,146 865,402 Other financial liabilities 33,083 62,372 Defined benefit liabilities 108,172 100,486 Provisions 138,730 132,139 Deferred tax liabilities 1,941,380 1,085,626 Other non-current liabilities 297,771 303,915
Total non-current liabilities
14,937,559 18,178,689
Total liabilities 20,164,482 24,907,444
Equity
Equity attributable to owners of the parent
Common stock
238,772 238,772 Capital surplus
245,706 256,768
Other equity instruments - 496,876 Retained earnings
2,958,355 3,940,259
Treasury stock
(67,727) (66,458)
Accumulated other comprehensive income
211,246 317,959
Total equity attributable to owners of the parent
3,586,352 5,184,176
Non-controlling interests
883,378 1,088,846
Total equity
4,469,730 6,273,022
Total liabilities and equity 24,634,212 31,180,466
SoftBank Group Corp. Consolidated Financial Report For the Fiscal Year Ended March 31, 2018
40
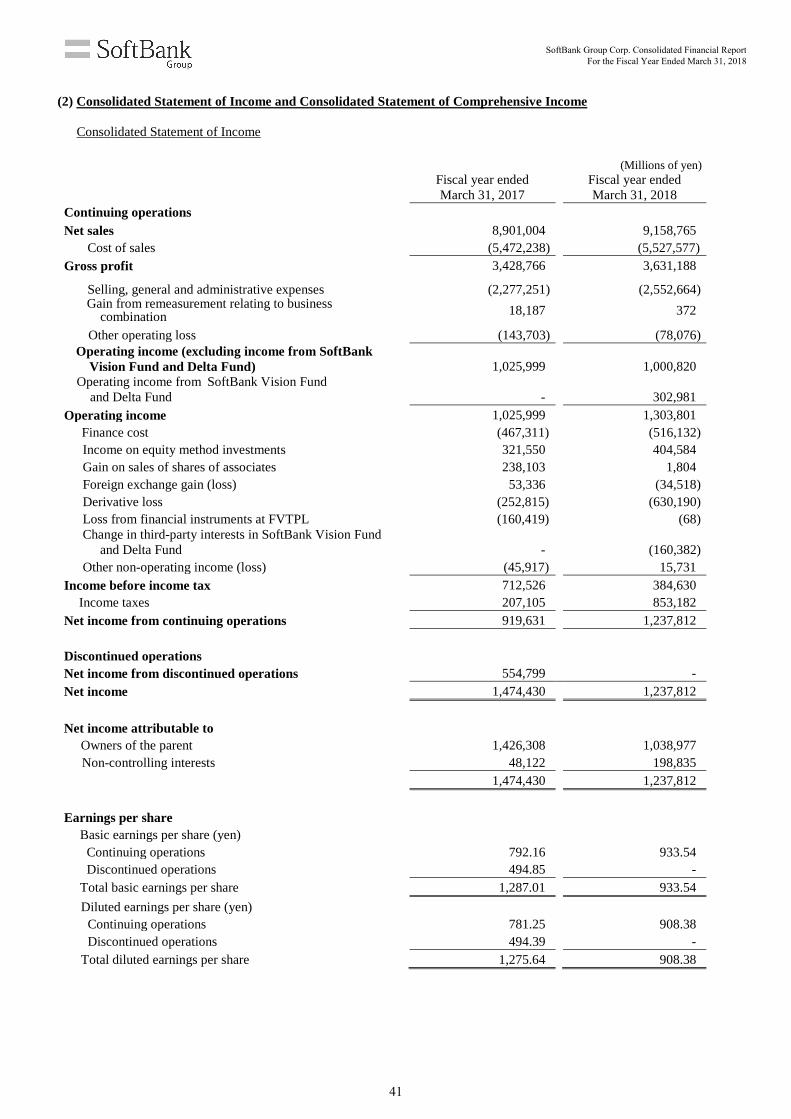
(2) Consolidated Statement of Income and Consolidated Statement of Comprehensive Income
Consolidated Statement of Income
(Millions of yen)
Fiscal year ended
March 31, 2017 Fiscal year ended
March 31, 2018 Continuing operations
Net sales
8,901,004 9,158,765 Cost of sales
(5,472,238) (5,527,577)
Gross profit
3,428,766 3,631,188
Selling, general and administrative expenses
(2,277,251) (2,552,664)
Gain from remeasurement relating to business combination
18,187 372
Other operating loss
(143,703) (78,076) Operating income (excluding income from SoftBank
Vision Fund and Delta Fund)
1,025,999 1,000,820 Operating income from SoftBank Vision Fund
and Delta Fund
- 302,981
Operating income
1,025,999 1,303,801 Finance cost
(467,311) (516,132)
Income on equity method investments
321,550 404,584 Gain on sales of shares of associates 238,103 1,804 Foreign exchange gain (loss) 53,336 (34,518) Derivative loss (252,815) (630,190) Loss from financial instruments at FVTPL (160,419) (68) Change in third-party interests in SoftBank Vision Fund
and Delta Fund
- (160,382) Other non-operating income (loss) (45,917) 15,731
Income before income tax
712,526 384,630 Income taxes
207,105 853,182
Net income from continuing operations 919,631 1,237,812
Discontinued operations Net income from discontinued operations 554,799 -
Net income
1,474,430 1,237,812
Net income attributable to
Owners of the parent
1,426,308 1,038,977
Non-controlling interests
48,122 198,835
1,474,430 1,237,812
Earnings per share
Basic earnings per share (yen)
Continuing operations 792.16 933.54 Discontinued operations 494.85 - Total basic earnings per share 1,287.01 933.54
Diluted earnings per share (yen)
Continuing operations 781.25 908.38 Discontinued operations 494.39 - Total diluted earnings per share 1,275.64 908.38
SoftBank Group Corp. Consolidated Financial Report For the Fiscal Year Ended March 31, 2018
41
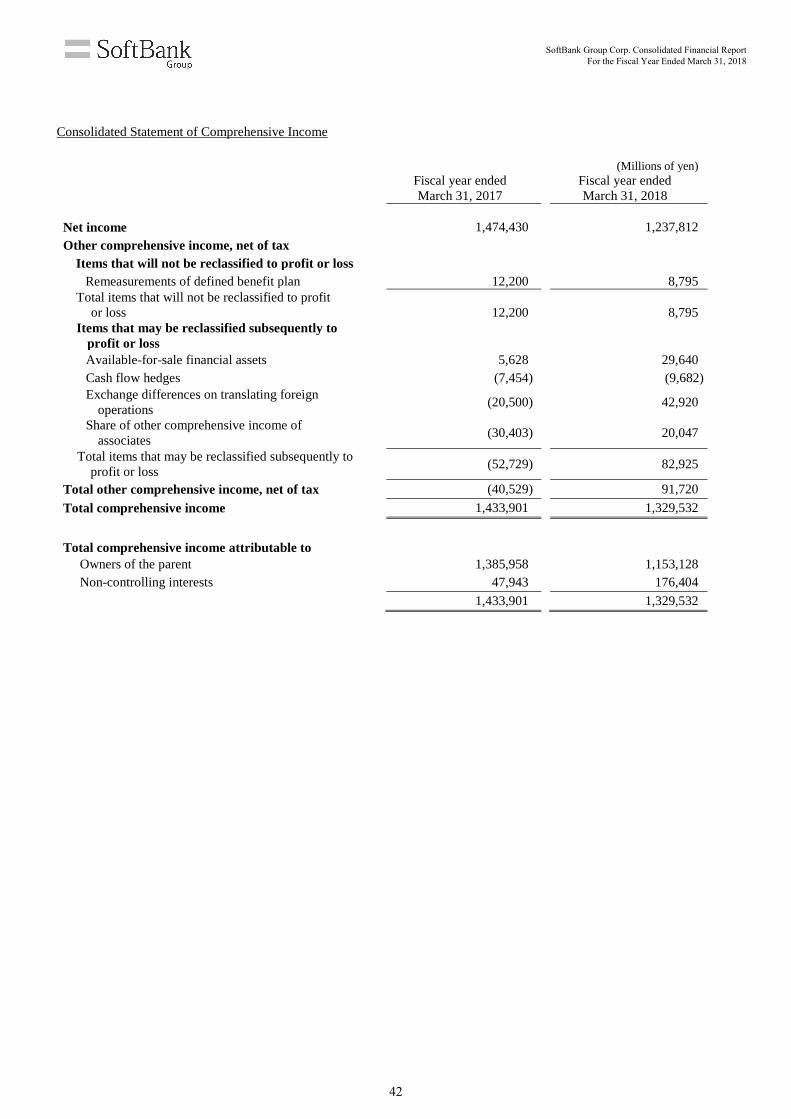
Consolidated Statement of Comprehensive Income
(Millions of yen)
Fiscal year ended
March 31, 2017 Fiscal year ended
March 31, 2018
Net income
1,474,430
1,237,812
Other comprehensive income, net of tax
Items that will not be reclassified to profit or loss Remeasurements of defined benefit plan 12,200 8,795
Total items that will not be reclassified to profit or loss
12,200 8,795 Items that may be reclassified subsequently to
profit or loss
Available-for-sale financial assets
5,628 29,640 Cash flow hedges
(7,454) (9,682)
Exchange differences on translating foreign operations
(20,500) 42,920
Share of other comprehensive income of associates
(30,403) 20,047
Total items that may be reclassified subsequently to profit or loss
(52,729) 82,925
Total other comprehensive income, net of tax (40,529) 91,720
Total comprehensive income
1,433,901 1,329,532
Total comprehensive income attributable to
Owners of the parent
1,385,958 1,153,128
Non-controlling interests
47,943 176,404
1,433,901 1,329,532
SoftBank Group Corp. Consolidated Financial Report For the Fiscal Year Ended March 31, 2018
42
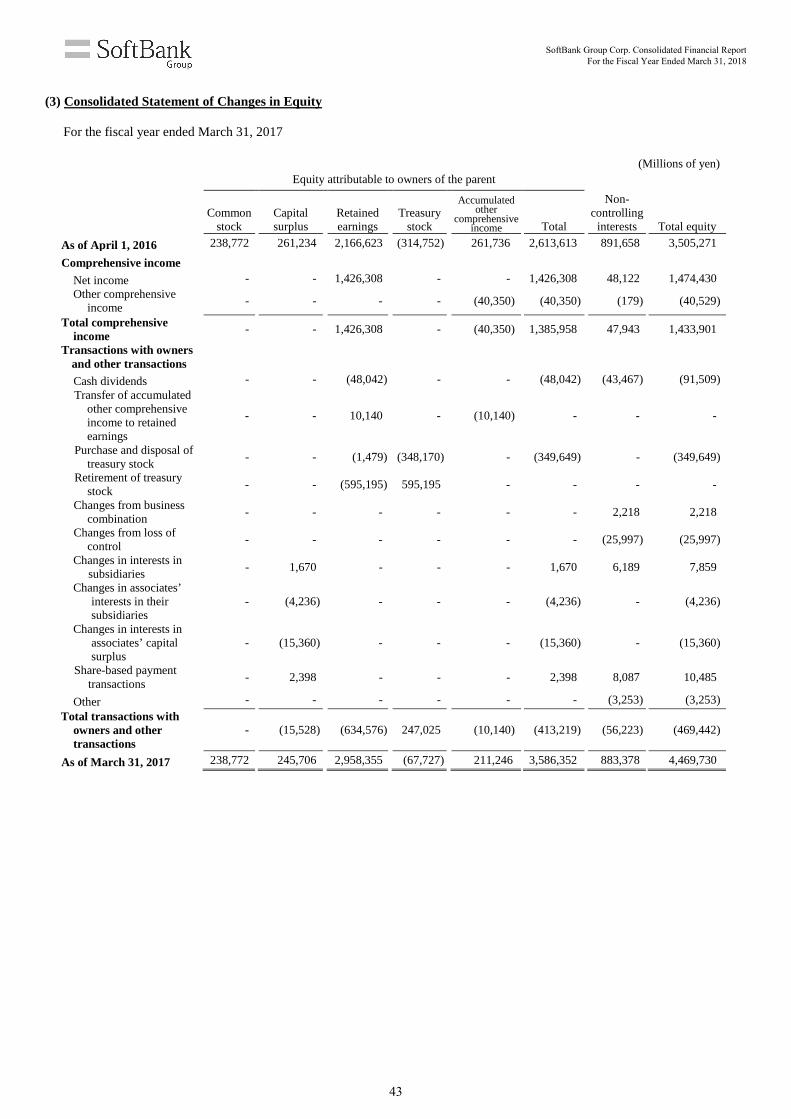
(3) Consolidated Statement of Changes in Equity
For the fiscal year ended March 31, 2017
(Millions of yen)
Equity attributable to owners of the parent Non-
controlling interests
Total equity
Common
stock Capital surplus
Retained earnings
Treasury stock
Accumulated other
comprehensive income Total
As of April 1, 2016 238,772 261,234 2,166,623 (314,752) 261,736 2,613,613 891,658 3,505,271
Comprehensive income
Net income
- - 1,426,308 - - 1,426,308 48,122 1,474,430
Other comprehensive income
- - - - (40,350) (40,350) (179) (40,529)
Total comprehensive income
- - 1,426,308 - (40,350) 1,385,958 47,943 1,433,901
Transactions with owners and other transactions
Cash dividends - - (48,042) - - (48,042) (43,467) (91,509) Transfer of accumulated
other comprehensive income to retained earnings
- - 10,140 - (10,140) - - -
Purchase and disposal of treasury stock
- - (1,479) (348,170) - (349,649) - (349,649)
Retirement of treasury stock
- - (595,195) 595,195 - - - -
Changes from business combination
- - - - - - 2,218 2,218
Changes from loss of control
- - - - - - (25,997) (25,997)
Changes in interests in subsidiaries
- 1,670 - - - 1,670 6,189 7,859
Changes in associates’ interests in their subsidiaries
- (4,236) - - - (4,236) - (4,236)
Changes in interests in associates’ capital surplus
- (15,360) - - - (15,360) - (15,360)
Share-based payment transactions
- 2,398 - - - 2,398 8,087 10,485
Other - - - - - - (3,253) (3,253)
Total transactions with owners and other transactions
- (15,528) (634,576) 247,025 (10,140) (413,219) (56,223) (469,442)
As of March 31, 2017 238,772 245,706 2,958,355 (67,727) 211,246 3,586,352 883,378 4,469,730
SoftBank Group Corp. Consolidated Financial Report For the Fiscal Year Ended March 31, 2018
43
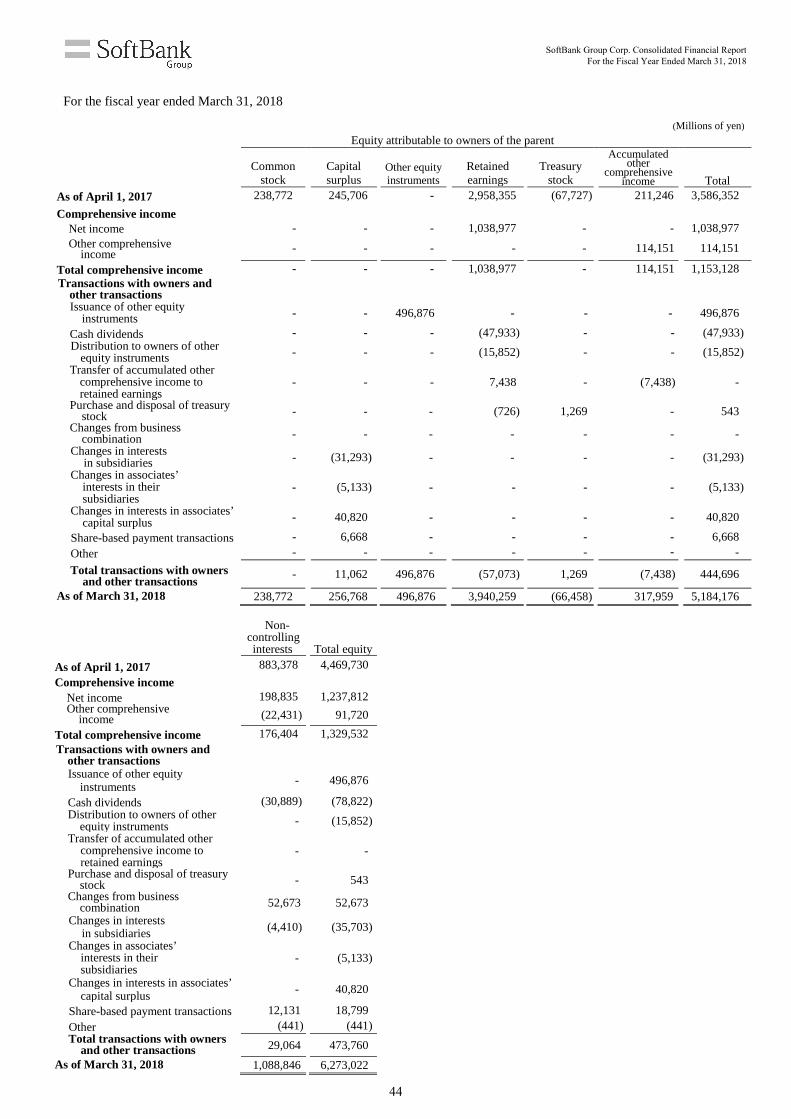
For the fiscal year ended March 31, 2018
(Millions of yen)
Equity attributable to owners of the parent
Common stock
Capital surplus
Other equity instruments
Retained earnings
Treasury stock
Accumulated other
comprehensive income Total
As of April 1, 2017 238,772 245,706 - 2,958,355 (67,727) 211,246 3,586,352
Comprehensive income
Net income
- - - 1,038,977 - - 1,038,977
Other comprehensive income
- - - - - 114,151 114,151
Total comprehensive income - - - 1,038,977 - 114,151 1,153,128
Transactions with owners and other transactions
Issuance of other equity
instruments - - 496,876 - - - 496,876
Cash dividends - - - (47,933) - - (47,933)
Distribution to owners of other equity instruments
- - - (15,852) - - (15,852)
Transfer of accumulated other comprehensive income to retained earnings
- - - 7,438 - (7,438) -
Purchase and disposal of treasury stock
- - - (726) 1,269 - 543 Changes from business
combination - - - - - - -
Changes in interests in subsidiaries
- (31,293) - - - - (31,293)
Changes in associates’ interests in their subsidiaries
- (5,133) - - - - (5,133)
Changes in interests in associates’ capital surplus
- 40,820 - - - - 40,820
Share-based payment transactions - 6,668 - - - - 6,668
Other - - - - - - -
Total transactions with owners and other transactions
- 11,062 496,876 (57,073) 1,269 (7,438)
444,696
As of March 31, 2018 238,772 256,768 496,876 3,940,259 (66,458) 317,959 5,184,176
Non-
controlling interests
Total equity
As of April 1, 2017 883,378 4,469,730
Comprehensive income
Net income 198,835 1,237,812
Other comprehensive income
(22,431) 91,720
Total comprehensive income 176,404 1,329,532
Transactions with owners and other transactions
Issuance of other equity instruments
- 496,876
Cash dividends (30,889) (78,822)
Distribution to owners of other equity instruments
- (15,852)
Transfer of accumulated other comprehensive income to retained earnings
- -
Purchase and disposal of treasury stock
- 543 Changes from business
combination 52,673 52,673
Changes in interests in subsidiaries
(4,410) (35,703)
Changes in associates’ interests in their subsidiaries
- (5,133)
Changes in interests in associates’ capital surplus
- 40,820
Share-based payment transactions 12,131 18,799
Other (441) (441)
Total transactions with owners and other transactions
29,064 473,760
As of March 31, 2018 1,088,846 6,273,022
SoftBank Group Corp. Consolidated Financial Report For the Fiscal Year Ended March 31, 2018
44
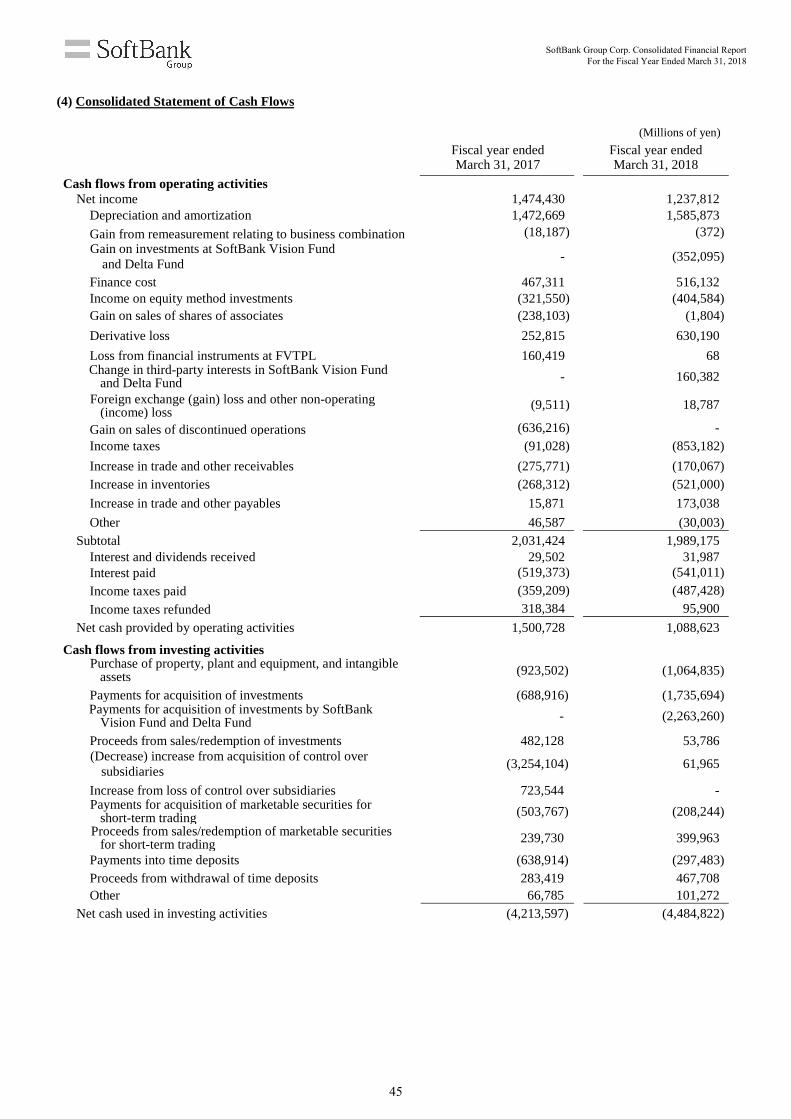
(4) Consolidated Statement of Cash Flows
(Millions of yen)
Fiscal year ended
March 31, 2017 Fiscal year ended
March 31, 2018
Cash flows from operating activities Net income 1,474,430 1,237,812
Depreciation and amortization 1,472,669 1,585,873
Gain from remeasurement relating to business combination (18,187) (372) Gain on investments at SoftBank Vision Fund
and Delta Fund
- (352,095)
Finance cost 467,311 516,132 Income on equity method investments (321,550) (404,584) Gain on sales of shares of associates (238,103) (1,804)
Derivative loss 252,815 630,190
Loss from financial instruments at FVTPL 160,419 68 Change in third-party interests in SoftBank Vision Fund
and Delta Fund - 160,382
Foreign exchange (gain) loss and other non-operating (income) loss
(9,511) 18,787
Gain on sales of discontinued operations (636,216) - Income taxes (91,028) (853,182)
Increase in trade and other receivables (275,771) (170,067) Increase in inventories (268,312) (521,000)
Increase in trade and other payables 15,871 173,038
Other 46,587 (30,003) Subtotal 2,031,424 1,989,175
Interest and dividends received 29,502 31,987 Interest paid (519,373) (541,011)
Income taxes paid (359,209) (487,428)
Income taxes refunded 318,384 95,900
Net cash provided by operating activities 1,500,728 1,088,623
Cash flows from investing activities Purchase of property, plant and equipment, and intangible
assets (923,502) (1,064,835)
Payments for acquisition of investments (688,916) (1,735,694) Payments for acquisition of investments by SoftBank
Vision Fund and Delta Fund - (2,263,260)
Proceeds from sales/redemption of investments 482,128 53,786 (Decrease) increase from acquisition of control over
subsidiaries
(3,254,104) 61,965
Increase from loss of control over subsidiaries 723,544 - Payments for acquisition of marketable securities for
short-term trading (503,767) (208,244)
Proceeds from sales/redemption of marketable securities for short-term trading 239,730 399,963
Payments into time deposits (638,914) (297,483) Proceeds from withdrawal of time deposits 283,419 467,708 Other 66,785 101,272
Net cash used in investing activities (4,213,597) (4,484,822)
SoftBank Group Corp. Consolidated Financial Report For the Fiscal Year Ended March 31, 2018
45
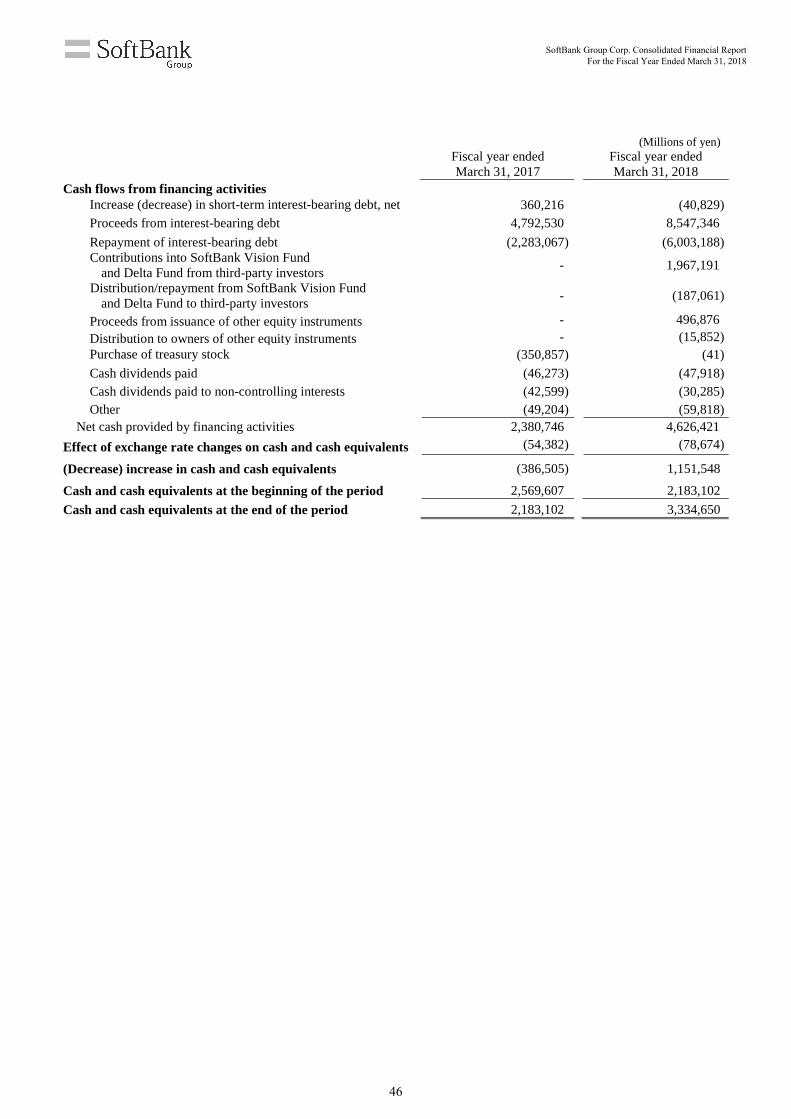
(Millions of yen)
Fiscal year ended
March 31, 2017 Fiscal year ended
March 31, 2018 Cash flows from financing activities
Increase (decrease) in short-term interest-bearing debt, net 360,216 (40,829) Proceeds from interest-bearing debt 4,792,530 8,547,346
Repayment of interest-bearing debt (2,283,067) (6,003,188) Contributions into SoftBank Vision Fund
and Delta Fund from third-party investors
- 1,967,191
Distribution/repayment from SoftBank Vision Fund and Delta Fund to third-party investors
- (187,061)
Proceeds from issuance of other equity instruments - 496,876
Distribution to owners of other equity instruments - (15,852) Purchase of treasury stock (350,857) (41)
Cash dividends paid (46,273) (47,918) Cash dividends paid to non-controlling interests (42,599) (30,285) Other (49,204) (59,818)
Net cash provided by financing activities 2,380,746 4,626,421
Effect of exchange rate changes on cash and cash equivalents (54,382) (78,674)
(Decrease) increase in cash and cash equivalents (386,505) 1,151,548
Cash and cash equivalents at the beginning of the period 2,569,607 2,183,102
Cash and cash equivalents at the end of the period 2,183,102 3,334,650
SoftBank Group Corp. Consolidated Financial Report For the Fiscal Year Ended March 31, 2018
46
(5) Significant Doubt about Going Concern Assumption
There are no applicable items. (6) Notes to Consolidated Financial Statements 1. Significant accounting policies
The SoftBank Vision Fund completed the initial closing in May 2017. Accordingly, the Company adopted accounting policies for SoftBank Vision Fund and Delta Fund as follows.
(1) Consolidation of the SoftBank Vision Fund and Delta Fund business by the Company
SoftBank Vision Fund and Delta Fund are Limited Partnerships established by the General Partner which is a wholly-owned subsidiary of the Company, and by their form of organization, qualify as structured entities. SoftBank Vision Fund and Delta Fund are consolidated by the Company for the following reasons.
The various entities comprising SoftBank Vision Fund and Delta Fund make investment decisions through their respective Investment Committee, which were established as committees of SB Investment Advisers (UK) Limited (“SBIA”). SBIA is an advisory company and is a wholly-owned subsidiary of the Company. As such, the Company has power as defined under IFRS 10 “Consolidated Financial Statements” over SoftBank Vision Fund and Delta Fund. Furthermore, SBIA receives performance fees and the Company receives distributions attributable to Limited Partners based on the investment performance as returns from the Funds. The Company has the ability to affect those returns through its power over the Funds, and therefore, the Company is deemed to have control as stipulated in IFRS 10 over each Fund.
Inter-company transactions such as management fees and performance fees to SBIA paid or to be paid from SoftBank Vision Fund and Delta Fund are eliminated in consolidation.
(2) Portfolio company investments made by SoftBank Vision Fund and Delta Fund
a. Investments in subsidiaries Of the portfolio company investments made by SoftBank Vision Fund, the portfolio companies that the Company is deemed to control under IFRS 10, are subsidiaries of the Company. Accordingly, their results of operations, assets and liabilities are included in the Company’s consolidated financial statements. Gain and loss on investments in the subsidiaries of the Company, which will be recognized at SoftBank Vision Fund, are eliminated in consolidation.
b. Investments in associates
Of the portfolio company investments made by SoftBank Vision Fund and Delta Fund, the portfolio companies over which the Company has significant influence under IAS 28 “Investments in Associates and Joint Ventures”, are associates of the Company. The investments in associates of the Company made by SoftBank Vision Fund and Delta Fund are accounted for as financial assets measured at fair value through profit or loss (“financial assets at FVTPL”) in accordance with IAS 28. 18, and presented as “Investments from SoftBank Vision Fund and Delta Fund accounted for using FVTPL” in the consolidated statement of financial position. The payments for these investments are presented as “Payments for acquisition of investments by SoftBank Vision Fund and Delta Fund” under cash flows from investing activities in the consolidated statement of cash flows.
c. Other investments Investments other than those in subsidiaries or associates of the Company made by the SoftBank Vision Fund and Delta Fund are accounted for as financial assets at FVTPL. The presentation of these investments in the consolidated statement of financial position and the consolidated statement of cash flows are the same as the above “b. Investments in associates.”
SoftBank Group Corp. Consolidated Financial Report For the Fiscal Year Ended March 31, 2018
47
(3) Presentation of the results from the SoftBank Vision Fund and Delta Fund business
Income and loss arising from the SoftBank Vision Fund and Delta Fund business are separated from operating income and loss arising from other businesses, recognized as a component of operating income, and presented as “Operating income from SoftBank Vision Fund and Delta Fund” in the consolidated statement of income. Gain and loss arising from “(2) Portfolio company investments made by SoftBank Vision Fund and Delta Fund” (realized gain and loss on sales of investments, unrealized gain and loss on valuation of investments, interest and dividend income from investments, except for gain and loss on investments in subsidiaries) and operating expenses such as incorporation expenses of entities that comprise SoftBank Vision Fund and Delta Fund, investment research expenses arising from SBIA and other Japan and U.S. advisory companies which support SBIA, and administrative expenses arising from each entity, are included in “Operating income from SoftBank Vision Fund and Delta Fund.”
(4) Investments made by the Company based on the premise of transferring to SoftBank Vision Fund and Delta Fund
Investments in associates or other investments made by SoftBank Group Corp. or its subsidiaries based on the premise of transferring to SoftBank Vision Fund and Delta Fund are designated as financial assets at FVTPL. In cases where the investees are the Company’s subsidiaries and the Company is transferring those investments to SoftBank Vision Fund, the investments are accounted for in accordance with the above “a. Investments in subsidiaries” under “(2) Portfolio company investments made by SoftBank Vision Fund and Delta Fund,” regardless of whether the investments are agreed to be transferred.
a. Investments made in the current fiscal year based on the premise of transfer If the investments are agreed to be transferred from the Company to SoftBank Vision Fund or Delta Fund, and regulatory approval to make the investments by SoftBank Vision Fund or Delta Fund is obtained (such investments, “Agreed Transferable Investments”) as of the end of the current fiscal year, the Company presents items relevant to those investments as “Investments from SoftBank Vision Fund and Delta Fund accounted for using FVTPL” in the consolidated statement of financial position, “Operating income from SoftBank Vision Fund and Delta Fund” in the consolidated statement of income, and “Payments for acquisition of investments by SoftBank Vision Fund and Delta Fund” under cash flows from investing activities in the consolidated statement of cash flows, as though SoftBank Vision Fund and Delta Fund made those investments from the date when the Company had initially made the investments. On the other hand, if the investments have not yet become the Agreed Transferable Investments as of the end of the current fiscal year, the Company presents items relevant to those investments as “Investment securities” in the consolidated statement of financial position, “Loss from financial instruments at FVTPL (Other non-operating income (loss))” in the consolidated statement of income, and “Payments for acquisition of investments” under cash flows from investing activities in the consolidated statement of cash flows.
b. Investments made prior to the current fiscal year based on the premise of transfer
If the investments become the Agreed Transferable Investments in the current fiscal year, the Company presents items relevant to those investments as “Investments from SoftBank Vision Fund and Delta Fund accounted for using FVTPL” in the consolidated statement of financial position and “Operating income from SoftBank Vision Fund and Delta Fund” in the consolidated statement of income for the current fiscal year, as though the investments were agreed to be transferred at the beginning of the current fiscal year. In such case, corresponding comparative information for the previous fiscal year is presented as “Investment securities” in the consolidated statement of financial position, “Loss from financial instruments at FVTPL (Other non-operating income (loss))” in the consolidated statement of income, and “Payments for acquisition of investments” under cash flows from investing activities in the consolidated statement of cash flows.
SoftBank Group Corp. Consolidated Financial Report For the Fiscal Year Ended March 31, 2018
48
(5) Contribution from Limited Partners to SoftBank Vision Fund and Delta Fund
SoftBank Vision Fund and Delta Fund call capital from their respective limited partners (“Capital Call”).
a. Contribution from Limited Partners other than the Company The interests attributable to limited partners of SoftBank Vision Fund and Delta Fund other than the Company (“Third-Party Investors”) are classified as financial liabilities, “Third-party interests in SoftBank Vision Fund and Delta Fund” in the consolidated statement of financial position, due to the predetermined finite life (at least 12 years from the final closing) and contractual payment provision to each of the limited partners at the end of the finite life within SoftBank Vision Fund and Delta Fund’s limited partnership agreements. The liabilities are classified as “financial liabilities measured at amortized cost” upon initial recognition. The carrying amounts attributable to Third-Party Investors represent the amounts that would be distributed in accordance with the limited partnership agreement in a theoretical liquidation scenario at the end of each quarter. “Third-party interests in SoftBank Vision Fund and Delta Fund” fluctuate due to the results of SoftBank Vision Fund and Delta Fund in addition to contributions from Third-Party Investors in satisfaction of Capital Calls, and distributions and repayments of investments to Third-Party Investors. The fluctuations due to the results of SoftBank Vision Fund and Delta Fund are presented as “Changes in third-party interests in SoftBank Vision Fund and Delta Fund” in the consolidated statement of income. Contributions from Third-Party Investors to SoftBank Vision Fund and Delta Fund are included in “Contributions into SoftBank Vision Fund and Delta Fund from third-party investors” under cash flows from financing activities in the consolidated statement of cash flows. The distributions and repayments of investments to Third-Party Investors are included in “Distribution/repayment from SoftBank Vision Fund and Delta Fund to third-party investors” under cash flows from financing activities in the consolidated statement of cash flows. Uncalled committed capital from Third-Party Investors is not subject to IAS 39, “Financial Instruments: Recognition and Measurement,” and therefore such amount is not recorded in the consolidated statement of financial position. Uncalled committed capital from Third-Party Investors for SoftBank Vision Fund and Delta Fund as of March 31, 2018 is $49.0 billion.
b. Contribution from the Company Contribution from the Company to SoftBank Vision Fund and Delta Fund as a limited partner is eliminated in consolidation.
SoftBank Group Corp. Consolidated Financial Report For the Fiscal Year Ended March 31, 2018
49
2. Segment information
(1) Description of reportable segments
The Company’s reportable segments are components of business activities for which discrete financial
information is available, and such information is regularly reviewed by the Company’s Board of Directors in
order to make decisions about the allocation of resources and assess its performance. The Company has six reportable segments: the Domestic Telecommunications segment, the Sprint segment, the
Yahoo Japan segment, the Distribution segment, the Arm segment, and the SoftBank Vision Fund and Delta Fund
segment.
The Domestic Telecommunications segment provides, mainly through SoftBank Corp., mobile communications
services, sale of mobile devices, telecommunication services such as fixed-line telephone and data
communications services for corporate customers, and broadband services for retail customers in Japan. The Sprint segment provides, through Sprint, mobile communications services, sale and lease of mobile devices,
sale of mobile device accessories, and fixed-line telecommunications services in the U.S.
The Yahoo Japan segment provides, mainly through Yahoo Japan Corporation, an Internet-based advertising
business, an e-commerce business, and membership services.
The Distribution segment provides, through Brightstar, distribution of mobile devices overseas, and through
SoftBank Commerce & Service Corp., sale of mobile device accessories, PC software, and peripherals in Japan.
The Arm segment provides, through Arm, designs of microprocessor intellectual property and related technology,
and the sale of software tools. The SoftBank Vision Fund and Delta Fund segment conducts investment activities in a wide range of technology
sectors. The SoftBank Vision Fund and Delta Fund segment was newly established from the three-month period
ended June 30, 2017, due to the completion of the Initial Closing for SoftBank Vision Fund in May 2017. The
segment income of the SoftBank Vision Fund and Delta Fund segment consists of gain and loss arising from
investments, including subsidiaries, held by SoftBank Vision Fund and Delta Fund or the Agreed Transferable
Investments (gain and loss on investments at SoftBank Vision Fund and Delta Fund), and operating expenses
incurred in SoftBank Vision Fund and Delta Fund, SBIA and advisory companies in the U.S. and Japan.
Information on business segments which are not included in the reportable segments is classified in “Other.”
“Other” includes mainly Fortress and the Fukuoka SoftBank HAWKS-related operations. “Reconciliations” include an elimination of intersegment transactions and the corporate general expenses
unallocated to each reportable segment. Expenses arising mainly from SoftBank Group Corp. and SB Group US,
Inc., which manages and supervises investment activities in the Internet, communication, and media fields
overseas, are included in corporate general expenses.
(2) Net sales and income of reportable segments
Income of reportable segments is defined as “Operating income.” Intersegment transaction prices are determined under the same general business conditions as applied for external customers.
The Company also discloses EBITDA (i.e., segment income and loss after addition of depreciation and
amortization) and Adjusted EBITDA (i.e., EBITDA after addition or deduction of unrealized gain and loss on
valuation of investments in SoftBank Vision Fund and Delta Fund and other adjustments (gains are deducted))
by each reportable segment. “Other adjustments” are special items, such as acquisition-related costs and
impairment loss mainly included in other operating income and loss.
Income and loss, which is not attributable to operating income and loss, such as financial cost and income and loss on equity method investments, is not managed by each reportable segment and therefore this income and losses are excluded from segment performance. Discontinued operations are not included.
SoftBank Group Corp. Consolidated Financial Report For the Fiscal Year Ended March 31, 2018
50
For the fiscal year ended March 31, 2017
(Millions of yen)
Reportable segments
Domestic Telecommu-
nications Sprint
Yahoo Japan
Distribution
Arm
SoftBank Vision Fund
and Delta Fund Total
Net sales
Customers 3,156,825 3,459,142 841,581 1,228,051 112,901 - 8,798,500
Intersegment 36,966 164,233 11,877 67,323 1
- 280,400
Total 3,193,791 3,623,375 853,458 1,295,374 112,902 - 9,078,900
Segment income 719,572 186,423 189,819 (10,047) 12,919 - 1,098,686
Reconciliation from segment income to adjusted EBITDA
Segment income 719,572 186,423 189,819 (10,047) 12,919 - 1,098,686 Depreciation and amortization
489,458 885,845
38,973
7,237
32,523 - 1,454,036
EBITDA 1,209,030 1,072,268 228,792 (2,810) 45,442 - 2,552,722 Gain from remeasurement
relating to business combination
- -
(19)
-
(18,168) - (18,187)
Other adjustments - 7,371 10,736 30,260 25,780 - 74,147
Adjusted EBITDA 1,209,030 1,079,639 239,509 27,450 53,054 - 2,608,682
(Millions of yen)
Other
Reconcili-
ations Consoli-
dated
Net sales
Customers 102,504 - 8,901,004
Intersegment 25,804 (306,204) -
Total 128,308 (306,204) 8,901,004
Segment income (16,573) (56,114) 1,025,999
Reconciliation from segment income to adjusted EBITDA
Segment income (16,573) (56,114) 1,025,999 Depreciation and amortization 9,984 1,589 1,465,609
EBITDA (6,589) (54,525) 2,491,608 Gain from remeasurement relating to business combination - - (18,187)
Other adjustments 8,052 8,847 91,046
Adjusted EBITDA 1,463 (45,678) 2,564,467
SoftBank Group Corp. Consolidated Financial Report For the Fiscal Year Ended March 31, 2018
51
For the fiscal year ended March 31, 2018
(Millions of yen)
Reportable segments
Domestic Telecommu-
nications Sprint
Yahoo Japan
Distribution
Arm
SoftBank Vision Fund
and Delta Fund Total
Net sales
Customers 3,188,416 3,403,820 866,627 1,360,656 202,338 - 9,021,857
Intersegment 41,429 198,141 17,775 58,663 6
- 316,014
Total 3,229,845 3,601,961 884,402 1,419,319 202,344 - 9,337,871
Segment income 682,996 279,283 179,290 (31,018) (31,380) 302,981 1,382,152
Reconciliation from segment income to adjusted EBITDA
Segment income 682,996 279,283 179,290 (31,018) (31,380) 302,981 1,382,152 Depreciation and amortization
499,188 953,820
45,193
6,695
62,324 1 1,567,221
EBITDA 1,182,184 1,233,103 224,483 (24,323) 30,944 302,982 2,949,373 Gain from remeasurement relating to business combination
- -
(372)
-
- - (372) Unrealized gain and loss on valuation of investments in SoftBank Vision Fund and Delta Fund
- -
-
-
- (345,975) (345,975)
Other adjustments* (4,044) (5,762) (9,692) 50,497 - 20,502 51,501
Adjusted EBITDA 1,178,140 1,227,341 214,419 26,174 30,944 (22,491) 2,654,527
(Millions of yen)
Other
Reconcili-
ations Consoli-
dated
Net sales
Customers 136,908 - 9,158,765
Intersegment 25,467 (341,481) -
Total 162,375 (341,481) 9,158,765
Segment income (36,874) (41,477) 1,303,801
Reconciliation from segment income to adjusted EBITDA
Segment income (36,874) (41,477) 1,303,801 Depreciation and amortization 17,144 1,508 1,585,873
EBITDA (19,730) (39,969) 2,889,674 Gain from remeasurement relating to business combination - - (372)
Unrealized gain and loss on valuation of investments in SoftBank Vision Fund and Delta Fund - - (345,975)
Other adjustments* 8,712 1,577 61,790
Adjusted EBITDA (11,018) (38,392) 2,605,117
Note:
*“Other adjustments” in SoftBank Vision Fund and Delta Fund segment represent expenses related to establishment of SoftBank Vision Fund
and Delta Fund.
SoftBank Group Corp. Consolidated Financial Report For the Fiscal Year Ended March 31, 2018
52
3. Business combinations
For the fiscal year ended March 31, 2017
(1) Arm a. Overview of combination
On July 18, 2016 (GMT), the Company and Arm, located in the United Kingdom, entered into an agreement on the terms of a recommended all-cash acquisition of the entire issued and to be issued share capital of Arm by the Company for a total acquisition price of approximately £24.0 billion (approximately ¥3.3 trillion) by means of an English court-sanctioned scheme of arrangement (“Acquisition”). The Acquisition was approved at Arm’s general meeting of shareholders held on August 30, 2016, and at the English court hearing held on September 1, 2016, and came into effect on September 5, 2016.
As a result of the transaction, Arm became a wholly-owned subsidiary of the Company.
b. Purpose of acquisition
The Company believes Arm is one of the world’s leading technology companies, with strong capabilities in global semiconductor intellectual property and the “Internet of Things,” and a proven track record of innovation.
The board and management of the Company believe that the acquisition of Arm by the Company will deliver the following benefits:
・Support and accelerate Arm’s position as the global leader in intellectual property licensing and R&D
outsourcing for semiconductor companies
The Company’s deep industry expertise and global network of relationships will accelerate adoption of Arm’s intellectual property across existing and new markets.
・Maintain Arm’s dedication to innovation
The Company intends to sustain Arm’s long-term focus on generating more value per device, and driving licensing wins and future royalty streams in new growth categories, specifically “Enterprise and Embedded Intelligence.”
・Increased investment to drive the next wave of innovation
The Company intends to support Arm’s multiple growth initiatives by investing in engineering talent and complementary acquisitions with the aim of ensuring Arm maintains an R&D edge over existing and emerging competitors. The Company believes such an investment strategy in long-term growth will be easier to execute as a non-listed company.
・Shared culture and long-term vision
The Company believes the two companies share the same technology-oriented culture, long-term vision, focus on innovation and commitment to attracting, developing and retaining top talent. These common values will be the foundation for a strong strategic partnership necessary to capture the significant opportunities ahead.
・Maintain and grow the UK’s leadership in science and technology
The Company is investing in the UK as a world leader in science and technology development and innovation and, as evidence of this, intends to invest in multiple Arm growth initiatives, at least doubling the number of Arm employees in the UK over the next five years.
SoftBank Group Corp. Consolidated Financial Report For the Fiscal Year Ended March 31, 2018
53
c. Summary of Arm
(a) Name Arm Holdings plc
(b) Address 110 Fulbourn Road, Cambridge CB1 9NJ, United Kingdom
(c) Name and title of representative Simon Segars, Chief Executive Officer
(d) Nature of business ・Design of microprocessor intellectual property and related technology
・Sale of software tools
(e) Share capital £0.7 million (as of December 31, 2015)
(f) Date of incorporation October 16, 1990
(g) Consolidated net sales £968 million
(For the fiscal year ended December 31, 2015 under IFRSs)
d. Acquisition date
September 5, 2016
e. Consideration transferred and the component
(Millions of yen)
Acquisition date
(September 5, 2016) Payment for the acquisition by cash 3,319,137 Fair value of equity interest in Arm already held at the
time of the acquisition 47,867
Total consideration transferred A 3,367,004
Acquisition-related costs of ¥25,780 million arising from the business combination are recognized in “Other
operating loss.”
As a result of the revaluation of the 1.4% equity interest already held by the Company at the time of the
acquisition of control in Arm at fair value, the Company recognized a gain of ¥18,168 million through the step
acquisition. This gain is presented as “Gain from remeasurement relating to business combination” in the
consolidated statement of income.
SoftBank Group Corp. Consolidated Financial Report For the Fiscal Year Ended March 31, 2018
54
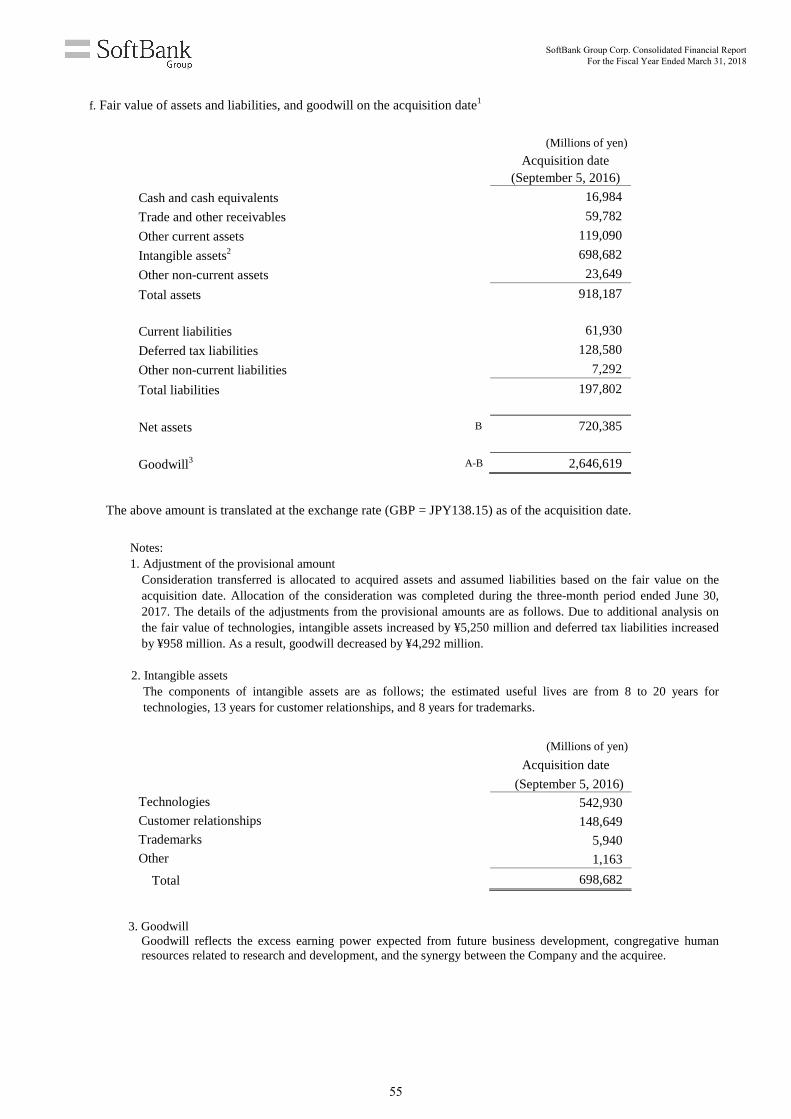
f. Fair value of assets and liabilities, and goodwill on the acquisition date1
(Millions of yen)
Acquisition date
(September 5, 2016)
Cash and cash equivalents 16,984
Trade and other receivables 59,782
Other current assets 119,090
Intangible assets2 698,682
Other non-current assets 23,649
Total assets 918,187
Current liabilities 61,930
Deferred tax liabilities 128,580
Other non-current liabilities 7,292
Total liabilities 197,802
Net assets B 720,385
Goodwill3 A-B 2,646,619
The above amount is translated at the exchange rate (GBP = JPY138.15) as of the acquisition date.
Notes: 1. Adjustment of the provisional amount
Consideration transferred is allocated to acquired assets and assumed liabilities based on the fair value on the acquisition date. Allocation of the consideration was completed during the three-month period ended June 30, 2017. The details of the adjustments from the provisional amounts are as follows. Due to additional analysis on the fair value of technologies, intangible assets increased by ¥5,250 million and deferred tax liabilities increased by ¥958 million. As a result, goodwill decreased by ¥4,292 million.
2. Intangible assets
The components of intangible assets are as follows; the estimated useful lives are from 8 to 20 years for technologies, 13 years for customer relationships, and 8 years for trademarks.
(Millions of yen)
Acquisition date
(September 5, 2016) Technologies 542,930 Customer relationships 148,649 Trademarks 5,940 Other 1,163
Total 698,682
3. Goodwill
Goodwill reflects the excess earning power expected from future business development, congregative human resources related to research and development, and the synergy between the Company and the acquiree.
SoftBank Group Corp. Consolidated Financial Report For the Fiscal Year Ended March 31, 2018
55
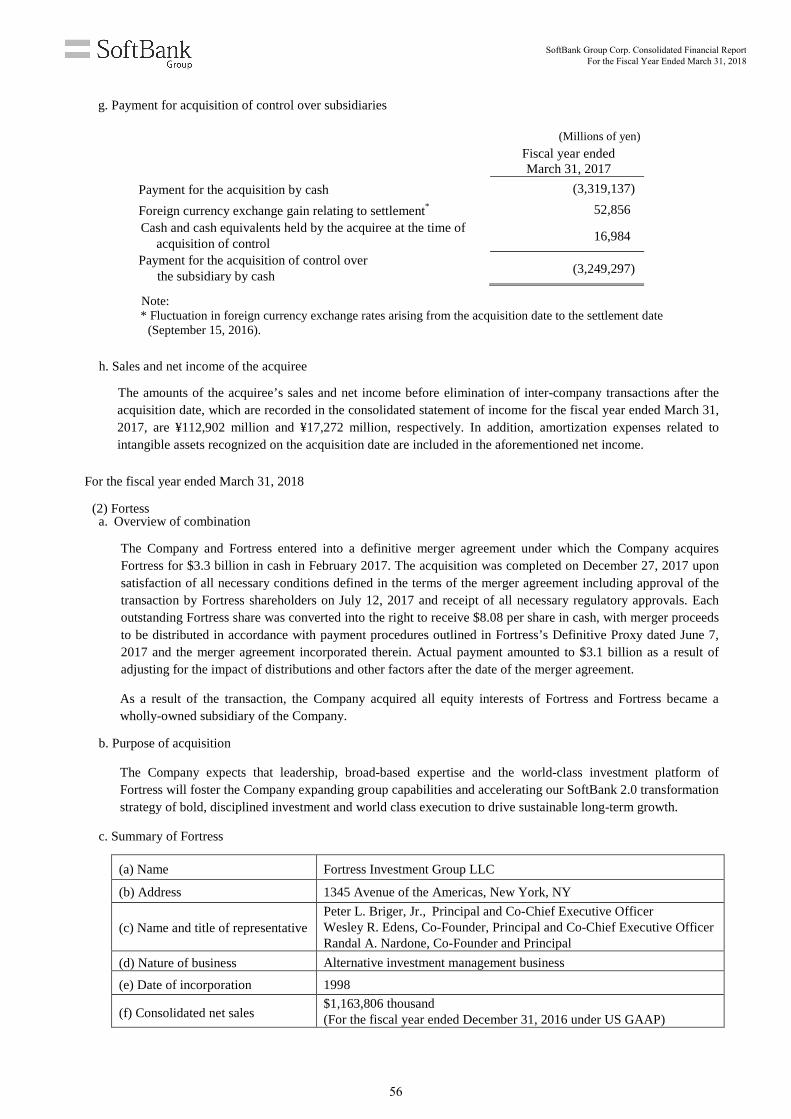
g. Payment for acquisition of control over subsidiaries
(Millions of yen)
Fiscal year ended March 31, 2017
Payment for the acquisition by cash (3,319,137)
Foreign currency exchange gain relating to settlement* 52,856 Cash and cash equivalents held by the acquiree at the time of
acquisition of control 16,984
Payment for the acquisition of control over the subsidiary by cash
(3,249,297)
Note: * Fluctuation in foreign currency exchange rates arising from the acquisition date to the settlement date
(September 15, 2016).
h. Sales and net income of the acquiree
The amounts of the acquiree’s sales and net income before elimination of inter-company transactions after the acquisition date, which are recorded in the consolidated statement of income for the fiscal year ended March 31, 2017, are ¥112,902 million and ¥17,272 million, respectively. In addition, amortization expenses related to intangible assets recognized on the acquisition date are included in the aforementioned net income.
For the fiscal year ended March 31, 2018
(2) Fortess a. Overview of combination
The Company and Fortress entered into a definitive merger agreement under which the Company acquires Fortress for $3.3 billion in cash in February 2017. The acquisition was completed on December 27, 2017 upon satisfaction of all necessary conditions defined in the terms of the merger agreement including approval of the transaction by Fortress shareholders on July 12, 2017 and receipt of all necessary regulatory approvals. Each outstanding Fortress share was converted into the right to receive $8.08 per share in cash, with merger proceeds to be distributed in accordance with payment procedures outlined in Fortress’s Definitive Proxy dated June 7, 2017 and the merger agreement incorporated therein. Actual payment amounted to $3.1 billion as a result of adjusting for the impact of distributions and other factors after the date of the merger agreement.
As a result of the transaction, the Company acquired all equity interests of Fortress and Fortress became a wholly-owned subsidiary of the Company.
b. Purpose of acquisition
The Company expects that leadership, broad-based expertise and the world-class investment platform of Fortress will foster the Company expanding group capabilities and accelerating our SoftBank 2.0 transformation strategy of bold, disciplined investment and world class execution to drive sustainable long-term growth.
c. Summary of Fortress
(a) Name Fortress Investment Group LLC
(b) Address 1345 Avenue of the Americas, New York, NY
(c) Name and title of representative Peter L. Briger, Jr., Principal and Co-Chief Executive Officer Wesley R. Edens, Co-Founder, Principal and Co-Chief Executive Officer Randal A. Nardone, Co-Founder and Principal
(d) Nature of business Alternative investment management business
(e) Date of incorporation 1998
(f) Consolidated net sales $1,163,806 thousand (For the fiscal year ended December 31, 2016 under US GAAP)
SoftBank Group Corp. Consolidated Financial Report For the Fiscal Year Ended March 31, 2018
56
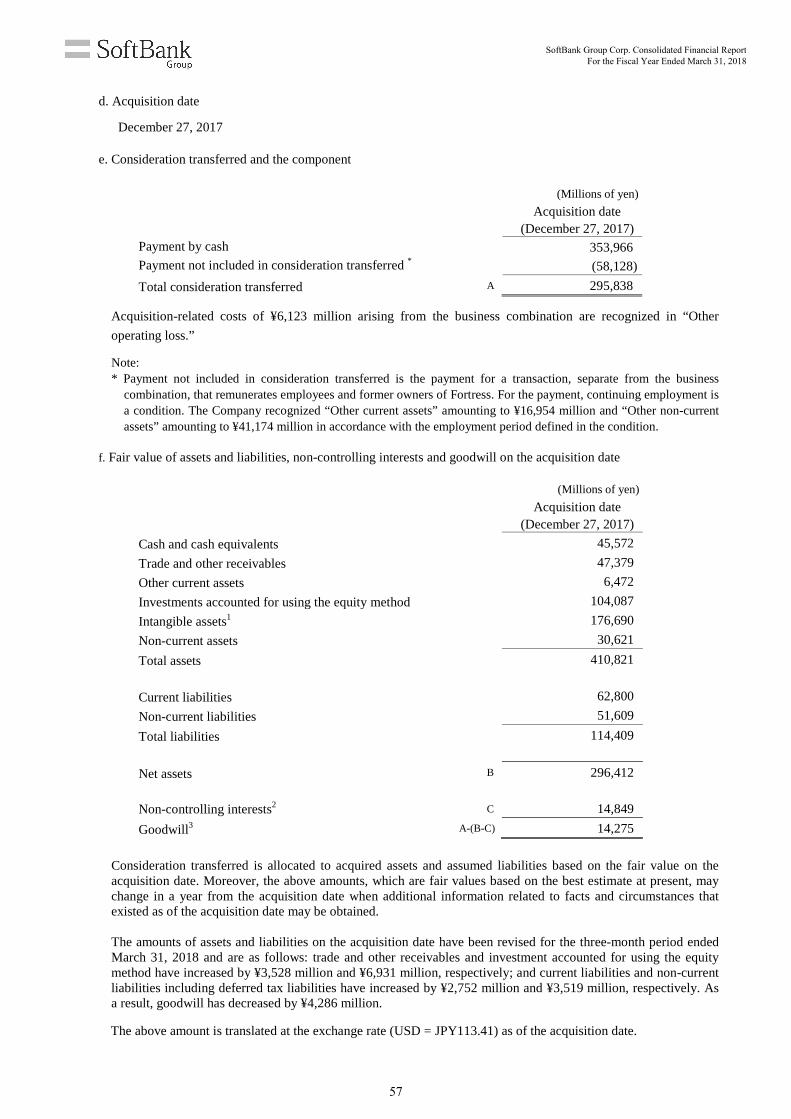
d. Acquisition date
December 27, 2017
e. Consideration transferred and the component
(Millions of yen)
Acquisition date
(December 27, 2017) Payment by cash 353,966 Payment not included in consideration transferred * (58,128)
Total consideration transferred A 295,838
Acquisition-related costs of ¥6,123 million arising from the business combination are recognized in “Other
operating loss.” Note: * Payment not included in consideration transferred is the payment for a transaction, separate from the business
combination, that remunerates employees and former owners of Fortress. For the payment, continuing employment is a condition. The Company recognized “Other current assets” amounting to ¥16,954 million and “Other non-current assets” amounting to ¥41,174 million in accordance with the employment period defined in the condition.
f. Fair value of assets and liabilities, non-controlling interests and goodwill on the acquisition date
(Millions of yen)
Acquisition date
(December 27, 2017)
Cash and cash equivalents 45,572
Trade and other receivables 47,379
Other current assets 6,472
Investments accounted for using the equity method 104,087
Intangible assets1 176,690
Non-current assets 30,621
Total assets 410,821
Current liabilities 62,800
Non-current liabilities 51,609
Total liabilities 114,409
Net assets B 296,412 Non-controlling interests2 C 14,849
Goodwill3 A-(B-C) 14,275
Consideration transferred is allocated to acquired assets and assumed liabilities based on the fair value on the acquisition date. Moreover, the above amounts, which are fair values based on the best estimate at present, may change in a year from the acquisition date when additional information related to facts and circumstances that existed as of the acquisition date may be obtained. The amounts of assets and liabilities on the acquisition date have been revised for the three-month period ended March 31, 2018 and are as follows: trade and other receivables and investment accounted for using the equity method have increased by ¥3,528 million and ¥6,931 million, respectively; and current liabilities and non-current liabilities including deferred tax liabilities have increased by ¥2,752 million and ¥3,519 million, respectively. As a result, goodwill has decreased by ¥4,286 million.
The above amount is translated at the exchange rate (USD = JPY113.41) as of the acquisition date.
SoftBank Group Corp. Consolidated Financial Report For the Fiscal Year Ended March 31, 2018
57
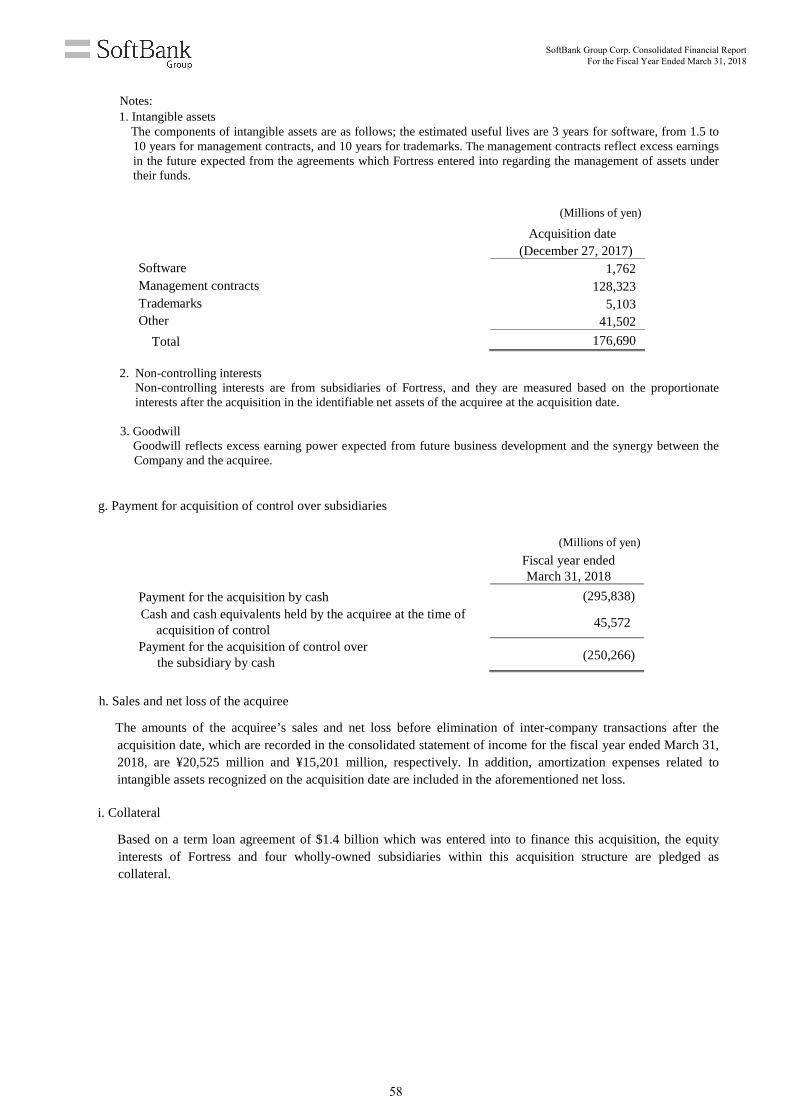
Notes: 1. Intangible assets
The components of intangible assets are as follows; the estimated useful lives are 3 years for software, from 1.5 to 10 years for management contracts, and 10 years for trademarks. The management contracts reflect excess earnings in the future expected from the agreements which Fortress entered into regarding the management of assets under their funds.
(Millions of yen)
Acquisition date
(December 27, 2017) Software 1,762 Management contracts 128,323 Trademarks 5,103 Other 41,502
Total 176,690
2. Non-controlling interests Non-controlling interests are from subsidiaries of Fortress, and they are measured based on the proportionate interests after the acquisition in the identifiable net assets of the acquiree at the acquisition date.
3. Goodwill
Goodwill reflects excess earning power expected from future business development and the synergy between the Company and the acquiree.
g. Payment for acquisition of control over subsidiaries
(Millions of yen)
Fiscal year ended March 31, 2018
Payment for the acquisition by cash (295,838) Cash and cash equivalents held by the acquiree at the time of
acquisition of control 45,572
Payment for the acquisition of control over the subsidiary by cash
(250,266)
h. Sales and net loss of the acquiree
The amounts of the acquiree’s sales and net loss before elimination of inter-company transactions after the acquisition date, which are recorded in the consolidated statement of income for the fiscal year ended March 31, 2018, are ¥20,525 million and ¥15,201 million, respectively. In addition, amortization expenses related to intangible assets recognized on the acquisition date are included in the aforementioned net loss.
i. Collateral
Based on a term loan agreement of $1.4 billion which was entered into to finance this acquisition, the equity interests of Fortress and four wholly-owned subsidiaries within this acquisition structure are pledged as collateral.
SoftBank Group Corp. Consolidated Financial Report For the Fiscal Year Ended March 31, 2018
58
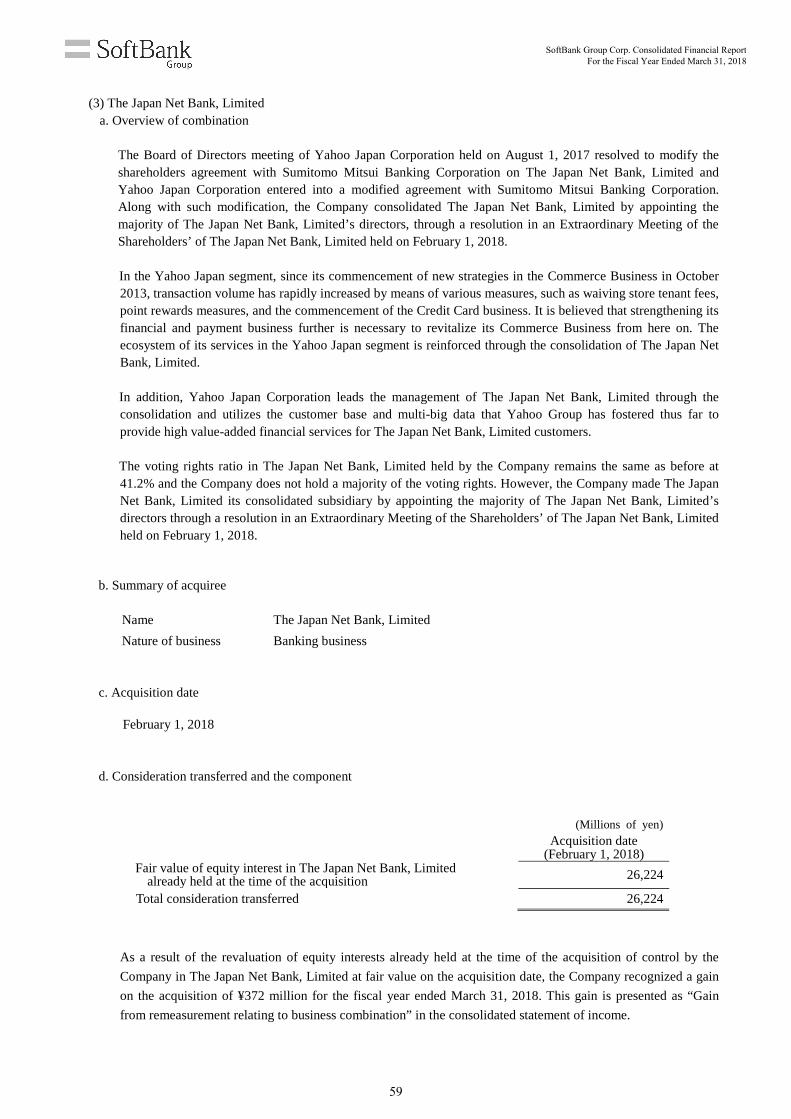
(3) The Japan Net Bank, Limited a. Overview of combination
The Board of Directors meeting of Yahoo Japan Corporation held on August 1, 2017 resolved to modify the shareholders agreement with Sumitomo Mitsui Banking Corporation on The Japan Net Bank, Limited and Yahoo Japan Corporation entered into a modified agreement with Sumitomo Mitsui Banking Corporation. Along with such modification, the Company consolidated The Japan Net Bank, Limited by appointing the majority of The Japan Net Bank, Limited’s directors, through a resolution in an Extraordinary Meeting of the Shareholders’ of The Japan Net Bank, Limited held on February 1, 2018. In the Yahoo Japan segment, since its commencement of new strategies in the Commerce Business in October 2013, transaction volume has rapidly increased by means of various measures, such as waiving store tenant fees, point rewards measures, and the commencement of the Credit Card business. It is believed that strengthening its financial and payment business further is necessary to revitalize its Commerce Business from here on. The ecosystem of its services in the Yahoo Japan segment is reinforced through the consolidation of The Japan Net Bank, Limited. In addition, Yahoo Japan Corporation leads the management of The Japan Net Bank, Limited through the consolidation and utilizes the customer base and multi-big data that Yahoo Group has fostered thus far to provide high value-added financial services for The Japan Net Bank, Limited customers. The voting rights ratio in The Japan Net Bank, Limited held by the Company remains the same as before at 41.2% and the Company does not hold a majority of the voting rights. However, the Company made The Japan Net Bank, Limited its consolidated subsidiary by appointing the majority of The Japan Net Bank, Limited’s directors through a resolution in an Extraordinary Meeting of the Shareholders’ of The Japan Net Bank, Limited held on February 1, 2018.
b. Summary of acquiree
Name The Japan Net Bank, Limited
Nature of business Banking business
c. Acquisition date
February 1, 2018
d. Consideration transferred and the component
(Millions of yen)
Acquisition date (February 1, 2018)
Fair value of equity interest in The Japan Net Bank, Limited already held at the time of the acquisition 26,224
Total consideration transferred 26,224
As a result of the revaluation of equity interests already held at the time of the acquisition of control by the
Company in The Japan Net Bank, Limited at fair value on the acquisition date, the Company recognized a gain
on the acquisition of ¥372 million for the fiscal year ended March 31, 2018. This gain is presented as “Gain
from remeasurement relating to business combination” in the consolidated statement of income.
SoftBank Group Corp. Consolidated Financial Report For the Fiscal Year Ended March 31, 2018
59
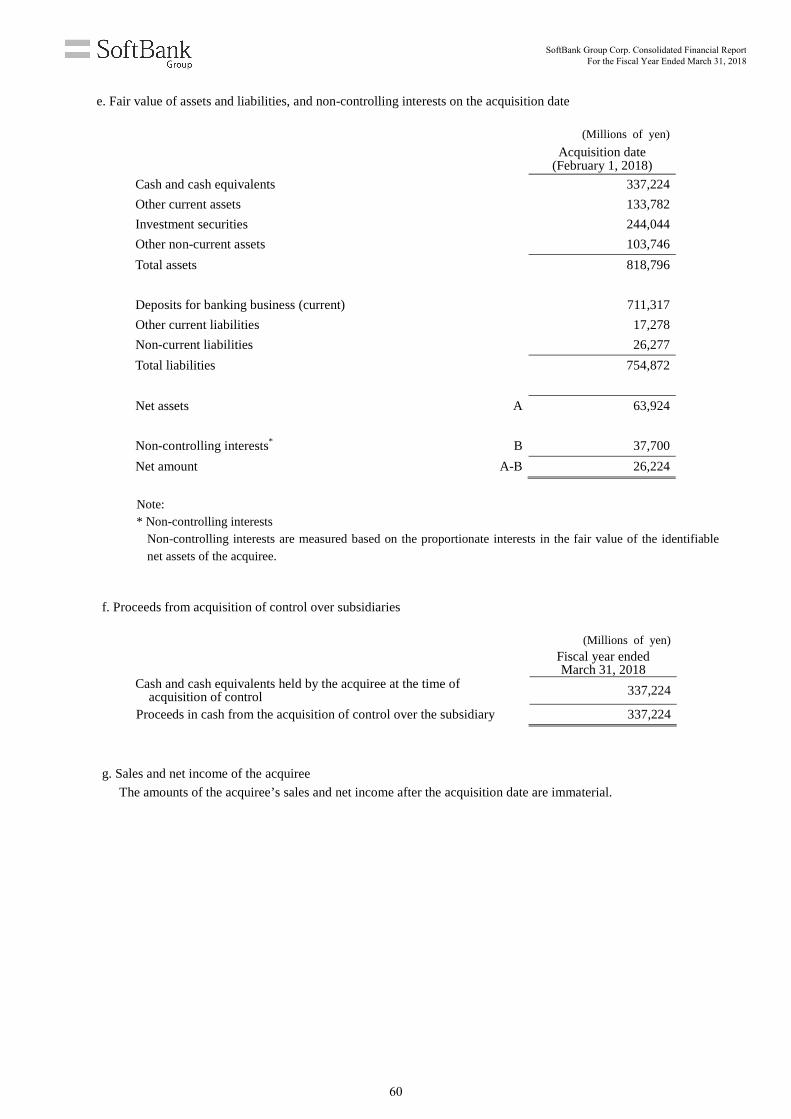
e. Fair value of assets and liabilities, and non-controlling interests on the acquisition date
(Millions of yen)
Acquisition date (February 1, 2018)
Cash and cash equivalents 337,224
Other current assets 133,782
Investment securities 244,044
Other non-current assets 103,746
Total assets 818,796
Deposits for banking business (current) 711,317
Other current liabilities 17,278
Non-current liabilities 26,277
Total liabilities 754,872
Net assets A 63,924
Non-controlling interests* B 37,700
Net amount A-B 26,224
Note: * Non-controlling interests
Non-controlling interests are measured based on the proportionate interests in the fair value of the identifiable net assets of the acquiree.
f. Proceeds from acquisition of control over subsidiaries
(Millions of yen)
Fiscal year ended March 31, 2018
Cash and cash equivalents held by the acquiree at the time of acquisition of control 337,224
Proceeds in cash from the acquisition of control over the subsidiary 337,224
g. Sales and net income of the acquiree
The amounts of the acquiree’s sales and net income after the acquisition date are immaterial.
SoftBank Group Corp. Consolidated Financial Report For the Fiscal Year Ended March 31, 2018
60
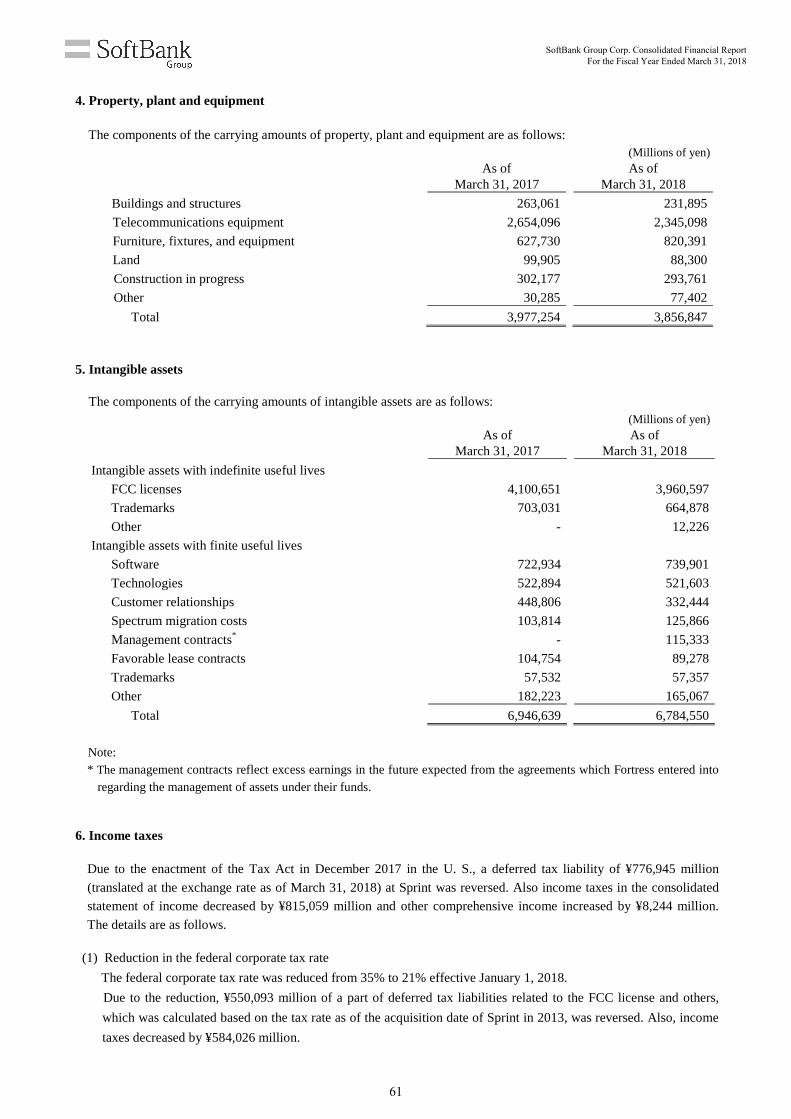
4. Property, plant and equipment The components of the carrying amounts of property, plant and equipment are as follows:
(Millions of yen)
As of
March 31, 2017 As of
March 31, 2018
Buildings and structures 263,061 231,895
Telecommunications equipment 2,654,096 2,345,098
Furniture, fixtures, and equipment 627,730 820,391
Land 99,905 88,300
Construction in progress 302,177 293,761
Other 30,285 77,402
Total 3,977,254 3,856,847
5. Intangible assets
The components of the carrying amounts of intangible assets are as follows: (Millions of yen)
As of
March 31, 2017 As of
March 31, 2018
Intangible assets with indefinite useful lives
FCC licenses 4,100,651 3,960,597
Trademarks 703,031 664,878
Other - 12,226
Intangible assets with finite useful lives
Software 722,934 739,901
Technologies 522,894 521,603
Customer relationships 448,806 332,444
Spectrum migration costs 103,814 125,866
Management contracts* - 115,333
Favorable lease contracts 104,754 89,278
Trademarks 57,532 57,357
Other 182,223 165,067
Total 6,946,639 6,784,550
Note: * The management contracts reflect excess earnings in the future expected from the agreements which Fortress entered into
regarding the management of assets under their funds. 6. Income taxes
Due to the enactment of the Tax Act in December 2017 in the U. S., a deferred tax liability of ¥776,945 million
(translated at the exchange rate as of March 31, 2018) at Sprint was reversed. Also income taxes in the consolidated
statement of income decreased by ¥815,059 million and other comprehensive income increased by ¥8,244 million.
The details are as follows.
(1) Reduction in the federal corporate tax rate
The federal corporate tax rate was reduced from 35% to 21% effective January 1, 2018.
Due to the reduction, ¥550,093 million of a part of deferred tax liabilities related to the FCC license and others,
which was calculated based on the tax rate as of the acquisition date of Sprint in 2013, was reversed. Also, income
taxes decreased by ¥584,026 million.
SoftBank Group Corp. Consolidated Financial Report For the Fiscal Year Ended March 31, 2018
61
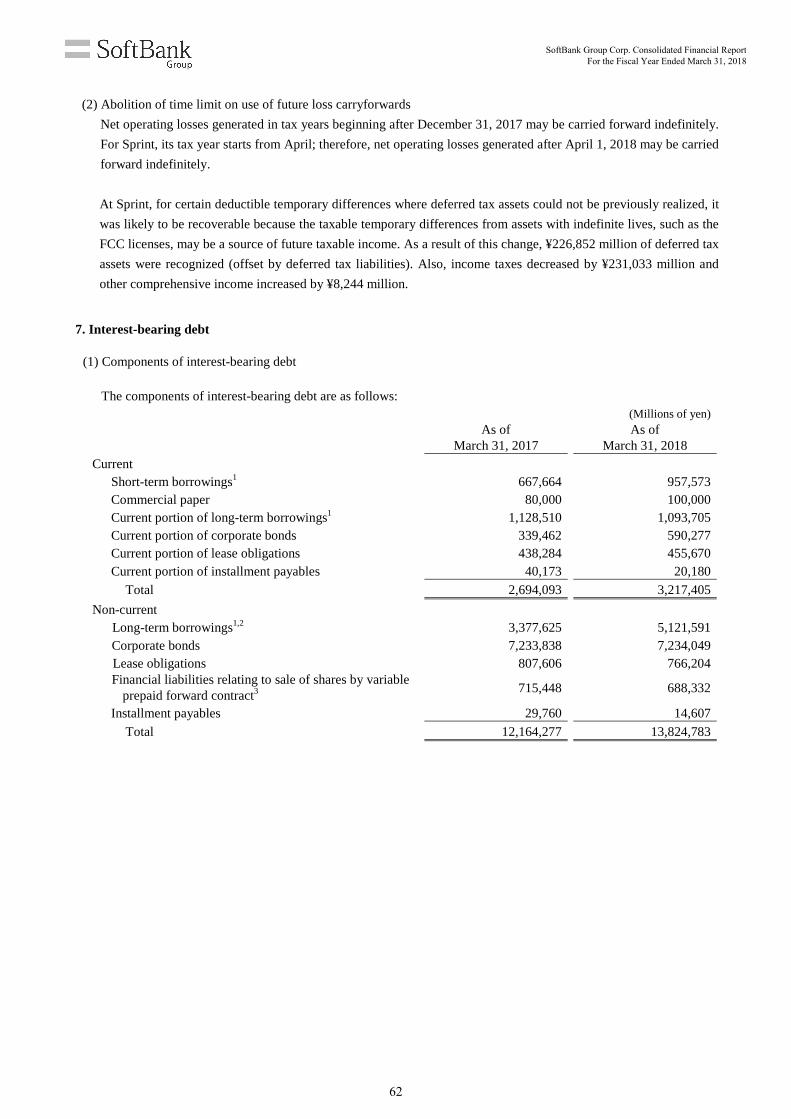
(2) Abolition of time limit on use of future loss carryforwards
Net operating losses generated in tax years beginning after December 31, 2017 may be carried forward indefinitely.
For Sprint, its tax year starts from April; therefore, net operating losses generated after April 1, 2018 may be carried
forward indefinitely.
At Sprint, for certain deductible temporary differences where deferred tax assets could not be previously realized, it
was likely to be recoverable because the taxable temporary differences from assets with indefinite lives, such as the
FCC licenses, may be a source of future taxable income. As a result of this change, ¥226,852 million of deferred tax
assets were recognized (offset by deferred tax liabilities). Also, income taxes decreased by ¥231,033 million and
other comprehensive income increased by ¥8,244 million. 7. Interest-bearing debt
(1) Components of interest-bearing debt The components of interest-bearing debt are as follows:
(Millions of yen)
As of March 31, 2017
As of March 31, 2018
Current Short-term borrowings1 667,664 957,573 Commercial paper 80,000 100,000 Current portion of long-term borrowings1 1,128,510 1,093,705 Current portion of corporate bonds 339,462 590,277 Current portion of lease obligations 438,284 455,670 Current portion of installment payables 40,173 20,180
Total 2,694,093 3,217,405
Non-current Long-term borrowings1,2 3,377,625 5,121,591 Corporate bonds 7,233,838 7,234,049 Lease obligations 807,606 766,204 Financial liabilities relating to sale of shares by variable
prepaid forward contract3 715,448
688,332
Installment payables 29,760 14,607
Total 12,164,277 13,824,783
SoftBank Group Corp. Consolidated Financial Report For the Fiscal Year Ended March 31, 2018
62
Notes:
1. The amounts of SoftBank Vision Fund and Delta Fund interest-bearing debt included in the above components of
interest-bearing debt are as follows:
As of March 31, 2017
As of March 31, 2018
Current Short-term borrowings - 87,259 Current portion of long-term borrowings - 313,143
Total - 400,402
Non-current Long-term borrowings - 108,749
Total - 108,749
SoftBank Vision Fund and Delta Fund interest-bearing debt (before elimination of inter-company transactions)
- 509,151
Eliminated amount of inter-company transactions - (10,744) SoftBank Vision Fund and Delta Fund interest-bearing debt
(after elimination of inter-company transactions) - 498,407
Investments from SoftBank Vision Fund and Delta Fund aggregating ¥718,803 million accounted for using FVTPL are pledged as collateral for ¥498,407 million of interest-bearing debt, which is included in the above table.
2. ¥363,384 million of Alibaba shares (carrying amount on a consolidated basis) held by a wholly-owned subsidiary of the
Company, is pledged as collateral for ¥842,313 million of long-term borrowings of the subsidiary as of March 31, 2018.
The borrowings include an early settlement clause and an early settlement may be elected under certain circumstances
such as a significant decrease in the fair value of pledged Alibaba shares. The borrowings are non-recourse debts, and
therefore, SoftBank Group Corp. will not be responsible for the borrowings. The creditors would be able to dispose the
asset pledged as collateral upon a circumstance where the early settlement was demanded and the subsidiary did not
repay the borrowings, accordingly.
3. The details are described in “(2) Transaction for sale of Alibaba shares by variable prepaid forward contract.”
(2) Transaction for sale of Alibaba shares by variable prepaid forward contract
On June 10, 2016, West Raptor Holdings, LLC (“WRH LLC”), a wholly-owned subsidiary of the Company, entered into a variable prepaid forward contract to sell Alibaba shares with a newly formed trust, Mandatory Exchangeable Trust (the “Trust”), and received proceeds of ¥578,436 million ($5.4 billion) as advances received on the sale. The Trust, on the other hand, utilized Alibaba shares scheduled to be transferred from WRH LLC at the time of settlement under the contract and issued $6.6 billion of Mandatory Exchangeable Trust Securities (“Trust Securities”) which are mandatorily exchangeable into American Depositary Shares (“ADSs”) of Alibaba. The proceeds from the sale received by WRH LLC from the Trust was $5.4 billion, which is after certain amounts from the $6.6 billion total of Trust Securities were deducted in order to purchase U.S. Treasury securities, which would fund distributions on the Trust Securities, and cover expenses for the issuance of the Trust Securities. The settlement of the Alibaba shares based on the variable prepaid forward contract is conducted concurrently with the exchange of Trust Securities. At the exchange date, which is expected to be the first scheduled trading day after June 1, 2019, Trust Securities are exchanged for a certain number of ADSs, determined by reference to the trading price of the ADSs at that time, and the number of Alibaba shares sold by the variable prepaid forward contract is determined by this number of ADSs. A cap and a floor are set for the number of shares settled, and the variable prepaid forward contract is classified as a hybrid financial instrument with embedded derivatives of a collar transaction.
SoftBank Group Corp. Consolidated Financial Report For the Fiscal Year Ended March 31, 2018
63
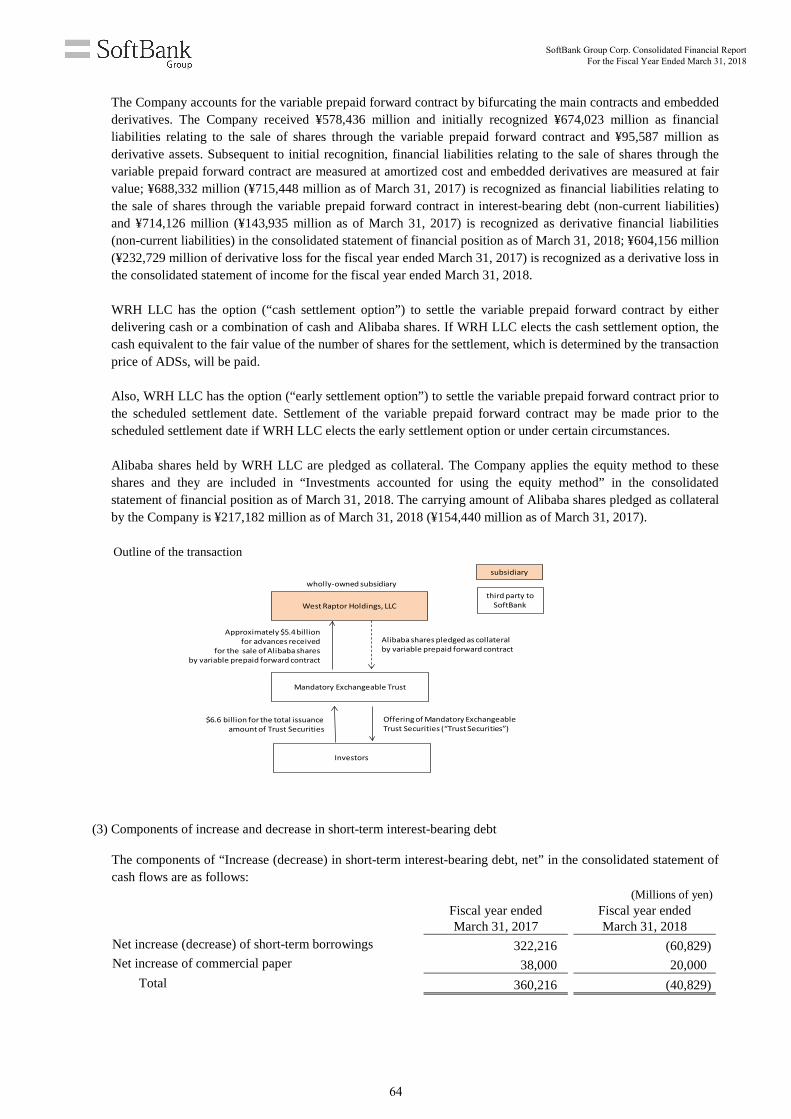
The Company accounts for the variable prepaid forward contract by bifurcating the main contracts and embedded derivatives. The Company received ¥578,436 million and initially recognized ¥674,023 million as financial liabilities relating to the sale of shares through the variable prepaid forward contract and ¥95,587 million as derivative assets. Subsequent to initial recognition, financial liabilities relating to the sale of shares through the variable prepaid forward contract are measured at amortized cost and embedded derivatives are measured at fair value; ¥688,332 million (¥715,448 million as of March 31, 2017) is recognized as financial liabilities relating to the sale of shares through the variable prepaid forward contract in interest-bearing debt (non-current liabilities) and ¥714,126 million (¥143,935 million as of March 31, 2017) is recognized as derivative financial liabilities (non-current liabilities) in the consolidated statement of financial position as of March 31, 2018; ¥604,156 million (¥232,729 million of derivative loss for the fiscal year ended March 31, 2017) is recognized as a derivative loss in the consolidated statement of income for the fiscal year ended March 31, 2018. WRH LLC has the option (“cash settlement option”) to settle the variable prepaid forward contract by either delivering cash or a combination of cash and Alibaba shares. If WRH LLC elects the cash settlement option, the cash equivalent to the fair value of the number of shares for the settlement, which is determined by the transaction price of ADSs, will be paid. Also, WRH LLC has the option (“early settlement option”) to settle the variable prepaid forward contract prior to the scheduled settlement date. Settlement of the variable prepaid forward contract may be made prior to the scheduled settlement date if WRH LLC elects the early settlement option or under certain circumstances. Alibaba shares held by WRH LLC are pledged as collateral. The Company applies the equity method to these shares and they are included in “Investments accounted for using the equity method” in the consolidated statement of financial position as of March 31, 2018. The carrying amount of Alibaba shares pledged as collateral by the Company is ¥217,182 million as of March 31, 2018 (¥154,440 million as of March 31, 2017). Outline of the transaction
(3) Components of increase and decrease in short-term interest-bearing debt
The components of “Increase (decrease) in short-term interest-bearing debt, net” in the consolidated statement of cash flows are as follows:
(Millions of yen)
Fiscal year ended March 31, 2017
Fiscal year ended March 31, 2018
Net increase (decrease) of short-term borrowings 322,216 (60,829) Net increase of commercial paper 38,000 20,000
Total 360,216 (40,829)
West Raptor Holdings, LLC
Alibaba shares pledged as collateral by variable prepaid forward contract
Approximately $5.4 billionfor advances received
for the sale of Alibaba sharesby variable prepaid forward contract
Offering of Mandatory Exchangeable Trust Securities (“Trust Securities”)
$6.6 billion for the total issuance amount of Trust Securities
subsidiarywholly-owned subsidiary
Mandatory Exchangeable Trust
Investors
third party to SoftBank
SoftBank Group Corp. Consolidated Financial Report For the Fiscal Year Ended March 31, 2018
64
(4) Components of proceeds from interest-bearing debt
The components of “Proceeds from interest-bearing debt” in the consolidated statement of cash flows are as follows:
(Millions of yen)
Fiscal year ended March 31, 2017
Fiscal year ended March 31, 2018
Proceeds from borrowings 2,715,725 7,176,036
Proceeds from issuance of corporate bonds 1,006,000 899,079 Proceeds from sale-leaseback of newly acquired
equipment 492,369 472,231
Proceeds from advances received for sale of shares by variable prepaid forward contract
578,436 -
Total 4,792,530 8,547,346
(5) Components of repayment of interest-bearing debt
The components of “Repayment of interest-bearing debt” in the consolidated statement of cash flows are as follows:
(Millions of yen)
Fiscal year ended March 31, 2017
Fiscal year ended March 31, 2018
Repayment of borrowings (920,315) (4,988,513) Redemption of corporate bonds (862,281) (474,975) Repayment of lease obligations (459,788) (502,520) Payment of installment payables (40,683) (37,180)
Total (2,283,067) (6,003,188)
8. Foreign currency exchange rates
Exchange rates of the major currencies used for translating financial statements of foreign operations are as follows:
(1) Rate at the end of the period (yen) As of
March 31, 2017 As of
March 31, 2018 USD 112.19 106.24
GBP 140.08 148.84
(2) Average rate for the quarter
For the fiscal year ended March 31, 2017
(yen)
Three-month period ended
June 30, 2016
Three-month period ended
September 30, 2016
Three-month period ended
December 31, 2016
Three-month period ended
March 31, 2017 USD 109.07 102.91 108.72 113.76
GBP* - 132.95 135.56 141.33
Note: * Average rate described for the three-month period ended September 30, 2016 is the average rate for the
one-month period of September 30, 2016.
SoftBank Group Corp. Consolidated Financial Report For the Fiscal Year Ended March 31, 2018
65
For the fiscal year ended March 31, 2018
(yen)
Three-month period ended
June 30, 2017
Three-month period ended
September 30, 2017
Three-month period ended
December 31, 2017
Three-month period ended
March 31, 2018 USD 111.61 111.38 112.74 108.85
GBP 142.92 146.20 150.77 151.01
9. Equity
The components of accumulated other comprehensive income are as follows: (Millions of yen)
As of March 31, 2017
As of March 31, 2018
Available-for-sale financial assets 11,983 63,700
Cash flow hedges (44,877) (55,286)
Exchange differences on translating foreign operations
244,140 309,545
Total 211,246 317,959
10. Other equity instruments
On July 19, 2017, the Company issued USD-denominated Undated Subordinated Non-Call 6 years (“NC6”)
Resettable Notes and USD-denominated Undated Subordinated Non-Call 10 years (“NC10”) Resettable Notes
(collectively, the “Hybrid Notes”).
The Hybrid Notes are classified as equity instruments in accordance with IFRSs because the Company has the option
to defer interest payments, the notes have no maturity date, and the Company has an unconditional right to avoid
delivering cash or another financial asset except for distribution of residual assets on liquidation. As a result of this
transaction, “Other equity instruments” is increased by ¥496,876 million (after deducting ¥7,034 million of
transaction costs) in the consolidated statement of financial position. The corresponding amount is recorded as
“Proceeds from issuance of other equity instruments” under cash flows from financing activities in the consolidated
statement of cash flows.
The payment of interest was completed on the interest payment date, January 19, 2018 and “Retained earnings”
decreased by ¥15,852 million as “Distribution to owners of other equity instruments” in the consolidated statement
of changes in equity.
Also, as of March 31, 2018, accrued interest, which is not recognized as a distribution to owners of other equity
instruments because the payment has not yet been determined, is ¥6,062 million.
SoftBank Group Corp. Consolidated Financial Report For the Fiscal Year Ended March 31, 2018
66
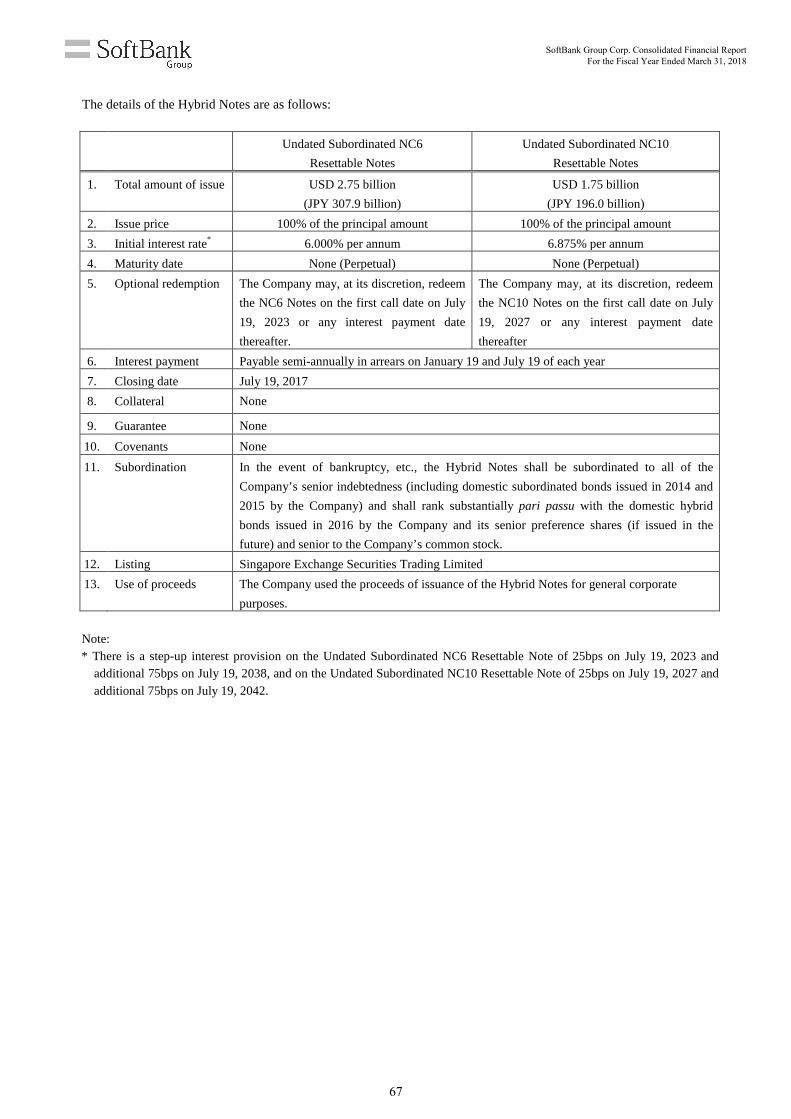
The details of the Hybrid Notes are as follows:
Undated Subordinated NC6
Resettable Notes
Undated Subordinated NC10
Resettable Notes
1. Total amount of issue USD 2.75 billion
(JPY 307.9 billion)
USD 1.75 billion
(JPY 196.0 billion)
2. Issue price 100% of the principal amount 100% of the principal amount
3. Initial interest rate* 6.000% per annum 6.875% per annum
4. Maturity date None (Perpetual) None (Perpetual)
5. Optional redemption The Company may, at its discretion, redeem
the NC6 Notes on the first call date on July
19, 2023 or any interest payment date
thereafter.
The Company may, at its discretion, redeem
the NC10 Notes on the first call date on July
19, 2027 or any interest payment date
thereafter
6. Interest payment Payable semi-annually in arrears on January 19 and July 19 of each year
7. Closing date July 19, 2017
8. Collateral None
9. Guarantee None
10. Covenants None
11. Subordination In the event of bankruptcy, etc., the Hybrid Notes shall be subordinated to all of the
Company’s senior indebtedness (including domestic subordinated bonds issued in 2014 and
2015 by the Company) and shall rank substantially pari passu with the domestic hybrid
bonds issued in 2016 by the Company and its senior preference shares (if issued in the
future) and senior to the Company’s common stock.
12. Listing Singapore Exchange Securities Trading Limited
13. Use of proceeds The Company used the proceeds of issuance of the Hybrid Notes for general corporate
purposes.
Note: * There is a step-up interest provision on the Undated Subordinated NC6 Resettable Note of 25bps on July 19, 2023 and
additional 75bps on July 19, 2038, and on the Undated Subordinated NC10 Resettable Note of 25bps on July 19, 2027 and additional 75bps on July 19, 2042.
SoftBank Group Corp. Consolidated Financial Report For the Fiscal Year Ended March 31, 2018
67
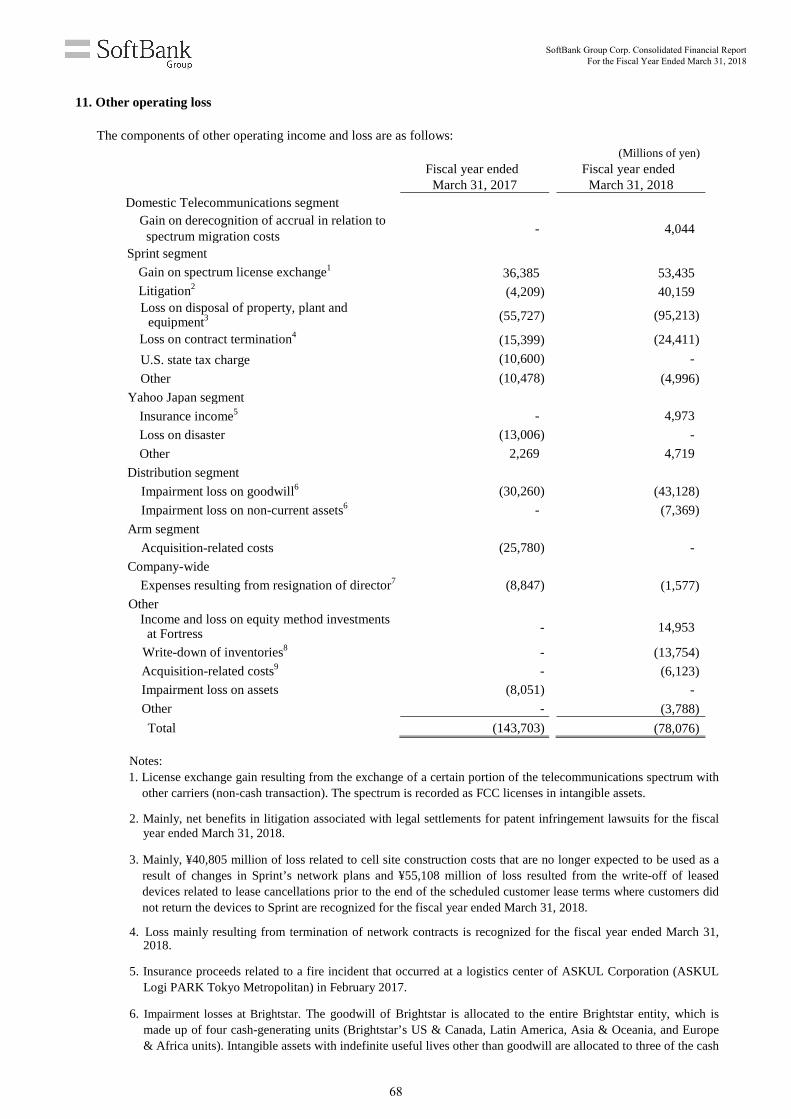
11. Other operating loss
The components of other operating income and loss are as follows: (Millions of yen)
Fiscal year ended March 31, 2017
Fiscal year ended March 31, 2018
Domestic Telecommunications segment Gain on derecognition of accrual in relation to
spectrum migration costs -
4,044
Sprint segment
Gain on spectrum license exchange1 36,385 53,435 Litigation2 (4,209) 40,159 Loss on disposal of property, plant and
equipment3 (55,727) (95,213)
Loss on contract termination4 (15,399) (24,411)
U.S. state tax charge (10,600) -
Other (10,478) (4,996)
Yahoo Japan segment
Insurance income5 - 4,973
Loss on disaster (13,006) -
Other 2,269 4,719
Distribution segment
Impairment loss on goodwill6 (30,260) (43,128)
Impairment loss on non-current assets6 - (7,369)
Arm segment
Acquisition-related costs (25,780) -
Company-wide
Expenses resulting from resignation of director7 (8,847) (1,577)
Other Income and loss on equity method investments
at Fortress - 14,953
Write-down of inventories8 - (13,754)
Acquisition-related costs9 - (6,123)
Impairment loss on assets (8,051) -
Other - (3,788)
Total (143,703) (78,076)
Notes: 1. License exchange gain resulting from the exchange of a certain portion of the telecommunications spectrum with
other carriers (non-cash transaction). The spectrum is recorded as FCC licenses in intangible assets. 2. Mainly, net benefits in litigation associated with legal settlements for patent infringement lawsuits for the fiscal
year ended March 31, 2018. 3. Mainly, ¥40,805 million of loss related to cell site construction costs that are no longer expected to be used as a
result of changes in Sprint’s network plans and ¥55,108 million of loss resulted from the write-off of leased devices related to lease cancellations prior to the end of the scheduled customer lease terms where customers did not return the devices to Sprint are recognized for the fiscal year ended March 31, 2018.
4. Loss mainly resulting from termination of network contracts is recognized for the fiscal year ended March 31,
2018. 5. Insurance proceeds related to a fire incident that occurred at a logistics center of ASKUL Corporation (ASKUL
Logi PARK Tokyo Metropolitan) in February 2017. 6. Impairment losses at Brightstar. The goodwill of Brightstar is allocated to the entire Brightstar entity, which is
made up of four cash-generating units (Brightstar’s US & Canada, Latin America, Asia & Oceania, and Europe & Africa units). Intangible assets with indefinite useful lives other than goodwill are allocated to three of the cash
SoftBank Group Corp. Consolidated Financial Report For the Fiscal Year Ended March 31, 2018
68
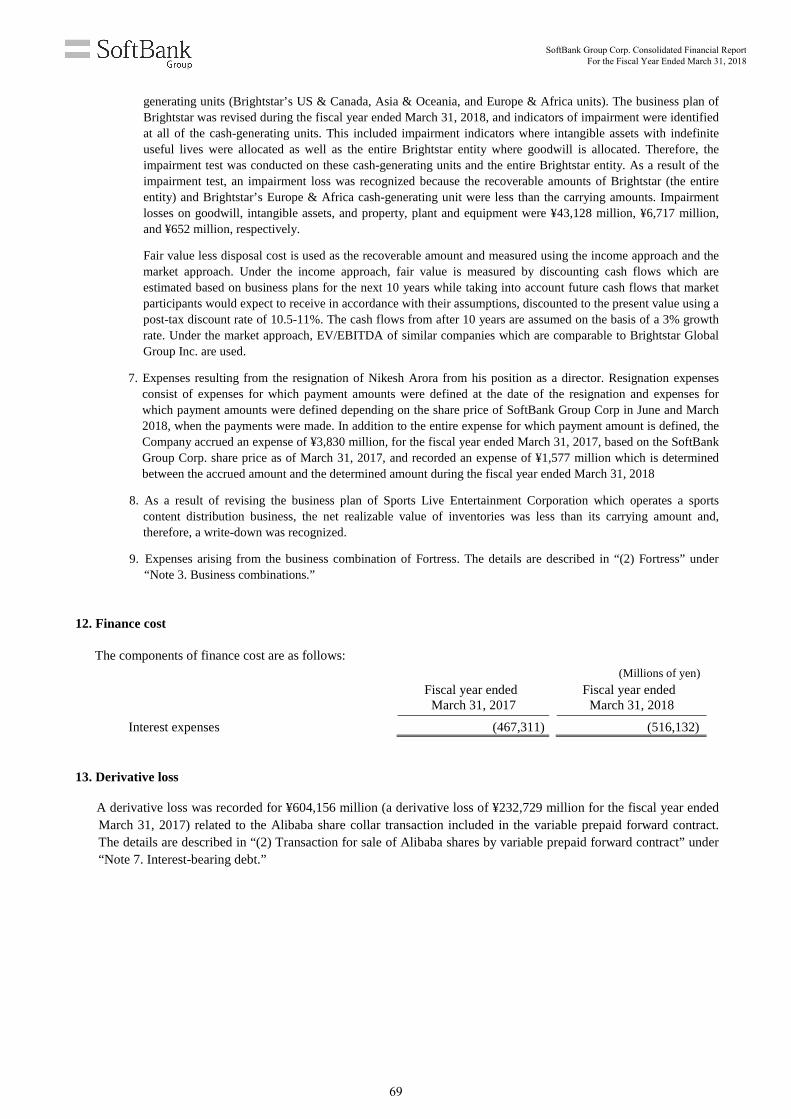
generating units (Brightstar’s US & Canada, Asia & Oceania, and Europe & Africa units). The business plan of Brightstar was revised during the fiscal year ended March 31, 2018, and indicators of impairment were identified at all of the cash-generating units. This included impairment indicators where intangible assets with indefinite useful lives were allocated as well as the entire Brightstar entity where goodwill is allocated. Therefore, the impairment test was conducted on these cash-generating units and the entire Brightstar entity. As a result of the impairment test, an impairment loss was recognized because the recoverable amounts of Brightstar (the entire entity) and Brightstar’s Europe & Africa cash-generating unit were less than the carrying amounts. Impairment losses on goodwill, intangible assets, and property, plant and equipment were ¥43,128 million, ¥6,717 million, and ¥652 million, respectively.
Fair value less disposal cost is used as the recoverable amount and measured using the income approach and the market approach. Under the income approach, fair value is measured by discounting cash flows which are estimated based on business plans for the next 10 years while taking into account future cash flows that market participants would expect to receive in accordance with their assumptions, discounted to the present value using a post-tax discount rate of 10.5-11%. The cash flows from after 10 years are assumed on the basis of a 3% growth rate. Under the market approach, EV/EBITDA of similar companies which are comparable to Brightstar Global Group Inc. are used.
7. Expenses resulting from the resignation of Nikesh Arora from his position as a director. Resignation expenses
consist of expenses for which payment amounts were defined at the date of the resignation and expenses for which payment amounts were defined depending on the share price of SoftBank Group Corp in June and March 2018, when the payments were made. In addition to the entire expense for which payment amount is defined, the Company accrued an expense of ¥3,830 million, for the fiscal year ended March 31, 2017, based on the SoftBank Group Corp. share price as of March 31, 2017, and recorded an expense of ¥1,577 million which is determined between the accrued amount and the determined amount during the fiscal year ended March 31, 2018
8. As a result of revising the business plan of Sports Live Entertainment Corporation which operates a sports
content distribution business, the net realizable value of inventories was less than its carrying amount and, therefore, a write-down was recognized.
9. Expenses arising from the business combination of Fortress. The details are described in “(2) Fortress” under
“Note 3. Business combinations.”
12. Finance cost The components of finance cost are as follows:
(Millions of yen)
Fiscal year ended March 31, 2017
Fiscal year ended March 31, 2018
Interest expenses (467,311) (516,132)
13. Derivative loss
A derivative loss was recorded for ¥604,156 million (a derivative loss of ¥232,729 million for the fiscal year ended March 31, 2017) related to the Alibaba share collar transaction included in the variable prepaid forward contract. The details are described in “(2) Transaction for sale of Alibaba shares by variable prepaid forward contract” under “Note 7. Interest-bearing debt.”
SoftBank Group Corp. Consolidated Financial Report For the Fiscal Year Ended March 31, 2018
69
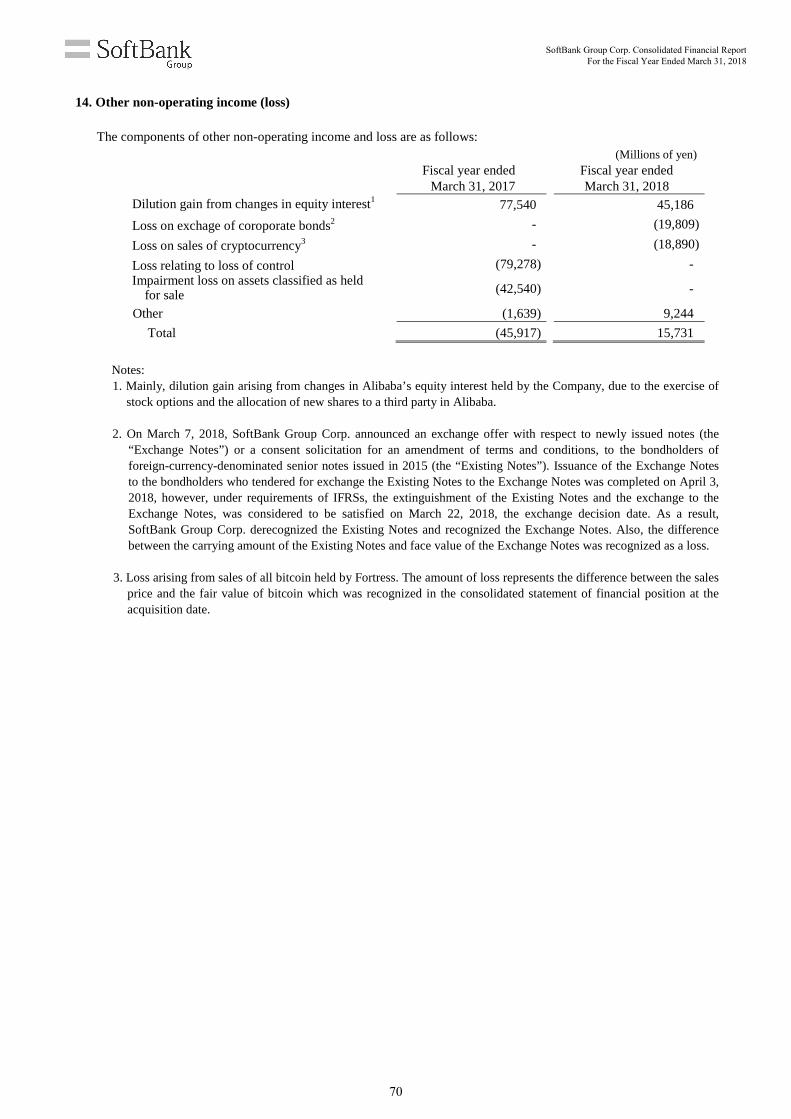
14. Other non-operating income (loss)
The components of other non-operating income and loss are as follows: (Millions of yen)
Fiscal year ended March 31, 2017
Fiscal year ended March 31, 2018
Dilution gain from changes in equity interest1 77,540 45,186
Loss on exchage of coroporate bonds2 - (19,809)
Loss on sales of cryptocurrency3 - (18,890)
Loss relating to loss of control (79,278) - Impairment loss on assets classified as held
for sale (42,540) -
Other (1,639) 9,244
Total (45,917) 15,731
Notes: 1. Mainly, dilution gain arising from changes in Alibaba’s equity interest held by the Company, due to the exercise of
stock options and the allocation of new shares to a third party in Alibaba.
2. On March 7, 2018, SoftBank Group Corp. announced an exchange offer with respect to newly issued notes (the “Exchange Notes”) or a consent solicitation for an amendment of terms and conditions, to the bondholders of foreign-currency-denominated senior notes issued in 2015 (the “Existing Notes”). Issuance of the Exchange Notes to the bondholders who tendered for exchange the Existing Notes to the Exchange Notes was completed on April 3, 2018, however, under requirements of IFRSs, the extinguishment of the Existing Notes and the exchange to the Exchange Notes, was considered to be satisfied on March 22, 2018, the exchange decision date. As a result, SoftBank Group Corp. derecognized the Existing Notes and recognized the Exchange Notes. Also, the difference between the carrying amount of the Existing Notes and face value of the Exchange Notes was recognized as a loss.
3. Loss arising from sales of all bitcoin held by Fortress. The amount of loss represents the difference between the sales
price and the fair value of bitcoin which was recognized in the consolidated statement of financial position at the acquisition date.
SoftBank Group Corp. Consolidated Financial Report For the Fiscal Year Ended March 31, 2018
70
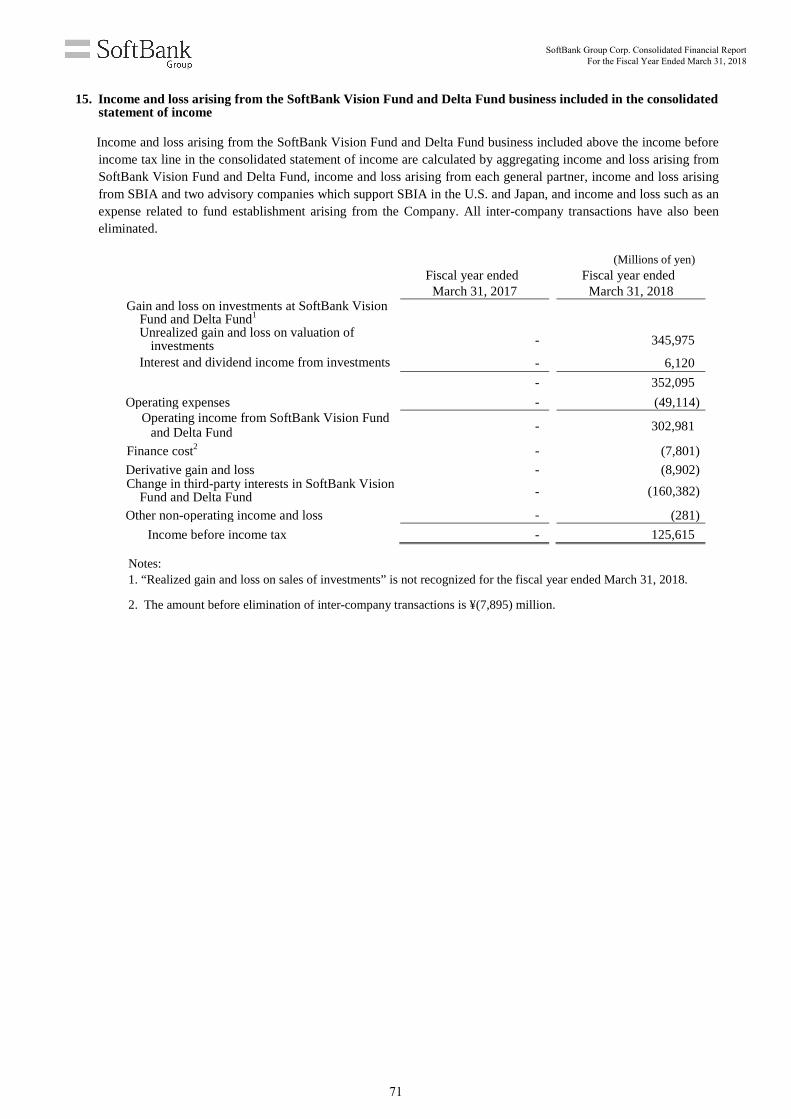
15. Income and loss arising from the SoftBank Vision Fund and Delta Fund business included in the consolidated statement of income
Income and loss arising from the SoftBank Vision Fund and Delta Fund business included above the income before income tax line in the consolidated statement of income are calculated by aggregating income and loss arising from SoftBank Vision Fund and Delta Fund, income and loss arising from each general partner, income and loss arising from SBIA and two advisory companies which support SBIA in the U.S. and Japan, and income and loss such as an expense related to fund establishment arising from the Company. All inter-company transactions have also been eliminated. (Millions of yen)
Fiscal year ended March 31, 2017
Fiscal year ended March 31, 2018
Gain and loss on investments at SoftBank Vision Fund and Delta Fund1
Unrealized gain and loss on valuation of investments - 345,975
Interest and dividend income from investments - 6,120
- 352,095
Operating expenses - (49,114) Operating income from SoftBank Vision Fund
and Delta Fund - 302,981
Finance cost2 - (7,801)
Derivative gain and loss - (8,902) Change in third-party interests in SoftBank Vision
Fund and Delta Fund - (160,382)
Other non-operating income and loss - (281)
Income before income tax - 125,615 Notes: 1. “Realized gain and loss on sales of investments” is not recognized for the fiscal year ended March 31, 2018. 2. The amount before elimination of inter-company transactions is ¥(7,895) million.
SoftBank Group Corp. Consolidated Financial Report For the Fiscal Year Ended March 31, 2018
71
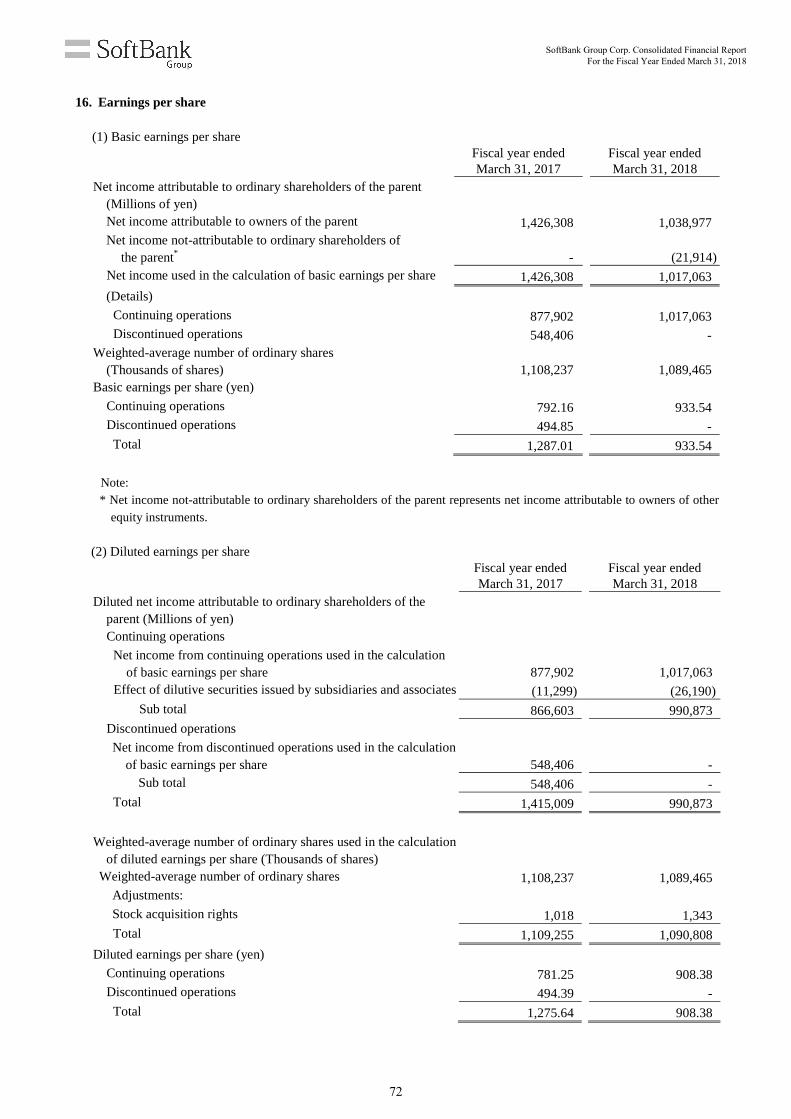
16. Earnings per share
(1) Basic earnings per share Fiscal year ended
March 31, 2017
Fiscal year ended March 31, 2018
Net income attributable to ordinary shareholders of the parent (Millions of yen) Net income attributable to owners of the parent 1,426,308 1,038,977 Net income not-attributable to ordinary shareholders of
the parent* - (21,914) Net income used in the calculation of basic earnings per share 1,426,308 1,017,063
(Details) Continuing operations 877,902 1,017,063 Discontinued operations 548,406 - Weighted-average number of ordinary shares
(Thousands of shares) 1,108,237 1,089,465 Basic earnings per share (yen) Continuing operations 792.16 933.54 Discontinued operations 494.85 - Total 1,287.01 933.54
Note: * Net income not-attributable to ordinary shareholders of the parent represents net income attributable to owners of other
equity instruments.
(2) Diluted earnings per share
Fiscal year ended March 31, 2017
Fiscal year ended March 31, 2018
Diluted net income attributable to ordinary shareholders of the parent (Millions of yen)
Continuing operations Net income from continuing operations used in the calculation
of basic earnings per share 877,902 1,017,063 Effect of dilutive securities issued by subsidiaries and associates (11,299) (26,190)
Sub total 866,603 990,873 Discontinued operations
Net income from discontinued operations used in the calculation of basic earnings per share 548,406 -
Sub total 548,406 - Total 1,415,009 990,873
Weighted-average number of ordinary shares used in the calculation
of diluted earnings per share (Thousands of shares) Weighted-average number of ordinary shares 1,108,237 1,089,465
Adjustments: Stock acquisition rights 1,018 1,343
Total 1,109,255 1,090,808
Diluted earnings per share (yen) Continuing operations 781.25 908.38 Discontinued operations 494.39 - Total 1,275.64 908.38
SoftBank Group Corp. Consolidated Financial Report For the Fiscal Year Ended March 31, 2018
72
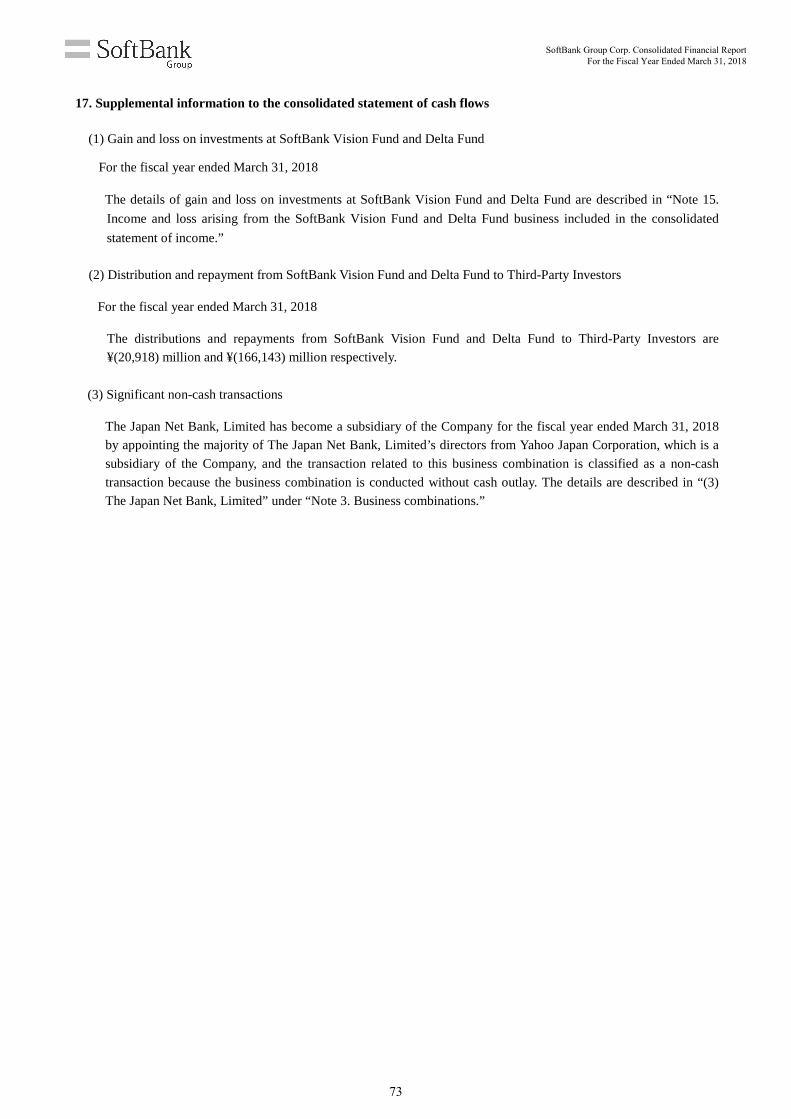
17. Supplemental information to the consolidated statement of cash flows
(1) Gain and loss on investments at SoftBank Vision Fund and Delta Fund
For the fiscal year ended March 31, 2018
The details of gain and loss on investments at SoftBank Vision Fund and Delta Fund are described in “Note 15.
Income and loss arising from the SoftBank Vision Fund and Delta Fund business included in the consolidated
statement of income.”
(2) Distribution and repayment from SoftBank Vision Fund and Delta Fund to Third-Party Investors
For the fiscal year ended March 31, 2018 The distributions and repayments from SoftBank Vision Fund and Delta Fund to Third-Party Investors are
¥(20,918) million and ¥(166,143) million respectively.
(3) Significant non-cash transactions
The Japan Net Bank, Limited has become a subsidiary of the Company for the fiscal year ended March 31, 2018
by appointing the majority of The Japan Net Bank, Limited’s directors from Yahoo Japan Corporation, which is a
subsidiary of the Company, and the transaction related to this business combination is classified as a non-cash
transaction because the business combination is conducted without cash outlay. The details are described in “(3)
The Japan Net Bank, Limited” under “Note 3. Business combinations.”
SoftBank Group Corp. Consolidated Financial Report For the Fiscal Year Ended March 31, 2018
73
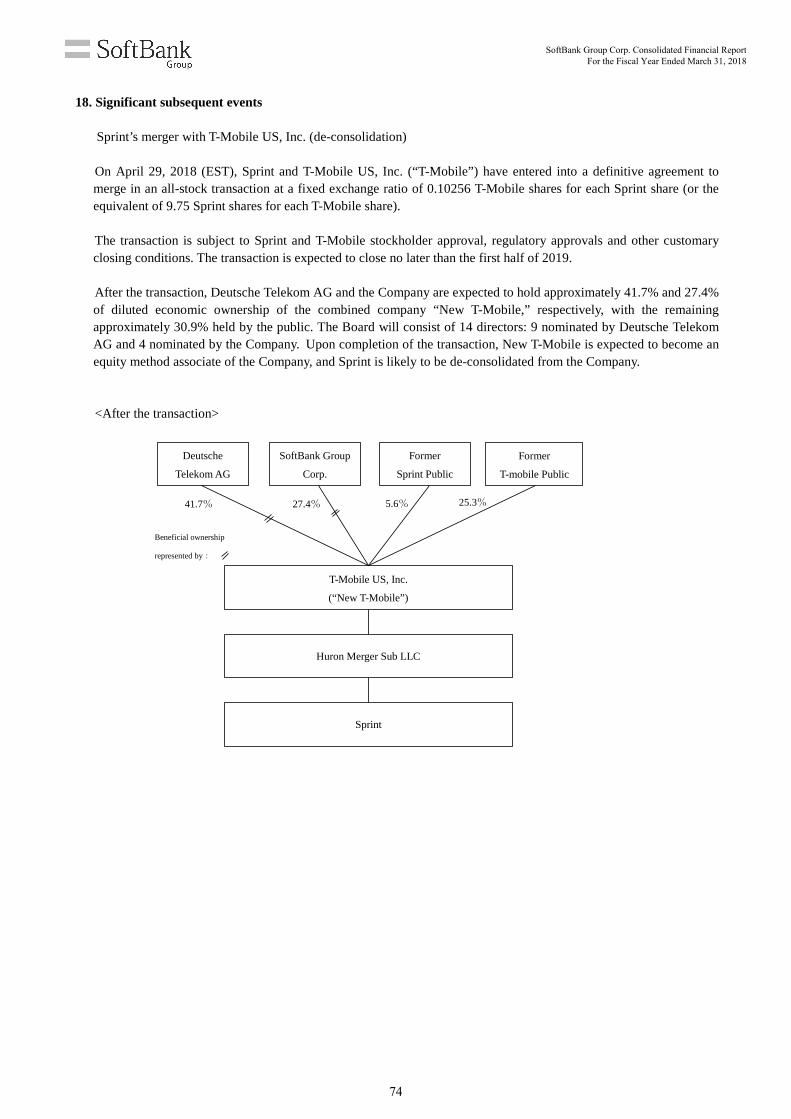
18. Significant subsequent events
Sprint’s merger with T-Mobile US, Inc. (de-consolidation) On April 29, 2018 (EST), Sprint and T-Mobile US, Inc. (“T-Mobile”) have entered into a definitive agreement to merge in an all-stock transaction at a fixed exchange ratio of 0.10256 T-Mobile shares for each Sprint share (or the equivalent of 9.75 Sprint shares for each T-Mobile share). The transaction is subject to Sprint and T-Mobile stockholder approval, regulatory approvals and other customary closing conditions. The transaction is expected to close no later than the first half of 2019. After the transaction, Deutsche Telekom AG and the Company are expected to hold approximately 41.7% and 27.4% of diluted economic ownership of the combined company “New T-Mobile,” respectively, with the remaining approximately 30.9% held by the public. The Board will consist of 14 directors: 9 nominated by Deutsche Telekom AG and 4 nominated by the Company. Upon completion of the transaction, New T-Mobile is expected to become an equity method associate of the Company, and Sprint is likely to be de-consolidated from the Company. <After the transaction>
Beneficial ownership
represented by:
25.3% 5.6% 27.4% 41.7%
Deutsche
Telekom AG
SoftBank Group
Corp.
Former
Sprint Public
Former
T-mobile Public
T-Mobile US, Inc.
(“New T-Mobile”)
Huron Merger Sub LLC
Sprint
SoftBank Group Corp. Consolidated Financial Report For the Fiscal Year Ended March 31, 2018
74