Consolidated Construction Consortium
13
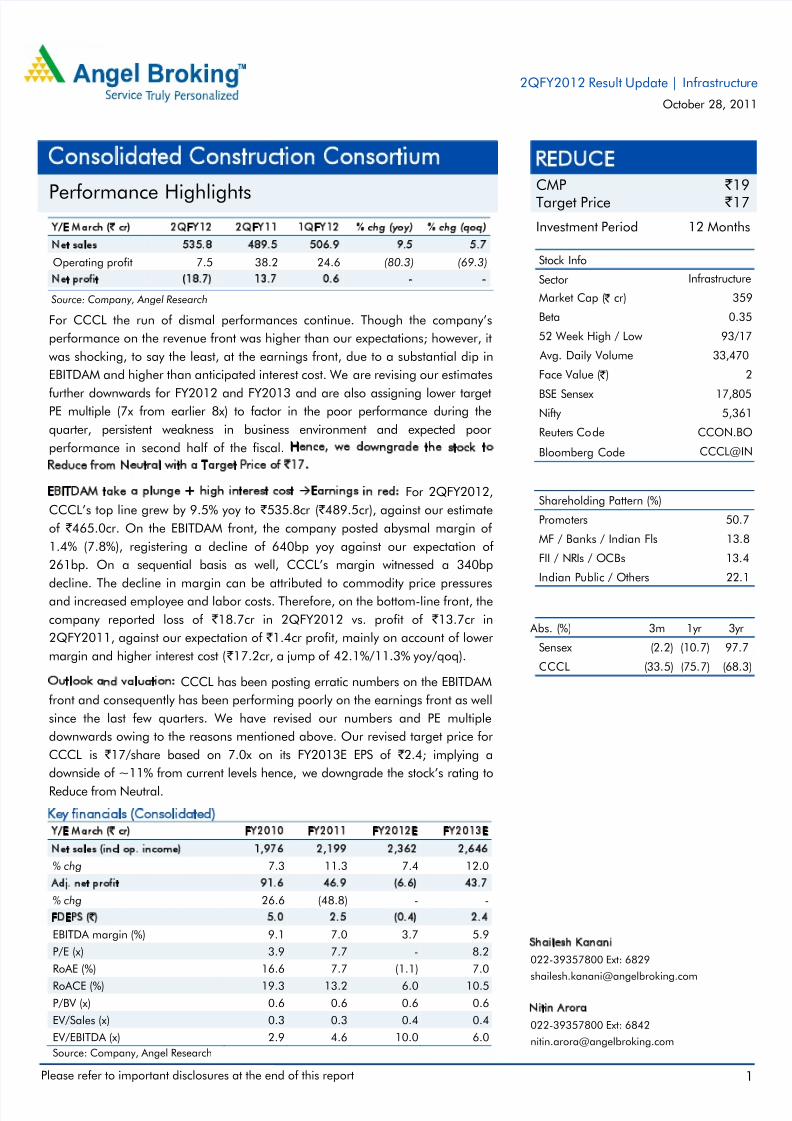
Please refer to important disclosures at the end of this report 1 Y/E March ( ` cr) 2QFY12 2QFY11 1QFY12 % chg (yoy) % chg (qoq) Net sales 535.8 489.5 506.9 9.5 5.7 Operating profit 7.5 38.2 24.6 (80.3) (69.3) Net profit (18.7) 13.7 0.6 - - Source: Company, Angel Research For CCCL the run of dismal performances continue. Though the company’s performance on the revenue front was higher than our expectations; however, it was shocking, to say the least, at the earnings front, due to a substantial dip in EBITDAM and higher than anticipated interest cost. We are revising our estimates further downwards for FY2012 and FY2013 and are also assigning lower target PE multiple (7x from earlier 8x) to factor in the poor performance during the quarter, persistent weakness in business environment and expected poor performance in second half of the fiscal. Hence, we downgrade the stock to Reduce from Neutral with a Target Price of ` 17. EBITDAM take a plunge + high interest cost Earnings in red: For 2QFY2012, CCCL’s top line grew by 9.5% yoy to ` 535.8cr ( ` 489.5cr), against our estimate of ` 465.0cr. On the EBITDAM front, the company posted abysmal margin of 1.4% (7.8%), registering a decline of 640bp yoy against our expectation of 261bp. On a sequential basis as well, CCCL’s margin witnessed a 340bp decline. The decline in margin can be attributed to commodity price pressures and increased employee and labor costs. Therefore, on the bottom-line front, the company reported loss of ` 18.7cr in 2QFY2012 vs. profit of ` 13.7cr in 2QFY2011, against our expectation of ` 1.4cr profit, mainly on account of lower margin and higher interest cost ( ` 17.2cr, a jump of 42.1%/11.3% yoy/qoq). Outlook and valuation: CCCL has been posting erratic numbers on the EBITDAM front and consequently has been performing poorly on the earnings front as well since the last few quarters. We have revised our numbers and PE multiple downwards owing to the reasons mentioned above. Our revised target price for CCCL is ` 17/share based on 7.0x on its FY2013E EPS of ` 2.4; implying a downside of ~11% from current levels hence, we downgrade the stock’s rating to Reduce from Neutral. Key financials (Consolidated) Y/E March ( ` cr) FY2010 FY2011 FY2012E FY2013E Net sales (incl op. income) 1,976 2,199 2,362 2,646 % chg 7.3 11.3 7.4 12.0 Adj. net profit 91.6 46.9 (6.6) 43.7 % chg 26.6 (48.8) - - FDEPS ( ` ) 5.0 2.5 (0.4) 2.4 EBITDA margin (%) 9.1 7.0 3.7 5.9 P/E (x) 3.9 7.7 - 8.2 RoAE (%) 16.6 7.7 (1.1) 7.0 RoACE (%) 19.3 13.2 6.0 10.5 P/BV (x) 0.6 0.6 0.6 0.6 EV/Sales (x) 0.3 0.3 0.4 0.4 EV/EBITDA (x) 2.9 4.6 10.0 6.0 Source: Company, Angel Research REDUCE CMP ` 19 Target Price ` 17 Investment Period 12 Months Stock Info Sector Bloomberg Code Shareholding Pattern (%) Promoters 50.7 MF / Banks / Indian Fls 13.8 FII / NRIs / OCBs 13.4 Indian Public / Others 22.1 Abs. ( %) 3m 1yr 3yr Sensex (2.2) (10.7) 97.7 CCCL ( 33.5) ( 75.7) ( 68.3) 2 17,805 5,361 CCON.BO CCCL@IN 359 0.35 93/17 33,470 Infrastructure Avg. Daily Volume Market Cap ( ` cr) Beta 52 Week High / Low Face Value ( ` ) BSE Sensex Nifty Reuter s Co de Shailesh Kanani 022-39357800 Ext: 6829 [email protected] Nitin Arora 022-39357800 Ext: 6842 [email protected] Consolidated Construction Consortium Performance Highlights 2QFY2012 Result Update | Infrastructu re October 28, 2011
-
Upload
angel-broking -
Category
Documents
-
view
218 -
download
0
Transcript of Consolidated Construction Consortium
8/3/2019 Consolidated Construction Consortium
http://slidepdf.com/reader/full/consolidated-construction-consortium 1/12
Please refer to important disclosures at the end of this report 1
Y/E March (` cr) 2QFY12 2QFY11 1QFY12 % chg (yoy) % chg (qoq)
Net sales 535.8 489.5 506.9 9.5 5.7
Operating profit 7.5 38.2 24.6 (80.3) (69.3)
Net profit (18.7) 13.7 0.6 - -
Source: Company, Angel Research
For CCCL the run of dismal performances continue. Though the company’s
performance on the revenue front was higher than our expectations; however, it
was shocking, to say the least, at the earnings front, due to a substantial dip in
EBITDAM and higher than anticipated interest cost. We are revising our estimates
further downwards for FY2012 and FY2013 and are also assigning lower targetPE multiple (7x from earlier 8x) to factor in the poor performance during the
quarter, persistent weakness in business environment and expected poor
performance in second half of the fiscal. Hence, we downgrade the stock to
Reduce from Neutral with a Target Price of `17.
EBITDAM take a plunge + high interest cost Earnings in red: For 2QFY2012,
CCCL’s top line grew by 9.5% yoy to ` 535.8cr ( ` 489.5cr), against our estimate
of ` 465.0cr. On the EBITDAM front, the company posted abysmal margin of
1.4% (7.8%), registering a decline of 640bp yoy against our expectation of
261bp. On a sequential basis as well, CCCL’s margin witnessed a 340bp
decline. The decline in margin can be attributed to commodity price pressures
and increased employee and labor costs. Therefore, on the bottom-line front, the
company reported loss of ` 18.7cr in 2QFY2012 vs. profit of ` 13.7cr in
2QFY2011, against our expectation of ` 1.4cr profit, mainly on account of lower
margin and higher interest cost ( ` 17.2cr, a jump of 42.1%/11.3% yoy/qoq).
Outlook and valuation: CCCL has been posting erratic numbers on the EBITDAM
front and consequently has been performing poorly on the earnings front as well
since the last few quarters. We have revised our numbers and PE multiple
downwards owing to the reasons mentioned above. Our revised target price for
CCCL is ` 17/share based on 7.0x on its FY2013E EPS of ` 2.4; implying a
downside of ~11% from current levels hence, we downgrade the stock’s rating to
Reduce from Neutral.
Key financials (Consolidated)
Y/E March (` cr) FY2010 FY2011 FY2012E FY2013E
Net sales (incl op. income) 1,976 2,199 2,362 2,646
% chg 7.3 11.3 7.4 12.0
Adj. net profit 91.6 46.9 (6.6) 43.7
% chg 26.6 (48.8) - -
FDEPS (`) 5.0 2.5 (0.4) 2.4
EBITDA margin (%) 9.1 7.0 3.7 5.9
P/E (x) 3.9 7.7 - 8.2
RoAE (%) 16.6 7.7 (1.1) 7.0
RoACE (%) 19.3 13.2 6.0 10.5
P/BV (x) 0.6 0.6 0.6 0.6
EV/Sales (x) 0.3 0.3 0.4 0.4
EV/EBITDA (x) 2.9 4.6 10.0 6.0
Source: Company, Angel Research
REDUCECMP ` 19
Target Price ` 17
Investment Period 12 Months
Stock Info
Sector
Bloomberg Code
Shareholding Pattern (%)
Promoters 50.7
MF / Banks / Indian Fls 13.8
FII / NRIs / OCBs 13.4
Indian Public / Others 22.1
Abs. (%) 3m 1yr 3yr
Sensex (2.2) (10.7) 97.7
CCCL (33.5) (75.7) (68.3)
2
17,8055,361
CCON.BO
CCCL@IN
359
0.35
93/17
33,470
Infrastructure
Avg. Daily Volume
Market Cap ( ` cr)
Beta
52 Week High / Low
Face Value ( ` )
BSE SensexNifty
Reuters Code
Shailesh Kanani
022-39357800 Ext: 6829
Nitin Arora
022-39357800 Ext: 6842
Consolidated Construction Consortium
Performance Highlights
2QFY2012 Result Update | Infrastructure
October 28, 2011

8/3/2019 Consolidated Construction Consortium
http://slidepdf.com/reader/full/consolidated-construction-consortium 2/12
CCCL | 2QFY2012 Result Update
October 28, 2011 2
Exhibit 1: Quarterly performance (Standalone)
Y/E March (` cr) 2QFY12 2QFY11 1QFY12 % Chg (yoy) % Chg (qoq) 1HFY12 1HFY11 % Chg
Net sales 535.8 489.5 506.9 9.5 5.7 1042.7 997.5 4.5
Total expenditure 528.3 451.3 482.3 17.1 9.5 1010.6 917.2 10.2Operating profit 7.5 38.2 24.6 (80.3) (69.3) 32.1 80.2 (60.0)
OPM (%) 1.4 7.8 4.8 (640)bp (340)bp 3.1 8.0 (490)bp
Interest 17.2 12.1 15.5 42.1 11.332.7 22.7 44.2
Depreciation 3.6 3.1 3.2 15.4 11.8 6.9 6.0 14.2
Non operating income 1.5 1.3 1.2 9.4 25.9 2.6 2.7 (3.3)
Nonrecurring items - 0.7 - - - - 1.6 -
Profit before tax (11.8) 25.0 7.0 - - (4.8) 55.9 -
Tax 4.2 8.5 4.1 (51.4) 1.2 8.3 18.8 (56.2)
Net profit before JV share (16.0) 16.5 2.9 - - (13.0) 37.1 -
Share of pfts to JV partner 2.8 2.7 2.4 - - 5.1 3.7 -
Net profit after JV share (18.7) 13.7 0.6 - - (18.2) 33.4 -
PAT (%) (3.5) 2.8 0.1 - - (1.7) 3.4 -
Reported EPS (1.0) 0.7 0.0 - - (1.0) 1.8 -
Source: Company, Angel Research
Exhibit 2: 2QFY2012 Actual vs. Estimates
Actual Estimates Variation (%)
Net sales ( ` cr) 535.8 465.0 15.2
EBITDA margin (%) 1.4 5.2 (380)bp
Net profit after JV share ( ` cr) (18.7) 1.4 -
Source: Company, Angel Research
Double digit growth on topline front
For 2QFY2012, CCCL’s top line grew by 9.5% yoy to ` 535.8cr ( ` 489.5cr), against
our estimate of ` 465.0cr. CCCL has been witnessing torrid time in recent past as
the company struggled to post decent topline growth in spite of robust order book
mainly on account of high proportion of slow moving orders, delay in statutory
clearances and slowdown in industrial capex.
Management has guided that, order visibility in the industrial segment is very bleak
and conversion of enquires into orders has been negligible in the Infrastructure
sector (read power segment), indicating that order inflow from these two segments
would be subdued and thereby leading to intense competition for orders.
CCCL still has ~ ` 2,000cr ( ` 1,000cr – power and metro projects each) worth of
slow-moving orders out of the total order book of ` 5,936cr, which will keep
revenue growth under check for the next few quarters. Against this background, we
are factoring in revenue growth of 7.4% and 12.0% for FY2012 and FY2013,
respectively, on a consolidated basis.
Projects update
On the Chennai Airport project, CCCL booked revenues of ` 138cr during the
quarter. The company is hopeful of completing the balance project (~ ` 200cr) by
December 2011.
8/3/2019 Consolidated Construction Consortium
http://slidepdf.com/reader/full/consolidated-construction-consortium 3/12
CCCL | 2QFY2012 Result Update
October 28, 2011 3
On the 5MW solar power plant front, CCCL expects to achieve completion by
January 2012. However, the Delhi car park project has not begun yet due to
approval pending from Delhi Municipal Corporation, which is expected soon.
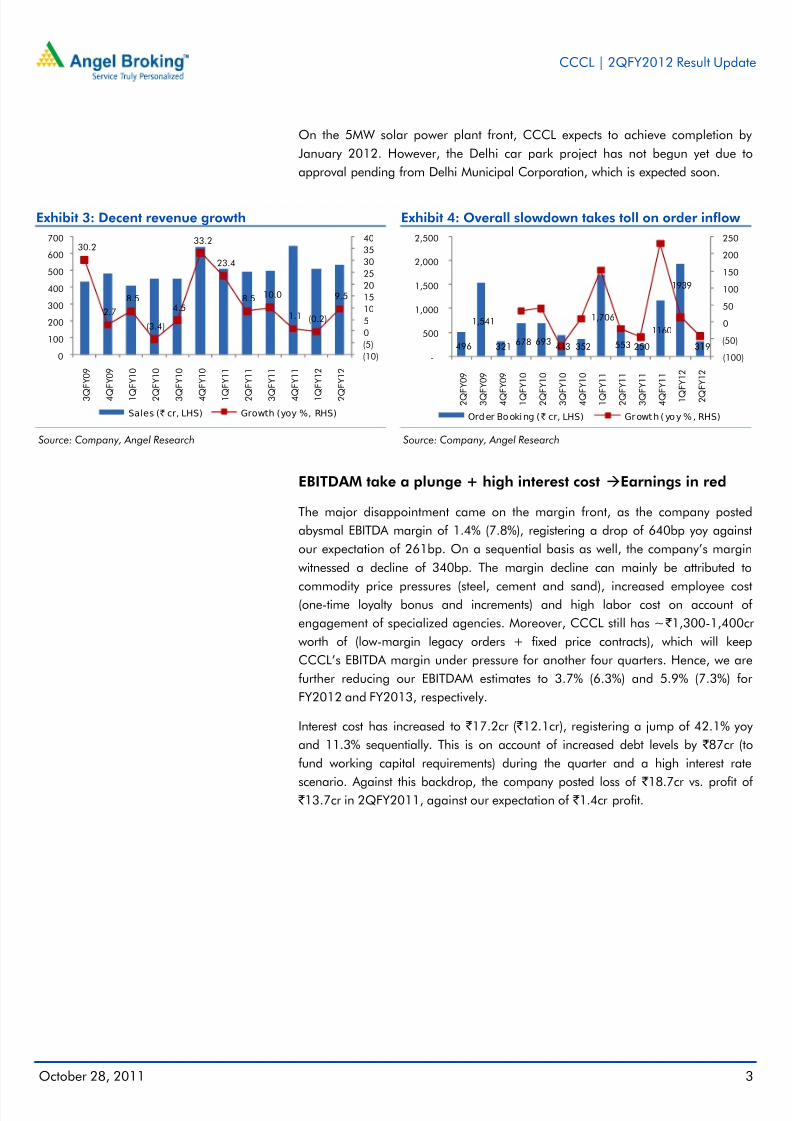
Exhibit 3: Decent revenue growth
Source: Company, Angel Research
Exhibit 4: Overall slowdown takes toll on order inflow
Source: Company, Angel Research
EBITDAM take a plunge + high interest cost Earnings in red
The major disappointment came on the margin front, as the company posted
abysmal EBITDA margin of 1.4% (7.8%), registering a drop of 640bp yoy against
our expectation of 261bp. On a sequential basis as well, the company’s margin
witnessed a decline of 340bp. The margin decline can mainly be attributed to
commodity price pressures (steel, cement and sand), increased employee cost(one-time loyalty bonus and increments) and high labor cost on account of
engagement of specialized agencies. Moreover, CCCL still has ~ ` 1,300-1,400cr
worth of (low-margin legacy orders + fixed price contracts), which will keep
CCCL’s EBITDA margin under pressure for another four quarters. Hence, we are
further reducing our EBITDAM estimates to 3.7% (6.3%) and 5.9% (7.3%) for
FY2012 and FY2013, respectively.
Interest cost has increased to ` 17.2cr ( ` 12.1cr), registering a jump of 42.1% yoy
and 11.3% sequentially. This is on account of increased debt levels by ` 87cr (to
fund working capital requirements) during the quarter and a high interest rate
scenario. Against this backdrop, the company posted loss of ` 18.7cr vs. profit of ` 13.7cr in 2QFY2011, against our expectation of ` 1.4cr profit.
30.2
2.7
8.5
(3.4)
4.5
33.2
23.4
8.5 10.0
1.1 (0.2)
9.5
(10)
(5)
0
5
10
15
20
25
30
35
40
0
100
200
300
400
500
600
700
3 Q
F Y 0 9
4 Q
F Y 0 9
1 Q
F Y 1 0
2 Q
F Y 1 0
3 Q
F Y 1 0
4 Q
F Y 1 0
1 Q
F Y 1 1
2 Q
F Y 1 1
3 Q
F Y 1 1
4 Q
F Y 1 1
1 Q
F Y 1 2
2 Q
F Y 1 2
Sales (` cr, LHS) Growth (yoy %, RHS)
496
1,541
321678 693
443 352
1,706
553 250
1160
1939
319
(100)
(50)
0
50
100
150
200
250
-
500
1,000
1,500
2,000
2,500
2 Q F
Y 0 9
3 Q F
Y 0 9
4 Q F
Y 0 9
1 Q F
Y 1 0
2 Q F
Y 1 0
3 Q F
Y 1 0
4 Q F
Y 1 0
1 Q F
Y 1 1
2 Q F
Y 1 1
3 Q F
Y 1 1
4 Q F
Y 1 1
1 Q
F Y 1 2
2 Q
F Y 1 2
Order Booking (` cr, LHS) Growth (yoy %, RHS)

8/3/2019 Consolidated Construction Consortium
http://slidepdf.com/reader/full/consolidated-construction-consortium 4/12
Octob
Exhibi
Source:
Exhibi
Source:
-
10.0
20.0
30.0
40.0
50.0
60.0
70.0
80.0
er 28, 2011
t 5: EBITDA
Company, Ang
t 7: Segme
Company, Ang
6.8
5.4
7.1
2 Q F Y 0 9
3 Q F Y 0 9
4 Q F Y 0 9
EBI
M goes for
l Research
tal order i
l Research
7.3
8.9 9.0
11.
1 Q F Y 1 0
2 Q F Y 1 0
3 Q F Y 1 0
4 Q F Y 1 0
DA (` cr, LHS)
a toss...
flow for th
4
8.37.8
9.7
1 Q F Y 1 1
2 Q F Y 1 1
3 Q F Y 1 1
EBITDA
Order b
As of 2QF
up 5.8% y
segments.
The comp
(18.6%) an
quarter ( `
3.5
4.8
1.4
-
1
1
4 Q F Y 1 1
1 Q F Y 1 2
2 Q F Y 1 2
(%, RHS)
Exhi
Sourc
ok analys
2012, CCC
oy, dominat
The industri
ny’s order b
d without ma
cr) Exhi
Sourc
.0
.0
.0
.0
0.0
2.0
(30.
(20.
(10.
-
10.
20.
30.
40.
it 6: ...lea
: Company, An
is
L’s order bo
d by the inf
l and resid
ook is sprea
terial (22.3%
it 8: Order
: Company, An
4.1
3.0
4.
0)
0)
0)
0
0
0
0
2 Q F Y 0 9
3 Q F Y 0 9
C
ing to loss
gel Research
k stood at `
rastructure (
ential segme
d across pri
) contracts.
book at 2.
gel Research
3 4.34.7 4.7
1 Q F Y 1 0
2 Q F Y 1 0
3 Q F Y 1 0
PAT (` cr, LHS)
CL | 2QFY
s on botto
5,936cr (2.7
6.3%) and
nts accounte
e protected
x FY2011
5.3
3.5 2.8 3.
4 Q F Y 1 0
1 Q F Y 1 1
2 Q F Y 1 1
PATM
012 Result
line front
x FY2011 re
ommercial (
d for the b
(59.1%), fixe
evenue ( `
4
0.2 0.1
(3.5)
4 Q F Y 1 1
1 Q F Y 1 2
2 Q F Y 1 2
(%, RHS)
Update
4
enue),
42.9%)
alance.
d price
r)
(4.0)
(3.0)
(2.0)
(1.0)
-
1.0
2.0
3.0
4.0
5.0
6.0

8/3/2019 Consolidated Construction Consortium
http://slidepdf.com/reader/full/consolidated-construction-consortium 5/12
CCCL | 2QFY2012 Result Update
October 28, 2011 5
Change in estimates
We are revising our estimates further downwards for FY2012 and FY2013 to factor
in the poor performance during the quarter, persistent weakness in business
environment and expected poor performance in second half of the fiscal. On the
margin front, we are factoring in a dip in EBITDAM to 3.7% (6.3%) and 5.9%
(7.3%) for FY2012 and FY2013, respectively, as the company has acknowledged
that margin pressure is likely to continue for the next four quarters due to the
above-mentioned reasons. Further, with rising interest cost and dismal margin, our
bottom-line estimates have been revised downwards to loss of ` 6.6cr vs. profit of
` 27.8cr for FY2012 and profit of ` 43.7cr ( ` 65.8cr) for FY2013.
Exhibit 9: Change in estimates
FY2012 FY2013
Earlier estimates Revised estimates Variation (%) Earlier estimates Revised estimates Variation (%)
Revenue 2,362.1 2,362.1 - 2,646.1 2,646.1 -
EBITDA margin (%) 6.3 3.7 (260)bp 7.3 5.9 (140)bp
PAT 27.8 (6.6) (123.8) 65.8 43.7 (33.7)
Source: Company, Angel Research
Return ratios take a hit, justifying the downgrade in PE multiple
In past CCCL reported superior return ratios because of which the stock traded at
a premium in comparison to its peers. Currently, the company’s return ratios have
taken a hit due its poor performance. Going ahead as well, we see pressure on
return ratios to continue for short to medium term and expect some improvementonly in 2HFY2013. Thus, CCCL has lost an edge over its peers and hence we have
further lowered f its target PE multiple to 7x from 8x.
Exhibit 10: Return ratios decline on low EBITDAM
Source: Company, Angel Research
27.8
14.9 16.6
7.7
(1.1)
7.0
35.3
17.519.3
13.2
6.010.5
(5.0)
-
5.0
10.0
15.0
20.0
25.0
30.0
35.0
40.0
FY2008 FY2009 FY2010 FY2011 FY2012E FY2013E
RoAE (%) RoACE (%)
8/3/2019 Consolidated Construction Consortium
http://slidepdf.com/reader/full/consolidated-construction-consortium 6/12
CCCL | 2QFY2012 Result Update
October 28, 2011 6
Outlook and valuation
CCCL has been posting erratic numbers on the EBITDAM front and consequently
has been performing poorly on the earnings front as well since the last few
quarters. We have revised our numbers and PE multiple downwards owing to the
reasons mentioned above. Our revised target price for CCCL is `17/share based
on 7.0x on its FY2013E EPS of `2.4; implying a downside of ~11% from current
levels hence, we downgrade the stock’s rating to Reduce from Neutral.
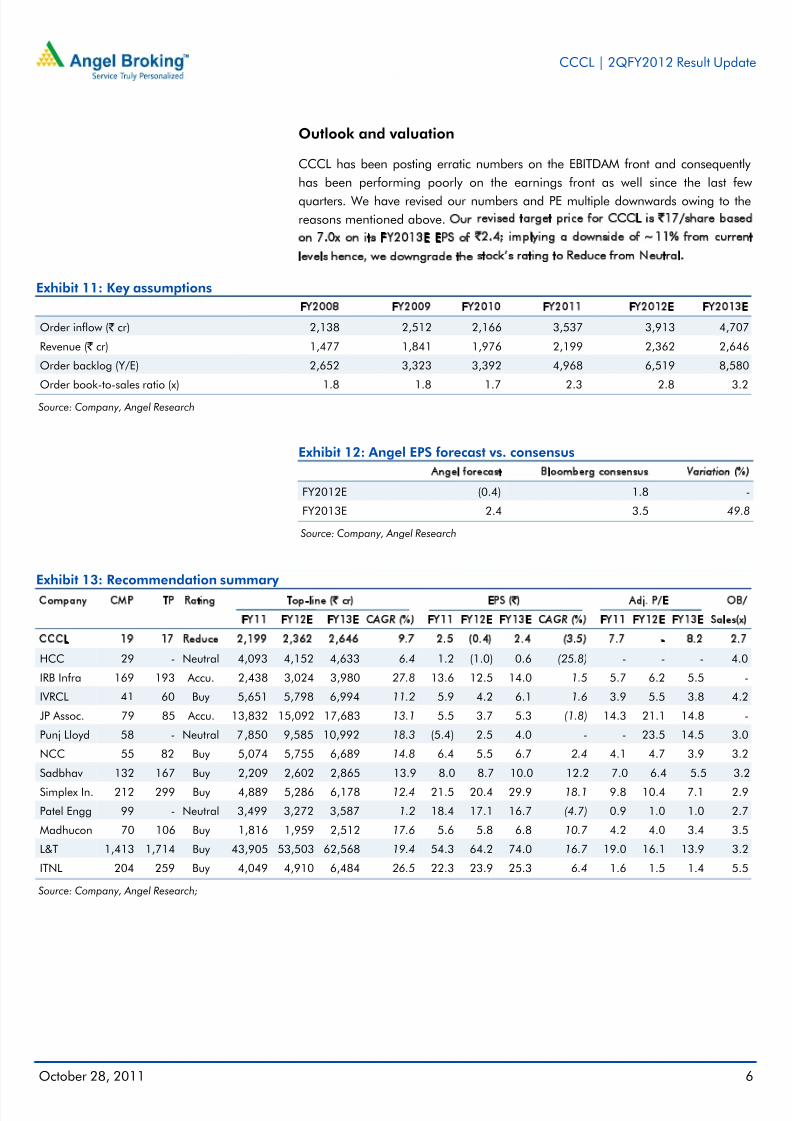
Exhibit 11: Key assumptions
FY2008 FY2009 FY2010 FY2011 FY2012E FY2013E
Order inflow ( ` cr) 2,138 2,512 2,166 3,537 3,913 4,707
Revenue ( ` cr) 1,477 1,841 1,976 2,199 2,362 2,646
Order backlog (Y/E) 2,652 3,323 3,392 4,968 6,519 8,580
Order book-to-sales ratio (x) 1.8 1.8 1.7 2.3 2.8 3.2
Source: Company, Angel Research
Exhibit 12: Angel EPS forecast vs. consensus
Angel forecast Bloomberg consensus Variation (%)
FY2012E (0.4) 1.8 -
FY2013E 2.4 3.5 49.8
Source: Company, Angel Research
Exhibit 13: Recommendation summary
Company CMP TP Rating Top-line (` cr) EPS (`) Adj. P/E OB/
FY11 FY12E FY13E CAGR (%) FY11 FY12E FY13E CAGR (%) FY11 FY12E FY13E Sales(x)
CCCL 19 17 Reduce 2,199 2,362 2,646 9.7 2.5 (0.4) 2.4 (3.5) 7.7 - 8.2 2.7
HCC 29 - Neutral 4,093 4,152 4,633 6.4 1.2 (1.0) 0.6 (25.8) - - - 4.0
IRB Infra 169 193 Accu. 2,438 3,024 3,980 27.8 13.6 12.5 14.0 1.5 5.7 6.2 5.5 -
IVRCL 41 60 Buy 5,651 5,798 6,994 11.2 5.9 4.2 6.1 1.6 3.9 5.5 3.8 4.2
JP Assoc. 79 85 Accu. 13,832 15,092 17,683 13.1 5.5 3.7 5.3 (1.8) 14.3 21.1 14.8 -
Punj Lloyd 58 - Neutral 7,850 9,585 10,992 18.3 (5.4) 2.5 4.0 - - 23.5 14.5 3.0
NCC 55 82 Buy 5,074 5,755 6,689 14.8 6.4 5.5 6.7 2.4 4.1 4.7 3.9 3.2
Sadbhav 132 167 Buy 2,209 2,602 2,865 13.9 8.0 8.7 10.0 12.2 7.0 6.4 5.5 3.2
Simplex In. 212 299 Buy 4,889 5,286 6,178 12.4 21.5 20.4 29.9 18.1 9.8 10.4 7.1 2.9
Patel Engg 99 - Neutral 3,499 3,272 3,587 1.2 18.4 17.1 16.7 (4.7) 0.9 1.0 1.0 2.7
Madhucon 70 106 Buy 1,816 1,959 2,512 17.6 5.6 5.8 6.8 10.7 4.2 4.0 3.4 3.5
L&T 1,413 1,714 Buy 43,905 53,503 62,568 19.4 54.3 64.2 74.0 16.7 19.0 16.1 13.9 3.2
ITNL 204 259 Buy 4,049 4,910 6,484 26.5 22.3 23.9 25.3 6.4 1.6 1.5 1.4 5.5
Source: Company, Angel Research;

8/3/2019 Consolidated Construction Consortium
http://slidepdf.com/reader/full/consolidated-construction-consortium 7/12
CCCL | 2QFY2012 Result Update
October 28, 2011 7
Exhibit 14: SOTP breakup – Across players
Company Core Const. Real Estate Road BOT Invst. In Subsidiaries Others Total
` % to TP ` % to TP ` % to TP ` % to TP ` % to TP `
CCCL 17 100 - - - - - - - - 17HCC 4 9 23 54 16 37 - - - - 44
IRB Infra 101 52 - - 70 36 4 2 18 9 193
IVRCL 43 71 - - - - 17 29 - - 60
JP Assoc. 31 37 30 35 - - - - 24 29 85
Punj Lloyd 72 100 - - - - - - - - 72
NCC 53 65 2 2 8 10 - - 18 22 82
Sadbhav 90 54 - - 76 46 - - - - 167
Simplex In. 299 100 - - - - - - - - 299
Patel Engg 40 33 47 38 16 13 - - 19 16 122
Madhucon 59 55 2 2 33 31 - - 12 12 106
L&T 1,332 78 - - - - 382 22 - - 1,714
ITNL 90 35 - - 143 55 - - 25 10 259
Source: Company, Angel Research
8/3/2019 Consolidated Construction Consortium
http://slidepdf.com/reader/full/consolidated-construction-consortium 8/12
CCCL | 2QFY2012 Result Update
October 28, 2011 8
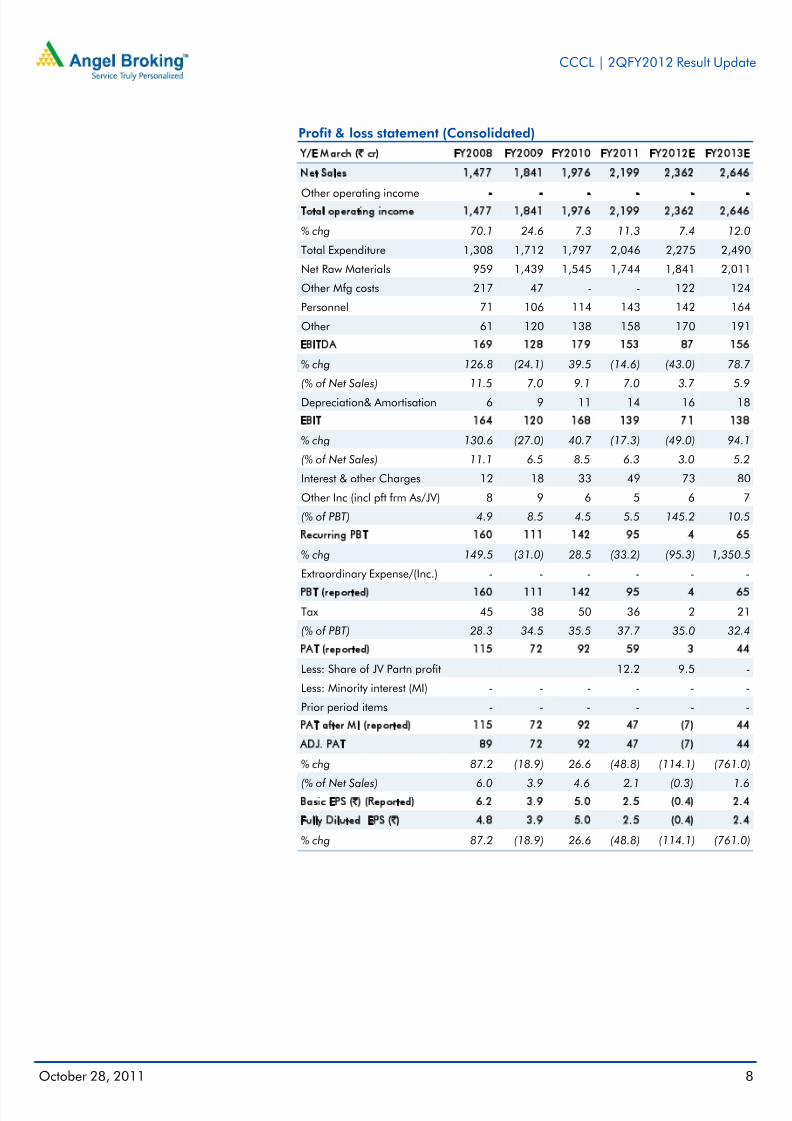
Profit & loss statement (Consolidated)
Y/E March (` cr) FY2008 FY2009 FY2010 FY2011 FY2012E FY2013E
Net Sales 1,477 1,841 1,976 2,199 2,362 2,646
Other operating income - - - - - -Total operating income 1,477 1,841 1,976 2,199 2,362 2,646
% chg 70.1 24.6 7.3 11.3 7.4 12.0
Total Expenditure 1,308 1,712 1,797 2,046 2,275 2,490
Net Raw Materials 959 1,439 1,545 1,744 1,841 2,011
Other Mfg costs 217 47 - - 122 124
Personnel 71 106 114 143 142 164
Other 61 120 138 158 170 191
EBITDA 169 128 179 153 87 156
% chg 126.8 (24.1) 39.5 (14.6) (43.0) 78.7
(% of Net Sales) 11.5 7.0 9.1 7.0 3.7 5.9
Depreciation& Amortisation 6 9 11 14 16 18
EBIT 164 120 168 139 71 138
% chg 130.6 (27.0) 40.7 (17.3) (49.0) 94.1
(% of Net Sales) 11.1 6.5 8.5 6.3 3.0 5.2
Interest & other Charges 12 18 33 49 73 80
Other Inc (incl pft frm As/JV) 8 9 6 5 6 7
(% of PBT) 4.9 8.5 4.5 5.5 145.2 10.5
Recurring PBT 160 111 142 95 4 65
% chg 149.5 (31.0) 28.5 (33.2) (95.3) 1,350.5
Extraordinary Expense/(Inc.) - - - - - -
PBT (reported) 160 111 142 95 4 65
Tax 45 38 50 36 2 21
(% of PBT) 28.3 34.5 35.5 37.7 35.0 32.4
PAT (reported) 115 72 92 59 3 44
Less: Share of JV Partn profit 12.2 9.5 -
Less: Minority interest (MI) - - - - - -
Prior period items - - - - - -
PAT after MI (reported) 115 72 92 47 (7) 44
ADJ. PAT 89 72 92 47 (7) 44
% chg 87.2 (18.9) 26.6 (48.8) (114.1) (761.0)
(% of Net Sales) 6.0 3.9 4.6 2.1 (0.3) 1.6Basic EPS (`) (Reported) 6.2 3.9 5.0 2.5 (0.4) 2.4
Fully Diluted EPS (̀ ) 4.8 3.9 5.0 2.5 (0.4) 2.4
% chg 87.2 (18.9) 26.6 (48.8) (114.1) (761.0)
8/3/2019 Consolidated Construction Consortium
http://slidepdf.com/reader/full/consolidated-construction-consortium 9/12
CCCL | 2QFY2012 Result Update
October 28, 2011 9
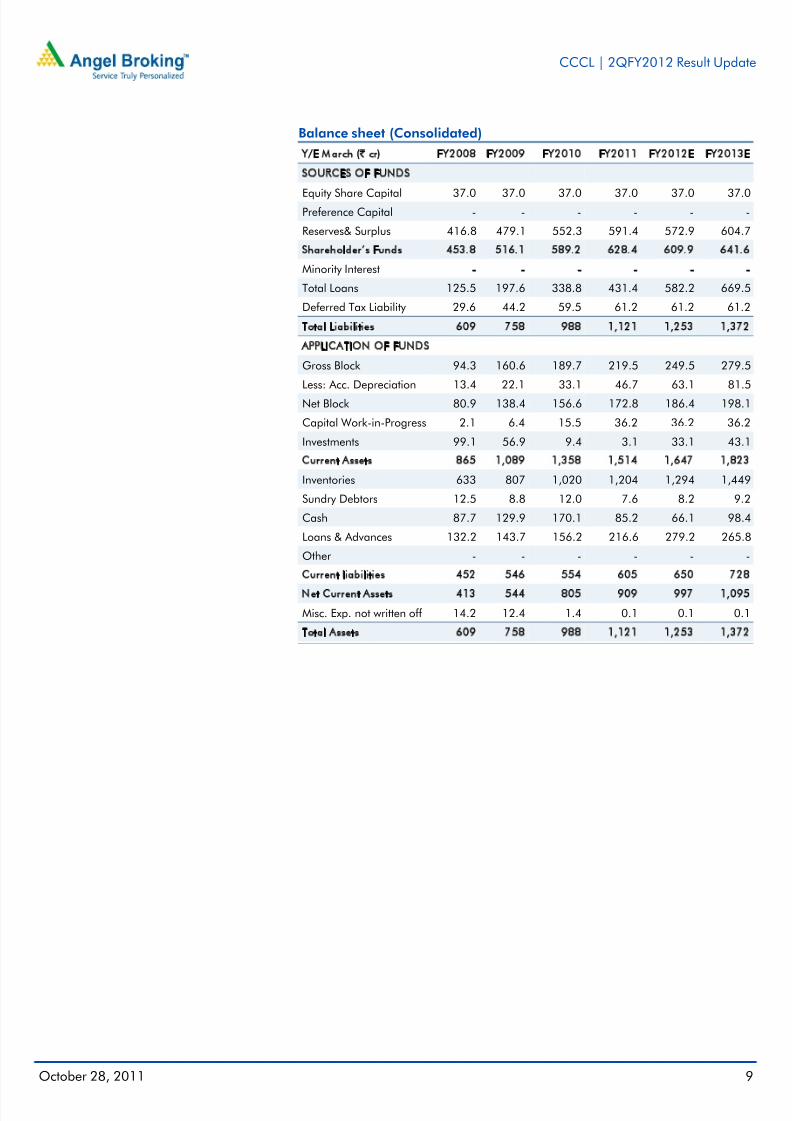
Balance sheet (Consolidated)
Y/E March (` cr) FY2008 FY2009 FY2010 FY2011 FY2012E FY2013E
SOURCES OF FUNDS
Equity Share Capital 37.0 37.0 37.0 37.0 37.0 37.0Preference Capital - - - - - -
Reserves& Surplus 416.8 479.1 552.3 591.4 572.9 604.7
Shareholder’s Funds 453.8 516.1 589.2 628.4 609.9 641.6
Minority Interest - - - - - -
Total Loans 125.5 197.6 338.8 431.4 582.2 669.5
Deferred Tax Liability 29.6 44.2 59.5 61.2 61.2 61.2
Total Liabilities 609 758 988 1,121 1,253 1,372
APPLICATION OF FUNDS
Gross Block 94.3 160.6 189.7 219.5 249.5 279.5
Less: Acc. Depreciation 13.4 22.1 33.1 46.7 63.1 81.5
Net Block 80.9 138.4 156.6 172.8 186.4 198.1
Capital Work-in-Progress 2.1 6.4 15.5 36.2 36.2 36.2
Investments 99.1 56.9 9.4 3.1 33.1 43.1
Current Assets 865 1,089 1,358 1,514 1,647 1,823
Inventories 633 807 1,020 1,204 1,294 1,449
Sundry Debtors 12.5 8.8 12.0 7.6 8.2 9.2
Cash 87.7 129.9 170.1 85.2 66.1 98.4
Loans & Advances 132.2 143.7 156.2 216.6 279.2 265.8
Other - - - - - -
Current liabilities 452 546 554 605 650 728
Net Current Assets 413 544 805 909 997 1,095
Misc. Exp. not written off 14.2 12.4 1.4 0.1 0.1 0.1
Total Assets 609 758 988 1,121 1,253 1,372
8/3/2019 Consolidated Construction Consortium
http://slidepdf.com/reader/full/consolidated-construction-consortium 10/12
CCCL | 2QFY2012 Result Update
October 28, 2011 10
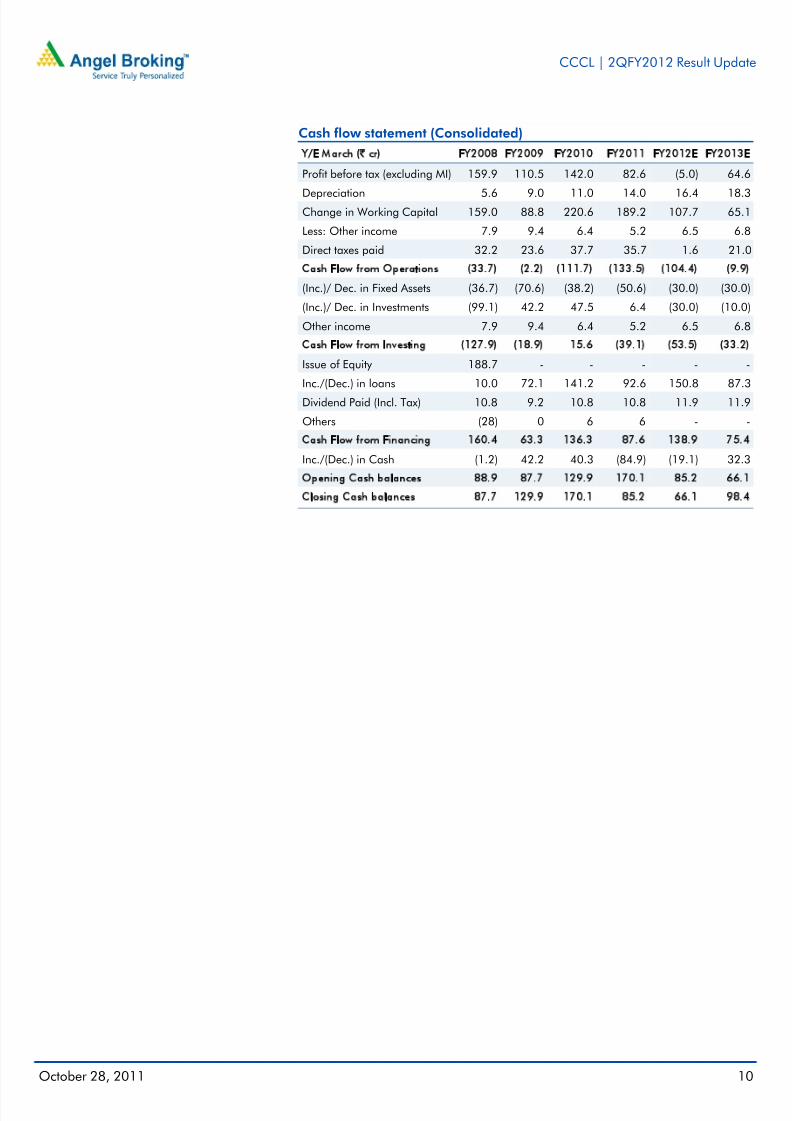
Cash flow statement (Consolidated)
Y/E March (` cr) FY2008 FY2009 FY2010 FY2011 FY2012E FY2013E
Profit before tax (excluding MI) 159.9 110.5 142.0 82.6 (5.0) 64.6
Depreciation 5.6 9.0 11.0 14.0 16.4 18.3Change in Working Capital 159.0 88.8 220.6 189.2 107.7 65.1
Less: Other income 7.9 9.4 6.4 5.2 6.5 6.8
Direct taxes paid 32.2 23.6 37.7 35.7 1.6 21.0
Cash Flow from Operations (33.7) (2.2) (111.7) (133.5) (104.4) (9.9)
(Inc.)/ Dec. in Fixed Assets (36.7) (70.6) (38.2) (50.6) (30.0) (30.0)
(Inc.)/ Dec. in Investments (99.1) 42.2 47.5 6.4 (30.0) (10.0)
Other income 7.9 9.4 6.4 5.2 6.5 6.8
Cash Flow from Investing (127.9) (18.9) 15.6 (39.1) (53.5) (33.2)
Issue of Equity 188.7 - - - - -
Inc./(Dec.) in loans 10.0 72.1 141.2 92.6 150.8 87.3
Dividend Paid (Incl. Tax) 10.8 9.2 10.8 10.8 11.9 11.9
Others (28) 0 6 6 - -
Cash Flow from Financing 160.4 63.3 136.3 87.6 138.9 75.4
Inc./(Dec.) in Cash (1.2) 42.2 40.3 (84.9) (19.1) 32.3
Opening Cash balances 88.9 87.7 129.9 170.1 85.2 66.1
Closing Cash balances 87.7 129.9 170.1 85.2 66.1 98.4

8/3/2019 Consolidated Construction Consortium
http://slidepdf.com/reader/full/consolidated-construction-consortium 11/12
CCCL | 2QFY2012 Result Update
October 28, 2011 11
Key Ratios
Y/E March FY2008 FY2009 FY2010 FY2011 FY2012E FY2013E
Valuation Ratio (x)
P/E (on FDEPS) 4.0 5.0 3.9 7.7 - 8.2P/CEPS 3.8 4.4 3.5 5.9 36.8 5.8
P/BV 0.8 0.7 0.6 0.6 0.6 0.6
Dividend yield (%) 2.6 2.6 2.6 2.6 2.8 2.8
EV/Sales 0.3 0.2 0.3 0.3 0.4 0.4
EV/EBITDA 2.3 3.3 2.9 4.6 10.0 6.0
EV / Total Assets 0.7 0.6 0.5 0.6 0.7 0.7
Per Share Data (`)EPS (Basic) 6.2 3.9 5.0 2.5 (0.4) 2.4
EPS (fully diluted) 4.8 3.9 5.0 2.5 (0.4) 2.4
Cash EPS 5.1 4.4 5.6 3.3 0.5 3.4
DPS 0.5 0.5 0.5 0.5 0.6 0.6
Book Value 24.6 27.9 31.9 34.0 33.0 34.7
DuPont Analysis
EBIT margin 11.1 6.5 8.5 6.3 3.0 5.2
Tax retention ratio 0.7 0.7 0.6 0.6 0.7 0.7
Asset turnover (x) 3.9 3.2 2.7 2.4 2.1 2.2
ROIC (Post-tax) 31.3 13.6 15.0 9.4 4.1 7.6
Cost of Debt (Post Tax) 6.9 7.5 7.8 8.0 9.4 8.6
Leverage (x) 0.1 0.1 0.2 0.4 0.7 0.9
Operating ROE 33.7 14.3 16.5 9.9 0.5 6.6
Returns (%)
ROACE (Pre-tax) 35.3 17.5 19.3 13.2 6.0 10.5
Angel ROIC (Pre-tax) 43.6 20.8 23.3 15.0 6.4 11.2
ROAE 27.8 14.9 16.6 7.7 (1.1) 7.0
Turnover ratios (x)
Asset Turnover (Gross Block) 19.2 14.4 11.3 10.7 10.1 10.0
Inventory / Sales (days) 120 143 169 185 193 189
Receivables (days) 2 2 2 2 1 1
Payables (days) 77 93 100 94 95 93
W. cap cycle (ex-cash) (days) 62 73 97 121 136 133
Solvency ratios (x)Net debt to equity 0.1 0.1 0.3 0.6 0.8 0.9
Net debt to EBITDA 0.2 0.5 0.9 2.3 5.9 3.7
Interest Coverage 14.2 6.5 5.2 2.8 1.0 1.7
8/3/2019 Consolidated Construction Consortium
http://slidepdf.com/reader/full/consolidated-construction-consortium 12/12
CCCL | 2QFY2012 Result Update
October 28 2011 12
Research Team Tel: 022 - 39357800 E-mail: [email protected] Website: www.angelbroking.com
DISCLAIMER
This document is solely for the personal information of the recipient, and must not be singularly used as the basis of any investment
decision. Nothing in this document should be construed as investment or financial advice. Each recipient of this document should makesuch investigations as they deem necessary to arrive at an independent evaluation of an investment in the securities of the companies
referred to in this document (including the merits and risks involved), and should consult their own advisors to determine the merits and
risks of such an investment.
Angel Broking Limited, its affiliates, directors, its proprietary trading and investment businesses may, from time to time, make
investment decisions that are inconsistent with or contradictory to the recommendations expressed herein. The views contained in this
document are those of the analyst, and the company may or may not subscribe to all the views expressed within.
Reports based on technical and derivative analysis center on studying charts of a stock's price movement, outstanding positions and
trading volume, as opposed to focusing on a company's fundamentals and, as such, may not match with a report on a company's
fundamentals.
The information in this document has been printed on the basis of publicly available information, internal data and other reliablesources believed to be true, but we do not represent that it is accurate or complete and it should not be relied on as such, as thisdocument is for general guidance only. Angel Broking Limited or any of its affiliates/ group companies shall not be in any way responsible for any loss or damage that may arise to any person from any inadvertent error in the information contained in this report .
Angel Broking Limited has not independently verified all the information contained within this document. Accordingly, we cannot testify,nor make any representation or warranty, express or implied, to the accuracy, contents or data contained within this document. While Angel Broking Limited endeavours to update on a reasonable basis the information discussed in this material, there may be regulatory,compliance, or other reasons that prevent us from doing so.
This document is being supplied to you solely for your information, and its contents, information or data may not be reproduced,
redistributed or passed on, directly or indirectly.
Angel Broking Limited and its affiliates may seek to provide or have engaged in providing corporate finance, investment banking or
other advisory services in a merger or specific transaction to the companies referred to in this report, as on the date of this report or in
the past.
Neither Angel Broking Limited, nor its directors, employees or affiliates shall be liable for any loss or damage that may arise from or in
connection with the use of this information.
Note: Please refer to the important `Stock Holding Disclosure' report on the Angel website (Research Section). Also, pleaserefer to the latest update on respective stocks for the disclosure status in respect of those stocks. Angel Broking Limited andits affiliates may have investment positions in the stocks recommended in this report.
Disclosure of Interest Statement CCCL
1. Analyst ownership of the stock No
2. Angel and its Group companies ownership of the stock No
3. Angel and its Group companies' Directors ownership of the stock No
4. Broking relationship with company covered No
Note: We have not considered any Exposure below ` 1 lakh for Angel, its Group companies and Directors.
Ratings (Returns): Buy (> 15%) Accumulate (5% to 15%) Neutral (-5 to 5%)Reduce (-5% to 15%) Sell (< -15%)