Consolidated Basis (Japanese GAAP) · PDF file¥8,501 . 26.1% . 2.6% . FY2017.3 ... to...
29
YAMAHA CORPORATION Flash Report Consolidated Basis (Japanese GAAP) Results for the fiscal year ended March 31, 2017 May 1, 2017 Company name: YAMAHA CORPORATION (URL http://www.yamaha.com) Code number: 7951 Stock listing: Tokyo Stock Exchange (First Section) Address of headquarters: 10-1, Nakazawa-cho, Naka-ku, Hamamatsu, Shizuoka 430-8650, Japan Representative director: Takuya Nakata, President and Representative Director For further information, please contact: Yasushi Nishiyama, General Manager, Corporate Finance Division Telephone: +81-53-460-2158 Scheduled date of Ordinary General Shareholders’ Meeting: June 22, 2017 Scheduled date to submit Securities Report: June 23, 2017 Scheduled date to begin dividend payments: June 23, 2017 Supplementary materials to the financial statements have been prepared: Yes Presentation will be held to explain the financial statements: Yes (for securities analysts and institutional investors) 1. Results for FY2017.3 (April 1, 2016–March 31, 2017) Figures of less than ¥1 million have been omitted. (1) Consolidated Operating Results (Percentage figures are changes from the previous fiscal year.) Net sales Operating income Ordinary income Net income attributable to owners of parent Millions of yen % change from the previous fiscal year Millions of yen % change from the previous fiscal year Millions of yen % change from the previous fiscal year Millions of yen % change from the previous fiscal year FY2017.3 (Ended March 31, 2017) ¥408,248 (6.3)% ¥44,302 8.9% ¥44,926 9.8% ¥46,719 43.2% FY2016.3 (Ended March 31, 2016) ¥435,477 0.8% ¥40,663 34.9% ¥40,907 31.0% ¥32,633 30.9% Note: Comprehensive income: FY2017.3 ¥76,143 million, —% FY2016.3 (¥19,887) million, —% Net income per share Net income per share after full dilution Return on equity Ratio of ordinary income to total assets Ratio of operating income to net sales Yen Yen % % % FY2017.3 (Ended March 31, 2017) ¥249.17 ¥— 14.0% 9.1% 10.9% FY2016.3 (Ended March 31, 2016) ¥168.90 ¥— 10.1% 8.2% 9.3% (For reference) Equity in earnings of non-consolidated subsidiaries and affiliates: FY2017.3 ¥ 7 million FY2016.3 ¥(6) million
Transcript of Consolidated Basis (Japanese GAAP) · PDF file¥8,501 . 26.1% . 2.6% . FY2017.3 ... to...

YAMAHA CORPORATION Flash Report
Consolidated Basis (Japanese GAAP) Results for the fiscal year ended March 31, 2017
May 1, 2017
Company name: YAMAHA CORPORATION (URL http://www.yamaha.com) Code number: 7951 Stock listing: Tokyo Stock Exchange (First Section)
Address of headquarters: 10-1, Nakazawa-cho, Naka-ku, Hamamatsu, Shizuoka 430-8650, Japan Representative director: Takuya Nakata, President and Representative Director For further information, please contact: Yasushi Nishiyama, General Manager, Corporate Finance Division Telephone: +81-53-460-2158 Scheduled date of Ordinary General
Shareholders’ Meeting: June 22, 2017 Scheduled date to submit Securities Report: June 23, 2017 Scheduled date to begin dividend payments: June 23, 2017 Supplementary materials to the financial
statements have been prepared: Yes Presentation will be held to explain the
financial statements: Yes (for securities analysts and institutional investors)
1. Results for FY2017.3 (April 1, 2016–March 31, 2017) Figures of less than ¥1 million have been omitted.
(1) Consolidated Operating Results
(Percentage figures are changes from the previous fiscal year.)
Net sales Operating income Ordinary income Net income attributable to owners of parent
Millions of yen
% change from the previous
fiscal year
Millions of yen
% change from the previous
fiscal year
Millions of yen
% change from the previous
fiscal year
Millions of yen
% change from the previous
fiscal year
FY2017.3 (Ended March 31, 2017)
¥408,248 (6.3)% ¥44,302 8.9% ¥44,926 9.8% ¥46,719 43.2%
FY2016.3 (Ended March 31, 2016)
¥435,477 0.8% ¥40,663 34.9% ¥40,907 31.0% ¥32,633 30.9%
Note: Comprehensive income: FY2017.3 ¥76,143 million, —% FY2016.3 (¥19,887) million, —%
Net income
per share Net income per share
after full dilution Return on equity Ratio of ordinary income to total assets
Ratio of operating income to net sales
Yen Yen % % %
FY2017.3 (Ended March 31, 2017)
¥249.17 ¥— 14.0% 9.1% 10.9%
FY2016.3 (Ended March 31, 2016)
¥168.90 ¥— 10.1% 8.2% 9.3%
(For reference) Equity in earnings of non-consolidated subsidiaries and affiliates: FY2017.3 ¥ 7 million FY2016.3 ¥(6) million

(2) Consolidated Financial Data
Total assets Net assets Shareholders’ equity ratio Net assets per share
Millions of yen Millions of yen % Yen
FY2017.3 (As of March 31, 2017)
¥522,362 ¥367,437 69.9% ¥1,948.01
FY2016.3 (As of March 31, 2016)
¥469,745 ¥303,889 64.2% ¥1,601.55
(For reference) Shareholders’ equity: FY2017.3 ¥365,123 million FY2016.3 ¥301,544 million
(3) Consolidated Cash Flows
Cash flows from operating activities
Cash flows from investing activities
Cash flows from financing activities
Cash and cash equivalents at end of period
Millions of yen Millions of yen Millions of yen Millions of yen
FY2017.3 (Ended March 31, 2017)
¥39,142 ¥(9,663) ¥(12,588) ¥100,669
FY2016.3 (Ended March 31, 2016)
¥42,399 ¥591 ¥(30,349) ¥85,018
2. Dividends
Annual dividends Total dividends
(annual)
Dividend propensity
(consolidated)
Ratio of dividends to
net assets (consolidated)
End of first quarter
End of second quarter
End of third quarter
End of fiscal year
Full fiscal year
Yen Yen Yen Yen Yen Millions of yen % %
FY2016.3 — ¥18.00 — ¥26.00 ¥44.00 ¥8,501 26.1% 2.6%
FY2017.3 — ¥26.00 — ¥26.00 ¥52.00 ¥9,750 20.9% 2.9%
FY2018.3 (Forecast)
— ¥28.00 — ¥28.00 ¥56.00 26.9%
3. Consolidated Financial Forecasts for FY2018.3 (April 1, 2017–March 31, 2018) (Percentage figures for the full fiscal year are changes from the previous fiscal year, and those for the first half are changes from the previous same period.)
Net sales Operating income Ordinary income Net income attributable
to owners of parent
Net income
per share Millions of
yen % Millions of yen % Millions of
yen % Millions of yen % Yen
FY2018.3 (First Half) ¥209,000 4.9% ¥26,000 5.5% ¥26,000 6.2% ¥21,500 (21.0)% ¥114.63
FY2018.3 (Full Year) ¥427,000 4.6% ¥48,500 9.5% ¥48,500 8.0% ¥39,000 (16.5)% ¥208.00

Footnote Items: (1) Changes in the state of material subsidiaries during the period (Changes regarding significant subsidiaries accompanying
changes in the scope of consolidation): Yes Newly added: 1 company Company name: PT. Yamaha Musical Products Asia
(2) Changes in accounting principles, changes in accounting estimates, and changes in presentation due to revisions (a) Changes in accounting principles accompanying revisions in accounting standards: None (b) Changes other than those in (a) above: Yes (c) Changes in accounting estimates: Yes (d) Changes in presentation due to revisions: None Note: Regarding the methods for calculation of depreciation of property, plant and equipment, previously, the Company and its consolidated subsidiaries in Japan adopted the declining balance method, and overseas consolidated subsidiaries mainly applied the straight-line method for calculating depreciation. However, from the beginning of FY2017.3, the method for depreciation in the Company and its subsidiaries has been changed to the straight-line method. Since this matter corresponds to Article 14-7 of the Ordinance of Consolidated Financial Statements, “Yes” is shown in the section “(b) Changes other than those in (a) above: Changes in accounting principles accompanying revisions in accounting standards” and in the section “(c) Changes in accounting estimates.” For further details, please refer to page 18 of the supplementary materials, the section entitled: “(5) Notes to the Consolidated Financial Statements, Changes in Accounting Principles, Changes in Accounting Estimates, and Changes in Presentation due to Revisions.”
(3) Number of shares issued (common shares)
(For Reference) Non-Consolidated Results
Non-consolidated results for FY2017.3 (April 1, 2016–March 31, 2017)
(1) Non-consolidated operating results (Percentage figures are changes from the previous fiscal year.)
Net sales Operating income Ordinary income Net income
Millions of yen % Millions of yen % Millions of yen % Millions of yen %
FY2017.3 (Ended March 31, 2017)
¥215,839 (7.3)% ¥15,634 2.6% ¥26,574 (2.1)% ¥33,970 68.5%
FY2016.3 (Ended March 31, 2016)
¥232,830 (0.4)% ¥15,237 45.0% ¥27,141 10.7% ¥20,160 (20.2)%
Net income per share Net income per share after full dilution
Yen Yen
FY2017.3 (Ended March 31, 2017)
¥181.17 ¥—
FY2016.3 (Ended March 31, 2016)
¥104.34 ¥—
(a) Number of shares issued at the end of the period (including treasury stock)
FY2017.3 197,255,025 shares FY2016.3 197,255,025 shares
(b) Number of treasury stock at the end of the period
FY2017.3 9,820,691 shares FY2016.3 8,971,933 shares
(c) Average number of shares issued during the period FY2017.3 187,500,903 shares FY2016.3 193,210,820 shares

(2) Non-consolidated financial data Total assets Net assets Shareholders’ equity ratio Net assets per share
Millions of yen Millions of yen % Yen
FY2017.3 (As of March 31, 2017)
¥375,638 ¥269,028 71.6% ¥1,435.32
FY2016.3 (As of March 31, 2016)
¥331,943 ¥222,177 66.9% ¥1,180.02
(For reference) Shareholders’ equity: FY2017.3 ¥269,028 million FY2016.3 ¥222,177 million
Footnote Items:
This flash report is exempt from the auditing procedures. Explanation of the Appropriate Use of Performance Forecasts and Other Related Items Consolidated financial forecasts were prepared based on information available at the time of the announcement and do not represent promises by the Company or its management that these performance figures will be attained. Actual consolidated results may differ from forecasts owing to a wide range of factors.
For further information regarding consolidated financial forecasts, please refer to page 4. The materials to be distributed for this earnings presentation and other materials will be posted on the Company’s website immediately after the presentation is concluded.

1
Table of Contents of Supplementary Materials
1. Management Performance …………………………………………………………………………………………………… 2
(1) Analysis of Management Performance …………………………………………………………………………………… 2
(2) Analysis of Financial Position …………………………………………………………………………………………… 4
(3) Basic Policy for Allocation of Profit and Dividends for FY2017.3 and FY2018.3 ……………………………………… 5
2. Management Policies ………………………………………………………………………………………………………… 6
(1) Basic Management Policy ……………………………………………………………………………………………… 6
(2) Management Indicators Taken as Objectives …………………………………………………………………………… 6
(3) The Group’s Medium- to Long-Term Management Strategy ……………………………………………………………… 7
(4) Issues to Be Addressed ………………………………………………………………………………………………… 7
3. Basic Approach to Selection of Accounting Standards ………………………………………………………………………… 9
4. Consolidated Financial Statements and Major Notes ………………………………………………………………………… 10
(1) Consolidated Balance Sheets …………………………………………………………………………………………… 10
(2) Consolidated Statements of Operations and Consolidated Statements of Comprehensive Income ……………………… 12
(3) Consolidated Statements of Changes in Shareholders’ Equity …………………………………………………………… 14
(4) Consolidated Statements of Cash Flows ………………………………………………………………………………… 16
(5) Notes to the Consolidated Financial Statements ………………………………………………………………………… 18
Notes Regarding Assumptions as a Going Concern ……………………………………………………………………… 18
Changes in Accounting Principles, Changes in Accounting Estimates, and Changes in Presentation due to Revisions… 18
Changes in the Method of Presentation …………………………………………………………………………………… 18
Additional Information …………………………………………………………………………………………………… 18
Consolidated Statements of Operations ………………………………………………………………………………… 19
Segment Information ……………………………………………………………………………………………… 21
Per Share Information …………………………………………………………………………………………………… 25
Important Subsequent Events …………………………………………………………………………………………… 25

2
1. Management Performance (1) Analysis of Management Performance 1. Review of the Fiscal Year (FY2017.3) Looking back at the operating environment during the fiscal year ended March 31, 2017, the world economy was on a moderate recovery trend. By country and region, the United States showed firm growth in real GDP, and, both the United States and Europe, despite uncertainty because of the departure of the United Kingdom from the EU, reported moderate economic recovery. The emerging countries, including China, experienced a deceleration in growth. In Japan, employment and income conditions showed further improvement, and consumer spending showed signs of moderate recovery. Amid this operating environment, the Yamaha Group entered the first year of its new Medium-Term Management Plan, “NEXT STAGE 12,” and implemented key initiatives of “develop products with distinctive individuality,” “enhance customer interaction,” “continually reduce costs,” and “strengthen global business platforms.” To attain the goal of “develop products with distinctive individuality,” in the musical instruments business, Yamaha introduced products aimed at appealing Yamaha’s new technology and attractive design to customers. These included TransAcoustic guitars, digital piano ARIUS, and electric violins. In the audio equipment business, Yamaha expanded its lineup of professional audio equipment, including a flagship model digital mixer and a lineup of audio products incorporating MusicCast* functions. In the area of industrial machinery and components, Yamaha proposed automobile-mounted modules and proceeded with the development of a new device to detect hydrogen. To achieve the goal of “enhance customer interaction” in the musical instruments business, Yamaha is taking active initiatives in e-commerce marketing and expanding sales through large volume retailers in mature countries with the goal of developing new customer interaction bases throughout the world. These activities include implementing sales policies targeting middle-income consumers in the emerging countries. In addition, Yamaha is working to expand the number of schools offering its “Music Time” music courses that provide support for music education in schools. The number of such schools in Indonesia and Malaysia has reached about 200. In the audio equipment business, Yamaha is implementing measures to expand transaction relationships with audio contractors. These initiatives have resulted in an increase of 10% year on year in the number of such dealers. Moreover, Yamaha is developing in-store displays of products installed with MusicCast systems focusing especially on European markets, which is the priority market, and achieved having such displays in place in about 1,000 stores. To meet the objective of “continually reduce costs,” Yamaha continued to take initiatives to lower procurement costs. In addition, Yamaha proceeded with measures to achieve a more even allocation of production and improvement of production efficiency through such policies as the relocation of its piano manufacturing processes and commencement of production of professional audio and ICT (Information & Communications Technology) equipment in its Malaysian factory, which thus far has specialized in AV products. To reach the goal of “strengthen global business platforms,” Yamaha has begun initiatives to train and develop the next generations of management personnel for global operations. In addition, Yamaha has implemented measures to establish information systems that cover the three major regions of the North Americas, Europe, and Asia and also to optimize logistics and accounting globally. Turning to financial performance, net sales for the fiscal year were ¥408,248 million (a decrease of 6.3% from the previous fiscal year). This decline was because of the negative effect of foreign currency fluctuations, which amounted to ¥33.4 billion, and the negative effect of the transfer of the music school business, which amounted to ¥4.2 billion. In terms of profits, Yamaha absorbed the negative impact of foreign currency of ¥11.1 billion for the full fiscal year and the Group reported operating income of ¥44,302 million (an increase of 8.9% from the previous fiscal year), ordinary income of ¥44,926 million (an increase of 9.8% from the previous fiscal year), and net income attributable to owners of parent of ¥46,719 million (an increase of 43.2% from the previous fiscal year). The operating income ratio for the fiscal year was 10.9%. * MusicCast: A new function to simply share music by means of audio equipment set up in a number of rooms in the home. MusicCast is a trademark of Yamaha Corporation.
3
Results of operations by segment were as follows: Musical Instruments Sales of upright pianos in China and sales of grand pianos in Europe were above the levels of the previous fiscal year. Among digital pianos, demand in China was favorable due to demand shifting from portable keyboards, and, in Europe, sales of mass market price units held firm. Although sales of portable keyboards were about the same as in the previous year in the United States, the sales environment in Japan and Europe was difficult. Sales of wind instruments in the medium-to-high price zones were strong globally. Sales of guitars in China in the medium-to-high price zones showed marked expansion. In the drums field, sales of acoustic drums were strong, but competition in the digital drum category became more intense, and sales were below the level of the previous year. As a result of these conditions, net sales in this segment amounted to ¥257,664 million (a decrease of ¥19,705 million or 7.1% year on year). About ¥22.2 billion of the decline in net sales was due to foreign currency fluctuations and ¥4.2 billion was a result of the transfer of the operations of Yamaha Music Schools in Japan to the Yamaha Music Foundation. After exclusion of these two factors, net sales expanded ¥6.7 billion. Operating income rose ¥451 million, or 1.4%, to ¥32,138 million, thereby offsetting the ¥8.6 billion negative impact of foreign currency fluctuations. This gain in operating income was the result of cost reductions, revisions of sales prices to proper levels, lower expenses, and other factors. Audio Equipment In audio products, sales increased because of the expansion in stores displaying products installed with MusicCast systems in the European market, which is the priority market, and, in the United States and China, sales of mainstay products, including receivers, were favorable. In the professional audio equipment business, sales of mixers in the United States and China expanded, and sales in Europe continued to be robust, including products for use in commercial spaces. In addition, in Japan, sales of professional audio equipment and acoustic equipment installations held firm. In Information & Communications Technology (ICT) equipment, sales of such network equipment as routers in Japan and communications equipment, including conferencing systems, expanded. However, due to more intense competition, the sales environment for Revolabs communications equipment became more difficult. Sales of soundproof products have not reached the level of the previous year. As a result, sales in this segment as a whole decreased ¥5,396 million, or 4.5%, to ¥115,484 million. After exclusion of the negative impact of foreign currency fluctuations, which amounted to ¥10.6 billion, sales increased ¥5.2 billion from the previous fiscal year. Operating income rose ¥1,910 million, or 22.4%, to ¥10,447 million, thus offsetting the ¥2.6 billion negative impact of foreign currency fluctuations. This gain in operating income was the result of the increase in sales, cost reductions, lower expenses, and other factors. Others Among electronic devices, sales of car-mounted audio LSIs equipped with hands-free operation capabilities and sales of heat-transmission elements for use in optical fiber equipment expanded, but sales overall decreased. In the factory automation (FA) business, sales of equipment for smartphone circuit testing rose, but sales of automobile interior components decreased because of weakness in sales of automobiles using these components. In the golf products business, sales of new product “inpres UD+2” were favorable. As a result, sales of this segment were ¥35,099 million (a decline of ¥2,126 million, or 5.7% from the previous year), reflecting a decline of ¥0.6 billion due to foreign currency fluctuations. After exclusion of the negative impact of foreign currency fluctuations, sales decreased ¥1.5 billion from the previous fiscal year. Operating income was ¥1,716 million (an increase of ¥1,277 million, or 290.8% from the previous year). Sales by region, based on the location of customers, were as follows: The percentage of consolidated net sales in overseas markets for the fiscal year was 66.1%, 0.6 percentage point lower than in the previous fiscal year. Japan Sales on a consolidated basis in Japan for the fiscal year were ¥138,404 million, ¥6,629 million (or 4.6%) lower than in the previous fiscal year. Despite increased sales of professional audio equipment, sales decreased mainly due to transferring the operations of Yamaha Music Schools in Japan to the Yamaha Music Foundation. North America Sales in North America amounted to ¥83,032 million, ¥5,202 million (or 5.9%) lower than in the previous fiscal year. After exclusion of a decline of ¥9.7 billion due to foreign currency fluctuations, sales increased ¥4.5 billion. This increase was mainly accounted for by expansion in sales of digital musical instruments, professional audio equipment, and other products. Europe Sales in Europe were ¥76,463 million, ¥5,741 million (or 7.0%) lower than in the previous year. After the exclusion of a decline of ¥9.2 billion due to foreign currency fluctuations, sales increased ¥3.5 billion. The increase was mainly accounted for by expansion in sales of pianos, professional audio equipment, and other products.

4
China and Asia/Oceania/Other Areas Sales in these regions amounted to ¥110,347 million, ¥9,655 million (or 8.0%) lower than in the previous fiscal year. After the exclusion of a decline of ¥13.9 billion due to foreign currency fluctuations, sales increased ¥4.2 billion. In China, sales of pianos, guitars, and other products increased, and, in the rest of Asia, Oceania, and other areas sales of digital musical instruments and other products increased. 2. Forecast for FY2018.3 The forecast for consolidated performance for the year ending March 2018 calls for net sales of ¥427.0 billion (an increase of 4.6%), operating income of ¥48.5 billion (an increase of 9.5%), ordinary income of ¥48.5 billion (an increase of 8.0%), and net income attributable to owners of parent of ¥39.0 billion (a decrease of 16.5%). Note that these forecasts take account of the positive impact on sales of foreign currency fluctuations.
The forward-looking statements in this flash report contain inherent risks and uncertainties insofar as they are based on future projections and plans that may differ materially from the actual results achieved.
(2) Analysis of Financial Position 1. Consolidated Financial Position 1) Assets Total assets increased ¥52,617 million (or 11.2%) from the end of the previous fiscal year, to ¥522,362 million. Of this total, current assets rose ¥17,585 million (or 6.9%), to ¥272,720 million, due to rises in cash and deposits as well as in merchandise and finished goods. In addition, noncurrent assets increased ¥35,031 million (or 16.3%), to ¥249,641 million, due to an increase in investment securities associated with an increase in the current market price of available-for-sale securities. 2) Liabilities Total liabilities decreased ¥10,931 million (or 6.6%) from the end of the previous fiscal year, to ¥154,924 million. Of this total, current liabilities increased ¥7,105 million (or 9.4%), to ¥82,565 million, because of increases in accounts payable—other and accrued expenses and other factors. Noncurrent liabilities decreased ¥18,037 million (or 20.0%), to ¥72,359 million, because of a decrease in net defined benefit liabilities. 3) Net Assets Net assets increased ¥63,548 million (or 20.9%) from the end of the previous fiscal year, to ¥367,437 million. This increase was due to an increase in retained earnings and total accumulated other comprehensive income resulting from a rise in the current market price of available-for-sale securities, and other factors. 2. Cash Flows Cash and cash equivalents (hereinafter, cash) at the end of the fiscal year ended March 31, 2017, showed an increase of ¥15,651 million (compared with an increase of ¥8,858 million in the previous fiscal year), and stood at ¥100,669 million. Cash Flows from Operating Activities Net cash provided by operating activities amounted to ¥39,142 million (compared with cash flows provided by operating activities of ¥42,399 million in the previous fiscal year). This net cash inflow was due mainly to contribution of income before income taxes. Cash Flows from Investing Activities Net cash used in investing activities amounted to ¥9,663 million (compared with net cash flows provided by investing activities of ¥591 million in the previous fiscal year). This net cash outflow arose primarily due to purchases of property, plant and equipment and certain other items. Cash Flows from Financing Activities Net cash used in financing activities amounted to ¥12,588 million (compared with net cash used in financing activities of ¥30,349 million in the previous fiscal year). This net cash outflow was due mainly to cash dividends paid and certain other items.

5
(For Reference) Trends in Cash-Flow Indicators FY2017.3 FY2016.3 FY2015.3 FY2014.3 FY2013.3 Shareholders’ equity ratio 69.9% 64.2% 65.3% 61.9% 58.1%
Shareholders’ equity ratio based on current market price 110.0% 135.9% 76.9% 58.6% 46.3%
Ratio of interest-bearing debt to cash flow 28.8% 20.2% 37.6% 26.5% 129.8%
Interest coverage ratio 169.5 times 127.4 times 123.7 times 150.8 times 31.8 times
(Calculation Methods) Shareholders’ equity ratio (%) = total shareholders’ equity ÷ total assets Shareholders’ equity ratio based on current market price (%) = total market value of common stock ÷ total assets Ratio of interest-bearing debt to cash flow (%) = interest-bearing debt ÷ net cash flows provided by (used in) operating activities Interest coverage ratio (times) = net cash flows provided by (used in) operating activities ÷ interest payments Notes: 1. All indicators are calculated based on consolidated financial figures.
2. Interest-bearing debt includes all balance-sheet debt for which interest payments are being made. 3. Figures for net cash flows provided by (used in) operating activities and interest payments are those from the cash flows from operating activities and interest
paid from consolidated financial statements of cash flows. 3. Forecast for FY2018.3 The forecast for FY2018.3 calls for an increase year on year in cash flows from operating activities due to an increase in income before income taxes and other factors. In cash flows from investing activities, the Company is planning to make investments in property, plant, and equipment exceeding depreciation. (3) Basic Policy for Allocation of Profit and Dividends for FY2017.3 and FY2018.3 Keeping in mind the improvement of its consolidated return on equity, the Company undertakes investments for growth—including R&D, investing in marketing capabilities and the making of other capital investments—on the basis of its medium-term consolidated income level, while proactively returning profits to shareholders. Taking continuous and steady cash dividends as the basis of its shareholder returns, the Company will implement flexible shareholder returns as it sees fit with the aim of improving its capital efficiency, while giving due consideration to the maintaining of a balance between adequate internal reserves of investment for future growth. The Company will implement dividends with a target consolidated payout ratio of 30% or higher. For the year-end dividend for FY2017.3, the Company decided to pay a regular dividend on its common stock of ¥26.00 per share (¥52.00 per share for the full fiscal year) in view of the above-mentioned policy for allocation of profit and dividends, its financial position, and other factors. Regarding dividends for FY2018.3, the Company is planning to pay a regular dividend of ¥56.00 per share for the full fiscal year (consisting of an interim dividend of ¥28.00 per share and a year-end dividend of ¥28.00 per share).
The forward-looking statements in this flash report contain inherent risks and uncertainties insofar as they are based on future projections and plans that may differ materially from the actual results achieved.

6
2. Management Policies (1) Basic Management Policy Yamaha Corporation and our Group companies (hereinafter referred to as “Yamaha” or “the Company” and the “Yamaha Group” or “the Group”) have issued the Yamaha Philosophy as our corporate philosophy and our Promises to Stakeholders, which we have made to all related parties, starting with our shareholders. By fulfilling our social responsibilities in such areas as compliance, the environment, safety, and contribution to the community even as we ensure a high level of profitability based on our global competitive prowess and increased business efficiency, we are working to ensure sustainable growth and to enhance the enterprise value over the medium-to-longer term. [Yamaha Philosophy] Corporate Slogan Sharing Passion & Performance Corporate Philosophy With our unique expertise and sensibilities, gained from our devotion to sound and music, we are
committed to creating excitement and cultural inspiration together with people around the world. Customer Experience*1 Joy, Beauty, Confidence, Discovery Yamaha Quality*2 Excellence, Authenticity, Innovation Yamaha Way*3 Embrace Your Will, Stand on Integrity, Take Proactive Actions, Go Beyond the Limits, Stick to the
Goals *1 The Customer Experience exemplifies the meaning of “Sharing Passion & Performance” from the customer’s viewpoint. When
customers experience, use, or own Yamaha products and services, they should experience a profound response that will stimulate both their emotions and senses.
*2 The Yamaha Quality is a set of criteria that supports Yamaha’s insistence on quality in products and services and our dedication to excellence in manufacturing. These criteria assist in making the Corporate Philosophy a reality.
*3 The Yamaha Way explains the mindset that all employees of the Yamaha Group should adopt, and the manner in which they should act on a daily basis, in order to put the corporate philosophy into practice.
[Promises to Stakeholders] Customer-Oriented and Quality-Conscious Management Yamaha fully satisfies its customers by offering quality products and services that incorporate new and traditional technologies as well as refined creativity and artistry. Transparent and Sound Management Yamaha delivers proper returns to shareholders by ensuring a solid business performance and achieves lasting development through transparent and sound management. Valuing People Yamaha strives to be an organization where each person’s individuality and creativity are respected and all can demonstrate their full potential through their work. Harmony with Society Yamaha is a good corporate citizen that contributes to the development of society, culture, and the economy by observing laws, demonstrating high ethical standards, and endeavoring to protect the environment. (2) Management Indicators Taken as Objectives The management objectives and financial numerical targets set under the Medium-Term Management Plan (from the fiscal year ended March 31, 2017 to the fiscal year ending March 31, 2019) are outlined and described in the following sections of this report: Page 8: “(3) The Group’s Medium- to Long-Term Management Strategy and (4) Issues to Be Addressed: 6. Quantitative Business Targets. The targets for the next fiscal year ending March 31, 2018, are outlined and described in the following sections of this report: “3. Consolidated Financial Forecasts for FY2018.3” in the summary information; Page 4: “(1) Analysis of Management Performance: 2. Forecast for FY2018.3;” and Page 5: “(2) Analysis of Financial Position: 3. Forecast for FY2018.3.”

7
(3) The Group’s Medium- to Long-Term Management Strategy and (4) Issues to Be Addressed Following the completion of its “Yamaha Management Plan 2016 (YMP2016)” on March 31, 2016, the Yamaha Group has prepared and begun to implement its new Medium-Term Management Plan “NEXT STAGE 12,” which will cover the three-year period that began in April 2016. Yamaha’s management vision, which describes the desired future image of the Company, is “Becoming an Indispensable, Brilliantly Individual Company” in the medium-to-long term. Yamaha has positioned the period under the new medium-term plan as a time for “Increase Brand Power and Show Stronger Profitability as a Result.” Principal initiatives under the medium-term plan will be (1) Further raise profitability of the musical instruments business, (2) Expand the audio equipment business, and (3) Establish a platform for the industrial machinery and components business as the third key domain. Even in the current business environment, where the trend toward yen appreciation is creating uncertainties in the economy, Yamaha will aim for steady increases in profitability and set an operating income ratio target of 12% in the final year of the plan as a management objective. 1. Management Vision “Becoming an Indispensable, Brilliantly Individual Company—Boosting Brand Power to Become a Highly Profitable Enterprise” Yamaha successfully completed YMP2016 showing performance that exceeded the numerical targets set under that medium-term plan. For this reason, Yamaha prepared its NEXT STAGE 12 Medium-Term Management Plan to position the desired future image of the Company as the management vision in the medium-to-long term and made clear what challenges the Yamaha Group as a whole, working together, must address to attain the next high goals. 2. Outline of NEXT STAGE 12 Medium-Term Management Plan (1) Positioning Yamaha aims to attain an operating income ratio of 20% in the long term, as a company with a strong brand value. To move up to the next step and work toward “Becoming an Indispensable, Brilliantly Individual Company,” Yamaha positions the coming three years as a time to “Increase Brand Power and Show Stronger Profitability as a Result.” (2) Basic Strategy and Management Objective Under the plan, Yamaha’s basic strategy will be to “Consolidate Competitive Superiority through Adding New Value and Differentiation.” To accomplish this, Yamaha will further deepen its connections with customers, raise attractive quality, and always offer solutions with new value added. Management Objective (Over 3 Years): Operating Income Ratio 12% (FY2019.3) Further raise profitability of the musical instruments business (aim for operating income ratio at the 15% level) Expand the audio equipment business to rival musical instruments business in the future (actual sales growth of 20%) Establish a platform for industrial machinery and components business as the third key domain following musical instruments
and audio equipment
(3) Four Key Strategies a. Develop products with distinctive individuality Through fusing Yamaha’s technologies, which range widely from materials and analytical technologies to sound source, signal processing and network technologies, as well as scientific evaluation of assessing human sensitivities, Yamaha is positioned to deliver original value that is added to excellent basic functions and develop products that others cannot imitate. Yamaha will construct the Yamaha Innovation Center Research and Development Building, and accelerate synergies by bringing together about 2,500 Yamaha technical personnel in one location at its Headquarters. b. Enhance customer interaction By offering customers optimal services and solutions, Yamaha is forging even stronger and broader ties with its customers. To realize this, Yamaha will expand its sales network for consumer products and work to speed up the promotion of music popularization activities suited to local needs, while enhancing corporate and business-to-business (B-2-B) service systems and locations. c. Continually reduce costs Under the new medium-term plan, Yamaha continues to reduce manufacturing costs (through reorganizing production processes, reducing purchasing costs, introducing new production methods, and other means) and to increase the productivity of administrative functions to realize about ¥8.0 billion (net over a three-year period) in cost reductions. d. Strengthen global business platforms Yamaha endeavors to facilitate international careers by assigning personnel to positions that are the most suited to them and to further their career development. In addition, Yamaha is working to globally optimize its IT, logistics, finance, and administrative functions to strengthen its global business platforms and to further promote operational efficiency.

8
3. Major Business Strategies (1) Musical Instruments Yamaha will aim to increase profitability through technology development capabilities and marketing that takes advantage of Yamaha’s business scale. To improve profitability, Yamaha will expand sales of high-margin digital musical instruments and improve gross margins by reviewing the product mix and selling prices. In addition, Yamaha will accelerate its activities to enhance product competitiveness through pursuing the essence of musical instruments using its original assessment technology of scientific evaluation of assessing human sensitivities and offering new value in digital musical instruments, hybrid pianos, and other products. Moreover, Yamaha will optimize its marketing and points of contact with customers by region to increase its brand power and enhance its customer interaction. (2) Audio Equipment Yamaha will work to accelerate growth by promoting technological innovation based on its signal processing and network technologies and enhancing customer support. In the professional audio equipment domain, Yamaha will provide audio systems that increase value added of audio contractors who partner with Yamaha. It will also expand its systems engineering and marketing staff worldwide and, in addition to providing services for concert halls and other venues, will work to broaden its customer base in other markets, including background music (BGM) for retail stores and corporate conferencing markets. In the consumer audio products domain, Yamaha will aim to strengthen its brand power by moving forward with its initiatives to propose freer music listening styles to meet customer needs, focusing on its strategic product MusicCast. (3) Industrial Machinery and Components Yamaha will establish a base that will enable it to make its industrial machinery and components business the third platform of Yamaha business activities. In this business, Yamaha will transform its focus from a semiconductor manufacturer to become a solutions vendor. Yamaha will endeavor to expand sales by offering solutions that are comfortable, secure, and safe, focusing especially on sound technology in the domains of onboard devices, home healthcare, and industrial machinery. In the onboard device domain, in addition to providing comprehensive sound systems, Yamaha will proceed with the development of thermoelectric solutions that contribute to the realization of an eco-friendly motorized society. In addition, in the home healthcare domain, Yamaha will move forward with applying its sound and sensor technologies to propose new solutions. 4. ESG With the aim of creating a sustainable society, Yamaha will continue to implement various activities from the perspective of “E” (Environment), “S” (Society), and “G” (Governance). Yamaha will work toward the solution of social issues through business activities that are based on business strategies, give due regard to the natural environment and society in its business processes and continue to implement various activities, and aim to conduct transparent, high-quality management by strengthening its corporate governance and internal control systems. 5. Investment and Return to Shareholders After the allocation of cash generated to strategic investments, Yamaha actively provides returns to shareholders. Capital expenditure: ¥40 billion Strategic investments: ¥50 billion (including M&A) Strategic marketing and R&D investments: ¥10 billion Yamaha’s basic policy is to pay continuing and stable dividends to shareholders, and give consideration to the balance between the appropriate level of retained earnings for investments for future growth, while flexibly providing appropriate returns to shareholders to increase capital efficiency. Note that, regarding dividends, Yamaha’s target ratio for its consolidated dividend payout is 30% or higher. 6. Quantitative Business Targets For the last year of “NEXT STAGE 12” (FY2019.3), Yamaha has set an operating income ratio target of 12% as a management objective. Note that the financial numerical targets (Currency exchange rates assumed: Yen per U.S. dollar: ¥115, Yen per euro: ¥125) are as follows. Net sales: ¥465 billion Operating income: ¥55 billion ROE: 10% level Earnings per share (EPS): ¥200 level

9
3. Basic Approach to Selection of Accounting Standards For the time being, the Group will continue to adopt generally accepted accounting principles in Japan, and the timing for adopting the International Financial Reporting Standards (IFRS) has not been decided. However with an eye to the adoption of IFRS in the fiscal year ending March 2020, the Group is continuing to consider related issues and practical operational matters.

10
4. Consolidated Financial Statements and Major Notes (1) Consolidated Balance Sheets
(Millions of yen) FY2017.3 FY2016.3 (As of Mar. 31, 2017) (As of Mar. 31, 2016) ASSETS Current assets:
Cash and deposits ¥105,859 ¥ 88,166 Notes and accounts receivable—trade 50,995 49,026 Merchandise and finished goods 66,149 63,232 Work in process 12,687 12,825 Raw materials and supplies 14,290 15,808 Deferred tax assets 8,579 8,802 Other 15,397 18,521 Allowance for doubtful accounts (1,239) (1,247) Total current assets 272,720 255,135
Noncurrent assets: Property, plant and equipment:
Buildings and structures, net 31,034 33,728 Machinery, equipment and vehicles, net 12,976 12,722 Tools, furniture and fixtures, net 10,030 9,889 Land 43,851 46,061 Lease assets, net 294 333 Construction in progress 7,287 1,544 Total property, plant and equipment 105,475 104,280
Intangible assets: Goodwill 60 2,456 Other 3,134 3,104 Total intangible assets 3,195 5,560
Investments and other assets: Investment securities 132,771 96,911 Long-term loans receivable 108 122 Net defined benefit assets 254 6 Deferred tax assets 2,261 2,123 Lease and guarantee deposits 4,108 4,330 Other 1,592 1,379 Allowance for doubtful accounts (126) (104) Total investments and other assets 140,970 104,769
Total noncurrent assets 249,641 214,610 Total assets ¥522,362 ¥469,745
Note: Figures of less than ¥1 million have been omitted.

11
(Millions of yen) FY2017.3 FY2016.3 (As of Mar. 31, 2017) (As of Mar. 31, 2016) LIABILITIES Current liabilities:
Notes and accounts payable—trade ¥ 17,828 ¥ 19,353 Short-term loans payable 11,170 8,409 Current portion of long-term loans payable 30 30 Accounts payable—other and accrued expenses 43,961 37,222 Income taxes payable 2,410 2,307 Deferred tax liabilities 11 2 Provision for product warranties 1,687 2,526 Provision for sales returns 109 93 Provision for loss on construction contracts 16 ― Other 5,338 5,513 Total current liabilities 82,565 75,459
Noncurrent liabilities: Long-term loans payable 40 71 Long-term accounts payable 6,972 1,035 Deferred tax liabilities 22,161 24,750 Deferred tax liabilities for land revaluation 9,587 9,878 Net defined benefit liabilities 23,039 38,024 Long-term deposits received 9,102 15,041 Other 1,454 1,595 Total noncurrent liabilities 72,359 90,396
Total liabilities 154,924 165,856 NET ASSETS Shareholders’ equity:
Capital stock 28,534 28,534 Capital surplus 40,054 40,054 Retained earnings 250,649 213,050 Treasury stock (23,731) (20,945) Total shareholders’ equity 295,507 260,694
Accumulated other comprehensive income: Valuation difference on available-for-sale securities 80,282 55,038 Deferred gains or losses on hedges 103 (97) Revaluation reserve for land 16,095 16,743 Foreign currency translation adjustment (24,219) (19,513) Remeasurements of defined benefit plans (2,645) (11,320) Total accumulated other comprehensive income 69,616 40,850
Non-controlling interests 2,314 2,344 Total net assets 367,437 303,889
Total liabilities and net assets ¥522,362 ¥469,745
Note: Figures of less than ¥1 million have been omitted.

12
(2) Consolidated Statements of Operations and Consolidated Statements of Comprehensive Income Consolidated Statements of Operations
(Millions of yen) FY2017.3 FY2016.3
(Apr. 1, 2016–Mar. 31, 2017) (Apr. 1, 2015–Mar. 31, 2016) Net sales ¥408,248 ¥435,477 Cost of sales 242,451 262,406 Gross profit 165,796 173,070 Selling, general and administrative expenses 121,493 132,407 Operating income 44,302 40,663 Non-operating income:
Interest income 665 699 Dividends income 3,108 2,377 Tariff refund ― 693 Other 951 1,106 Total non-operating income 4,725 4,876
Non-operating expenses: Interest expenses 290 338 Sales discounts 2,616 2,909 Foreign exchange losses 218 598 Other 977 785 Total non-operating expenses 4,101 4,632
Ordinary income 44,926 40,907 Extraordinary income:
Gain on sales of noncurrent assets 3,848 8,963 Gain on sales of investment securities 259 3 Gain on liquidation of investment securities ― 13 Gain on liquidation of subsidiaries and affiliates 229 ― Total extraordinary income 4,337 8,979
Extraordinary loss: Loss on retirement of noncurrent assets 304 666 Loss on valuation of investment securities 6 0 Impairment loss 630 882 Amortization of goodwill 1,499 6,759 Business structural reform expenses 3,032 ― Loss due to transition to a defined contribution pension plan 892 ―
Total extraordinary loss 6,366 8,309 Income before income taxes 42,898 41,578 Income taxes―current 8,728 9,541 Income taxes―deferred (12,706) (656) Total income taxes (3,978) 8,885 Net income for the period 46,876 32,693 Net income attributable to non-controlling interests 156 59 Net income attributable to owners of parent ¥ 46,719 ¥ 32,633
Note: Figures of less than ¥1 million have been omitted.

13
Consolidated Statements of Comprehensive Income (Millions of yen)
FY2017.3 FY2016.3 (Apr. 1, 2016–Mar. 31, 2017) (Apr. 1, 2015–Mar. 31, 2016)
Net income for the period ¥46,876 ¥ 32,693
Other comprehensive income Valuation difference on available-for-sale securities 25,234 (32,118) Deferred gains or losses on hedges 200 (313) Revaluation reserve for land ― 450 Foreign currency translation adjustments (4,853) (10,858) Remeasurements of defined benefit plans 8,675 (9,708) Share of other comprehensive income of affiliates accounted for
using equity method 9 (31) Total other comprehensive income 29,267 (52,580)
Comprehensive income 76,143 (19,887) (Composition) Comprehensive income attributable to owners of parent 76,133 (19,694) Comprehensive income attributable to non-controlling interests ¥ 10 ¥ (192)
Note: Figures of less than ¥1 million have been omitted.

14
(3) Consolidated Statements of Changes in Shareholders’ Equity
FY2017.3 (April 1, 2016-March 31, 2017) (Millions of yen) Shareholders’ equity
Capital stock Capital surplus Retained earnings Treasury stock Total shareholders’ equity
Balance at beginning of period ¥28,534 ¥40,054 ¥213,050 ¥(20,945) ¥260,694
Changes of items during the period Dividends from surplus (9,768) (9,768)
Net income attributable to owners of parent 46,719 46,719
Change of scope of consolidation ― Reversal of revaluation reserve for land 648 648
Purchase of treasury stock (2,785) (2,785)
Net changes of items other than shareholders’ equity
Total changes of items during the period ― ― 37,598 (2,785) 34,813
Balance at the end of period ¥28,534 ¥40,054 ¥250,649 ¥(23,731) ¥295,507
Accumulated other comprehensive income
Non-controlling interests Total net assets Valuation
difference on available-for-sale
securities
Deferred gains or losses on hedges
Revaluation reserve for land
Foreign currency translation adjustment
Remeasurements of defined benefit
plans
Total accumulated other
comprehensive income
Balance at beginning of period ¥55,038 ¥ (97) ¥16,743 ¥(19,513) ¥(11,320) ¥40,850 ¥2,344 ¥303,889
Changes of items during the period Dividends from surplus (9,768) Net income attributable to owners of parent 46,719
Change of scope of consolidation ―
Reversal of revaluation reserve for land 648
Purchase of treasury stock (2,785)
Net changes of items other than shareholders’ equity 25,244 200 (648) (4,706) 8,675 28,765 (30) 28,735
Total changes of items during the period 25,244 200 (648) (4,706) 8,675 28,765 (30) 63,548
Balance at the end of period ¥80,282 ¥103 ¥16,095 ¥(24,219) ¥ (2,645) ¥69,616 ¥2,314 ¥367,437

15
FY2016.3 (April 1, 2015-March 31, 2016) (Millions of yen) Shareholders’ equity
Capital stock Capital surplus Retained earnings Treasury stock Total shareholders’ equity
Balance at beginning of period ¥28,534 ¥40,054 ¥186,436 ¥ (3,711) ¥251,314
Changes of items during the period
Dividends from surplus (7,841) (7,841)
Net income attributable to owners of parent 32,633 32,633
Change of scope of consolidation 29 29
Reversal of revaluation reserve for land 1,791 1,791
Purchase of treasury stock (17,234) (17,234)
Net changes of items other than shareholders’ equity
Total changes of items during the period ― ― 26,613 (17,234) 9,379
Balance at the end of period ¥28,534 ¥40,054 ¥213,050 ¥(20,945) ¥260,694
Accumulated other comprehensive income
Non-controlling interests Total net assets Valuation
difference on available-for-sale
securities
Deferred gains or losses on hedges
Revaluation reserve for land
Foreign currency translation adjustment
Remeasurements of defined benefit
plans
Total accumulated other
comprehensive income
Balance at beginning of period ¥87,188 ¥215 ¥18,085 ¥ (9,106) ¥ (1,611) ¥94,771 ¥2,666 ¥348,752
Changes of items during the period
Dividends from surplus (7,841)
Net income attributable to owners of parent 32,633
Change of scope of consolidation 29
Reversal of revaluation reserve for land 1,791
Purchase of treasury stock (17,234)
Net changes of items other than shareholders’ equity (32,150) (313) (1,341) (10,406) (9,708) (53,920) (321) (54,242)
Total changes of items during the period (32,150) (313) (1,341) (10,406) (9,708) (53,920) (321) (44,862)
Balance at the end of period ¥55,038 ¥ (97) ¥16,743 ¥(19,513) ¥(11,320) ¥40,850 ¥2,344 ¥303,889

16
(4) Consolidated Statements of Cash Flows (Millions of yen)
FY2017.3 FY2016.3 (Apr. 1, 2016–Mar. 31, 2017) (Apr. 1, 2015–Mar. 31, 2016) Net cash provided by (used in) operating activities:
Income before income taxes ¥42,898 ¥41,578 Depreciation and amortization 11,145 12,681 Impairment loss 630 882 Amortization of goodwill 2,307 9,553 Increase (decrease) in allowance for doubtful accounts 47 (91) (Gain) on liquidation of subsidiaries and affiliates (229) ― Loss on valuation of investment securities 7 0 (Gain) on sales of investment securities (259) (3) (Gain) on liquidation of investment securities ― (13) (Decrease) in net defined benefit liabilities (7,166) (3,172) Interest and dividends income (3,774) (3,077) Interest expenses 290 338 Foreign exchange (gains) losses (111) 286 Equity in (gains) losses of affiliates (7) 6 (Gain) on sales of noncurrent assets (3,848) (8,963) Loss on retirement of noncurrent assets 304 666 Business structural reform expenses 3,032 ― (Increase) decrease in notes and accounts receivable—trade (3,036) 9,947 (Increase) in inventories (3,387) (8,523) (Decrease) in notes and accounts payable—trade (550) (1,921) Increase in accounts payable due to transition to a defined
contribution pension plan 7,241 ―
Other, net (852) 273 Subtotal 44,679 50,449 Interest and dividends income received 3,780 3,137 Interest expenses paid (230) (332) Payment of business structural reform expenses (565) (1,543) Income taxes paid (8,520) (9,311) Net cash provided by (used in) operating activities ¥39,142 ¥42,399

17
(Millions of yen) FY2017.3 FY2016.3 (Apr. 1, 2016–Mar. 31, 2017) (Apr. 1, 2015–Mar. 31, 2016)
Net cash provided by (used in) investing activities: Net decrease (increase) in time deposits ¥ (2,094) ¥ (300) Purchase of property, plant and equipment (13,276) (11,432) Proceeds from sales of property, plant and equipment 5,263 12,811 Purchase of investment securities (191) (250) Proceeds from sales and redemption of investment securities 318 41 Proceeds from liquidation of investment securities ― 27 Proceeds from liquidation of subsidiaries and affiliates 329 ― Payments for investments in capital (9) (0) Payments of loans receivable (38) (93) Collection of loans receivable 46 43 Other, net (11) (255) Net cash provided by (used in) investing activities (9,663) 591
Net cash provided by (used in) financing activities: Net increase (decrease) in short-term loans payable 2,765 (2,188) Proceeds from long-term loans payable ― 93 Repayment of long-term loans payable (30) (111) Proceeds from deposits received from membership 125 150 Repayments for deposits received from membership (5,582) (261) Purchase of treasury stock (8) (17,234) Payments made to trust account for purchase of treasury stock ― (2,793) Cash dividends paid (9,768) (7,841) Cash dividends paid to non-controlling interests (40) (129) Other, net (47) (31) Net cash provided by (used in) financing activities (12,588) (30,349)
Effect of exchange rate change on cash and cash equivalents (1,238) (3,782) Net increase (decrease) in cash and cash equivalents 15,651 8,859 Cash and cash equivalents at beginning of period 85,018 76,159 Increase in cash and cash equivalents from newly consolidated
subsidiary ― 858
Decrease in cash and cash equivalents resulting from exclusion of subsidiaries from consolidation ― (858)
Cash and cash equivalents at end of period ¥100,669 ¥85,018
Note: Figures of less than ¥1 million have been omitted.

18
(5) Notes to the Consolidated Financial Statements Notes Regarding Assumptions as a Going Concern
Not applicable
Changes in Accounting Principles, Changes in Accounting Estimates, and Changes in Presentation due to Revisions
Changes in the depreciation method for calculation of property, plant and equipment Regarding the methods for calculation of depreciation of property, plant and equipment, previously, the Company and its consolidated subsidiaries in Japan adopted the declining balance method, and overseas consolidated subsidiaries mainly applied the straight-line method for calculating depreciation. However, from the beginning of FY2017.3, the method for depreciation in the Company and its subsidiaries has been changed to the straight-line method. Under the new Medium-Term Management Plan “NEXT STAGE 12,” which will cover the three-year period beginning from the current fiscal year, as a part of its key strategies, the Company has set the objectives of continually reducing costs, including reorganization of production processes, and strengthening its global business platforms. In addition, along with the expansion of the sales and production overseas and the increasing number of overseas subsidiaries through M&A, the importance of overseas bases is increasing. Since standardization of accounting treatment throughout the Group has risen in importance, on the occasion of preparing a Medium-Term Management Plan, the Company reconsidered the methods for calculating depreciation of property, plant and equipment. Taking into account the actual usage and capital investments in the past as well as the usage plans and capital investments in the future, since the outlook is for the property, plant and equipment to be used stably over long useful lives, the Company has decided that it will be reasonable for depreciation expenses to be spread evenly over the useful lives of these assets through the use of the straight-line method of depreciation. As a result of this change, operating income, ordinary income, and income before income taxes for the fiscal year were ¥745 million higher than they would have been in the absence of such changes, respectively. Please note that the effect of this change to the segment information is stated in the related section.
Changes in the Method of Presentation
Consolidated balance sheets In the consolidated financial statements for the previous fiscal year, long-term accounts payable were included in the other item under noncurrent liabilities. However, since the amount of this item has become material, it has been presented as an independent item. To reflect this change in presentation, the consolidated financial statements for the previous fiscal year have been reclassified. As a result, in the consolidated balance sheets for the previous fiscal year, the other item under noncurrent liabilities, which was reported as ¥2,631 million, has been restated as ¥1,035 million of long-term accounts payable and ¥1,595 million of the other item under noncurrent liabilities.
Additional Information
Presentation of deferred tax assets accompanying the application of “Implementation Guidance on Recoverability of Deferred Tax Assets” The Company has applied “Implementation Guidance on Recoverability of Deferred Tax Assets” (ASBJ Guidance No. 26, issued March 28, 2016) from the beginning of FY2017.3, and, based on the recent performance trends and other factors, the Company has revised the recoverability of deferred tax assets. As a result, during FY2017.3, deferred tax assets have been additionally recorded in the consolidated financial statements, with ¥12,706 million to be credited as income taxes-deferred. Realignment of resort business The Company has decided to realign its resort businesses and, regarding “Tsumagoi” that the Yamaha Group manages, has concluded a transfer agreement of its real estate and trademark “Tsumagoi” with Hotel Management International Co., Ltd. (HMI) on February 28, 2017. The Yamaha Group fully closed its operations as of March 26, 2017, and on March 27, the assets were transferred to HMI. Please note that, in connection with this corporate realignment, the Company reported a gain on sales of noncurrent assets of ¥2,182 million and business structural reform expenses of ¥2,652 million. The impact on the consolidated financial statements for FY2017.3 was a reduction in income before income taxes of ¥470 million.

19
Extraordinary losses due to impairment loss on stock of consolidated subsidiary and immediate amortization of goodwill The Company reported extraordinary losses in FY2017.3 because of the impairment loss on stock of a consolidated subsidiary held by the Company (in the non-consolidated closing) and the immediate amortization of goodwill (in the consolidated closing). 1. Impairment loss of stock of consolidated subsidiary (in the non-consolidated closing) The Company reported ¥2,319 million of extraordinary losses due to loss on valuation of stocks of subsidiaries and affiliates, namely, Revolabs, Inc., a company that became a wholly owned subsidiary in March 2014, together with its subsidiaries. This course of action was taken because performance results and results expected from drawing on the technology, know-how, sales network, etc. of these subsidiaries continued to diverge from initial plans. For this reason, the Company has reported an impairment loss on stocks of Revolabs and its subsidiaries. Please note that the extraordinary losses shown in the non-consolidated closing have been eliminated in consolidation; therefore, the impact of this extraordinary loss in the consolidated closing is equal to those shown in section 2. 2. Immediate amortization of goodwill (in the consolidated closing) Accompanying the impairment loss in the non-consolidated closing noted in the previous item, in its consolidated closing, the Company reported extraordinary losses on the immediate amortization of goodwill of ¥1,499 million related to Revolabs, Inc., and its subsidiaries. Revisions in the pension plans Yamaha Corporation and certain of its subsidiaries revised their pension plans as of April 1, 2017, and made the transition of a portion of such plans from defined benefit to defined contribution plans. Accompanying this, Yamaha has applied “Accounting Treatment of Pension Plan Transitions” (Corporate Accounting Application Guidelines No. 1). As a consequence, the Company recognized an extraordinary loss due to transition to a defined contribution pension plan amounting to ¥892 million. Please note that, as a result of this transition, the amount transferred to defined contribution plans was ¥7,241 million, and this amount was included in accounts payable—other and accrued expenses, and in long-term accounts payable.
Consolidated Statements of Operations
Impairment Losses
FY2017.3 (April 1, 2016–March 31, 2017) Outline of asset groups where impairment losses were recognized (Millions of yen)
Use Location Impairment losses
Idle assets, etc. Kakegawa City, Shizuoka, and elsewhere
Buildings and structures ¥1,039 Machinery, equipment and vehicles, net 52 Tools, furniture and fixtures 71 Land 1,437 Construction in progress 34 Total ¥2,634
Of the above, impairment loss of ¥2,004 million related to realignment of the resort business is included in the business structural reform expenses. Method for Grouping of Assets Within its segment classification, the Yamaha Group groups the smallest asset units that generate cash flow together. Background Leading to the Recognition of Impairment Losses Impairment losses were recognized on idle assets that will not be used in the future, assets that are expected to become idle assets, and assets that the Company expects to dispose of. Calculation of the Recovery Value The recovery value of idle assets, etc., is estimated from the net sales value; indicators include value estimates prepared by real estate appraisers, the assessed value for the tangible fixed assets tax, and other sources.

20
FY2016.3 (April 1, 2015–March 31, 2016) Outline of asset groups where impairment losses were recognized (Millions of yen)
Use Location Impairment losses
Idle assets, etc. Hamamatsu City, Shizuoka, and elsewhere
Buildings and structures ¥ 85 Tools, furniture and fixtures 0 Land 796 Total ¥882
Method for Grouping of Assets Within its segment classification, the Yamaha Group groups the smallest asset units that generate cash flow together. Background Leading to the Recognition of Impairment Losses Impairment losses were recognized on idle assets that will not be used in the future, assets that are expected to become idle assets, and assets that the Company expects to dispose of. Calculation of the Recovery Value The recovery value of idle assets, etc., is estimated from the net sales value; indicators include value estimates prepared by real estate appraisers, the assessed value for the tangible fixed assets tax, and other sources. Amortization of Goodwill
FY2017.3 (April 1, 2016–March 31, 2017) Immediate amortization of goodwill was recognized based on Item 32 of the “Practical Guideline Related to Capital Consolidation Procedures in Consolidated Financial Statements” (Final Revision on November 28, 2014, the Accounting Practice Committee Report No. 7 issued by the Japanese Institute of Certified Public Accountants). FY2016.3 (April 1, 2015–March 31, 2016) Immediate amortization of goodwill was recognized based on Item 32 of the “Practical Guideline Related to Capital Consolidation Procedures in Consolidated Financial Statements” (Final Revision on November 28, 2014, the Accounting Practice Committee Report No. 7 issued by the Japanese Institute of Certified Public Accountants). Business Structural Reform Expenses
FY2017.3 (April 1, 2016–March 31, 2017) In addition to losses of ¥2,652 million (including ¥2,004 million of impairment loss on noncurrent assets) incurred in connection with the realignment of the resort business, the Company incurred losses of ¥380 million due to extra retirement allowance in connection with reductions in personnel at overseas manufacturing and development operations. FY2016.3 (April 1, 2015–March 31, 2016)
Not applicable
21
Segment Information
1. Summary of Reporting Segments Business segments are composed of business units that provide separate financial information, and are regularly reviewed by the Board of Directors of the Company for the purpose of business performance evaluation and management resource allocation decisions. The Company’s business segments, based on its economic features and similarity of products and services, comprise its two principal reporting segments, which are musical instruments and audio equipment. Other businesses have been grouped together in the “Others” segment. The musical instruments business segment includes the manufacture and sales of pianos; digital musical instruments; wind, string, and percussion instruments; and other music-related activities. The audio equipment business segment includes the manufacture and sales of audio products, professional audio equipment, information and telecommunication equipment, and certain other products. The “others” segment includes electronic devices business, automobile interior wood components, factory automation (FA) equipment, golf products, recreation, and certain other lines of business. Change in business segments From the beginning of FY2017.3, the reporting segment classification and presentation have been changed. Accompanying the decrease in size of the electronic devices business, it has been excluded from the reporting segment and included in the others segment. Sales of this business to external customers in the previous fiscal year amounted to ¥13,068 million and segment income was ¥107 million. Also, as a result of the review of the classification of businesses, the soundproof product business has been moved from the musical instruments segment to the audio equipment segment from the beginning of FY2017.3. The impact of this change was not material. Please note that segment information of the previous fiscal year has been prepared and presented after the change in business segments. 2. Method for Calculating the Sales, Income (Loss), Assets, Liabilities, and Other Items for Reporting Segments The accounting treatment for reporting business segments is carried out through principles and procedures that are all the same as the methods adopted for preparation of the consolidated financial statements. Figures for income in reporting segments are on an operating income basis. Intersegment sales and transfers are based on prevailing market prices. Changes in the depreciation method for calculation of property, plant and equipment As noted in “(5) Notes to the Consolidated Financial Statements, Changes in Accounting Principles, Changes in Accounting Estimates, and Changes in Presentation due to Revisions,” the method for depreciation has been changed. Regarding the methods for calculation of depreciation of property, plant and equipment, previously, the Company and its consolidated subsidiaries in Japan adopted the declining balance method, and overseas consolidated subsidiaries mainly applied the straight-line method for calculating depreciation. However, from the beginning of FY2017.3, the method for depreciation in the Company and its subsidiaries has been changed to the straight-line method. As a result of this change, segment income of musical instruments, audio equipment, and others was ¥532 million, ¥164 million, and ¥49 million higher than they would have been in the absence of this change, respectively.

22
3. Information on the Amounts of Sales, Income (Loss), Assets, Liabilities, and Other Items for Reporting Segments FY2017.3 (April 1, 2016-March 31, 2017) (Millions of yen)
Musical instruments
Audio equipment Others Total Adjustments Consolidated
Sales to external customers ¥257,664 ¥115,484 ¥ 35,099 ¥408,248 ¥408,248
Intersegment sales or transfers 402 402 (402)
Total 257,664 115,484 35,501 408,650 (402) 408,248
Segment income 32,138 10,447 1,716 44,302 44,302
Segment assets ¥294,687 ¥ 75,555 ¥152,120 ¥522,362 ¥522,362
Other items
Depreciation and amortization 7,245 2,920 978 11,145 11,145
Impairment loss 546 83 2,004 2,634 2,634 Increase in property, plant and equipment and intangible assets ¥ 11,469 ¥ 4,047 ¥ 2,364 ¥ 17,881 ¥ 17,881
Notes: 1. The item “Adjustments” contains the following: The sales adjustment item of ¥(402) million, which comprises eliminations of transactions among the Company’s business segments.
2. “Segment income” means the operating income of the segment as presented in the Consolidated Statements of Operations. 3. Among the assets of the Others segment, the amount of investment securities related to Yamaha Motor Co., Ltd. (the market value reported on the Consolidated
Balance Sheets) is ¥114,325 million. FY2016.3 (April 1, 2015-March 31, 2016) (Millions of yen)
Musical instruments
Audio equipment Others Total Adjustments Consolidated
Sales to external customers ¥277,370 ¥120,881 ¥ 37,225 ¥435,477 ¥435,477
Intersegment sales or transfers 544 544 (544)
Total 277,370 120,881 37,770 436,021 (544) 435,477
Segment income ¥ 31,687 ¥ 8,536 ¥ 439 ¥ 40,663 ¥ 40,663
Segment assets 272,309 81,433 116,002 469,745 469,745
Other items
Depreciation and amortization 8,390 3,075 1,215 12,681 12,681
Impairment loss 882 882 882 Increase in property, plant and equipment and intangible assets ¥ 6,736 ¥ 3,187 ¥ 1,418 ¥ 11,341 ¥ 11,341
Notes: 1. The item “Adjustments” contains the following: The sales adjustment item of ¥(544) million, which comprises eliminations of transactions among the Company’s business segments.
2. “Segment income” means the operating income of the segment as presented in the Consolidated Statements of Operations. 3. Among the assets of the Others segment, the amount of investment securities related to Yamaha Motor Co., Ltd. (the market value reported on the Consolidated
Balance Sheets) is ¥79,827 million.

23
Related Information
1. Information by product and service Since the Company discloses the same information in its segment information section, it has been omitted.
2. Information by geographical segment
(1) Sales and Property, plant and equipment Information based on the geographical location of the customers FY2017.3 (April 1, 2016-March 31, 2017) (Millions of yen)
Japan
Overseas
Consolidated North America Europe China
Asia, Oceania,
and other areas
Total U.S.A.
Net sales ¥138,404 ¥83,032 ¥74,231 ¥76,463 ¥45,827 ¥64,520 ¥269,843 ¥408,248
% of net sales 33.9% 20.3% 18.2% 18.7% 11.2% 15.9% 66.1% 100.0% Notes: 1. Sales information is based on the geographical location of the customers, and it is classified by country or region.
2. Main country and regional divisions: North America: U.S.A., Canada Europe: Germany, France, U.K. Asia, Oceania, and other areas: Republic of Korea, Australia
FY2016.3 (April 1, 2015-March 31, 2016) (Millions of yen)
Japan
Overseas
Consolidated North America Europe
Asia, Oceania, and other areas
Total
Net sales ¥145,033 ¥88,234 ¥82,205 ¥120,003 ¥290,443 ¥435,477
% of net sales 33.3% 20.3% 18.9% 27.5% 66.7% 100.0% Notes: 1. Sales information is based on the geographical location of the customers, and it is classified by country or region.
2. Main country and regional divisions: North America: U.S.A., Canada Europe: Germany, France, U.K. Asia, Oceania, and other areas: People’s Republic of China, Republic of Korea, Australia
24
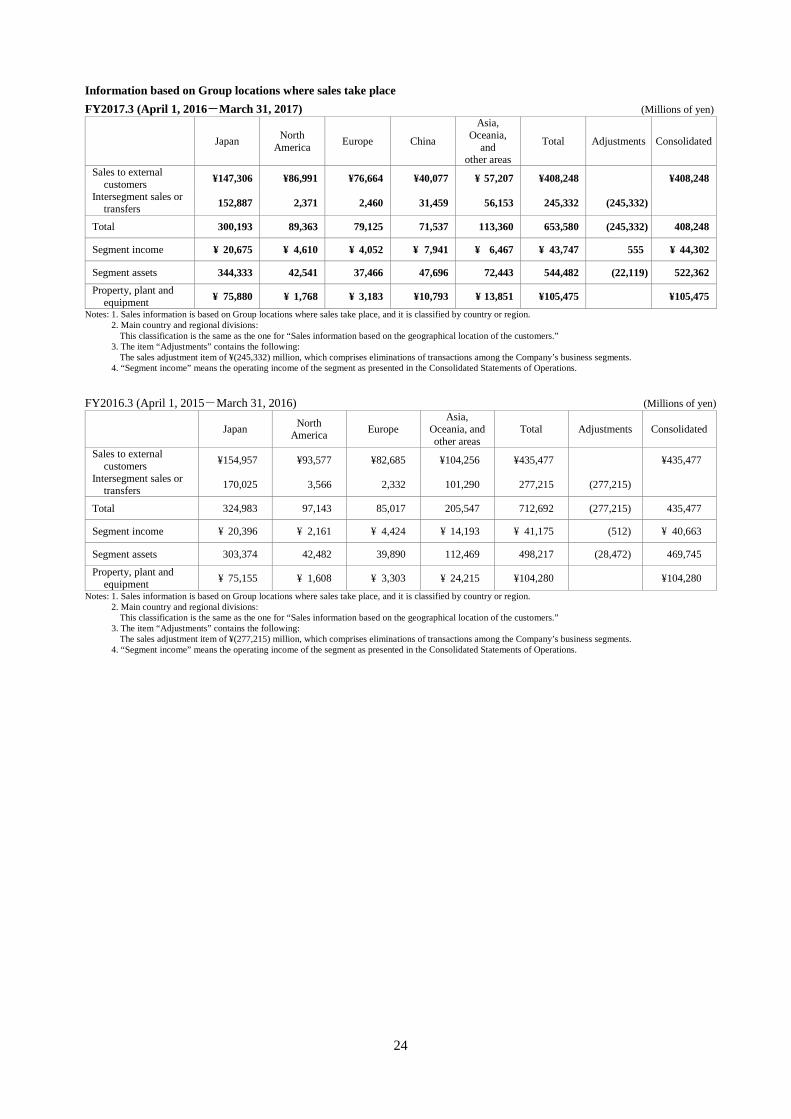
Information based on Group locations where sales take place FY2017.3 (April 1, 2016-March 31, 2017) (Millions of yen)
Japan North
America Europe China
Asia, Oceania,
and other areas
Total Adjustments Consolidated
Sales to external customers ¥147,306 ¥86,991 ¥76,664 ¥40,077 ¥ 57,207 ¥408,248 ¥408,248
Intersegment sales or transfers 152,887 2,371 2,460 31,459 56,153 245,332 (245,332)
Total 300,193 89,363 79,125 71,537 113,360 653,580 (245,332) 408,248
Segment income ¥ 20,675 ¥ 4,610 ¥ 4,052 ¥ 7,941 ¥ 6,467 ¥ 43,747 555 ¥ 44,302
Segment assets 344,333 42,541 37,466 47,696 72,443 544,482 (22,119) 522,362 Property, plant and
equipment ¥ 75,880 ¥ 1,768 ¥ 3,183 ¥10,793 ¥ 13,851 ¥105,475 ¥105,475 Notes: 1. Sales information is based on Group locations where sales take place, and it is classified by country or region.
2. Main country and regional divisions: This classification is the same as the one for “Sales information based on the geographical location of the customers.”
3. The item “Adjustments” contains the following: The sales adjustment item of ¥(245,332) million, which comprises eliminations of transactions among the Company’s business segments.
4. “Segment income” means the operating income of the segment as presented in the Consolidated Statements of Operations.
FY2016.3 (April 1, 2015-March 31, 2016) (Millions of yen)
Japan North
America Europe Asia,
Oceania, and other areas
Total Adjustments Consolidated
Sales to external customers ¥154,957 ¥93,577 ¥82,685 ¥104,256 ¥435,477 ¥435,477
Intersegment sales or transfers 170,025 3,566 2,332 101,290 277,215 (277,215)
Total 324,983 97,143 85,017 205,547 712,692 (277,215) 435,477
Segment income ¥ 20,396 ¥ 2,161 ¥ 4,424 ¥ 14,193 ¥ 41,175 (512) ¥ 40,663
Segment assets 303,374 42,482 39,890 112,469 498,217 (28,472) 469,745
Property, plant and equipment ¥ 75,155 ¥ 1,608 ¥ 3,303 ¥ 24,215 ¥104,280 ¥104,280
Notes: 1. Sales information is based on Group locations where sales take place, and it is classified by country or region. 2. Main country and regional divisions:
This classification is the same as the one for “Sales information based on the geographical location of the customers.” 3. The item “Adjustments” contains the following:
The sales adjustment item of ¥(277,215) million, which comprises eliminations of transactions among the Company’s business segments. 4. “Segment income” means the operating income of the segment as presented in the Consolidated Statements of Operations.
25
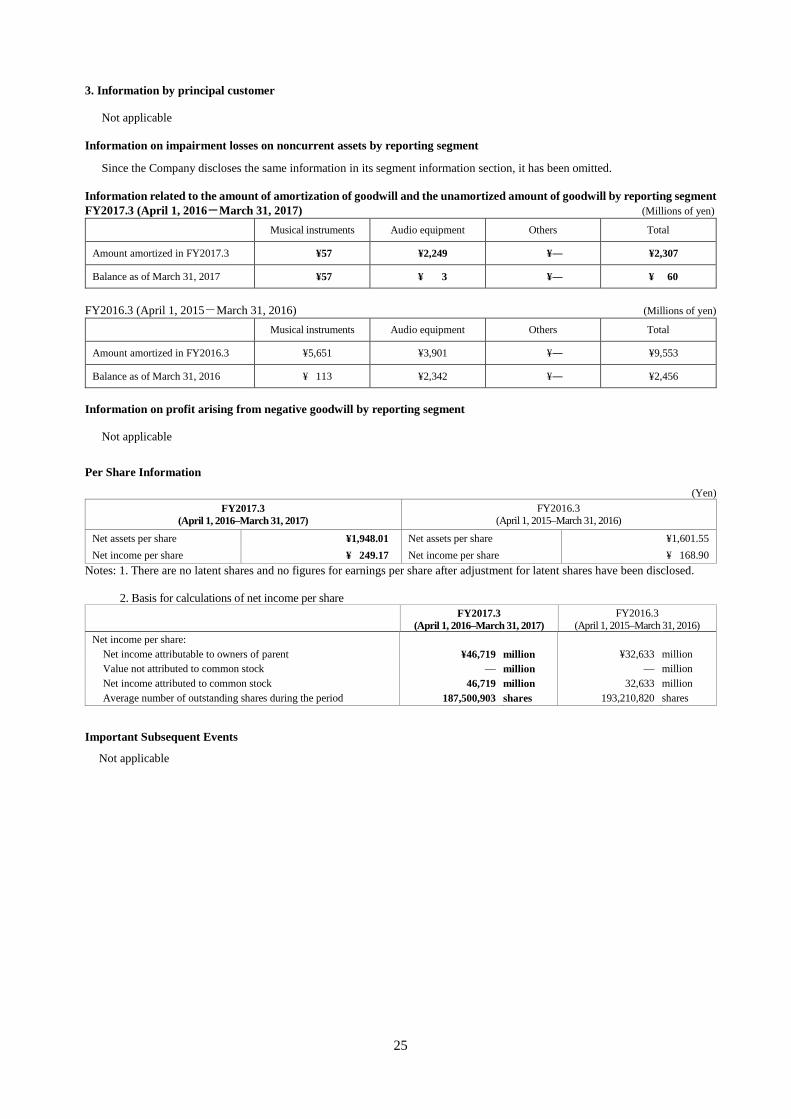
3. Information by principal customer
Not applicable Information on impairment losses on noncurrent assets by reporting segment
Since the Company discloses the same information in its segment information section, it has been omitted. Information related to the amount of amortization of goodwill and the unamortized amount of goodwill by reporting segment FY2017.3 (April 1, 2016-March 31, 2017) (Millions of yen)
Musical instruments Audio equipment Others Total
Amount amortized in FY2017.3 ¥57 ¥2,249 ¥― ¥2,307
Balance as of March 31, 2017 ¥57 ¥ 3 ¥― ¥ 60
FY2016.3 (April 1, 2015-March 31, 2016) (Millions of yen)
Musical instruments Audio equipment Others Total
Amount amortized in FY2016.3 ¥5,651 ¥3,901 ¥― ¥9,553
Balance as of March 31, 2016 ¥ 113 ¥2,342 ¥― ¥2,456
Information on profit arising from negative goodwill by reporting segment
Not applicable
Per Share Information
(Yen) FY2017.3
(April 1, 2016–March 31, 2017) FY2016.3
(April 1, 2015–March 31, 2016)
Net assets per share ¥1,948.01 Net assets per share ¥1,601.55 Net income per share ¥ 249.17 Net income per share ¥ 168.90
Notes: 1. There are no latent shares and no figures for earnings per share after adjustment for latent shares have been disclosed.
2. Basis for calculations of net income per share FY2017.3
(April 1, 2016–March 31, 2017) FY2016.3
(April 1, 2015–March 31, 2016) Net income per share:
Net income attributable to owners of parent ¥46,719 million ¥32,633 million Value not attributed to common stock — million — million Net income attributed to common stock 46,719 million 32,633 million Average number of outstanding shares during the period 187,500,903 shares 193,210,820 shares
Important Subsequent Events
Not applicable