CONSOLIDATED ANNUAL REPORT 2017 · 2018-03-29 · Panariagroup is a leading manufacturer of...
110
CONSOLIDATED ANNUAL REPORT 2017 DRAFT
Transcript of CONSOLIDATED ANNUAL REPORT 2017 · 2018-03-29 · Panariagroup is a leading manufacturer of...

CONSOLIDATED ANNUAL REPORT 2017
DRAFT

CONSOLIDATED FINANCIAL STATEMENTS 31 DECEMBER 2017 DIRECTORS' REPORT
Panariagroup Industrie Ceramiche Spa

___________________________________
1
Panariagroup is an Italian multinational leader in innovation and beauty. OUR MISSION We specialise in the manufacturing and sale of ceramic tiles to promote beauty and innovation. • Our team generates sustainable value for shareholders, employees and business partners, in compliance with the company’s corporate environment. • Our focus is on research and innovation to serve the beauty and quality of our products. • Our goal is to meet our private and professional clients’ high expectations of wellness and aesthetics, in both buildings and architecture. OUR VALUES TECHNOLOGICAL LEADERSHIP We constantly invest in research, technologies and state‐of‐the‐art facilities to meet every architectural and interior design need with innovative solutions, capable of becoming the industry benchmark. AESTHETIC QUALITY AND EXCELLENCE We tenaciously pursue industrial excellence, from quality raw materials to process efficiency, to obtain products that combine absolute aesthetic value with the highest level of technical performance. RESPONSIBILITY We always place people and quality of life at the centre of our attention, with safe, environmentally‐sustainable products and by operating with the utmost respect for those who work with us. RELIABILITY The guarantee of a Group which, from its family roots in the ceramic district of Sassuolo to its listing on the Milan Stock Exchange, has grown to become a solid international company, which operates throughout the world whilst maintaining an Italian core. Panariagroup is a leading manufacturer of ceramics tiles for floors and walls. It has over 1,600 employees, 10,000 customers, 6 manufacturing plants (3 in Italy, 2 in Portugal and 1 in the United States) and a presence, through its broad and extensive sales network, in over 120 countries worldwide. Specialising in the production of porcelain tiles and laminate, the Group is positioned in the premium and luxury market through its nine brand names: Panaria, Lea, Cotto d’Este, Blustyle, Fiordo, Florida Tile, Margres, Love Tiles and Bellissimo, which are capable of satisfying a diversified customer base that is attentive to the technical and aesthetic quality of its products.

___________________________________
2
STRUCTURE OF THE GROUP The structure of the Group as at 31 December 2017 is as follows:
The Parent Company is Panariagroup Industrie Ceramiche S.p.A., based in Finale Emilia, Modena (Italy), with share capital of Euro 22,677,645.50. Panariagroup produces and sells ceramic tiles for floor and wall coverings under five distinctive brand names: Panaria, Lea, Cotto d’Este, Fiordo and Blustyle. All brands are focused on the high‐end and deluxe market segment and mainly sell porcelain stoneware product lines, both in Italy and abroad. Gres Panaria Portugal S.A, based in Chousa Nova, Ilhavo (Portugal), share capital of Euro 16,500,000, subscribed and paid in, wholly owned by Panariagroup Industrie Ceramiche S.p.A. Gres Panaria Portugal produces ceramic tiles for floors and walls under two separate brand names, Margres and Love Tiles, both aimed at the main European markets. Panariagroup USA Inc. based in Delaware, USA, share capital of USD 65,500,000, wholly owned by Panariagroup Industrie Ceramiche S.p.A. It owns 100% interests both in Florida Tile Inc. and Lea North America LLC. This company markets Panaria branded products on the North American market. Florida Tile Inc., based in Delaware, USA, share capital of USD 34,000,000, wholly owned by Panariagroup USA Inc., produces and sells ceramic tiles in the USA through its own distribution network located mainly on the east coast.

___________________________________
3
Lea North America LLC., based in Delaware, USA, share capital of USD 20,000, wholly owned by Panariagroup USA Inc. This company markets Lea branded products on the North American market. Montanari Ceramiche srl, based in Finale Emilia, Modena (Italy), share capital of Euro 48,000, wholly owned by Panariagroup Industrie Ceramiche S.p.A. This company runs a retail outlet for ceramic tiles. Furthermore, the Group participates in a Joint Venture Company (JVC) based in the Indian state of Gujarat. This company is 50% held by Panariagroup and 50% by AGL India Ltd, a leading manufacturer in the Indian market.

___________________________________
4
DIRECTORS AND OFFICERS Board of Directors
Name Office
Emilio Mussini Chairman of the Board and Managing Director
Paolo Mussini Deputy Chairman and Managing Director
Andrea Mussini Deputy Chairman
Giuliano Pini Managing Director
Giuliano Mussini Director
Silvia Mussini Director
Daniele Prodi Director
Francesca Bazoli Independent Director
Sonia Bonfiglioli Independent Director
Tiziana Ferrari Independent Director
Board of Statutory Auditors
Name Office
Sergio Marchese Chairman of the Board of Statutory Auditors
Piergiovanni Ascari Standing Auditor
Francesca Muserra Standing Auditor
Independent Auditors EY S.p.A.

___________________________________
5
RESULTS AND SIGNIFICANT EVENTS IN 2017 Dear Shareholders,
The international economic cycle strengthened in 2017.
The recovery of investments in most economies fostered trade exchanges, underpinning growth in both
advanced and emerging countries.
This recovery was favoured by a series of factors; the confidence levels of businesses remained high thanks to
positive expectations concerning production and orders, as well as to the increased use of production capacity
and loan terms, which should remain favourable over the medium term.
Amongst the main advanced economies, recovery in Europe strengthened, while US growth continued at a
moderate pace and will be affected by the launch of measures, announced and already implemented by the
US Government.
Prospects for emerging countries are becoming even more dynamic thanks to the strengthening of raw
material exporting countries (especially Brazil and Russia) and the continuing growth in India and Chine (albeit
the development rhythm of the Chinese economy is still featuring a downward trend).
As regards the construction sector, a recovery in investments in the building segment has been reported,
backed‐up by favourable loan terms and stronger revenue dynamics connected with the increase in
employment.
Moreover, the downward adjustments in the property markets, especially in some countries of the Eurozone,
are likely to stop: in the Italian market the sector shows the first revitalisation symptoms, above all in the most
important towns.
Segment framework: the performance of Italian competitors
The Italian ceramics industry consolidated its structure in a framework of strong investments in new
technologies, driven by tax incentive measures within the “Industria 4.0” package, with the aim of
consolidating its position of global leader, in a positive, albeit increasingly competitive context.
In 2017, world GDP growth, combined with the growth in international trade, are comforting elements for an
industry, like the ceramics one, which is oriented to international markets.
In 2017, the Italian ceramics industry consolidated the upward trend which commenced in 2015, with a growth
in sales on foreign markets of around 2.5% and 1.5% on the domestic market.
In the European Union member countries, the general growth approached 4%.
The recovery in the Russian area, already reported at end 2016, is worth noting.
Asia countries reported fluctuating trends, with a good growth in the Far East markets (China, Hong Kong and
Japan) and a contraction in the Middle East markets.
In the US market, Italian competitors reported an overall reduction in turnover of around 5%. In Africa too,
Italian exports reported a fall (‐11%), while in Oceania sales reported 3% growth.

___________________________________
6
Group Results Results for 2017 can be summarised as follows:
Net revenues for sales amounted to Euro 384.6 million (Euro 377.0 in 2016, with a growth of 2.0%).
Gross operating profit amounted to Euro 42.7 million (Euro 40.8 million in 2016, with an increase of 4.7%).
Net operating profit amounted to Euro 18.9 million (Euro 19.1 million in 2016, with a decrease of 0.8%).
Net profit amounted to Euro 11.4 million (Euro 11.2 million in 2016, with an increase of 1.3%). The year 2017 ended with a positive result. After a particularly dynamic first half of the year, the second half reported a progressive slowdown of activities and a weakening of the US dollar. Nevertheless, Gross Operating Profit and the Net Profit reported a growth, in absolute value, compared to the previous year. For the second consecutive year, turnover was the highest in the history of Panariagroup. In particular, the European Business Units achieved excellent results (Italian BU +6.0%, Portuguese BU +9.6%), while a drop in sales was reported in the US Business Unit. As regards margins, improvements achieved by European Business Units were partially absorbed by the decline in the results of the US Business Unit. Even all the main financial statement indexes remained balanced, the ratio between Net Financial Position and EBITDA, stood at 2.3 and the ratio between Net Working Capital and Revenues from Sales, stood at 34.0%. Results of operations The increase in sales, achieved in 2017 and equal to 2%, is substantially in line with the average figure reported within the Italian competitors. During the year, an interrelationship between the Group’s trend and the competitors’ one is to be highlighted with a good growth in the first part of the year and a progressive slowdown in the second half of the year. The Italian Business Unit reported an overall growth of 6%, with differentiated performances on various markets. The very good performance of the Italian market is to be noted, with 9% growth, clearly superior to competitors (+1.5%), thanks to the new collections that were particularly appreciated. The European markets showed a more limited growth (around 2%), with a consolidation in the results in the main EU markets and a good development in the Eastern Europe countries. On the whole, Asian markets reported a slight reduction, mainly due to the results obtained in Middle East, which were affected by geopolitical tensions, while Far Eastern markets reported a good growth trend. Lastly, the excellent results obtained in Oceania, with 18% growth, are worth noting. The Portuguese Business Unit increased its turnover by over 9%. It fully confirmed its excellent results on the domestic market, showing a growth of 17% and further consolidating its leading position.

___________________________________
7
The European markets as well, core business of Gres Panaria Portugal, achieved an important growth, higher than 13%. On the other hand, the African area suffered from a significant drop. This area is characterised by a very volatile trend due to the execution of large orders, a lower economic and political stability compared to Western markets and oscillating liquidity availabilities of the economies connected with the production of energy sources. After seven years of progressive growth, with an annual average of more than 13%, the best result of the overall US market, the US Business Unit reported a slight reduction in 2017. In the sales channels oriented to Independent distributors and Home Centres the Company has mostly suffered from a stronger competitive pressure due to both the higher production capacity installed on the US territory by some important competitors and the growth of some foreign exporters (Spain, Turkey), more competitive price‐wise. The network of our shops, which ensure a more direct presence on the territory, was less affected by this phenomenon. In light of these results, the Group is already focusing on new collections with technical, aesthetic and competitive features able to tackle the changing competition context, in a market with still good growth prospects. Significant events in the period In 2017 as well, the Group continued its development, upgrading and efficiency improvement plan for industrial plants. The main investment concerned the Portuguese Business Unit, with the installation of a new complete line in the Aveiro plant. Thanks to its characteristics, the new plant not only increased its production capacity, but it is now particularly suited for the production of large‐format products in traditional stoneware for both flooring and covering. This new product completes and renders the product line of our Portuguese brands more competitive. The strengthening of the Portuguese site supports the strong growth of the local Business Unit, along with aiming to further enhance its strategic function of manufacturing pole for all Panariagroup Brands. In the Italian Business Unit, in the Fiorano Modenese production facility, to complete the huge investment made in the previous year, along with the installation of the third line of laminated stoneware, new product finishing lines were installed for cutting, grinding, polishing and backing. These new plants further widened the offer of this type of products in a still expanding market. A portion of investments made in the Italian plants has already the technical characteristics to comply with the “Industria 4.0” standards. In 2018, along with further investments, the interconnection implementation activities are expected, which are necessary to obtain tax benefits. The US Business Unit was also the object of investments. In particular, we highlight the establishment of a new research laboratory, in the Lawrenceburg site, dedicated to the development of new production lines. To this purpose, the Group is implementing a further strengthening of the Product Development function, which we deem is of key importance for our market segment, and for the structuring of a codified procedure, centrally defined and valid for the entire Group, which, through a careful market analysis and the understanding of new technological and aesthetic trends, aims at creating products that are increasingly able to meet the customers’ needs.

___________________________________
8
Always with respect to organisation, starting from the second half of 2017 the Group established a commercial Division focused on large projects, made up by a team of promoters and a team of sellers, capable of direct interfacing with architects and designers, to support them in the search for technical and aesthetic solutions that use ceramics not only for traditional flooring and covering, but also in high‐tech uses such as ventilated covering of façades, floating floorings, furniture tops, etc. A structure, made up by technicians, researchers and engineers, operates together with this Division in the aim of backing design activities. We deem that a dedicated structure would be in a better position to seize all opportunities of this particular market segment, which usually does not use traditional retail channels, but requires direct dialogue with large customers. The complete product line developed by our Group, allows us to offer a great number of solutions for both interior design and furniture and outdoor architecture. During 2017, Panariagroup presented its first Sustainability Report, prepared in compliance with the highest international reference standards for non‐financial reporting (GRI), which is the first result of a process of reflection and awareness of our role in terms of corporate social responsibility. Since its establishment, our Group stood out for its ethical way of conducting its business, respecting resources and people, maintaining its commitment to create long‐term value, with special attention to all stakeholders and resources used in manufacturing processes. We are firmly convinced that this approach to business represents a strategic lever for differentiation with respect to other players in the sector, not only for industrial and product aspects, but also for our way of “doing things”. The drivers behind consumer decisions are increasingly oriented towards products and companies that operate with a sustainable approach. All this is correct and consistent with the mature approach to consumption in the modern world, and to which we adhere willingly.

___________________________________
9
ANALYSIS OF GROUP PERFORMANCE
Reclassified Income statement as at 31 December 2017 compared with 31 December 2016 (in thousands of Euro)
31‐Dec‐2017 % 31‐Dec‐2016 %
Revenues from sales and services 384,580 92.70% 377,045 96.32%
Change in inventories of finished products 18,202 4.39% 1,016 0.26%
Other revenues 12,075 2.91% 13,379 3.42%
Value of Production 414,857 100.00% 391,440 100.00%
Raw, ancillary and consumable materials (114,861) ‐27.69% (109,484) ‐27.97%
Services, leases and rentals (158,973) ‐38.32% (145,859) ‐37.26%
Personnel costs (94,501) ‐22.78% (91,999) ‐23.50%
Changes in inventories of raw materials (3,783) ‐0.91% (3,270) ‐0.84%
Cost of production (372,118) ‐89.70% (350,612) ‐89.57%
Gross operating profit 42,739 10.30% 40,828 10.43%
D&A expenses (22,089) ‐5.32% (19,360) ‐4.95%
Provisions and other impairments (1,732) ‐0.42% (2,402) ‐0.61%
Net operating profit 18,918 4.56% 19,066 4.87%
Financial income and expense (3,699) ‐0.89% (2,543) ‐0.65%
Pre‐tax profit 15,219 3.67% 16,523 4.22%
Income taxes (3,863) ‐0.93% (5,308) ‐1.36%
Net profit (loss) for the period 11,356 2.74% 11,215 2.86%

___________________________________
10
Consolidated revenues After three years of highly significant growth, the Group was able to further strengthen its market presence, increasing the turnover by Euro 7.5 million (+2.0%). Revenues during the year were strongly affected by the US Dollar/Euro volatility, which particularly affected the second half of 2017, in which the average exchange rate was 1.177 against an average exchange rate of 1.099 of the second half of 2016 (+7.1%). To this purpose, it should be noted that the performance of exchange rates resulted in a gain of Euro 2.2 million in the first half of the year, while a loss of Euro 4.9 million was reported in the second half, due to a negative effect of Euro 2.7 million compared to the previous year. The graph below shows the remarkable increase in turnover over the 2013‐2017 period, with a growth of Euro 111.6 million (only for internal lines), equal to +41%, thus achieving a further historical record in sales for the Group.

___________________________________
11
Principal markets In Europe, the Group achieved excellent results, with growth of over 7%. We are highly satisfied of the results obtained on the German market, the most important for the sector in our continent, where we are reaping the benefits of a stronger monitoring policy for the various distribution channels. The performances are still brilliant in Portugal, which since 2013 has recorded a CAGR of 19.7%, with Gres Panaria Portugal as market leader. The results obtained in Eastern Europe are also worth noting, which increased by more than 20%, driven primarily by the more than positive performance recorded in Russia. Italy BU exports to European markets recorded an overall growth of 4%, as highlighted by the latest report of Confindustria Ceramica. The impact of the European markets on total revenues was 35%. Turnover on the US market fell by 5.5% in Euro. This performance was partly due to the US Dollar weakening against the Euro (‐2%) and to a reduction in actual business volumes (‐3.5%). The favourable performance of the market over the last few years further increased competitive pressure, both pressure by local players, which strengthened their production and distribution networks, and pressure by foreign exporters, more aggressive in terms of price. We deem that our US Business Unit has all the credentials to successfully fend off competition on the market. The impact of the US market on total revenues was 35%. The results on the Italian market were excellent, up by around 9%. This figure is clearly superior to the general sector performance in Italy, which rose by 1.5% overall. Given the fact that, in the last few years, the Italian market was characterised by little dynamism, competitors witnessed a progressive reduction of commercial investments in this area. This fostered our consolidated and widespread presence on the territory, while allowing us to acquire further market shares. While considering positive property domestic market forecasts, we are confident that this local presence would allow us to benefit from this opportunity. The impact of the Italian market on total revenues was 19%. On other markets (Asia, Canada, South America, Oceania and Africa) the turnover remained essentially in line with 2016. Good results, particularly in the Far East (Japan, Hong Kong and China), were obtained in areas less conditioned by geopolitical factors, whilst tensions in the Middle East affected our Group and the ceramics industry in general. Likewise, sales on the African markets felt the repercussions of an unfavourable context for both our Group and the Italian competitors. The performance in Oceania, on the other hand, was excellent, proving to be higher than the trend for the sector, and allowing the Group to achieve a 9% weighting on imports from Italy. The impact of the other markets on total revenues was 11%. Turnover of the Group’s foreign markets accounted for 81% of total revenues. Non‐European markets accounted for 46% of overall turnover.

___________________________________
12
The Group confirmed, also in 2017, a balanced geographical distribution, with an important presence in areas featuring high‐end product consumption (Europe and Asia) and a continuous development in countries that are characterised by building yards which require the use of high‐tech products, typical of our productions. Performance of the Group's Divisions The Italian Business Unit reported excellent results and it is the BU which generated, in absolute value, the highest growth in turnover compared to 2016. These results confirm that initiatives implemented over the last few years, through structural reorganisation, are achieving excellent results. The increase in sales concerned both the Italian market and the foreign markets. The Cotto d’Este / Blustyle, Panariagroup Trade Divisions and the Private Label Division stood out particularly thanks to their positive contribution to the growth in business volumes. Once again, the Portuguese Business Unit confirmed a steady growth trend, which has characterised the BU for various years now. Besides confirming its leadership on the Portuguese market, its expansion on the main European markets continues, especially France, Germany and Austria. The Business model of the Portuguese company is proving successful thanks to the acknowledged product quality, price competitiveness, wide product range and an efficient organisation and management structure. To support the development and as a confirmation of the strategic role played by the Portuguese production pole for the Group, the installation of a new complete production line in the Aveiro facility was completed during the year. This new line will allow for a further widening of the product range, a further improvement in productivity and an increase in production capacity. The US Business Unit reported a fall in turnover in Euro, partly justified by a significant weakening of the US Dollar with respect to the European currency. Well aware of the fact that the US market is changing and is subject to a strong competition, the Group is implementing measures aimed at further increasing competitiveness regarding both the product range and its positioning, as well as the strengthening of distribution channels.

___________________________________
13
Thanks to the significant investments made over the last two years, resulting in an increase in production capacity, the strengthening of the logistic pole and the distribution network, we are in the best conditions to foster our development strategies. Operating results Gross operating profit came to Euro 42.7 million, representing 10.3% of the value of production (Euro 40.8 million as at 31 December 2016), with 4.7% growth. The positive change in the Gross Operating Profit (Euro +1.9 million) was determined by a growth in profitability reported in the Italian and Portuguese Business Units, partially offset by the contraction in margins occurred in the US Business Unit. The European Business Units benefited from both the increase in revenues, due to higher quantities sold, and higher volumes in production, which resulted in reduced production costs, especially in the Italian Business Unit. With respect to the fast drop in revenues recorded in the United States, a prompt reduction in fixed and semi‐variable costs was not possible, with a consequent compression of margins. In 2018 budget, in fact, albeit confirming growth targets, operating costs optimisation was taken into account to recover profit margins. After some years of significant growth in the Gross Operating Profit, 2017 witnessed a further consolidation, confirming the Group profit margins.
Net operating profit amounted to Euro 18.9 million (Euro 19.1 million as at 31 December 2016), substantially unchanged compared to the previous year.

___________________________________
14
In 2017, amortisation/depreciation increased by Euro 2.7 million, due to the significant investments made over the last three years. The impact of amortisation/depreciation on the value of production is in line with standard levels for the sector. The impact of financial expenses on the value of production remained at reduced levels, albeit growing with respect to last year. If, on the one hand, the cost of loans remained very low, due to the level of interest rates and the careful management of treasury, on the other hand the Group was affected by the negative impact of the Euro/US Dollar exchange rate trend. The Net Result was a profit of Euro 11.4 million (Euro 11.2 million as at 31 December 2016).
The performance of the net result confirms the good margin levels achieved last year, after a remarkable positive progression that, starting form a significant loss recorded in 2013, led to the confirmation of a good profit for the third consecutive year.

___________________________________
15
ANALYSIS OF THE GROUP’S BALANCE SHEET (in thousands of Euro)
As required by CONSOB Communication DEM/6064293 of 28 July 2006, here attached is a table with the reconciliation between the reclassified equity‐financial position, shown in the balance sheet above, and the related financial statements.
CONSOLIDATED FINANCIAL STATEMENT ‐ BALANCE SHEET
31‐Dec‐2017 31‐Dec‐2016
Inventories 151,480 140,173
Receivables from customers 79,142 79,903
Other current assets 12,044 13,657
CURRENT ASSETS 242,666 233,733
Payables due to suppliers (83,198) (83,647)
Other current liabilities (28,980) (28,097)
CURRENT LIABILITIES (112,178) (111,744)
NET WORKING CAPITAL 130,488 121,989
Goodwill 8,139 8,139
Intangible assets 14,239 13,967
Tangible assets 126,005 119,595
Equity Investments and other financial assets 300 82
FIXED ASSETS 148,683 141,783
Receivables due after following year 537 777
Liabilities for employee benefits (5,531) (5,913)
Provision for risk and charge (4,569) (4,725)
Deferred tax assets 4,633 5,405
Other payables due after the year (3,531) (3,386)
ASSET AND LIABILITIES DUE AFTER THE YEAR (8,461) (7,842)
NET CAPITAL EMPLOYED 270,710 255,930
Short term financial assets (7,156) (16,995)
Short term financial debt 24,662 36,505
NET SHORT TERM FINANCIAL DEBT 17,506 19,510
Mid‐Long term financial debt 81,895 64,202
NET FINANCIAL POSITION 99,401 83,712
Group Shareholder's Equity 171,309 172,218
SHAREHOLDERS' EQUITY 171,309 172,218
TOTAL SOURCES OF FOUNDS 270,710 255,930

___________________________________
16
Net working capital The net working capital increased by 7% compared to the previous year, from Euro 122.0 to Euro 130.6 million. This increase was determined primarily by the growth of stocks. The decrease in sales, occurred in the second half of 2017, resulted in an increase in stocks, albeit a slowdown in production was implemented in the last period of the year. During 2018, we deem we will gradually absorb this effect, while returning in line with our targets, taking account of the fact that the increase in stocks refers to products featuring fast stock rotation levels. With reference to trade receivables, a substantial stability in values, with a slight improvement in “average collection times”, was reported. As regards collectability, a positive situation, with no critical issues, was reported thanks to both the improvement of the general economic context and the rigorous selection of customers. Regardless of the increase in the net working capital, a good NWC / Revenues ratio is confirmed.

___________________________________
17
Non‐current assets Non‐current assets have increased by Euro 6.9 million since the beginning of the year, due to the following:
- investments for the period, of approximately Euro 34.4 million, of which Euro 13.1 million invested in Italy, Euro 13.8 million in Portugal and Euro 7.5 million in the United States.
‐ depreciation and amortisation for the period of Euro 22.1 million. - the lower value of fixed assets of the US sub‐consolidation expressed in Euro, because of the
depreciation of the Dollar since the end of 2016, totalling Euro 5.6 million. ‐ increase in financial fixed assets, amounting to Euro 0.2 million
The Group continued its initiatives aimed at technological upgrading and improvement in production efficiency. The main investments in the Italian production facilities concerned the new dryer, the purchase of the latest digital equipment, the construction of new cutting and grinding lines and the changes in the logistics of flows of materials within the Fiorano Modenese facility. A portion of implementations carried out in 2017 features the “interconnectivity” requirements set forth by the “Industria 4.0” program, which grants important tax incentives connected to a greater deductibility of amortisation/depreciation. To this purpose, the Group confirms its willingness in carrying on the modernisation of plants in 2018, with the completion and effective interconnection of machinery. It is worth specifying that an important initiative in terms of energy efficiency was carried out in the Finale Emilia plant with the installation of LED lighting replacing neon fluorescent lights. As previously reported, the main investment in Portuguese production facilities was the new production line in the Aveiro plant. In the same facility, the number of digital printers for tile decoration was increased. In the Ilhavo plant, internal processing lines (grinding and polishing) were remarkably increased. Moreover, also the logistic infrastructure of Aveiro was strengthened, through the purchase of adjacent land, in order to allow for the management of greater volumes and improve efficiency in the handling of goods and vehicles. In the first months of the year, the US plant witnessed the enlargement of the Logistic Distribution Centre that reached full operating regime in 2017. This investment represents the completion of the huge strengthening program for logistics and production started in 2016. In terms of the industrial business area, the glaze preparation department was enlarged and is now fully able to backup the greater production capacity resulting from the installation of the third furnace and the creation of a new R&D structure, larger and more modern, able to meet the increased needs of the Lawrenceburg production facility. An important commercial investment concerned the transfer and extension of some important branches, aimed at further developing their commercial activities. Lastly, it is worth noting the restructuring works in the Lexington offices, aimed at doubling the area made available for the Florida Tile headquarters and the construction of a large showroom. Given the changed sizes of the Company, adjustments were needed to the headquarters were the Company has operated since 2010. The Group, also in 2017, continued to invest in projects for the reduction of energy consumption to safeguard environment and safety at workplace.

___________________________________
18
We deem that the remarkable efforts implemented over the last three years endowed the Group with a structure which is now able to support, in terms of volumes, the growth estimated for the next few years. Investments made in 2018 will be therefore addressed above all to the achievement of greater efficiency and technological innovation. We therefore foresee, for next year, a decrease in investments compared to the recent past. Net financial position
Net financial position showed a growth in the Group’s indebtedness, mainly due to the already described increase in net working capital and the relevant level of investments made over the year. We therefore deem that current capital ratios, associated with the NFP, in any event are a positive indicator. As it can be inferred from the graph, the EBITDA/NFP ratio has remained well below threshold 3 for the third consecutive year.
Financial cash flow
(thousands euro)
31‐Dec‐2017 31‐Dec‐2016
Net financial position (debt) ‐ beginning (83,712) (82,991)
Net Result for the period 11,356 11,215
D & A 22,089 19,360
Net Variation Provisions 164 6,869
Non monetary changes 118 379
Internal operating Cash flow 33,727 37,823
Change in net working capital and other assets and liabilities (10,925) (1,213)
Distribution of dividends (3,145) 0
Net Investments (34,570) (36,746)
Changes in Equity (1,145) (522)
Exchange rate diff. from US$ financial statement conversions 369 (63)
Net financial position (debt) ‐ final (99,401) (83,712)

___________________________________
19
One of the main objectives for next year will be a lower absorption of operating cash‐flow, with a lower employment of financial resources in the net working capital and a restriction of investments at lower levels than the average reported in the last three years.

___________________________________
20
SEGMENT REPORTING The application of IFRS 8 – Operating segments became compulsory on 1 January 2009. This standard requires the identification of the operating segments with reference to the system of internal reporting used by senior management to allocate resources and to assess performance. In terms of their economic and financial characteristics, the products distributed by the Group are not significantly different from each other in terms of product nature, nature of the production process, distribution channels, geographical distribution or types of customer. Accordingly, considering the requirements specified in paragraph 12 of the standard, the breakdown called for is unnecessary since the information would not be useful to readers of the financial statements. The disclosures required by paragraphs 32‐33 of IFRS 8 are shown below. In particular: ‐ The breakdown of revenues by principal geographical area is presented in the earlier section on "Revenues", ‐ The breakdown of total assets by geographical location is shown below:
CONSOLIDATED FINANCIAL STATEMENT
Breakdown of assets by geographical area (amounts in thousand Euro) ‐ IFRS classification
ASSETS Italy Europe USA Other 31‐Dec‐2017
NON‐CURRENT ASSETS 57,055 55,320 67,926 284 180,585
Goodwill 350 7,789 0 0 8,139
Intangible assets 5,757 1,179 7,303 0 14,239
Property, plant and equipment 44,029 45,083 36,893 0 126,005
Equity Investments 6 10 0 284 300
Deferred tax assets 6,588 1,259 4,620 0 12,467
Other non‐current assets 325 0 212 0 537
Non‐current Financial Assets 0 0 18,898 0 18,898
CURRENT ASSETS 122,249 45,706 72,052 10,944 250,951
Inventories 80,480 22,770 48,230 0 151,480
Trade Receivables 32,109 18,633 17,456 10,944 79,142
Due from tax authorities 3,338 1,013 2,602 0 6,953
Other current assets 3,806 399 886 0 5,091
Current Financial Assets 0 0 1,129 0 1,129
Cash and cash equivalents 2,516 2,891 1,749 0 7,156
TOTAL ASSETS 179,304 101,026 139,978 11,228 431,536
Italy Europe USA Other TOT
Net investments 2017 13,023 13,770 7,586 0 34,379

___________________________________
21
RESEARCH AND DEVELOPMENT ACTIVITIES Research and development activities, a distinguishing feature of our Group in this sector, continued as before during 2017. Research and development activities include applied research in our laboratories and the adoption of advanced production technologies. These two activities, added to the constant technological upgrading of facilities aimed at seeking solutions in production processes to enable cost savings, have allowed us to develop product lines with a high technical content and aesthetic innovations that guarantee us supremacy in the high/deluxe end of the ceramic tile market. The new product lines created in 2017, and in particular those presented at the now regular event of CERSAIE 2017 were much appreciated. We trust that the successful outcome of these innovations will benefit sales as well as the Group's overall results.
TRANSACTIONS WITH PARENT COMPANIES, AFFILIATES AND RELATED PARTIES Related‐party transactions are explained in the explanatory notes to the 2017 financial statements. Furthermore, in compliance with CONSOB Communication DEM/6064293 of 28 July 2006, it is reported that the related party transactions described in the explanatory notes almost all relate to the lease of industrial premises used by the Parent Company for the conduct of its business.

___________________________________
22
RECONCILIATION OF THE PARENT COMPANY'S EQUITY AND NET PROFIT WITH THE CORRESPONDING CONSOLIDATED AMOUNTS As required by CONSOB Communication DEM/6064293 of 28 July 2006, the following table reconciles the Parent Company's equity and net results with the corresponding consolidated amounts reported as at 31 December 2017 (in thousands of Euro):
Equity
Net
Income
(Loss)
Equity
Net
Income
(Loss)
As per Panariagroup Industrie Ceramiche SpA's
financial statements (Partent Company)147,393 4,825 145,621 3,339
Difference between the book value of equity
investments and their value using the equity method24,757 6,710 27,263 10,041
Elimination of unrealised gains arising on the
intercompany transfer of inventories(1,422) (190) (1,232) (42)
Storno (utili) perdite su cambi su finanziamento
intercompany0 1,481 0 (147)
Aligment to Group depreciation's rates 66 (21) 87 (22)
Recognition of deffered tax assets and (liabilities)
reflecting the tax effect (where applicable) of
consolidation adjustments
611 169 442 26
Elimination of unrealised gains arising from dividend
disribution0 (1,485) 0 (1,980)
Others (95) (132) 37 0
Net effect of consolidation adjustments 23,916 6,531 26,597 7,876
As per consolidated financial statements 171,309 11,356 172,218 11,215
31‐Dec‐201631‐Dec‐2017

___________________________________
23
TREASURY SHARES AND/OR ULTIMATE PARENT COMPANY SHARES In execution of the resolution passed at the Shareholders' Meeting of Panariagroup Industrie Ceramiche S.p.A. on 28 April 2016, the Company has renewed a stock buy‐back programme which stood as follows as at 31 December 2016:
The number of treasury shares in portfolio is the same as at 31 December 2016, as no purchases or sales were made during 2017. Panariagroup Industrie Ceramiche S.p.A., the Parent Company, does not own any shares or quotas in the ultimate parent companies, nor did it own or trade in such shares or quotas during 2016; there are therefore no disclosures to be made in accordance with article 2428 ‐ paragraph 2, points 3 and 4 of the Italian Civil Code.
ATYPICAL AND/OR UNUSUAL TRANSACTIONS As required by CONSOB Communication DEM/6064293 of 28 July 2006, it is reported that during 2017 there were no atypical and/or unusual transactions, as defined in the explanatory notes.
BUSINESS OUTLOOK The results for 2017 are to be deemed as positive, with a further strengthening in turnover and confirmed margins with respect to the previous year. For 2018, an overall favourable performance is expected, starting moderately and improving in the second half of the year. In making this forecast, the Euro/USD exchange rate is to be considered, which is affecting the beginning of 2018 (average of around 1.23) and heavily penalising the Group’s consolidated revenues compared to that recorded in the first quarter of 2017 (1.06). Another important external factor is the economic and tax policy implemented by the new US Government. On the one hand, the uncertain economic policy is not fostering, to date, the performance of the US economy, albeit the initiatives are intended to support local manufacturers and, therefore, also to the benefit of our US Business Unit. On the other hand, the recent tax reform, which set forth a significant reduction in the federal tax rate, not only represents an incentive for economy with effects over the medium term, but will undoubtedly be an important and direct advantage for the economic and financial results of our US companies. Within this changed context, special attention will be paid to the US Business Unit, also considering the fact that, after several years of growth, the year 2017 reported a slowdown in turnover. We are still convinced that the USA Division is an essential strong point for the Group and we therefore deem that, with adequate initiatives, we will be able to recover growth during 2018. As regards the Italian Business Unit, we expect to continue our growth in sales and profit margins. We are confident in a stronger growth in the Italian market and further improvement of productivity in production facilities.
Treasury shares
No. of shares Average book value Amount
432,234 3.7347 1,614,284.94

___________________________________
24
We deem that the Portuguese Business Unit will be able to confirm the excellent results achieved as regards sales and profit. Despite the significant increase, which is expected in energy costs, we foresee that the BU will benefit from the starting of the new production line and a further increase in revenues. An important development lever that we have implemented at Group level, is represented by the “Contract & Key Account” structure, dedicated to the large works channel which, in our opinion, has good chances to increase our market share if our quality and expertise are better used, both in terms of products and people. This is a channel where competition is restricted to the most structured operators, owing product technologies and types that are not available to everybody due to the important investments required for their development. After several years during which the Group was involved in extraordinary activities aimed at strengthening its business structure and optimising its organisational structure, in 2018 we have the opportunity to further focus our efforts even more on developing sales and profit margins. The Group is to date one of the leading companies in the global ceramics sector, in terms of internationalisation, technology, ability to interpret market trends and business management. We confirm our medium/long‐term strategies aimed at maintaining the Group’s current position amongst the leading market players. In this sense, therefore, backed strongly by the values and excellence for which the Italian ceramics industry has always been renowned, our ability to invest in new technologies, product innovation and new markets will be of key importance. Ceramics is increasingly becoming a “universal” material, with ever‐growing demand in a wider range of uses compared to traditional uses. Its quality, technical and aesthetic qualities and its competitive cost, render this material interesting for applications that, in the past, were covered mainly by other types of products: “outdoor” flooring, kitchen tops and, in more general terms, as a replacement to marble, natural stone and wood, as well as many other uses. These trends that are very clearly emerging and from which benefits are expected over the next few years, further drive us to pursue in our growth strategies. As for last year, also for 2017 the Panariagroup Board of Directors will propose the payment of a dividend to shareholders, to confirm the business ability to generate profits, not only used for self‐financing, but also in view of an adequate remuneration to shareholders.
REPORT ON CORPORATE GOVERNANCE AND THE OWNERSHIP STRUCTURE In compliance with the disclosure requirements of Borsa Italiana Spa and Consob, Panariagroup Industrie Ceramiche S.p.A. has prepared the “Report on Corporate Governance and the Ownership Structure”‚ which can be consulted on its website www.panariagroup.com in the section entitled Company Documents (as required by art. 123‐bis of Law Decree 58 of 24 February 1998).
CONSOLIDATED NON‐FINANCIAL REPORT Pursuant to provisions set forth by article 5, paragraph 3, letter b, of Legislative Decree 254/2016, the Company prepared a separate consolidated non‐financial report. The consolidated non‐financial report for 2017, drawn

___________________________________
25
up according to the “GRI Standards” reporting criteria (or according to “GRI G4 Sustainability Reporting Guidelines”) is available on the Group’s website.
RISK MANAGEMENT In compliance with all reporting requirements for listed companies, the Law 262/2005 has amended the Issuers Regulation by introducing a requirement for the Directors of such companies to identify, assess and manage risks relating to the Company's activities. The main types of risk that have been identified are as follows: GENERAL ECONOMIC RISK The macro‐economic context is an element of potential risk for the Group, with particular reference to the specific business sector, significantly influenced by the economic situation. The construction sector in general is strongly related to the investment propensity of families and industries and is therefore influenced by the uncertainties arising from the current economic situation. CREDIT AND LIQUIDITY RISK The Group's exposure to credit and liquidity risk is analysed in the explanatory notes accompanying these financial statements, which include the information required by IFRS 7. RISK OF DEPENDENCE ON KEY PERSONNEL The Group's performance depends, among other things, on the competence and skills of its managers, as well as the ability to ensure continuity in the running of operations. Since several of the principal managers of Panariagroup are shareholders in Panariagroup Industrie Ceramiche S.p.A. ‐ through Finpanaria S.p.A., which holds approximately 70% of the share capital ‐ it is reasonable to assume that the possibility of the Group's principal managers leaving the company is remote. Should this happen, however, it could have a negative impact on the activities and results of Panariagroup. MARKET RISK Competition risk: The main producers of ceramic materials for floor and wall coverings worldwide, besides Italian firms, are: (i) producers in emerging markets, who are particularly competitive price‐wise and target the lower end of the market; (ii) European producers, some of whom are able to compete at the higher end of the market, with average prices that are lower than those of Italian companies, due to lower production costs. Our Group believes that its positioning in the high‐end luxury market segment, which is difficult for low‐cost producers to enter, the renown of its trademarks, the wide range of product lines offered and the particular care and attention given to design, all represent competitive advantages over the products offered by such competitors. Increased competition could negatively impact the Group's economic and financial results in the medium to long term. Raw material price risk: The raw materials used in the production of ceramics for floor and wall coverings such as gas, electricity and clay accounted for more than 25.0% of the value of production in both 2016 and 2017. Therefore, their increase, which is not currently expected, could have a negative impact on the financial results of the Group in the short term. BREXIT RISK The result of the Brexit referendum could have impact also on ceramic consumption on the UK market and on the flow of ceramic material import.

___________________________________
26
We highlight that Panariagroup made sales in 2017 for Euro 5.9 million (equal to about 1.5% of the total Sales), then eventual changes, even significant, on our sales in this area should not have relevant economic and financial impact for the Group.
ENVIRONMENTAL PROTECTION, PERSONNEL COSTS AND REGULATIONS RELATING TO THE SECTOR The production and sale of ceramic materials for floor and wall coverings is not currently subject to specific sector regulations. On the other hand, environmental protection regulations are especially relevant given the use made of certain chemical compounds, particularly with regard to the treatment of such materials, emissions control and waste disposal. The Group keenly monitors environmental and personnel risks, and any situations arising in connection with operations are treated in compliance with the regulations. With regards to its personnel, Panariagroup protects the health and safety of its employees in compliance with current regulations governing health and safety in the workplace. The average workforce in 2017 was equal to 1,705 individuals, an increase of 49 employees compared with the average number in 2016.
ADHESION TO THE SIMPLIFICATION REGIME AS PER ARTICLES 70 AND 71 OF THE ISSUERS REGULATION
Panariagroup Industrie Ceramiche S.p.A., adhered to the opt‐out regime envisaged by the Consob Issuers regulation, availing itself of the faculty to be exempt from obligations to publish disclosure documents as set out on the occasion of significant mergers, demergers, acquisitions and sales, as well as capital increases through assets in kind. Pursuant to provisions set forth in the regulation above, the Company provided for the supply of adequate disclosures.

___________________________________
27
CONSOB RESOLUTION NO. 11971 OF 14 MAY 1999 In compliance with the provisions of this resolution, the following table reports the interests held in Panariagroup and its subsidiaries by directors, statutory auditors, general managers, key management personnel and their spouses, unless legally separated, and minor children, directly or through companies under their control, trust companies or third parties, as reported in the shareholders' register, notices received and other information obtained from such directors, statutory auditors, general managers and key management personnel:
SIGNIFICANT EVENTS OCCURRED AFTER YEAR END No significant events are to be reported.
Name and Last NameInvestment held in
Number of shares held
at the end of the prior
year
Number of shares
purchased in 2017
Number of shares
sold in 2017
Number of shares
held at 31‐Dec‐2017
Type of
holding
Type of
ownership
393,039 19,000 113,650 298,389 Direct Property
4,400 4,400 Spouse Property
Mussini Andrea Panariagroup 611,413 84,394 527,019 Direct Property
97,802 97,802 Direct Property
7,880 5,000 500 12,380 Spouse Property
129,436 129,436 Direct Property
13,080 13,080 Spouse Property
Mussini Paolo Panariagroup 1,000 1,000 Direct Property
Mussini Silvia Panariagroup 21,900 21,900 Direct Property
Prodi Daniele Panariagroup 29,500 29,500 Direct Property
Bonfiglioli Sonia Panariagroup ‐ ‐
Ferrari Tiziana Panariagroup ‐ ‐
Bazoli Francesca Panariagroup ‐ ‐
Marchese Sergio Panariagroup ‐ ‐
Ascari Pier
Giovanni Panariagroup ‐ ‐
Muserra
FrancescaPanariagroup
‐ ‐
Total 1,309,450 24,000 198,544 1,134,906
Mussini Emilio Panariagroup
‐ ART. 79 ‐
TABLE 2 ‐ INVESTMENTS HELD BY DIRECTORS, STATUTORY AUDITORS AND GENERAL MANAGERS AT 31‐December‐2017
Mussini Giuliano Panariagroup
Pini Giuliano Panariagroup

___________________________________
28
Warnings The consolidated financial statements for the year ended 31 December 2017 have been prepared in accordance with the International Financial Reporting Standards (IFRS) issued by the International Accounting Standards Board (IASB) and officially approved by the European Union, as well as with the instructions issued in implementation of article 9 of Legislative Decree 38/2005. The term IFRS is understood as including all of the international accounting standards (IAS), suitably revised, and all of the interpretations by the International Financial Reporting Interpretations Committee (IFRIC), previously named the Standing Interpretations Committee (SIC). After the European Regulation no. 1606 took effect in July 2002 and beginning with the financial statements of the first half of 2005, the Group adopted the IFRS standards issued by the International Accounting Standards Board officially approved by the European Union. The accounting policies and financial statement formats used in preparing these financial statements do not differ from those applied in the financial statements for the year ended 31 December 2015, with the exception of those international accounting standards which entered into effect as at 1 January 2016 and which are illustrated in the section of the financial statements named "Accounting standards, amendments and interpretations applicable as at 1 January 2016"; refer to this section for more information. The application of these standards did not produce any significant effects. As regards the provisions on the conditions applied to the listing of parent companies, incorporated companies or companies regulated under the laws of countries outside of the European Union and which have a significant impact on the consolidated financial statements, it should be noted that: ‐ As at 31 December 2017, three of the companies controlled by Panariagroup come under these
regulations: Panariagroup USA Inc., Florida Tile Inc. and Lea North America LLC. ‐ Adequate procedures have been adopted to ensure thorough compliance with the new rules (art. 36
of Market Regulations issued by Consob).
Performance measures Explanatory notes and directors’ report, include some performance indicators in order to present a better evaluation of financial and economic performance of the Group. As regards those indicators, on December 3, 2015, CONSOB issued Communication no. 92543/15, which gives force to the Guidelines issued on October 5, 2015, by the European Securities and Markets Authority (ESMA) concerning the presentation of alternative performance measures in regulated information disclosed or prospectuses published as from July 3, 2016. These Guidelines, which update the previous CESR Recommendation (CESR/05‐178b), are intended to promote the usefulness and transparency of alternative performance indicators included in regulated information or prospectuses within the scope of application of Directive 2003/71/EC in order to improve their comparability, reliability and comprehensibility. Accordingly, in line with the regulations cited above, the criteria used to construct these indicators are as follows: ‐ Gross Operating Profit: this is made up of the pre‐tax result before financial income and expenses,
depreciation and amortisation, provisions and impairment charges on assets made during the period and provisions;
‐ Net Operating Profit: this is made up of the pre‐tax result before financial income and expenses; - Pre‐tax profit (loss): this is made up of the result for the period before income taxes. ‐ Net Working capital: this is made up of the inventory, account receivable, other current assets, net of
account payables and other current liabilities. ‐ Net Financial Position: this is made up of cash and financial credit, net of bank short and medium‐long
terms financial debts and leasing.

___________________________________
29
ATTACHMENTS
Reconciliation between the reclassified balance sheet and the IFRS‐format balance sheet as at 31 December 2017
Reconciliation between the reclassified balance sheet and the IFRS‐format balance sheet as at 31 December 2016
Reconciliation between the summary of cash flows and the IFRS‐format cash flow statement The Chairman Emilio Mussini Sassuolo, 16 March 2018

___________________________________
30
ASSETS 31‐Dec‐2017 RIF 31‐Dec‐2017 RIF
NON‐CURRENT ASSETS 180,585 Inventories 151,480 AC1
Goodwill 8,139 ANC1 Receivables from customers 79,142 AC2
Intangible assets 14,239 ANC2 Other current assets 12,044 AC3+AC4+AC5‐(*)
Property, plant and equipment 126,005 ANC3 CURRENT ASSETS 242,666
Equity Investments 300 ANC4
Deferred tax assets 12,467 ANC5 Payables due to suppliers (83,198) PC1
Other non‐current assets 537 ANC6 Other current liabilities (28,980) PC2+PC3
Non‐current Financial Assets 18,898 ANC7 CURRENT LIABILITIES (112,178)
CURRENT ASSETS 250,951 NET WORKING CAPITAL 130,488
Inventories 151,480 AC1
Receivables from customers 79,142 AC2 Goodwill 8,139 ANC1
Due from tax authorities 6,953 AC3 Intangible assets 14,239 ANC2
Other current assets 5,091 AC4 Property, plant and equipment 126,005 ANC3
Current Financial Assets 1,129 AC5 Equity Investments 300 ANC4+ANC7 ‐ (**)
Cash and cash equivalents 7,156 AC6 FIXED ASSETS 148,683
TOTAL ASSETS 431,536
Receivables due beyond 12 months 537 ANC6
Liabilities for employee benefits (5,531) PNC1
LIABILITIES AND EQUITY 31‐Dec‐2017 Provision for risk and charge (4,569) PNC3
Provision for deferred taxes 4,633 ANC5+PNC2
EQUITY 171,309 PN Other liabilities due beyond 12 months (3,531) PNC4
Share capital 22,678 ASSET AND LIABILITIES DUE BEYOND 12 MONTHS (8,461)
Reserves 137,275
Net profit (loss) for the year 11,356 NET CAPITAL EMPLOYED 270,710
NON‐CURRENT LIABILITIES 122,258
Liabilities for employee benefits 5,531 PNC1 Short term financial assets (7,156) AC6
Deferred tax liabilities 7,834 PNC2 Short term financial indebtedness 24,662 PC4+PC5 ‐ (*)
Provisions for risks and charges 4,569 PNC3
Other non‐current liabilities 3,531 PNC4 NET SHORT TERM FINACIAL INDEBTEDNESS 17,506
Due to banks 78,988 PNC5
Due to other sources of finance 21,805 PNC6 Mid‐Long term financial debt 81,895 PNC5+PNC6 ‐ (**)
CURRENT LIABILITIES 137,969 NET MID‐LONG TERM FINACIAL INDEBTEDNESS 81,895
Payables due to suppliers 83,198 PC1
Due to tax authorities 3,609 PC2 NET FINANCIAL POSITION 99,401
Other current liabilities 25,371 PC3
Due to banks 23,651 PC4 Group Shareholders' Equity 171,309 PN
Due to other sources of finance 2,140 PC5
SHAREHOLDERS' EQUITY 171,309
TOTAL LIABILITIES AND EQUITY 431,536
TOTAL SOURCES OF FOUNDS 270,710
(*) CURRENT PORTION OF IRB 1,129
Classified under current assets in the IFRS satatement of financial position
Included in the short‐term financial indebtedness in the reclassified statement of financial position
(**) NON ‐ CURRENT PORTION OF IRB 18,898
Classified under financial assets in the IFRS statement of financial position
Included in the long‐term financial indebtedness in the reclassified statement of financial position
Reconciliation IFRS Statement of Financial Position/Reclassified Statement of Financial Position
Figures at 31 December 2017
STATEMENT OF FINANCIAL POSITION ‐ IFRS RECLASSIFIED STATEMENT OF FINANCIAL POSITION

___________________________________
31
ATTIVO 31‐Dec‐2016 RIF 31‐Dec‐2016 RIF
NON‐CURRENT ASSETS 179,739 Inventories 140,173 AC1
Goodwill 8,139 ANC1 Receivables from customers 79,903 AC2
Intangible assets 13,967 ANC2 Other current assets 13,657 AC3+AC4+AC5‐(*)
Property, plant and equipment 119,595 ANC3 CURRENT ASSETS 233,733
Equity Investments 82 ANC4
Deferred tax assets 14,394 ANC5 Payables due to suppliers (83,647) PC1
Other non‐current assets 777 ANC6 Other current liabilities (28,097) PC2+PC3
Non‐current Financial Assets 22,785 ANC7 CURRENT LIABILITIES (111,744)
CURRENT ASSETS 252,013 NET WORKING CAPITAL 121,989
Inventories 140,173 AC1
Receivables from customers 79,903 AC2 Goodwill 8,139 ANC1
Due from tax authorities 8,020 AC3 Intangible assets 13,967 ANC2
Other current assets 5,637 AC4 Property, plant and equipment 119,595 ANC3
Current Financial Assets 1,285 AC5 Equity Investments 82 ANC4+ANC7 ‐ (**)
Cash and cash equivalents 16,995 AC6 FIXED ASSETS 141,783
TOTAL ASSETS 431,752
Receivables due beyond 12 months 777 ANC6
Liabilities for employee benefits (5,913) PNC1
LIABILITIES AND EQUITY 31‐Dec‐2016 Provision for risk and charge (4,725) PNC3
Provision for deferred taxes 5,405 ANC5+PNC2
EQUITY 172,218 PN Other liabilities due beyond 12 months (3,386) PNC4
Share capital 22,678 ASSET AND LIABILITIES DUE BEYOND 12 MONTHS (7,842)
Reserves 138,325
Net profit (loss) for the year 11,215 NET CAPITAL EMPLOYED 255,930
NON‐CURRENT LIABILITIES 110,000
Liabilities for employee benefits 5,913 PNC1 Short term financial assets (16,995) AC6
Deferred tax liabilities 8,989 PNC2 Short term financial indebtedness 36,505 PC4+PC5 ‐ (*)
Provisions for risks and charges 4,725 PNC3
Other non‐current liabilities 3,386 PNC4 NET SHORT TERM FINACIAL INDEBTEDNESS 19,510
Due to banks 60,694 PNC5
Due to other sources of finance 26,293 PNC6 Mid‐Long term financial debt 64,202 PNC5+PNC6 ‐ (**)
CURRENT LIABILITIES 149,534 NET MID‐LONG TERM FINACIAL INDEBTEDNESS 64,202
Payables due to suppliers 83,647 PC1
Due to tax authorities 3,320 PC2 NET FINANCIAL POSITION 83,712
Other current liabilities 24,777 PC3
Due to banks 35,808 PC4 Group Shareholders' Equity 172,218 PN
Due to other sources of finance 1,982 PC5
SHAREHOLDERS' EQUITY 172,218
TOTAL LIABILITIES AND EQUITY 431,752
TOTAL SOURCES OF FOUNDS 255,930
(*) CURRENT PORTION OF IRB 1,285
Classified under current assets in the IFRS satatement of financial position
Included in the short‐term financial indebtedness in the reclassified statement of financial position
(**) NON ‐ CURRENT PORTION OF IRB 22,785
Classified under financial assets in the IFRS statement of financial position
Included in the long‐term financial indebtedness in the reclassified statement of financial position
Reconciliation IFRS Statement of Financial Position/Reclassified Statement of Financial Position
Figures at 31 December 2016
STATEMENT OF FINANCIAL POSITION ‐ IFRS RECLASSIFIED STATEMENT OF FINANCIAL POSITION

___________________________________
32
RECONCILIATION BETWEEN THE SUMMARY OF CASH FLOWS AND THE IFRS‐FORMAT CASH FLOW STATEMENT Note: The summary of cash flows presented in the Directors' Report measures the change in total net financial indebtedness, while the IFRS‐format cash flow statement measures the change in Cash and cash equivalents.
PANARIAGROUP
CONSOLIDATED FINANCIAL STATEMENT
NET FINANCIAL POSITION
(THOUSANDS OF EURO)
31‐Dec‐2017
Cash (53)
Other Cash and cash equivalents (7,103)
Securities held for sale 0
Liquidity (7,156) (*)
Short‐term financial assets (1,129)
Due to banks 3,979
Current portion of long‐term loans 19,672
Other short‐term financial debt 2,140
Short‐term financial indebtedness 25,791
Net short‐term financial indebtness 17,506
Non‐current portion of long‐term loans 78,988
Due to bondholders 0
Other long‐term financial debt 21,805
Long‐term financial indebtedness 100,793
Long‐term financial assets (18,898)
Net financial indebtness 99,401 (**)
Liquidity (7,156) (*)
(Subject of the IFRS Cash Flow Statement)
Total NFP 99,401 (**)
(Subject of the financial cash flows as per Directors Report)

___________________________________
33
PANARIAGROUP
CONSOLIDATED FINANCIAL STATEMENT
CASH FLOW STATEMENT ‐ IFRS
(THOUSAND OF EURO)
(Thousands of Euro) 31‐Dec‐2017
A ‐ OPERATIONS Profit (loss) of the year 11,356 A Depreciation and amortisation 22,089 B Losses (gains) on assets disposal (169) C Deferred tax liabilities (assets) 924 D Non‐monetary change in provisions for employee severance indemnities 48 E Net change in provisions (808) F Tax effect on elimination of intercompany exchange rates 101 G Revaluation and writedown of equity investments 186 H
Cash flow (absorption) from operations prior to changes in working capital 33,727
(Increase)/(decrease) in trade receivables (1,027) (Increase)/(decrease) in inventories (16,798) (Increase)/(decrease) in trade payables 4,297 Employee severance indemnities disbursement (408) Net change in other assets/liabilities 3,010
Cash flow (absorption)from operations due to changes in working capital (10,925) I
Total (A) Cash flow from operations 22,801
B ‐ INVESTMENT ACTIVITY Net investment in tangible and intangible assets (34,379) J Net investment in financial assets (413) K Exchange differences on tangible and intangible assets 222 L
Total (B) Cash Flow (absorption) from investment activities (34,570)
C ‐ FINANCING ACTIVITY Distribution of dividends (3,145) M Non‐ monetary changes recorded in equity (1,145) N Net change on financial liabilities (net of New Loans/Loans repayments) (10,175) New Loans 45,628 Loan repayments (29,603)
Total (C) Cash Flow (absorption) from financing activities 1,560
Opening net cash 16,995 Change in the translation reserve 369 ONet change in short‐term net cash (A+B+C) (10,208)Closing net cash 7,156 (*)
Financial cash flow(thousands euro)
31‐Dec‐2017
Net financial position (debt) ‐ beginning (83,712)
Net Result for the period 11,356 A
D & A 22,089 B
Net Variation Provisions 164 D+E+F
Non monetary changes 118 C+G+H
Internal operating Cash flow 33,727
Change in net working capital and other assets and liabilities (10,925) I
Dividends (3,145) M
Net Investments (34,570) J+K+L
Changes in Equity (1,145) N
Exchange rate diff. from US$ financial statement conversions 369 O
Net financial position (debt) ‐ final (99,401) (**)

___________________________________
CONSOLIDATED FINANCIAL STATEMENTS
Panariagroup Industrie Ceramiche Spa

___________________________________
PANARIAGROUP
STATEMENT OF CONSOLIDATED FINANCIAL POSITION
(THOUSANDS OF EURO)
Notes ASSETS 31‐Dec‐2017 31‐Dec‐2016
NON‐CURRENT ASSETS 180,585 179,739
1.a Goodwill 8,139 8,139
1.b Intangible assets 14,239 13,967
1.c Property, plant and equipment 126,005 119,595
1.d Equity Investments 300 82
1.e Deferred tax assets 12,467 14,394
1.f Other non‐current assets 537 777
1.g Non‐current Financial Assets 18,898 22,785
CURRENT ASSETS 250,951 252,013
2.a Inventories 151,480 140,173
2.b Receivables from customers 79,142 79,903
2.c Due from tax authorities 6,953 8,020
2.d Other current assets 5,091 5,637
2.e Current Financial Assets 1,129 1,285
2.f Cash and cash equivalents 7,156 16,995
TOTAL ASSETS 431,536 431,752
LIABILITIES AND EQUITY 31‐Dec‐2017 31‐Dec‐2016
3 EQUITY 171,309 172,218
Share capital 22,678 22,678
Reserves 137,275 138,325
Net profit (loss) for the period 11,356 11,215
NON‐CURRENT LIABILITIES 122,258 110,000
4.a Liabilities for employee benefits 5,531 5,913
4.b Deferred tax liabilities 7,834 8,989
4.c Provisions for risks and charges 4,569 4,725
4.d Other non‐current liabilities 3,531 3,386
4.e Due to banks 78,988 60,694
4.f Other non‐current financial payables 21,805 26,293
CURRENT LIABILITIES 137,969 149,534
5.a Payables due to suppliers 83,198 83,647
5.b Due to tax authorities 3,609 3,320
5.c Other current liabilities 25,371 24,777
5.d Due to banks 23,651 35,808
5.e Other current financial payables 2,140 1,982
TOTAL LIABILITIES AND EQUITY 431,536 431,752

___________________________________
PANARIAGROUP
CONSOLIDATED INCOME STATEMENTS
(THOUSANDS OF EURO)
Notes
6.a REVENUES FROM SALES AND SERVICES 384,580 92.7% 377,045 96.3%
Change in inventories of finished products 18,202 4.4% 1,016 0.3%
6.b Other revenues 12,075 2.9% 13,379 3.4%
VALUE OF PRODUCTION 414,857 100.0% 391,440 100.0%
7.a Raw materials (114,861) ‐27.7% (109,484) ‐28.0%
7.b Services, leases and rentals (158,973) ‐38.3% (145,859) ‐37.3%
of whic, related party transactions (5,478) ‐1.3% (5,449) ‐1.4%
7.c Personell costs (94,501) ‐22.8% (91,999) ‐23.5%
7.d Other operating expenses (3,783) ‐0.9% (3,270) ‐0.8%
PRODUCTION COSTS (372,118) ‐89.7% (350,612) ‐89.6%
GROSS OPERATING PROFIT 42,739 10.3% 40,828 10.4%
8.a Amortisation and depreciation (22,089) ‐5.3% (19,360) ‐4.9%
8.b Provisions and writedowns (1,732) ‐0.4% (2,402) ‐0.6%
NET OPERATING PROFIT 18,918 4.6% 19,066 4.9%
9.a Financial income (expense) (3,699) ‐0.9% (2,543) ‐0.6%
PRE‐TAX PROFIT 15,219 3.7% 16,523 4.2%
10.a Income taxes (3,863) ‐0.9% (5,308) ‐1.4%
NET PROFIT FOR THE PERIOD 11,356 2.7% 11,215 2.9%
BASIC AND DILUTED EARNING PER SHARE 0.250 0.247
31‐Dec‐2017 31‐Dec‐2016

___________________________________
PANARIAGROUP
CONSOLIDATED STATEMENT OF COMPREHENSIVE INCOME
(THOUSANDS OF EURO)
31‐Dec‐2017 31‐Dec‐2016
NET PROFIT (LOSS) FOR THE PERIOD 11,356 11,215
Other components of comprehensive income that will be
reclassified later to after‐tax profit (9,140) 2,020
Exchange rate differences from foreign operations (7,730) 2,122
Profit (loss) on exchange on intercompany loans (IAS 21) (1,481) 147
Profit (loss) on Joint Venture ‐ accounted with Equity Method (14) 41
Profit (loss) on interest rate hedging transactions accounted in
accordance with the Cash Flow Hedge method 85 (290)
Other components of comprehensive income that will NOT be
reclassified later to after‐tax profit 20 (287)
Net Profit (loss) from revaluation of defined benefits and plans 20 (282)
Other 0 (5)
COMPREHENSIVE INCOME FOR THE PERIOD 2,236 12,948

___________________________________
For a better understanding of the exchange rate effect on the Net Financial Position, a cash flow presentation method has been used; in this format, the changes in the individual components of equity are “net” of the exchange rate effect which is incorporated in full in the item “change in the translation reserve”. This item represents the actual impact of the change in exchange rates on the Group’s Net Financial Position.
The cash flow statement, shown above, shows movements of cash and cash equivalents in compliance with IAS 7. For a better understanding of the overall financial evolution, the Directors’ Report includes a summarised cash flow statement, which highlights the movements of the Net Financial Position, as a whole.
PANARIAGROUP
CONSOLIDATED FINANCIAL STATEMENT
CASH FLOW STATEMENT ‐ IFRS
(THOUSANDS OF EURO)
(in thousands of Euro) 2017 2016
A ‐ OPERATIONS Net Results of the period 11,356 11,215 Ammortisation, depreciation and impairments 22,089 19,360 Losses (gains) on fixed assets disposals (169) 110 Deferred tax liabilities (assets) 924 5,197 Net change in the provision for serverance indemnities 48 498 Net change in provisions (808) 1,174 Tax effect on elimination of intercompany exchange rates 101 (47) Revaluation and writedowns of partecipation 186 316
Cash flow (absorption) from operations prior to changes in working capital 33,727 37,823
(Increase)/decrease in trade receivables (1,027) (1,339) (Increase)/decrease in inventories (16,798) (1,203) Increase/(decrease) in trade payables 4,297 5,860 Employee severance indemnity disbursement (408) (422) Net change in other assets/liabilities 3,010 (4,109)
Cash flow (absorption)from operations due to changes in working capital (10,925) (1,213)
Total (A) Cash flow from operations 22,801 36,610
B ‐ INVESTMENT ACTIVITY Net investment in tangible assets (31,864) (28,579) Net investment in intangible assets (2,515) (8,571) Net investment in financials assets (413) (208) Sales of tangible fixed assets 222 611
Total (B) Cash Flow /absorption) from investment activities (34,570) (36,746)
C ‐ FINANCING ACTIVITY Distribution of dividends (3,145) ‐ Non‐ monetary changes recorded in equity (1,145) (522) Net change on financial liabilities (net of New Loans/Loans repayments) (10,175) (76) New Loans 45,628 39,530 Loan repayments (29,603) (29,238)
Total (C) Cash Flow (absorption) from financing activities 1,560 9,694
Cash and cash equivalents at beginning of the period 16,995 7,500 Change in the translation reserve 369 (63)Net change in Cash and cash equivalents (A + B + C) (10,208) 9,558 Cash and cash equivalents at end of period 7,156 16,995
Supplementary information:
Interest paid 617 977
Income taxes paid 2,988 2,201
December 31,

___________________________________
PANARIAGROUP
Statement of changes in consolidated equity from 1 January 2016 to 31 December 2017
(THOUSANDS OF EURO)
Share CapitalShare premium
reserve
Revaluation
reserveLegal reserve Other reserves
Translation
reserve
Reserve for
exchange rate
adjustment
Retained
earnings
Net profit (loss)
attributable to the
Group
Total equity
Balance as of 01.01.2016 22,678 60,784 4,493 3,958 47,822 8,143 1,132 4,381 5,865 159,256
Net result for the period 11,215 11,215
Other comprehensive profit (loss) (536) 2,122 147 1,733
Total gains (losses) booked directly to equity (536) 2,122 147 11,215 12,948
Other 14 14
Allocation of net profit for year 2015 (1,103) 6,968 (5,865)
Balance as of 31 December 2016 22,678 60,784 4,493 3,958 46,197 10,265 1,279 11,349 11,215 172,218
Balance as of 01.01.2017 22,678 60,784 4,493 3,958 46,197 10,265 1,279 11,349 11,215 172,218
Net result for the period 11,356 11,356
Other comprehensive profit (loss) 91 (7,730) (1,481) (9,120)
Total gains (losses) booked directly to equity 91 (7,730) (1,481) 11,356 2,236
Other
Allocation of net profit for year 2016 167 3,172 7,876 (11,215)
Dividends (3,145) (3,145)
Balance as of 31 December 2017 22,678 60,784 4,493 4,125 46,315 2,535 (202) 19,225 11,356 171,309

___________________________________
EXPLANATORY NOTES
Panariagroup Industrie Ceramiche Spa

___________________________________
INTRODUCTION
Panariagroup Industrie Ceramiche S.p.A. (hereinafter also the "Company") is a joint‐stock company incorporated in Italy and registered in the Companies Register of Modena. It has fully paid‐in share capital of Euro 22,677,645.50 and its registered offices are in Via Panaria Bassa 22/A, Finale Emilia (Modena), Italy. It is listed on the STAR segment of the Italian Stock Exchange. The companies that make up the Panaria Group (the “Group”) produce and sell ceramic tiles for floors and wall coverings. The consolidated financial statements for the year ended 31 December 2017 have been prepared in accordance with the International Financial Reporting Standards (IFRS) issued by the International Accounting Standards Board (IASB) and approved by the European Union, as well as with the provisions issued in implementation of article 9 of Legislative Decree no. 38/2005. The term IFRS is understood as including all of the international accounting standards (IAS), suitably revised, and all of the interpretations by the International Financial Reporting Interpretations Committee (IFRIC), previously named the Standing Interpretations Committee (SIC). The accounting policies and reporting formats used for preparing these consolidated financial statements do not differ from those applied since adopting IFRS, with the exception of the newly introduced standards and the amendments indicated below in these explanatory notes. The currency used to draw up the consolidated financial statements for the period 1 January – 31 December 2017 (hereinafter also: “the consolidated financial statements”) is the Euro. The Group's foreign operations are included in the consolidated financial statements using the principles indicated in the section below entitled “Accounting Principles”. In order to clearly disclose figures in the financial statements, pursuant to provisions set out by “IAS 1 ‐ Presentation of Financial Statements”, paragraph 55 (“An entity shall present additional line items (...), headings and subtotals when such presentation is relevant to an understanding of the entity’s financial position”), the balance sheet underwent some changes with respect to the previous year, namely: ‐ in the “Non‐current assets” section, the line previously named “Financial assets” was broken down into items “Equity investments” and “Non‐current financial assets” ‐ in the “Current assets” section, the line previously named “Other current assets” was broken down into items “Other current assets” and “Current financial assets”; ‐ in the “Current liabilities” and “Non‐current liabilities” sections, the line previously named “Due to banks and other sources of finance” was broken down into items “Due to banks” and “Other financial payables”; We deem that the new format would permit a prompter detection of financial assets and liabilities that, together with items “Cash and cash equivalents” and “Due to banks”, make up the Net Financial Position. Lastly, the disclosure order of items was changed from a declining liquidity format, as elected during the IFRS transition phase, to an increasing liquidity format. The consolidated financial statements include:
the consolidated balance sheet as at 31 December 2017 compared with the consolidated balance sheet as at 31 December 2016. In particular, the balance sheet has been drawn up in an increasing

___________________________________
liquidity format, with current and non‐current assets and liabilities shown separate, based on a 12‐month operating cycle.
In addition, as required by CONSOB resolution 15519 of 27 July 2006, the effects of any significant related party transactions are shown separately in the balance sheet.
the consolidated income statement for 2017, compared with that for 2016.
Note that, as decided at the time of the transition to IFRS, the income statement shows the following intermediate results, even if they are not accepted by IFRS as a valid accounting measurement, because the Group’s management is of the opinion that they provide important information for an understanding of the results for the period:
o Gross Operating Margin: this is made up of the pre‐tax result before financial income and expenses, depreciation and amortisation, provisions and impairment charges on assets made during the period and provisions;
o Net Operating Margin: this is made up of the pre‐tax result before financial income and expenses;
o Pre‐tax Profit (loss): this is made up of the result for the period before income taxes.
As required by CONSOB resolution 15519 of 27 July 2006, the effects of any significant related party transactions are shown separately in the income statement. CONSOB resolution 15519 of 27 July 2006 also requires separate disclosure in the income statement, under costs or revenues, of any significant components of income and/or expense deriving from non‐recurring events or transactions or arising from transactions or events that are not repeated frequently in the normal course of business.
the statement of consolidated comprehensive income for 2017 with comparative figures for the year 2016, presented in accordance with the requirements of IAS 1 revised.
the consolidated cash flow statement for 2017 and 2016. The indirect method has been used in drawing up the cash flow statement, which means that the profit or loss for the period has been adjusted for the effects of transactions of a non‐monetary nature, for any deferral or provision for previous or future years' operating receipts or payments, and for any elements of revenue or cost related to the cash flows deriving from investment or financial activity and from changes in working capital.
the statement of changes in consolidated equity from 1 January 2016 to 31 December 2017.
the explanatory notes (with related attachments). Consolidated and separate financial statements have been approved by the Board of Directors on 16 March 2018.

___________________________________
1) GENERAL INFORMATION ON THE GROUP
The companies that make up the Panaria Group produce and sell ceramic tiles for floors and wall coverings. The Group's products are sold in more than 60 countries under eight distinctive brand names: Panaria, Lea, Cotto d’Este, Fiordo, Blustyle, Margres, Love Tiles and Florida Tile. The Parent Company is Panariagroup Industrie Ceramiche S.p.A. It has fully paid‐in share capital of Euro 22,677,645.50 and its registered offices are in Via Panaria Bassa 22/A, Finale Emilia (Modena), Italy. It is listed on the STAR segment of the Italian Stock Exchange. The other companies included in the scope of consolidation are:
- Gres Panaria Portugal S.A., with head office in Ilhavo, Portugal, share capital Euro 16,500,000 fully paid‐in, 100% controlled by Panariagroup Industrie Ceramiche S.p.A.
- Panariagroup USA Inc., with head office in Delaware, USA and share capital of USD 65,500,000 fully paid‐in, 100% controlled by Panariagroup Industrie Ceramiche S.p.A.
- Lea North America LLC., with head office in Delaware, USA, and share capital of USD 20,000 fully paid‐in, 100% controlled by Panariagroup USA Inc.
- Florida Tile Inc., with head office in Delaware, USA and share capital of USD 34,000,000 fully paid‐in, 100% controlled by Panariagroup USA Inc.
- Montanari Ceramiche S.r.l. with head office in Finale Emilia, Italy and share capital of Euro 48,000 paid‐in, 100% controlled by Panariagroup Industrie Ceramiche S.p.A.
These companies are thus all 100% controlled, directly or indirectly, by Panariagroup Industrie Ceramiche S.p.A. The Group also participates (50%) in a Joint Venture Company (JVC), in the company AGL Panaria, based in Ahmedabad in the Indian state of Gujara, together with AGL India, one of the leading manufacturers in the Indian market. The scope of consolidation did not change with respect to 31 December 2016.

___________________________________
2) ACCOUNTING PRINCIPLES
Consolidation methods The consolidated financial statements for the year ended 31 December 2017 include the financial statements of Panariagroup Industrie Ceramiche S.p.A. and of those companies over which it exercises direct or indirect control, as defined in paragraphs 12 to 17 of IAS 27. This standard states that control over another enterprise exists when the company has the power to determine its financial and operating policies so that the company can obtain benefits from the other's activity. Subsidiaries are consolidated from the date on which the Group takes over control and are excluded from the scope of consolidation from the date on which such control ceases to exist. Subsidiaries consolidated are 100% controlled directly or indirectly and therefore are not present factual control situations or exercised significant judgments. Where necessary, adjustments are made to the subsidiaries' financial statements to bring them into line with Group accounting policies.
The carrying value of investments in consolidated companies held by the Parent or by other Group companies is eliminated against the related portion of equity and their assets and liabilities are combined on a line‐by‐line basis.
According to the provisions of IFRS 3, as at the acquisition date the buyer must recognise, separately from goodwill, the identifiable assets and liabilities acquired and any non‐controlling interest in the acquired entity.
All significant intercompany transactions and balances between Group companies are eliminated on consolidation.
Joint venture companies These are entities over which the Group has contractually agreed sharing of control, or where there are contractual arrangements whereby two or more parties undertake an economic activity that is subject to joint control. Equity investments in joint venture companies are accounted for under the equity method. As at 31 December 2017, the Group held a joint venture company (JVC). In the financial statements for the year ended 31 December 2017, this equity investment was measured according to the equity method, using the interim financial statements as at 31 December 2017 of the Indian investee company as a reference. As a local practice, the financial statements of this company, in fact, do not coincide with the calendar year. For these equity investments, if joint control should be lost, the difference between (a) the fair value of any share retained and the consideration received for the sale and (b) the book value of the investment on the date control is lost, will be booked to the income statement. An evaluation will be performed each year to check if the facts and circumstances have changed as such to modify the equal partnership between the parties in the joint venture agreement.
___________________________________
Measurement criteria
General principles The financial statements have been prepared on a historical cost basis, except for certain financial instruments, which are measured at fair value, and on a going concern basis. In fact, the Group has determined that there are no uncertainties about business continuity. The accounting policies used to prepare the consolidated financial statements for the year ended 31 December 2017 do not differ from those used to draft the consolidated financial statements for the year ended 31 December 2016, with the exception of the accounting standards, amendments and interpretations applicable from 1 January 2017. IAS 7 Disclosure Initiative – Amendments to IAS 7 – Statement of Cash Flows According to amendments, an entity is required to disclose supplementary information on changes in financing‐related liabilities, including both cash flow changes and non‐cash changes (e.g. exchange gains and losses). Amendments to IAS 12 Income Taxes: Recognition of Deferred Tax Assets for Unrecognised Losses (not applicable due to EU non‐endorsement) The amendments clarify that an entity should consider whether tax law limits the income tax base on which deductions may be made in relation to the reverse of deductible temporary differences. The amendment also gives guidelines on how an entity should determine future taxable income and explains the cases in which the taxable income might include the recovery of some assets for a value that is higher than their carrying value. Lastly, description is made hereunder of the accounting standards, amendments and IFRS interpretations not yet applicable and that the Company is analysing. Evaluation is also being made on the impact that these standards would have on the Company’s financial statements. No early adoption is however expected. IFRS 9 – Financial Instruments In July 2014, the IASB issued the final version of IFRS 9 – Financial Instruments, which replaces IAS 39 – Financial Instruments: Recognition and Measurement and all prior versions of IFRS 9. IFRS 9 combines all three aspects related to the accounting project of financial instruments: classification and measurement, impairment and hedge accounting. IFRS 9 is effective for years starting on or after 1 January 2018; early adoption is permitted. Except for hedge accounting, the standard must be applied retrospectively, but it is not necessary to provide comparative disclosures. As regards hedge accounting, the standard is generally applied prospectively, with some restricted exemptions. In particular, for the financial assets the new standard uses a unique approach based on the methods of managing financial instruments and on the features of the contractual cash flows of the financial assets in order to determine their measurement criterion, replacing the different rules provided for by IAS 39. For the financial liabilities, on the other hand, the main amendment regards the accounting treatment of the changes in fair value of a financial liability designated as financial liability measured at fair value through the income statement if these changes are due to the change in the credit rating of the issuer of the same liability.

___________________________________
According to the new standard, these changes must be recognised in the “Other comprehensive income” statement, and no longer in the income statement. The Company is completing the evaluation aimed at determining whether and to what extent this standard would have any impact, especially by adapting the provision matrix currently applied. The Company deems that there will be no significant impact on its Balance Sheet and Equity. IFRS 15 ‐ Revenue from contracts with customers IFRS 15 was issued in May 2014 and amended in April 2016 and introduces a new five‐stage analysis model which will apply to revenue from contracts with customers. IFRS 15 provides for the recognition of revenue for an amount that reflects the consideration to which the entity believes to be entitled in exchange for the transfer of goods or services to the customer.
The new standard will supersede all current requirements on revenue recognition envisaged by IFRSs. This standard is effective for years starting on or after 1 January 2018, with full or amended retrospective application. Early application is permitted.
The Company expects to apply the new standard from the mandatory effective date, by using the amended application method. The preliminary evaluation of the effects of IFRS 15 started in 2016; in 2017, the Company continued and completed the evaluation with a more detailed analysis.
The Company produces and sells ceramic tiles for floor and wall coverings under five distinctive brand names: Panaria, Lea, Cotto d’Este, Fiordo and Blustyle. The Company is mainly focused on the high‐end and deluxe market segment and mainly sell porcelain gres product lines, both in Italy and abroad. The products are sold separately and mainly based of specific contracts with well identified customers (mainly B2B). (a) Sales of goods
With regard to contracts with customers in which the sale of ceramic items is the only obligation envisaged, the adoption of IFRS 15 is not expected to have any impact on revenues and on the Company’s income statement. The Company estimates that revenues would be recognised when the control of the asset is transferred to the customer, generally upon delivery of the goods based on the Incoterm terms and conditions used.
In the first time adoption of IFRS 15 phase, the Company is analysing the following:
(i) Variable consideration
Some contracts with customers envisage a right of return, year‐end allowances (rebates based on milestones of volumes and/or turnover) and discounts. The Company currently recognises at fair value revenues from the sales of goods and related to the consideration received or to be received, less adjustments for returns, discounts and rebates on volumes. If revenues cannot be measured in a reliable way, the Company will postpone their recognition until the amount is certain. This type of adjustments to revenues generates what IFRS 15 defines as variable consideration, which must be estimated upon execution of the contract, with subsequent updating.
According to IFRS 15, the initial estimate of the variable consideration must be restricted in order to avert any over‐recognition of revenues. The Company expects that, in light of the following comments, the application of a restriction would not entail a postponed recognition of a higher volume of revenues with respect to revenues recognised by applying the current IFRS standards. • Right of return
When a contract with a customer envisages a right of return of the goods within a specific period of time from delivery (less than one year), the Group recognises the right of return by using an approach based on probability‐weighted amounts, which in turn is estimated based on a historical analysis, similar to the expected value method envisaged by IFRS 15. The accounting criterion, which is currently in use, envisages the allocation of a Provision of non‐current risks and charges in the consolidated balance sheet and a

___________________________________
counter‐entry in the consolidated income statement under item Revenues from sales and services rendered “on a net basis” (i.e. for a value equal to the average margin of sales).
According to IFRS 15, the consideration received from the customer is variable to the extent that the contract permits the return of goods by the customer. The Group elected to use the expected value method to estimate goods that will be returned as this method allows for a better estimate of the variable consideration to which the Group is entitled. In defining the variable consideration, which can be included in the transaction price, the Group applied the restrictions set out by IFRS 15 as regards the variable consideration estimates.
Pursuant to IFRS 15, the Company will provide for some reclassifications in the balance sheet, which will not affect retained earnings as at 1 January 2018.
Year‐end allowances and discounts The Company grants its customers retrospective year‐end allowances on all products purchased by the customer when the quantity and/or the value of goods purchased during the year achieve the milestones envisaged in the contract. Pursuant to the accounting criterion currently in use, the Company determines the amount of estimated discounts by using an approach based on probability‐weighted allowance, in its turn based on a historical analysis on milestones achieved by specific customers. The amounts are then recognised under a special item in Current liabilities. These amounts are usually settled through the issue of credit notes.
Moreover, the Company grants discounts if the customer settles the invoice with a shorter payment term than the “ordinary” one, or the terms agreed upon in the contract. Cash discounts are prospectively accounted for during the year (according to the contract and the historic data on the customer’s payments), upon recognition of revenues from the sale of expected goods.
According to IFRS 15, retrospective year‐end allowances and discounts generate a variable consideration. In order to estimate the amount of variable consideration to which it will be entitled, the Group decided that, as regards contracts envisaging one milestone, the most probable amount method allows for the best estimate of the possible consideration. Conversely, as regards contracts envisaging more than one milestones (steps), the expected value method or the most probable amount method will be applied, whichever estimates at best the variable consideration envisaged in that specific type of contract.
The Company applied the variable consideration restrictions set out in IFRS 15 and concluded that no material impact due to these changes would occur at the transition date. Pursuant to IFRS 15, the Company will continue to disclose contract Liabilities related to future discounts and expected allowances under Current liabilities.
(ii) Payables to customers
The Group contractually grants payables to customers in favour of special customers, in the form of:
• co‐marketing fees: consideration to advertisement costs that the customer will borne during the year, often determined as percentage on the annual turnover;
• allowances by kind: free delivery of the square metres of tiles, whose value is determined based on a contractually predetermined percentage on the value of products purchased over the period.
The accounting criterion, which is currently used, is similar to the one described in relation to year‐end allowances and discounts, to which reference is made.
According to IFRS 15, if the consideration payable to a customer is not paid against a distinct good or service, it shall be recognised as reduction to the total transaction price (and therefore a reduction of item Revenues from sales and services in the consolidated income statement) when the Group recognises the revenue for the sale of the expected goods or, if earlier, when the Group pays or promises to pay the considerations to the customer. The Group applied the variable consideration restrictions set out in IFRS 15 and concluded that no material impact due to these changes would occur as at the transition date.
___________________________________
(b) Presentation and disclosure requirements
Provisions of IFRS 15 as regards presentation and disclosure requirements are more detailed with respect to those envisaged in the current standards. Presentation requirements are a significant change and increase the amount of disclosures required in the Company’s financial statements. A great number of disclosures required by IFRS 15 is entirely new and, in light of the preliminary evaluation of the impact of the new standard, the Group determined that these disclosure requirements will have a significant impact, mainly on the assumptions used to determine the transaction price for the contracts envisaging a variable consideration.
Moreover, as required by IFRS 15, the Company will provide for a disaggregation of revenues from contracts with customers in relation to segments showing how the type, amount, timing and uncertainty of revenue and cash flows are affected by economic factors. The effect of this requirement, compared to the segment disclosures required by IFRS 8 ‐ Operating Sectors, is not material as at the transition date.
In 2017, the Company continued to test systems, in‐house controls, politics and necessary procedures to collect and present the required disclosures.
(c) Other adjustments
The recognition and measurement requirement envisaged by IFRS 15 are applicable also to the recognition and measurement of each profit or loss on the sale of non financial assets (i.e. components of Plants and machinery and Intangible assets), when the sale is not carried out during the ordinary conduct of business. The Group, however, estimates that the impact of these changes would not be material for the Group as at the transition date. Amendments to IFRS 10 and IAS 28: Sale or Contributions of Assets between an Investor and its Associate or Joint Venture The amendments concern the conflict between IFRS 10 and IAS 28 with reference to the loss of control of an investee, which is sold or contributed to an associated company or a joint venture. The amendments clarify that the gain or loss resulting from the sale or the contribution of assets that constitute a business between an investor and its associate or joint venture, as defined in IFRS 3, shall be recognised in full. The gain or loss resulting from the sale or contribution of assets that do not constitute a business, is recognised only to the extent of unrelated investors’ interests in the associate or joint venture. The IASB deferred indefinitely the application date of these amendments. However, if an entity elects for an early application, it should be made prospectively. Group does not expect impacts. IFRS 2 Classification and Measurement of Share‐based Payment Transactions — Amendments to IFRS 2 The IASB issued the amendments to IFRS 2 Share‐based Payment that consider three main issues: effects of a vesting condition on the measurement of a cash‐settled share‐based payment transaction; the classification of a share‐based payment transaction settled net of tax withholdings; the accounting when a modification occurs of share‐based payment transactions from cash‐settled to equity‐settled. Upon adoption, the entities shall apply the amendments without restating the previous reporting periods; nevertheless, a retrospective application is allowed if it is applied for all three amendments and other criteria are fulfilled. Group does not expect impacts. IFRS 16 – Leasing
IFRS 16 was published in January 2016 and replaced IAS 17 “Leasing”, IFRIC 4 “Determining Whether an Arrangement Contains a Lease”, SIC‐15 “Operating leasing – Incentives” and SIC‐27 “Evaluating the Substance of Transactions in the Legal Form of a Lease”.

___________________________________
IFRS 16 defines the policies for the recognition, measurement, presentation and disclosure of leasing and requires lessees to recognise all leases on the financial statement on the basis of a single model similar to that used to account for finance leases in accordance with IAS 17. Short‐term leases (e.g. within 12 months), and those in which the underlying asset has a low value (e.g. personal computers), are excluded from the lessees’ recognition requirements. At the inception date of the lease, the lessee shall recognise a liability against lease payments (i.e. lease liabilities) and an asset representing the right of use of the underlying asset for the duration of the contract (i.e. the right of use of the asset). The lessees shall provide for a separate recognition of expenses and interest of lease liabilities and amortisation of the right of use of the assets. Lessees shall also remeasure lease liabilities upon occurrence of specific events. Lessees shall in general recognise the amount of the remeasuring of lease liabilities as an adjustment to the right of use of the asset. IFRS 16 is effective for years starting on or after 1 January 2019. An early application is permitted, but not before the entity has adopted the IFRS 15 standard. Lessees can elect to apply the standard by using either a fully retrospective approach or a modified retrospective approach. Transitory provisions envisaged by the standard permit some facilitations. Given the great number of lease contracts and the significance of changes made by the new standard, in 2018 the Company will continue to determine the effects resulting from its application. IFRS 17 Insurance Contracts In May 2017, the IASB issued IFRS 17 Insurance Contracts, which establishes the principles for the recognition, measurement, presentation and disclosure of insurance contracts. When effective, the IFRS 17 standard will supersede the IFRS 4 Insurance Contracts standard, issued in 2005. IFRS 17 applies to all types of insurance contracts (e.g.; life, non‐life, direct insurance, reinsurance), regardless of the type of issuer, as well as to some guarantees and financial instruments with a discretionary participation feature. Restricted exceptions are applicable to the scope of the standard. The general aim of IFRS 17 is to provide for an accounting model for insurance contracts that is more useful and consistent for insurers. In contrast with provisions set out by IFRS 4 that are largely based on the maintenance of previous accounting policies, IFRS 17 supplies a comprehensive model for insurance contracts that covers all relevant accounting issues. The core of IFRS 17 is the framework model, integrated by:
• A special adaptation for contracts with direct features (variable fee approach).
• A simplified approach (premium allocation approach), mainly for short‐term contracts.
The IFRS 17 standard will be in force for annual reporting periods beginning on or after 1 January 2021, and will require the disclosure of comparative balances. Early application is permitted; in this case, the entity must have also adopted IFRS 9 and IFRS 15 as at the date of IFRS 17 first time application, or earlier.
Transfers of Investment Property — Amendments to IAS 40 The amendments clarify when an entity should transfer an investment property, including real estate properties under construction or development that are disclosed or not disclosed under item Investment property. The amendment specifies that a change in use occurs when the building fulfils, or ceases to fulfil the definition of real estate property and there is evidence of a change in use. A simple change in the management intentions concerning the property is not an evidence of a change in use. Amendments should be applied by entities prospectively with respect to changes in use that occurred at the beginning of the financial year in which the entity applies the amendments for the first time, or at later date. An entity should re‐evaluate the classification of buildings owned at that date and, if applicable, it should reclassify them to reflect the conditions existing as at that date. In compliance with IAS 8, a retrospective application is permitted, if an entity can do so without using hindsight. This amendment is effective for years starting on or after 1 January 2018. Early application is permitted, of which disclosures must be provided. No impact is expected on the Company’s financial statements.

___________________________________
Amendments to IFRS 12 Disclosure of Interests in Other Entities: Clarification of the scope of disclosure requirements in IFRS 12 from Annual Improvements ‐ 2014‐2016 Cycle (not applicable due to EU non‐endorsement) The amendments clarify that disclosure requirements of IFRS 12 apply to an entity’s interests in a subsidiary, joint venture or associated company (or to a portion of equity investment in a joint venture or associated company), which is classified (or included in a discontinuing group classified) as available for sale.
Annual improvements to IFRSs ‐ 2014‐2016 Cycle On 8 December 2016, the IASB issued some minor amendments to the following standards, in relation to which no significant impact is expected by the Company. IFRS 1 First‐time Adoption of International Financial Reporting Standards ‐ Deletion of short‐term exemptions for first‐time adopters Short‐term exemptions, envisaged in paragraphs E3‐E7 of IFRS 1 were deleted as no longer within the scope of the standard. The amendment is effective from 1 January 2018. This amendment is not applicable to the Group. IAS 28 Investments in Associates and Joint Ventures ‐ Clarification that measuring investees at fair value through profit or loss is an investment‐by‐investment choice The amendments clarify the following:
• On initial recognition and with reference to the specific investment, an entity that is a venture capital organisation, or other qualified entity, might elect to measure its interests in associates and joint ventures at fair value through profit or loss.
• If an entity is not an investment entity, but has an investment in an associate or joint venture, which is an investment entity, when applying the equity method in measuring its equity investment (in the associate or joint venture), this entity might decide to maintain the measurement at fair value applied by the investment entity (either an associate or a joint venture). This choice is made separate for each associate or joint venture, which is an investment entity, at the following dates, whichever is later (in terms of occurrence): (a) initial recognition of the equity investment in the associate or joint venture, which is an investment entity; (b) when the associate or joint venture becomes an investment entity; and (c) when the associate or joint venture, which is an investment entity, becomes parent company for the first time.
The amendments should be applied retrospectively from 1 January 2018. Early application is permitted. If the entity elects for an early application of the above amendments, adequate disclosures should be provided.
Applying IFRS 9 Financial Instruments with IFRS 4 Insurance Contracts ‐ Amendments to IFRS 4
The amendments concern the problems arising from the adoption of IFRS 9, the new standard on financial instruments, before adopting IFRS 17 Insurance Contracts, which replaces IFRS 4. The amendments envisage two options for entities that are issuers of insurance contracts: a temporary exemption in applying IFRS 9 and the overlay approach. The temporary exemption is applied for the first time to annual reporting periods beginning on or after 1 January 2018. An entity might elect to adopt the overlay approach on first time adoption of IFRS 9 and to apply this approach retrospectively to financial assets designated upon transition to IFRS 9. The entity restates the comparative disclosures based on the overlay approach only, and only if the entity restates the comparative disclosures when applying IFRS 9.

___________________________________
IFRIC Interpretation 22 Foreign Currency Transactions and Advance Consideration The interpretation clarifies that, in defining the spot foreign exchange rates to be used on initial recognition of the related asset, expense or income (or a part thereof) upon deletion of a non‐monetary asset or non‐monetary liability related to advance considerations, the date of transaction is the date of initial recognition of the non‐monetary asset or non‐monetary liability related to advance considerations. In the event of payments or multiple advance payments, the entity shall define the date of transaction for each payment of consideration or advance consideration. Entities might apply these amendments on a fully retrospective basis. As an alternative, an entity might apply the interpretation prospectively to all assets, expenses and income that are within the scope of the standard and had an initial recognition at or after the following dates: at inception of the financial year related to the first time adoption of the interpretation; at inception of the prior financial year disclosed, for comparison purposes, in the financial statements in which the entity applied the interpretation for the first time. This interpretation is effective for years starting on or after 1 January 2018. An early application is permitted, of which disclosures shall be given.
IFRIC Interpretation 23 Uncertainty over Income Tax Treatment The interpretation defines income tax accounting when there is uncertainty over income tax treatment under IAS 12. It must not be applied to taxes that are not within the scope of IAS 12 standard and does not include any requirements related to interest or fines related to uncertain tax treatments. The interpretation specifically concerns the following issues:
• If an entity estimates uncertain tax treatments separately
• Assumptions of the entity on the assessment of tax treatments by tax authorities
• How an entity determines taxable profit (or tax loss), tax bases, unused tax losses, unused tax credits and tax rates.
• How an entity estimates changes in facts and circumstances. An entity shall determine whether each single uncertain tax treatment should be considered separate or together with other (one or more) uncertain tax treatments. The approach resulting to be the best solution for uncertainty should be adopted. This interpretation is effective for years starting on or after 1 January 2019. Some interim facilities are available. Except as indicated above, no significant changes are expected on the consolidated financial statements by the new standards described above. The main accounting policies applied are described below. Business combinations Acquisitions of subsidiaries are accounted for using the purchase method described in IFRS 3. The purchase cost is determined by the sum of the fair values, as of the transaction date, of the assets acquired, the liabilities incurred or taken over, and the financial instruments issued by the Group in exchange for control of the enterprise acquired, plus the costs directly attributable to the business combination. The identifiable assets, liabilities and contingent liabilities acquired that comply with the conditions for recognition contained in IFRS 3 are booked at their fair values at the acquisition date, accounting for the tax effect of the difference between their fair and book values.

___________________________________
Any positive difference between the purchase cost and the Group's portion of the fair value of such assets and liabilities is booked as goodwill, if this is justified, and capitalised as an intangible asset. If, after the redetermination of these fair values, the Group's portion of the fair values of the identifiable assets, liabilities and contingent liabilities exceeds the purchase cost, the excess is immediately written off to the income statement, as IFRS 3 does not allow the recognition of negative goodwill. Minority interests in the acquired enterprise are initially valued at an amount equal to their portion of the fair values of the identifiable assets, liabilities and contingent liabilities. Goodwill Goodwill deriving from the acquisition of a subsidiary or joint venture represents the excess purchase cost compared with the Group's portion of the fair value of the subsidiary or joint venture's assets, liabilities and contingent liabilities identifiable at the acquisition date. Goodwill is recognised as an asset if the excess cost paid can be justified as such. It is not amortised, but the value is reviewed annually to ensure that it has not suffered impairment. Impairment losses are booked immediately to the income statement and are not subsequently reinstated. If a subsidiary is sold, the amount of any goodwill attributable to it is to be taken into account when calculating the disposal gain or loss. Intangible assets Intangible assets consist of non‐monetary elements, without any physical substance, that are clearly identifiable and able to generate future economic benefits. Such elements are booked at purchase or production cost, including directly attributable expenses incurred to permit the asset to be used, net of accumulated amortisation and any impairment losses. Amortisation begins when the asset is available for use and is charged systematically over its estimated useful life. Bought‐in software licences are capitalised on the basis of the costs incurred for their purchase and to bring them into use. Amortisation is calculated on a straight‐line basis over their estimated useful life. In the absence of specific indications, for software the useful life is generally considered to be 5 years. For the SAP management software a useful life of at least 10 years has been considered. The costs associated with the development and maintenance of software programs are accounted for as a cost when incurred. The costs directly associated with the production of unique and identifiable software products that are under a consolidated company's control and which will generate future economic benefits over a time horizon of more than one year are accounted for as intangible assets. Internally generated intangible assets ‐ research and development costs Research costs are booked to the income statement in the period in which they are incurred. Internally generated intangible assets that derive from the Group's product development efforts are only capitalised if all of the following conditions are satisfied:
the asset is identifiable (e.g. software or new processes);
it is probable that the asset will generate future economic benefits;
the development costs of the asset can be reliably measured.

___________________________________
Such intangible assets are amortised on a straight‐line basis over the estimated useful lives of the related products. When internally generated assets cannot be capitalised, the development costs are written off to the period in which they are incurred. Trademarks and patents Patents and trademarks are initially booked at purchase cost and amortised on a straight‐line basis over their estimated useful life. In the absence of specific indications, for trademarks a useful life of at least 10 years is considered. Property, plant and equipment Property, plant and equipment are booked at historical cost, net of accumulated depreciation and any write‐downs due to impairment. Cost includes the best estimate, if significant, of the costs involved in dismantling and removing the asset and the costs involved in reclaiming the site where the asset was located, if these come under the provisions of IAS 37.
Any costs incurred after the purchase are only capitalised if they add to the future economic benefits inherent in the asset to which they refer. All other costs are booked to the income statement when incurred. In particular, ordinary or cyclical repairs and maintenance costs are booked directly to the income statement in the period in which they are incurred. Depreciation is charged on a straight‐line basis against the cost of the assets, net of their residual values, over their estimated useful life, applying the following rates (main categories):
Category Rate
Buildings and light buildings 4%‐10%
Plant and machinery 10%‐15%
Industrial equipment 25%
Electronic office machines 20%‐25%
Furniture and showroom furnishings 10%‐20%
Vehicles 25%
Land is not depreciated. Depreciation starts when the assets are ready for use. If a depreciable asset is made up of distinctly identifiable elements that have significantly different useful lives, depreciation is charged separately on each of the elements making up the asset, based on the so‐called component approach. Assets held on the basis of finance leases are depreciated over their estimated useful life, in the same way as for assets owned, or over the period of the lease contract if this is less. Gains and losses on the sale or disposal of fixed assets are calculated as the difference between the sale

___________________________________
proceeds and the net book value of the asset, and are to be booked to the income statement of the period in which the sale or disposal takes place. Impairment losses At each balance sheet date, the Group reviews the book value of its tangible and intangible assets for any signs that these assets may have suffered a loss in value. If there are signs that this is the case, the recoverable value of such assets is estimated so as to determine the amount of the write‐down. When it is not possible to estimate the recoverable amount of an asset individually, the Group makes an estimate of the recoverable amount of the cash generating unit (CGU) to which the asset belongs. Intangible assets with an indefinite useful life, are tested annually for impairment and any other time that there are signs of a possible loss in value. The recoverable value is the higher of the asset's fair value, less costs to sell, and its value in use. To determine the value in use, the estimated future cash flows are discounted to their present value at a rate net of tax that reflects current market assessments of the time value of money and the specific risks of the business in question. If the recoverable amount of an asset (or of a CGU) is estimated to be lower than its book value, it is written down to the lower recoverable amount. Impairment losses are booked to the income statement immediately. If a write‐down is no longer justified, the book value of the asset (or of the CGU), except for goodwill, is increased to the new value deriving from an estimate of its recoverable value, though this cannot be more than the net book value that the asset would have had if an impairment loss had not been recognised. Write‐backs are booked to the income statement immediately, unless the asset was booked at revalued cost as the deemed historical cost on the transition to IFRS, in which case the write‐back is booked to the related revaluation reserve. Leases Leases are classified as finance leases if the terms of the contract substantially transfer all of the risks and rewards of ownership to the lessee. All other contracts are treated as operating leases. Assets under finance leases are booked as Group assets at their fair value on the date of stipulation of the contract or at the present value of the minimum lease payments, if this is less. The corresponding liability to the lessor is included in the consolidated balance sheet as a lease liability. The lease instalment payments are split between principal and interest so as to achieve a constant rate of interest on the residual liability. The lease instalment costs under operating leases are booked on a straight‐line basis over the life of the contract. The benefits received or to be received by way of incentive to take out operating leases are also booked on a straight‐line basis over the life of the contract. Inventories Inventories are valued at the lower of cost and net realisable value. Cost includes direct materials and, where applicable, direct labour costs, production overheads and other costs incurred to bring the inventories to their current location and condition. Cost is calculated on the basis of the weighted average cost method. Net realisable value represents the estimated selling price less the estimated costs of completion and the

___________________________________
costs considered necessary to make the sale. Receivables from customers Receivables from customers are shown at face value less an appropriate write‐down to reflect estimated losses on receivables. Appropriate write‐downs as an estimate of the amounts that are unlikely to be recovered are booked to the income statement when there is objective proof that the receivables have suffered an impairment. Write‐downs are measured as the difference between the carrying value of the receivables and the present value of the estimated future cash flows discounted at the effective rate of interest calculated when the receivables are first booked. Financial assets Financial assets are booked to and reversed out of the balance sheet on the basis of the date of purchase or sale and are initially valued at fair value, including any charges directly related to the purchase. At subsequent balance sheet dates, the financial assets that the Group intends and has the ability to hold to maturity (“securities held to maturity”) are shown at amortised cost using the effective interest rate method, net of any write‐downs for impairment. Financial assets other than those held to maturity are classified as being held for trading or available for sale, and are measured at fair value at the end of every period. When financial assets are held for trading, the gains and losses deriving from changes in their fair value are charged to the income statement for the period; for financial assets available for sale, gains and losses deriving from changes in their fair value are booked directly to equity until such time that they are sold or have suffered an impairment; at that moment, the overall gains and losses previously booked to equity are transferred to the income statement for the period. Cash and cash equivalents This includes cash on hand, bank current and deposit accounts that are repayable on demand and other highly liquid short‐term financial investments that can rapidly be converted into cash and which are not subject to a significant risk of changes in value. Derivatives The Group's activities are primarily exposed to financial risks arising from changes in exchange rates. In certain cases, the Group uses derivatives to hedge the risks deriving from foreign exchange fluctuations that might affect commitments that are certain and irrevocable, as well as foreseeable future transactions. Even though these derivatives are not held for trading purposes, but solely to cover exchange rate risks, they do not have the characteristics required by IAS 39 to be defined as hedging derivatives. Derivatives are recorded at fair value; changes in the fair value of derivatives that do not qualify for hedge accounting are booked to the income statement in the period they arise. Provisions
Provisions are recognised in the financial statements when the Group has a clear obligation as the result of a past event and it is probable that an outlay of resources will be required to fulfil the obligation. Provisions are made on the basis of management's best estimate of the costs required to fulfil the obligation as of the balance sheet date, and are discounted if the effect is significant.

___________________________________
Post‐employment benefits Payments into defined‐contribution pension plans are booked to the income statement in the period in which they are due; payments to Foncer, a supplementary pension scheme, fall into this category, as well as payments of severance indemnities since the start of 2007 under the reform of these indemnities by the Budget Law. For defined‐benefit plans, the cost of the benefits provided is calculated by performing actuarial valuations at the end of each financial period. Liabilities for post‐employment benefits shown in the balance sheet consist of the present value of the liabilities for defined‐benefit plans adjusted to take account of the actuarial gains and losses that have not yet been recognised and of any past service costs that have not yet been recognised. Any net assets resulting from this calculation are limited to the value of the actuarial losses not yet recognised and to past service costs that have not yet been recognised, plus the net present value of any reimbursements and reductions in future contributions to the plan. The standard sets forth the obligation of recognising actuarial gains and losses in the statement of comprehensive income. Payables due to suppliers Payables due to suppliers are booked at their face value. Financial liabilities
Initial recognition and measurement Financial liabilities are classified on initial recognition among financial liabilities designated at fair value through profit or loss, among mortgages and loans or among derivatives designated as hedging instruments.
All financial liabilities are initially recognised at fair value added to which, for mortgages, loans and payables, are the directly attributable transaction costs.
The Group’s financial liabilities include payables due to suppliers and other payables, mortgages and loans, including current account overdrafts, guarantees given and derivatives.
Subsequent measurement The financial liabilities are mainly composed of loans. After initial recognition, if the effects are significant, loans are measured at amortised cost using the effective interest rate method. Gains and losses are recognised in the income statement when the liability is settled, in addition to through the amortisation process.
The amortised cost is calculated by recognising the discount or premium on the acquisition and the fees or costs forming an integral part of the effective interest rate. Amortisation at the effective interest rate is recognised among financial expense in the statement of profit or loss.
Equity instruments The equity instruments issued by the Company are booked on the basis of the amount received, net of direct issue costs. They are defined as contracts that give a right to benefit from the residual interests in the Company's assets after all liabilities have been deducted.

___________________________________
Bank loans Interest‐bearing bank loans and overdrafts are booked on the basis of the amounts received, net of any related costs, and subsequently valued at amortised cost, using the effective interest rate method. Treasury shares Treasury shares are deducted directly from equity: gains and losses realised on their disposal are booked directly to the equity reserves. Revenue recognition Revenues are recognised to the extent it is probable that the economic benefits are achieved by the Group and the related amount can be reliably determined, regardless of the date of collection. Revenues are measured at the fair value of the consideration received or to be received, taking into account the contractually defined payment terms and excluding taxes and duties. Foreign currency transactions The financial statements of the individual Group companies are prepared in the currency of the main economic environment in which they operate (functional currency). For consolidation purposes, the financial statements of each foreign entity are expressed in euro, which is the functional currency of the Group and the currency in which the consolidated financial statements are presented. In preparing the financial statements of the individual entities, transactions in currencies other than the euro are initially booked at the exchange rates ruling on the transaction dates. At the balance sheet date, monetary assets and liabilities denominated in such currencies are restated at period‐end exchange rates. Non‐monetary assets expressed at fair value that are denominated in a foreign currency are translated at the exchange rates ruling on the date on which the fair values were determined. Exchange differences arising on the settlement of monetary items and their re‐measurement at period‐end exchange rates are booked to the income statement for the period, except for exchange differences on non‐monetary assets expressed at fair value, for which changes in fair value are booked directly to equity, like for the exchange element. For the presentation of the consolidated financial statements, the assets and liabilities of foreign subsidiaries that use functional currencies other than the euro are translated at the exchange rates ruling on the balance sheet date. Revenues and expenses are translated at the average exchange rates for the period. The exchange differences that arise as a result of this exercise are booked to the translation reserve in equity. The positive or negative balance on this reserve is then transferred to the income statement in the period when the subsidiary concerned is sold. The companies that prepared financial statements in currencies other than the euro were as follows:
Reporting currency
Lea North America LLC. USD
Panariagroup USA Inc. USD
Florida Tile Inc. USD

___________________________________
The EUR/USD exchange rates used to translate these financial statements are as follows:
31‐Dec‐17 31‐Dec‐16
Average exchange rate for the period 1.1297 1.1069
Current exchange rate at the balance sheet date 1.1993 1.0541
In accordance with IAS 21, exchange differences originating from the elimination of intragroup foreign currency loans, that form part of an investment in a foreign operation, are recognised as a separate component of equity, net of the related tax; such exchange differences are recognised in profit or loss only when the investment is sold. Following the application of IAS 1 (revised in 2007), exchange differences arising from foreign operations are now reported in the statement of comprehensive income. Government grants Government grants for capital investments are booked to the income statement over the period needed to match them against the related costs, being treated in the meantime as deferred income. In particular, they are booked when there is reasonable certainty that the company will comply with the requirements for the allocation of funds, and that the grants will be received. Income taxes Income taxes for the year are the sum of current and deferred taxes. Current taxes are based on the taxable result for the year. Taxable income differs from the result shown in the income statement as it excludes positive and negative elements that will be taxed or deducted in other financial years, while it also excludes those items that will never be taxed or deducted for tax purposes. The current tax liability is calculated using the official or effective tax rates ruling at the balance sheet date. Deferred taxes are the taxes that are expected to be paid or recovered on temporary differences between the book value of the assets and liabilities shown in the financial statements and the corresponding value for tax purposes used in calculating taxable income, accounted for according to the balance sheet liability method. Deferred tax liabilities are generally recognised for all taxable temporary differences, whereas deferred tax assets are only recognised to the extent that it is considered probable that there will be sufficient taxable income in the future to absorb them. These assets and liabilities are not recognised if the temporary differences derive from goodwill or from the initial recognition (not in business combinations) of other assets or liabilities in transactions that do not have any influence either on the accounting result or on the taxable result. Deferred tax liabilities are recognised on taxable temporary differences relating to investments in subsidiaries, associates and joint ventures, except in those cases where the Group is able to control the reversal of such temporary differences and it is probable that they will not reverse in the foreseeable future. The carrying value of deferred tax assets is reviewed at each balance sheet date and reduced to the extent that it is no longer probable that there will be sufficient taxable income to allow all or part of such assets to be recovered. Deferred taxes are calculated on the basis of the tax rate that is expected to be in force at the time that the

___________________________________
asset is realised or the liability extinguished. With reference to American companies within the Group, following the tax reform approved by the US Government in December 2017, deferred taxes were adjusted as at 31 December 2017 based on the new tax rates. The tax reform envisages the reduction of federal tax rates from 34% to 21% as from 1 January 2018. Deferred taxes are booked directly to the income statement, except for those relating to items booked directly to equity, in which case the related deferred taxes are also booked to equity. Significant accounting policies based on the use of estimates Preparation of the consolidated financial statements requires management to apply accounting principles and methods that in certain circumstances necessitate difficult and subjective valuations and estimates based on past experience and assumptions that, on each occasion, are considered reasonable and realistic, depending on the specific circumstances. These estimates and assumptions affect the amounts shown in the financial statements, namely the balance sheet, income statement and cash flow statement, as well as the other information provided in the report. The following is a brief description of the accounting principles that, more than others, require greater subjectivity on the part of management in making such estimates and for which a change in the conditions underlying the assumptions made can have a significant impact on the Group’s consolidated financial statements.
Goodwill – Estimate of the degree of recoverability The Group is showing various amounts of goodwill that arose on company acquisitions. These amounts of goodwill are not amortised, but tested at least once a year for impairment, in accordance with the provisions of IAS 36, based on forecasts of expected cash flows over coming years. In the event that future business and market scenarios differ from those assumed when preparing the forecasts, the value of goodwill could be subject to write‐down, or a write‐down that differs from that already recorded. Inventory valuation and provision for slow‐moving and obsolete goods Inventories are valued at the lower of cost and net realisable value based on future market trends and making assumptions regarding the future realizable value of inventories. Analyses made by Management are aimed to identify the goods that are sold at a price lower than the cost (i.e. second and third choice or obsolete material) and to identify the presence of excess or obsolete stocks. The estimate of the recoverable amount of inventories as of 31 December 2017 is the Managements’ best estimate, according to the information available and the predictable circumstances as of closing date, with reference to the Group policies and the expected trend in future sales. If effective market conditions turn out to be less favourable than those foreseen by the Group policies, the value of inventories might be written down. Provision for bad and doubtful accounts In order to establish an appropriate level for the provision for bad and doubtful accounts, the Group evaluates the likelihood of receivables being collected based on the solvency of each debtor. The quality of these estimates depends on the availability of up‐to‐date information on debtors' solvency. If the solvency of debtors were to decline due to the difficult economic environment in certain markets where the Group operates, the value of receivables from customers could be subject to additional write‐downs.

___________________________________
Deferred tax assets Deferred tax assets are accounted for on the basis of expectations of taxable income in future years. The valuation of expected income for this purpose depends on factors that vary over time, which can have a significant impact on the value of deferred tax assets. Contingent liabilities In relation to legal proceedings, court cases and other disputes, in order to establish an appropriate level for the provisions for risks and charges relating to these contingent liabilities, the Group examines the reasonableness of the claims being made by counterparties and the fairness of its own actions, and evaluates the amount of any damages that might result from the potential outcomes. The Group also consults with its lawyers on the problems involved in the disputes that arise as part of the Group's business activities. The level of the provisions for risks and charges needed to cover contingent liabilities is decided after careful analysis of each problem area. The level of provisions needed is potentially subject to future changes based on developments in each problem area. Significant non‐recurring events and transactions – Atypical and/or unusual transactions As required by CONSOB Communication DEM/6064293 of 28 July 2006, any significant non‐recurring events and transactions or atypical/unusual transactions have to be explained in the notes, disclosing their impact on the Group’s balance sheet, financial position, results and cash flow. Related parties As required by CONSOB Communication DEM/6064293 of 28 July 2006, the explanatory notes have to explain the impact that related party transactions have on the Group’s balance sheet, financial position, results and cash flow. Financial risks and derivatives The Group is exposed to a variety of trading and financial risks which are monitored and managed centrally. It does not make systematic use of derivatives to minimise the impact of such risks on its results. The market risks to which the Group is exposed fall into the following categories:
a) Exchange rate risk The Group operates on international markets and settles its trading transactions in euro and, where foreign currencies are concerned, principally in US dollars. Exchange rate risk mainly arises from the sale of finished products to the US market. See the “Financial income and expense” section of these notes for the sensitivity analysis required by IFRS 7.
b) Credit risk The Group deals only with known, reliable customers. The Group has procedures for assigning credit to its customers that limit the maximum exposure to every position. In addition, the Group has extensive insurance

___________________________________
coverage against its receivables from foreign customers and receivables from customers of the “third party” market. The Group does not have any significant concentrations of credit risk. See the “Receivables from customers” section of these notes for the composition of receivables from customers broken down by due date.
c) Interest rate risk Risks associated with changes in interest rates refer to loans. Floating‐rate loans expose the Group to the risk of fluctuating cash flows associated with interest payments. Fixed‐rate loans expose the Group to the risk of change in the fair value of the loans themselves. In some cases, the Group has hedged exchange rate risk by taking out derivatives such as interest rate swaps. The Group’s exposure is mainly to floating‐rate debt. See the “Financial income and expense” section of these notes for the sensitivity analysis required by IFRS 7.
d) Liquidity risk In its main activities the Group is exposed to a mismatch of cash flows in and out in terms of timing and volumes, and hence to the risk of not being able to fulfil its financial obligations. The Group’s objective is to ensure that it can fulfil all of its financial obligations at any moment in time, optimising its recourse to external financing. The Group maintains a certain number of lines of credit (see section 3.a “Due to banks and other sources of finance”) in order to take advantage of unforeseen business opportunities which may arise or for unforeseen payments, in addition to commitments arising from planned capital expenditure. Liquidity risk is closely monitored on a daily basis in order to plan for and predict liquidity. See the comments in section 4.d “Due to banks and other sources of finance” for information regarding the maturities of financial liability contracts. There are no loan contracts subjected to covenants or other similar guarantees.
3) OTHER INFORMATION
Presentation of the consolidated financial statements To assist readers, the consolidated financial statements are stated in thousands of Euro. Subsequent events There are no matters worth mentioning.

___________________________________
4) COMMENTS ON THE PRINCIPAL ASSET CAPTIONS
1. NON‐CURRENT ASSETS 1.a. Goodwill “Goodwill”, equal to Euro 8,139 thousand, relates to goodwill recognised on the acquisition of Gres Panaria Portugal and Montanari Ceramiche S.r.l., net of impairment. In particular, with respect to Gres Panaria Portugal, the value of goodwill as at 31 December 2017 is Euro 7,789 thousand and relates to:
- Euro 4,235 thousand of surplus paid for the acquisition of Maronagres Comercio e Industria Ceramica S.A., net of the amortisation charged prior to the IFRS transition date;
- Euro 7,854 thousand of surplus paid for the acquisition of Novagres Industria de Ceramica S.A. over the Group's portion of its equity, adjusted to take account of the fair value of this company's assets and liabilities on the acquisition date.
The above amounts are stated net of impairment recorded in 2012 of Euro 4,300 thousand based on the outcome of impairment testing performed at the year end with reference to the Cash Generating Unit consisting of the Portuguese company resulting from the merger of Maronagres Comercio e Industria Ceramica S.A. and Novagres Industria de Ceramica S.A. Despite in the following years the Portuguese investee started to generate profits again, the value had not been restored in accordance with “IAS 36 – Impairment of assets” which states that “An impairment loss recognised for goodwill shall not be reversed in a subsequent period”. As regards the goodwill relating to Maronagres, it derives from an acquisition that was carried out prior to the IFRS transition date. Its book value is therefore the amount resulting from the application of Italian GAAP as of that date (so‐called “deemed cost”). The acquisitions of Novagres and Montanari, on the other hand, have been accounted for in accordance with IFRS 3. These two Portuguese companies, purchased in 2002 and 2005 respectively, were merged at the end of 2006 to form a single entity called Gres Panaria Portugal S.A. The value of goodwill relating to Montanari Ceramiche S.r.l. as at 31 December 2017 is Euro 350 thousand. This amount was generated as follows:
- Euro 900 thousand relates to the excess price paid for the acquisition of Montanari Ceramiche S.r.l. over the Group's portion of its equity, adjusted to take account of the fair value of this company's assets and liabilities on the acquisition date;
- The above amount was then reduced by write‐down for impairment totalling Euro 550 thousand, of which Euro 200 thousand was recorded in 2009 and Euro 350 thousand in 2012, as a result of impairment testing.
The acquisition of Florida Tile did not involve booking any goodwill.

___________________________________
Impairment Testing As stated earlier in the section on Accounting Principles, at least once a year, and any time there are indicators of impairment, the Group performs impairment tests as required by IAS 36 in order to verify the recoverability of the goodwill recorded in the consolidated financial statements. In the presence of indicators of potential critical issues, the recoverability check is extended to the entire residual value of the property, plant and equipment and intangible assets recorded in the consolidated financial statements. As part of the 2017 financial statement closure process, impairment tests were performed as required by IAS 36. In particular, the Company identified the Cash Generating Units (“CGUs”) that represent the smallest identifiable grouping capable of independently generating cash flows; these CGUs correspond to the business units that make up the Group. The CGUs are consistent with the units identified for the previous financial year; furthermore, it should be noted that the business units correspond to individual companies, as shown by the table. The Company tested the recoverability of the value of net capital employed recorded in the Group's consolidated financial statements and attributed to each CGU, to which were added allocations made at consolidation level. With respect to testing for the Panariagroup S.p.A. CGU, net capital employed was considered net of the carrying value of the equity investments. The impairment test was performed assuming the value in use of each of these to be their recoverable value, in consideration of the fact that it is not possible to reliably establish their fair value net of selling costs. Value in use was determined as the present value of estimated future cash flows to be generated from the continuing use of the assets pertaining to the CGUs, being the sum of cash flows expected during the period of the plan and the terminal value attributable thereto. For the purposes of the verification of the recoverability of the amounts recorded, the vale in use was compared against the value of net capital employed recorded in the Group's consolidated financial statements (sum of the book value of equity and net financial indebtedness), added to which were the allocations made at consolidation level. The amounts, by individual CGU, subjected to testing for recoverability are as follows (in thousands of Euro):
Net capital employed
Goodwill ‐ Allocation of consolidated
financial statements
Equity investments
Total
Panariagroup S.p.A. 219,085 ‐ (89,862) 129,264 Gres Panaria Portugal 47,885 14,605 ‐ 62,490 Panariagroup USA and subsidiaries 79,512 (248) ‐ 79,264 Montanari Ceramiche S.r.l. 685 350 ‐ 968
The value in use of the CGUs was determined by applying the UDCF (“Unlevered Discounted Cash Flow”) model, which considered the cash flows included in the 2018‐2022 Business Plan approved by the Board of Directors of the Parent Company on 16 March 2018. The impairment method was approved by the Board of
___________________________________
Directors on 15 November 2017. A terminal value was calculated at the end of the explicit forecast period, represented by a perpetuity. For determination of the cash flow in perpetuity, use was made of net operating profit less adjusted tax (NOPLAT) of the last year of the business plan as management estimates this to be a long‐term “normalised” flow. The growth rate used for the determination of the terminal value was prudently taken to be zero, in line with the assumption made for the tests performed in prior years. The discount rate, or WACC, used to discount expected cash flows from all the CGUs subjected to testing was 7.10% (6.26% in 2016). The Company determined the discount rate by weighting the risks associated with the principal markets in which the Company operates on the basis of the turnover achieved by each of these. Moreover, based on the information contained in the joint document of the Bank of Italy, CONSOB and ISVAP no. 2 of 6 February 2009, the Group set out to develop a sensitivity analysis on the test results compared with the change in the basic assumptions, identifying WACC and EBITDA as significant parameters for this analysis, as they condition the value in use of the cash generating units. The use of positive values for the “g rate” would, in fact, have determined better results than the baseline scenario considered for the testing. Note that the impairment tests are based on business plans determined by management on the basis of past experience and expectations of developments in the market in which the Company operates. In particular, the revenue forecasts were made by taking as reference the trends defined by the most recent forecasts published by “Confindustria Ceramica” and “Cresme”, without assuming any additional efficiency beyond the current production and organisational structure of the Group. In addition, as mentioned previously, the tests were carried out considering a zero rate of further growth at the end of the explicit forecast period. No impairment losses arose from the test performed. Set out below are comments on the results of the testing for each CGU. Panariagroup Industrie Ceramiche S.p.A. Based on the above parameters, the recoverable amount of Panariagroup S.p.A. is some Euro 147.8 million, against the company's net capital employed as per the consolidated financial statements, net of the carrying value of equity investments, of Euro 129.3 million. Gres Panaria Portugal S.A. Based on the above parameters, the recoverable amount of Gres Panaria Portugal is Euro 134.6 million, against the company's net capital employed as per the consolidated financial statements, inclusive of the allocation of consolidation differences, of Euro 62.5 million. Panariagroup USA and subsidiaries On the basis of the above parameters, the recoverable amount of Panariagroup USA is USD 139.2 million, against the company's net capital employed as per the consolidated financial statements of USD 95.1 million. Montanari Ceramiche S.r.l. On the basis of the above parameters, the recoverable amount of Montanari Ceramiche S.r.l. was around Euro 1.3 million, compared to the company's net capital employed of Euro 1.0 million.

___________________________________
Impairment ‐ Sensitivity Analysis The results of the Sensitivity Analysis made to assess the degree of “strength” of the test are provided below; in particular, the hypothetical values of WACC and EBITDA that would take the test to the break‐even point were checked (with higher WACC = impairment, with lower EBITDA = impairment). The results are shown in the following table:
WACC Change in EBITDA compared to the Plan
Panariagroup S.p.A. 8.1% ‐7%
Gres Panaria 15.0% ‐39%
Panariagroup USA 10.0% ‐21%
Montanari 9.1% ‐21%
As the table above shows, there is a good margin between the assumptions of the plan and the impairment limit. It is worth pointing out that assessing the recoverable value of the cash generating units requires management to use its judgement in making estimates, which means that the Company cannot guarantee that the fixed assets booked in the consolidated financial statements will not be impaired in the future. The circumstances and events that might result in further impairment will be monitored constantly by the Company. 1.b. Intangible assets “Intangible assets” as at 31 December 2017 amount to Euro 14,239 thousand, higher than the figure of Euro 272 thousand reported as at 31 December 2016. Changes during the year can be summarised as follows:
2017 2016
Beginning Balance 13,967 5,593
Additions 2,271 8,777
Reclassifications from tang. assets 244 56
Retirements ‐ ‐
Amortisation charge (1,230) (562)
Exchange differences for foreign subsidiaries
(1,013) 103
Ending Balance 14,239 13,967
The increases of the financial year mostly refer to software acquisitions and development. The most significant concerns the start‐up of the IT system integration project at Group level, on a single platform (SAP).

___________________________________
The software became operative at the beginning of January 2017 in the American companies of the Group (Panariagroup USA, Florida Tile, Lea North America). Costs related to training and start‐up activities were charged to income statement, as envisaged by International Accounting Standards. In 2017, activities aimed at developing and implementing the software were started in the company Gres Panaria Portugal. As regards the Italian and Portuguese Business Units, capitalised costs connected with the project were recognised under item Construction in progress. The changes during the period are reported in an attachment. 1.c. Property, plant and equipment The net book value of property, plant and equipment at the end of the period is as follows:
31‐Dec‐17 31‐Dec‐16
Land and buildings 24,972 23,688
Plant and machinery 72,951 67,882
Equipment and other assets 27,252 17,435
Construction in progress 830 10,590
126,005 119,595
Changes during the year can be summarised as follows:
2017 2016
Beginning Balance 119,595 109,115
Additions 32,108 29,307
Retirements (53) (721)
Depreciation charge (20,859) (18,798)
Reclassifications to intang. assets (244) (56)
Exchange differences for foreign subsidiaries
(4,542) 748
Ending Balance 126,005 119,595
The changes during the period are reported in an attachment. Expenditure on property, plant and equipment during the period came to around Euro 32.1 million and refers, for roughly Euro 12.1 million, to investments in the Italian Business Unit, for Euro 12.9 million to investments in the Portuguese Business Unit and for roughly Euro 7.1 million to investments in the US Business Unit. The most significant investments of the financial year have already been previously described in the Directors' Report in section “Significant events in the period” and in section “Non‐current Assets”. “Land and buildings” are represented mainly by the buildings shown in the financial statements of the Portuguese subsidiary Gres Panaria Portugal S.A.

___________________________________
Following the extraordinary property spin‐off in 2004, the buildings in which Panariagroup Industrie Ceramiche S.p.A. conducts its business are rented, being owned by Immobiliare Gemma S.r.l. (a related party). The US subsidiary Florida Tile Inc. operates at the Lawrenceburg (Kentucky) plant under an operating lease that expires in 2030 (with multiple renewal options until 2050), an annual lease instalment of around USD 2 million and without buy‐back option on expiry. 1.d. Equity investments This caption comprises:
31‐Dec‐17 31‐Dec‐16
Equity investment in AGL PanariaPrivate Ltd
284 70
Other 16 12
300 82
The change in the book value of the equity investment in AGL Panaria Private Label was determined by an increase of Euro 400 thousand for capital considerations and a decrease of Euro 186 thousand for the depreciation made when applying the equity method. 1.e. Deferred tax assets Deferred tax assets are composed as follows:
31‐Dec‐17 31‐Dec‐16
Deferred tax assets:
‐ taxed provisions 4,448 4,661
‐ tax loss carryforwards 4,924 7,272
‐ for Section 263 A Ending 444 687
‐ for deferred rent payable 148 263
‐ for AMT Credit carryover 446 541
‐ other 2.057 970
Deferred tax assets 12,467 14,394
Deferred tax assets for “tax loss carryforwards” refer to tax losses related to the subsidiary Florida Tile Inc. (Euro 1.7 million) and Panariagroup Industrie Ceramiche (Euro 3.2 million). With respect to these deferred tax assets, the business plans prepared and approved by Group management show future results that will allow their recovery. The recoverability of the deferred tax assets is thus subject to the ability of the aforementioned companies to produce, in the medium term, positive results in line with forecasts included in the business plans approved by the Group's directors on 16 March 2018. The Parent Company Panariagroup Industrie Ceramiche S.p.A. has been included in the tax group headed up by its ultimate parent Finpanaria S.p.A., which also includes the related company Immobiliare Gemma S.p.A. and the subsidiaries Montanari Ceramiche S.r.l. and Panariagroup Immobiliare S.r.l. The IRES income tax

___________________________________
receivable or payable is thus a receivable from or payable to the parent company which, in its role as head of the tax group, handles all dealings with the tax authorities. 1.f. Other non‐current assets This caption comprises:
31‐Dec‐17 31‐Dec‐16
Guarantee deposits for utilities 294 456
Loans due from third parties 143 188
Other receivables 100 133
Other non‐current assets 537 777
The item “Loans due from third parties” includes a residual loan for Euro 143 thousand granted to a partner company belonging to the group of companies headed by Panariagroup Industrie Ceramiche S.p.A. as part of the project called “Industria 2015”. The item “Other receivables” includes Euro 100 thousand for deposits on leases of the stores of the subsidiary Florida Tile (Euro 133 thousand as at 31 December 2016). 1.g. Non‐current financial assets Non‐current financial assets are broken down as follows:
31‐Dec‐17 31‐Dec‐16
Industrial Revenue Bond 2007 7,058 8,833
Industrial Revenue Bond 2016 11,840 13,952
18,898 22,785
The “Industrial Revenue Bond” items refer to the subscription of IRBs issued by Anderson County, Kentucky, (hereinafter, the “County”), forming part of a wider package of tax incentives granted in relation to major investments in the Lawrenceburg factory, operated by the subsidiary Florida Tile Inc. (defined by contract as the “Porcelain Project”). The 2007 Bond relates to the implementation of the first grès porcelain production line at Lawrenceburg and has a twenty‐year maturity, whilst the new transaction subscribed at the end of 2016 (thirty‐year maturity) relates to the investment in construction of the third grès porcelain production line. Both transactions were carried out under similar terms. In particular, their purpose is to save property taxes on the plants acquired as part of transactions involving two distinct and exactly matching operations:
- the subscription by Panariagroup USA to a bond, issued by the County at an interest rate linked to the LIBOR;
- the purchase of the “Porcelain Project” properties by the County and grant of a twenty‐year finance lease at the same rate as the Bond to Florida Tile Inc, with a redemption value of USD 1 at the end.

___________________________________
The repayment plans and conditions of the two transactions (Bond and Finance Lease) are identical and the related cash transfers (lease payments by Florida Tile Inc. to the County and reimbursement of Bond by the County to Panariagroup USA) will be made directly between the subsidiaries Florida Tile Inc. and Panariagroup USA without going through the County. The entire transaction has a neutral cash‐flow impact on the consolidated financial statements, since the financial asset represented by the Bond exactly matches the financial liability represented by the Finance Lease; however, the consolidated financial statements do benefit in terms of income since this transaction means that there is no property tax payable on the “Porcelain Project”. The “Porcelain Project's” formal transfer of ownership to the County does not involve any restriction on the use, modification, management or retirement of the plant acquired. The decrease in value of the 2007 Industrial Revenue Bond as at 31 December 2016 is due to an exchange gain of Euro 972 thousand arising from translation at the year‐end exchange rate, net of the repayment of the annual instalment of Euro 803 thousand (USD 846 thousand). The Industrial Revenue Bond, subscribed in 2016, decreased in value, compared to 31 December 2016, due to the repayment of the annual instalment of Euro 481 (USD 507) and to the negative exchange rate, equal to Euro 1,631.
2. CURRENT ASSETS 2.a. Inventories As at 31 December 2017, this item is composed of the following:
31‐Dec‐17 31‐Dec‐16
Raw, ancillary and consumable materials 12,901 13,231
Work in progress 2,082 2,287
Finished products 148,023 136,834
Provision for obsolescence (13,427) (14,202)
Total finished products and raw materials 149,579 138,150
Buildings held for sale 2,585 2,674
Provision for depreciation: buildings held for sale
(684) (651)
Total buildings held for sale 1,901 2,023
151,480 140,173
The overall value of inventories increased (+11.3 million, 8%) if compared to 31 December 2016. This increase, albeit offset by a slowdown in production recorded in the last period of the year, is attributable to the decrease in sales volumes in the second half‐year.

___________________________________
Inventories of finished products and raw materials are shown net of a provision for obsolescence of Euro 13,427 thousand as at 31 December 2017, 8.2% of total inventories (Euro 14,202 thousand as at 31 December 2016), based on an analysis estimating the timing of sale and recoverable value of stocks according to historical experience and the market trends of the various types of goods. Analyses made by Management are aimed to identify the goods that are sold at a price lower than the cost (i.e. second and third choice or obsolete material) and to identify the presence of excess or obsolete stocks. The estimate of the recoverable amount of inventories as of 31 December 2017 is the Managements’ best estimate, according to the information available and the predictable circumstances as of closing date, with reference to the Group policies and the expected trend in future sales. Inventories include Euro 2,585 thousand of buildings held for sale (mainly apartments received in exchange of goods), net of an impairment charge of Euro 684 thousand, based on the estimates of the market value of the assets at the end of the year made by an independent professional. 2.b. Receivables from customers The item “Receivables from customers” is broken down as follows:
31‐Dec‐17 31‐Dec‐16
Receivables from customers 84,676 85,923
Provision for bad and doubtful accounts (5,534) (6,020)
79,142 79,903
The gross amount of receivables from customers decreased by approximately 1.4% compared to 31 December 2016 against a growth in turnover, thus highlighting an improvement in “average collection times”. The item “Receivables from customers” includes around Euro 2.7 million in receivables past due by more than 120 days (equal to roughly 3.2% of total receivables); the provision for bad and doubtful accounts, amounting to Euro 5.5 million, reflects an economic estimate of the recoverable value of total receivables, based on the information available at the time of preparing the consolidated financial statements. During the year, the Company factored its non‐recourse receivables for a total amount of Euro 358 thousand. 2.c. Due from tax authorities The amounts due from tax authorities are made up as follows:
31‐Dec‐17 31‐Dec‐16
VAT receivable 2,182 3,386
Income tax receivable and advance payments 2,716 2,591
Other amounts due from tax authorities 2,055 2,043
6,953 8,020
The Group's VAT position is normally in credit, mainly because of the high proportion of exports.

___________________________________
The item “Income tax receivable and advance payments” refers to the balance between the advance payments made and income taxes due for the period as well as receivables for withholding tax. The item “Other amounts due from tax authorities” refers for Euro 1.7 million to IRES for which a refund was requested due to IRAP deductibility in the years 2007‐2011 (art. 2, Italian Law Decree 201/2011). The amounts due from tax authorities do not include any items of dubious collectability. 2.d. Other current assets This caption is made up as follows:
31‐Dec‐17 31‐Dec‐16
Advances to social security institutions 127 102
Advances to suppliers 178 81
Rebates from suppliers and credit notes to be received
816 568
Receivables due from employees and third parties 204 220
Earthquake grants receivable 320 320
Other grants to be received 727 169
Receivables due from energy income 991 1,900
Other 340 447
Total other current receivables 3,703 3,807
Total current accrued income and prepaid expenses
1,388 1,830
5,091 5,637
The line “Earthquake grants receivable” refers to the amount not yet collected in relation to the claims presented to the Emilia Romagna Region for damages suffered to plants and buildings, as well as to relocation expenses incurred following the earthquake in May 2012 and not covered by insurance policies. Receivables related to “Other grants” refer to income due from the Region, amounting to Euro 219 thousand and concerning subsidies granted for R&D activities, as well as, in the amount of Euro 508 thousand, to the last tranche to be collected for the “Industria 2015” project related to the development of photovoltaic tiles. “Receivables due from energy income” refer to certain types of revenues granted with various subsidies on energy costs, such as the “energy‐intensive” business grants and from the sale of photovoltaic energy. “Other” includes Euro 232 thousand relating to the recoverable VAT part of write‐down of receivables. The item “Accrued income and prepaid expenses” mainly relates to miscellaneous costs (interest, trade fairs, promotions, commercial costs, maintenance and rentals) that refer to the next year.

___________________________________
2.e. Current financial assets
This caption is made up as follows:
31‐Dec‐17 31‐Dec‐16
IRB 2007 – Current portion 706 804
IRB 2016 – Current portion 423 481
1,129 1,285
The items “IRB – Current portion” relate to the principal element of the Industrial Revenue Bonds that matures within 12 months, as explained in more detail in the section “Non‐current financial assets”. 2.f. Cash and cash equivalents These are made up as follows:
31‐Dec‐17 31‐Dec‐16
Bank and post office deposits 7,103 16,890
Cash and equivalents on hand and cheques 53 105
7,156 16,995
There are no restrictions or disposal costs on cash and cash equivalents. The changes in financial position in 2017 compared with 2016 are analysed in the Consolidated Cash Flow Statement shown previously.

___________________________________
5) COMMENTS ON THE MAIN LIABILITY AND EQUITY CAPTIONS
3. EQUITY Equity consists of:
31‐Dec‐17 31‐Dec‐16
Share capital 22,678 22,678
Share premium reserve 60,784 60,784
Revaluation reserves 4,493 4,493
Legal reserve 4,125 3,958
Translation reserve 2.535 10,265
Reserve for exchange rate adjustment (202) 1,279
Other reserves and retained earnings 65,540 57,546
Profit (Loss) for the year 11,356 11,215
171,309 172,218
The changes in equity have already been reported in the table forming part of the consolidated financial statements. To date, no stock option plans have been granted. The main items making up equity and the associated changes are discussed below. Share capital The share capital, subscribed and paid in consists of 45,355,291 shares of par value of Euro 0.50 each and refers to the Parent Company Panariagroup Industrie Ceramiche S.p.A. Share premium reserve
The share premium reserve represents the surplus of the issue price for shares with respect to their par value and includes:
- Euro 5,069 thousand in relation to the share capital increase carried out in 2000 by Panaria Industrie Ceramiche S.p.A.;
- Euro 53,114 thousand for the increase in capital carried out in 2004 through the public offering on the stock market;
- Euro 2,601 thousand for the unutilised reserve for additional shares related to the portion of equity reserved for servicing the bonus share at the time the Company was listed.
Revaluation reserves
The revaluation reserves amounting to Euro 4,493 thousand include Euro 4,103 thousand for the revaluation of assets as at 31 December 2000 under Law 342 of 21.11.2000 and Euro 390 thousand for revaluations carried out in application of previous laws. No deferred taxes have been provided on these reserves, which

___________________________________
are subject to the deferral of taxation, since no transactions that would give rise to their distribution and consequent taxation are currently envisaged.
Legal reserve
The legal reserve increased thanks to the allocation of 5% from the 2016 net profit. Translation reserve In compliance with IAS 21, translation differences arising from translation of the foreign currency Financial Statements of consolidated companies into the Group accounting currency are classified as a separate Equity component; particularly this reserve contains the exchange differences that arose on translation into euro of the financial statements of Florida Tile Inc., Panariagroup USA Inc. and Lea North America LLC, originally expressed in US dollars. Reserve for exchange rate adjustment In application to IAS 21.40, this reserve comprises profits/losses generated by monetary elements which are an integral part of the net investment of foreign managements. In particular, it relates to the effect of exchange rates measurement at year‐end for receivables for loans in US Dollars granted by parent company to American subsidiaries. For these loans no regulation and/or a defined reimbursement plan are provided, nor is it deemed probable that they will be reimbursed in the foreseeable future. Other reserves and retained earnings The “Other equity reserves” are made up as follows:
31‐Dec‐17 31‐Dec‐16
Extraordinary reserve 50,462 50,435
Payments on capital account 1,077 1,077
Treasury shares in portfolio (1,614) (1,614)
Retained earnings/losses and other reserves
15,615 7,648
65,540 57,546
The balance of the Extraordinary reserve increased by the net amount related to the allocation of the result of the previous year, after the allocation of 5% to the Legal reserve and the distribution of dividends amounting to Euro 3,145 thousand.
The reserve for “Payments on capital account” relates to payments made by shareholders in prior years and not tied to future capital increases. Treasury shares As at 31 December 2017, the treasury shares held in portfolio were 432,234, at an average carrying value of Euro 3.73 each, for a total of Euro 1,614 thousand. There have been no changes since the end of the previous year. As stated in the section on Accounting Principles, these have been treated as a deduction from equity.

___________________________________
The treasury shares currently held were purchased in accordance with a resolution passed by the Shareholders' Meeting of Panariagroup Industrie Ceramiche S.p.A. on 26 April 2005. This resolution was then renewed at the Shareholders' Meetings that approved subsequent years' financial statements. “Retained earnings (accumulated losses) and other reserves” of Euro 8,335 thousand refer principally to profits made by subsidiaries after preparation of the first consolidated financial statements and not distributed, and to the allocation of the result of the previous year. No deferred taxes have been provided on these reserves, as no transactions that would give rise to their distribution and consequent taxation are currently envisaged.
4. NON‐CURRENT LIABILITIES 4.a. Liabilities for employee benefits This item includes the actuarial value of post‐employment benefits, as shown hereunder:
31‐Dec‐17 31‐Dec‐16
Liabilities for employee benefits 5,531 5,913
Liabilities related to post‐employment benefits are related to the employee severance indemnities, as envisaged by the Italian regulations and were determined pursuant to provisions set forth by IAS 19. The main technical bases used for calculations are shown hereunder: Demographic assumptions Retirement: 100% on reaching the so‐called “AGO” (Assicurazione Generale Obbligatoria) requirements Mortality rate: demographic base IPS 55 prepared by ANIA (National Association of Insurance Companies) Inability: INPS tables divided by age and gender Probability of termination of employment for reasons other than death (calculated on the basis of historical data for the last five years):
Age group Probability
0‐24 13.2%
25‐29 7.1%
30‐34 5.5%
35‐39 3.4%
40‐49 2.7%
Over 50 2.4%
Financial assumptions The following discount rates have been used:

___________________________________
31‐Dec‐17: IBoxx Eurozone Corporate AA discount rate = 0.88% 31‐Dec‐16: IBoxx Eurozone Corporate AA discount rate = 0.86% The inflation rates taken into consideration are as follows: 31‐Dec‐17: annual inflation rate = 1.50% 31‐Dec‐16: annual inflation rate = 1.50% The changes in this provision during the year were as follows:
Balance as at 31‐Dec‐16 5,913
Charge to the income statement 53
Charge to “Other Comprehensive Income” (27)
Portion paid out during the year (408)
Employee severance indemnities as at 31‐Dec‐17
5,531
4.b. Deferred tax liabilities Details of deferred tax liabilities are provided below:
31‐Dec‐17 31‐Dec‐16
Deferred tax liabilities:
‐ revaluation of acquired company buildings to fair value
1,785 1,919
‐ valuation of severance indemnities according to IFRS
‐ (147)
‐ valuation of agents' termination indemnities according to IFRS
213 186
‐ valuation of inventories 351 386
‐ lease‐back 152 172
‐ exchange differences on valuation ‐ 280
‐ accelerated amortisation/depreciation 5,286 6,135
‐ other 47 58
Deferred tax liabilities 7,834 8,989
Deferred tax liabilities provided against the “revaluation of acquired company buildings at fair value” (Euro 1,785 thousand) refer to the recognition of the current value of acquired company assets at fair value in the consolidated financial statements, net of accumulated depreciation on the acquisition date. Deferred tax for accelerated amortisation/depreciation refers mainly to the temporary difference between book value and fiscal value of the depreciation in the subsidiary Florida Tile.

___________________________________
4.c. Provision for risks and charges Provisions for risks and charges are made up of:
31‐Dec‐17 31‐Dec‐16
Provision for agents' termination indemnities
3,276 3,253
Provision for tax risks 485 485
Provision for returns 245 245
Other provisions 563 742
4,569 4,725
The Provision for agents' termination indemnities refers to the amount allocated as termination indemnity payable on existing agent contracts and, in agreement with international accounting standards, the liability was discounted at a rate of 2.09%. The rate has been applied to a projection of expected future cash flows for agents' termination indemnities based on past payments of this kind over the last five years. For prudence sake, a maximum limit of 20 years was chosen for the period during which payments from this provision will be made, even though most of the agency network is made up of legal entities. “Provisions for tax risks” include allocations on contingent tax liabilities; the balance as at 31 December 2017 refers entirely to the risk connected with a dispute with the Portuguese tax office and reflects the best estimate of expenses to be incurred on the basis of the analysis of irregularities received and the likelihood of the defensive arguments made by the Directors, with the help of the Group's tax consultants, being upheld. The main item that makes up “Other provisions” is the “Provision for the risks of ongoing disputes”. The Parent Company's tax years from 2013 onwards are still open for assessment. Management, with support from the Group's tax advisors, believes that the settlement of these open years will not give rise to significant liabilities not already recorded in the consolidated financial statements as at 31 December 2017. With regard to tax risks, note that the dispute on use of the “Tax receivable not due” ascertained with issue of a tax recovery demand by the Tax Authorities in December 2015 to the parent company, is still pending. At present, the risk has been categorised as “possible” by Company consultants, so no provision was recognised in the financial statements, in compliance with the accounting principles. 4.d. Other non‐current liabilities As at 31 December 2017, this caption comprises:
31‐Dec‐17 31‐Dec‐16
Due to suppliers beyond 12 months 2,097 1,483
Accrued rent ‐ Lawrenceburg 595 670
Deferred income on grants for earthquake 782 1,153
Other 57 80
3,531 3,386

___________________________________
The amounts due to suppliers beyond 12 months refer to the discounted value of medium/long‐term payables and mainly relate to the supply of plants and machinery on extended payment terms agreed for beyond 12 months.
“Accrued rent – Lawrenceburg” is the difference between the rent payments effectively made and the higher rent instalments due as calculated according to IAS. In fact, the contract provides for rent payments that increase every five years, whereas IAS 17 assumes that they are booked on a straight‐line basis.
“Deferred income on grants for earthquake” includes the amount already collected in previous years from the Regional Government and from insurance companies for damages suffered as a result of the 2012 earthquake. These grants mostly refer to works included under fixed assets, recognised in the income statement according to the useful life of the investments to which they refer.
“Other” includes commitments taken by Florida Tile Inc. to carry out environmental monitoring at its own expense for the next 25 years; these have been treated to all effects as liabilities acquired as part of the acquisition. 4.e. Due to banks The item “Due to banks” is broken down as follows:
31‐Dec‐17 31‐Dec‐16
Medium/Long‐term loans 78,988 60,694
78,988 60,694
The item “Medium/Long‐term loans” relates to the portion beyond 12 months of medium/long term loans, obtained primarily by the parent company, at floating rates tied to Euribor. There are the following guarantees in respect of these loans in the bank's favour.
- Mortgage Security for Euro 37,500 thousand issued by the affiliated company Immobiliare Gemma S.p.A.;
As pointed out in the related parties section, the Company pays a consideration for these guarantees received. 4.f. Other non‐current financial payables The item “Other non‐current financial payables” is broken down as follows:
31‐Dec‐17 31‐Dec‐16
IRB finance lease ‐ 2007 7,058 8,833
IRB finance lease ‐ 2016 11,840 13,952
Loans from public entities 2,772 3,091
Other leases 135 417
21,805 26,293

___________________________________
The "IRB finance lease" relates to transactions detailed in note “1.g. Non‐current financial assets” of the Industrial Revenue Bond and associated with the package of tax incentives obtained for the major investment in the Lawrenceburg factory of Florida Tile Inc. As mentioned previously in connection with the Bond, the decrease in its amount reflects the repayment of principal during 2017 and the exchange‐rate effect deriving from the translation to Euro of the original amounts (denominated in dollars) using the closing rate of exchange. The item “Loans from public entities” refers to loans granted by the Portuguese Government with special conditions against investment plans. As required by IFRS 7, the following table reports the due dates envisaged by the repayment plans for the above financial payables:
Medium/Long‐
term loans Leases IRB Total
12 months 20,450 1,362 (1,129) 20,683
2019 24,476 1,264 (1,129) 24,612
2020 22,543 1,129 (1,129) 22,543
2021 14,623 1,129 (1,129) 14,623
2022 8,486 1,129 (1,129) 8,486
2023 4,736 1,129 (1,129) 4,736
2024 3,007 1,129 (1,129) 3,007
2025 2,778 1,129 (1,129) 2,778
2026 1,111 1,129 (1,129) 1,111
2027 0 1,129 (1,129) 0
Beyond 10 years
0 8,741 (8,741) 0
Medium / Long‐term
81,760 19,033 (18,898) 81,896
Financial payables
102,210 20,395 (20,027) 102,579
The credit amounts refer to the current and long‐term operations of the already commented IRB, whose maturities are related to the amortisation plan of the leasing. The Group does not have any negative pledges or covenants on debt positions outstanding at the end of the year.

___________________________________
5. CURRENT LIABILITIES 5.a. Payables due to suppliers The trend in payables due to suppliers is as follows:
31‐Dec‐17 31‐Dec‐16
Payables due to suppliers 83,198 83,647
Payables due to suppliers refer to amounts due to suppliers for the purchase of goods and services used in the Group's normal business activities. The balance is in line with the previous year. 5.b. Due to tax authorities This caption comprises:
31‐Dec‐17 31‐Dec‐16
Withholding tax 3,017 3,008
Income taxes 297 67
Other 295 245
3,609 3,320
5.c. Other current liabilities As at 31 December 2017, this caption comprises:
31‐Dec‐17 31‐Dec‐16
Due to social security institutions 4,165 4,090
Due to employees 7,600 7,210
Due to customers 4,440 3,941
Due to agents 7,114 7,100
Financial derivatives – negative fair value 189 361
Due for EUA shares to purchase 1,011 418
Other 331 948
Total current payables 24,850 24,068
Deferred income from capital grants 94 156
Accrued interest expense 3 24
Deferred income from earthquake insurance payouts
371 371
Other 53 158
Total current accrued expenses and deferred income
521 709
25,371 24,777

___________________________________
The item "Due for EUA shares to purchase" refers to the value of the greenhouse gas emission shares to purchase in 2017 to meet the CO2 emissions of the Parent Company and of the Company Gres Panaria Portugal. “Deferred income from earthquake insurance payouts” consists of a portion of insurance payouts and of the government grant relating to extraordinary maintenance as a consequence of the earthquake and which have been capitalised. This portion of the payout is thus being taken to income over the useful lives of the assets to which they relate. 5.d. Due to banks Short‐term payables due to banks are made up as follows:
31‐Dec‐17 31‐Dec‐16
Current account overdrafts 1,330 4,985
Export advances 1,649 8,169
Short‐term loans 1,000 1,000
Short‐term portion of medium/long‐term loans
19,672 21,654
23,651 35,808
The changes in financial position during 2017, compared with 2016, are shown in the consolidated cash flow statement contained in the section relating to the consolidated financial statements. The Group's total borrowing facilities granted by banks at 31 December 2017 amounted to Euro 122.5 million, of which Euro 3 million had been drawn down at that date. “Medium/Long‐term loans” include the current portion of unsecured loans obtained by the Parent Company between 2009 and 2016 for Euro 19,031 thousand and for Euro 641 thousand as the current portion of the new loan subscribed by Florida Tile in 2017 for the amount of USD 5 million. These loans are discussed in more detail in the section entitled “Due to banks” and “Other non‐current financial payables” under Non‐current liabilities.
Like in previous years, the Group has not carried out any factoring or securitisation transactions in 2017. 5.e. Other current financial payables Short‐term financial payables are made up as follows:
31‐Dec‐17 31‐Dec‐16
IRB finance lease ‐ 2007 706 804
IRB finance lease ‐ 2016 423 481
Loans from public entities 778 431
Other leases 233 266
2,140 1,982

___________________________________
TRANSACTIONS INVOLVING FINANCIAL DERIVATIVES
The following financial derivative contracts taken out with leading banks were outstanding as at 31 December 2017:
- “Interest rate swap” with a notional underlying principal of Euro 10,000 thousand to hedge interest rates on a portion of the total existing and outstanding loan obtained during 2016 with expiry 31/12/2019.
- “Interest rate swap” with a notional underlying principal of Euro 20,000 thousand to hedge interest rates on portion of the total existing and outstanding loan obtained during 2016 with expiry 31/12/2020.
These contracts are shown at fair value under “Other current liabilities” for a total of Euro 189 thousand, relating to the mark to market as at year end.
Adjusting these instruments to fair value as at 31 December 2017 involved booking a profit of Euro 47 thousand to the income statement for the period.
In 2017, the “IRS” transaction, entered in 2012, expired.
Effectiveness testing was carried out as at 31 December 2017 which confirmed the hedging requirements envisaged in IAS 39. The gains on the hedging instrument were therefore recognised in Equity, in accordance with cash flow hedge accounting, for Euro 125.
The impact of IFRS 13 relating to the fair value adjustment to consider the counterparty risk is not significant for the Group's transactions involving financial derivatives.
GUARANTEES AND COMMITMENTS
As at 31 December 2017 the following guarantees had been given:
- for USD 1.2 million in favour of a Kentucky government authority for the exercise of production activities at the Lawrenceburg, KY, plant of Florida Tile;
- for 15 million Rupees in favour of AGL Panaria as bank guarantees (around Euro 0.2 million).
The guarantees received from third parties are specifically disclosed in the notes on the balance sheet captions to which such guarantees refer.
The loan contracts do not contain any covenants.

___________________________________
6) COMMENTS ON THE MAIN INCOME STATEMENT CAPTIONS
6. REVENUES
6.a. Revenues from sales The Group's sales revenues are broken down by geographical area as follows:
31‐Dec‐17 31‐Dec‐16
Italy 75,613 68,998
Abroad 313,821 312,450
(Customer rebates) (4,854) (4,404)
384,580 377,045
Net revenues from sales increased by 2%, from Euro 377,045 thousand as at 31 December 2016 to Euro 384,580 thousand as at 31 December 2017 (Euro +7.5 million).
More details can be found in the directors' report.
6.b. Other revenues “Other revenues” are made up as follows:
31‐Dec‐17 31‐Dec‐16 Change
Expense recoveries (displays, transport)
6,386 6,791 (405)
Gains on the sale of property 185 70 115
Out‐of‐period income 397 261 136
Indemnities for damages suffered 505 760 (255)
Grants 1,325 1,043 282
Energy income 2,609 1,828 781
Capitalisation of own work 576 1,445 (869)
Other 92 1,181 (1,091)
12,075 13,379 (1,306)
% of Value of production 4.4% 3.4% (1.0%)
“Expense recoveries” include transport and sample costs recharged to customers. The item “Capitalisation of own work”, in 2017 recorded at Euro 576 thousand, refers to the in‐house personnel employed for the implementation of the new SAP management platform. “Energy income” includes mainly revenues related to the Parent Company's membership of consortiums that collect and make available gas storage and the availability of the associates' energy burden and income from the remuneration of electricity produced by their own photovoltaic systems, income from the assignment of Energy Efficiency Certificates and income from tariff concessions granted for energy intensive companies and income coming from the trading of the surplus greenhouse gas emission shares (EUA).

___________________________________
The increase for the period is mainly attributable to the collection of the last two instalments of the Energy Efficiency Certificates related to the project implemented by the Parent Company and named “Energy‐efficiency upgrading of Toano furnaces”, completed in 2017. “Grants” refer to the various subsidised amounts, including staff training expense and the current portion of grants received as compensation for damages suffered in the 2012 earthquake (the latter overlap with the amortisation of improvement works carried out and capitalised).
7. COST OF PRODUCTION 7.a. Raw materials “Raw materials” are made up as follows:
31‐Dec‐17 % of V.o.P. 31‐Dec‐16 % of V.o.P.
Raw materials 56,444 13.6% 50,287 12.8%
Finished products 43,106 10.4% 45,480 11.6%
Packaging 14,994 3.6% 12,787 3.3%
Price lists/Catalogues 1,021 0.2% 1,185 0.3%
Change in inventories (728) (0.2)% (354) (0.1)%
Other 24 0.0% 99 0.0%
114,861 27.7% 109,484 28.0%
The increase in this caption, in absolute value, substantially relates to the increase in 2017 production compared to the previous year, already described in the Directors' Report. The item “Finished products” refers to purchases of ceramic material from third parties. 7.b. Services, leases and rentals “Services, leases and rentals” are made up as follows:
31‐Dec‐17 % of V.o.P. 31‐Dec‐16 % of V.o.P.
Property rental 10,295 2.5% 9,570 2.4%
Rent of other fixed assets 5,355 1.3% 4,043 1.0%
Commissions 15,620 3.8% 15,095 3.9%
Utilities 33,062 8.0% 34,155 8.7%
Commercial expenses and advertising 9,471 2.3% 8,688 2.2%
Sub‐contract work 16,183 3.9% 11,552 3.0%
Maintenance 10,227 2.5% 11,702 3.0%
Transportation 27,548 6.6% 26,548 6.8%
Industrial services 8,617 2.1% 7,032 1.8%
Directors' and statutory auditors' fees 784 0.2% 983 0.3%
Consulting fees 6,198 1.5% 4,629 1.2%
Insurance 1,550 0.4% 1,186 0.3%
Travel expenses 4,454 1.1% 3,972 1.0%
Temporary employment 7,044 1.7% 5,699 1.5%
Other 780 0.2% 2,642 0.7%
158,973 38.3% 145,859 37.3%

___________________________________
“Property rental” mainly includes:
- rents of Euro 5,478 thousand that Panariagroup Industrie Ceramiche S.p.A. pays to Immobiliare Gemma S.p.A. (a related party) for use of the land and buildings in which the company carries on its business. The rent contract covers a contractual period of eight years (with tacit renewal on the first expiry for another eight years), for an annual rent initially set at Euro 4,500 thousand, revalued each year according to ISTAT statistics. The economic value of the rent is based on a specific appraisal prepared by an independent expert, which supports the alignment to market values.
- rents that Florida Tile Inc. pays for the land and building of its plant in Lawrenceburg, its head office
and the premises used as branches for the retail sale of finished products amount in total to Euro 4,263 thousand.
- The increase in consulting provided refers mainly to costs related to the start‐up phase of the new ERP SAP system, which has become operative since 2017 for the American companies within the Group.
7.c. Personnel costs Personnel costs passed from Euro 91,999 thousand in the year ended 31 December 2016 (23.5% of value of production) to Euro 94,501 thousand in the year ended 31 December 2017 (22.8% of value of production). Personnel costs can be broken down as follows:
31‐Dec‐17 31‐Dec‐16
Wages and salaries 71,932 70,563
Social security contributions 19,384 17,916
Employee severance indemnities and other funds
2,510 2,408
Other personnel costs 675 1,112
94,501 91,999
The average number of people employed by the Group during the year was as follows:
31‐Dec‐17 31‐Dec‐16
Managers 41 39
Supervisors and white collar workers 673 665
Foremen and blue collar workers 991 952
1,705 1,656
The increased cost is more than proportionate to the increase in “people employed” due to the higher number of hours that the existing employees worked, mainly attributable to the greater use of the production facilities as compared to 2016.

___________________________________
7.d. Other operating expenses “Other operating expenses” are made up as follows:
31‐Dec‐17 % of V.o.P. 31‐Dec‐16 % of V.o.P.
Out‐of‐period expenses 473 0.1% 167 0.0%
Gifts 109 0.0% 46 0.0%
Trade association fees 112 0.0% 104 0.0%
Losses on disposals 16 0.0% 223 0.1%
Indirect taxes 1,412 0.3% 1,236 0.3%
Office equipment 494 0.1% 390 0.1%
Other 1,167 0.3% 1,104 0.3%
3,783 0.9% 3,270 0.8%
8. DEPRECIATION, AMORTISATION AND PROVISIONS 8.a. Depreciation and amortisation Amortisation/depreciation rose compared to 2016, up from Euro 19,360 thousand as at 31 December 2016 to Euro 22,089 thousand as at 31 December 2017 as a result of investments made in the last three years. It should be noted that no changes were made to either the rates or the original repayment plans. 8.b. Provisions and impairment “Provisions and impairment”, amounting to Euro 1,732 thousand, include allocations to the provision for slow‐moving and obsolete goods for Euro 836 thousand, against allocations to the provision for future charges estimated at Euro 310, write‐downs of receivables for Euro 160 thousand and allocations for agents’ termination indemnities for Euro 426 thousand.
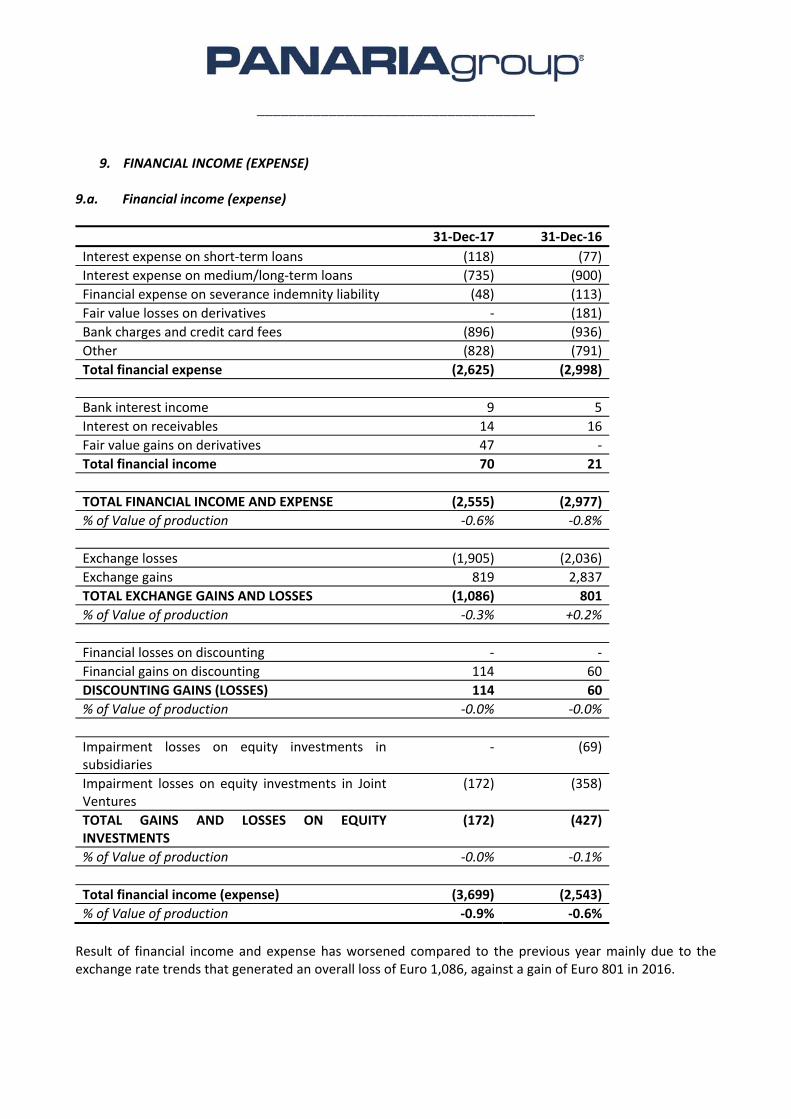
___________________________________
9. FINANCIAL INCOME (EXPENSE)
9.a. Financial income (expense)
31‐Dec‐17 31‐Dec‐16
Interest expense on short‐term loans (118) (77)
Interest expense on medium/long‐term loans (735) (900)
Financial expense on severance indemnity liability (48) (113)
Fair value losses on derivatives ‐ (181)
Bank charges and credit card fees (896) (936)
Other (828) (791)
Total financial expense (2,625) (2,998)
Bank interest income 9 5
Interest on receivables 14 16
Fair value gains on derivatives 47 ‐
Total financial income 70 21
TOTAL FINANCIAL INCOME AND EXPENSE (2,555) (2,977)
% of Value of production ‐0.6% ‐0.8%
Exchange losses (1,905) (2,036)
Exchange gains 819 2,837
TOTAL EXCHANGE GAINS AND LOSSES (1,086) 801
% of Value of production ‐0.3% +0.2%
Financial losses on discounting ‐ ‐
Financial gains on discounting 114 60
DISCOUNTING GAINS (LOSSES) 114 60
% of Value of production ‐0.0% ‐0.0%
Impairment losses on equity investments in subsidiaries
‐ (69)
Impairment losses on equity investments in Joint Ventures
(172) (358)
TOTAL GAINS AND LOSSES ON EQUITY INVESTMENTS
(172) (427)
% of Value of production ‐0.0% ‐0.1%
Total financial income (expense) (3,699) (2,543)
% of Value of production ‐0.9% ‐0.6%
Result of financial income and expense has worsened compared to the previous year mainly due to the exchange rate trends that generated an overall loss of Euro 1,086, against a gain of Euro 801 in 2016.

___________________________________
Financial income and expense ‐ Sensitivity analysis As previously stated in the section on “Financial risks”, the Group is exposed to certain types of market risk, such as interest rate risk and exchange rate risk. The following is a sensitivity analysis to show the impact on the 2017 financial statements (pre‐tax profit) in the event that interest rates or exchange rates fluctuate. Interest rates
Rate Higher (Lower) Pre‐tax profit € mln
+ 0.50% (0.5)
+ 1.00% (1.0)
+ 1.50% (1.5)
+ 2.00% (1.9)
Exchange rates (EUR/USD)
Rate Higher (Lower)
Pre‐tax profit € mln
1.00 +3.0
1.10 +0.6
1.20 ‐1.5
1.30 ‐3.2
1.40 ‐4.7
* Hypothesis of a constant interest rate over the entire period

___________________________________
10. INCOME TAXES
10.a. Income taxes Income taxes for the financial year were Euro 3,863 thousand. A reconciliation of the main differences between the theoretical tax charge and the actual tax charge is given below.
During 2017, the US companies adjusted their deferred tax assets and liabilities to the new tax rate, which will be effective as from 2018, following the tax reform of December 2017 (reduction of tax rates from 35% to 21%).
Reconciliation between the theoretical tax rate and the actual tax rate
(in thousands of Euro)
THEORETICAL TAX RATE ‐ ITALIAN TAXATION
A Pre‐ Tax profit 6,347
B Personnel costs 50,913
C Net finance costs 3,010
D IRAP deductions for tax wedge 49,354
Theoretical
tax
Theoretic
al "Tax
Rate"
A Theoretical taxable income for IRES purpose 6,347 1,523 24.00%
A+B+C+D Theoretical taxable income for IRAP purpose 10,916 426 3.90%
CF1 Theoretical Tax Charge ‐ ITALIAN TAXATION 1,949 30.71%
THEORETICAL TAX RATE ‐ PORTUGUESE TAXATION
Theoretical
tax
Theoretic
al "Tax
Rate"
A Theoretical taxable income for IRC purpose 7,752 1,628 21.00%
CF2 Theoretical Tax Charge ‐ PORTUGUESE TAXATION 1,628 21.00%
THEORETICAL TAX RATE ‐ US TAXATION
Theoretical
tax
Theoretic
al "Tax
Rate"
A Theoretical taxable income for Federal + State Taxes purposes 863 337 39.00%
CF3 Theoretical Tax Charge ‐ US TAXATION 337 39.00%
THEORETICAL TAX RATE ‐ TOTAL
CF1 + CF2 + CF3 Theoretical Tax Charge ‐ TOTAL 3,913 25.71%
No taxation of earthquake grants (249) ‐1.64%
Tax effect on consolidation entry 285 1.87%
Italian's allowance for corporate equity (ACE) (34) ‐0.22%
IRES Non‐deductible costs 192 1.26%
IRAP Non‐deductible costs 239 1.57%
Benefit from fiscal consolidation (115) ‐0.76%
Dividends ‐ taxation 5% (339) ‐2.23%
Difference (29) ‐0.19%
ACTUAL tax charge 3,863 25.38%

___________________________________
BASIC AND DILUTED EARNINGS (LOSSES) PER SHARE As required by IAS 33, the basic earnings per share of Euro 0.25 (earnings of Euro 0.247 per share as at 31 December 2016) is disclosed at the foot of the income statement. Basic and diluted earnings (losses) per share are the same because there are no diluting factors. SIGNIFICANT NON‐RECURRING EVENTS AND TRANSACTIONS No events/transactions worthy of note were recorded during the year that fall under the scope of CONSOB Communication DEM/6064293 of 28 July 2006. The Company's management has interpreted “significant non‐recurring events and transactions” to mean those falling outside the normal course of business. POSITIONS OR TRANSITIONS ARISING FROM ATYPICAL AND/OR UNUSUAL TRANSACTIONS No events/transactions were recorded during the year that fall under the scope of CONSOB Communication DEM/6064293 of 28 July 2006. As specified in this Communication “atypical and/or unusual transactions mean those transactions which by virtue of their significance/size, nature of the counterparties, purpose of the transaction, method of determining the transfer price and timing (proximity to year end) may give rise to doubts concerning: the fairness/completeness of the information contained in the financial statements, conflicts of interest, the safekeeping of company assets, and the protection of minority shareholders”.

___________________________________
RELATED PARTY TRANSACTIONS
The “Regulation containing instructions on related‐party transaction”, adopted by CONSOB Resolution 17221 of 12 March 2010 and subsequently amended by CONSOB Resolution 17389 of 23 June 2010 implemented art. 2391‐bis of the Italian Civil Code. By resolution on 23 April 2014, the Board implemented the procedure on related parties, which takes account of the additional instructions on how to apply the new rules provided in CONSOB Communication DEM/10078683 of 24 September 2010. The purpose of this procedure is to lay down the approach to be taken in identifying, reviewing and approving transaction to be carried out by Panariagroup, or by its subsidiaries, with related parties to ensure that they are transparent and fair from both a substantial and procedural point of view. The identification of transactions with related parties is based on CONSOB Regulation. The Group have transactions with related parties, mainly the parent company Finpanaria S.p.A. (Parent company that does not exercise any management and coordination) and to Immobiliare Gemma S.p.A. (Affiliated company, controlled by Finpanaria), as well as persons responsible for administration and management, their family members and any companies controlled by them. The transactions include commercial and real property referred to the rental of real estate where parent company operates and guarantees. In 2017 there were no transactions with related parties other than Finpanaria S.p.A. and Immobiliare Gemma S.p.A. Operation with related parties are described below: INCOME STATEMENT (in thousands of euro)
REVENUES Finpanaria Imm. Gemma Total
Services 32 26 58
Total revenues 32 26 58
Revenues for services refer to consulting provided by the Ultimate Parent Company to Finpanaria S.p.A. and Immobiliare Gemma for administrative and organisational services.
COSTS Finpanaria Imm. Gemma Total
Rental expense ‐ 5,478 5,478
Commission for guarantees given 6 94 100
Total costs 6 5,572 5,578
Rental expense refers to the rents paid for all of the buildings used for Panariagroup Industrie Ceramiche S.p.A.’s production and logistics activities. Commissions are a consideration for the guarantees received, which are described in the “due to banks ‐ non‐current”.

___________________________________
In accordance with CONSOB Communication DEM/6064293, the impact of related party transactions on the Company's results and cash flows is shown below:
% of Value of
Production
% of pre‐tax profit
% of operating cash flow*
Revenues 0.01% 0.38% 0.17%
Costs 1.34% 36.65% 16.52%
* before changes in working capital BALANCE SHEET (in thousands of euro)
Finpanaria Imm. Gemma Total
Receivables ‐ ‐ ‐
Payables ‐ ‐ ‐
Due from (to) tax authorities
1,729 ‐ 1,729
Net receivable (payable) 1,729 ‐ 1,729
As regards Receivables due to Finpanaria, of a tax nature, the parent company reports a tax receivable of the same amount, still not collected. All related party transactions are carried out on an arm's length basis. In this connection, we would call your attention to the fact that a procedure on related‐party transactions is now in place in accordance with the CONSOB Regulation adopted with Resolution 17221 of 12 March 2010 and subsequent amendments and additions.
___________________________________
ATTACHMENTS
The following attachments contain additional information to that provided in the explanatory notes, of which they form an integral part:
Statement of changes in intangible assets and goodwill from 1 January 2016 to 31 December 2017
Statement of changes in property, plant and equipment from 1 January 2016 to 31 December 2017
Statement of changes in net financial position
Directors and Officers
Disclosure required by article 149‐duodecies of the CONSOB Issuers’ Regulation
Certification of the consolidated financial statements in accordance with art. 81‐ter of CONSOB Regulation 11971 of 14 May 1999 and subsequent amendments and additions
Sassuolo, 16 March 2018 The Chairman of the Board of Directors EMILIO MUSSINI

___________________________________
EXPLANATORY NOTES ‐ ATTACHMENT 1
Statement of changes in intangible assets and goodwill from 1 January 2016 to 31 December 2017

___________________________________
Panariagroup ‐ Consolodated financial statements
Statement of changes in intangible assets and goodwill
from 1 January 2016 to 31 December 2017
(in thousands of Euro)
Concessions, Intangible Other intangible TOTAL
licenses, assets assets INTANGIBLE GOODWILL
trademarks in progress ASSETS
Balance at 1 January 2016 2,404 3,189 ‐ 5,593 8,139
Net increases 337 8,440 8,777 ‐
Net drecreases and impairment 0 ‐
Amortisation (562) (562) ‐
Reclassifications (71) 127 56 ‐
Exchange differences on foreign subsidiaries 42 61 103 ‐
Balance at 31 December 2016 2,150 11,817 ‐ 13,967 8,139
Net increases 395 1,876 2,271 ‐
Net drecreases and impairment 0 ‐
Amortisation (1,230) 0 (1,230) ‐
Reclassifications 6,341 (6,097) 244 ‐
Exchange differences on foreign subsidiaries (173) (840) (1,013) ‐
Balance at 31 December 2017 7,483 6,756 ‐ 14,239 8,139

___________________________________
EXPLANATORY NOTES ‐ ATTACHMENT 2
Statement of changes in property, plant and equipment from 1 January 2016 to 31 December 2017

___________________________________
Panariagroup ‐ Consolodated financial statements
Statement of changes in tangible asset
from 1 January 2016 to 31 December 2017
(in thousands of Euro)
Land Plant Equipment Construction
and and and in progress Total
buildings Machinery Other Assets and advances
Balance at 1 January 2016 24,855 54,254 15,289 14,717 109,115
Net increases 437 14,122 5,070 9,678 29,307
Net drecreases and impairment (676) (4) (41) ‐ (721)
Amortisation (928) (13,861) (4,009) ‐ (18,798)
Reclassifications ‐ 12,861 924 (13,841) (56)
Exchange differences on foreign subsidiaries ‐ 510 202 36 748
Balance at 31 December 2016 23,688 67,882 17,435 10,590 119,595
Net increases 2,404 14,244 8,240 7,220 32,108
Net drecreases and impairment (32) (21) ‐ ‐ (53)
Amortisation (1,088) (14,776) (4,995) ‐ (20,859)
Reclassifications ‐ 8,042 7,482 (15,768) (244)
Exchange differences on foreign subsidiaries ‐ (2,420) (910) (1,212) (4,542)
Balance at 31 December 2017 24,972 72,951 27,252 830 126,005

___________________________________
EXPLANATORY NOTES ‐ ATTACHMENT 3
Statement of changes in net financial position

___________________________________
Details of net financial position are provided in accordance with CONSOB Communication DEM/6064293 of 28 July 2006:
The Group does not have any negative pledges and covenants on debt positions outstanding at the end of the year.
PANARIAGROUP
CONSOLIDATED FINANCIAL STATEMENTS
NET FINANCIAL POSITION
(THOUSANDS OF EURO)
31‐Dec‐2017 31‐Dec‐2016
A Cash (53) (105)
B Other Cash and cash equivalents (7,103) (16,890)
C Securities held for sale 0 0
D Liquidity (A+B+C) (7,156) (16,995)
E Short‐term financial assets (1,129) (1,285)
F Due to banks 3,979 14,154
G Current portion of long‐term loans 19,672 21,654
H Other short‐term financial debt 2,140 1,982
I Short‐term financial indebtedness (F+G+H) 25,791 37,790
J Net short‐term financial indebtness 17,506 19,510
K Non‐current portion of long‐term loans 78,988 60,694
L Due to bondholders 0 0
M Other long‐term financial debt 21,805 26,293
N Long‐term financial indebtedness (K+L+M) 100,793 86,987
Z Long‐term financial assets (18,898) (22,785)
O Net financial indebtness (J+N+Z) 99,401 83,712

___________________________________
EXPLANATORY NOTES ‐ ATTACHMENT 4
Directors and Officers

___________________________________
EXPLANATORY NOTES ‐ ATTACHMENT 5
Name Office Powers
Emilio Mussini Chairman of the Board and Managing Director Ordinary administration of Panariagroup Industrie
Ceramiche S.p.A.
Paolo Mussini Deputy Chairman of the Board and Managing
Director
Ordinary administration of Panariagroup S.p.A. acting as
deputy to the Chairman and Ordinary administration of the
Cotto d'Este Division.
Andrea Mussini Deputy Chairman of the Board Ordinary administration of Panariagroup S.p.A. acting as
deputy to the Chairman
Giuliano Pini Managing Director Ordinary administration of Panariagroup Industrie
Ceramiche S.p.A.
Giuliano Mussini Director Non‐executive
Silvia Mussini Director Non‐executive
Daniele Prodi Director Non‐executive
Sonia Bonfiglioli Director Independent non‐executive
Tiziana Ferrari Director Independent non‐executive
Francesca Bazoli Director Independent non‐executive
Powers of extraordinary administration are held exclusively by the Board of Directors in its entirety.
The board of Directors'term in office expires at the AGM that approves the 2017 financial statement.
For details of the remuneration of the Directors, please refer to the "Report of the Board on the remuneration"
Name Office
Sergio Marchese Chairman of the Board of Statutory Auditors
Francesca Muserra Standing Auditor
Piergiovanni Ascari Standing Auditor
Vittorio Pincelli Alternate Auditor
Fabrio Andreoli Alternate Auditor
Compensation Commitee
Name
Sonia Bonfiglioli
Tiziana Ferrari
Daniele Prodi
Internal Control Commitee
Name
Tiziana Ferrari
Sonia Bonfiglioli
Daniele Prodi
Supervisory board
Name
Francesco Tabone
Paolo Onofri
Bartolomeo Vultaggio
Independent Auditors
EY S.p.A.
Board of Directors
Board of Statutory Auditors

___________________________________
Disclosure required by article 149‐duodecies of the CONSOB Issuers’ Regulation

___________________________________
Type of services Party providing the services RecipientFees earned in
2017
Auditing EY S.p.A. Panariagroup S.p.A. 134
EY S.p.A. Panariagroup USA e subsidiaries (* 79
Deloitte & Touche s.a. Gres Panaria Portugal s.a. (*) 30
Exepenses on auditing ser EY S.p.A. Group 48
Other services EY S.p.A. Panariagroup S.p.A. 17
Total 308
(*) Wholly owned (direct and indirect) by Panariagroup S.p.A.

___________________________________
EXPLANATORY NOTES ‐ ATTACHMENT 6
Certification of the consolidated financial statements in accordance with art. 81‐ter of CONSOB Regulation 11971 of 14 May 1999 and subsequent amendments and additions

___________________________________
ATTACHMENT 3C‐ter
Certification of the consolidated financial statements in accordance with art. 81‐ter of CONSOB Regulation 11971 of 14 May 1999 and subsequent amendments and additions
1. The undersigned, Paolo Mussini, Emilio Mussini and Giuliano Pini, as Managing Directors, and Damiano Quarta, as Financial Reporting Manager of Panariagroup Industrie Ceramiche S.p.A., taking into account the provisions of art. 154‐bis, paragraphs 3 and 4 of Legislative Decree no. 58 of 24 February 1998, hereby certify:
the adequacy in relation to the characteristics of the firm and
the actual application of the administrative and accounting procedures for the formation of the financial statements during the period ended 31 December 2017.
2. No matters of particular importance in this regard arose during the period.
3. We also certify that:
3.1 the Consolidated Financial Statements:
a) have been prepared under the applicable international accounting standards endorsed by the European Union, pursuant to EC Regulation no. 1606/2002 of the European Parliament and of the Council of 19 July 2002;
b) agree with the balances shown in the books and accounting entries;
c) give a true and fair view of the equity, economic and financial position of the Issuer and all companies included in the consolidation.
3.2 The Directors' Report includes a reliable analysis of performance and the results of operations, and of the general situation of the Issuer and the companies included within the scope of consolidation, together with a description of the principal risks and uncertainties to which they are exposed.
Sassuolo, 16 March 2018
Managing Directors Financial Reporting Manager Paolo Mussini Damiano Quarta Emilio Mussini Giuliano Pini

___________________________________
Financial Statement of the companies extra‐UE
Panariagroup Industrie Ceramiche Spa

PANARIAGROUP USA
CONSOLIDATED BALANCE SHEET
(THOUSANDS OF DOLLARS)
ASSETS 31‐dec‐2017 31‐dec‐2016
NON‐CURRENT ASSETS 81,187 81,254
Goodwill 0,000 0,000
Intangible assets 9,183 9,238
Property, plant and equipment 44,246 42,399
Financial assets 22,734 24,088
Deferred tax assets 4,770 5,085
Other non‐current assets 0,254 0,444
CURRENT ASSETS 86,884 77,736
Inventories 59,340 50,082
Trade Receivables 19,909 19,280
Due from tax authorities 3,121 1,819
Other current assets 2,417 2,356
Cash and cash equivalents 2,097 4,199
TOTAL ASSETS 168,071 158,990
LIABILITIES 31‐dec‐2017 31‐dec‐2016
EQUITY 67,686 63,020
Share capital 63,020 63,020
Capital Reserves 3,940 (2,882)
Net Profit 0,726 6,822
NON‐CURRENT LIABILITIES 57,959 38,585
Employee severance indemnities ‐ ‐
Deferred tax liabilities 6,278 6,413
Provisions for risks and charges 0,315 0,302
Due to banks and other sources of finance 50,584 31,078
Other non‐current liabilities 0,782 0,792
CURRENT LIABILITIES 42,426 53,445
Due to banks and other sources of finance 3,063 8,510
Trade payables 32,299 41,333
Due to tax authorities 1,091 0,793
Other current liabilities 5,973 2,809
TOTAL LIABILITIES 100,385 92,030
TOTAL LIABILITIES AND EQUITY 168,071 158,990

PANARIAGROUP USA
CONSOLIDATED FINANCIAL STATEMENT(THOUSANDS OF DOLLARS)
REVENUES FROM SALES AND SERVICES 149,850 90,4% 157,041 97,0%
Change in inventories of finished products 10,490 6,3% (2,228) ‐1,4%
Other revenues 5,374 3,2% 7,149 4,4%
VALUE OF PRODUCTION 165,714 100,0% 161,962 100,0%
Raw materials (65,192) ‐39,3% (64,820) ‐40,0%
Services, leases and rentals (51,670) ‐31,2% (43,354) ‐26,8%
Personnel costs (36,284) ‐21,9% (33,710) ‐20,8%
Other operating expenses (1,456) ‐0,9% (1,623) ‐1,0%
PRODUCTION COSTS (154,602) ‐93,3% (143,507) ‐88,6%
GROSS OPERATING PROFIT 11,112 6,7% 18,455 11,4%
Amortisation and depreciation (7,308) ‐4,4% (5,618) ‐3,5%
Provisions and writedowns (0,916) ‐0,6% (0,892) ‐0,6%
NET OPERATING PROFIT 2,888 1,7% 11,945 7,4%
Financial income (expense) (1,914) ‐1,2% (1,000) ‐0,6%
PRE‐TAX PROFIT 0,974 0,6% 10,945 6,8%
Income taxes (0,248) ‐0,1% (4,123) ‐2,5%
NET PROFIT 0,726 0,4% 6,822 4,2%
31‐dec‐2017 31‐dec‐2016