
Ethics Education: Considerations for Development and Evaluation

CONSIDERATIONS FOR THE COLLECTION AND EVALUATION OF
NATURAL ATTENUATION PARAMETERS AT SITES CONTAMINATED WITH
CHLORINATED SOLVENTS
Chlorine • Hydrogen • Carbon • Bond "\.
( . . ~
I Vinyl Chloride I
I Cis-1,2-Dichloroethene I ITrichloroethene I
.,. ISource Area Downgradient Area
Filure 3 Anaerobic Reductive Dechlorination ofa Trichloroethene Plnm.e
Biological Active Area
Prepared by Florida Department of Environmental Protection (FDEP)
Division of Waste Management Bureau of Waste Cleanup
Hazardous Waste Cleanup Section April 1999

TABLE OF CONTENTS
SECTION TITLE PAGE
1.0 IN'TR.ODUCTION ........................................................................................ 1 ~
2.0 GENERAL OVERVIEW OF CHLORINATED ALIPHATIC HYDROCARBON BIODEGRADATION ................................................. 2
2.1 Bacteria 2.2 Electron Acceptor Reactions 2.3 Electron Donor Reactions 2.4 Co-Metabolism
3.0 NATURAL ATTENUATION BY PHYSICAL PROCESSES ................... 4
4.0 METABOLIC BY-PRODUCTS AND REDOX PROCESSES IN GROUNDWATER SYSTEMS ................................................................... 4
S.O EVIDENCE USED TO SUPPORT NATURAL ATTENUATION •••••••••• S 5.1 Direct Evidence S.2 Examine Changes 5.3 Laboratory microcosm studies
6.0 METHODOLOGY USED FOR DATA REVIEW AND SITE EVALUATION........................................................................................... 6
7.0 NATURAL ATTENUATION SAMPLING AND DATA EVALUATION METHODOLOGY..................................................................................... 9
7.1 Monitor Well Placement and Sampling 7.2 Evaluation of Biological Mediated Natural Attenuation Data
8.0 MONITORING THE EFFECTIVENESS OF NATURAL ATTENUATION ........................................................................................ 11
9.1 Estimation of Biodegradation Rate 9.2 Estimation of Overall Natural Attenuation Rate
9.0 MONITORED NATURAL ATTENUATION REPORTS ........................ 12
REFERENCES.................................................................................................... 14

Figures
Figure 1: Natural Attenuation of Chlorinated Solvents in Groundwater Figure 2: Common Degradation Pathways Figure 3: Anaerobic Reductive Dechlorination of a Trichloroethene Plume Figure 4: Reductive Dechlorination (Chemical Sequence Example) Figure S: Common Patterns of Chlorinated Solvent Biodegradation in a
Sequential Aerobic/ Anaerobic System Figure 6: Redox Potential
Tables
Table 1: Geochemical Parameters Table 2: Contaminants and Daughter Products Table 3: Data Elements Table 4: Natural Attenuation Parameters and Test Methods Table S: Analytical Parameters and Data Evaluation
LIST OF APPENDICES
Appendix A
GLOSSARY OF TERMS
Please direct all comments and questions concerning this document: FDEP Judie A. Kean, Project Manager, HWC MS4520 2600 Blairstone Road Tallahassee, Florida 32399 850-488-0190.

CONSIDERATIONS FOR THE COLLECTION AND EVALUATION OF NATURAL ATTENUATION PARAMETERS AT SITES CONTAMINATED WITH CHLORINATED
SOLVENTS
(This document is an aggregation of technical information, compiled from professional journals and presentations on natural attenuation. It has been prepare<l by the Hazardous Waste Cleanup Section of the Bureau of Waste Cleanup as a resource for the Department staff and Department contractors for evaluating and assessing drycleaning solvent contamination sites. This document is not intended to serve as a regulatory standard or to supercede any specific regulatory requirements.)
1.0 INTRODUCTION
The intent of this document is to provide a resource for collection of site characterization parameters, analytical methods, sampling techniques and data evaluation procedures which may be necessary in considering natural attenuation as a remediation tool at sites contaminated with chlorinated solvents. This document does not include a detailed discussion of the natural attenuation processes; however it does present a logical approach to the evaluation, substantiation, feasibility, and appropriateness of implementing natural attenuation at a site as part of, or as the sole remedial approach. Since information from field studies and research regarding natural attenuation of chlorinated solvents is ongoing, this guide will be revised as necessary.
The applicability of implementing Monitored Natural Attenuation (MNA) as a remedial strategy at a drycleaning site will include considerations regarding the presence of free product, contaminated soil, groundwater contaminant concentrations, physical, chemical, and biological characteristi,cs ofeach contaminant, trend analysis, temporary points ofcompliance, and overall technical evaluation. The proposed drycleaning rule, F.A.C. Chapter 62-782 provides information regarding these specific site considerations.
Natural attenuation refers to naturally-occurring processes in soil and groundwater that act without human intervention to reduce contamination. The processes that may contribute to plume attenuation are physical, chemical and biological. Natural attenuation is the combined effect of dispersion, dilution, volatilization, sorption, chemical reactions with subsurface materials, and biodegradation of dissolved contaminants in the groundwater and soil. Intrinsic bioremediation or biodegradation is used to describe the natural biological process that leads to contaminant degradation and is the only process that actually results in significant contaminant destruction during natural attenuation.
MNA is considered an approach to site rehabilitation that allows natural processes to contain the spread ofcontamination and reduce the concentrations of contaminants in groundwater and soil. This approach should be substantiated by site specific assessment information including data evaluation and interpretation, and long-term monitoring. MNA may be used in conjunction with other engineered remedies. Natural attenuation should not be considered a "no action" alternative to site rehabilitation, but rather a remedial approach which focuses on the verification and monitoring ofnatural remediation processes. Natural attenuation processes should be evaluated
-1

prior to, and along with, the engineered approaches to ensure the compatibility of an engineered solution to the existing site natural attenuation processes. Performance monitoring is an important component ofMNA. Figure 1, Natural Attenuation of Chlorinated Solvents in Groundwater, illustrates several processes ofnatural attenuation.
,, 2.0 GENERAL OVERVIEW OF CHLORINATED ALIPHATIC
HYDROCARBON BIODEGRADATION
Over the past decade, numerous laboratory and field studies have demonstrated that subsurface microorganisms can degrade hydrocarbons and chlorinated solvents. Microorganisms are abundant in the environment and may represent a population range of 105 -107 bacteria in every gram of soil.
2.1 Bacteria
Bacteria may form resting stages in growth patterns (spores) and have the ability to survive in extreme environments for many years. Like all organisms, bacterial growth depends upon food, energy and water. In clean groundwater, there is usually enough oxygen that the electron donor (food) is the factor which limits bacterial growth.
Some bacteria may use several electron donors such as small molecules like sugar, acids, alcohols, man-made compounds, natural organic carbon and hydrogen. Other bacteria use only one or two electron acceptors such as 02, N03, Mn (IV), Fe+3
, S04, CO2, and Chlorinated Solvents.
Chlorinated ethenes, perchloroethene (PCE), trichloroethene {TCE), dichloroethene (DCE), and vinyl chloride (VC) are biodegraded under natural conditions through a variety of processes. These processes can include reductive and oxidative pathways which transform the chlorinated ethenes to carbon dioxide (CO2) and chloride (Cl} Figure 2, Common Degradation Pathways, provides a visual aid for understanding the degradation process incorporating both abiotic and biotic pathways. Quantification ofnatural biodegradation requires a thorough understanding of the interactions between the inorganic electron acceptors, organic carbon, chlorinated aliphatic hydrocarbons and physical hydrogeology.
2.2 Electron Acceptor Reactions - Reductive Dechlorination (Anaerobic Biodegradation)
An electron acceptor is a compound which gains electrons during biodegradation. As noted by several research programs (1, 2, 4, 12, 22), under anaerobic conditions highly chlorinated ethenes such as PCE and TCE are subject to reductive dechlorination, which is an electron acceptor reaction. This is a biologically (biotic) mediated transfer of two electrons to the main compound. This is the most important process for the natural biodegradation of the more chlorinated solvents (i.e., PCE and TCE). The chlorinated hydrocarbon serves as an electron acceptor and the chlorine atom is removed and is replaced with a hydrogen atom:
PCE => TCE+ + Cl - => DCE +i + 2 Cl - => VC +3 + 3Cl - => ethene +4+ 4CI - (2) FAST-------->--->--------SLOW

I
Abiotlc
Advection
Dispersion
Sorption I Volatilization r-
INatural Attenuation of PCE I
l Diffusion
Dilution
Chemical Reaction
Biotic
Anaeroblc/Cometabollc Giving Electrons to thel I r•roblc (Oxidation) Chlorine Atoms Taking electrons from
the carbon
Nitrate Reduction Methanotropic
Iron Reduction
Sulfate ~eduction
Carbon Dioxide Reduction
Figure 1 Natural Attenuation of Chlorinated Solvents in Groundwater

Adapted from Sajeed Jamal, Beak International Inc., 1997-Draft EPA Region 4 "Suggested Practices for Evaluation of a Site for Natural Attenuation... "
Carbon Tetrachloride
Tetrachlorethene
I I Reductive Dechlorination
• t ------- .., -~-ri-ch-1-or'""oe-th_e_n_e__
Chloroform 1,1, 1-Trichloroethane 1,1,2-Trichloroethane
Elimination
Reductive Dechlorination
------- ...--------.• •I I
1,2-Dichloroethane- - - Dichloromethane
Anaero~lc Oxidation I Reductive Dechlorination Reductive Dechlorination
Hydrolysisi • I ... DI-halo Elimination------- -------- .-- •Chloromethane - I
Chloroethane
I Reductive Dechlorination Reductive Dechlorination ......____Hydrolysis
t I+ Acetic Acid Methane Ethene Acetic Acid Ethane Ethanol I I 11 Ethene I11
CO2
Biotic reactions (Anaerobic Conditions) ..... Abiotic reactions (Anaerobic or aerobic conditions) ......... Aerobic cometabolism to CO2 in presence of toluene ~ Aerobic mineralization to CO2
FIGURE2 COMMON DEGRADATION PATHWAYS

Reductive dechlorination generally occurs sequentially as illustrated above. Thus, reductive dechlorination of chlorinated solvents results in a proliferation of daughter products and an increase in the concentration of chloride ions. The rate ofreductive dechlorination has been observed to decrease as the degree of chlorination decreases; vinyl chloride being the least susceptible to reductive dechlorination (13, 14). The transformation ofDCE to VC and VC to ethene requires higher reducing conditions. Therefore, under specific site co1>ditions, natural attenuation by biotic processes may not proceed to completion and, as a result, intermediate compounds may accumulate (13, 14).
Figure 3, Anaerobic Reductive Dechlorination, (Cover page of document), illustrates the sequential dechlorination ofa trichloroethene plume and Figure 4 , Reductive Dechlorination , illustrates the degradation of PCE and the interactive processes of the electron donors, degradation products, and environmental conditions.
The efficiency ofreductive dechlorination differs for methanogenic (C~), sulfate-reducing (SO/2
), iron-reducing (Fe+3), or nitrate-reducing (NO/2
) conditions. The dechlorination ofPCE and TCE to DCE will occur under milder reducing conditions. Figure 5, Common Patterns of Chlorinated Solvent Biodegradation in an Anaerobic System, illustrates the intricacy of the degradation process and transitional substrates and degradation products.
Until recently, it was commonly believed among researchers that vinyl chloride would not degrade under anaerobic conditions and would accumulate; however, it has now been documented that vinyl chloride can be degraded under both aerobic and anaerobic conditions if the necessary electron acceptors, organic carbon and subsurface microorganisms are present. Recent research has shown that there is evidence ofmineralization ofvinyl chloride under iron-reducing conditions so long as there is sufficient bioavailable ferric iron (Fe+3)(4).
2.3 Electron Donor Reactions - Aerobic Biodegradation
Illustrated below are two equations demonstrating that facilitating microorganisms obtain energy and organic carbon from the degraded aliphatic chlorinated hydrocarbon (20). Under aerobic conditions, DCE and VC can be oxidized to CO2 (2, 19):
DCE + 202 > 2C02 + 2ft +2 er and
vc + 202 -> 2co2 + Ir + er
The anaerobic conditions include either methanogenic, sulfate-reducing or iron-reducing conditions and include the following general reactions:
Sulfate- and iron (Fe+3)-reducing PCE, TCE => DCE Methanogenic only DCE===>VC Methanogenic only VC ===:> Ethene
The aerobic conditions include: DCE, VC =>2C02 and Cr

2.4 Co-metabolism
The degradation of a chlorinated aliphatic hydrocarbon can be catalyzed by the presence of an enzyme or co-factor that is produced by an organism for other purposes (20). For example, during co-metabolism, trichloroethene is indirectly transformed by various microbial enzymes during the biodegradation of methane, toluene, phenol, or ammonia. The organism receives no known benefit nor does trichloroethene enhance the degradation ofBTEX or other carbon sources. Co-metabolism is not a stable process and has been best documented in aerobic conditions, although it can occur under anaerobic conditions (14, 15, 18, 20).
3.0 NATURAL ATTENUATION BY PHYSICAL PROCESSES
The primary physical processes ofnatural attenuation include dispersion and dilution. Field observations have indicated that contaminant concentrations decline in a pattern which is consistent with the soil and/or groundwater processes. For example, groundwater flow direction and high hydraulic conductivity would indicate contaminant concentration decline along a particular flow path. It has been documented that both dispersion and dilution processes exhibit minor depletion of oxygen and redox potential values which may occur in the source area. However, values for most other field and inorganic parameters will not change significantly. Generally, site characteristics which may facilitate the attenuation processes include coarse sand and gravel, high groundwater flow and shallow fractured bedrock systems (28).
4.0 METABOLIC BY-PRODUCTS AND REDOX PROCESSES IN GROUNDWATER SYSTEMS
Redox potential (ORP) is a measure of electron activity and an indicator of the tendency of a solution to accept or transfer electrons. Groundwater reactions involving chlorinated solvents are usually biologically mediated, and the oxidation-reduction potential depends on and influences the rate of biodegradation. Additionally, some biological processes operate only within a specific range of redox conditions .. The possible redox potential for reductive dechlorination ranges from approximately -400 to 800 millivolts (m V). Figure 6, Redox Potential, indicates typical redox conditions for groundwater with different electron acceptors.
It is evident that one of the keys in understanding and evaluating the biodegradation of chlorinated ethenes is to provide accurate delineation of red ox conditions and metabolic by-product concentrations in the groundwater at the site. Listed below are several generalized equations which indicate several common redox reactions in groundwater: (2)
REACTION SYSTEM TYPE
1. 02 + CH20 =>CO2+ H20 Aerobic Respiration • Solubility of oxygen in water is -10 mg/I Measured by 0 2 depletion and
CO2 production.
4

----
I
REDUCTIVE DECHLORINATION PCE
CL ANAEROBIC '-- C = C / _ENVIRONMENT
..-------,----C--.L _.--1 --..CL ELECTRON DONOR
EASIEST- RATE OF REACTION CONTROLED BY CARBON SOURCE TCE
CL H --..C= C _.--
elf ~ I ELECTRON DONOR
I
C1S 1,-2 DCE trans 1,2 DCE 1,1 DCE . BIOLOGICAL DCE IS MANUFACTURED DCE 80-100% IS MOSTLY 1,1 DCE
CL CL H CL H ' C=C/ -.._ C=C_.-- -.._ C= C----/ ' H H H ---- ---- ----H
ELECTRON DONOR ' ~ ,-HARD--E-S_T_
VINYL CHLORIDE
H HAEROBIC ENVIRONMENT AEROBIC ENVIRONMENT
MUST HAVE ELECTRON --..C= C_.--_.--
ACCEPTORS:CL HNOTE: VC MAY BE MINERALIZED OXYGEN
UNDER ANAEROBIC CONDITIONS NITRATE
REDUCTIVE DECHLORINATION FIGURE4

(+)
'
Mass ORP
Background Source Downgradient (-)
In the anaerobic zone PCE is dechlorinated to TCE, DCE, VC and Ethene. The dechlor ination rate is insufficient to cause all of the TCE and DCE to be dechlorinated in the anaerobic zone. These chemicals along with methane, ethene and vinyl chloride migrate i nto the transition a n d aerobi c zone.
~-----L ~· : '\
-
Mass
Background Source Downgradient Due to the metabolism in the source area, an anerobic zone has developed in the groundwater system . Methanogenic, sulphate-reducing, and acetogenic bacteria are active to cause TCE and DCE to be dechlorinated in the anaerobic zone. Several geochemical parameters are good indicators of bacteria metabolism. Ethene and VC are mineralized to CO2 by aerobic bacteria in the aerobic zone . (Adapted f rom ITRC-Natural Attenuation of Chlorinated Solvents in Groundwater- Training Course Workbook.)
FIGURE 5 COMMON PATTERNS OF CHLORINATED SOLVENT BIODEGRADATION IN A
SEQUENTIAL AEROBIC/ANAEROBIC SYSTEM (JK)
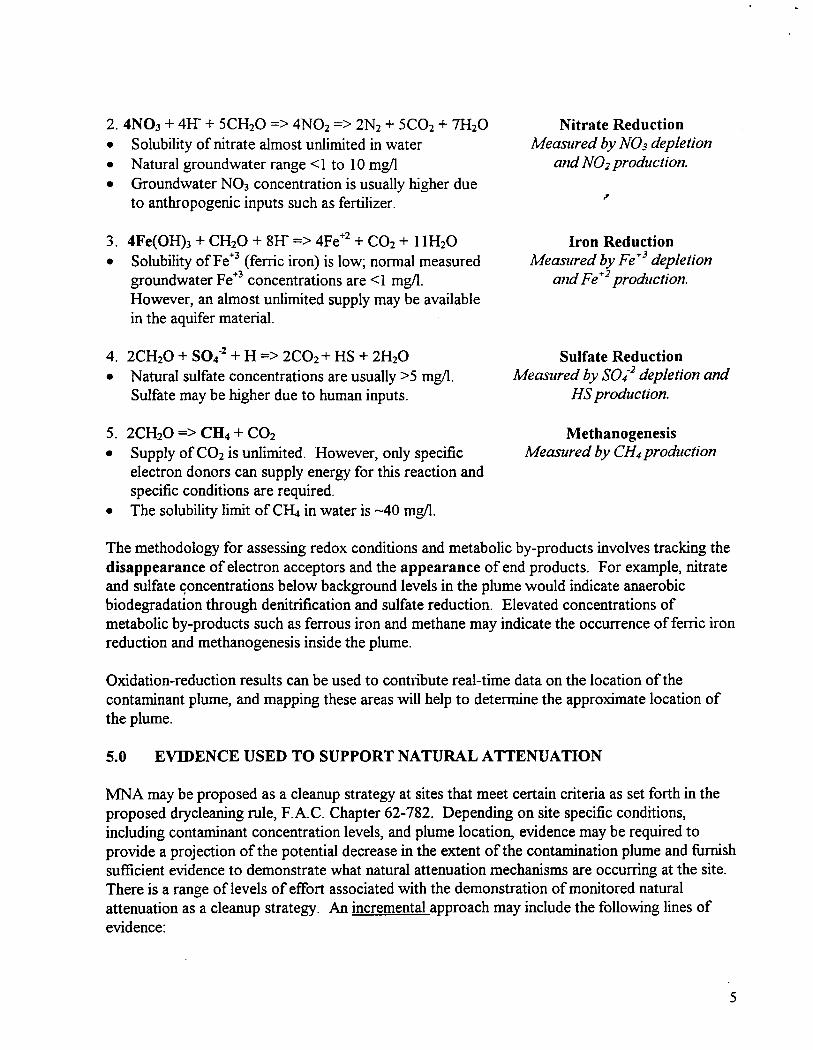
2. 4NO3 + 4H" + 5CH2O => 4NO2=> 2N2+ 5CO2+ 7H2O Nitrate Reduction • Solubility of nitrate almost unlimited in water Measured by NO3 depletion • Natural groundwater range <I to IO mg/1 and NO2 production.
• Groundwater NO3 concentration is usually higher due to anthropogenic inputs such as fertilizer.
3. 4Fe(OH)3 + CH2O + 8H" => 4Fe+2+CO2+ l IH2O Iron Reduction • Solubility ofFe+3 (ferric iron) is low; normal measured Measured by Fe +3 depletion
groundwater Fe+3 concentrations are <I mg/1. and Fe+2 production. However, an almost unlimited supply may be available in the aquifer material.
4. 2CH2O + S04-z + H => 2CO2+ HS+ 2H2O Sulfate Reduction • Natural sulfate concentrations are usually >5 mg/1. Measured by s04-2 depletion and
Sulfate may be higher due to human inputs. HS production.
5. 2CH2O => CH4 + CO2 Methanogenesis • Supply of CO2is unlimited. However, only specific Measured by CH4 production
electron donors can supply energy for this reaction and specific conditions are required.
• The solubility limit ofC~ in water is -40 mg/1.
The methodology for assessing redox conditions and metabolic by-products involves tracking the disappearance of electron acceptors and the appearance of end products. For example, nitrate and sulfate c;oncentrations below background levels in the plume would indicate anaerobic biodegradation through denitrification and sulfate reduction. Elevated concentrations of metabolic by-products such as ferrous iron and methane may indicate the occurrence offerric iron reduction and methanogenesis inside the plume.
Oxidation-reduction results can be used to contribute real-time data on the location of the contaminant plume, and mapping these areas will help to determine the approximate location of the plume.
5.0 EVIDENCE USED TO SUPPORT NATURAL ATTENUATION
MNA may be proposed as a cleanup strategy at sites that meet certain criteria as set forth in the proposed drycleaning rule, F.A.C. Chapter 62-782. Depending on site specific conditions, including contaminant concentration levels, and plume location, evidence may be required to provide a projection of the potential decrease in the extent of the contamination plume and furnish sufficient evidence to demonstrate what natural attenuation mechanisms are occurring at the site. There is a range of levels of effort associated with the demonstration of monitored natural attenuation as a cleanup strategy. An incremental approach may include the following lines of evidence:
5

Redox Potential (Eh8)
in Millivolts @ pH=7 and T=2S°C
1000
0 2 + 4H+ + 4e· --------> 2 H2O (Eh0 =+820) AEROBIC
2NO3 + 12H- +10e· --------> N2 + 6H20 (Eh0 =+740)
ANAEROBIC
S00-+-- Mn02 (s) + HCO3• + 3H+ + 2e·------> MnC03 (s) +2 H20 (Eh0 = 520)
Possible Range for Reductive Dechlorination
0 Fe00H(s) + HCO3- + 2H+ +e· ------ >FeC03 + 2H20
(Eh0 =-50) "
Optimal Range for SO/+ 9H+ +se· -------->HS-+ 4H20 (Eh0 =-220)4 1 1
Reductive Dechlorination CO2 + SH+ +se·--------> CH4 + 2H20 (Eh0 =-240)
-S00 __
FIGURE 6- REDOX POTENTIAL FOR VARIOUS ELECTRON ACCEPTORS (Modified from Bouwer 1994-Draft EPA Region 4 "Suggested Practices for Evaluation of a Site for
Natural Attenuation ... " 1997)

1. Direct evidence of contaminant concentration reduction and degradation products
This is simply an observed reduction in the concentration of released contaminants downgradient from the source area over time. However, biological processes may be indicated by an increase in the concentration of some degradation products, such as vinyl chloride. Figute 5, illustrates degradation products generated through biotic processes as related to distance and source area.
Typically, this first line of evidence may be documented by reviewing historical trends in contaminant concentrations and distribution in conjunction with site geology and hydrogeology to show reduction in the total mass is occurring at the site. Other site specific conditions, including hydraulic properties and aquifer characteristics determined from the contamination assessment, will also provide valuable information regarding groundwater flow and transport. Evaluation of all data should establish if the plume is expanding, stable or shrinking.
2. Examine changes in the concentration and distribution of the geochemical and biochemical indicator parameters that are related to specific natural attenuation processes
This information, along with the migration and contaminant degradation products, provide specific data to support natural attenuation. This line of evidence relies on chemical and physical data to show that contaminant mass is being destroyed via biodegradation and/or attenuated by physical processes such as diffusion, dilution, sorption, dispersion and other chemical reactions. The collection and analysis of the geochemical parameters is site specific and should be evaluated carefully. All geochemical parameters may not be necessary at each site.
3. Laboratory microcosm studies
These studies provide data which may be used to estimate site specific biodegradation rates which cannot be demonstrated by field data alone and also to confirm specific chlorinated solvent biodegradation processes. Evaluation ofresearch data has indicated that this line of evidence is generally not cost effective.
6.0 METHODOLOGY USED FOR DATA REVIEW AND SITE EVALUATION
Evaluation of existing data should be used as an initial indicator ofnatural attenuation ( e.g., evidence of transformation, appearance ofdaughter products and mass loss of target chemicals). Where there is initial evidence ofnatural attenuation mechanisms, further evaluation with regard to the type, rate and effectiveness of these mechanisms may be accomplished by the collection and analysis of additional specific natural attenuation parameters. Completion of the following steps will help facilitate a logical and sequential quantification process throughout the entire evaluation process:
Step # 1 Site Characterization Data
Review all site characterization data which will be used to develop a site specific conceptual model. For the evaluation of biotic attenuation, collection of specific parameters may be required to determine which microbial processes predominate in the site specific groundwater system.
6

Major geochemical parameters that characterize the subsurface include: dissolved oxygen, alkalinity, pH, redox potential, temperature, and concentration of electron receptors. Tables 1 and 2 provide a list and interpretation of several parameters.
TABLE 1 - Geochemical Parameters (7) ,,
Parameter Range Interpretation Redox potential <50 mV Reductive pathway possible Sulfate <20 mg/L Competes at higher concentrations with reductive pathway Nitrate <l mg/L Competes at higher concentrations with reductive pathway Ox-ygen <0.5 mg/L Tolerated; toxic to reductive pathway at higher concentrations Oxygen >l mg/L Vinyl chloride oxidized Iron (II) >l mg/L Reductive pathway possible Sulfide >l mg/L Reductive pathway possible Hydrogen >l nM Reductive pathway possible; vinyl chloride may accumulate pH 5<pH<9 Suitable for biological activity
Evaluation of the geochemical parameters and other site information will contribute to understanding the biotic natural attenuation processes. Listed below are some Geochemistry Rules of Thumb (27,28) which can also be used to help evaluate data quality:
• Dissolved oxygen (DO) concentrations are always below 10 ppm. • DO levels are directly proportional to red ox potential. (Relative) • DO is inversely proportional to Fe+2 and alkalinity concentrations. • Alkalinity concentrations are directly proportional to Fe+2
, but Fe+2 concentrations are not necessarily direct to alkalinity.
• Methane is always below 25 ppm. • Dissolve~ iron concentrations over 5 ppm may establish the reducing pathway. • Coastal aquifers are normally oxidized. • Biological DCE is at least 80% cis-1,2 DCE.
TABLE 2 - Contaminants and Daughter Products (7)
Parameter Interpretation PCE Material spilled TCE Material spilled or daughter product ofperchlorethylene (PCE) 1, 1, I -Trichloroethane Material spilled cis-DCE Daughter product of trichloroethylene (TCE) trans-DCE Daughter product of trichloroethylene (TCE) Vinyl Chloride Daughter product of dichloroethylene (DCE) Ethene Daughter product ofvinyl chloride Ethane Daughter product ofethene or chloroethane Methane Product of methanogenesis or reductive dechlorination of chlorinated methanes,
such as carbon tetrachloride, chloroform and methylene chloride Chloride Daughter product oforganic chlorine Carbon dioxide Ultimate oxidative daughter product Alkalinity Results from interaction of carbon dioxide with aquifer minerals and other
factors such as the biomass using the inorganic carbon in Hco·3 as a carbon source.
7

Several Rules of Thumb for Contaminant Half Lives (28), will assist in understanding the time frames and processes that are occuring within the plume boundary.
• BTEX contaminants have a half life that is very short ( weeks). • Chlorinated Hydrocarbon's halflife are months to years.
O DCE is the slowest to biodegrade. It's halflife will determine if natural attenuation is biologically mediated.
o VC can degrade very fast under the proper conditions.
The September 1998 Considerations for Assessment ofDrycleaning Solvent Contaminated Sites (21 ), provides general guidance regarding Contamination Assessment (CA) activities for sites under the Drycleaning Solvent Cleanup Program. The goal of any site characterization is to define the extent of contamination and to better understand the fate and transport of the contaminants. This is necessary in order to assess any current or potential threat to human health and the environment. The data elements in Table 3 provide a review of the key information necessary for plume delineation. This information may also be necessary to substantiate the effectiveness ofnatural attenuation through both physical and biological processes.
TABLE 3- Data Elements
Data Direction and gradient of groundwater flow
Hydraulic Conductivity
Aquifer thickness
Analysis of sit~ stratigraphy
Water table fluctuations
Date of contaminant release
Contaminant delineation- soil and groundwater
Soil texture, structure, TOC content
Historical concentrations along flow paths
Locations of groundwater recharge areas
Locations of exposure receptors
Information Estimate expected rate and direction of plume migration
Estimate expected rate of plume migration
Model groundwater flow
Conceptual model for preferential flow paths for contaminant transport
Potential source smearing and variation in flow direction
Estimate anticipated e:x"tent of plume migration
Current status of plume
Higher organic carbon content and smaller grain size results in greater adsorption of chemicals and retardation of migration
Plume status (i.e., migrating, decreasing, steady state)
Identify areas of ground water aeration
Identify possible exposures
Step #2 Three-dimensional Conceptual Model
The existing site data gathered in the site characterization phase may be used to develop a threedimensional (3D) conceptual model (27). Both physical and biological components ofnatural attenuation are incorporated into the conceptual model. The model should therefore include a
8

representation of the groundwater flow and transport system based upon the geological, biological, geochemical, hydrological, climatological, and analytical data. Use of this model will represent the site conditions and help to identify data shortcomings. If required, the data collected during site characterization may also be used to simulate the fate and transport of contaminants. This simulation will help to illustrate predictions regarding the future extent and concentrations of contaminants in the dissolved plume. ,,
Step #3 Additional Site Characterization Data Collection
Examine the site data for evidence ofnatural attenuation and develop an hypothesis ( conceptual model) to explain the attenuation process. With use ofmobile laboratories and direct push technology, the initial conceptual models can change dramatically while in the field. It is imperative that data are carefully reviewed and evaluated to constantly reconstruct the conceptual model. Select locations for additional data collection and evaluate what specific data are necessary to complete the conceptual model. Some common elements are: chlorinated solvent distribution along flow pathway, presence of degradation products, evidence ofmass loss of chemicals, and evidence ofgeochemical or biochemical indicators ofnatural attenuation.
During site characterization, indentify any source areas that are suspected. Source removal usually is very effective at decreasing the remediation time frame.
Step #4 Identify Exposure Pathways
Step #5 Refine the Site Conceptual Model
Perhaps one of the most important steps in the process is to incorporate all new data into the site conceptual model. Once the conceptual model is complete, a remedial alternative analysis may be initiated for site rehabilitation.
7.0 NATURAL ATTENUATION SAMPLING AND DATA EVALUATION METHODOLOGY
The main objective of the natural attenuation evaluation is to determine whether natural attenuation processes are taking place, and if those processes will reduce contaminant concentrations in groundwater within an acceptable distance and time frame. Upon examination of the initial site contaminant data in the field, if degradation products exist (i.e., daughter products), it is reasonable to infer that there is biotic natural attenuation. Ifhistorical data is available, reduction of contaminant concentrations in groundwater, without degradation products, may indicate abiotic natural attenuation processes. The primary natural attenuation mechanism may now be identified and substantiated through sampling, analysis, and evaluation of parameters that relate to each significant natural attenuation mechanism.
The following may be used to contribute toward increased assessment efficiency:
• Utilization of direct push technology, whenever possible, will assist in mapping the plume both laterally and vertically.
9

• Field test kits may be used for the following parameters: DO (disolved oxygen), Fe+2(ferrous iron), alkalinity, sulfide, pH, and temperature.
• Mobile laboratories will streamline site evaluation with real time information. The use of temporary transects for initial site natural attenuation characterization (27) may be helpful in identifying plume geochemical conditions. The placement of these transects may be useful for identifying both biotic and abiotic natural attenuation proct!sses. Indicated below is an example of an elongated groundwater plume with the placement of sampling transects located in the proper locations.
0 Locations may be determined by starting at the inferred center of the plume and moving out in a stepwise fashion at intervals of2 times the source area (inferred) width.
0 If the 2nd sampling location is contaminated, then sample 2 times the source area width further along the transect.
Vertical.Profiling
• The goal is to determine the variations in the physical and biological systems throughout the site (27, 28).
• One of the most important physical characteristics to determine at a site is hydraulic conductivity (27, 28).
Identify the significant biodegradation processes in source, plume, fringe, and background area from review of all collected data.
7.1 Monitor Well Placement and Sampling for MNA
Monitor well placement will depend on specific site conditions and may be installed upon completion of all assessment activity. The following are typical locations, but may be adjusted depending on the site conditions:
1. In the most contaminated zone. This should be as close to the source area as possible to provide a determination of the dominant terminal electron-accepting processes occurring at the site.
10
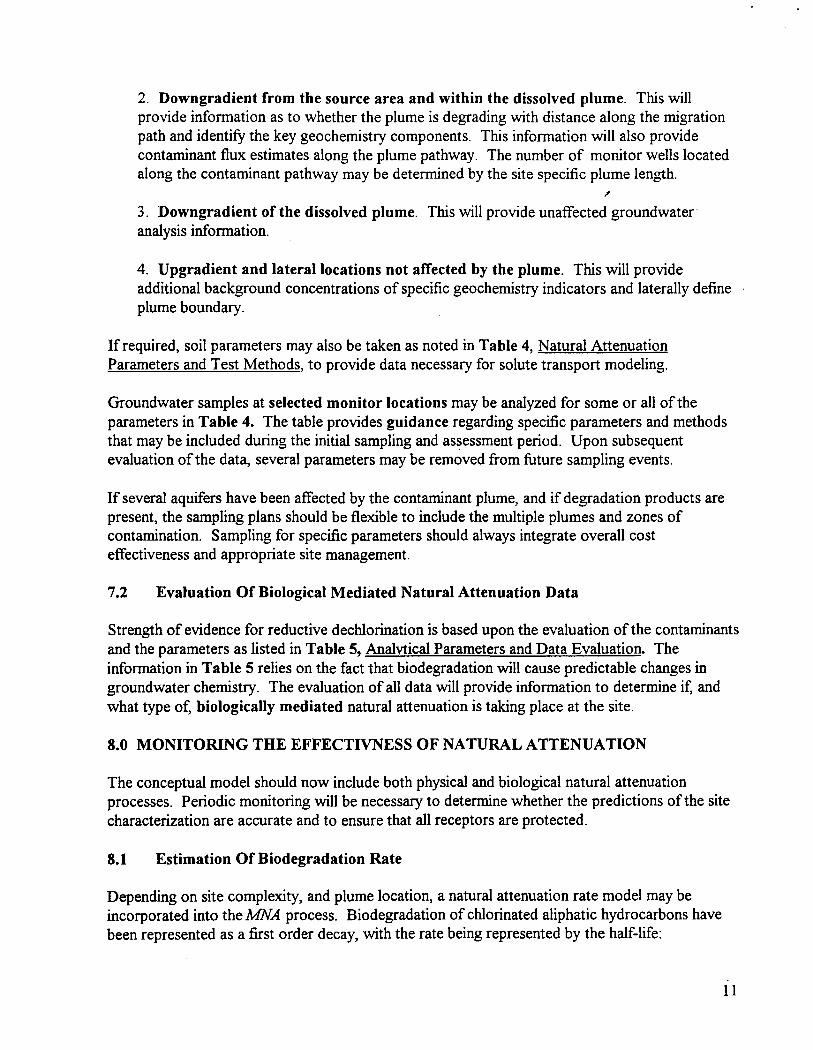
2. Downgradient from the source area and within the dissolved plume. This will provide information as to whether the plume is degrading with distance along the migration path and identify the key geochemistry components. This information will also provide contaminant flux estimates along the plume pathway. The number of monitor wells located along the contaminant pathway may be determined by the site specific plume length.
3. Downgradient of the dissolved plume. This will provide unaffected groundwater· analysis information.
4. Upgradient and lateral locations not affected by the plume. This will provide additional background concentrations of specific geochemistry indicators and laterally define plume boundary.
If required, soil parameters may also be taken as noted in Table 4, Natural Attenuation Parameters and Test Methods, to provide data necessary for solute transport modeling.
Groundwater samples at selected monitor locations may be analyzed for some or all of the parameters in Table 4. The table provides guidance regarding specific parameters and methods that may be included during the initial sampling and assessment period. Upon subsequent evaluation of the data, several parameters may be removed from future sampling events.
If several aquifers have been affected by the contaminant plume, and if degradation products are present, the sampling plans should be flexible to include the multiple plumes and zones of contamination. Sampling for specific parameters should always integrate overall cost effectiveness and appropriate site management.
7.2 Evaluation Of Biological Mediated Natural Attenuation Data
Strength of evidence for reductive dechlorination is based upon the evaluation of the contaminants and the parameters as listed in Table 5, Analytical Parameters and Data Evaluation. The information in Table 5 relies on the fact that biodegradation will cause predictable changes in groundwater chemistry. The evaluation of all data will provide information to determine if, and what type of, biologically mediated natural attenuation is taking place at the site.
8.0 MONITORING THE EFFECTIVNESS OF NATURAL ATTENUATION
The conceptual model should now include both physical and biological natural attenuation processes. Periodic monitoring will be necessary to determine whether the predictions of the site characterization are accurate and to ensure that all receptors are protected.
8.1 Estimation Of Biodegradation Rate
Depending on site complexity, and plume location, a natural attenuation rate model may be incorporated into the MNA process. Biodegradation of chlorinated aliphatic hydrocarbons have been represented as a first order decay, with the rate being represented by the half-life:
11

TABLE 4
MATRIX PARAMETER TEST METHOD LOCATION COMMENTS JUSTIFICATION
Soil
Soit
Soil gas
Water
Water
Water
Water
Water
Volatile Organics
Total Organic Carbon (TOC)
Volatile Organics
Alkalinity
Chloride
Dissolved Oxygen
Ethane, Ethene, Methane
Ferrous Iron (Fe.2)
EPA 8021 with Fixedupdated EPA 5035
preparation
SW-8469060 Fixed
modified
EPAT0-14 Fixed
HACH/ Field / Fixed
EPA 310.1/310.2
HACH/ Field / Fbced
EPA E-300 series
Meter and Probe Flow through cell
360.1 Field
Winkler titration ASTM D 888-92 (A)
SW-8468015 Fixed
modified
HACH (25140-25) / Field / Fixed
EPA E-300 series
Must detennine high and low levels.
Procedure -must be accurate over the range of 0.1% to 5% TOC.
****Not recommended at all sites.
Collect 100 to 250 ml of water in a glass container.
Colorimetric F'reld Kit
With all DO methods extra care must be taken to avoid aeration during all steps ot the analysis including well purging.
Field kits for performing Winkler titration• can be used as the primary method of DO measurement or to confinn mete, measurements.
Method published by EPA researchers. Limited to few commercial labs.
Colorimetric Field Kit Collect 100 ml ot water in glass container. Filter sample with 0.2 micron filter if turbid.
Detennlne the extent of soil contamination.
The amount of TOC in aquifer matrix influences contaminant migration and/ 01
degradation.
Distribution of soil gas within plume area.
Provides an indication of the buffering capacity of groundwater and the amount of carbon dioxide dissolved; increases due to biodegradation ot organic compounds.
Final product of chlorinated solvent reduction.
Concentration <1mg/L = anaerobic pathway; highest energy-yielding electron acceptor for biodegradation of organic constituents.
Presence of methane suggests biodegradatlon of organic carbon via methanogenesis; ethane and ethene are daughter products of chlorinated solvents. ***Not recommended for all sites.
Reductive pathway; anaerobic degradation process due to depletion o
oxygen, nitrate and manganese; increased concentrations of Fe•2 may
indicate Fe•3 is being used as an electron a~tor during anaerobic blodegradation.
Water Hydrogen Not recommended
at this time. Under consideration.
TABLE4 NATURAL ATTENUATION PARAMETERS AND TEST METHODS

TABLE4
Water
Water
Water
Redox Potential
Temperature
Nitrate
Field Flow through cell
Field Probe / EPA 170.1
HACH/ EPA E-300 series
Field
Field / Fixed
Field / Fixed
ORP probe can be Inserted Into flow through cell and reading obtained simultaneously with DO, pH, T, and EC.
Available from some DO, ORP, pH, or EC probes.
Collect 40 ml of water In a glass or plastic container; add sulfuric acid to pH<2, keep cool.
Water pH EPA 150.1 or SW-8469040
Field Direct Reading Meter
Water
Water
Sulfate (S04}-2
Sulfide
HACH/ EPA 8051
HACH/ EPA E-300 series
Field / Fixed
Field / Fixed
Colorimetric Method
Colorimetric Method ·
Water Total Organic Carbon (TOC)
HACH/ EPA E-300 series
Field / Fixed
Water Volatile Organics EPA 8021 / 8015 Fixed / Mobile Choice of methods considerations required.
-cost effective
Indicates the relative ability of a solution to accept or transfer electrons; define regions of the plume under oxidizing and reducing conditions; help! validate DO measurements. May range from more than 800mV for aerobic conditions to -400mV.
At T>20, biochemical process accelerated; proper well development Index.
Substrate for microbial respiration If oxygen depleted; decreased nitratE concentrations in anaerobic portion of the plume may indicate use of sulfatE as an electron acceptor.
Difference in pH between contaminated and uncontaminated groundwatet may Indicate biological activity Is occurring.
Substrate for anaerobic microbial respiration; decreased sulfatE concentrations In anaerobic portion of the plume may Indicate use of sulfatE as an electron acceptor.
Microbially reduced form of sulfate. Indicates reduced conditions.
A measure of the total concentration of organic material in water that may bE available for biological degradation.
Provides a measure of the type and quantity of parent and biogenic daughter products.
'
Notes: SW-846 refers to the Test Methods for Evaluating Solid Waste, Physical and Chemical Methods EPA refers to Methods for Chemical Analysis of Water and Wastes HACH refers to the Hach Company catalog
TABLE4 NATURAL ATTENUATION PARAMETERS AND TEST METHODS

Analyte Concentration Interpretation
Oxygen <0.5 mg/L Tolerated: suppresses reductive dechlorination at higher concentrations
Oxygen >1 mg/L Vinyl chloride may be oxidized aerobically, but reductive dechlorination will not occur
Nitrate <1 mg/L At higher concentrations may complete with reductive pathway ,r
Iron (II) >1 mg/L Reductive pathway possible; vinyl chloride may be oxidized under lron(lll)-reducing conditions
Sulfate <20 mg/L At higher concentrations may compete with reductive pathway
Sulfide >1 mg/L Reductive pathway possible
Methane <0.5 mg/L Vinyl chloride oxidizes
>.5 mg/L Ultimate reductive daughter product, vinyl chloride accumulates
Oxidation-Redudion
<50mV Reductive pathway possible
<-100mV Reductive pathway likely
pH 5<pH<9 Optimal range for reductive pathway
5>pH>9 Outside optimal range for reductive pathway
TOC (Total Organic Carbon)
>20 mg/L Carbon and energy source; drives dechlorination; can be natural or anthropogenic
Temperature >20°C At T>2a°, biochemical process is accelerated
Carbon dioxide > 2 X background Ultimate oxidative daughter product
Alkalinity > 2 X background Results from interation of carbon dioxide with aquifer minerals
Chloride > 2 X background Daugher product of organic chlorine
Hydrogen >1nM Reductive pathway possible; vinyl chloride may accumulate
<1 nM Vinyl chloride oxidized
Volatile Fatty Acids
>0.1 mg/L Intermediates resulting from biodegradation of aromatic compounds; carbon and energy souce
BTEX >0.1 mg/L Carbon and energy souce; drives dechlorination
Perchloroethene Material released
Trichloroethane Material released or daughter product of perchloroethene
Dichloroethene Material released or daughter product of trichloroethene
If amount of cis-1,2 DCE is greater than 80% of total DCE, It is likely a daughter product ol trichloroethene. 1,1-DCE can be chemical reaction product of TCA.
Vinyl Chloride Daughter product of dichloroethene
Ethene >0.01 mg/L Daughter product of vinyl chloride
Ethane >0.1 mg/L Daugher product of ethene
Chloroethane Daughter product of vinyl chloride under reducing conditions
Dichloroethane Daughter product trichloroethene
Table 5 Analytical Parameters and Data Evaluation
Adpated from" Draft EPA Region 4 Suggested Practices for Evaluation of a Site For Natural Attenuation... " 1997

Where: *Ci= initial measured chlorinated compound concentration (mg/L)
*Co= final measured chlorinated compound concentration (mg/L)
*t = time between initial and final measurements (year) *k = degradation rate (per year) .,
Two methods for determining rate constants are described by Wiedemeier et al (17).
8.2 Estimation of Overall Natural Attenuation Rates
Estimation of site specific attenuation rate should include all loss mechanisms that contribute to concentration changes in target contaminants, such as dispersion, dilution, sorption, volatilization, and biodegradation. The most compelling substantiation of a contaminant's half-life is through the evaluation ofhistorical data. Since this may not be available at many sites, historical data may be generated by quarterly sampling for a period of one year. Ifno mathematically significant change in concentrations is observed, the half-life is likely very large and natural attenuation processes may not be defensible.
A method used by Buscheck and Alcantar (25) for natural attenuation rate uses interpretation of a steady-state analytical solution to the advection-dispersion equation by Bear (26). Natural attenuation rates should be calculated along the flow vector of the plume in order to show the natural attenuation process along the flow path.
For sites with complex site conditions (multiple sources, complex hydrogeology, preferential pathways, etc.), a scientific evaluation consisting of a fate and transport model may be appropriate for proposed MNA. A screening model, such as BIOSCREEN, can simulate biological degradation ofhydrocarbons and has been suggested for use at chlorinated sqlvent sites. The model is non-proprietary and available from Robert S. Kerr Laboratory's home page (www.Epa.gov/ada/kerriab.htm). Screening models incorporating biodegradation kinetics for natural attenuation of chlorinated solvents are currently under development.
9.0 MONITORED NATURAL ATTENUATION REPORTS
If there is no historical groundwater monitoring data information, quarterly groundwater sampling may be required for the first year and annual evaluation of the data will determine future sampling frequency and sampling parameters. All reports should include a discussion regarding the continued applicability ofMNA for the particular site. The following items may be required for inclusion in quarterly or semi-annual reports:
1. Water Table Evaluation Data
2. Groundwater Quality Data Subsequent review and evaluation of the data may indicate that certain sampling parameters may not be necessary for future sampling events.
12

3. Site maps indicating natural attenuation parameters, contaminant concentrations, specific site conditions, and neighboring areas.
4. Groundwater Historical Analytical Summary Table and graphs depicting trend analysis. The tables should include all historical information.
5. Evaluation and discussion of the data to include: • Geochemical evaluation • Contaminant trend evaluation
Annual Reports may also include:
Chemical Analysis Evaluation • Biodegradation analysis and regression analysis may be required depending on
site specific data and plume status; • Relative mass of contaminants-plume dynamics; • Contaminant flux concentrations along the plume; • Review of all historical site data contaminants.
Risk Analysis Evaluation • Review of property records to ascertain property owner status of the affected
property; • Review of the "physical status" of the site, and other surrounding property
conditions. "Physical status" will include building development, installation of groundwater wells, residential development or other conditions that would change the exposure pathways.
13

REFERENCES
l. Chapelle, F.H. U.S. Geological Survey. Protocol for Assessing the Natural Attenuation of Chlorinated Ethenes in Growidwater Systems. Draft Document July, 1996
~
2. Chapelle, F.H. U.S. Geological Survey. Identify Redox Conditions that Favor Natural Attenuation of Chlorinated Ethenes in Contaminated Growid Water. Symposium on Natural Attenuation of Chlorinated Organics in Growidwater. 1996 EPA/540/R-96/509
3. Vogel, T.M., C.S. Criddle, and P.L. McCarty, 1987. Transformations ofHalogenated Aliphatic Compowids. Environ. Sci. Technology 21:722-736
4. Bradely, P.M., and F.H. Chapelle, 1996. Anaerobic Mineralization of Vinyl Chloride in Fe(l11)-reducing sediments. Environ Sci. Technology 30:2084-2086.
5. Major, D.W., W.W. Hodgins, and B.J. Butler, 1991. Field and Laboratory Evidence of In situ Biotransformation of PCE to ethene and ethane. In: Hinchee, R.E. and R.F. Olfenbuttel, Eds. On Site Bioreclamation. Stoneham, Ma: Butterworth-Heinemann pp. 147-171.
6. Gossett, J.M., Zinder, S.H. Microbiological Aspects Relevant to Natural Attenuation of Chlorinated Ethenes. Symposium on Natural Attenuation of Chlorinated Organics in Growidwater. 1996 EPA/540/R-96/509
7. Wislon, B.H., Wilson, J.T. U.S. EPA National Risk Management Research Laboratory. Design and Interpretation ofMicrocosm Studies for Chlorinated Solvents. Symposium on Natural Attel}uation of Chlorinated Organics in Growidwater. 1996 EPA/540/R-96/509
8. Cherry, J.A., University of Waterloo, Department of Earth Science, Waterloo, Ontario. Conceptual Model for Chlorinated Solvent Plumes and Their Relevance to Intrinsic Remediation. Symposium on Natural Attenuation of Chlorinated Organics in Growidwater. 1996 EPA/540/R-96/509.
9. Cherry, J.A., J.F. Barker, S. Feenstra, R.W. Gillham, D.M. Mackay, and D.J.A. Smyth. The Borden Site for Growidwater Contamination Experiments; 1978-1995.
10. Hach Co. 1990. Hach Company Catalog: Production Analysis Ames, IA.
11. U.S. EPA 1993 Test Methods for Evaluating Solid Waste; Physical and Chemical Methods, 3rd Ed. SW846 Washington, D.C.
12. Bouwer, E.J., B.E. Rittman, and P.L. McCarty. 1981 Anaerobic Degradation of Halogenated 1-and 2-Carbon Organic Compowids. Environ. Sci. Technology. 15(5): 596-599.
13. Bouwer, E.J., 1994 Bioremediation of Chlorinated Solvents Using Alternate Electron Aceptors. In:_ Norris, R.D., R.E. Hinchee, R. Brown, P.L. McCarty, L. Semprint, J.T. Wilson,
14

DH. Kampsll, M. Reinhard, E.J. Bower, R.C. Borden, J.M. Vogel, J.M. Thomas, and C.H. Ward, Eds. Handbook ofBioremediation, Boca Raton, Fl.: Lewis Publishers.
14. Vogel, T.M., 1994. Natural Attenuation of Chlorinated Solvents. In: Norris, R.D., R.E. Hinchee, R. Brown, P.L Macarty, L. Semprini, J.T. Wilson, D.H. Kampbell, M. Reinhard, E.J. ,, Bouwer, R.C. Borden, T.M. Vogel, J.M. Thomas, and C.H. Ward, eds. Handbook of Bioremediation. Boca Raton, Fl: Lewis Publishers
15. Vogel, T.M and P.L. McCarty. 1995 Biotransformation ofTetrachoroethylene to Trichloethylene, dichloroethylene, vinyl chloride, and carbon dioxide under methanogenic conditions. Appl. Environ. Microbiol. 49(5):1080-1083.
16. Wiedemeier, T.H., M.A. Swanson, J.T. Wilson, D.H. Kampbell, R.N. Miller, and J.E. Hansen. 1996 Approximation of Biodegradation Rate Constants for Monoaromatic Hydrocarbons in Groundwater. Ground Water Monitoring and Remediation.
17. Wiedemeier, T.H., M.A. Swanson, D.E. Moutoux, J.T. Wilson, D.H. Kampbell, J.E. Hansen, P.Haas, and F.H. Chapelle. 1996. Technical Protocol for Natural Attenuation of Chlorinated Solvents in Groundwater. San Antonio, Tx: U.S. Air Force Center for Environmental Excellence.
16. Phillips, J.B., M. Hindawi, A. Phillips, R.V. Bailey. Engineering Development Institute. Viewing Bioremediation from a Multimedia Perspective. Pollution Engineering, Jan. 98. p.33-35.
17. Schaffner, Jr., P.G., E. Hawkins, J. Wieck. A Look at Degradation of CAHs. Soil and Groundwater Cleanup, May 1996. p.20-31.
18. U.S.EPA Draft Region 4. Suggested Practices for Evaluation ofa Site for Natural Attenuation (Biological Degradation) of Chlorinated Solvents. November, 1997.
19. Murry, W.D., and M. Richardson. 1993. Progress Toward the Biological Treatment of Cl and C2 Halogenated Hydrocarbons. Crit. Rev. Environ. Sci. Technology 23(3):195-217
20. McCarty, P.L., and L. Semprini. 1994 Groundwater treatment for chlorinated solvents, In: Norris, R.D., R.E. Hinchee, R. Brown, P.L Mcarty, L. Semprini, J.T. Wilson, D.H. Kampbell, M. Reinhard, E.J. Bouwer, R.C. Borden, T.M. Vogel, J.M. Thomas, and C.H. Ward, eds. Handbook ofbioremediation. Boca Raton, Fl: Lewis Publishers.
21. Linn, W., P.G. Considerations for Assessment ofDryCleaning Solvent Contaminated SitesDraft, November 1998. Florida Department of Environmental Protection.
22. Semprini, L., Peter K. Kitanidis, Don H. Kampbell, John T. Wilson. Anaerobic Transformation of Chlorinated Aliphatic Hydrocarbons in a Sand Aquifer Based on Spatial Chemical Distributions. Water Resources Research, 31(4):1051-1062. April 1995.
15

23. RTDF. Natural Attenuation of Chlorinated Solvents in Groundwater: Principals and Practices. Draft Version 3.0, August 1997.
24. Domenico, RA. 1987. An Analytical Model for Multidimensional Transport of a Decaying Contaminant Species. J. Hydro. 91:49-58.
25. Buscheck, T.E.G., and C.M Alacanter. 1995. Regression Techniques and Analytical Solutions to Demonstrate Intrinsic Bioremediation. In: Proceeding of the 1995 Battelle International Conference on In-Situ and On-Site Bioremediation. April
26. Bear, J. 1979. Hydraulics of Groundwater. New York, NY McGraw-Hill
27. EPA Seminars. "Monitored Natural Attenuation for Groundwater." Office ofResearch and Development, U.S. Environmental Protection Agency, Washington, DC. September, 1998.
28. Interstate Technology Regulatory Cooperation (ITRC); Workshop Notes, November, 1998.
29. Cox, E.E., L.Lehmick, E. Edwards, R. Mechaber, B. Su and D.W. Major. 1997. Field and Laboratory Evidence of Sequential Anaerobic-Cometabolic Biodegradation of Chlorinated Solvents. In: In Situ and On-Site Bioremediation: Vol. 3. Battelle Press, p. 203.
16

,
APPENDIX A GLOSSARY OF TERMS

APPENDIX A GLOSSARY OF TERMS
Parts of this glossary have been adapted from National Research Council (1993) J
Abiotic - Occurring without the involvement ofmicroorganisms.
Advection - Transport of molecules dissolved in water along the groundwater flow path at an average expected velocity.
Aerobic - Environmental conditions where oxygen is present.
Aerobic Respiration - Process whereby microorganisms use oxygen as an electron acceptor to generate energy.
Aliphatic Hydrocarbon - A compound built from_ carbon and hydrogen atoms joined in a linear chain. Petroleum products are composed primarily of aliphatic hydrocarbons.
Anaerobic - Environmental conditions where oxygen is absent.
Anaerobic Respiration - Process whereby microorganisms use a chemical other than oxygen as an electron acceptor. Common "substitutes" for oxygen are nitrate, sulfate, iron, carbon dioxide, and other organic compounds (fermentation).
Aquifer - An underground geological formation that stores groundwater.
Bacterium - A single cell organism ofmicroscope size. Bacteria are ubiquitous in the environment, inhabiting water, soil, organic matter and the bodies ofplants and animals.
Biochemical - Produced by, or involving chemical reactions of living organisms.
Biodegradation - Biologically mediated conversion of one compound to another.
Biomass -Total mass of microorganisms present in a given amount ofwater or soil
Bioremediation - Use of microorganisms to control and destroy contaminants.
Biotransformation - Microbiologically catalyzed transformation of a chemical to some other product.

Chlorinated Solvent - A hydrocarbon in which chlorine atoms substitutes for one or more hydrogen atoms in the compounds structure. Chlorinated solvents commonly are
used for grease removal in manufacturing and dry cleaning, and other operations.
, Co-metabolism - A reaction in which microbes transform a contaminant even though the contaminant cannot serve as an energy source for the organisms. To degrade the contaminant, the microbes require the presence of other compounds (primary substrates) that can support their growth.
Degradation - Destruction of a compound through biological or abiotic reactions.
Dechlorination - The removal of chlorine atoms from a compound.
Desorption - Opposite of sorption; the release of chemicals attached to solid surfaces.
Diffusion - Dispersive process that results from the movement ofmolecules along a concentration gradient. Molecules move from areas ofhigh concentration to low concentration.
Dilution - The combined processes of advection and dispersion results in a net dilution of the molecules in the groundwater.
Dispersion - The spreading ofmolecules along and away from the expected groundwater flow pat:J;i during advection as a result ofmixing of groundwater in individual pores and channels.
Electron - A negatively charged subatomic particle that may be transferred between chemical species in chemical reactions. Every chemical molecule contains electrons and protons (positively charged particles).
Electron Acceptor - Compound that gains electrons ( and therefore is reduced) in oxidation - reduction reactions that are essential for the growth ofmicroorganisms. Common electrons acceptors are oxygen, nitrate, sulfate, iron and carbon dioxide. Highly chlorinated solvents ( e.g., TCE) can act as electron acceptors.
Electron Donor - Compound that loses electrons ( and therefore is oxidized) in oxidation - reduction reactions that are essential for growth ofmicroorganisms. In bioremediation organic compounds serve as electron donors. Less chlorinated solvents ( e.g., VC) can act as electron donors.
Geochemical - produced by, or involving non-biochemical reactions of the subsurface.

Growth Substrate - an organic compound upon which a bacteria can grow, usually as a sole carbon an energy source.
Hydraulic Conductivity - A measure of the rate at which water moves through a unit area of the subsurface under a unit hydraulic gradient.
Hydraulic Gradient - change in head (i.e., water pressure) per unit distance in a given direction, typically in the principal flow direction.
Inorganic Compound - A chemical that is not based on covalent carbon bonds. Important examples are metals, nutrients such as nitrogen and phosphorus, minerals, and carbon dioxide.
Intrinsic Bioremediation - A type of in situ bioremediation that uses the innate capabilities ofnaturally occurring microbes to degrade contaminants without taking any engineering steps to enhance the process.
Intrinsic Remediation - In situ remediation that uses naturally occurring processes to degrade or remove contaminants without using engineering steps to enhance the process.
Metabolic Intermediate - A chemical produced by one step in a multistep biotransformation.
Metabolism - The chemical reactions in living cells that convert food sources to energy and new cell mass.
Methanogen - A microorganism that exists in aerobic or anaerobic environments and produces methane as the end product of its metabolism. Methanogens use carbon dioxide or simple carbon compounds such as methanol as an electron acceptor.
Microcosm - A laboratory vessel set up to resemble as closely as possible the conditions ofa natural environment.
Microorganism - An organism ofmicroscopic or submicroscopic size. Bacteria are microorganisms.
Mineralization - The complete degradation of an organic chemical to carbon dioxide, water, and in some cases inorganic ions.
Natural Attenuation - Naturally-occurring processes in soil and groundwater environments that act without human intervention to reduce the mass, toxicity, mobility, volume or concentration of contaminants in those media. Natural attenuation is the combinded effect of dispersion, dilution, volatilization, sorbtion, chemical reactins

with subsurface materials, and biodegradation of dissolved contaminants in the groundwater and soil.
~
Nonaqueous Phase Liquids (NAPLs)-An organic liquid that is maintained as a separate phase from water.
Oxidization - Loss of electrons from a compound, such as an organic contaminant. The oxidation can supply energy that microorgansims use for growth. Often ,but not always, oxidation results in the addition of an oxygen atom and/or the loss of a hydrogen atom.
Oxygenase - An enzyme that introduces oxygen into an organic molecule.
Plume - A zone of dissolved contaminants. A plume usually originates from a source and extends for some distance in the direction of ground water flow.
Primary Substrates -The electron donor and electron acceptor that are essential to ensure the growth of microorganisms. These compounds can be viewed as analogous to the food and oxygen that are required for human growth.
Reduction - Transfer of electrons to a compound such as oxygen. It occurs when another compound is oxidized.
Reductive Dechlorination - The removal of chlorine atoms from an organic compound and their replacement with hydrogen atoms (same as reductive dehalogenation).
Reductive Dehalogenation - A variation on biodegradation in which microbially catalyzed reactions cause the replacement of a halogen atom ( e.g., chlorine) on an organic compound with a hydrogen atom. The reactions result in the net addition of two electrons to the organic compound.
Saturated Zone - Subsurface environments where pore spaces are filled with water.
Site Conceptual Model - A hypothesis about how releases occurred, the current state of the source, an idealized geochemical site type, and current plume characteristics (plume stability).
Sorption - Attachment of a substance on the surface of a solid by physical or chemical attraction.

Stabilization - Process whereby chemical molecules become chemically bound by a stabilizing agent (e.g.,clay, hwnic materials), reducing the mobility of the molecule in groundwater.
Substrate - A compound that microorganisms can use in the chemical reactions , catalyzed by their enzymes.
Sulfate Reducer - A microorganism that exists in anerobic environments and reduces sulfate to hydrogen sulfide.
Unsaturated Zone - Soil above the water table, where pores are partially or largely filled with air.
Vadose Zone - See "Unsaturated zone . "
Volatilization - Transfer of a chemical from the liquid to the gas phase ( as in evaporation).


![Safety Considerations For WCET Evaluation Methods … · SAFETY CONSIDERATIONS FOR WCET EVALUATION METHODS IN AVIONIC EQUIPMENT Xavier Jean, ... CS-25.1309 [1]. Hardware and …](https://static.fdocuments.in/doc/165x107/5b69663e7f8b9af23e8e1073/safety-considerations-for-wcet-evaluation-methods-safety-considerations-for.jpg)
