Consideration of Preservation in Pavement Design and...
75
Consideration of Preservation in Pavement Design and Analysis June 27, 2016
-
Upload
truongkhuong -
Category
Documents
-
view
213 -
download
0
Transcript of Consideration of Preservation in Pavement Design and...

Consideration of Preservation in Pavement Design and Analysis June 27, 2016

Today’s Presenters • Moderator
Judith Corley-Lay, NCDOT
• Findings of NCHRP 1-48 David Peshkin, Applied Pavement Technology
• Texas DOT Approach to Pavement Design Magdy Mikhail, TexDOT
• NC Review of Report 810 Judith Corley-Lay, NCDOT

NCHRP is...
A state-driven national program
• The state DOTs, through AASHTO’s Standing Committee on Research... – Are core sponsors of NCHRP
– Suggest research topics and select final projects
– Help select investigators and guide their work through oversight panels

NCHRP delivers...
Practical, ready-to-use results • Applied research aimed at state
DOT practitioners • Often become AASHTO
standards, specifications, guides, manuals
• Can be directly applied across the spectrum of highway concerns: planning, design, construction, operation, maintenance, safety

A range of approaches and products • Traditional NCHRP reports • Syntheses of highway practice • IDEA Program • Domestic Scan Program • Quick-Response Research for
AASHTO • Other products to foster
implementation: – Research Results Digests – Legal Research Digests – Web-Only Documents and CD-ROMs

NCHRP Webinar Series • Part of TRB’s larger webinar
program • Opportunity to interact with
investigators and apply research findings.

Today’s First Presenter
• Findings of NCHRP 1-48
David Peshkin,
Applied Pavement Technology

NCHRP Project 1-48 / NCHRP Report 810
Consideration of Preservation in Pavement Design and Analysis Procedures
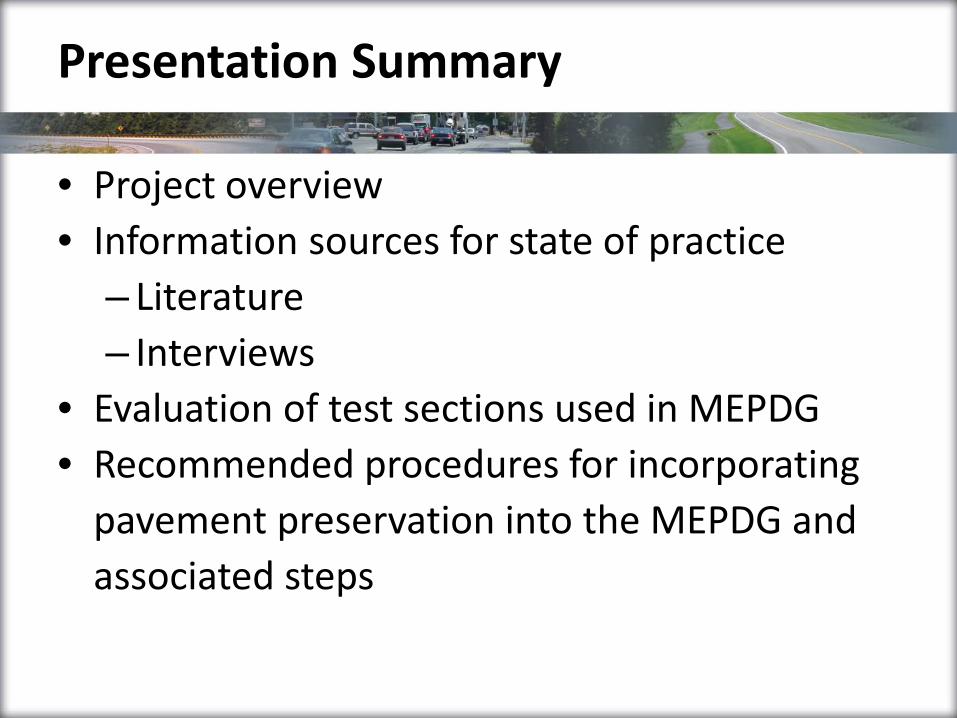
Presentation Summary
• Project overview • Information sources for state of practice
– Literature – Interviews
• Evaluation of test sections used in MEPDG • Recommended procedures for incorporating
pavement preservation into the MEPDG and associated steps

Project Overview
Background—
(1) The MEPDG is increasingly being used by agencies as
the pavement design and analysis tool. (2) Most agencies
have some sort of preservation program. (3) MEPDG
models do not consider the effects of preservation.
Initial Project Objective—
Develop procedures for incorporating pavement
preservation treatments into the MEPDG process.

Underlying Concept
Preventive Maintenance Treatments
Good
Poor
Time
Initial Performance Period
Pave
men
t Con
ditio
n

Literature Review
Sources NCHRP/TRB AASHTO FHWA National
research organizations Preservation organizations Industry organizations
Pavement preservation performance Effects of preservation on pavement performance
MEPDG models Agency calibration efforts

Literature Review Topics
• Techniques for analyzing performance of pavement preservation treatments
• MEPDG performance prediction models • MEPDG evaluation and implementation
activities, including local calibration
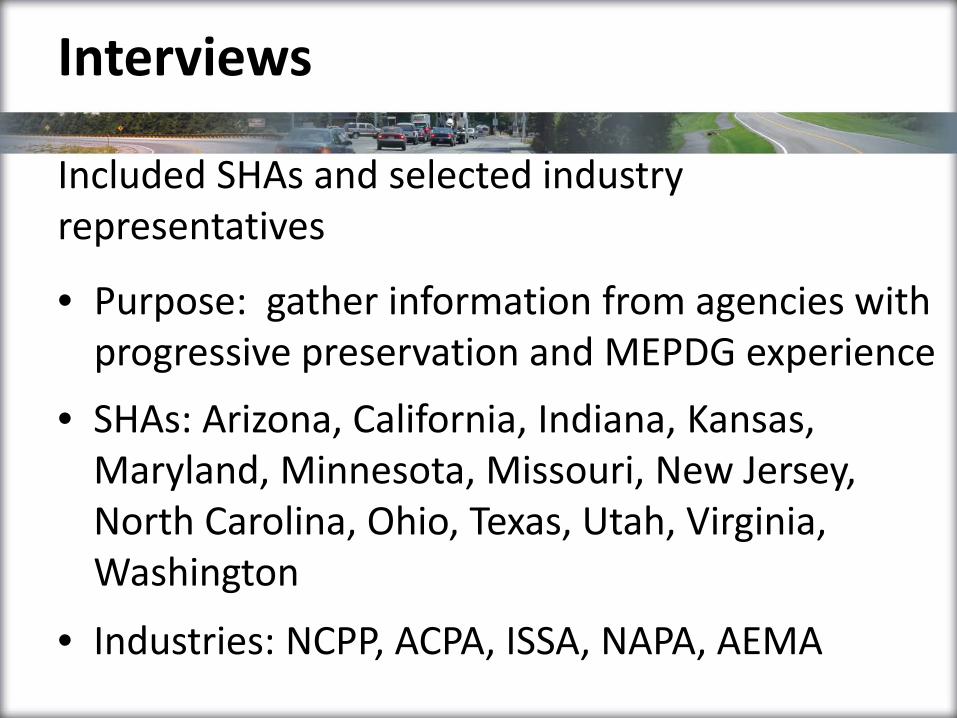
Interviews
Included SHAs and selected industry representatives
• Purpose: gather information from agencies with progressive preservation and MEPDG experience
• SHAs: Arizona, California, Indiana, Kansas, Maryland, Minnesota, Missouri, New Jersey, North Carolina, Ohio, Texas, Utah, Virginia, Washington
• Industries: NCPP, ACPA, ISSA, NAPA, AEMA
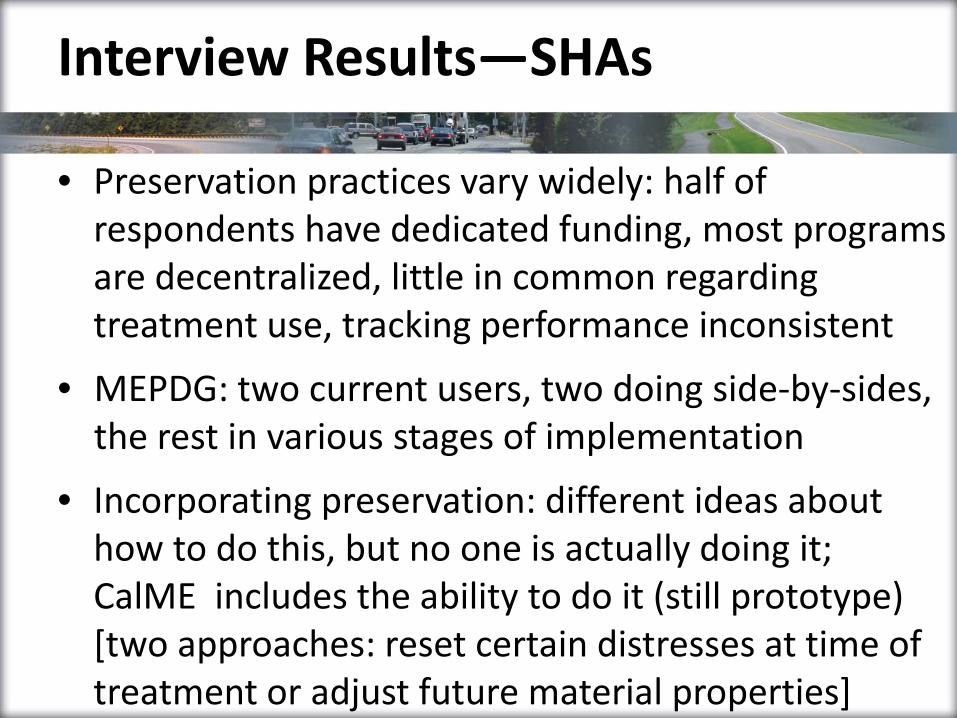
Interview Results—SHAs
• Preservation practices vary widely: half of respondents have dedicated funding, most programs are decentralized, little in common regarding treatment use, tracking performance inconsistent
• MEPDG: two current users, two doing side-by-sides, the rest in various stages of implementation
• Incorporating preservation: different ideas about how to do this, but no one is actually doing it; CalME includes the ability to do it (still prototype) [two approaches: reset certain distresses at time of treatment or adjust future material properties]

Interview Results—Industry
• Preservation: all have strong emphasis on preservation; little objective data on pavement life extension
• MEPDG: NCPP, AEMA, ISSA not very familiar; NAPA, ACPA very familiar, but from perspective of design, not preservation
• PP and the MEPDG: NAPA, ACPA thought it was a good idea, but would need an LTPP-type experiment to implement

Evaluation of MEPDG Test Sections—Overview
Wanted to answer the question: Did pavements used to develop or verify MEPDG models benefit from preservation? • Identify pavement sections • Extract maintenance history from LTPP
database and other sources • Organize information in tables • Determine whether treatments may have
affected MEPDG models
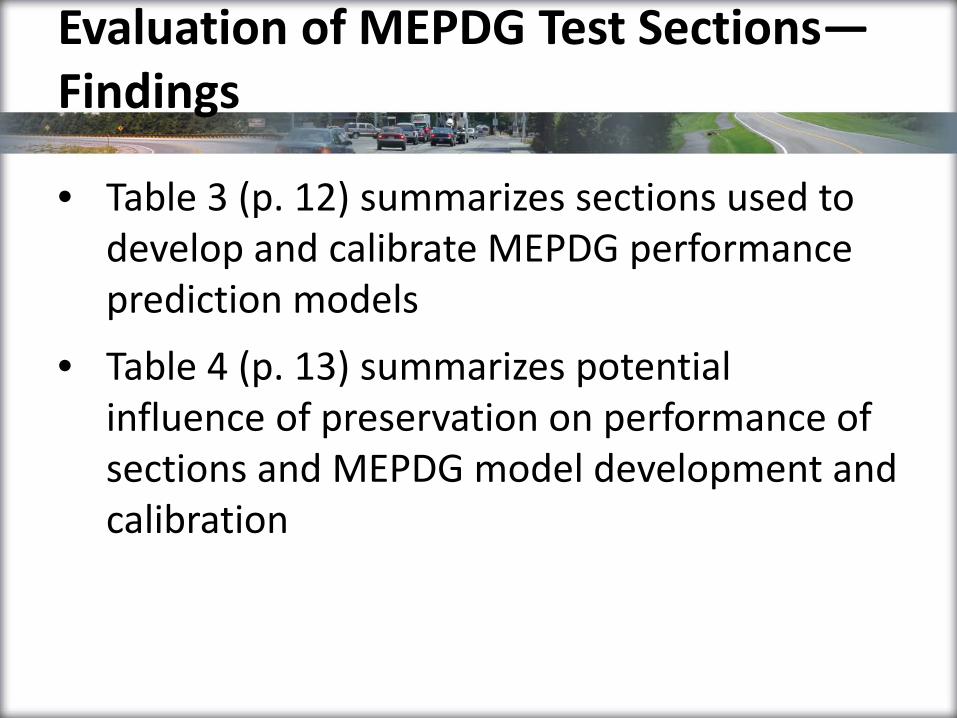
Evaluation of MEPDG Test Sections—Findings
• Table 3 (p. 12) summarizes sections used to develop and calibrate MEPDG performance prediction models
• Table 4 (p. 13) summarizes potential influence of preservation on performance of sections and MEPDG model development and calibration

Evaluation of MEPDG Test Sections—Findings (continued)
• Flexible pavement models (10): 2 NA; range from 2 to 67 percent [crack sealing, fog, slurry, seal coats]
• Rigid pavement models (9): 4 NA; range from 7 to 23 percent [joint resealing, crack sealing, PDR, FDR, a few instances of grinding/grooving]

Transition from Phase I to Phase II
• Phase I outcome: three approaches to consider effects of preservation in the MEPDG
– Develop pavement preservation response models
– Calibrate existing models for effect of preservation
– Modify material properties to account for preservation effects
Identified data to fully develop these approaches and their availability within SHAs. Conclusion – sufficient data not readily available.
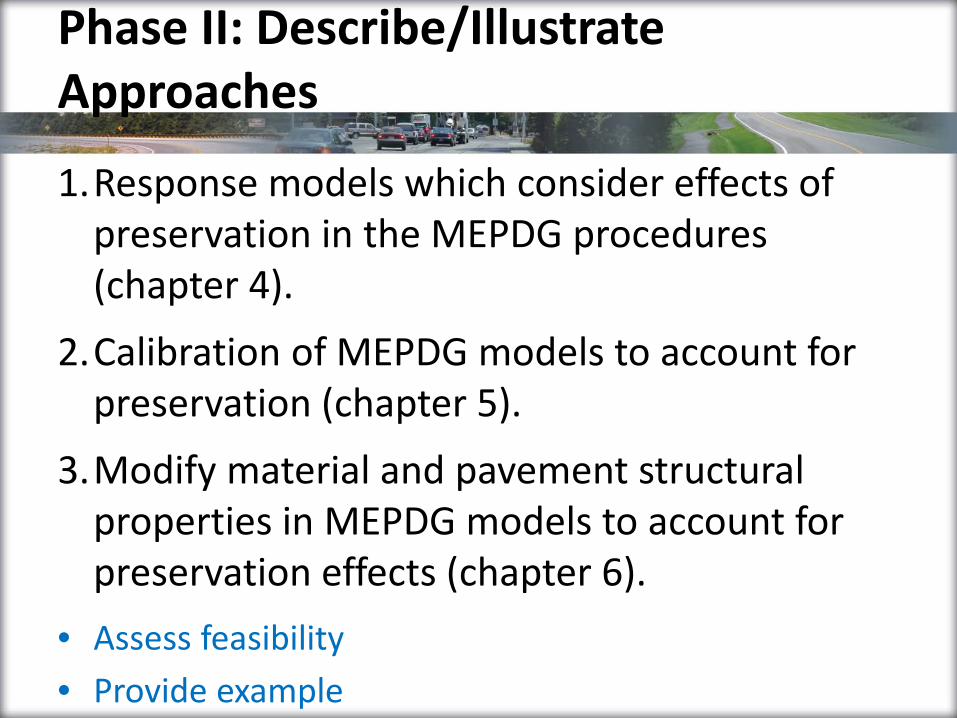
1.Response models which consider effects of preservation in the MEPDG procedures (chapter 4).
2.Calibration of MEPDG models to account for preservation (chapter 5).
3.Modify material and pavement structural properties in MEPDG models to account for preservation effects (chapter 6).
Phase II: Describe/Illustrate Approaches
• Assess feasibility • Provide example

Approach 1—Response Models
• Create experimental matrix and construct test sections
• Test sections dictated by variables of interest to agency
• Include controls (based on MEPDG design)

Response Models Steps
• Pavement preservation treatment and strategy selection
• Experimental design • Construct test sections/sites • Monitor performance • Develop performance models • Calibrate/validate models

Example Experimental Matrix
Climate Zone
Preservation Treatment
Flexible Pavement
Conventional HMA
Full-Depth HMA
Low-Volume State Routes
Moderate Volume US and
State Routes
Interstate and Freeway Routes
Wet, hard freeze, spring
thaw
(0) Untreated control Site 1 Site 2 Site 3 (chip seals excluded)
(1a) Chip seal @ Year 4 (1b) Chip seal @ Year 5 (1c) Chip seal @ Year 6 (1d) Chip seal @ Year 7 (2a) Microsurface @ Year 4 (2b) Microsurface @ Year 4 (2c) Microsurface @ Year 4 (2d) Microsurface @ Year 4 (3a) Thin HMA Overlay @ Year 4 (3b) Thin HMA Overlay @ Year 4 (3c) Thin HMA Overlay @ Year 4

Approach 2—Calibrate MEPDG Models
• Systematic process to eliminate bias and minimize residual errors between observed or measured real world results and predicted (model) results
• Assumes existing models do not, or don’t adequately, account for preservation

Calibrate MEPDG Model Steps1
1.Selected hierarchical input level 2.Develop experimental plan 3.Estimate sample size for specific models 4.Select roadway segments 5.Extract/evaluate distress and project data 6.Conduct field and forensic studies
1 From AASHTO Guide for Local Calibration

Calibrate MEPDG Model Steps (continued)
7. Assess local bias 8. Eliminate local bias of distress, IRI 9. Assess standard error of estimate (SEE) 10.Reduce SEE 11. Interpret results/evaluate adequacy of
calibration parameters

Approach 3—Modify Material and Structural Properties
• “Corrected” distress (or life) to reflect effects of preservation
• Correction consists of altering MEPDG outputs • Requires knowledge, understanding, or ability
to estimate effect of preservation treatments or strategies on predicted distresses

Model Modification Example
0.000
0.050
0.100
0.150
0.200
0.250
0.300
0.350
0.400
0.000 0.050 0.100 0.150 0.200 0.250 0.300 0.350 0.400
Mea
sure
d To
tal R
uttin
g, in
Predicted Total Rutting, in
Untreated Pres-Treated A Pres-Treated B
H0: bo = 0 and H0: m = 1.0(Linear Regression)R^2 = 0.29Se = 0.057Sy = 0.068Se/Sy = 0.838p-value (int) = 0.003p-value (slope) = 0.000Reject H0 (p-value <0.1)
H0: ∑(ymeas – xpred) = 0(T-test @10% significance level)n = 197Avg Pred Total Rut = 0.166 inAvg. Meas Total Rut = 0.098 inBias = -0.068 inp-value = 0.000Reject H0 (p-value <0.1)
y = 0.4322x + 0.0265R^2 = 0.2977

Steps to Modify Properties in MEPDG Models
1.Identify basic pavement structure and preservation treatment type
2.Identify preservation treatment timing 3.Identify baseline material properties of
pavement structure and treatment 4.Quantify treatment effect on thickness 5.Identify effect on existing layer material
properties and on moisture/thermal properties

6. Identify treatment effect on pavement performance
7. Establish MEPDG model coefficients 8. Perform base pavement ME design analysis 9. Perform ME design analysis for
preservation-treated design
Steps to Modify Properties in MEPDG Models (continued)

NCHRP 1-48 Outcomes and Recommendations
• Growing experience with use of preservation • Lack of agency documentation of impacts of
preservation • Recognition that preservation has ability to
extend service life and delay need for subsequent structural treatments
• Acknowledgment that preservation is not a structural enhancement and MEPDG is a structural design process
• More data needed to support implementation of identified approaches.
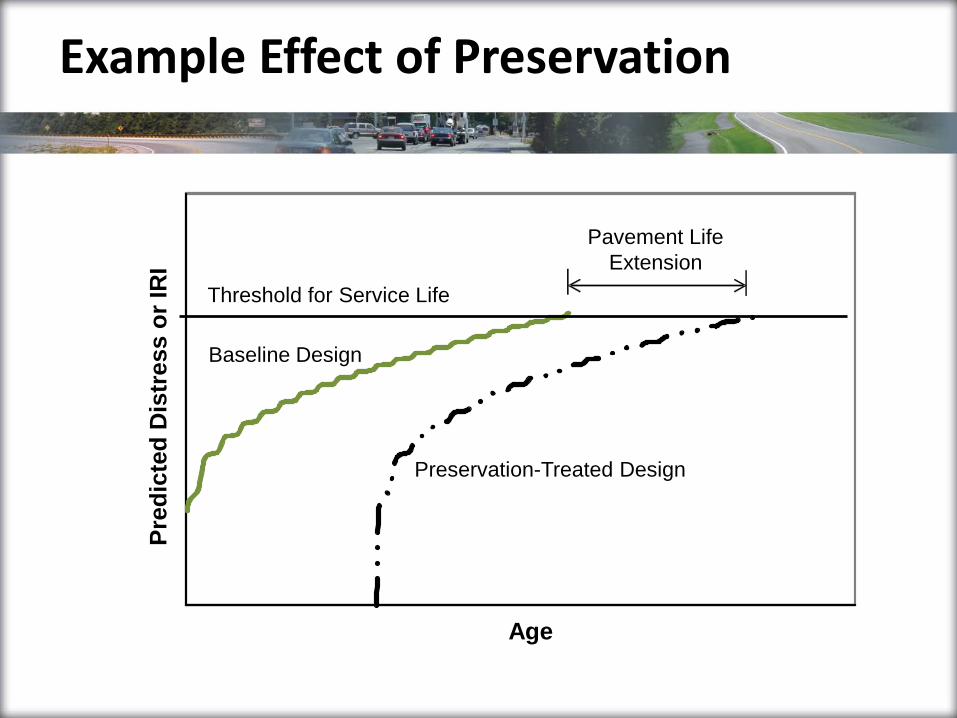
Example Effect of Preservation
Threshold for service life
Pred
icte
d D
istr
ess
or IR
I
Age
Baseline Design
Preservation-Treated Design
Pavement Life Extension
Threshold for Service Life

Questions and Discussion

Footer Text Date
Texas Department of transportation approach to pavement design
1

Footer Text Date
Table of Contents
2
5-6
38-41
42-45
46
3-4 Flexible Pavement Design in Texas
Design Process
Project Selection
Flexible Pavement Database
Summary
1
2
3
4
5

Footer Text Date
Flexible Pavement Design in Texas
Decentralized design – Most designs done in-house, usually in Area Offices (100+) – Construction Division provides support and training
Texas Network – Over 50% of network very thin surfaced asphalt pavements – Range of climates and soil support conditions
Materials Information – Thickness designs completed 1 – 2 years before materials selection – Designs currently based on spec item number

Footer Text Date
Traffic Data – Based on 20 Year 18 Kip ESAL’s – Extensive Axle load Spectra data not available
Implementation Status – Original FPS developed in the 1970’s – Current system implemented mid 1990’s – Training schools taught in-house and with University support – Experienced designers comfortable with results
4
Flexible Pavement Design in Texas
Footer Text Date
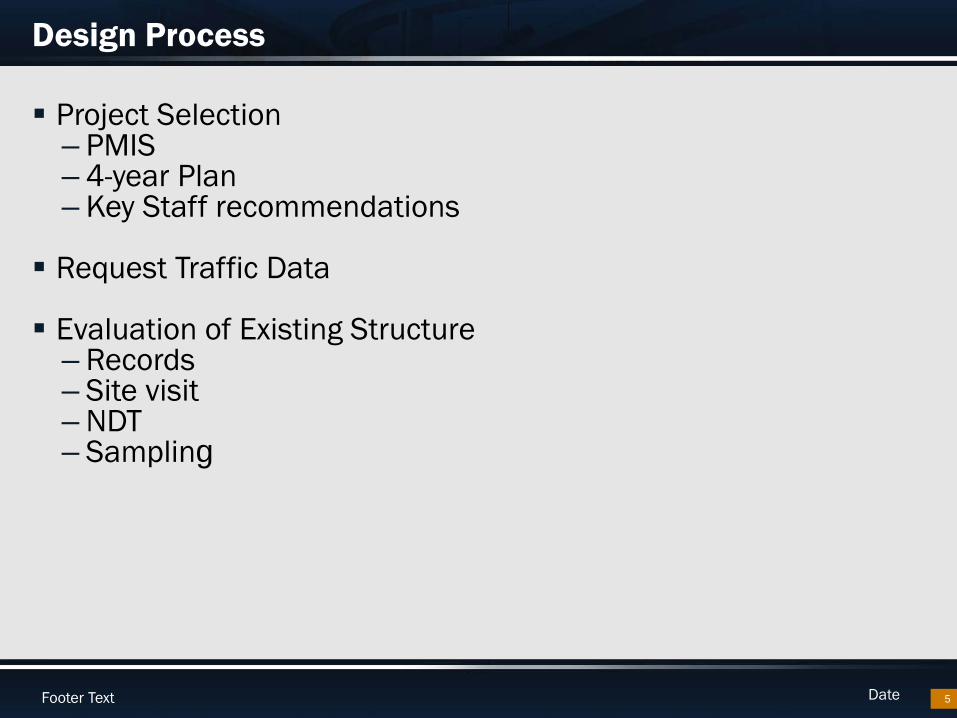
Design Process
Project Selection – PMIS – 4-year Plan – Key Staff recommendations
Request Traffic Data
Evaluation of Existing Structure
– Records – Site visit – NDT – Sampling
5

Footer Text Date
Design Process
6
Design
On Line Pavement Design Guide District SOP Pavement Design Concept Conference FPS 21 1993 AASHTO (DarWin 3.1) TxCRCP-ME
Materials Selection Standard & Special Specifications and Special Provisions Special Guidelines/SOP
Design Review

Footer Text Date
Project Selection
PMIS – Set of automated tools to help identify sections in most need
of improvement
– Present condition
– Multi-year trends
– Predictions of future performance
Staff Recommendations – Maintenance and Area Engineers
– District Pavement Engineer
– Planning and Development

Footer Text Date
Request Traffic Data
TP&P is the TxDOT “sole source”
TP&P manages statewide traffic data collection (WIM, Classification, Counts)
Critical Traffic input parameters include:
– Beg & End ADT
– % Trucks in the ADT
– ATHWLD
– Cumulative ESALs (20 or 30 yr)

Footer Text Date
Design Traffic Report

Footer Text Date
Evaluation
Records
– As-built drawings/plans
– Maintenance
– Soils Maps
Site Visit
– Drainage issues
– Cross slope/crown
– ROW issues
– Distress Survey

Footer Text Date
Evaluation (cont.)
NDT – Rut/Ride – Skid – Deflection – GPR – DCP
Sampling – HMA Cores – Soil Borings – Auger/Trench (FDR samples)
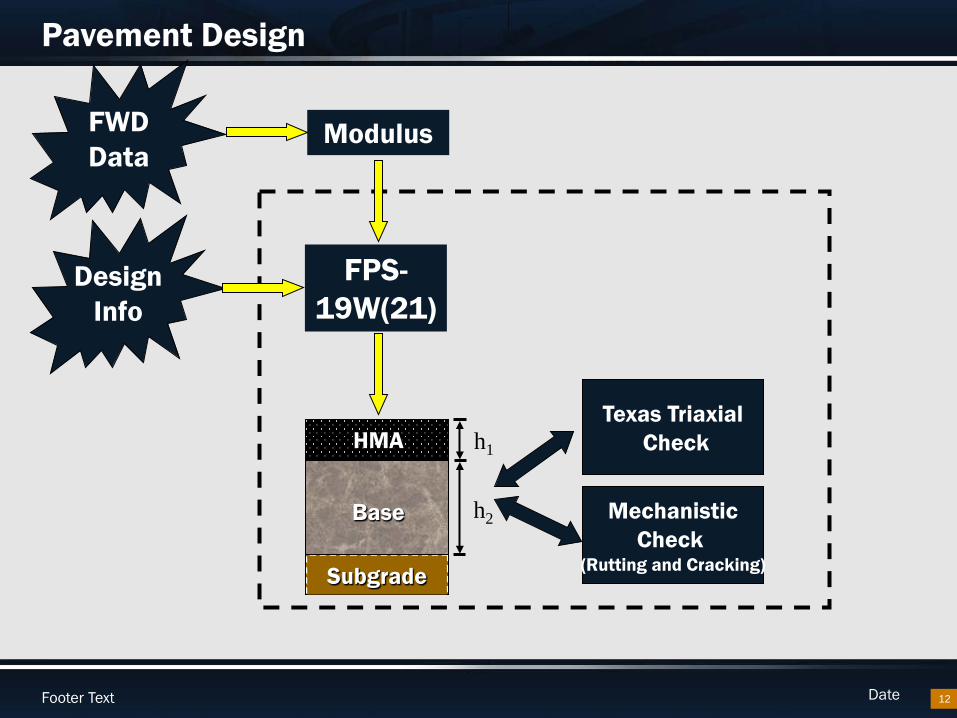
Footer Text Date 12
Modulus
FPS-19W(21)
Design Info
HMA
Base
Subgrade
Texas Triaxial Check
Mechanistic Check
(Rutting and Cracking)
h1
h2
Pavement Design
FWD Data

Footer Text Date
Pavement Design
13
Pavement Properties
Traffic
Reliability
Serviceability
Design Alternatives
Life-cycle Cost Initial Construction
Funding Available User Delay
Material Testing District SOP
FPS 21
Consider Constructability and material characteristics – Does the structure make sense ??

Footer Text Date
ericeability Index Time (years) Minimum Serviceability Index0 0 4.2 31 5 4 32 10 3 4 33 15 3.9 34 20 3.6 35 25 3 3
30 3
2
2.5
3
3.5
4
4.5
5
0 5 10 15 20 25 30
Serv
icea
bilit
y In
dex
Time (years)
Performance Curve
ACP Overlay
Initial Serviceability IndexServiceability Index after Overlay
Minimum Serviceability Index
Length of Analysis Period
Min. Time to First Overlay Min. Time Between Overlays
Performance Period 1 Performance Period 2

Footer Text Date
The Design Report – When is One Required?
A Design Report is Required For:
– Structural changes > 500-ft long, including:
• New Location Projects
• Reconstruction Projects
• Rehabilitation (3R) Projects
• Unbonded Concrete Overlays
– Special Cases:
• Document the Criteria and Rationale for the Strategy Selected
– Bridge Approaches
– Detours
– Pavement Widening
– HMA Overlays of Rigid Pavements
– Bonded Rigid Overlays of Rigid Pavement
– Thin Whitetopping of Flexible Pavement
15

Footer Text Date
The Design Report – Steps for Approval
Key District Players Agree on General Pavement Format: Design Concept Conference
Technical Review/Approval: District Pavement Engineer (License #) Final Approval: District Engineer w/Signature and Date (exception only
for Metro Districts, value < $20M). Qualifier statement: “This document is released for the purpose of
interim review and is not intended for bidding, construction, or permitting purposes.”
16

Footer Text Date
FPS 21 – Design Types
17
AC
Flex Base
Subgrade
AC
ASB
Subgrade
AC
ASB
Subgrade
Flex Base
AC
Flex Base
Subgrade
Stab. SG
AC
Base
Subgrade
Overlay
Use Existing Input File
2 3 4
5 6 8
Seal
Flex Base
Subgrade
1
SMA
HMA Binder Crs.
Subgrade
HMA Base
7
Stab. SG RBL
User-defined; 4 to 7 Layers

Footer Text Date
FPS 21 Strengths and Shortcomings
18
Does: •Flexible Base Pavements •Asphalt Stabilized Base Pavements •Lightly Stabilized Base Pavements (<3% Stabilizer) •Perpetual Pavements •Overlay Thickness
Does Not Do: •Heavily Stabilized Pavements •Concrete •Overlay on CTB or Concrete

Footer Text Date
Transition to M-E design
19

Footer Text Date
Future Direction
TxME Check
FWD Modulus
FPS 21
Lab Testing Data
Pavement Location
Max. and Min. Thickness Traffic

Footer Text Date
Contact Information
21
Magdy Mikhail Director Pavement Preservation Branch
Maintenance Division Texas Department of Transportation
Phone : (512)832-7210
E-mail: [email protected]

Footer Text Date
Questions
22

AN AGENCY LOOK AT CONSIDERING PRESERVATION IN
PAVEMENT DESIGN
Judith Corley-Lay June 27, 2016

Outline of Presentation
• Our review of Response Model approach • Our review of Calibrating MEPDG models • Our review of Modified Material and
Structural properties in ME models • So what can we do?

Response Models that consider effects of preservation.
Test Section Approach
• Would need test sections for full depth asphalt and aggregate base pavements.
• Regular aggregate and lightweight aggregate. • Control section, single chip seal and double
seal. • With and without polymer modifications.

Test sections
• Also need to include thin lift overlays. • 3 climatic zones • 2-3 traffic levels • Monitor for 7-10 years or longer • Replicates???

Test Section issues
• Experimental design dictates treating pavements at different points in time. Difficult to maintain this schedule over time.
• Would also need to conduct similar process for rigid pavement preservation, although our history here is short.

Calibrating ME models to Account for Preservation

Local Calibration
• Goal is to eliminate bias and make predicted distresses better match measured distresses.
• May reduce scatter in the data • Each distress has one or more coefficients
that are modified during local calibration.

Local Calibration approach
• Must cover a range of distress levels for each distress type.
• Large number of test sections is required. • Need 10 years of performance data- 4 years
before treatment and 5 years after. • May need field investigation to fill missing
data.

Using modified material and structural properties in ME models
Must identify exact impact of each preservation treatment • For example, microsurfacing may reduce rutting
by ½ inch. • Rejuvenator or fog seal will reduce the modulus
of the asphalt surface. How long will the reduction be maintained?
• Treatment may change the pavement structure: milling or diamond grinding.
• Treatment may change moisture/temp profile.

Drawback
• “A major drawback to this approach is the complexity of accurately defining the changes in properties resulting from the application of different preservation treatments at different times during the life of the pavement.”
• Some of this could be done through national research.

So what CAN we do?

NCDOT current view…
• We have performed 3 cycles of automated data collection that provide the necessary level of data accuracy and consistency.
• We do not yet have enough data to apply approach 2 (local calibration), but that approach will be feasible for us.
• We can identify test sections in preparation for using this approach.

Current view…
• NCDOT will be performing a local calibration in the coming six months.
• Since we have a long standing preservation program for flexible pavements, this local calibration may satisfy some of the method 2 requirements.

Conclusions
Consideration of Preservation in ME design
• Method 1 required years of consistency in applying treatments on a schedule.
• Method 2 requires local calibration, which NCDOT plans to do in the next 6 months.
• Method 3 requires carefully defining impacts of each preservation treatment on material properties, structure, distress levels, and moisture/temperature regime.

QUESTIONS?