Consideration of Global Climatoloav and Loadirm ... · the USCG study totals 69 vessels. ......
13
T,HE SOCIETY OF NAVAL ARCHITECTS AND MARINE ENGINEERS 601 Pavonia Avenue, %tite 400, Jereey City, New Jereey 07306 USA Paper’ pfesented at the Maine Smwtwal Ins@on, Mainterwws, snd t&nitming Sympc6ium Sblaton Naiiotd Hotel, Arlhq@n,: Wginia, Mm& 1&19, 1991 Consideration of Global Climatoloav and Loadirm Characteristics in Fatigue Damage-Assessment 6f Ship Structures Y.N. Chen and A.K. Thayamballi, American Bureau of Shipping, Paramus, New Jersey Abstract ~though the methodology for fatigue damage evaluation employed by other engineering disciplines is largely applicable to ship structures, there are some special co~iderations that are more relevant to ship structures than the land based or site specific offshore structures. The foremost among these considerations is the significance of wave ,climatology, or ‘the global variability of such since most ship structures are designed for global, unrestricted services, The second factor prominent in a fatigue msessment is the loading and structural characteristics of the local details which requires refined consideration of the loading statistics beyond the traditional consideration of hull girder ‘h loading. In this paper, the notions of various measures of climate severi~ are introduced. The significance of such ‘partieters in the” realm of different structural limit states, ‘the fatigue limit state in particular, is explored by examining the results parametrically. Rationale of developing the strategy and criteria for screening in an overall fatigue strength assessment for ocean going vessels are presented. 1. Introduction Up until the recent put, ship design based on a semi-empirical approach sut%ce~ an overwhelming majori~ of designers. From global and detail con@uratiOns to local scantli.pgs, answers are usually readily available from desgn handboob “ind/or classification Rules. In general, semi-empirical approaches evolve frorrL and often are spoken if synonymously with successful operating eqierience; so in fairness, a semi-empirical approach is not without merit. In fa~ in ternis of the first yield limit state and a number of serviceability requirements such as minimum thickness and minimum stiffness, the approach “has had a surprisingly excellent track record despite its simplicity.’ Other failure modes such as fatigue and buckling have not been considered in a conventional “’\ ‘design process with equal emphasis as first yield failure, if at all. Then the world maritime market becameincreasingly more competitive, partly owingto aseries ofenergycrises, whichcompelleddesigners to reducesteelweightintheirdesign.A clearpathto achievethatgoalk toreducescantling orincrease the percentage usageofhightensile steel(HTS),orboth. As a result, structures areoperating atahigherlevel ofstresses. Whilethisinitself doesnotcausedirect problemintheconsideration ofthefirst yieldlimit state, problemsinfatigueand bucklinghavebeen intensified. Thisissobecausethefatigue resistance capacities ofhigherstrength steelandweldmentare known tobe notsuperiortomildsteelswhilethe demand increases. Meanwhile,structural detail designsforHTS application weresimplytransported fromthemildsteeltechnology. Nowadays,itissafeto concludethatproponentsandopponentsofthesemi- empkicaldesignapproachareingeneralagreement thatdesignsshouldincreasingly relyon approaches basedon engineering ftindamentals orfirst principles. Classification societies’ Rule changes appear to confirmthistrendwiththeobjective ofavoiding such problemsinthefuture. Itwouldbegrossly over-simplified topinallthe emergingproblemsinshipstructures performanceto theuse“ofHTS.Theseproblems,eitherindividually orin“combination withtheuseofHTS, compoundand magnifytheproblemsstemmingfromtheuse of HTS. These include the overall local detail design, workmanship,maintenanceandrepair, corrosio~and vessel operatio~justtonameafew.Indepthprobing oftheseissues isoutofthescopeofthispaper.What willbefoeusedoninthispaperincludes issues directly affectingthe design”processsuch as thewave environmentanditsassociated loading, and loading combination. For example,when examiningthestructural htegr@ ofthedeckand bottomstructures, thehull girder loadingcanbeexpectedtobeprimary.Grillage bendingeffect, at leastforthe bottom structure, shouldbeconsidered secondaryandthelocalbending between stiffeners subjectedto hydrostatic and hydrodynamicpressure istertiary. Fortheanalysis of sideshellstructures, especially inthevicinity ofthe still waterline, hullgirderbendingwouldbefarless significant. The pressure loadingandshearmustthen be promotedtoprimarywhilelocalbendingwould VI-D-I
Transcript of Consideration of Global Climatoloav and Loadirm ... · the USCG study totals 69 vessels. ......

T,HESOCIETY OF NAVAL ARCHITECTS AND MARINE ENGINEERS601 Pavonia Avenue, %tite 400, Jereey City, New Jereey 07306 USA
Paper’ pfesented at the Maine Smwtwal Ins@on, Mainterwws, snd t&nitming Sympc6ium
Sblaton Naiiotd Hotel,Arlhq@n,: Wginia, Mm& 1&19, 1991
Consideration of Global Climatoloav and LoadirmCharacteristics in Fatigue Damage-Assessment 6fShip StructuresY.N. Chen and A.K. Thayamballi, American Bureau of Shipping, Paramus, New Jersey
Abstract
~though the methodology for fatigue damageevaluation employed by other engineering disciplinesis largely applicable to ship structures, there are somespecial co~iderations that are more relevant to shipstructures than the land based or site specific offshorestructures. The foremost among these considerationsis the significance of wave ,climatology, or ‘the globalvariability of such since most ship structures aredesigned for global, unrestricted services, The secondfactor prominent in a fatigue msessment is the loadingand structural characteristics of the local details whichrequires refined consideration of the loading statisticsbeyond the traditional consideration of hull girder‘hloading.
In this paper, the notions of various measuresof climate severi~ are introduced. The significance ofsuch ‘partieters in the” realm of different structurallimit states, ‘the fatigue limit state in particular, isexplored by examining the results parametrically.Rationale of developing the strategy and criteria forscreening in an overall fatigue strength assessment forocean going vessels are presented.
1. Introduction
Up until the recent put, ship design based on asemi-empirical approach sut%ce~ an overwhelmingmajori~ of designers. From global and detailcon@uratiOns to local scantli.pgs, answers are usuallyreadily available from desgn handboob “ind/orclassification Rules. In general, semi-empiricalapproaches evolve frorrL and often are spoken ifsynonymously with successful operating eqierience; soin fairness, a semi-empirical approach is not withoutmerit. In fa~ in ternis of the first yield limit state anda number of serviceability requirements such asminimum thickness and minimum stiffness, theapproach “has had a surprisingly excellent track recorddespite its simplicity.’
Other failure modes such as fatigue andbuckling have not been considered in a conventional“’\
‘design process with equal emphasis as first yieldfailure, if at all. Then the world maritime market
becameincreasinglymore competitive,partlyowingtoa seriesofenergycrises,whichcompelleddesignerstoreducesteelweightintheirdesign.A clearpathtoachievethatgoalk toreducescantlingorincreasethepercentageusageofhightensilesteel(HTS),orboth.As a result,structuresareoperatingata higherlevelofstresses.Whilethisinitselfdoesnotcausedirectproblemin theconsiderationof thefirstyieldlimitstate,problemsin fatigueand bucklinghave beenintensified.Thisisso becausethefatigueresistancecapacitiesofhigherstrengthsteeland weldmentareknown to be not superiorto mild steelswhilethedemand increases. Meanwhile,structuraldetaildesignsforHTS applicationwere simplytransportedfromthemildsteeltechnology.Nowadays,itissafetoconcludethatproponentsand opponentsofthesemi-empkicaldesignapproacharein generalagreementthatdesignsshouldincreasinglyrelyon approachesbasedon engineeringftindamentalsorfirstprinciples.Classificationsocieties’Rule changes appear toconfirmthistrendwiththeobjectiveofavoidingsuchproblemsinthefuture.
Itwouldbegrosslyover-simplifiedtopinalltheemergingproblemsinshipstructuresperformancetotheuse“ofHTS. Theseproblems,eitherindividuallyorin“combinationwiththeuseofHTS, compound andmagnifytheproblemsstemmingfromtheuse of HTS.These include the overall local detail design,workmanship,maintenanceand repair,corrosio~andvesseloperatio~justtoname a few.Indepthprobingoftheseissuesisoutofthescopeofthispaper.Whatwillbe foeusedon inthispaperincludesissuesdirectlyaffectingthe design”processsuch as the waveenvironmentand itsassociatedloading,and loadingcombination.
For example,when examiningthe structuralhtegr@ of thedeck and bottomstructures,thehullgirderloadingcanbe expectedtobe primary.Grillagebendingeffect,at leastfor the bottom structure,shouldbe consideredsecondaryand thelocalbendingbetween stiffenerssubjectedto hydrostaticandhydrodynamicpressureistertiary.Fortheanalysisofsideshellstructures,especiallyinthevicinityofthestillwaterline,hullgirderbendingwouldbe farlesssignificant.The pressureloadingand shearmustthenbe promoted to primarywhilelocalbendingwould
VI-D-I

become secondary. How these loading componentscombine pose an interesting taslq conceptually and inpractice as the supefiosition of the individualextremes can be overly conservative. Anotherpotentiaf pitfall that can be easilyoverlookedk toassumethatthestatisticalpropertiesofthehulfgirderstressescanbe blindlytransposedtocharacterizeotherloadcomponents.A casein pointiscontainershipfoiward‘hatchcomeredgestresswhichdiffersfromthehullgirderstresshiboth-theirprobabilitydistributionand theirdominantperiodbecauseoftorsionaleffects.Al thesepointsareimportantlessonslearnedfromrecentshipdesignanalyses.
bothertopicdescribedinthispaperishowtolookatthewaveenvironment’sdegreeofseverity.Itwillbe shownlater.inthispaperthata specificenvironmentcanexciteverysevereloadeffectsintherealmoftheultimatelimitstate(or,initsplace,thefirstyieldiimitstate)while.itmaynotcauseasmuchfatiguedamageasa “milder”environment,andviceversa.Rationalcriteriaareproposedforabaselinescreeningof theglobalwave statistics.Someinterestinginsightscan be derivedhorn suchevaluationsthatmay servew backgroundintheprocess.of developingrationalclassificationrequirementstoalleviateexcessivefatiguedamageinshipstructures. ,,
2. The U.S.”Coast Guard’s TAPSdamagestatistics
me precedirtgdiscussionstressingtheimportanceoffatigueconsiderationsintheshipdesign
proce,ssmay riinth~riskofbeingaccusedofacademic
evangelism,rather,than true lessonslearned. One
should alsoexamine “availabledamage statisticsthe
inferenceto which may lead to valuableexperience.By mid 1989, the U.S. Coast Guard had compiled andanalyzed; a set of darnage statistics collected for, theU.S, flag tanker fleet over 10,000 gross tons involvedin world trade; and in particular, those engaged in atrade known as Trans-AIMka.Pipeline Service (TAPS).Recogni@tg that fatigue induced fracture is aprevailing problem in some of the TAPS tankervessels, the USCG requested the American Bureau ofShipping (+BS) to convene a meeting with TAPSoperators and the USCG. Subsequent to that meeting,the data was ~e-analyzed and the USCGS reportdiscussing the failure experience of these vessels wasrecently issued [1] t,
It is not the authors’ intention to give an in-depth. analysis and evaluation of the USCG report,which is in open literature. (A detailed analysis andinference can be found in Reference [2].) Rather,some striking inference can be deduced andconclusions cited. These key points are highlighted asfollows:
“’
t Numbers in brackets dekignate Reference at end of paper.
,.
VI-D-2
1.
2.
,“
3.
4.
.!
The TAPS tanker vessel population included inthe USCG study totals 69 vessels. Theseaccounted for 13 percent of the “U.S. “flag s~psover 10,000 gross tons. However, ‘lhese shipssustained about 59 percent of the fepotiedstructural failure.
Of the 26 classes (individual designs) of vessels inthe stiple ship! poptilatio~ 6specitlc classes (24vessels) were foundmostproneto st~ctural’damages.Thesetop35percentaccountedfor2/3ofthereportedfakes.
Among the6 worstclasses,,theworstclassconsistingofsixshipksustairiedtwicetimanyreportedfailuresthanthe2 nextworstclassescombined.The6 shipsh theworstclasswere”builtwithI-ITS(36kg/cml) material throughouttheir cargo block.
Two third of the 6 worst classes ships were builteither patiially or totally of HT?3. “
In light of these inferences, it is clear that theuse of HTS at. least contributes partially,, butsignificantly to such a, disproportionately high rate oflocal structural failure. Specifically, the facts clearlypoints, in the words of the Coast Guard repoi-t, to,“poorly designed details, poor workmanship, andfati$e ...”..
Another subtle point cited in the report was thetime of occurrence. of the reported damages whichshowed a high concentration in the months betweenOctober and March. This fact was further translatedto heavy weather. Since the remainder of the U.S. flagshipsalsosailedduringtliisperiodandweresubjectedto heavyweather,the glaringhighrateof damagesustainedby theTAPS vesselscanbe attributedtotheseverityofthewave environmentaroundtheGulfofAlaska.
3. Fatigue assessment in the realm of asimplified method’
Within the framework of the Palmgren-Minerlinear, cumulative darnageformulatio{~ it appears thatthe most reliable method ‘of analysls.is full fledgedspectral analysis. Most.de;ign codes, however, chooseto adopt” a simplified fatigue evaluation formula.Strictlyi speaking, the most commonly employedsimplified fatigue evd,uation formulas share acommon basis ~th spectk~ fatigue amdysis. hng,term distribution”of the .,Stressrange can be obtainedfrom spectral analysis; and a simple mathematicaldistribution is fitted. Noi%mlly, a Weibulf distribution:is assumed. ,.” !“
Without loss of gerierality,the Weibull/spectralbased formulation” is ‘refeired to in, this paper. Thefatigue damage evaluation formula can be cast in theform [e.g., see Ref. [7])
D = (~~m)K) pl?(rn/h” + l)/[ln(~)]m/h.1
(1)
.,
,..

in which
p .1 + {“~mlh -I([m+Am]/h+l,u)=. -T(m/h+l,v)}/T(m/h+l) (2)
and
D“ = cumulativefatiguedamage
f = lifetimeaverageoftheresponsezero
crossingperiod[hz]
T = baselineduration(usuallytakenasthe
designlife)[see]
ST = longterm stressrangeasthemost
probableextremevalueintimeT
m,K- = parametersoftheupperbranchoftheS-Ncurve
h = Weibull shape parameter of the stressrange distribution
v = (&#T)h hl(~)
% = stress range at kink of S-N curve
~.(a,x) = incompletegamma function,Legendreform
r(a) = garnrnafunctionofargumenta
WithIheexceptionof“thefactorP,thedamageformulaiswell-known.The factorp,referredtohereastheendurancefactor,stemsfrom theexistenceofthelowerbranchoftheS-N curvewhichintersectstheupperbranch”atpointQ,.atwhichthestressrangeisdenotedbySq Ifthelowerbranchisabsent,p k equaltounity.
ltcanbe.readilyobservedthat,on.thepremiseofEq.(1)fora givenS-N curve,therelationcontainsthreeparameters,viz.,thedamage,D, thelongtermmost probableextremestressrange,ST, consistentwiththebasetimeperiod,-T,and theWeibullshapeparameter,h. Evidently,iftwo ofthese,parametersareknow thethirdcanbe obtained.Forinstance,ifh and ST We known, the “damage and thus the fatiguelife (equal to T/D), can be easily computed. This isthe primaiy ’purpose of the formula. On the otherhand, if ST and the damage qe, known (say, obtainedfrom spectral analysis), the shape parameter can bebackward calibrated applying the equal damagecriterion. It is the authors’ contention that this is themost reliable fashion to obtain the Weibull shapeparameter if it is to be used subsequently for. thefatigue as,sessmegt process in the context of theWeibull based simplified fatigue. calculation.
The backward calibration of the Weibull shapeparameter has been carried out within the frameworkof Eqs.( 1-2) in a typical spectral, fatigue analysis. First,the endurance factor, ~, is set equal to unity while the
\ actual S-N curves employed in the spectral fatigue
analysis have two branches. The resulting Weibullshape parameter is plotted in Figure 1 for twodifferent wave environments as indicated in the figure.The calculation for h is then repeated usingappropriate values of the endurance factor, ~,according to Eq.(2) and the resulting h values areshown in Figure 2. Evidently, when 2-segment S-Ncurves are used to obtain ~ and D, the use of Eq.(2)to compute P is necessmy and it provides a morerational representation. .
VI-D-3

Referring to Figure 2, someinterestingfeaturescanbe obsemed. FimL the Weib”ull shape parameterexhibits a fairly stiong dependency upon the waveenvironment. As it will be demonstrated in a laterpart of this paper, a higher shape parameter wouldresult in an ~even more dramatically higher fatiguedamage. Thus, the shape parameters in a simplifiedfatigue analysis need to be a function of the waveenvironment to which the structure is exposed.Secondly, on the basis of the first obse~ation+ thewave environment that gives rise to generally highervalues for the Weibull shape parameter (referred to asJS-01 here) can be said to be more hazardous than theone corresponding to lower shape parameter (referredto as JS-02 here) as far as fatigue damage isconcerned. However, the JS-02 environment wouldresult in greater most probable extreme stress rangethan JS-01 as the data points belonging to the JS-02environment extend ‘tirther to the right. It can thus beinferred that the severity of the wave environmentshould be measured with ,.different criteria for variousconsequences (e.g., mrcumum stress versus fatiguedamage). ‘
It would be beneficial at this juncture to takeinventory of several key points relevant to the Weibullbased simplified fatigue calculation. First andforemost is the long term stress range shapeparameter. It should be appreciated that, in thecontext of fatigue, this parameter depends strongly onthe wave enviromnent to which the structure isexposed. Secondly, the response characteristics suchas the dominant “frequenq (or period) in the responsestress range transfer function also play an importantrole. Figure 3 is a manifestation of this point. In thisfigure, a number of vessels for unlimited global seti’cefall into a wide range of stress range shape parameter,Such a wide spread can be attributed to the -variousdominant response periods. Thirdly, the scatter of theWeibull shape parameter must be recognized andproperly dealt with, Finally, a special form of thedamage formula featuring the endurance factor, ~,” isnecessary for the formula to be applicable to classes ofS-N curves having two segmerits.
Figure 3 Weibull shape parameter for long termdistribution of response for various vessels
VI-D-4
While these key pointswere drawn from theframework of a Weibullbased simplifiedfatigueanalysis,itshouldbe notedthatthephysiaassociatedwith the firsttwo points,viz.,referringto thecharacterizationofwave severityand”itsdependenceon thewave environmentand thesignificanceofthestructuralcharacterist@areequallyrelevanttootherformulationsforfati~eanalysis.
4. Wave intensi~ and response severitymeasures
When speaking of intensity of the waveenviromnent one should also refer to the responseseverity in order to place the term in a proper cgntext.On the one hand, the severity of various waveenvironments can be measured by, for example,. themaximum wave height associated. with theseenvironments. On the other hand, when a givenmarine structure (e.g., a ship), is exposed to thesewave environments, {he consequence of the waveseveri~ is to be quantified in terms of some otherparameters such as the most probable extreme valueof a certain limit state (e.g., the stress range) , or thefatigue darnage incurred by the structure at somespecific locations. In other words, when the samemarine structure is exposed to a more severe waveenvironment compared with ~a “milder” environment,ranked according to the maximum wave height, thecorresponding most probable extreme and the fatiguedamage need not reflect the same ranking of severity.This argument can be extended even further. Theseresponse’ variables, ”even when corisidered within” thesame wave environrnen6. can reflect different degreeof intensity depending-upon the frequen~ (or period)contents of the envirotmient with respect to those thatdominate different structural responses.
In order to demonstrate the preceding notio~five wave environments identified as GP-128, GP-199,Alaska-Californi~ Alaskd-Yokoham~ and Europe-New York are considered. The location of the grid-points are shown in Figures 4-a and 4-b. The Alaska-to-California region covers the route stretching fromthe Gulf of Alaska to Southern California which isrepresented by the colktioh of grid-points 145, 199,168, and 156. The corresponding grid-points thatconstitute the Alaska-to-~okohama route and theEurope-to-New York route are “199,145,016, 088; 295,and 181,184,187,288,2’75jrespectively.Inaddition,asixthwave environmentknown as theH-family[3,4]spectra,iialsoemployedforthisprocess.The H-farnilywave spectraarebtiedon measuredwave dataand ithasbeenused’fiequendyasa databaseattheAmerican Bureau of’Shippingforthe purpose ofcalibratingthelongimdinalstrengthrequirementforoceangoingvessels.Dataforallthegrid-points(otherthantheH-family)arerepresentedby wave scatterdiagramsderivedfrom the U.S. Navy Heet NumericWeather Central hindcast data base using the SpectralOcean Wave Mo@el (S~WM) [5].
Short term extreme wave analysis can becarried out for the H-family wave spectra in
..... -

conjunction with the probability of occurrence of theindividual spectra Similar short term analysis cars be
“~ carried out for all the wave scatter diagrams identifiedby the wave characteristic period of a given regio~weighted by the H~:Tz joint probability., The resultsare shown in Figure 5.
Figure 4-b Hindcait wave data grid pointdesignatio~ Atlantic Ocean
01
D I -~ \%0 2.0 u-o 6.0 6.0 10.012.0 IU. o 16.016.020.
TI [8ecmd,l
Figore 5 Extreme wave height versus me~ waveperiod for various environments
Clearly, in terms of the maximum wave heigh~the regions can be ranked in terms of wave intensity inthe !order bf GP-199, Alaska-Californi& Alaska-Yokoham& GP-128, and the H-family. On the otherhand, if a vessel, whose dominant period (as reflectedby the peaks of the wave induced bending momentRAO) is h the order, say, 10 seconds, is exposed tothese wave environmen~ the long term most probableextreme bending moment is expected to beproportional to the wave intensity in tie windowaround 10 seconds. On this basis, the H-family spectrawould probably “giverise to a highest bending momentwhile the ship’s response to other environments wouldlikely be roughly the szrne but somewhat lower thanthe response to the H-family wave envirormient. Thisexpectation has been confirmed by results of actualship motion analysis [6]. In any eveng the responseseverity on this basis need not reflect the waveintensity ranldng baaed on the “ill time maximum”wave height. It can be anticipated that nor would itnecessarily reflect the severity of the cumulativedamage incurred: This point will be further examinedafter the necessmy parameters are introduced.
Measuring Parameters of the Wave Environment andResponse
For the purpose of this paper, the term“response severity” (hereafter simply the “severity”)refers to the severity of the most probable extremevalue (MPEV), normalized with respect to the MPEVobtained” when the structure is exposed to thereference (or “NORM”,N) wave environment. To thisend, the region Europe-to-New York is chosen as thenorm. Thus, a response severity parameter, RS, isdefined as
Response severity parameter (RS) = MF’EV/[MPEqN (3)
Similarly, a fatigue severity parameter, FS, can bedefined as
Fatigue severiry parameter (FS) = D/~ (4)
A third parameter measuring how vulnerable a
structure is to fatigue damage in a given wave
environment can be introduced, separating the fatigue
vulnerability parameter from the response severity
parameter as follows:
Fatigue vulnerabfi~ parameter (lW) = FS/RSm (5I
For demonstration purposes, a set of stress
range transfer functio~ coi-resportding to all wave
headings (at 30 degrees apti) is selected. Spectralfatigue analysis can be pursued in a straight-fonvardfashion. Standard Bretschneider spectral form isassumed for this calculation. In the same process, theshort term extreme stress range ean be determined inconjunction vdh the known joint probability (for thegiven pair I& and T~ of the given wave scatterdiagram. The results are summarized in Table 1below.
VI-D-5
It can be readily .obsewed under the column“RS” that the most probable extreme stress range usingthe H:fa@ly wave spectra is the highest among the six“regions” while the others exhibit roughly the samevalues, which .conhrns the indication obse.med fromFigure 5. The grid-point 199 (Gulf of Alaska) showsthe highest fatigue vulnerabili~ while having thesecond highest response severity and the highestfatigue severity. In any we, the tabulated valuesindicate that ranking. based on RS and FV can bevastly different, while neither follows the pattern of the“wave intensity” measured by the maximum waveheight of ihe regions, ,@ fa-~ the H-family data resuhsin the smallest wave ,intensity while it is associatedwith the highest response, severity.
.-.-, ,. ..,”.. . . . ., . ..
to wave environment,,
TRegion Rs.
GP-l& 1.030GP.1S9 1.151
Alaska-Cahfornia. 1.087.
Alaska-Yokohama 1.069
Europe-New York 1.0
I--family - 1.341
FS FV
I
Waventensity
1.5872.3141.3291.5851.02.031
1.4541.5181.0351.2961.00.842
1.0081.3091.2361.2031.00.952
The Role of Sti-ucturalCharacteristics
“’As mentioned previously, the fact that the RSranking differs from that based on wave intensitynotwithstanding, the RS notion and the wave intensitynotion are really both. imbedded in the informationcontained in Figure 5. The difference is that the RSmeasure depends upon the structural characteristics interms of the “peak ‘period of dominant period of theresponsetr~fer tinction.ln order~o probe theinfluenceofthedominantperiodofthestructure,thesetof“standard”transferfunctionsemployedfortheresultsofTable1canbe used.The transferfunctions,wiich“are given in terms of the wave period, can beshifted uniformly so that the dominfit periods areshifted uniforrrdv for all wave headines. Standard.spectral analysis “sigdl& to that used to obtain resultsin Table.1 can be repeated.
h mentioned in Section 3 in the foregoing, inthe realm of a simplified fatigue analysis, the.parameters entering the governing equation are themost probable extreme stress range, ST, thecumulative damage, D, ad the Weibull shapeparameter,h,of the long term exceedance table of thestress range. For the purpose of the present work, STis determine-dthrougha.shortterm extremevaluecalculationandthecumulativedarnage,D, isobtainedthroughthespectralfat@e analysis.Once thesetwoparameters-areavailable,theequaldarnagecriterioncanbe appliedand theWeibullshapeparametercanbe obtainedthroughbackwardcalibration.Itcanbereasonedthatthe Weibullshape parameteris aconvenientmeasureforthefat@e vulnerability.The
VI-D-6
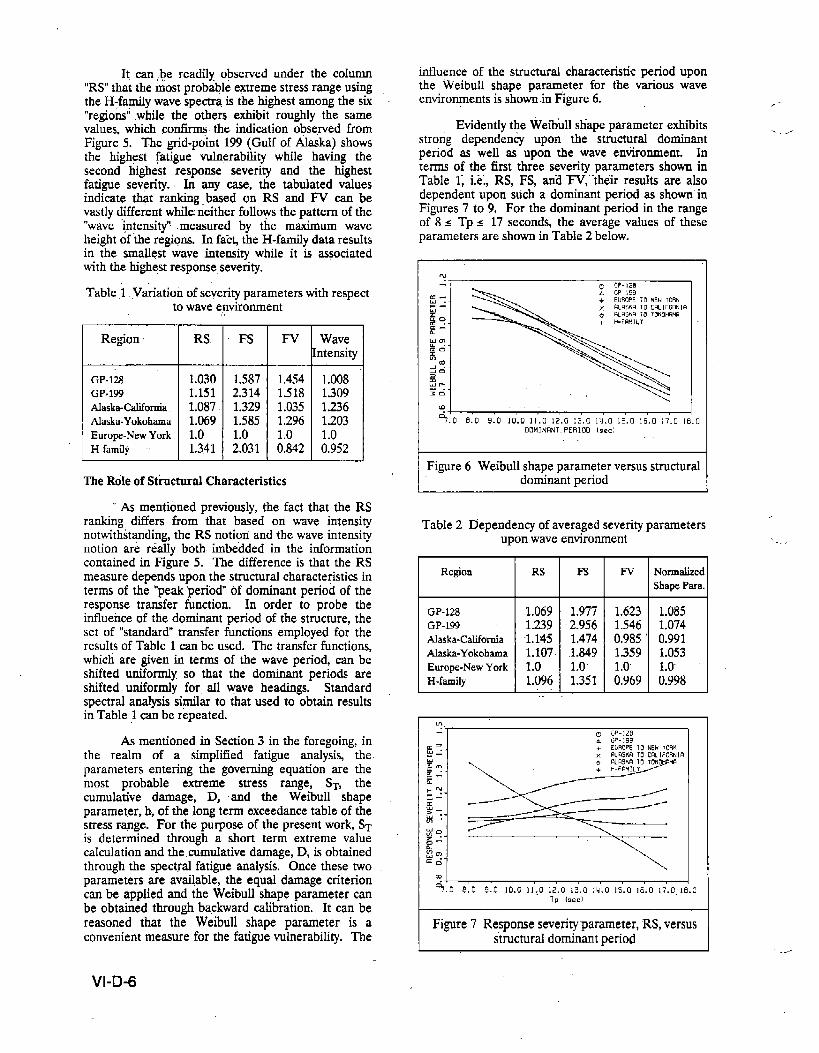
influenceofthestructuralcharacteristicperioduponthe Weibullshapeparameterforthevtious waveenvironmentsk showr.inFigure6. F-.
EvidentlytheWeibi.dlsliapeparameterexhibitsstrorigdependen~ upon the structuraldominant
........
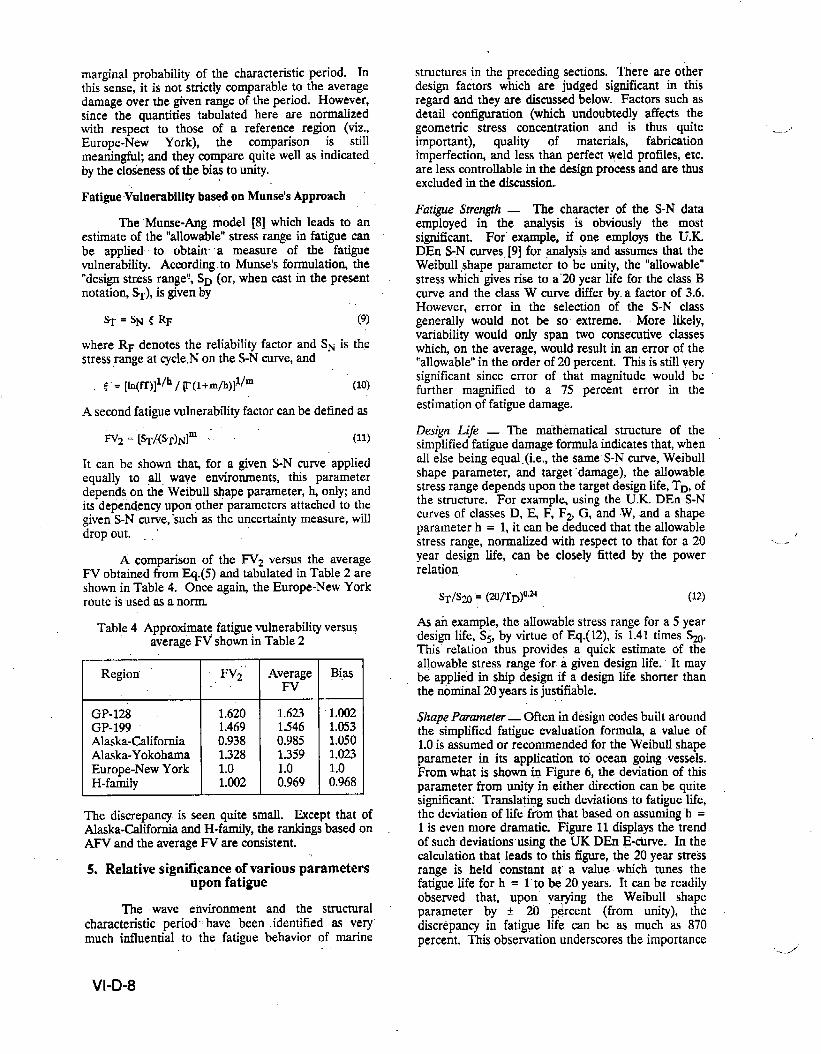
periodas wellas upon thewave environment.Interm ofthefirstthreeseverityparametersshown inTable 1;i.e.,RS, FS, arid~,” “theirresultsarealsodependentupon sucha dominantperiodasshow” inFigures7 to9, Forthedornhmntperiodintherangeof8 s Tu s 17 seconds.theaveragevaluesoftheseparamet&s are shown in’Table 2 beiow.
m
%.0 8.0 9.0 10.011.0 12.0 13.0 lu. o 15.0 16,0 17.0 IB.ODOMINRNT, PERlOn (SKI
Figure 6 Weibull shape parameter versus structuraldominant period
Table 2 Dependency of averaged severity parametersupon wave environment
LRegion
GP-K?8
GP-l!W
Alaska-California
Alaska-Yokohama
Europe-New York
H-family
RS
1.0691.239“1.1*51.107.1.0’1.096
-
1%
1.977-2.956
1.474.1.8491.0”1.351
f
Fv Norndzed
Shape Para.
L623 1.0851.546 1.0740.985 0.9911.359 1.0531.0 1,0”0.969 0.998
,“-.: I m r,P-17R
\
?~?.0 .8,0 9.0 10.0 I1:D12.0 13.0 IU.O 15.0 16.0 17. OIE
TP (secl
Figure 7 Response severity parameter, RS, versusstructural dominant period
.... ,.
.---

w%.0 8.0 9.0 10.0 11.012.0 13.0 IU. O 15.016 .017.0 18. [
Figure 8 Fatigue severi~, parameter, FS, versus
‘:~+.0 6.0 9.0 “IO.O 11.0 .12.0 13.0 111.o15,0 16.0 17.0 1
Figure 9 Fatigue vulnerability parameter, FV,versus structural dominant period
Here, the Weibull shape parameter shown isalsonormalized with respect ‘to ~he norm (i.e., withrespect to the average shape parameter of the Europe-to-NY route). II can be deduced that, for the waveenviron&ents considered here, the normalized shapeparameter raised to the sixth power is approximatelyequal to the fatigue vulnerability parameter, FV. Onthis premise, the ordinate of Fi@re 5 offers a quickmeasure of the fatigue “wlnerability of the regions.Moreover, once agaiw the three severity parameters(i.e., RS, FS, and FV) give different ranking of theseverity of ,the wave environments considered.
Fatigue Vulnerability Based On Wave Data
In light of the notion of fatigue vulnerability’factor, FV, introduced in the foregoing,. theparticipating parameters are the fatifle damage andthe most probable extreme stress range associatedwith the wave eim-ironmertt considered. Chen andMavrakis. [7] suggested a simple algorithm” for theevaluation of the equivalent significant heights forfatigue damage estimate in conjunction with thecommonly used format of the wave scatter diagramApplicable to l-segment S-N curves, the equivalentsignificant wave height representing all sea stateshaving a characteristic period .Tj is given by
H j = ~ p ijH ijm/p j]I/m (6)
in which p ij is the joint probability of the pti (H ij,Tj)and
Pj=ZPij (?I
is the marginal probability of all sea states associatedwith the characteristic period Tj. m is the negativeslope of the l-segment S-N curve and the range ofsummation covers all sea states in that group, i.e., withrespect to the index i. The darnage incurred from allsea states associated With Tj is proportional to HjmpfSince only the normalized damage is of interest in thefatigue vulnerability parameter, the constant ofproportionality is not required. Hence, a damagefactor, d, associated with the wave environmentconsidered is given by
d = z ‘im?i (8)
The summation operates on the index j.
Although this simple algorithm is limited to 1-segment S-N cumes, it is approximately applicable toZ-segment curves provided that the negative slope ofthe S-N curve, m, is adjusted upward. In the exampleshown in Table 3, m is assumed to be adjusted to 3.8for cases in which m = 3.
Table 3 Approximate damage vs. average damage
Region
GP-128GP-’199Alaska-CaliforniaAlaska-YokohamaEurope-New YorkH-family
~ol-malkec
D,approx
1.905
3.000
1.521
1.858
1.0
1.537f
vonnalized Bias
D, SpCCtr~
1.977 1.0372.956 0.9861.474 0.9691.849 0.9951.0 1.01.35”1 0.879
The equivalentsignificantwave heightgivenin
Eq.(6)isplottedinFigure10, Noticetheapproximate
damage measuregiveninEq.(8)essentially;epresentstheareaundera curveinFigure10 weightedby the
T] (seconds)
Figure 10 Equivalent significant wave height versusmean wave period
VI-D-7
mafiginal probability of the characteristic period. Inthis sense, it is not strictly comparable to the averagedamage over the given range of the period. However,since the quantities tabulated here are normalizedwith respect to those of a reference region (viz.,Europe-New York), the comparison is stillmeaningful; and they compare quite well as indicatedby the closeness of tie bias to unity.
Fatigue Wlnerability based on Munse’s Approach
The “Munse-Ang model [8] which leads to anestimate of the “allowable”stress range in fatigue canbe applied to obtain- a measure of the fatiguevulnerability. According. to Munse’s formulatio~ the“design stress range”, SD (or, when cast in the presentnotatioq ~), is given by
q=SNfRF (9)
whereRF denotesthereliabilityfactorand SN k thestressrangeatqcle,N on the S-N curve, and
(lo)<”=[k@)]~/h / ~(l+m/h)]l/m
A second fatigue vulnerability factor can be defined as
ivl =“[sT&)N]m .“, (11)
It can be shown tha~ for a given S-N curve” appliedequally to all wave environments, this parameterdepends on the Weibull shape parameter, h, ord~ andits dependency upon other parameters attached to thegiven S-N curve, ‘such as the uncertainty measure, willdrop out.
A comparison of the FV2 versus the averageFV obtained from Eq.(5) and tabulated in Table 2 areshown in Table 4. Once agai~ the Europe-New Yorkroute is used as a norm
Table 4 Approximate fatigue vulnerability versusaverage FV shown in Table 2
,.
Region
GP-128GP-199Alaska-CaliforniaAlaska-YokohamaEurope-New YorkH-family
FV2 Average BiasFv
1.6201.4690.9381.3281.01.002
1.6231.5460.9851.3591.00.969
1.0021.0531.0501.0231.00.968
The discrepant k seen quite small, Except thatAlaska-California and H-family, the rankings based onAFV and the average N are consistent.
5. Relative significance of various parametersupon fatigue
The wave eiwironment and the structuralcharacteristic period’ have been identified as verymuch influential to the fatigue behavior of marine
.,
W-D-8
structures in the preceding sections. fiere are otherdesign factors which are judged significant in thisregard and they are discussed below. Factors such asdetail contlguration (which undoubtedly affects thegeometric stress concentration and is thus quite -. ...important), quality of materials, fabri=tionimperfection and less than perfect weld profiles, etc.are less controllable in the design process and are thusexcluded in the discussion..
Fatigue Strength — The character of the S-N dataemployed in the analysis k obviously the mostsignificant. For example, if one employs the U.K.DEn SIN curves. [9] for .@ysis and wsurnes that theWeibull shape parameter to be unity, the “allowable”stress which gives rise to a “20year life for the class Bcurve and the class W curve differ by.a factor of 3.6.However, error in the selection of the S-N classgenerally would not be so extreme. More likely,variability would ordy span two consecutive classeswhich, on the average, would result in art error of the“allowable”in the order of 20 percent. Thk k still verysignificant since error of that magnitude would befurther magtiled to a 75 percent error in theestimation of fatigue damage.
Desi~ Lye — The mathematical structure of thesimplified fatigue damage formula indicates that, whenall else being equal .(i.e., the same” S-N curve, Weibullshape parameter, and target “damage), the allowablestress range depends upon the target design life, TD, ofthe structure. For example, using the UK DEn S-Ncurves of classes D, E, F, F2 G, and W, and a shapeparameter h = 1, it can be deduced that the allowablestress range, normalized with respect to that for a 20
?z....,.
year design life, can be closely fitted by the powerrelation.
sT/s~ ‘=(~jTD)O.a (12)
As ah example,theallowablestressrangefora 5 yeardesignlife,S5,by virtueofEq.(12),k 1.41times~.This”relationthusprovidesa quickestimateof theallowablestressrangefora givendesignlife.”It maybe applied in ship design if a design life shorter thanthe norninaI 20 years is justifiable.
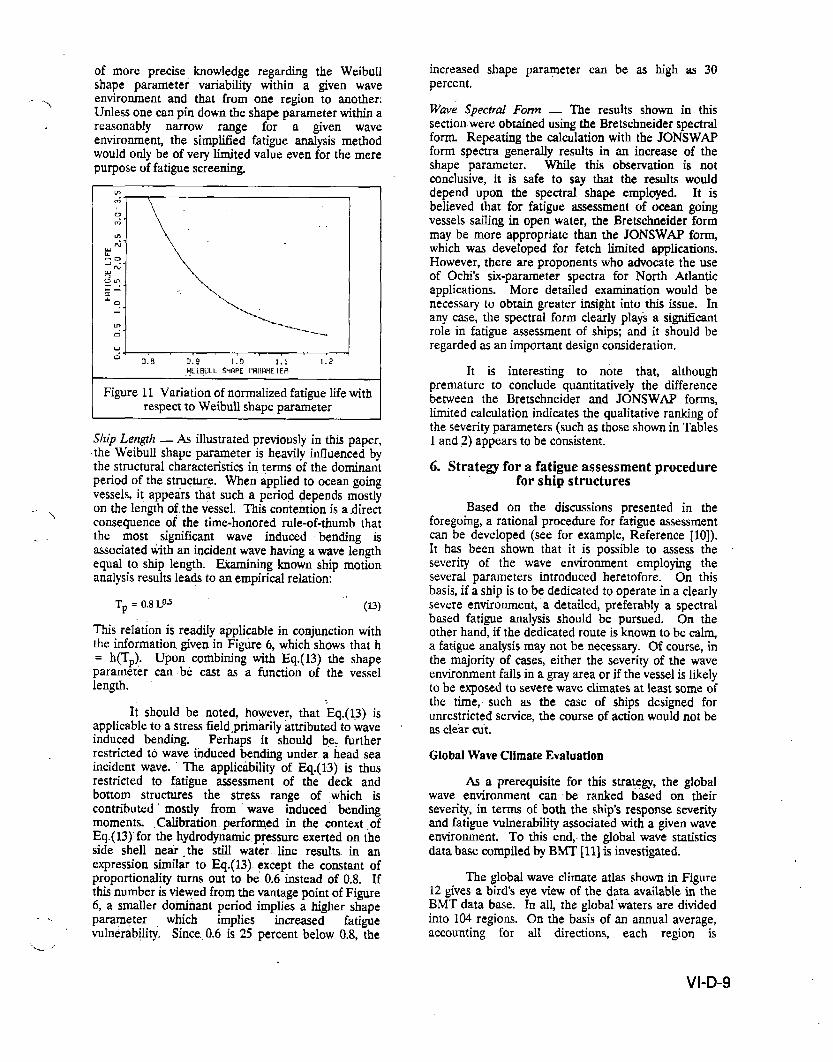
Shape Parameter — Often in design codes built aroundthe simplified fatigue evaluation formula a value of1.0 is assumed or recommended for the Weibull shapeparameter in its application to ocean going vessels.From what is shown ~ Figure 6, the deviation of thisparameter from unity m either direction can be quitesignificant:’ Translating such deviations to fatigue life,the deviation of life Porn that based on assuming ‘h =1 is even more dramatic. Figure 11 displays the trendof such-deviations using the UK DEn E-cusve. In thecalculation that leads to this figure, the 20 year stressrange is held constant at’ a value which tunes thefatigue life for h = I’to be 20,years. It can be readilyobserved that, upon varying the Weibull shapeparameter by + 20 p~rcent (horn uni~), thediscrepancy in fati~e life can be as much as 870percent. This observation underscores the importance
-../
of more preciseknowledgeregardingthe Weibullshape parametervariabilitywithina givenwave
““\environmentand thatfrom one regionto another:Unlessonecanpindown theshapeparameterwithinareasonablynarrow range for a given waveenvironment,the simpliGedfat@e analysismethodwouldonlybe ofverylimitedvalueevenforthemerepurposeoffatiguesc~eening.
:~
HE I BULL 5HRPE PWI13HE 1 ER
Figure 11 Variation of normalized fatigue life withrespect to Weibull shape parameter
Ship Length — & illustrated previously in this paper,the Weibull shape parameter is heavily influenced bvthe structural char~cteristics in terms if the dornina~tperiod “ofthe st~cture. When applied to ocean goingvessels, it appears that such a period depends mostly
““””\on the length of. the vessel. This contention is a directconsequence of the time-honored rule-of-thumb thatthe most significmt wave induced bending isassociated tith an incident wave having a wave lengthequal to. ship length. Ihrnining known ship motionanalysis results leads to an empirical relation:
Tp = 0.8 Los (13)
Thisrelation is readily applicable in conjunction withthe information. given in Fi@re 6, which shows that h= h(TP). Upon combining with Eq.(13) the shapeparameter can be cast as a function of the vessellength.
Ii should be noted, however, that ‘kq.(13)- iSapplicable to a stress field ,primarily attributed to waveinduced bending. Perhaps it should be: furtherrestricted to wave itiduced bending under a head seaincident wave. The applidbdity of Eq(13) is thusrestricted to fatigue assessment of the deck andbottom structures the stress range of which iscontributed mostly from wave induced bendingmoments. Calibration. pm-formed in the context. ofEq.(13)” for the hydrodynamic. pressure exerted on theside shell near .the st~ water. line results ti anexpression similar to Eq.(13). except the constant ofproportionality turns out to be 0.6 instead of 0.8. Ifthis number is viewecl from the vantage point of Figure6, a smaller doinitiant period implies a higher shape
., parameter which implies in~eased fatiguevulnerabili$. Since.,0.6 is 25 percent beliw 0.8, the
‘.+ ...
increased shape parameter can be as high as 30percent.
Wuve Spectral Fortn — The results shown in. thissection. were obtained using the Bretschneider spectralform Repeating the calculation with the JONSWAPform spectra generally results in an increase of theshape parameter. While this observation is notconclusive, it is safe to say that the results woulddepend upon the spectral shape employed. It isbelieved that for fatigue assessment of ocean goingvessels sailing in open water, the Bretschneider formmay be more appropriate than the JONSWAP fo~which was developed for fetch limited applications.However, there are proponents who advocate the useof ochi’s six-parameter spectra for North Atlanticapplications. More detailed examination would benecessary to obtain greater insight into this issue. Inany cwg, the spectral form clearly plays a significantrole in fatigue assessment of ships; and it should beregarded as an important design consideration.
It is interesting to note that, althoughpremature to conclude quantitatively the differencebetween the Bretschneider and JONSWAP forms,limited calculation indicates the qualitative ranking ofthe severity parameters (such as those shown in Tables1 and Z) appears to be consistent.
6. Strategy for a fatigue assessment procedurefor ship structures
Based on the discussions presented in theforegoing, a rational procedure for fatigue assessmentcan be developed (see for example, Reference [10]).It has been shown that it is possible to assess theseverity of the wave environment employing theseveral parameters introduced heretofore. On thisbasis, if a ship is to be dedicated to operate in a clearlysevere environment, a detailed, preferably a spectral‘based fatigue analysis should be pursued. On theother hand, if the dedicated route is known to be calm
a fatigueanalysismay notbe necessary.Of course,inthemajori~ofcases,eithertheseverityofthewaveenvironmentfallsina grayareaorifthevesselk likelytobe exposedtoseverewave climatesatleastsome ofthe time,such as the case of shipsdesignedforunrestrictedservice,thecourseofactionwouldnotbeasclearw“t.
GlobalWave Climate Evaluation
& a prerequisite for this stratey the globalwave environment can be ranked based on theirseveri~, in terms of both the ship’s response severityand fatigue vulnerability associated with a given waveenvironment. To this end,. the global wave statisticsdata base compiled by BMT [11] is investigated.
The global wave climate atlas shown in Figure12 gives a bird’s eye view of the data mailable in theBMT data base. In all, the global “waters are dividedinto 104 regions. On the basis of an annual average,accounting for all directions, each region is
VI-D-9

180 150 120 90 60 30 0 30 60. W 123 150 Iao
90 1 1
Figure 12 EMT global wave statistics zone designation
represented by one wave scatter diagram. The NewYork to Rotterdam route is once again selected as thenorm, represented by the EMT designated zones 11,15, 16, and 17. The stm”dard set of transfer functionsare once. again employed and spectral fatigue analysisis carried out for all 1~. regions plus the referencezone. On the relative. basis, the results are notsemitive .to the S-N curve selected. For the presentpurpose, the U.K DEn D class o-we is used.
An inmiediatequestion arising is “how does theEMT data compare with the hindcast data” on thebasis of the severi~ parameters dei%ed in theforegoing. The. answer ,“to this question is obviously“not ve~ well”. For example, using the hindcast dataas a norm the. BMT reference zone’s severityparameters are as follows:
Response severiiy, RS: 1.25Fatigue severity, FS: 1.05Fatigui vulnerability, ~ 0.60Normalized shape parameter, +: ‘0.89
All these parameters for ihe hindcast based referencezone, of course, are equal .to unity. These numbersshow tha~ for the reference zone,” the BMT data leadsto higher responses, slightly higher fatigue- damage,but distinctly lower fatigue vulnerability and: shapeparameter. However, making the same comparisonfor the other zones does not lead to”the same pict~e.This indicates that the two sets of wave data are notquite .consistertt, as one might expect; so a littleskepticism toward either (any) wave data base may beprudent. One of the. reasous for the ewpectedinconsistency k that the,EMT data are “obsewed” dataas againit hindcas~ the former includes rough weather
,’
. . . .
avoidanceon thepartof thevolunteerships.Itisnotedthatthe New York to Rotterdam route consistsof a data ensemble about’ two orders of magniiudelarger than the poptilation of the” “Gulf of Alaskaregions (zones 6 and 7) in the BMT data base. This ,,.
may or may not explain why the EMT zones 6 and 7are very much milder than their hindcast counterpart(grid-point 199) in all severity parameters. perhapszones 6 tmd 7 cover a much wider area than @id-point199 and averaging over a wider aiea may result indown-grading the severity.
It appears that inconsistent among availablewave data base must be accepted as an unavoidablereality. While one may not justify to accord absolutefaith toward any wave data base, it is necessary toassume that a given data ‘base is at least self consistent.
On this basis, the 104 ,zones can be rqkedaccording to”- the normalized fatigue damage (orfatigue severity; FS). If th$ threshold FS is taken to be1.0, there are 25 zones (10 in the northern hemisphereand 15: in the southern hemisphere, almost exclusivelylocated in the bands be~-eem 30 to 45 degrees latityde,north and iouth) ihat ““ai be termed “severe”compared io the New York to Rotterdam route. Onthe other hand, there qre’ 53 zones having an FS lessthan 0.33”that can be classed M“’’c@”. It ‘is interestingto observ& that, among “’tliese “mild” regions, manyhave high respotie. severiky,’‘RS, and “others may havehigh fatigue vulnerability (and :hape parameter); butnot high on both. Ori the other hand, all 25 “severe”zones have high values for all severity parameters, i.e.,RS > 0.97, FV > 0,93 and thg” normalized “shapeparameters exceeding 0.99.’, The normalized (withrespect to the ‘New York to Rotterdam route)parameters RS (response severity), FV (fatigue
VI-D-1O

..
vulnerability), and FS (fatime severi~) based on the. . .EMT data are shown in’Fi&es 13 to ~5.
I
Figure 13 Normalized response severity based onBMT wave data
,II
Fi~”re 14 Normalized fatigue vulnerability basedon EMT wave data,,
Figure 15 Normalized fatigue severity based onBMT wave data
Of course, the bottom line is the fatigue.severi~ parameter, FS. How influential are theremaining severity parameters can be show in the
comelation matrix given in Table 5, in which thenormalized shape parameter is denoted by+.
Table 5 Correlation of the severity parameters
I FS RS Fv $
ILliuMMEvidently, the response severi~ parameter, RS,
is correlated neither with the fatigue vulnerability northe shape parameter. This has been pointed outearlier in this paper but the contention is nowconhted. The shape parameter is stronglycorrelated with fatigue vulnerability. Both RS and FVcorrelate with fatigue severity only moderately; but therespective correlation coefikients being in the order of0.7 indicates that they both play an important role.What is not shown in Table 5 is that the productRSmFV virtually correlates with FS.
At this point, it is fair to raise the issue thatsince the FS factor measures the fatigue severity, whyare RS and FV needed. In the first place, the notionsof RS and FV (and o) provide better insight on whyhigh responses (e.g., stress range) does not imply highfatigue damage; and vice versa. Furthermore, thepurpose of fatigue screening is to circumvent detailedspectral fatigue analysis if the regions in question areknown to be mild. Without a full fledged spectralanalysis, the parameter FS is not know, Hence,although both .RS and FV were derived from spectralfatigue analysis, if they can be replaced by somereasonable approximations,. a meaningful fatiguescreening scheme can be devised.
To this end, it is suggested that RS be replacedby the wave severity measured by the maximum waveheight of the region in question. The fatiguevulnerability can be estimated through the notion ofthe “equivalent wave height” presented in section 4(referring to Equations (5-8), Table 3 artd Figure 10).This information is completely imbedded in the wavescatter” diagram and the parameters involved can becomputed with ease. These parameters (i.e., RS, FV,and the derived FS) for the 104 zones have beenobtained and theyeari be shown completely correlatedwith thiir speetral based counterparts. On this basis,and a threshold value of 1.0 for FS, 19 of the 25 zonespreviously identified as “severe” again emerge assevere zones. If the threshold for FS is lowered to0.86, all 25 “severew zones are picked up plus 2 extrazones previously determined as very close to “severe”.In short, the criterion based on approximate severityparameters derived” horn the wave scatter diagramsalone predicts the severe fatigue zones correctly (orconsistently).
Similarly, the procedure for obtaining thefatigue wlnerability parameter, FV2 based on Munse’s
VI-D-I 1
approach can be recalled from previous discussions inthis papec
a)
b)
For a given. s@nd-alone or composite wave scatterdiagra use the set of “stmdaxd response transferfunctions” to, perforsq a spectral fatigue analysis.Witi. the. resulting “life time most probableextreme stress range, ~ and the fatigue damage,solve. for the WeibuLl shape parameter, h, as afunction of the dominant period for this waveenvironment.
Apply the function” h = h(T.) to Eq,(ll), compute,the-fatigmwulneratdlity parraeter,-FV2,
Results derived from this process (i.e., FV2)can be. shown to be virtually correlated with FVobtained from spectral fatigue analysis as expected.
Allowable Stress Range
.,. For ships operating in wave climates at par withthe reference ,regio~ allowable stress ranges can beestablished based on the. information of the Weibullshape parameter. Since the shape parameter is afunction of the dominant period, a structuralcharacteristics that can be estimated as a function ofthe ship length X shown in Eq.(13), a simpletransformation leads IO- the shape parameter as afunction of ship length. In this regard, the nature ofthe wave loading, whether it is dominated by the hullgirder ‘strt?ss, pressure loading on the side shell, orinertia. loading, such a tmnsfonnation will result indifferent “formulae” as discussed in section 4.
~is set of baselipe allowable stress ranges is. tobe modified by both the RS md FV factors such that.
~a = (Fa)N /[RS (FV)l/m]’ (14)
On this premise, if the Weibull shape parameter isassume-d to be 1.0 as is the case in many design codes,then FV = 1.0 and “the allowable stress range isaffected oidy by, the response severity (or waveseverity). This has been shown to be erroneous in thispaper.
,,Since (Fa)N~ the ~baieline allowable stressrange, is a fynction .of the s~p length and the loadingtype, Fa will aho be a finchon of the :hip length and”the loading type. The modification factors, RS andFV, are b-principle also .fimctions of ship length. Forthe purpose of applying to Eq.( 14), however, theirrespective average,values will suffice.
! ...
Application to’Ship Structures Fatigue Assessment
In prinriiple, ship’details suspected to be fatifieprone can be identified by way of the allowable “stressscreening. Once th”e “iritical locations in the structureare identified; ‘their adequa~ of fatigue resistance maybe best evaluated by way of a spectral fatigue analysis.The allowable stress in questioni of course, mustcontain the environmental modification factors tised inEq.(14). The criticality of the” specific locations in the
structure is not only relevant in fadgue analysis in thedesign stage, it may also serve as a guideline insubsequent inspection and monitoring programs forthe vessel, .,
h mentioned previously, the simplified fatigue --, ,analysis does carry the spectral comotation if theshape parameter can be accurately evaluated. Sincethe shape parameters obtained and shown in section 4were computed through spectral fatigue analyses andbackward Calibration%the simp~ed analysis resultsshould be as accurate as the ,sxxtral fatigue analysisresults. The only potential error which can beregarded A additional modelling uncertain@ stems ‘from the use of the. “stmdard” response tr~ferfunctions. ‘If the doniirtant period of the primaryloading component can be ~accurately determined+ theuse of standard response transfer functions is notexpected to lead to significant error.
7. Summary and concluding remarka
In a conventional ship. design process, fatiguedamage of ship structure typically has not been givenas much attention as other considerations such as theglobal hull girder and local yielding strengths. Theintroduction of high tensile steels in ship design andconstruction signifies a new era in which theimportance of fatigue considerations gradually gainsacceptance in the ship design and constructionindust~. ‘The lessons learned from the USCGstructural casualty report simply helps to eliminate anylingering doubts as .to whether fatigue considerationsshould be an integral pan of the ship design process.
It shou~d “be .recog&ed that the increasing useof HTS itself is not the only reason attributed to thefrequency of fatigue induced fracture in specific traderoutes such ~ the TAPS! This paper identifies therelevance of some factors which makes a specific waveclimate. particularly. damaging to ship structures interms of fatigue crack initiation. In--particular, oneshould view the wave environment’s severity from boththe severity of the response’s most probable extremeand the severity in terms of fatigue vulnerability.These two notions need not be correlated nor are theynecessarily mutually excluded: For ships designed tooperate iy wave environments that have both highresponse severity and fatigue vulnerability, a thoroughfatigue analysis for the ship structures would beprudent.
Cl&sification societies such as ABS. now aretaking necessmy steps to implement appropriatefatigue strength requiremenfi in their Rules. Thispaper also presents a possible strate~ toward thatgoal. These steps are built around the belief that theseveri~ and fatigue vulnerability as well as the natureof fatigue loading are the most influential, in additionto other better known factors such as workmanship,weld profile and weld quality, coriosiow etc. It k alsonoted. that ,the factors identified in this paper alsodepends upon the structures! characte~stics? especially ‘the dominant period of the response transfer
VI-D-12
functions. The latter is expected to be sensitive to thenature of the loading,
Some continued resistance within the shipbuilding and maritime industry toward the fullimplementation of fatigue requirements may beanticipated and understandable. Fatigue analysis isoften thought of as costly and time consuming.Nevertheless, the time-honored economic .reality thatpaper is cheaper than steel should convince theskeptics that fatigue consideration makes economicsense. There am increasingly clear indications thatthis view is shared by many major shipbuildingorganizations. Moreover, a rational approach and theenhanced safety benefit does not require analysis forevery structural details. The insight gained fromfatigue consideration in terms of identifying thecritical fatigue sensitive locations in a given structuremay also facilitate the long range planning ofinspectio~ maintenance and monitoring of the shipstructure during the ship’s service life.
Acknowledgement
The authors are thankful to the management ofthe American Bureau of Shipping for supporting theresearch that leads to this paper and to the permissiongranted, to publish this paper. They are especiallyindebted to Dr. D, Liu and Mr. John F. Cordon fortheir encouragement to undertake this task and fortheir invaluable suggestions during the course of thiswork.
... . References
1. Sipes, J.D., ‘Trans-Alaska Pipeline Service(TAPS) Tanker Structural Failure Study+ U.S.Coast Guard, June 25, 1990.
2. CordoW J.F., “Use of Higher Strength Steels inTanker Structures - Some Recent MarshEnvironment Experience; Presented at theINTERTJ4NK0 Technical Session on TankerDesign, bmdo~ October 1990.
3. kvk, E.V.,“Predictinglong-TermDktributionsofWave-inducedBendingMomenton ShipHulls;Proceedings, SNAME Spring Meeting,Montreal, 1967.
4. Hoffma~ D., “Analysis for a Stratitled Sample ofOcean Wave Records at Station Indi~” T & RBulletin No. 1-35, The Society of Naval Architectsand Marine Engineers, May, 1976.
5. Hoffrna~ D, and Che~ H.H., ‘TheImplementation of the 2@Year Hindcast WaveData in the Design and Operation of MarineStructures; OTC 3644, Offshore TechnologyConference, May, 1979.
6. Unger, D. P., “%sessment and Comparison ofWave Data in the North Atlantic Oce~ NorthPacific Ocean, and Along the TAPS Route.”
Technical Report RD-89009, American Bureau ofShipping, June 1989.
7. CheL Y.N. and Mavrakis, S.A, “Closed FormSpectral Fatigue Analysis for Compliant OffshoreStructures,” Journal of Ship Rese~h, Vol. 32, No.4, December 1988.
8. Munse, W,H., Wilbur, T.W., Tellaliw M.L.,Nicoll, K, and Wilso& K, “FatigueCharacterization of Fabricated Ship Details forDesi~” SSC-318, Ship Structure Cmnrnittee,1983.
9. “Offshore Installations: Guidance on Design andConstruction” United Kingdom Department ofEner~, 1984.
10. Thayamballi, AX, “Fatigue Screening forTankers,” Technical Report RD-90005, AmericanBureau of Shipping, May 1990.
11. British Maritime Technology, Globul WaveStatir?ics (primary contributors: N. HogbeLN.M.C. Dacunb~ and G.F. Oliver), UnwinBrothers Ltd., Surrey, U.K, 1986; Also BMT, PCGlobal Wave Statistics (computerized form).
VI-D-13