
CONSERVATISM IN ACCOUNTING: AN ANALYTIC EXPLANATION...
83
CONSERVATISM IN ACCOUNTING: AN ANALYTIC EXPLANATION AND AN EXPLORATION OF THE EFFECTS OF FAMILIARITY AND RULES- VS. PRINCIPLES-BASED STANDARDS By IDIL RAIFE BURAT IMPINK A THESIS PRESENTED TO THE GRADUATE SCHOOL OF THE UNIVERSITY OF FLORIDA IN PARTIAL FULFILLMENT OF THE REQUIREMENTS FOR THE DEGREE OF MASTER OF ARTS UNIVERSITY OF FLORIDA 2006
Transcript of CONSERVATISM IN ACCOUNTING: AN ANALYTIC EXPLANATION...
CONSERVATISM IN ACCOUNTING:
AN ANALYTIC EXPLANATION AND AN EXPLORATION OF THE EFFECTS OF FAMILIARITY AND RULES- VS. PRINCIPLES-BASED STANDARDS
By
IDIL RAIFE BURAT IMPINK
A THESIS PRESENTED TO THE GRADUATE SCHOOL OF THE UNIVERSITY OF FLORIDA IN PARTIAL FULFILLMENT
OF THE REQUIREMENTS FOR THE DEGREE OF MASTER OF ARTS
UNIVERSITY OF FLORIDA
2006

Copyright 2006
by
Idil Raife Burat Impink

iii
ACKNOWLEDGMENTS
I am grateful to Gary McGill and Dominique DeSantiago for their unwavering
support. They have been the most wonderful mentors, friends, and bosses I could ever
wish for.
I thank David Sappington and Steven Slutsky for their help in finalizing my degree.
Finally, I thank my husband, Joost Impink, and my daughter, Selin Yaylali, for
helping me understand what matters most in life.
iv
TABLE OF CONTENTS page
ACKNOWLEDGMENTS ................................................................................................. iii
LIST OF TABLES............................................................................................................. vi
LIST OF FIGURES .......................................................................................................... vii
ABSTRACT..................................................................................................................... viii
CHAPTER
1 INTRODUCTION ........................................................................................................1
2 CONSERVATISM PUZZLE .......................................................................................3
Measures of Conservatism............................................................................................6 Balance Sheet Conservatism .................................................................................7 Income Statement Conservatism ...........................................................................8 Accruals Conservatism........................................................................................10
The Puzzling Evidence on Conservatism ...................................................................12 The Model...................................................................................................................15
No Growth Case ..................................................................................................16 Growth Case ........................................................................................................20
3 THE EFFECTS OF RULES- VS. PRINCIPLES-BASED STANDARDS AND FAMILIARITY ..........................................................................................................23
Theoretical Basis for Experiment Design...................................................................25 Background and Hypotheses ......................................................................................27
Rules- vs. Principles-Based Standards ................................................................27 Familiarity ...........................................................................................................31
Method........................................................................................................................32 Experimental Design ...........................................................................................32 Subjects................................................................................................................34 Procedure.............................................................................................................34 Materials ..............................................................................................................36
The case........................................................................................................36 “Familiarity” manipulation ..........................................................................37 “Standards” manipulation ............................................................................38
v
Results.........................................................................................................................40 Descriptive Statistics ...........................................................................................40 The Joint Decision...............................................................................................40 Manipulated Variables.........................................................................................41 Manipulation Check for Familiarity....................................................................42 Additional Variable: Compensation/Class .........................................................48 Hypothesis Tests..................................................................................................48
Discussion and Limitations.........................................................................................52 Results Discussion...............................................................................................52 Limitations...........................................................................................................55
4 CONCLUSION...........................................................................................................57
APPENDIX
HISTORICAL PERSPECTIVE ON THE DEVELOPMENT OF ACCOUNTING STANDARDS ............................................................................................................59
LIST OF REFERENCES...................................................................................................68
BIOGRAPHICAL SKETCH .............................................................................................74

vi
LIST OF TABLES
Table page 3-1. 2x2 between subjects design and the number of pair-wise observations in each
cell. ...........................................................................................................................33
3-2. Experimental design and predictions.........................................................................34
3-3. Comparison of individual beliefs before and after the discussion with pair-wise conclusions. ..............................................................................................................43
3-4. Comparison of auditor and client beliefs with pair-wise conclusions.......................44
3-5. Number (percentage) of observations in “standards” manipulation..........................44
3-6. Number (percentage) of observations in “familiarity” manipulation. .......................45
3-7. Number (percentage) of observations when the joint decision is INVENTORY. ....46
3-8. Number (percentage) of observations when the joint decisions is INCOME. ..........46
3-9. Manipulation check for the familiarity variable for individuals................................47
3-10. Manipulation check for the familiarity variable for paired individuals...................47
3-11. Logistic regression model for single and pair-wise observations explaining pair-wise conclusions.......................................................................................................49
3-12. Logistic regression for simple effects test for familiarity using data collected at individual level. ........................................................................................................53

vii
LIST OF FIGURES
Figure page 2-1. Graph of earnings regressed on positive and negative returns. ....................................9
2-2. Cumulative accruals by type.......................................................................................11
3-1. “Standards” manipulation graph................................................................................45
3-2. “Familiarity” manipulation graph..............................................................................45
3-3. Graph of Table 3-7. ...................................................................................................46
3-4. Graph of Table 3-8. ...................................................................................................47
viii
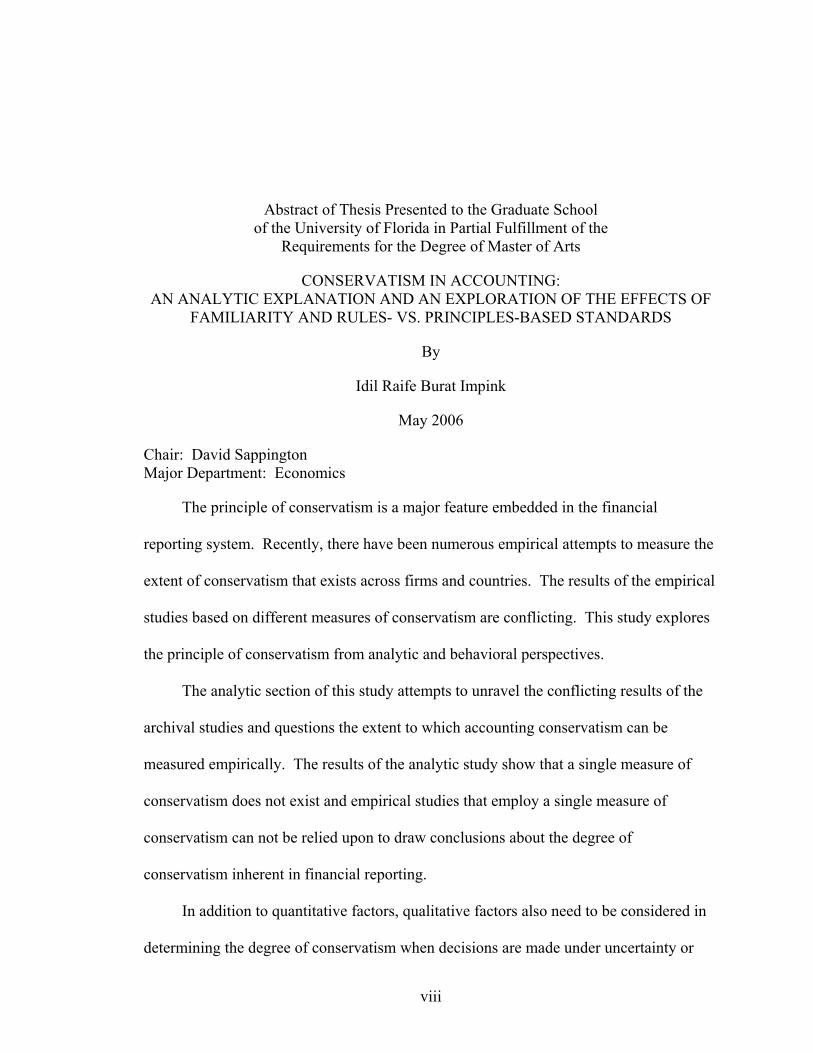
Abstract of Thesis Presented to the Graduate School
of the University of Florida in Partial Fulfillment of the Requirements for the Degree of Master of Arts
CONSERVATISM IN ACCOUNTING: AN ANALYTIC EXPLANATION AND AN EXPLORATION OF THE EFFECTS OF
FAMILIARITY AND RULES- VS. PRINCIPLES-BASED STANDARDS
By
Idil Raife Burat Impink
May 2006
Chair: David Sappington Major Department: Economics
The principle of conservatism is a major feature embedded in the financial
reporting system. Recently, there have been numerous empirical attempts to measure the
extent of conservatism that exists across firms and countries. The results of the empirical
studies based on different measures of conservatism are conflicting. This study explores
the principle of conservatism from analytic and behavioral perspectives.
The analytic section of this study attempts to unravel the conflicting results of the
archival studies and questions the extent to which accounting conservatism can be
measured empirically. The results of the analytic study show that a single measure of
conservatism does not exist and empirical studies that employ a single measure of
conservatism can not be relied upon to draw conclusions about the degree of
conservatism inherent in financial reporting.
In addition to quantitative factors, qualitative factors also need to be considered in
determining the degree of conservatism when decisions are made under uncertainty or
ix
when decisions are made between parties that have a conflict of interest. The behavioral
section of this study explores two factors that may influence the degree of conservatism
that is observed in financial reporting. Specifically, this part explores the effects of rules-
vs. principles-based accounting standards and the influence of familiarity on conflict
resolution when auditors and their clients collectively decide on how an ambiguous
accounting issue should be reported in the financial statements. The results of the
experiment indicate that the type of standards and the degree of familiarity jointly have
an effect on the degree of conservatism inherent in the reported numbers. This is
important in showing how quantitative measures are affected by qualitative factors that
surround the decision making process.
1
CHAPTER 1 INTRODUCTION
Accounting conservatism is a major feature of the financial reporting system. The
saying “anticipate no profits and provide for all possible losses” (Devine, 1963; Watts,
2003a) describes conservative reporting on the income statement, which has inspired
most of the recent empirical research on conservatism (Ball, Kothari, and Robin, 2000;
Basu, 1997; Givoly and Hayn, 2000; Holthausen and Watts, 2001).
The most commonly used measures of conservatism in the literature are income
statement based as derived by Basu (1997), and balance sheet based assessments as
captured by the market-to-book ratio. The results of the empirical studies based on these
measures are conflicting.
In chapter 2, I attempt to unravel the conflicting results in the empirical literature
and I question the extent to which accounting conservatism can be accurately measured.
The results in chapter 2 indicate that conservatism can not be measured by a single
measure and that other factors may influence the conservatism in reported numbers.
I further explore the idea that qualitative factors may have an influence on the
degree of conservatism in financial reporting. In chapter 3, I explore this idea through an
experiment that examines two factors that may affect the joint decision of two parties that
have a conflict of interest. The auditor and the client are a classic example of two parties
known for their inherent conflict of interest. The client pays the auditor for auditing its
financial statements. Thus, the auditor can do a satisfactory job in the eyes of the client if
the auditor issues an opinion in line with the client’s. The outcome of the joint decision

2
process reflects the degree of conservatism inherent in financial reporting. The results in
chapter 3 indicate that familiarity and the type of standards may jointly affect the
outcome of a joint decision making process.
Chapter 4 concludes the findings of the study.
3
CHAPTER 2 CONSERVATISM PUZZLE
The Financial Accounting Standards Board (FASB) Statement of Financial
Accounting Concepts (SFAC) No. 2 (1980) describes conservatism as the understatement
of net income and net assets in the presence of uncertainty. This description
encompasses conservatism as it is reflected on both the balance sheet and the income
statement. However, this does not imply that the effects of understatement will impact
both statements equally. Basu (2001) gives the following example:
It is useful to distinguish between the balance sheet and income statement effects of conservatism, since they do not always go hand in hand. The purchase and pooling-of-interest methods of accounting for mergers under U.S. GAAP provide a useful illustration. Under the pooling-of-interest method, the acquired firm’s assets and liabilities are reported on the acquirer’s balance sheet at the values on the acquired firm’s balance sheet, and depreciation typically continues under the pre-existing basis. Under purchase accounting, the assets and liabilities of the acquired firm are reported on the acquirer’s balance sheet at fair values, which are typically greater than their values reported on the acquired firm’s balance sheet. However, these assets are subsequently depreciated and/or amortized at rates higher than those previously used by the acquired firm. Thus, the pooling method results in more conservative balance sheets and less conservative income statements than the purchase method, at least under the traditional definition. (p. 1335)
The reason why the effects of conservatism manifest in varying degrees in the
financial statements may be due to the fact that the conservatism principle overlaps the
two primary qualities of the financial statements: relevance and reliability. Relevance is
achieved through information that has predictive value, feedback value and that is timely.
Reliability is achieved through representational faithfulness, verifiability and neutrality
(SFAC No. 2). There exists a tradeoff between relevance and reliability: more relevance
can be achieved at the expense of reliability. Barth, Beaver, and Landsman (2001) state
4
that “conservatism can be a by-product of applying the FASB’s reliability criterion” (p.
94). However, while on the one hand the conservatism principle requires more
verifiability for reporting good news, on the other hand the use of conservatism in
making judgments under conditions of uncertainty deters the neutrality of financial
statements. In addition to the statement in Barth et al., conservatism can also be a by-
product of the relevance criterion as it requires predictive value, feedback value, and the
timely recognition of “bad news” in the financial statements—but not “good news.”
Thus, the concept of conservatism nurtures both of the primary qualities of the financial
statements in an asymmetric manner. Kieso, Weygandt, and Warfield (2001) label
conservatism as one of the “overriding constraints” to the qualitative characteristics,
which introduces yet another angle to the conceptualization.
Moreover, income statement and balance sheet conservatism may be applied at
varying degrees because of the different functions they serve. There may be different
forces at work pushing in opposite directions: more aggressive on the income statement
(as aggressive as possible that is allowed by the accounting standards) and more
conservative on the balance sheet (as conservative as possible that is allowed by the
accounting standards). For example, assuming that earnings provides a performance
measure for compensation contracting and monitoring purposes while the balance sheet
provides an estimate of the liquidation value of net assets for borrowing purposes, it is
understandable that income statements will be used by managers in a least conservative
manner whereas balance sheets will tend to err towards the more conservative end.
The empirical evidence collected based on operationalized definitions of
conservatism measures indicates that accounting practice has become more conservative
in the last 30 years (Basu, 1997; Givoly and Hayn, 2000; Watts, 2003b). Has accounting
5
really become more conservative in the past three decades? One of the most commonly
cited reasons for this increased degree of conservatism is the litigious environment that
was created after the 1966 changes in the rules of bringing class action suits (Watts,
2003a). The fear of litigation has supposedly forced accounting reporting to become
more conservative. Yet, could it be that litigation has increased because of aggressive
financial reporting and this has not necessarily made companies more conservative, but in
fact more calculative? Could there have been other changes at work that forced
litigations to increase?
An answer may be derived from Zeff’s (2003a) review of the accounting profession
during the 20th century. According to Zeff (2003a), one major change that has affected
the large accounting firms in the last 30 years was the growth of consulting services,
which eventually led to the accounting profession succumbing to the mentality of
“making profits.” In addition to this organizational change taking place within
accounting firms, financial reporting norms were also under stress during the 1980s as (1)
industry regulators increasingly viewed them as a means to achieving “public interest”
goals (e.g., regulators in the banking and thrift industries pressuring the FASB and the
audit firms to use deceptive accounting practices in order to “rescue” failing banks and
savings and loan institutions in the name of the “public interest”) and (2) firms and trade
associations demanded more preparer-friendly standards from the FASB (Zeff, 2003a).
Furthermore, the 1980s was also the decade when analysts’ earnings forecasts became
more prominent, which created increased pressure on CEOs to achieve earnings targets.
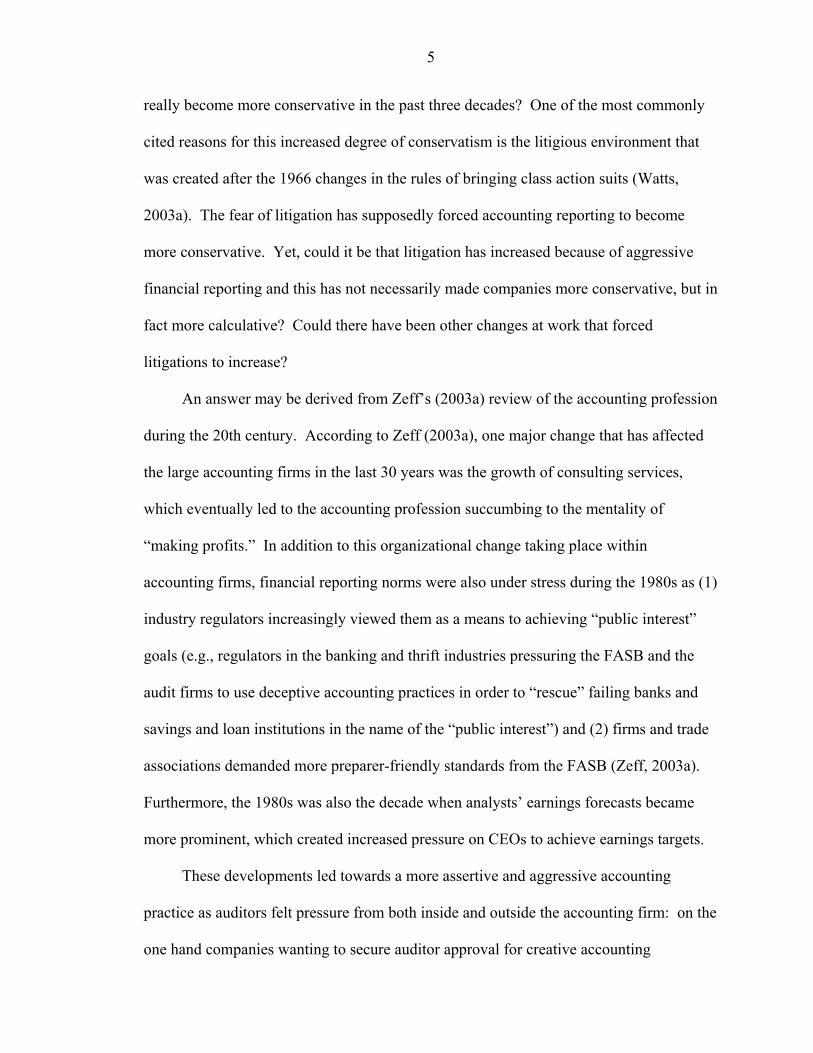
These developments led towards a more assertive and aggressive accounting
practice as auditors felt pressure from both inside and outside the accounting firm: on the
one hand companies wanting to secure auditor approval for creative accounting
6
techniques, and on the other hand the accounting firms wanting to keep the client’s
business. The accountant’s role diminished to one of “putting the foot in the client’s
door” and once through the door, keeping the client happy. Not surprisingly, by the mid-
1980s all of the booklets and newsletters previously published by the large accounting
firms expressing views on controversial issues became nonexistent, which marks the
death of the accounting profession as it was known before (Zeff, 2003b).
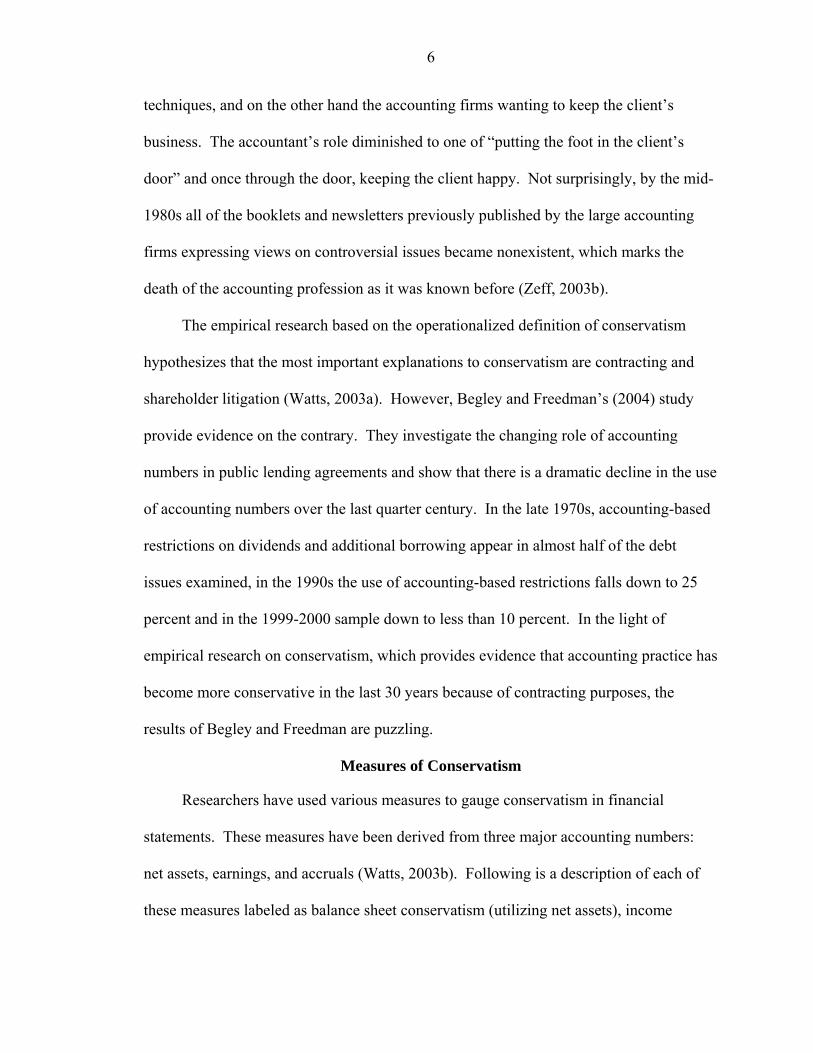
The empirical research based on the operationalized definition of conservatism
hypothesizes that the most important explanations to conservatism are contracting and
shareholder litigation (Watts, 2003a). However, Begley and Freedman’s (2004) study
provide evidence on the contrary. They investigate the changing role of accounting
numbers in public lending agreements and show that there is a dramatic decline in the use
of accounting numbers over the last quarter century. In the late 1970s, accounting-based
restrictions on dividends and additional borrowing appear in almost half of the debt
issues examined, in the 1990s the use of accounting-based restrictions falls down to 25
percent and in the 1999-2000 sample down to less than 10 percent. In the light of
empirical research on conservatism, which provides evidence that accounting practice has
become more conservative in the last 30 years because of contracting purposes, the
results of Begley and Freedman are puzzling.
Measures of Conservatism
Researchers have used various measures to gauge conservatism in financial
statements. These measures have been derived from three major accounting numbers:
net assets, earnings, and accruals (Watts, 2003b). Following is a description of each of
these measures labeled as balance sheet conservatism (utilizing net assets), income

7
statement conservatism (utilizing earnings), and accruals conservatism (utilizing
accruals).
Balance Sheet Conservatism
Balance sheet conservatism describes the choice of accounting methods and
estimates that keep the book values of net assets relatively low (Penman and Zhang,
2002). For example, LIFO accounting for inventories is conservative relative to FIFO;
accelerated depreciation for property, plant, and equipment is conservative relative to
straight-line depreciation; and expensing research and development (R&D) expenditures
is conservative compared to capitalizing these expenditures. One empirical measure of
conservatism emanates from the work of Feltham and Ohlson (1995), who model the
relation between a firm’s market value and accounting data. They distinguish between
unbiased accounting and conservative accounting in terms of how book value differs
from market value. Based on Feltham and Ohlson’s work, Zhang (2000) gives the
following definition of conservatism: An accounting policy is conservative if
lim [ ] / [ ] 1t t t tE oa E Vτ ττ + +→∞< (Eq. 1)
where oa is operating assets and V is the market value of operating assets. The market-
to-book ratio has been used as a proxy for balance sheet conservatism based on this
relationship (e.g., Givoly and Hayn, 2000; Lara and Mora, 2004). This implies that the
market-to-book ratio will be greater than one if companies are conservative on their
balance sheets.
The source of understatement of the book value relative to the economic value can
be due to: (1) the failure to capture the positive net present value of projects and
subsequent increases in value; (2) the minimization of the carrying value of net assets in
place; and (3) the prompt recognition of losses (Givoly, Hayn, and Natarajan, 2003). The
8
source of understatement that is due to the failure to capture the positive net present value
of projects and subsequent increases in value introduces the growth factor into the
market-to-book ratio. In fact, market-to-book ratios have been widely used to proxy for
growth in the financial literature where high (low) market-to-book ratio firms have been
described as growth (value) firms (Brealey, Myers, and Marcus, 2001; Fama and French,
1995, 1998). Thus, high market-to-book ratios can be an indicator of conservative
accounting practices on the balance sheet and/or high growth firms. The interaction of
accounting bias with growth is a well-known fact (Beaver and Ryan, 2000). Thus, at this
point, it becomes difficult to tease apart the conservatism embedded in the balance sheet
and the growth potential that is perceived by the market. Indeed, Penman and Zhang
(2002) state that this interaction of growth and conservatism—“the joint effect of real
activity and accounting policy” (p. 238)—can be used to manage earnings.
Income Statement Conservatism
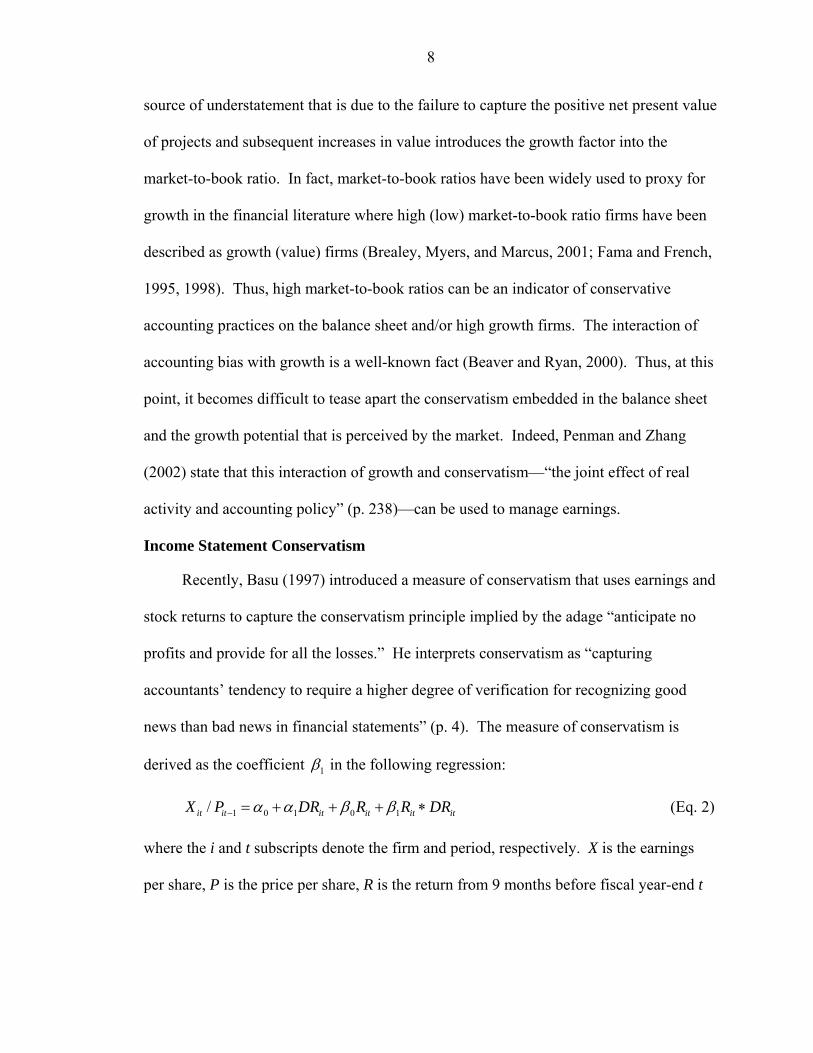
Recently, Basu (1997) introduced a measure of conservatism that uses earnings and
stock returns to capture the conservatism principle implied by the adage “anticipate no
profits and provide for all the losses.” He interprets conservatism as “capturing
accountants’ tendency to require a higher degree of verification for recognizing good
news than bad news in financial statements” (p. 4). The measure of conservatism is
derived as the coefficient 1β in the following regression:
1 0 1 0 1/it it it it it itX P DR R R DRα α β β− = + + + ∗ (Eq. 2)
where the i and t subscripts denote the firm and period, respectively. X is the earnings
per share, P is the price per share, R is the return from 9 months before fiscal year-end t
9
to three months after fiscal year-end t, and DR is a dummy variable that is equal to 1 if
0R < and 0 otherwise.
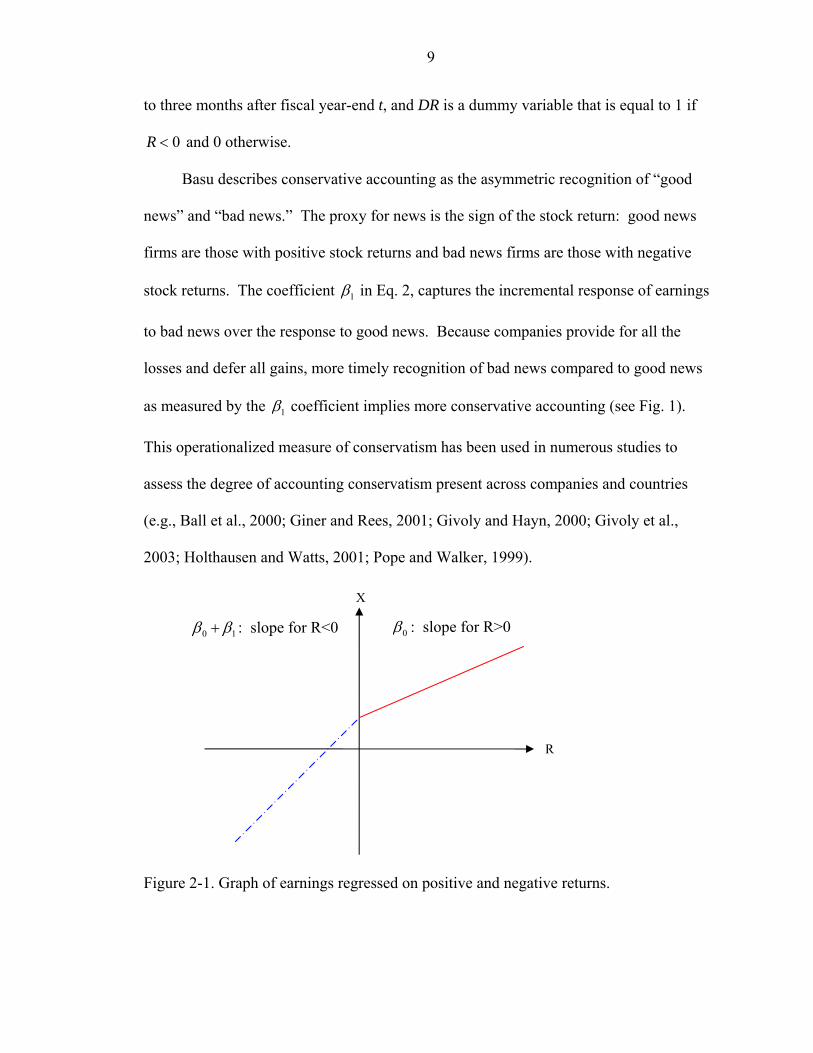
Basu describes conservative accounting as the asymmetric recognition of “good
news” and “bad news.” The proxy for news is the sign of the stock return: good news
firms are those with positive stock returns and bad news firms are those with negative
stock returns. The coefficient 1β in Eq. 2, captures the incremental response of earnings
to bad news over the response to good news. Because companies provide for all the
losses and defer all gains, more timely recognition of bad news compared to good news
as measured by the 1β coefficient implies more conservative accounting (see Fig. 1).
This operationalized measure of conservatism has been used in numerous studies to
assess the degree of accounting conservatism present across companies and countries
(e.g., Ball et al., 2000; Giner and Rees, 2001; Givoly and Hayn, 2000; Givoly et al.,
2003; Holthausen and Watts, 2001; Pope and Walker, 1999).
Figure 2-1. Graph of earnings regressed on positive and negative returns.
0 1β β+ : slope for R<0
R
0β : slope for R>0
X
10
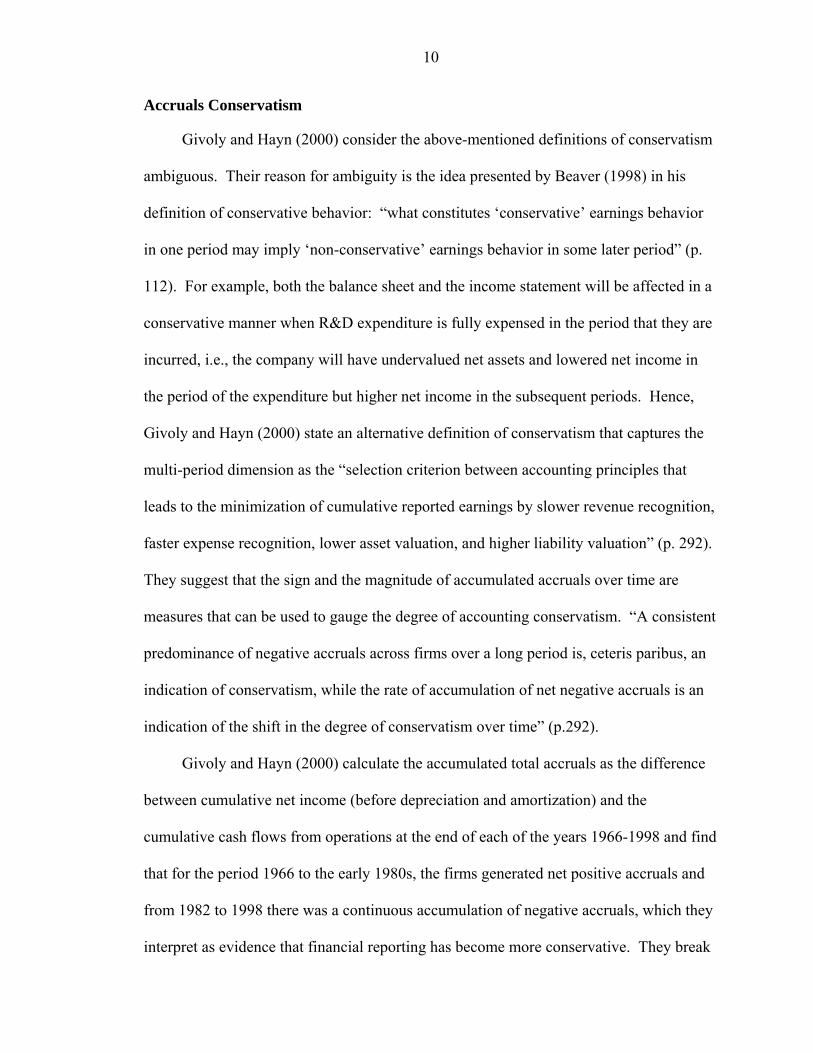
Accruals Conservatism
Givoly and Hayn (2000) consider the above-mentioned definitions of conservatism
ambiguous. Their reason for ambiguity is the idea presented by Beaver (1998) in his
definition of conservative behavior: “what constitutes ‘conservative’ earnings behavior
in one period may imply ‘non-conservative’ earnings behavior in some later period” (p.
112). For example, both the balance sheet and the income statement will be affected in a
conservative manner when R&D expenditure is fully expensed in the period that they are
incurred, i.e., the company will have undervalued net assets and lowered net income in
the period of the expenditure but higher net income in the subsequent periods. Hence,
Givoly and Hayn (2000) state an alternative definition of conservatism that captures the
multi-period dimension as the “selection criterion between accounting principles that
leads to the minimization of cumulative reported earnings by slower revenue recognition,
faster expense recognition, lower asset valuation, and higher liability valuation” (p. 292).
They suggest that the sign and the magnitude of accumulated accruals over time are
measures that can be used to gauge the degree of accounting conservatism. “A consistent
predominance of negative accruals across firms over a long period is, ceteris paribus, an
indication of conservatism, while the rate of accumulation of net negative accruals is an
indication of the shift in the degree of conservatism over time” (p.292).
Givoly and Hayn (2000) calculate the accumulated total accruals as the difference
between cumulative net income (before depreciation and amortization) and the
cumulative cash flows from operations at the end of each of the years 1966-1998 and find
that for the period 1966 to the early 1980s, the firms generated net positive accruals and
from 1982 to 1998 there was a continuous accumulation of negative accruals, which they
interpret as evidence that financial reporting has become more conservative. They break
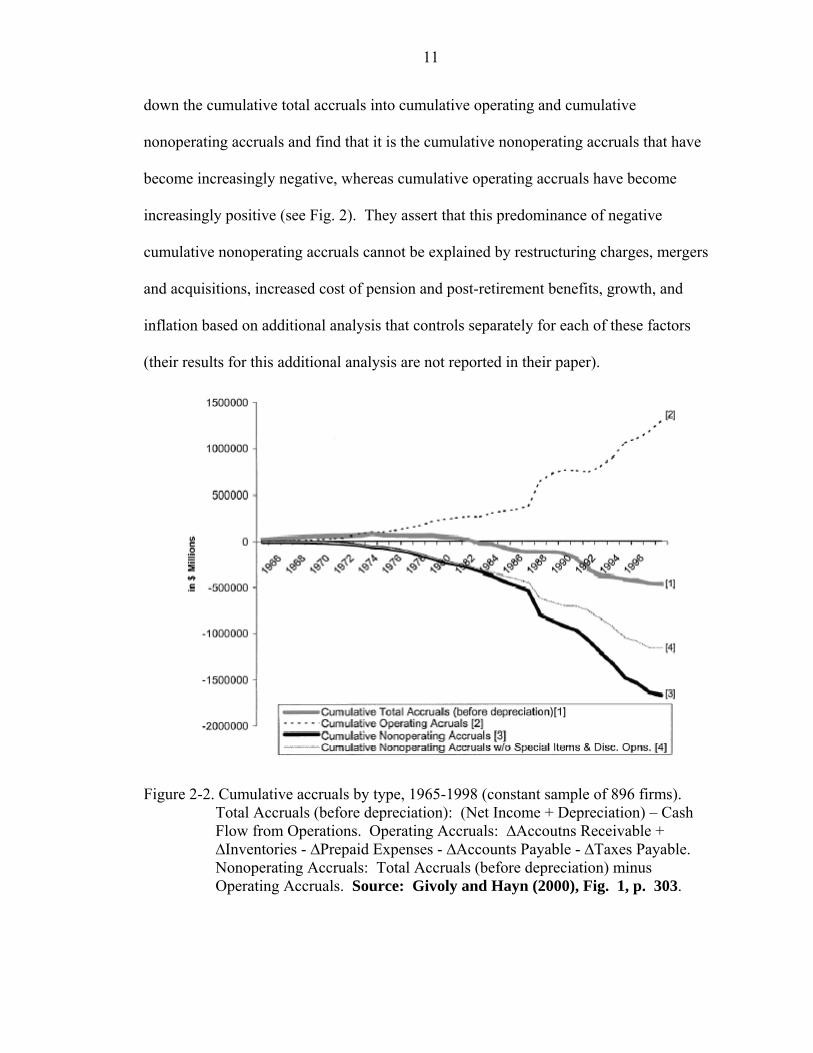
11
down the cumulative total accruals into cumulative operating and cumulative
nonoperating accruals and find that it is the cumulative nonoperating accruals that have
become increasingly negative, whereas cumulative operating accruals have become
increasingly positive (see Fig. 2). They assert that this predominance of negative
cumulative nonoperating accruals cannot be explained by restructuring charges, mergers
and acquisitions, increased cost of pension and post-retirement benefits, growth, and
inflation based on additional analysis that controls separately for each of these factors
(their results for this additional analysis are not reported in their paper).
Figure 2-2. Cumulative accruals by type, 1965-1998 (constant sample of 896 firms). Total Accruals (before depreciation): (Net Income + Depreciation) – Cash Flow from Operations. Operating Accruals: ∆Accoutns Receivable + ∆Inventories - ∆Prepaid Expenses - ∆Accounts Payable - ∆Taxes Payable. Nonoperating Accruals: Total Accruals (before depreciation) minus Operating Accruals. Source: Givoly and Hayn (2000), Fig. 1, p. 303.
12
The Puzzling Evidence on Conservatism
Numerous studies have been conducted based on the above-mentioned measures of
conservatism (e.g., Ball et al., 2000; Basu, 1997; Givoly and Hayn, 2000; Holthausen and
Watts, 2001). Some of the conclusions that emerge from these empirical studies are: (1)
the U.S. financial reporting is conservative (Basu, 1997); (2) the U.S. financial reporting
has become increasingly conservative (Givoly and Hayn, 2000; Holthausen and Watts,
2001); (3) the financial reporting system in common law countries (the U.K., Australia,
Canada, the U.S.) is more conservative compared to the financial reporting system in
code law countries (France, Germany, Japan) (Ball et al., 2000).
While Basu (1997) and Givoly and Hayn (2000) show that the U.S. is conservative
and that financial reporting has become increasingly conservative using the income
statement conservatism measure, Bowen, DuCharme, and Shores (1995) directly examine
firms’ choices of depreciation and inventory methods during the 1980s and early 1990s,
and find a near-monotonic and large shift towards straight-line depreciation and FIFO
from accelerated depreciation and LIFO, which indicates conservatism has been
decreasing over time in the U.S.
Ball et al. (2000) explain their findings based on the differences that the law system
creates. They theorize that in common law countries, where companies are mostly
owned by the public, there is a demand for public disclosure that induces conservative
reporting by the companies in order to protect themselves against litigation. On the other
hand, this lack of demand for public disclosure in code law countries does not require
conservative reporting, because companies are mostly owned by financial institutions or
families and thus information asymmetries are resolved privately.

13
An inherent tension in the argument of Ball et al. is that while on the one hand
there is a demand for public disclosure that induces conservative behavior, on the other
hand the same public demands accurate, unbiased financial reporting. Gigler and
Hemmer (2001) show that companies with more conservative accounting are less likely
to make timely voluntary disclosures compared to those with less conservative
accounting and thus, they conclude that price more timely reflects the news of firms with
less conservative accounting. Moreover, even though the U.S. is more conservative as
measured by Ball et al. (2000), Pope and Walker (1999) show that the differences
between the U.K. and the U.S. reverse when the analysis is done based on earnings after
extraordinary items, i.e., the U.K. becomes more timely in the recognition of bad news
compared to the U.S. This raises two questions: (1) whether financial reporting is
comparable across countries even though they use similar law systems and (2) whether
the income statement conservatism measure is sensitive to the definition of earnings.
Pownall and Schipper (1999) provide an answer to the first question by addressing the
differences that exist between U.S. GAAP and non-U.S. GAAP. They state that
“speaking to the type and magnitude of noncomparabilities as captured by Form 20-F
reconciliations, research generally finds substantial negative differences between U.S.
GAAP and home GAAP income, consistent with U.S. GAAP being on average more
conservative than non-U.S. GAAP and consistent with a lack of aggregate comparability”
(p. 264).
Another empirical example is provided by Giner and Rees (2001). They state that
“an examination of the accounting practices suggests that pervasive conservatism would
be greatest in Germany—the classic ‘stakeholder—code law’ area, intermediate in France
and least apparent in the U.K. It may be expected that the more developed equity market
14
in the U.K., and the more frequent occurrence of widely held firms, would discourage
pervasive conservatism, as it might be expected to produce earnings numbers of less
relevance to shareholders, and to reflect badly on the reputation and remuneration of
managers” (p. 1299). However, the empirical evidence using the income statement
conservatism measure points in the exact opposite direction: the U.K. is the most timely
in recognizing bad news (i.e., most conservative) compared to the ‘code-law’ countries,
France and Germany. Germany turns out to be the least conservative of the three. Giner
and Rees (2001) also show that in the U.K., firms with low (high) market-to-book ratios
have higher (lower) income statement conservatism. This would indicate that the two
conservatism measures point in opposite directions.
Lara and Mora (2004) reach similar conclusions and find that the existence of
balance sheet conservative practices is associated with reduced levels of earnings
conservatism. Givoly et al. (2003) explain why balance sheet conservatism may produce
lower income statement conservatism as follows:
The application of conservative accounting methods and practices such as expensing of software development costs, providing for anticipated losses, the immediate write-off of goodwill upon acquisition and the use of accounting methods such as LIFO and accelerated depreciation, would minimize the book value of net assets. As a result, the application of lower-of-cost-or-market-rule will be less frequent and the greater responsiveness of earnings to subsequent bad news will tend to be less pronounced. In contrast, aggressive reporting in the form of extensive capitalization and inadequate provisions for future costs or losses will make the firm’s earnings more sensitive to unfavorable economic events. (p. 6).
They provide evidence that the income statement conservatism measure (which
they label as the differential timeliness (DT) measure), is not related to the rate of
accumulation of negative accruals (also for nonoperating accruals) and is negatively
correlated with other dimensions of conservatism.
15
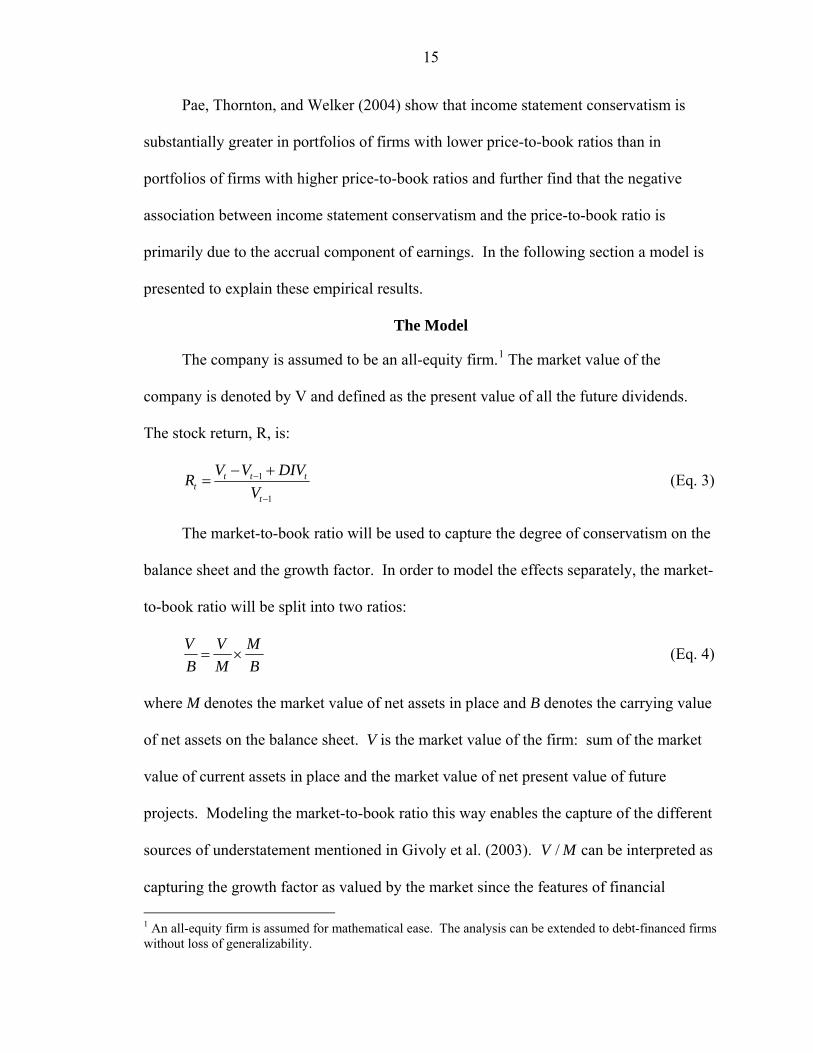
Pae, Thornton, and Welker (2004) show that income statement conservatism is
substantially greater in portfolios of firms with lower price-to-book ratios than in
portfolios of firms with higher price-to-book ratios and further find that the negative
association between income statement conservatism and the price-to-book ratio is
primarily due to the accrual component of earnings. In the following section a model is
presented to explain these empirical results.
The Model
The company is assumed to be an all-equity firm.1 The market value of the
company is denoted by V and defined as the present value of all the future dividends.
The stock return, R, is:
1
1
t t tt
t
V V DIVRV−
−
− += (Eq. 3)
The market-to-book ratio will be used to capture the degree of conservatism on the
balance sheet and the growth factor. In order to model the effects separately, the market-
to-book ratio will be split into two ratios:
V V MB M B= × (Eq. 4)
where M denotes the market value of net assets in place and B denotes the carrying value
of net assets on the balance sheet. V is the market value of the firm: sum of the market
value of current assets in place and the market value of net present value of future
projects. Modeling the market-to-book ratio this way enables the capture of the different
sources of understatement mentioned in Givoly et al. (2003). /V M can be interpreted as
capturing the growth factor as valued by the market since the features of financial 1 An all-equity firm is assumed for mathematical ease. The analysis can be extended to debt-financed firms without loss of generalizability.
16
reporting (e.g., historical cost convention) do not allow for the valuation of net present
value of future projects. /M B can be interpreted as capturing the degree of conservatism
on the balance sheet that is purely due to accounting choices. For example, if V M= ,
this means that the net present value of future projects is 0 and that this is a no-growth
firm. When this is the case, / /V B M B= , i.e., market-to-book ratio measures the degree
of conservatism on the balance sheet without the interaction of the growth factor.
Therefore, accounting choice and regulation are the only forces behind conservative
practices via minimization of the carrying value of net assets in place. However,
whenV M≠ , then the market-to-book ratio becomes a noisy proxy for conservatism on
the balance sheet because of the interaction between growth and conservatism.
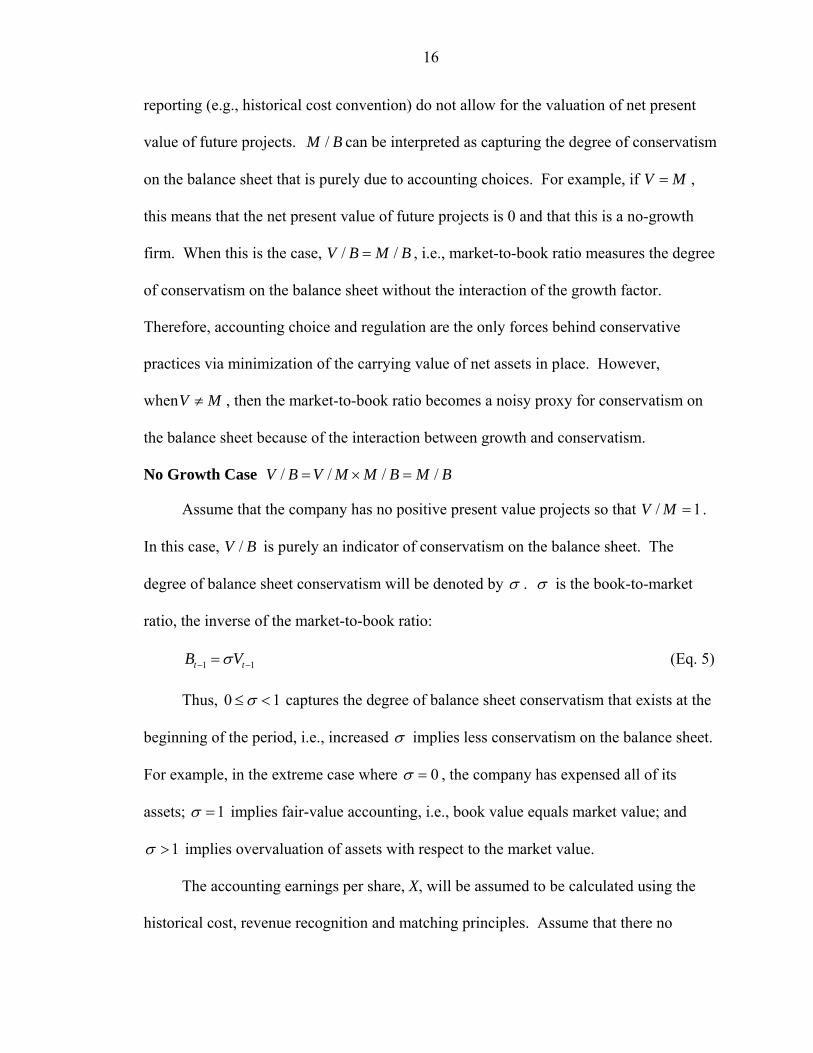
No Growth Case / / / /V B V M M B M B= × =
Assume that the company has no positive present value projects so that / 1V M = .
In this case, /V B is purely an indicator of conservatism on the balance sheet. The
degree of balance sheet conservatism will be denoted by σ . σ is the book-to-market
ratio, the inverse of the market-to-book ratio:
1 1t tB Vσ− −= (Eq. 5)
Thus, 0 1σ≤ < captures the degree of balance sheet conservatism that exists at the
beginning of the period, i.e., increased σ implies less conservatism on the balance sheet.
For example, in the extreme case where 0σ = , the company has expensed all of its
assets; 1σ = implies fair-value accounting, i.e., book value equals market value; and
1σ > implies overvaluation of assets with respect to the market value.
The accounting earnings per share, X, will be assumed to be calculated using the
historical cost, revenue recognition and matching principles. Assume that there no
17
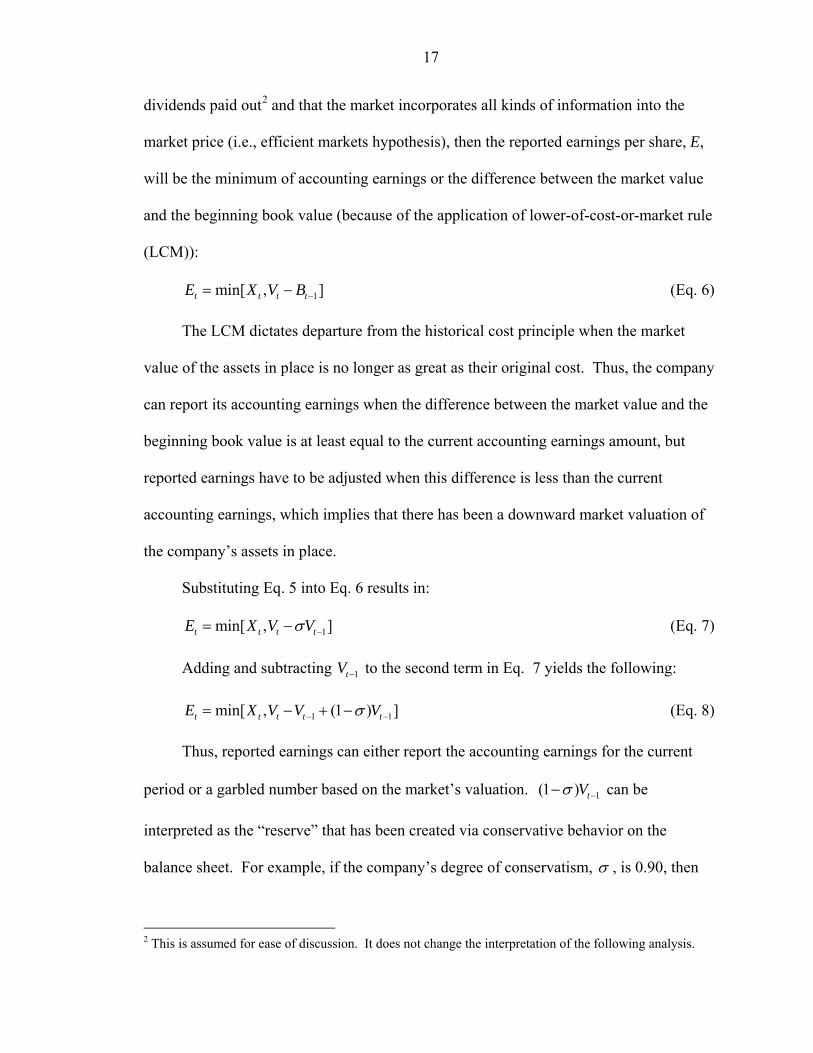
dividends paid out2 and that the market incorporates all kinds of information into the
market price (i.e., efficient markets hypothesis), then the reported earnings per share, E,
will be the minimum of accounting earnings or the difference between the market value
and the beginning book value (because of the application of lower-of-cost-or-market rule
(LCM)):
1min[ , ]t t t tE X V B −= − (Eq. 6)
The LCM dictates departure from the historical cost principle when the market
value of the assets in place is no longer as great as their original cost. Thus, the company
can report its accounting earnings when the difference between the market value and the
beginning book value is at least equal to the current accounting earnings amount, but
reported earnings have to be adjusted when this difference is less than the current
accounting earnings, which implies that there has been a downward market valuation of
the company’s assets in place.
Substituting Eq. 5 into Eq. 6 results in:
1min[ , ]t t t tE X V Vσ −= − (Eq. 7)
Adding and subtracting 1tV − to the second term in Eq. 7 yields the following:
1 1min[ , (1 ) ]t t t t tE X V V Vσ− −= − + − (Eq. 8)
Thus, reported earnings can either report the accounting earnings for the current
period or a garbled number based on the market’s valuation. 1(1 ) tVσ −− can be
interpreted as the “reserve” that has been created via conservative behavior on the
balance sheet. For example, if the company’s degree of conservatism, σ , is 0.90, then
2 This is assumed for ease of discussion. It does not change the interpretation of the following analysis.
18
the book value is 90 when the market values it at 100. Thus, the company has created a
“reserve” of 10.
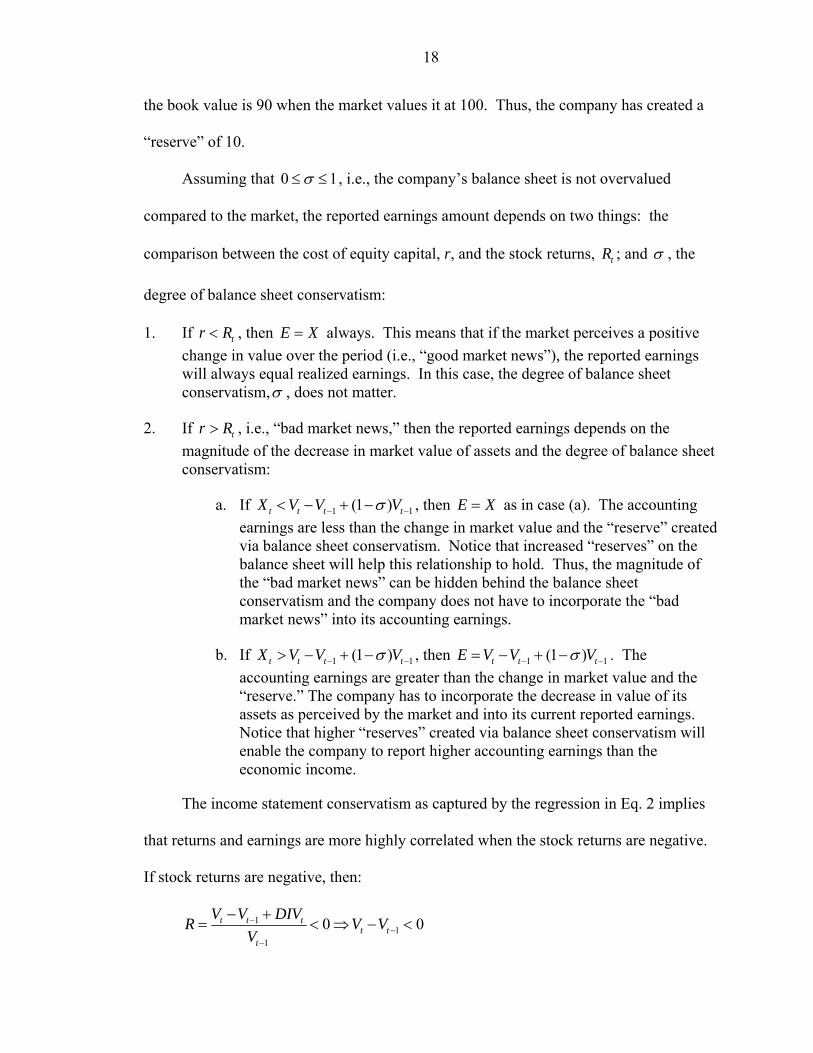
Assuming that 0 1σ≤ ≤ , i.e., the company’s balance sheet is not overvalued
compared to the market, the reported earnings amount depends on two things: the
comparison between the cost of equity capital, r, and the stock returns, tR ; and σ , the
degree of balance sheet conservatism:
1. If tr R< , then E X= always. This means that if the market perceives a positive change in value over the period (i.e., “good market news”), the reported earnings will always equal realized earnings. In this case, the degree of balance sheet conservatism,σ , does not matter.
2. If tr R> , i.e., “bad market news,” then the reported earnings depends on the magnitude of the decrease in market value of assets and the degree of balance sheet conservatism:
a. If 1 1(1 )t t t tX V V Vσ− −< − + − , then E X= as in case (a). The accounting earnings are less than the change in market value and the “reserve” created via balance sheet conservatism. Notice that increased “reserves” on the balance sheet will help this relationship to hold. Thus, the magnitude of the “bad market news” can be hidden behind the balance sheet conservatism and the company does not have to incorporate the “bad market news” into its accounting earnings.
b. If 1 1(1 )t t t tX V V Vσ− −> − + − , then 1 1(1 )t t tE V V Vσ− −= − + − . The accounting earnings are greater than the change in market value and the “reserve.” The company has to incorporate the decrease in value of its assets as perceived by the market and into its current reported earnings. Notice that higher “reserves” created via balance sheet conservatism will enable the company to report higher accounting earnings than the economic income.
The income statement conservatism as captured by the regression in Eq. 2 implies
that returns and earnings are more highly correlated when the stock returns are negative.
If stock returns are negative, then:
11
1
0 0t t tt t
t
V V DIVR V VV−
−−
− += < ⇒ − <
19
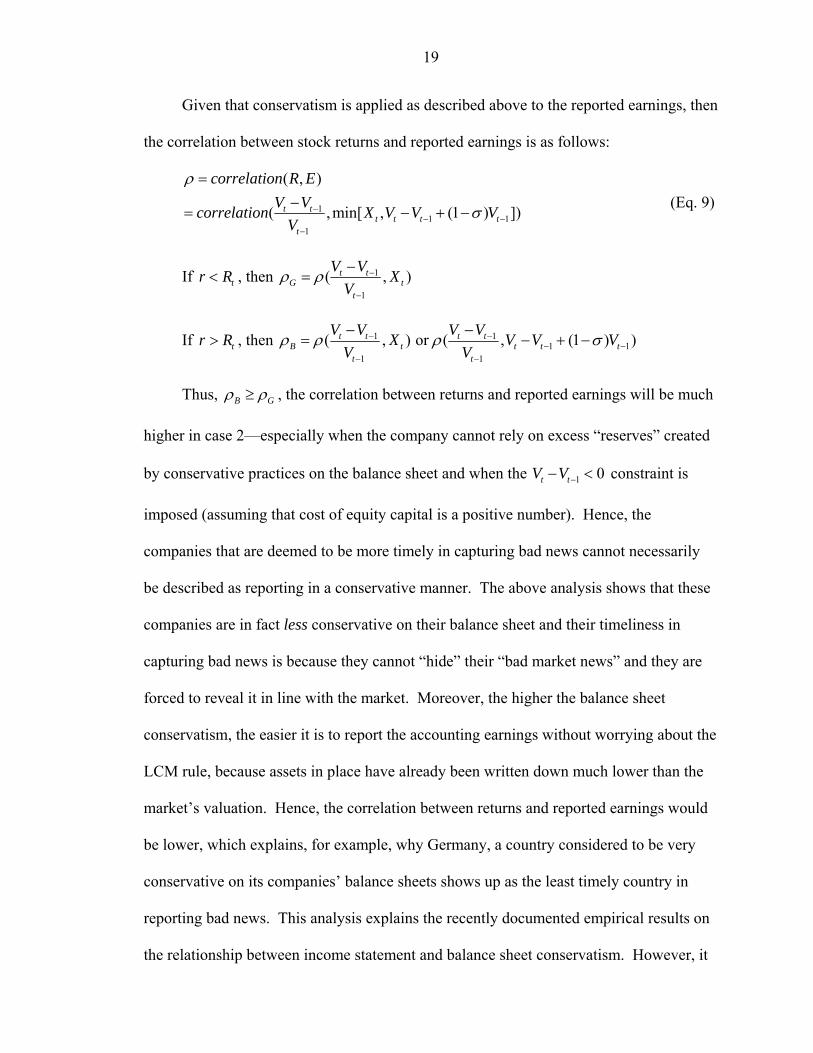
Given that conservatism is applied as described above to the reported earnings, then
the correlation between stock returns and reported earnings is as follows:
11 1
1
( , )
( ,min[ , (1 ) ])t tt t t t
t
correlation R EV Vcorrelation X V V V
V
ρ
σ−− −
−
=−
= − + − (Eq. 9)
If tr R< , then 1
1
( , )t tG t
t
V V XV
ρ ρ −
−
−=
If tr R> , then 1 11 1
1 1
( , ) or ( , (1 ) )t t t tB t t t t
t t
V V V VX V V VV V
ρ ρ ρ σ− −− −
− −
− −= − + −
Thus, B Gρ ρ≥ , the correlation between returns and reported earnings will be much
higher in case 2—especially when the company cannot rely on excess “reserves” created
by conservative practices on the balance sheet and when the 1 0t tV V −− < constraint is
imposed (assuming that cost of equity capital is a positive number). Hence, the
companies that are deemed to be more timely in capturing bad news cannot necessarily
be described as reporting in a conservative manner. The above analysis shows that these
companies are in fact less conservative on their balance sheet and their timeliness in
capturing bad news is because they cannot “hide” their “bad market news” and they are
forced to reveal it in line with the market. Moreover, the higher the balance sheet
conservatism, the easier it is to report the accounting earnings without worrying about the
LCM rule, because assets in place have already been written down much lower than the
market’s valuation. Hence, the correlation between returns and reported earnings would
be lower, which explains, for example, why Germany, a country considered to be very
conservative on its companies’ balance sheets shows up as the least timely country in
reporting bad news. This analysis explains the recently documented empirical results on
the relationship between income statement and balance sheet conservatism. However, it
20
should be noted that the relationship is not a linear one, but rather one that depends on the
degree of balance sheet conservatism and the magnitude of the change in value as
perceived by the market.
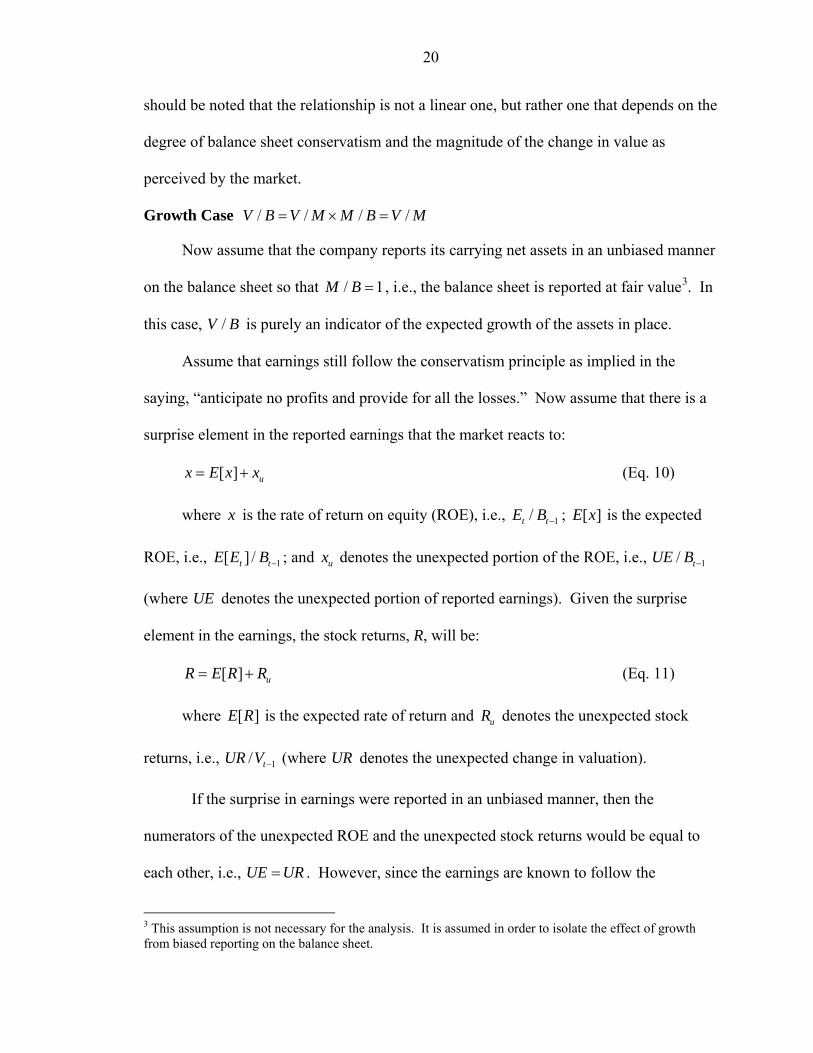
Growth Case / / / /V B V M M B V M= × =
Now assume that the company reports its carrying net assets in an unbiased manner
on the balance sheet so that / 1M B = , i.e., the balance sheet is reported at fair value3. In
this case, /V B is purely an indicator of the expected growth of the assets in place.
Assume that earnings still follow the conservatism principle as implied in the
saying, “anticipate no profits and provide for all the losses.” Now assume that there is a
surprise element in the reported earnings that the market reacts to:
[ ] ux E x x= + (Eq. 10)
where x is the rate of return on equity (ROE), i.e., 1/t tE B − ; [ ]E x is the expected
ROE, i.e., 1[ ] /t tE E B − ; and ux denotes the unexpected portion of the ROE, i.e., 1/ tUE B −
(where UE denotes the unexpected portion of reported earnings). Given the surprise
element in the earnings, the stock returns, R, will be:
[ ] uR E R R= + (Eq. 11)
where [ ]E R is the expected rate of return and uR denotes the unexpected stock
returns, i.e., 1/ tUR V − (where UR denotes the unexpected change in valuation).
If the surprise in earnings were reported in an unbiased manner, then the
numerators of the unexpected ROE and the unexpected stock returns would be equal to
each other, i.e., UE UR= . However, since the earnings are known to follow the
3 This assumption is not necessary for the analysis. It is assumed in order to isolate the effect of growth from biased reporting on the balance sheet.
21
conservatism principle, the market valuation of the unexpected portion of the earnings
will be in the following way:
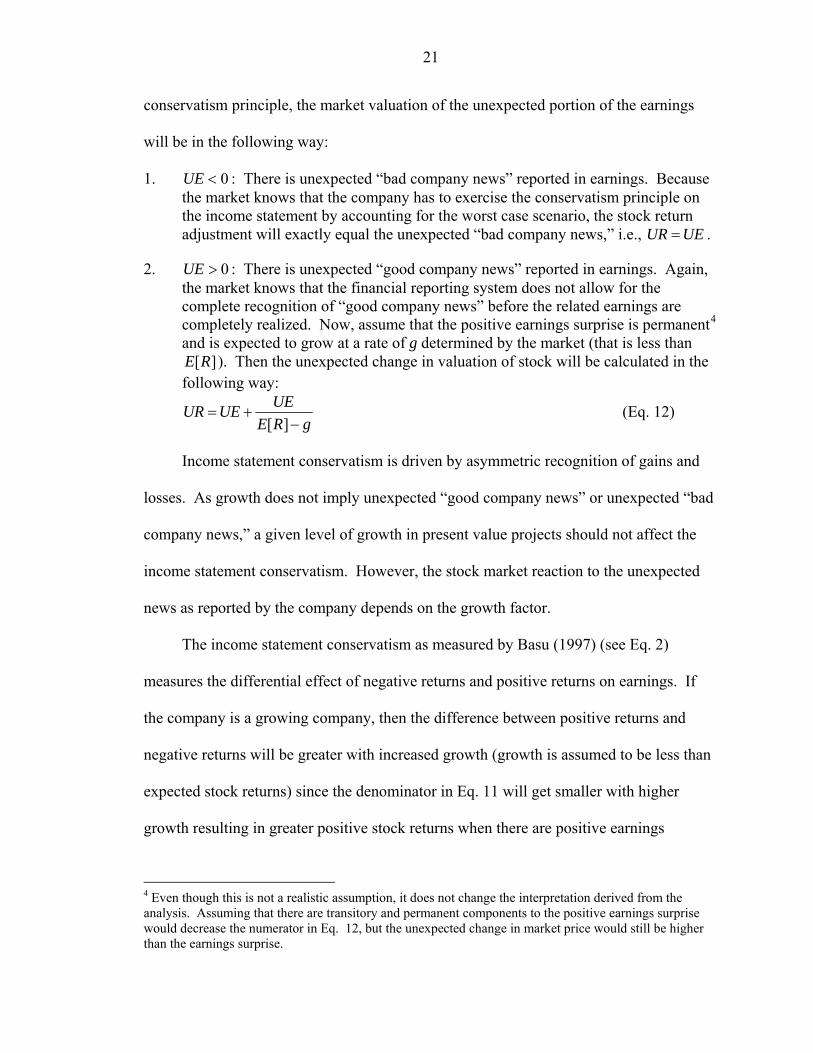
1. 0UE < : There is unexpected “bad company news” reported in earnings. Because the market knows that the company has to exercise the conservatism principle on the income statement by accounting for the worst case scenario, the stock return adjustment will exactly equal the unexpected “bad company news,” i.e., UR UE= .
2. 0UE > : There is unexpected “good company news” reported in earnings. Again, the market knows that the financial reporting system does not allow for the complete recognition of “good company news” before the related earnings are completely realized. Now, assume that the positive earnings surprise is permanent4 and is expected to grow at a rate of g determined by the market (that is less than
[ ]E R ). Then the unexpected change in valuation of stock will be calculated in the following way:
[ ]UEUR UE
E R g= +
− (Eq. 12)
Income statement conservatism is driven by asymmetric recognition of gains and
losses. As growth does not imply unexpected “good company news” or unexpected “bad
company news,” a given level of growth in present value projects should not affect the
income statement conservatism. However, the stock market reaction to the unexpected
news as reported by the company depends on the growth factor.
The income statement conservatism as measured by Basu (1997) (see Eq. 2)
measures the differential effect of negative returns and positive returns on earnings. If
the company is a growing company, then the difference between positive returns and
negative returns will be greater with increased growth (growth is assumed to be less than
expected stock returns) since the denominator in Eq. 11 will get smaller with higher
growth resulting in greater positive stock returns when there are positive earnings
4 Even though this is not a realistic assumption, it does not change the interpretation derived from the analysis. Assuming that there are transitory and permanent components to the positive earnings surprise would decrease the numerator in Eq. 12, but the unexpected change in market price would still be higher than the earnings surprise.
22
surprises. Hence, a market-to-book ratio greater than 1, which indicates positive growth
in this case, will result in higher income statement conservatism (where there is no
balance sheet conservatism).
By splitting the market-to-book ratio into two portions, one measuring the growth
factor, /V M , and the other measuring the conservatism factor, /M B , the interaction of
growth with conservatism and how it affects income statement conservatism is observed.
Income statement conservatism is increasing in /V M and decreasing in /M B .
Therefore, given the growth and no-growth scenarios, two conflicting results
emerge with respect to the relation between income statement conservatism as measured
by Basu (1997) and balance sheet conservatism as measured by the market-to-book ratio:
(1) when there is no-growth, higher income statement conservatism is associated with
lower market-to-book ratio and (2) when there is growth and no balance sheet
conservatism, higher income statement conservatism is associated with higher market-to-
book ratio. Thus, the link between income statement conservatism and balance sheet
conservatism cannot be adequately interpreted without accounting for the growth factor.
23
CHAPTER 3 THE EFFECTS OF RULES- VS. PRINCIPLES-BASED STANDARDS AND
FAMILIARITY
Among the most cited causes of the current accounting crisis are overly complex
accounting standards, emphasis of form over substance in applying accounting standards,
and the failed independence of auditors (Piecara, 2002). The Sarbanes-Oxley Act of
2002 includes provisions aimed at the removal of these fundamental problems. There are
two important provisions in the Act that closely relate to the topic of this chapter.
Section 108 of the Act instructs the SEC to study the feasibility of adopting a principles-
based accounting system. Section 203 of the Act requires the rotation of audit partners
every five years and Section 206 prohibits the audit of a company if the company’s CEO,
CFO, controller, CAO or person in equivalent position has been employed by the audit
firm during the one-year period preceding the audit.
An overlooked point by the experimental studies conducted in prior literature to
discern the varying effects of rules- vs. principles-based standards on decision-making is
that the auditing process is embedded in an interactive relationship between the auditor
and the client. Antle and Nalebuff (1991) pointed out that the financial statement
“becomes a joint venture if the auditor is unwilling to provide an unqualified opinion on
management’s stated representations.” In other words, whenever there is a disagreement
on the reporting decision of accounting issues, the auditor and the client will have to
collectively resolve the conflict in order to issue an unqualified opinion.
24
I designed an experiment where the impact of rules- vs. principles-based standards
can be explored within the context of the existing relationship between the auditor and
the client. Magee and Tseng (1990) showed that there exists a link between auditor
independence and the type of standard. Thus, a factor that naturally has to be considered
and included in such an experimental setting is the degree of familiarity between the
auditor and the client. This is especially so when auditor independence has been the
concern of many regulatory agencies and the accounting profession (Glazer and Jaenicke,
2002).
The experiment was conducted using senior and graduate students studying
accounting. In the experiment, the students were assigned to pairs, where one was asked
to role-play as the auditor and the other was asked to role-play as the client. The auditors
were instructed to question the reporting of a certain accounting transaction by their
clients, which increased the net income of the company and were asked to suggest an
alternative way of reporting to their clients. Both the auditors and the clients were
provided with current GAAP that supported their point of view. “Threat of lawsuits” and
“threat of client loss” could possibly influence the outcome of the mini discussion by
giving the client an upper-hand (Farmer, Rittenberg, Trompeter, 1987). To remove the
possible effects of these factors, the subjects were informed that there was no threat of
litigation and the client could not fire the auditor.
The collective reporting decision of the auditor and the client depended upon (1)
whether they employed rules-based or principles-based standards to discuss the
accounting issue, and (2) whether they personally knew each other or were meeting for
the first time. The pairs were asked to discuss the issue and make a joint decision. Pair-
wise conclusion was the binary dependent variable and could either be INCOME as
25
favored by the client or INVENTORY as favored by the auditor. The type of accounting
standard employed in determining the appropriate reporting method was manipulated
between subjects, as was the familiarity factor. The results indicated that the likelihood a
client agrees with an auditor’s position increases when the auditor and the client resolve
the issue using rules- rather than principles-based standards. Familiarity by itself did not
have an impact on pair-wise conclusions. However, familiarity and the type of standards
jointly affected the outcome of conflict resolution between the auditor and the client.
When the client and the auditor were not familiar with each other, the pair-wise
conclusion was not dependent on the type of accounting standards employed. However,
when the client and the auditor were familiar with each other, the likelihood that the
conclusion was in client’s favor increased when principles-based standards were
employed, and the likelihood that the conclusion reflected the auditor’s opinion increased
when rules-based standards were employed.
Theoretical Basis for Experiment Design
Gibbins, Salterio, and Webb (2001) develop a model of auditor-client accounting
negotiation and design a field questionnaire that was completed by audit partners about
real negotiations with clients. Negotiation is defined as any context in which two or more
parties with differing views jointly make a decision that affect the welfare of both parties.
The negotiation process is described as a three-element process model, which begins with
an accounting issue (based on past negotiations or relationships between the parties),
followed by different choices and actions that constitute the auditor-client process, and
results in a negotiation outcome. In this process, each negotiation has the potential to
become an antecedent for the next negotiation, making it a continuous round of
discussions until a final resolution is reached. The three-process model is closely
26
associated with accounting contextual features that provide practical meaning to the
model. These features are external conditions and constraints, interpersonal context, and
parties’ capabilities (Gibbins et al., 2001).
The experiment was designed to replicate one round of this three-element process
model. The subjects were provided with an accounting issue along with a brief history of
the auditor-client relationship; the auditor and the client were asked to discuss the issue
between them; and an outcome was required to be reported at the end of their discussion.
The conflict was created by instructing the auditor and the client to adopt opposing points
of view.
Gibbins, McCracken, and Salterio (2003) explore the client side of the same
negotiation process described in Gibbins et al. (2001). In both studies, the audit partners
and the CFOs report accounting and disclosure standards as one of the most important
external factors during auditor-client negotiations. In both studies, the relationship with
the “other side” constituted one of the most important interpersonal factors. This
outcome can be somewhat biased since the length of the relationship between the auditor
and the client in both studies was reported to be more than three years for most of the
sample, indicating that most were already familiar with the person they were negotiating
with. The experiment was designed to isolate the effects of these two important factors
from the other contextual factors and to reveal the impact they may have on the
accounting outcome when the negotiation was limited to only one round of discussion.
A puzzling issue that arises from the joint analysis of both papers is the reported
outcome of the negotiated issue. 32% (19%) of the audit partners (CFOs) reported that
the negotiation outcome was agreement on auditor’s original position whereas only 4%
(34%) of the audit partners (CFOs) reported that the negotiation outcome was agreement
27
on client’s original position. The percentages reported in both studies tell opposing
stories as to whose original positions wins at the end of a negotiated issue. Since both
these studies are field questionnaires collecting subjective information, it is not possible
to objectively verify the reported percentages. The designed experiment has the potential
to provide insight into this puzzle.
Background and Hypotheses
Rules- vs. Principles-Based Standards
A closer look at the development of standards and the definition of rules- vs.
principles-based standards is necessary in order to understand how we came upon the
debate and distinction between rules- vs. principles-based standards.
The need to develop a comprehensive set of accounting standards first arose after
the market crash in 1929. Since then, there have been other major market crashes, the
most recent being the so-called “burst of the Tech Bubble.” The aftermath of almost
every market crash has eventually led to the questioning of accounting standards in effect
at the time, their structure, and whether they had been comprehensive enough to predict
or to prevent the imminent crash (refer to appendix for a summary of historical account
of the development of standards).
After nearly a century of developing accounting standards, the debate on rules- vs.
principles-based standards is fueled once again. It is important to understand what is
meant by these terms. A likewise distinction is made in the law literature between rules
vs. principles. Brasil, Jr. (2001, pp. 67-68) summarizes the law literature on rules and
principles as follows:
• Dworkin (1978) claims that rules have “absolute obligations equivalent to ‘all-or-nothing’” whereas principles do not have this kind of absolute obligation.
28
According to Dworkin, principles are selected based on the importance of the value they attain to whereas rules are not value-laden.
• Alexy (1978) claims that one way of distinguishing rules from principles is “the abstraction degree on their prescriptions,” which is not just a matter of degree but also a matter of quality.
• Peczenik (1989) assumes that “principles are normative propositions” and not descriptive statements.
• Verheij (1996) proposes that the difference between rules and principles is merely gradual and that there is “no difference in logic structure” between the two.
Recent accounting literature has made the distinction along parallel lines. Vincent
et al. (2003) “characterize the standard setting-process and its products along a
continuum ranging from unequivocally rigid standards on one end to general definitions
of economic-based concepts on the other end” (p. 74). The rigid end of the spectrum
leaves no room for judgment or disagreement whereas the general end of the spectrum
requires the application of professional judgment and expertise both by managers and
accountants.
Nelson (2003) defines rules- vs. principles-based standards in a similar way by
adopting the “incremental perspective.” He views all standards as principles-based since
the FASB is assumed to be issuing standards based on the conceptual framework. Thus,
he characterizes the “issue as the incremental effect on behavior when standards include
relatively more elaborate rules.” He focuses on the incremental effects of increasing the
number of rules in a standard where he defines rules to “include specific criteria, ‘bright
line’ thresholds, examples, scope restrictions, exceptions, subsequent precedents,
implementation guidance, etc.” (p. 91).
The FASB has issued a “Proposal for a Principles-Based Approach to U.S.
Standard Setting” (FASB 2002) in response to concerns about the quality and
29
transparency of financial reporting. There are mixed reactions to the proposal. Some
academics find the proposal in conflict with the existing constraints posed by the legal,
technological, and business environment (Schipper, 2003), while others embrace the
notion on the grounds that managers use rules-based standards to structure transactions
(Nelson, 2003; Vincent et al., 2003).
Initially, the accounting profession has been concerned about the lack of
accountants’ power over their clients (Sterling, 1973). The issuance and application
requirement of more strict and clear rules have been viewed as an “empowering” tool for
the auditor against clients who are inclined to interpret standards in a way that justifies
their aggressive reporting decisions. This perspective has resulted in a highly technical,
complex, and detailed set of accounting standards. Magee and Tseng (1990) found that
auditor independence is easier to maintain when standards leave little room for
disagreement among auditors. However, more recent research clearly pointed out that
replacement of vague standards with precise standards does not mitigate aggressive
reporting in tax contexts (Cuccia, Hackenbrack, and Nelson, 1995). Based on the results
of Cuccia et al., one can make the analogy that using rules- vs. principles-based standards
should not necessarily have an effect on the reporting decision of auditors. Hackenbrack
and Nelson (1996) further explore the issue in the audit arena while introducing an
additional factor that might mitigate the aggressiveness of auditors’ reporting decisions,
namely the engagement risk. Results of their study indicate that the nature of standards
does not influence the outcome of the reporting decision: They showed that under
moderate engagement risk, auditors permitted aggressive reporting method by their
clients under both rules- vs. principles-based standards, whereas under high engagement
risk, the auditors reverted to more conservative interpretation of standards.
30
Recently the perspective that rules-based standards “empower” auditors has
suddenly swung in favor of the clients: rules-based standards now are perceived to
“empower” clients by enabling them to structure transactions to manage their earnings.
This is currently quoted as one of the main reasons why regulators want to revert to
principles-based standards. Nelson, Elliott, and Tarpley (2002) analyzed data collected
from 253 auditors on 515 specific earnings management incidences by using a field-
based questionnaire. Their results indicated that managers are more likely to attempt
earnings management by structuring transactions using “high precise” standards [i.e.,
rules-based] rather than “low precise” standards and that auditors are less inclined to
interfere with such attempts. On the other hand, the percentage of earning management
attempts adjusted by the auditor was still higher for the “high precision” standards (51%)
compared to the “low precision” standards (39%). In addition, the number of earning
management attempts was higher for the “low precision” standards (313) compared to the
“high precision” standards (202).
In this experiment, the type of standards is manipulated between subjects to
examine the impact of rules- vs. principles-based standards on the outcome of conflict
resolution. Since the recent literature indicated that different types of standards do not
mitigate aggressive reporting of auditors and since this fact would only be exacerbated by
closer relationships between the auditor and the client, the hypothesis stated in alternative
form is as follows:
H1: The likelihood that a client agrees with an auditor’s position increases when
the auditor and the client resolve the issue using rules- rather than principles-based
standards.
31
Familiarity
The accounting literature on familiarity is fairly limited in scope and explores the
issue only from the accountants’ side. Most studies conducted on the topic are limited to
the effects of familiarity in the audit setting concerning the relationships between the
senior auditors and their staff (Asare and McDaniel, 1996; Ramsay, 1994; Wilks, 2002).
There are no behavioral studies that explicitly examine how familiarity between the
auditor and the client may affect the outcome of an actual discussion between the two
with regard to the reporting decision of a conflicting accounting issue. An emerging
theme from the existing studies is that familiarity with the group members of an audit
team can potentially become a source of judgment bias in the team’s performance (Tan
and Jamal, 2001; Asare and McDaniel, 1996). Likewise, long running interactions
between the client and the auditor can also be a potential source of judgment bias
(Dopuch, King, and Schwartz, 2001) and a threat to auditor independence (Glazer and
Jaenicke, 2002), which explains why the Sarbanes Oxley Act includes specific provisions
for auditor independence. The implicit assumption underlying the mandatory rotation of
auditors is that potential economic gains from continuing interactions with the same
client undermine auditor independence (Dopuch et al., 2001).
This experiment manipulates the degree of familiarity between-subjects to examine
its effect on the outcome of a conflict resolution. The second hypothesis is:
H2: The more familiar an auditor is with a client, the more likely s/he is to agree
with a client’s position.
32
Method
Experimental Design
An experiment was conducted to test the effects of different types of standards and
familiarity on the resolution of a conflict between the auditor and the client. The subjects
were paired up where one subject was asked to role-play as the auditor and the other was
asked to role-play as the client. The pairs were provided with a case in which the
appropriate conclusion to the accounting issue in question could be resolved by using the
accounting standards they were provided with.
The experiment employed a 2 x 2 between-subjects design (Table 3-1). There were
two different units of observation: One was observation based on individual reports and
the other was observation of a pair of students. The dependent variable measured is the
binary outcome of the conflict resolution (0=INCOME for client-favoring outcomes,
1=INVENTORY for auditor-favoring outcomes). One variable was the type of
standards. The standards manipulation involved the resolution of a conflicting
accounting issue by employing either rules- or principles-based standards. Pairs assigned
to the rules-based standard condition were provided with a case in which the ambiguous
accounting issue could be resolved by employing rules-based standards. Both the auditor
and the client were provided with rules-based GAAP that appropriately supported their
stance on the matter. Auditors were given an excerpt from SAB 101, Revenue
Recognition in Financial Statements (SEC, 1999), and clients were given an excerpt from
SFAS 45, Accounting for Franchise Fee Revenue (FASB, 1981). Pairs in the principles-
based standard condition were provided with GAAP that was not rules-based. Auditors
were provided with standards from ARB 43, Restatement and Revision of Accounting
Research Bulletins (CAP, 1953), on inventory and clients were provided with standards
33
from SFAC 6, Elements of Financial Statements (FASB, 1985), on characteristics of
gains.
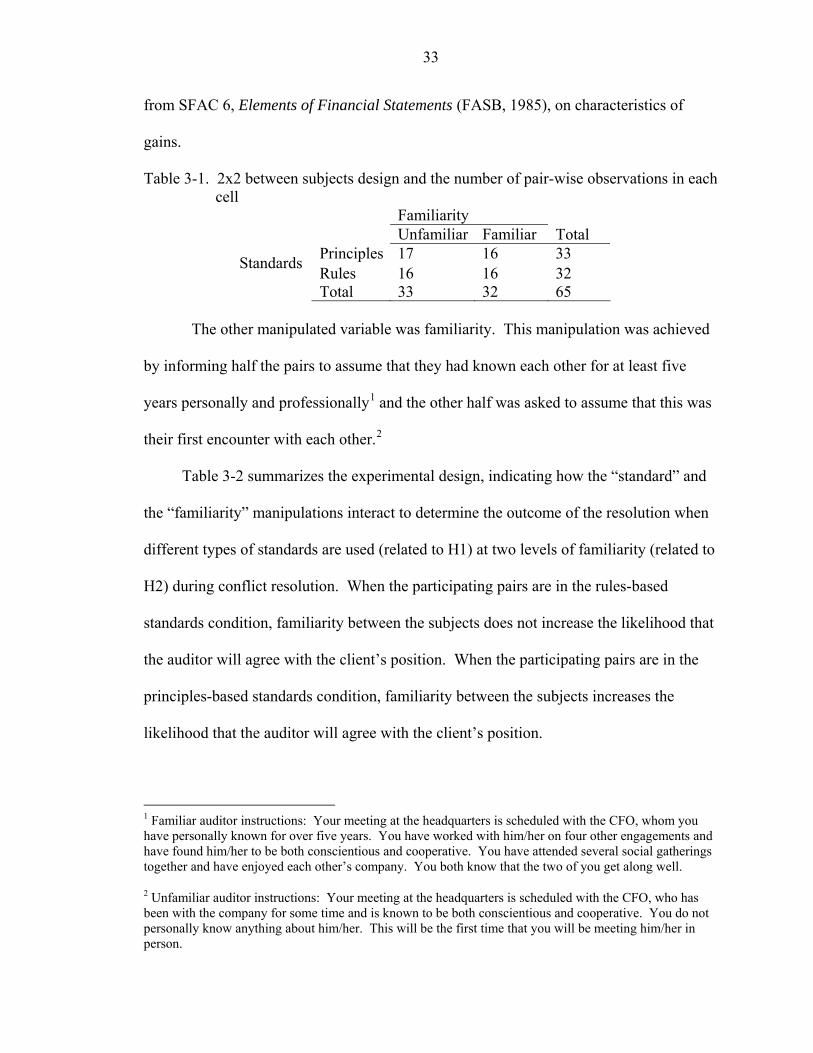
Table 3-1. 2x2 between subjects design and the number of pair-wise observations in each cell
Familiarity Unfamiliar Familiar Total
Principles 17 16 33 Standards Rules 16 16 32 Total 33 32 65
The other manipulated variable was familiarity. This manipulation was achieved
by informing half the pairs to assume that they had known each other for at least five
years personally and professionally1 and the other half was asked to assume that this was
their first encounter with each other.2
Table 3-2 summarizes the experimental design, indicating how the “standard” and
the “familiarity” manipulations interact to determine the outcome of the resolution when
different types of standards are used (related to H1) at two levels of familiarity (related to
H2) during conflict resolution. When the participating pairs are in the rules-based
standards condition, familiarity between the subjects does not increase the likelihood that
the auditor will agree with the client’s position. When the participating pairs are in the
principles-based standards condition, familiarity between the subjects increases the
likelihood that the auditor will agree with the client’s position.
1 Familiar auditor instructions: Your meeting at the headquarters is scheduled with the CFO, whom you have personally known for over five years. You have worked with him/her on four other engagements and have found him/her to be both conscientious and cooperative. You have attended several social gatherings together and have enjoyed each other’s company. You both know that the two of you get along well.
2 Unfamiliar auditor instructions: Your meeting at the headquarters is scheduled with the CFO, who has been with the company for some time and is known to be both conscientious and cooperative. You do not personally know anything about him/her. This will be the first time that you will be meeting him/her in person.
34
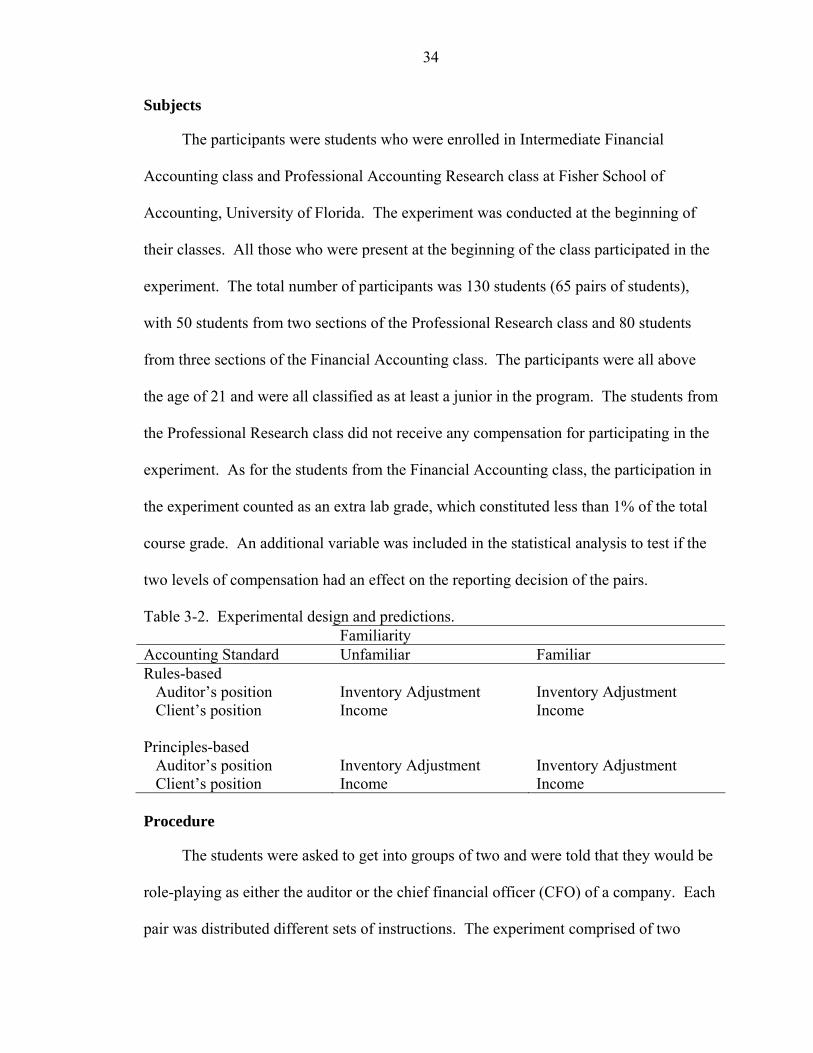
Subjects
The participants were students who were enrolled in Intermediate Financial
Accounting class and Professional Accounting Research class at Fisher School of
Accounting, University of Florida. The experiment was conducted at the beginning of
their classes. All those who were present at the beginning of the class participated in the
experiment. The total number of participants was 130 students (65 pairs of students),
with 50 students from two sections of the Professional Research class and 80 students
from three sections of the Financial Accounting class. The participants were all above
the age of 21 and were all classified as at least a junior in the program. The students from
the Professional Research class did not receive any compensation for participating in the
experiment. As for the students from the Financial Accounting class, the participation in
the experiment counted as an extra lab grade, which constituted less than 1% of the total
course grade. An additional variable was included in the statistical analysis to test if the
two levels of compensation had an effect on the reporting decision of the pairs.
Table 3-2. Experimental design and predictions. Familiarity Accounting Standard Unfamiliar Familiar Rules-based Auditor’s position Inventory Adjustment Inventory Adjustment Client’s position Income Income Principles-based Auditor’s position Inventory Adjustment Inventory Adjustment Client’s position Income Income Procedure
The students were asked to get into groups of two and were told that they would be
role-playing as either the auditor or the chief financial officer (CFO) of a company. Each
pair was distributed different sets of instructions. The experiment comprised of two
35
parts. In the first part of the experiment, the auditors received a set of instructions
informing them about their role along with a description of the accounting issue that
needed to be resolved. Half the auditors were told that they were familiar with their
client—that they were friends with the CFO and also knew them professionally. The
other half was told that this would be the first time they would be interacting with their
client. Likewise, the CFOs received a set of instructions informing them about their role
along with a description of the problem. The familiarity manipulation was applied to the
clients same way as it was applied to the auditors.
The case was adapted from the Deloitte & Touche Trueblood Accounting &
Auditing Case Study Series. The accounting issue in question was the classification of
$1,000,000. This amount could either be reported as an adjustment to inventory in the
following period or as income for the current period. After reading the case, the
participants were asked to write down and hand in to the experimenter their personal
opinion as to how the issue should be resolved.
In the second part of the experiment, the standards manipulation was applied in
addition to the familiarity manipulation. The participants were provided with a second
set of instructions. Half the pairs received principles-based standards that supported their
arguments and the other half received rules-based standards. The auditors were told that
their subordinates’ report indicated the appropriate treatment to be an adjustment to
inventory in the following period supported by the provided accounting standard. The
clients were told that for the company’s tax purposes and in order to receive the bonus for
the current period, the amount in question should be reported as income. They were also
provided with appropriate accounting standards that supported their argument, albeit
different from the ones the auditors received. All standards provided to both auditors and
36
clients are part of current GAAP and no standards were made up to support their
arguments.
Each pair, consisting of an auditor and a client, was then asked to discuss the issue
between them based on the standards provided. Half the pairs discussed the issue solely
based on rules-based standards and the other half discussed the issue based on principles-
based standards. All pairs were told that the financial statements had to be published the
next day and they had to make a joint conclusion on the matter based on the information
they had.
The threat of litigation and the removal of the auditor from the current assignment
are two factors in prior literature that have been suggested to increase the likelihood that
the auditors will agree with their clients (Farmer et al., 1987). To remove the
confounding effects of these factors, the participants were informed that there was no
threat of litigation posed by either of the accounting treatments in question and that the
client could not fire the auditor.
At the end of their discussion, the participants were asked to individually report the
concluding reporting decision; whether the amount in question should be recorded as an
inventory adjustment or income. This response provided data to test H1. The
participants were also asked to rate how familiar they felt with each other on a ten-point
scale (1=total stranger to 10=extremely familiar). This response was used to check for
the manipulation of familiarity and was also used to test H2.
Materials
The case
The case is about a company that has entered an exclusive supply agreement with a
supplier concerned about enhanced price competition from its rivals. Initially, the
37
supplier offers to pay the company a nonrefundable amount of $1,000,000 in cash and
promises best prices over the next two years in exchange for the signing of the exclusive
supply agreement. In exchange, the company has no obligations to fulfill after signing
the contract. Even if they renege and decide to purchase from another supplier, they
would still be entitled to claim the $1,000,000. The company declines to receive the
$1,000,000 in cash and instead asks the supplier to issue a credit memo of $1,000,000
that could be applied towards future purchases. The underlying motive for this is to keep
their tax bill low for the period while increasing their net income (by recording a gain of
$1,000,000), which would entitle the managers to a generous bonus. The fiscal year ends
the day after they sign the contract. The accounting issue is whether to record the amount
in question as income for the period or whether to apply it whenever inventory is actually
purchased from the supplier.
“Familiarity” manipulation
The subjects were provided with a description of the role that they were asked to
play. Familiarity manipulation was based on the length of the relationship between the
auditor and the client. Those assigned to the “familiar” group were told that they had
known each other for five years personally and professionally. They were told that they
had worked together on other business engagements, attended social gatherings together,
had occasional barbeques with each other’s families on Sundays. Those in the
“unfamiliar” group were told that this would be the first time that they would be meeting.
Both groups were told that they were with someone who was known to be both
conscientious and cooperative at work.
38
“Standards” manipulation
Rules-based standards. The auditors were provided with the following excerpt
from SAB 101, Revenue Recognition in Financial Statements (SEC, 1999), to convince
their client that the amount in question could not be recorded as income for the period
since the credit memo was inseparable from the purchase of inventory. Unless the client
purchased inventory, the credit memo was deemed worthless. There was no transaction
that actually took place with the signing of the contract. It was simply an executory
contract. The only way to disclose it would be in the footnotes to the financial
statements.
The staff states that revenue is realized or realizable and earned when all of the following criteria are met:
- Persuasive evidence of an arrangement exists [yes; an executive contract is in effect],
- Delivery has occurred or services have been rendered [no; inventory has not yet been purchased],
- The seller’s price to the buyer is fixed or determinable [yes; $1,000,000 is fixed],
- Collectibility is reasonably assured [yes].
…
Revenue may not be recognized before it is realized or realizable and earned. An amount received is not deemed to be earned under GAAP solely because it is nonrefundable… In some circumstances, the right, product, or service conveyed in conjunction with the nonrefundable fee has no utility to the purchaser separate and independent of the registrant’s performance of the other elements of the arrangement. Therefore, in the absence of the registrant’s continuing involvement under the arrangement, the customer would not have paid the fee.
The clients were provided with the following excerpt from SFAS 45, Accounting
for Franchise Fee Revenue (FASB, 1981), to justify the reason why they could report the
amount in question as income for the period. They argued that an analogy could be made
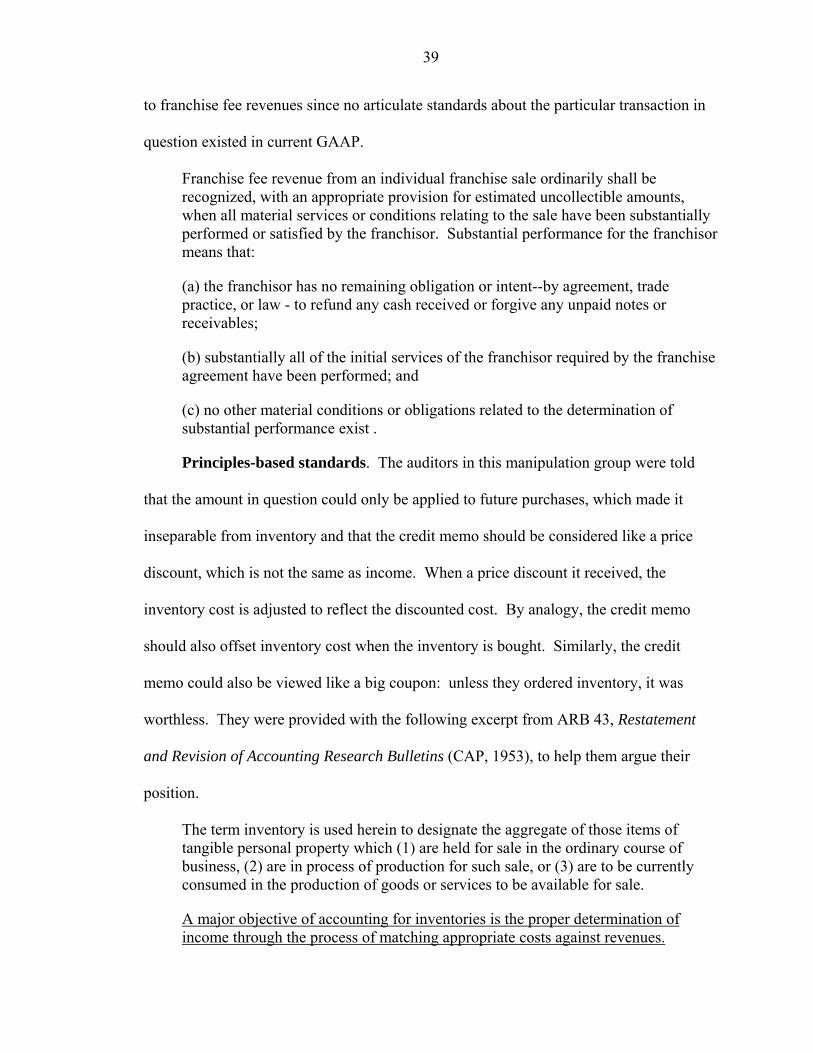
39
to franchise fee revenues since no articulate standards about the particular transaction in
question existed in current GAAP.
Franchise fee revenue from an individual franchise sale ordinarily shall be recognized, with an appropriate provision for estimated uncollectible amounts, when all material services or conditions relating to the sale have been substantially performed or satisfied by the franchisor. Substantial performance for the franchisor means that:
(a) the franchisor has no remaining obligation or intent--by agreement, trade practice, or law - to refund any cash received or forgive any unpaid notes or receivables;
(b) substantially all of the initial services of the franchisor required by the franchise agreement have been performed; and
(c) no other material conditions or obligations related to the determination of substantial performance exist .
Principles-based standards. The auditors in this manipulation group were told
that the amount in question could only be applied to future purchases, which made it
inseparable from inventory and that the credit memo should be considered like a price
discount, which is not the same as income. When a price discount it received, the
inventory cost is adjusted to reflect the discounted cost. By analogy, the credit memo
should also offset inventory cost when the inventory is bought. Similarly, the credit
memo could also be viewed like a big coupon: unless they ordered inventory, it was
worthless. They were provided with the following excerpt from ARB 43, Restatement
and Revision of Accounting Research Bulletins (CAP, 1953), to help them argue their
position.
The term inventory is used herein to designate the aggregate of those items of tangible personal property which (1) are held for sale in the ordinary course of business, (2) are in process of production for such sale, or (3) are to be currently consumed in the production of goods or services to be available for sale.
A major objective of accounting for inventories is the proper determination of income through the process of matching appropriate costs against revenues.
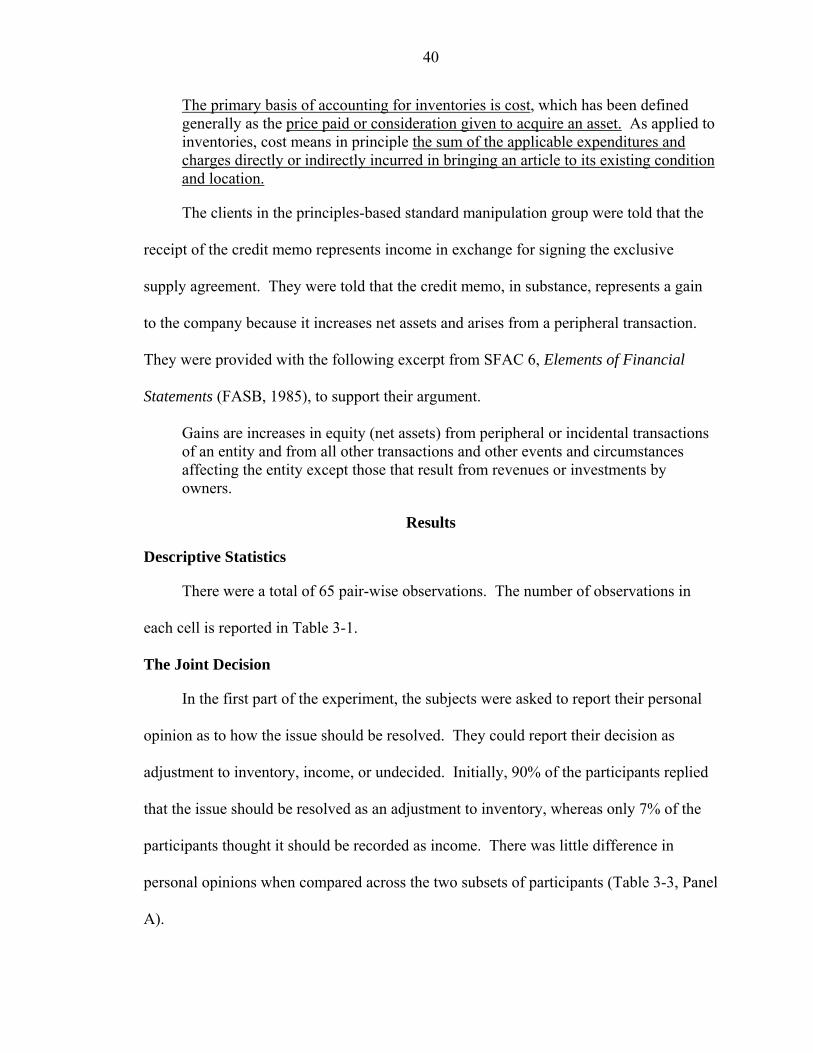
40
The primary basis of accounting for inventories is cost, which has been defined generally as the price paid or consideration given to acquire an asset. As applied to inventories, cost means in principle the sum of the applicable expenditures and charges directly or indirectly incurred in bringing an article to its existing condition and location.
The clients in the principles-based standard manipulation group were told that the
receipt of the credit memo represents income in exchange for signing the exclusive
supply agreement. They were told that the credit memo, in substance, represents a gain
to the company because it increases net assets and arises from a peripheral transaction.
They were provided with the following excerpt from SFAC 6, Elements of Financial
Statements (FASB, 1985), to support their argument.
Gains are increases in equity (net assets) from peripheral or incidental transactions of an entity and from all other transactions and other events and circumstances affecting the entity except those that result from revenues or investments by owners.
Results
Descriptive Statistics
There were a total of 65 pair-wise observations. The number of observations in
each cell is reported in Table 3-1.
The Joint Decision
In the first part of the experiment, the subjects were asked to report their personal
opinion as to how the issue should be resolved. They could report their decision as
adjustment to inventory, income, or undecided. Initially, 90% of the participants replied
that the issue should be resolved as an adjustment to inventory, whereas only 7% of the
participants thought it should be recorded as income. There was little difference in
personal opinions when compared across the two subsets of participants (Table 3-3, Panel
A).
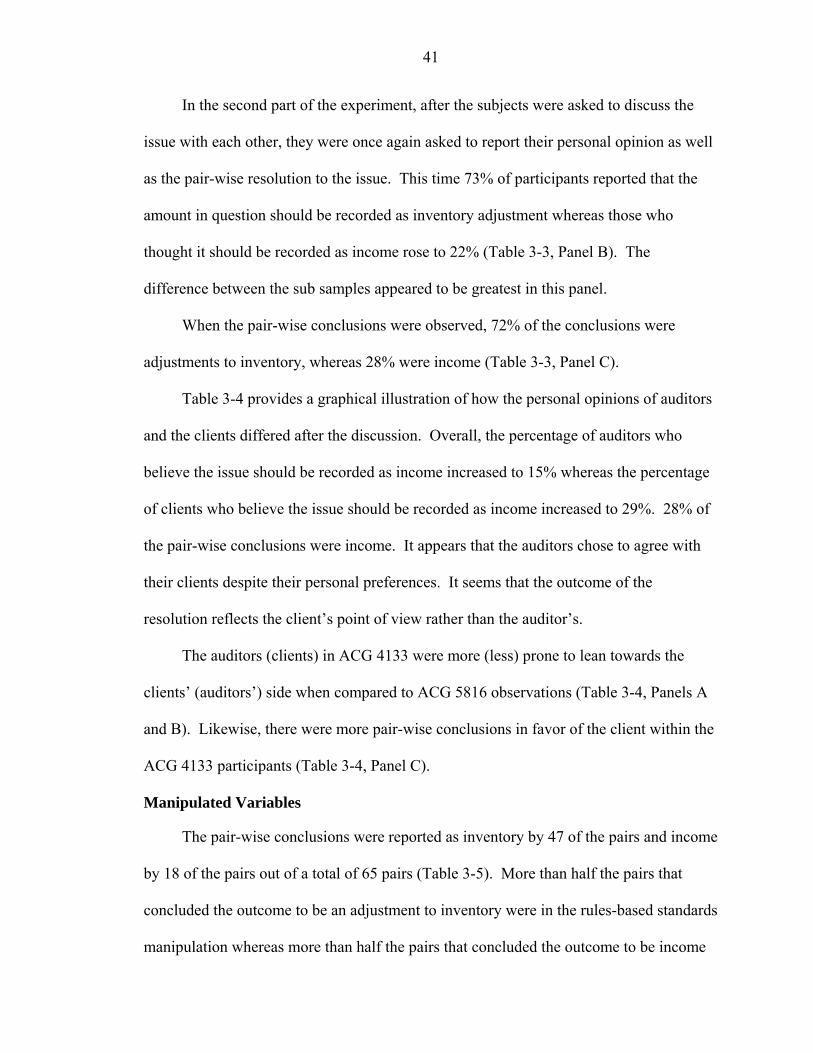
41
In the second part of the experiment, after the subjects were asked to discuss the
issue with each other, they were once again asked to report their personal opinion as well
as the pair-wise resolution to the issue. This time 73% of participants reported that the
amount in question should be recorded as inventory adjustment whereas those who
thought it should be recorded as income rose to 22% (Table 3-3, Panel B). The
difference between the sub samples appeared to be greatest in this panel.
When the pair-wise conclusions were observed, 72% of the conclusions were
adjustments to inventory, whereas 28% were income (Table 3-3, Panel C).
Table 3-4 provides a graphical illustration of how the personal opinions of auditors
and the clients differed after the discussion. Overall, the percentage of auditors who
believe the issue should be recorded as income increased to 15% whereas the percentage
of clients who believe the issue should be recorded as income increased to 29%. 28% of
the pair-wise conclusions were income. It appears that the auditors chose to agree with
their clients despite their personal preferences. It seems that the outcome of the
resolution reflects the client’s point of view rather than the auditor’s.
The auditors (clients) in ACG 4133 were more (less) prone to lean towards the
clients’ (auditors’) side when compared to ACG 5816 observations (Table 3-4, Panels A
and B). Likewise, there were more pair-wise conclusions in favor of the client within the
ACG 4133 participants (Table 3-4, Panel C).
Manipulated Variables
The pair-wise conclusions were reported as inventory by 47 of the pairs and income
by 18 of the pairs out of a total of 65 pairs (Table 3-5). More than half the pairs that
concluded the outcome to be an adjustment to inventory were in the rules-based standards
manipulation whereas more than half the pairs that concluded the outcome to be income

42
were in the principles-based standards (Table 3-5, Figure 3-1). More specifically, 33% of
the conclusions in the principles-based group were reported as income compared to 22%
of the conclusions in the rules-based group, which suggests that discussing an ambiguous
issue based on principles-based standards increases the likelihood that the auditor will
agree with their client.
Familiarity did not seem to have an effect on how the issue was resolved when
compared based on only pair-wise conclusions (Table 3-6). The total number of reported
resolutions as income and as inventory was equally divided between the familiar and
unfamiliar groups (Table 3-6, Figure 3-2). However, when the total sample was split into
groups of INCOME and INVENTORY based on pair-wise conclusions, the type of
standard and familiarity appeared to interact (Tables 3-7 and 3-8, Figures 3-3 and 3-4).
Among the pairs with inventory conclusion, i.e., when the auditor’s position was agreed
upon by the pair, more than half the pairs in the familiarity manipulation were in the
rules-based group (Table 3-7, Figure 3-3). On the other hand, among the pairs with
income conclusion, i.e., when the client’s position was agreed upon by the pair, more
than half the pairs in the familiarity manipulation were in the principles-based group
(Table 3-8, Figure 3-4). The type of standard did not have an effect on the pair-wise
conclusions when the pairs were in the unfamiliar group. Only when the pairs were
assigned to the familiar group did the type of standard seem to have a differential effect
on the pair-wise conclusions.
Manipulation Check for Familiarity
The participants were asked to report how familiar they felt with their partner after
they had discussed the issue as a manipulation check for familiarity variable. The total
sample was split into sub samples based on the familiarity manipulation. A t-test
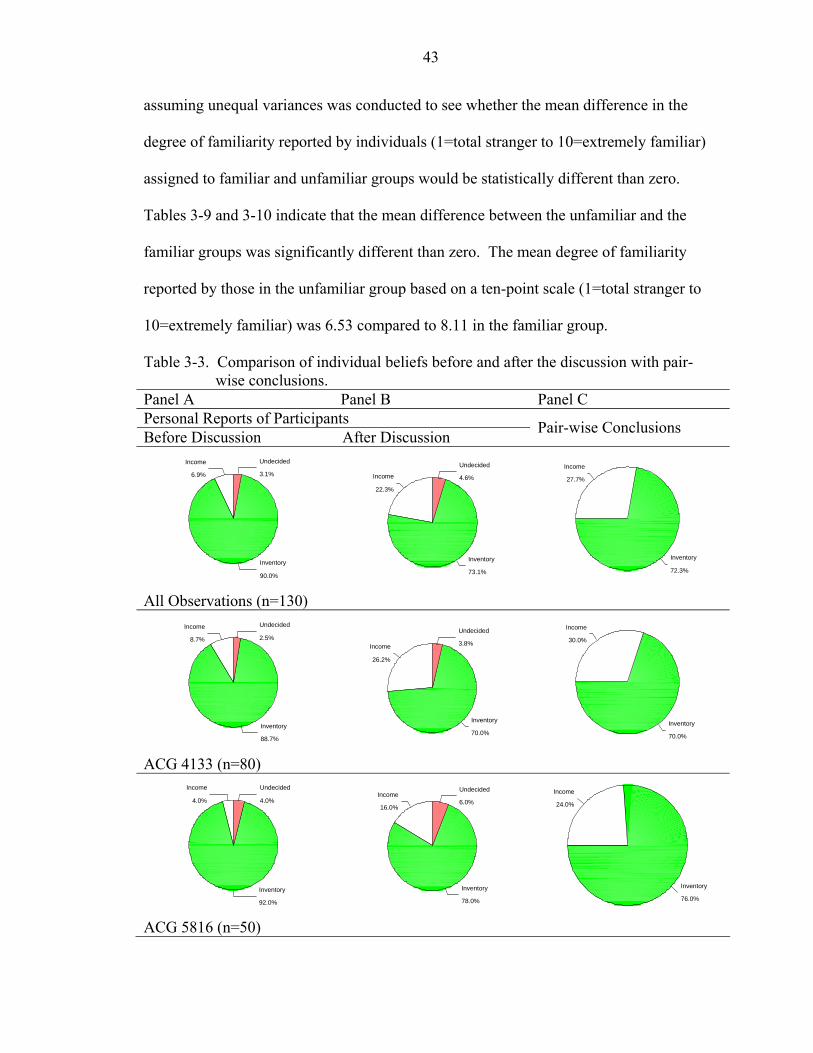
43
assuming unequal variances was conducted to see whether the mean difference in the
degree of familiarity reported by individuals (1=total stranger to 10=extremely familiar)
assigned to familiar and unfamiliar groups would be statistically different than zero.
Tables 3-9 and 3-10 indicate that the mean difference between the unfamiliar and the
familiar groups was significantly different than zero. The mean degree of familiarity
reported by those in the unfamiliar group based on a ten-point scale (1=total stranger to
10=extremely familiar) was 6.53 compared to 8.11 in the familiar group.
Table 3-3. Comparison of individual beliefs before and after the discussion with pair-wise conclusions.
Panel A Panel B Panel C Personal Reports of Participants Before Discussion After Discussion Pair-wise Conclusions
6.9%
90.0%
3.1%
Income
Inventory
Undecided
22.3%
73.1%
4.6%Income
Inventory
Undecided
72.3%
27.7%
Inventory
Income
All Observations (n=130)
8.7%
88.7%
2.5%
Income
Inventory
Undecided
26.2%
70.0%
3.8%Income
Inventory
Undecided
70.0%
30.0%
Inventory
Income
ACG 4133 (n=80)
4.0%
92.0%
4.0%
Income
Inventory
Undecided
16.0%
78.0%
6.0%Income
Inventory
Undecided
76.0%
24.0%
Inventory
Income
ACG 5816 (n=50)

44
Table 3-4. Comparison of auditor and client beliefs with pair-wise conclusions. Panel A Panel B Panel C Personal Reports of Participants After Discussion Auditors Clients Pair-wise Conclusions
15.4%
80.0%
4.6%Income
Inventory
Undecided
29.2%
66.2%
4.6%Income
Inventory
Undecided
72.3%
27.7%
Inventory
Income
All Observations (n=130)
20.0%
77.5%
2.5%Income
Inventory
Undecided
32.5%
62.5%
5.0%
Income
Inventory
Undecided
70.0%
30.0%
Inventory
Income
ACG 4133 (n=80)
8.0%
84.0%
8.0%
Income
Inventory
Undecided
24.0%
72.0%
4.0%Income
Inventory
Undecided
76.0%
24.0%
Inventory
Income
ACG 5816 (n=50)
Table 3-5. Number (percentage) of observations in “standards” manipulation. Standards Principles Rules Total
Inventory 22 (34%) 25 (38%) 47 (72%) Joint Decision Income 11 (17%) 7 (11%) 18 (28%) Total 33 (51%) 32 (49%) 65 (100%)
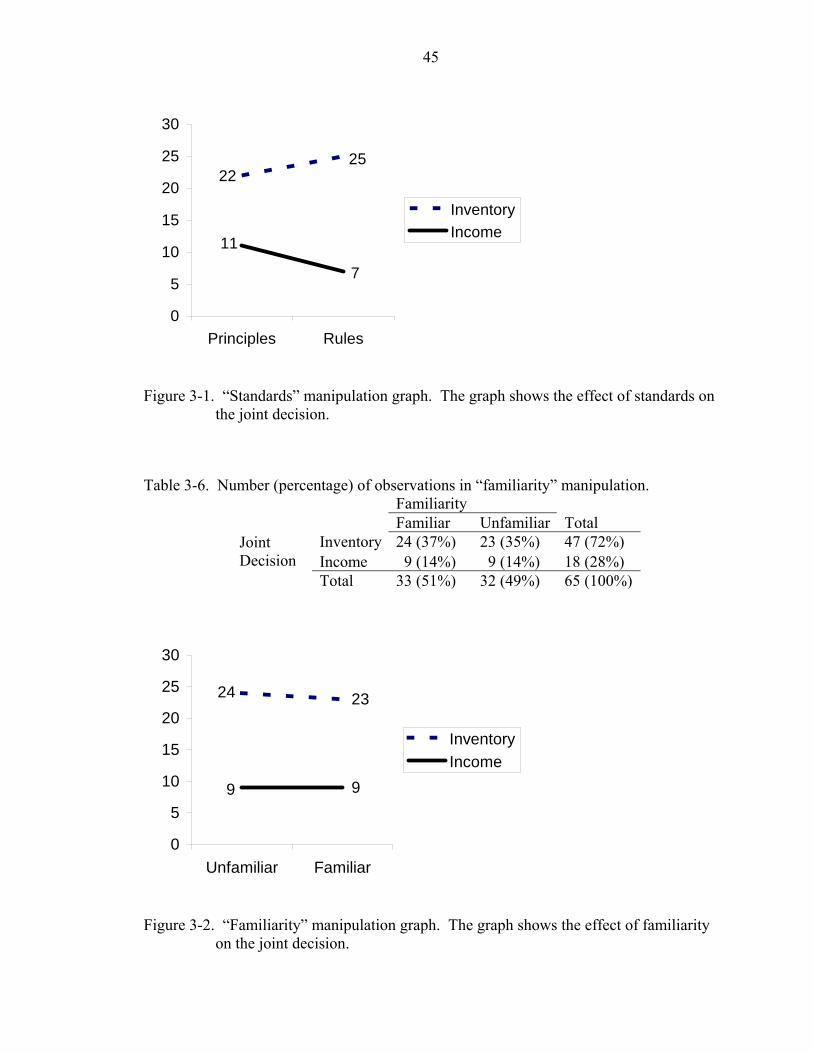
45
2522
11
7
0
5
10
15
20
25
30
Principles Rules
InventoryIncome
Figure 3-1. “Standards” manipulation graph. The graph shows the effect of standards on the joint decision.
Table 3-6. Number (percentage) of observations in “familiarity” manipulation. Familiarity Familiar Unfamiliar Total
Inventory 24 (37%) 23 (35%) 47 (72%) Joint Decision Income 9 (14%) 9 (14%) 18 (28%) Total 33 (51%) 32 (49%) 65 (100%)
23
9
24
9
0
5
10
15
20
25
30
Unfamiliar Familiar
InventoryIncome
Figure 3-2. “Familiarity” manipulation graph. The graph shows the effect of familiarity on the joint decision.
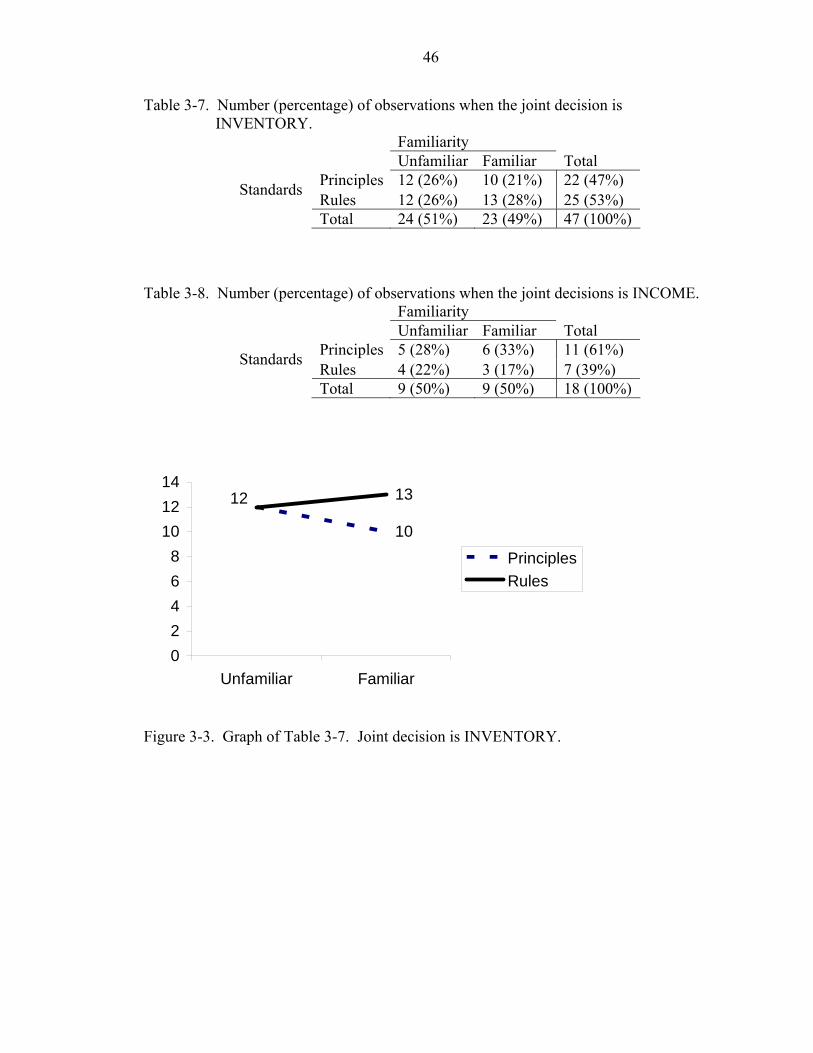
46
Table 3-7. Number (percentage) of observations when the joint decision is INVENTORY.
Familiarity Unfamiliar Familiar
Total
Principles 12 (26%) 10 (21%) 22 (47%) Standards Rules 12 (26%) 13 (28%) 25 (53%) Total 24 (51%) 23 (49%) 47 (100%)
Table 3-8. Number (percentage) of observations when the joint decisions is INCOME. Familiarity Unfamiliar Familiar
Total
Principles 5 (28%) 6 (33%) 11 (61%) Standards Rules 4 (22%) 3 (17%) 7 (39%) Total 9 (50%) 9 (50%) 18 (100%)
10
1312
02468
101214
Unfamiliar Familiar
PrinciplesRules
Figure 3-3. Graph of Table 3-7. Joint decision is INVENTORY.
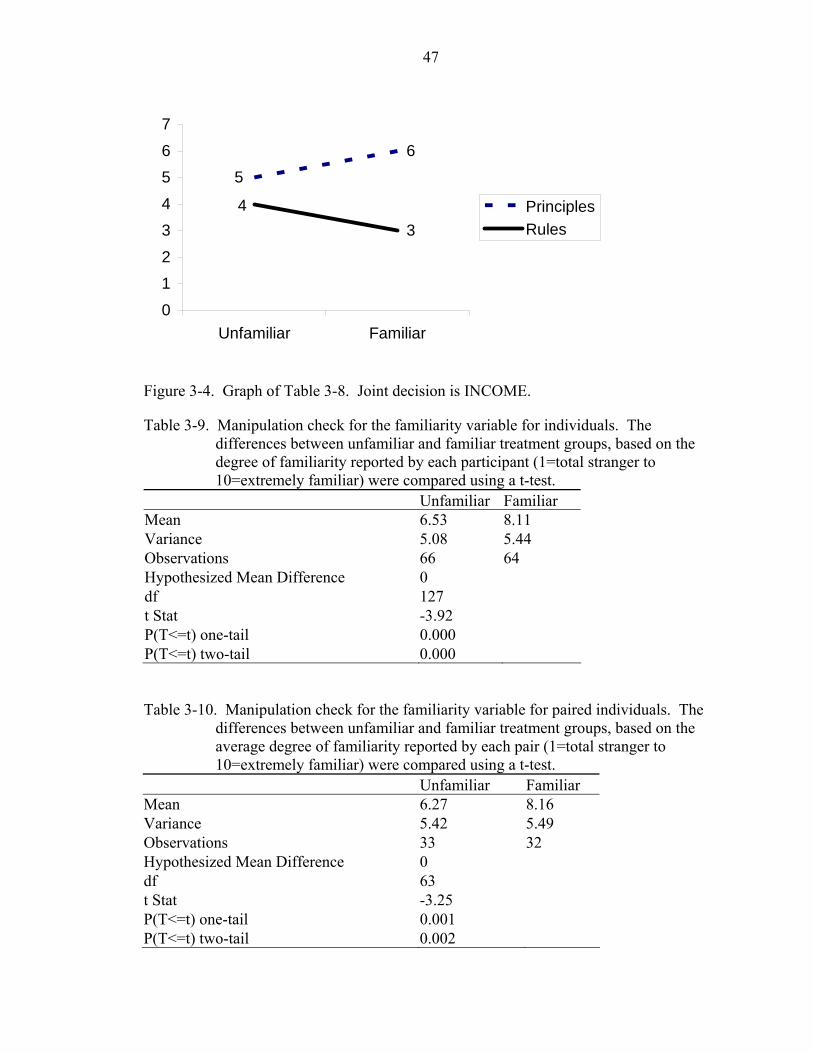
47
6
3
5
4
0
12
34
56
7
Unfamiliar Familiar
PrinciplesRules
Figure 3-4. Graph of Table 3-8. Joint decision is INCOME.
Table 3-9. Manipulation check for the familiarity variable for individuals. The differences between unfamiliar and familiar treatment groups, based on the degree of familiarity reported by each participant (1=total stranger to 10=extremely familiar) were compared using a t-test.
Unfamiliar Familiar Mean 6.53 8.11 Variance 5.08 5.44 Observations 66 64 Hypothesized Mean Difference 0 df 127 t Stat -3.92 P(T<=t) one-tail 0.000 P(T<=t) two-tail 0.000
Table 3-10. Manipulation check for the familiarity variable for paired individuals. The differences between unfamiliar and familiar treatment groups, based on the average degree of familiarity reported by each pair (1=total stranger to 10=extremely familiar) were compared using a t-test.
Unfamiliar Familiar Mean 6.27 8.16 Variance 5.42 5.49 Observations 33 32 Hypothesized Mean Difference 0 df 63 t Stat -3.25 P(T<=t) one-tail 0.001 P(T<=t) two-tail 0.002

48
Additional Variable: Compensation/Class
The participants in the Intermediate Financial Accounting class (ACG 4133)
received a grade that contributed to less that 1% of their total course grade for
participating in the experiment whereas those students in the Professional Research class
(ACG 5816) did not receive any compensation for participation. An additional binary
variable for compensation was included in the statistical analysis to control for any
differential effects this may have on pair-wise conclusions. However, the compensation
variable is confounded with the participant’s class. The experiment setup fails to
differentiate the effects of compensation from the effects of being enrolled in a different
class.
Hypothesis Tests
The participants’ individual reports and pair-wise conclusions were separately
analyzed using logistic regression with pair-wise conclusions (1=INVENTORY and
0=INCOME) as the binary dependent variable and the factors familiarity, standards, and
compensation as the independent variables. All the interaction variables were included in
the initial analysis. The pair-wise analysis results were weaker across all variables, since
the sample size was reduced from 130 to 65 when the unit of observation is changed from
individual observation to pair-wise observation. The probability modeled by the
regression is based on the INCOME conclusion. The results of the logistic regression are
reported in Table 3-11.
The regression results indicate that the main effects of familiarity, standards, and
compensation are all significant at the individual observation based analysis. Same
analysis reveals significant two-way interactions between familiarity and standards,
familiarity and compensation, and a borderline significant three-way interaction between
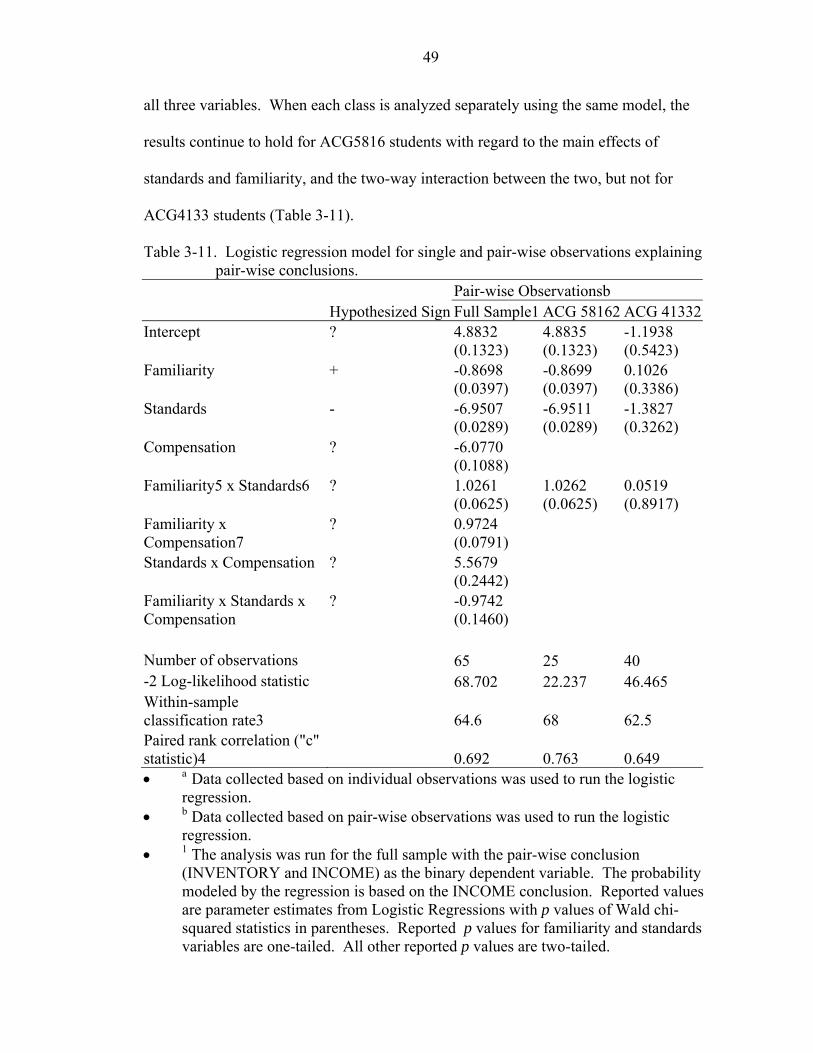
49
all three variables. When each class is analyzed separately using the same model, the
results continue to hold for ACG5816 students with regard to the main effects of
standards and familiarity, and the two-way interaction between the two, but not for
ACG4133 students (Table 3-11).
Table 3-11. Logistic regression model for single and pair-wise observations explaining pair-wise conclusions.
Pair-wise Observationsb Hypothesized Sign Full Sample1 ACG 58162 ACG 41332Intercept ? 4.8832
(0.1323) 4.8835 (0.1323)
-1.1938 (0.5423)
Familiarity + -0.8698 (0.0397)
-0.8699 (0.0397)
0.1026 (0.3386)
Standards - -6.9507 (0.0289)
-6.9511 (0.0289)
-1.3827 (0.3262)
Compensation ? -6.0770 (0.1088)
Familiarity5 x Standards6 ? 1.0261 (0.0625)
1.0262 (0.0625)
0.0519 (0.8917)
Familiarity x Compensation7
? 0.9724 (0.0791)
Standards x Compensation ? 5.5679 (0.2442)
Familiarity x Standards x Compensation
? -0.9742 (0.1460)
Number of observations 65 25 40 -2 Log-likelihood statistic 68.702 22.237 46.465 Within-sample classification rate3 64.6 68 62.5 Paired rank correlation ("c" statistic)4 0.692 0.763 0.649 • a Data collected based on individual observations was used to run the logistic
regression. • b Data collected based on pair-wise observations was used to run the logistic
regression. • 1 The analysis was run for the full sample with the pair-wise conclusion
(INVENTORY and INCOME) as the binary dependent variable. The probability modeled by the regression is based on the INCOME conclusion. Reported values are parameter estimates from Logistic Regressions with p values of Wald chi-squared statistics in parentheses. Reported p values for familiarity and standards variables are one-tailed. All other reported p values are two-tailed.
50
• 2 The analysis was conducted separately for each sub-sample with the pair-wise conclusion (INVENTORY and INCOME) as the binary dependent variable. The probability modeled by the regressions is based on the INCOME conclusion. Reported values are parameter estimates from Logistic Regressions with p values of Wald chi-squared statistics in parentheses.
• 3 This measure is a within-sample classification where each observation is classified as an event or non-event based on the predicted probability from the logistic regression and then compared to what actually happens in the event status.
• 4 This measure compares all possible pairs of observations with different responses. It is said to be concordant (discordant) if the observation with the higher response has a higher (lower) predicted probability than the lower level response. It is closest to a goodness-of-fit test.
• 5 Familiarity variable is a subjective measure of how familiar the participants felt with their partner and is included in the analysis conducted at the individual observation level. A new familiarity variable is calculated as the average of the subjective measures reported by the participants in each pair and is included in the analysis conducted at the pair-wise observation level. The familiarity variable is measured on a ten-point scale (1=total stranger to 10=extremely familiar).
• 6 Compensation variable is a binary measure coded as 1 for those participants in ACG4133 and coded as 0 for those participants in ACG5816.
• 7 Standards variable is a binary measure coded as 1 for Rules-based standards and coded as 0 for Principles-based standards.
The first hypothesis (H1) is that the likelihood that a client agrees with an auditor’s
position increases when the auditor and the client resolve the issue using rules- rather
than principles-based standards. The descriptive statistics in Table 3-5 and Figure 3-1
indicate that this relationship appears to hold. The main effect for standards was
statistically ignificant , thus providing strong support for H1. H1 is a one-directional test;
therefore the reported p-values for standards variable are one-tailed.
The analysis at each sub sample level reveals that the results for ACG 5816
participants continue to be statistically significant for standards. For ACG 4133, the
main effect of standards becomes statistically insignificant, even though the parameter
estimate’s sign is still in the same direction as the hypothesized sign.
The familiarity variable is defined differently at individual and pair-wise level
analysis. The logistic regression conducted at the individual level employed the degree
51
of familiarity reported by each participant as the familiarity variable. The same analysis
conducted at the pair-wise level employed the average degree of familiarity—calculated
as the average degree of familiarity reported by subjects in the same pair—as the
familiarity variable in the analysis.
The second hypothesis (H2) is that the more familiar an auditor is with a client, the
more likely s/he is to agree with a client’s positions. An inspection of the graphs in
Figure 3-3 and Figure 3-4 indicates conflicting results and suggests an interaction
between familiarity and standards. The main effect for familiarity in the logistic
regression (Table 3-11) is statistically significant; however the sign is in the opposite
direction from the hypothesized sign. Thus, the regression results suggest that a higher
degree of familiarity reduces the likelihood of a client-favoring outcome. This result may
be due to the fact that all participants were accounting students and even though they
were asked to play the role of the manager, they probably intrinsically reasoned with the
mind of an auditor. Thus, the more familiar the pair was, the stronger was the intrinsic
motivation to favor the auditor’s and not the manager’s position. H2 is a one-directional
test; therefore the reported p-values for familiarity are one-tailed.
The analysis at each sub sample level reveals that the results for ACG 5816
participants continue to be statistically significant for familiarity, but still in the opposite
direction from the hypothesized sign. For ACG 4133, the main effect of familiarity
becomes statistically insignificant, but the parameter estimate’s sign switches in the
direction of the hypothesized sign.
The significant interaction that is observed in the full logistic regression model was
further analyzed by splitting the sample into familiarity groups (Table 3-12). The logistic
regression based on pair-wise observations did not reveal any significant results. Thus,
52
the results for pair-wise analysis are not included. The interaction coefficient for
standards and compensation was insignificant, thus the data was not further analyzed at
class levels. The simple effect test for standards reveals at borderline significance that
when the auditor and the client are familiar with each other, discussing the ambiguous
issue using rules-based (principles-based) standards decreases the likelihood of a client-
favoring (auditor-favoring) outcome. This relation can be graphically observed in Figure
3-3 and Figure 3-4. On the other hand, when the auditor and the client were unfamiliar
with each other, discussing the ambiguous issue using rules- or principles-based
standards did not have any impact on the outcome of the resolution.
The logistic regression was conducted using sex, age, and academic level in the
program entering as independent variables. None of these additional variables had an
impact on the pair-wise conclusions. Thus, these results are not reported.
Discussion and Limitations
Results Discussion
The analysis conducted at two sub sample of classes show considerable differences.
A number of explanations can be enumerated for these differences. First of all, the
differences in results may be attributed to the compensation provided for participating in
the experiment to only one of the groups. Given the insignificance of the majority of
results for this compensated group, it appears that providing compensation randomized
the data. This view is not consistent with the idea of providing compensation in the first
place. Thus, there must be some other reason to explain the insignificant results in one
group and significant results in the other group. A plausible explanation is accounting
knowledge of students. ACG 5816 students have already taken ACG 4133 as a
prerequisite for enrolling in ACG5816. Thus, their accounting knowledge base can be
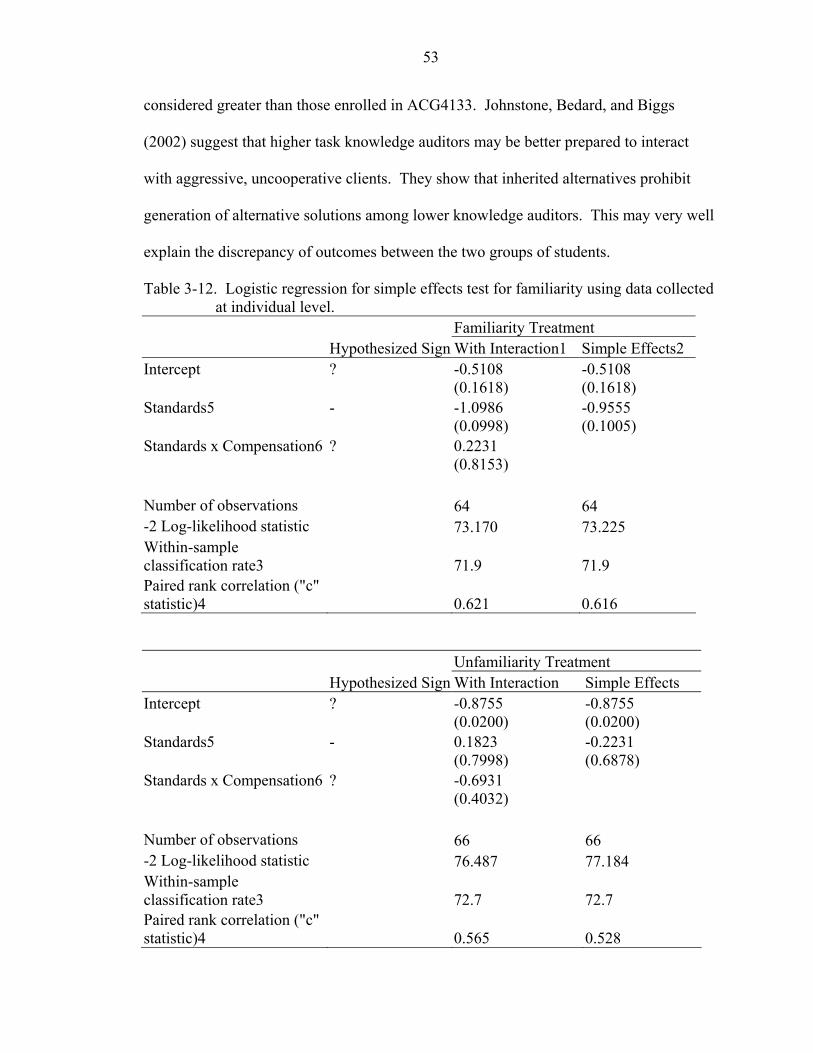
53
considered greater than those enrolled in ACG4133. Johnstone, Bedard, and Biggs
(2002) suggest that higher task knowledge auditors may be better prepared to interact
with aggressive, uncooperative clients. They show that inherited alternatives prohibit
generation of alternative solutions among lower knowledge auditors. This may very well
explain the discrepancy of outcomes between the two groups of students.
Table 3-12. Logistic regression for simple effects test for familiarity using data collected at individual level.
Familiarity Treatment Hypothesized Sign With Interaction1 Simple Effects2 Intercept ? -0.5108
(0.1618) -0.5108 (0.1618)
Standards5 - -1.0986 (0.0998)
-0.9555 (0.1005)
Standards x Compensation6 ? 0.2231 (0.8153)
Number of observations 64 64 -2 Log-likelihood statistic 73.170 73.225 Within-sample classification rate3 71.9 71.9 Paired rank correlation ("c" statistic)4 0.621 0.616
Unfamiliarity Treatment Hypothesized Sign With Interaction Simple Effects Intercept ? -0.8755
(0.0200) -0.8755 (0.0200)
Standards5 - 0.1823 (0.7998)
-0.2231 (0.6878)
Standards x Compensation6 ? -0.6931 (0.4032)
Number of observations 66 66 -2 Log-likelihood statistic 76.487 77.184 Within-sample classification rate3 72.7 72.7 Paired rank correlation ("c" statistic)4 0.565 0.528
54
• 1 The analysis was run for the full sample with the pair-wise conclusion (INVENTORY and INCOME) as the binary dependent variable splitting on familiarity. The probability modeled by the regression is based on the INCOME conclusion. Reported values are parameter estimates from Logistic Regressions and those in parentheses are one-tailed p values for standards and two-tailed p values for other parameter estimates of Wald chi-squared statistics.
• 2 The analysis was run for the full sample with the pair-wise conclusion (INVENTORY and INCOME) as the binary dependent variable splitting on familiarity to test for simple effects of standards. The probability modeled by the regression is based on the INCOME conclusion. Reported values are parameter estimates from Logistic Regressions with p values of Wald chi-squared statistics in parentheses.
• 3 This measure is a within-sample classification where each observation is classified as an event or non-event based on the predicted probability from the logistic regression and then compared to what actually happens in the event status.
• 4 This measure compares all possible pairs of observations with different responses. It is said to be concordant (discordant) if the observation with the higher response has a higher (lower) predicted probability than the lower level response. It is closest to a goodness-of-fit test.
• 5 Standards variable is a binary measure coded as 1 for Rules-based standards and coded as 0 for Principles-based standards.
• 6 Compensation variable is a binary measure coded as 1 for those participants in ACG4133 and coded as 0 for those participants in ACG5816.
Another factor that may have produced the differences in results is the level of
authority present in the classroom while the experiment was conducted. The professor
was personally present when the experiment was administered to ACG5816 students
whereas a teaching assistant, who was a graduate student, was initially present and then
left the classroom while the experiment was administered to ACG4133 students. This
could suggest that the students in ACG5816 (more knowledgeable compared to those in
ACG4133 and working under the presence of an authority—albeit without any
compensation for participation) took the experiment far more seriously than the other
group. One could possibly infer that the credibility of the results from ACG5816
students are further enhanced by these uncontrolled and unforeseen factors that existed at
55
the time the experiment was conducted. Interpreted this way, the data obtained from
ACG4133 students could be viewed as adding random noise to the analysis.
The comparison of individual beliefs with pair-wise conclusions (Figure 2 and
Figure 3) illustrate that the outcome of conflict resolution closely reflects the beliefs of
clients. This could mean that auditor independence is truly impossible (Bazerman,
Morgan, Loewenstein, 1997). This pattern clearly reflects Antle and Nalebuff’s (1991)
claim that joint conclusions of auditor and client are always client-favored. Figure 2
shows that the initial beliefs of participants before they discuss the issue are not
associated with their privately reported beliefs and the outcome of the resolution after
they have discussed the issue. Gibbins et al. (2001) also reported that they found no
association between the reported initial beliefs of the parties and the contextual features,
when beliefs are considered very important in basic negotiation models.
Limitations
One major limitation of the experiment is that the selected sample was initially
biased towards the auditor-favored conclusion. This was because all participants were
accounting majors. Nonetheless, comparison of initial beliefs with pair-wise conclusions
still display differences, indicating that even asking accounting students to role-play as
clients has an impact on the outcome of the conflict resolution. However, because the
sample was initially biased towards one side, this naturally produced pair-wise
conclusions that were also biased towards the same side, weakening the statistical results.
The pairs were provided with only one accounting standard to defend their point of
view. In reality, a variety of accounting standards are used to justify a certain reporting
decision and this set of standards will include both rules- and principles-based standards.
Thus, the results of the experiment are not immediately generalizable to other settings.
56
An important factor to reflect upon is that the standard setting process is a process and
that standards are not a static set over time. “Significant efforts should be made to
continue progress in the development of objectives from this point on. The objectives of
financial statements are not and should not be static.” (report of the Accounting
Objectives Study Group, 1973, p. 44).
Majority of the subjects in the experiment had been in the program long enough to
know most about everybody in their class. Hence, even though the familiarity
manipulation seems to have worked to a certain degree, the results should be interpreted
with caution. Instructing people to assume that they do not know somebody when they
actually do is tricky. This can possibly explain why there were no significant results
associated with the unfamiliar group.
A further limitation of the study is that the experimental design did not take into
consideration potentially important factors in negotiation such as the
bargaining/discussion strategies of subjects, first mover advantage, additional information
added into the setting by the participants, and the degree of effort each participant put
into the discussion.
In the real world, there are many other factors that enter a negotiation process, each
factor interacting to a certain degree with all the other factors. Even in this small study, it
was documented that most of the interactions between the variables were significant.
Hence, the results of this study should be taken with a grain of salt for the simple fact that
there are at least a dozen missing variables from the equation.
57
CHAPTER 4 CONCLUSION
The principle of conservatism is an important feature of the financial reporting
system. There have been numerous empirical attempts to measure the extent of
conservatism embedded in the financial statements. Chapter 2 discusses these different
measures and the results of the empirical studies in light of a simple model that attempts
to explain the conflicting results of balance sheet based and income statement based
conservatism measures. The model explains why increased income statement based
conservatism may be associated with decreased balance sheet based conservatism. I also
distinguish between growth and no-growth firms and argue that the difference between
the two measures cannot be interpreted adequately given increased growth. Additional
empirical analysis is needed to test the model. An empirical study can be conducted
using a proxy for growth and forming portfolios based on growth and then measuring the
degree of conservatism on the balance sheet and the income statement.
One very important conclusion that emerges from chapter 2 is that there is not a
single measure of conservatism. There are many factors to consider and any simplistic
way of attempting to measure conservatism cannot be relied upon to draw conclusions
about the degree of conservatism inherent in financial reporting. Other than quantitative
factors, there are qualitative factors that interfere when making decisions under
uncertainty. Prudence for example, a subjective concept, is deemed conservative
behavior (Giner and Rees, 2001). Thus, the “value” of an increment of prudence or the
level of prudence may differ greatly across companies and across countries.
58
Chapter 3 explores the effects of two qualitative factors that may influence
conservatism in financial reporting. A unique setting is chosen to explore how the
resolution of an ambiguous accounting issue between the auditor and the client can be
affected by employing different types of standards and whether the degree of familiarity
between the auditor and the client impacts the outcome of the resolution. The
experimental design is based on the three-element process model of auditor-client
accounting negotiation proposed by Gibbins et al. (2001). The results indicate that the
type of standards and the degree of familiarity jointly have an effect on conflict
resolution. Thus, the joint decision of two parties that have a conflict of interest will
ultimately affect the degree of conservatism in the reported numbers.
Hence, conservatism is an elusive concept difficult to operationalize with simple
quantitative measures that lack contextual factors. Any empirical studies that claim to
report on the degree of conservatism in financial reporting have to be analyzed and
interpreted with great caution before drawing conclusions.
59
APPENDIX HISTORICAL PERSPECTIVE ON THE DEVELOPMENT OF ACCOUNTING
STANDARDS
1929 Market Crash and the Development of Accounting Standards
The Securities and Exchange Commission (SEC) was formed to restore public
confidence in the capital markets after the stock market crash in 1929. The main purpose
of the SEC was to build investors’ trust by ensuring that the companies truthfully
conveyed information about themselves to the public
[http://www.sec.gov/about/whatwedo.shtml]. The only way this could be done and
monitored at the same time was creating regulations that would make the companies
report truthfully. Regulation is possible through the formation of a police force of some
kind that will enforce a set of rules. The SEC would be the police force and the set of
rules needed to be created. At the time, accounting standards were not heard of, so the
SEC encouraged the creation of a group of standard setters. In recognition of the
resources, expertise, and talent of the private sector, the SEC supported the formation of a
private standard-setting body and asked the American Institute of Accountants (later
AICPA) to undertake the task of providing accounting standards for companies (Kieso,
Weygandt, and Warfield, 2001).
The AICPA appointed a small group of prominent academics, Sanders, Hatfield,
and Moore, to write the accounting standards and published their work in 1938: A
Statement of Accounting Principles, which is the first noteworthy book of accounting
standards. In the Introduction section of the book, the authors stated that several
institutions had already issued various sets of accounting standards. For example, the
60
AICPA had published a brief statement of principles, the SEC had issued accounting
regulations for the administration of the legislation, and the Bureau of Internal Revenue
had enlarged the volume of its accounting rules for determining taxable income.
However, none of the issued statements represented a complete formulation of
accounting principles. It seemed that each agency was stating only those accounting
rules that required compliance with the statutes it was administering. Thus, the time
seemed ripe for the compilation of a comprehensive statement of accounting principles.
The authors, not being members of the AICPA but notable academics, had been asked to
carry out the task of writing the standards on behalf of the Institute yet independently
from the Institute. This appeared to be a perfect arrangement for the AICPA: it
encouraged research without lending authority to its findings. On the other hand, the
SEC was not satisfied with the arrangement and urged the Institute to back their findings
and endorse their principles, which led to the formation of the Committee on Accounting
Procedure (CAP) in 1939 (Baxter, 1979).
CAP issued 51 authoritative standards known as Accounting Research Bulletins
(ARB) from 1939 to 1959. ARBs were issued in response to accounting problems
occurring at the time. The ARBs had a big impact on the financial reporting system and
constituted the basis of generally accepted accounting principles (GAAP), but the
problem-by-problem approach to formulating standards failed to provide the desired
structured body of accounting standards (Kieso et. al, 2001). All CAP members worked
part-time. There was not enough staff and the turnover ratio was high. The critics
pointed out that the committee did not rely enough on research and that it was the
catspaw of the SEC. Thus, came the demise of CAP and the formation of a new
committee: the Accounting Principles Board (Baxter, 1979).
61
The Accounting Principles Board (APB), run by about 20 part-time members,
replaced CAP in 1959. After a decade of its formation, criticisms began to pour in once
more: APB was considered to be lacking the resources necessary to develop high-quality
standards to meet the increasingly complex business transactions of the times
[http://www.aicpa.org/info/regulation02.htm]. The development of a conceptual
framework was a principal part of the charter of the APB in 1958 (Burton, 1978). Yet,
there were complaints about the lack of articulated statements of basic concepts
underlying procedures that would enable uniformity, simplicity, and comparability in
financial reporting. There was a “longing for certainty” that could only be provided by a
coordinated system of principles (Davidson, 1969). APB’s failure to provide such a
conceptual framework has been cited as one of the main reasons that eventually led to its
replacement by the Financial Accounting Standards Board (FASB) in 1973 (Burton,
1978). By the time APB was terminated, it had issued 31 standards called APB
Opinions.
Blue Monday and the Emerging FASB
Trueblood (1970) observed that there were “rising expectations” in all fields
including accounting mostly because of the advances in technology and communications
at the time. He pointed out that increased personal and social choices, business
alternatives, interdependence, and the rising costs accompanying the choices would likely
intensify the moral and ethical problems that already existed in the accounting profession.
He called for “rules for the profession” so that the accountants could not find ways to
circumvent APB Opinions that their clients did not like. He stated that the “profession
must move to correct deficiencies in the setting of standards with more alacrity than it has
so far seemed able to muster” (p. 38).
62
Trueblood’s observations and recommendations for the accounting profession
closely follow the market crash of 1969. In 1971, in the aftermath of the crash, the
AICPA appointed a Study Group on Establishment of Accounting Principles (commonly
known as the Wheat Committee). This was an action similar to the one that AICPA
undertook after the 1929 crash when the AICPA appointed academics to write standards
on behalf of the Institute. The Study Group’s recommendations were submitted to the
AICPA Council in 1972, adopted in total, and shortly after implemented in 1973. As a
result of the Wheat Committee’s recommendations, the APB was disbanded and the
FASB was founded (Kieso et. al, 2001).
The Study Group’s conclusions were based upon the fundamental concept that
financial statements should aid economic decision-making. All the major conclusions of
the Group aimed for a “principles-based” approach to standard setting. “Emphasize
substance, not technical form” was explicitly listed as one of the conclusions (Report of
the Accounting Objectives Study Group, 1973). Hence, the Wheat Committee initially
started out with a principles-based approach to standard setting just like all the previous
committees that undertook the task.
The FASB started its operations by implementing the Trueblood report and
formulating a conceptual framework for the profession, which the CAP and the APB had
failed to do. This conceptual framework would provide the basis upon which new
standards could be issued (Flegm, 1989). Flegm (1989) described the FASB’s next
decade full of tension but nonetheless revolutionary as the committee proceeded on the
conceptual framework project. The Discussion Memorandum (DM) published in 1976
supported a shift from the matching of costs and revenues perspective to an asset/liability
63
view when determining income. Two public hearings were held in 1977 and 1978 to
discuss the DM and the perceived shift in income determination.
In 1978, Flegm (1989) attended a special meeting of the FASB on the conceptual
framework project and the DM. The meeting entailed the discussion of “eight examples
of accounting problems … with the participants being asked to1 comment on whether or
not they accepted the various alternatives under the asset/liability or revenue/expense2
view. Without delving extensively into the discussion, it is fair to say that there was little
consensus on any of the issues” (p. 91). The author stated that despite the lack of
consensus, the FASB was determined to implement the Trueblood report, which was
geared toward the asset/liability view of income and entailed the prediction of future cash
flows and fair value accounting. On the other hand, accountants led by Financial
Executives Institute’s (FEI) Committee on Corporate Reporting, argued for the
maintenance of the historical-cost based accounting and the retention of the matching
concept (p. 91). Flegm pointed out that this fundamental argument had not been resolved
when the concepts statements were being developed, which eventually led to so many
compromises that in the end no one has been satisfied with the result.
To assist the FASB in the development of a conceptual framework, the AICPA,
Financial Analysts Federation, FEI, and the Robert Morris Associates got together to
discuss the issue in the triennial Seaview Symposium (Burton, 1978). The group shared
the general view that financial statements should be limited to objectively verifiable data
1 Asset/liability perspective considers assets and liabilities to be direct measurements of economic phenomena and defines income as a change in such phenomena. This view endorses the fair-value approach to accounting (Burton, 1978).
2 Revenue/expense perspective considers assets and liabilities to be residuals arising out of the income measurement process. This view endorses the historical cost approach to accounting (Burton, 1978).
64
and objectivity should not be compromised for better predictive information. However,
there were differences of opinion on how far the process of emphasizing objectivity
should go. Some supported the notion of moving towards a more cash-basis accounting,
whereas others, including the FASB, preferred an accrual-basis accounting but at the
same time were in favor of objective measurements that would minimize management’s
role in income determination. The consensus was that the financial statements
themselves should not emphasize predictive data, yet a predictive approach to financial
reporting should be undertaken outside the financial statements to aid users of
information in decision-making about companies. The group proposed that predictive
data, subject to uncertainties and differences in subjective opinion, should appear under a
separate section of the financial report and not be audited as rigorously as the financial
statements. This way the statements would be simpler, more uniform, more
understandable and less subject to manipulation. A small group was concerned because
of added constraints to the conceptual framework project and objected to an
implementation of the dual reporting approach. (Burton, 1978).
1980s: How (and Why) did We Move Away from ‘Principles-Based’ Approach to Standard Setting toward a ‘Rules-Based’ Approach?
In the 1980s, the search for a conceptual framework to guide the FASB in decision
making was still a lingering issue. Accounting Principles Board Statement no. 4, Basic
Concepts and Accounting Principles Underlying Financial Statements of Business
Enterprises, was perceived as helpful in defining objectives, but nevertheless considered
insufficient in prescribing a clear direction for standard setting (Kirk, 1981).
Horngren (1981) observed that the FASB was moving in the direction of building a
conceptual framework that emphasized the technology of accounting. He explained that
65
this was because of a “problem of social choice.” A technical framework would empower
the FASB by “measuring the financial impact of events in an evenhanded manner” and
thus steer the board away from the “problem of social choice.” For the FASB, this
“problem” entailed the identification of the constituencies in power, acting in accordance
with their wishes and accomplishing this in a manner that would be acceptable by “the
800-pound gorilla in the form of the federal government, particularly the SEC” in order
to ensure its survival. The emphasis on certain issues would still continue to depend on
the relative importance of the board’s constituencies, but building a more technical
framework would enable the FASB to stay away from the policymaking process
(Horngren, 1981, p. 88).
In the beginning of the 1980s, the accounting profession had already begun
complaining about a standards overload (Chenok et. al, 1980). Not heeding the protests
of the profession, the FASB embarked on a journey of moving away from “principles-
based” toward “rules-based” standards. The motivation behind this apparent course of
action was to empower the FASB help drive out “creative accounting” that emerged as
executive pays were increasingly tied to reported profits and as new and riskier ways of
financing appeared as a result of globalization and deregulation (Piecara, 2002).
Sterling’s captivating description of the accountant’s dilemma (1973) closely
parallels the FASB’s problem in the 1980s and why the board opted to move toward a
more “rules-based approach” to standard setting:
“As an independent auditor, the accountant needed a strong defense against the
always optimistic, sometimes dishonest, financiers and entrepreneurs. Unfortunately, he
was not given this defense. Instead, he was placed in the precarious position of being the
employee of the person he was obliged to keep honest. In the absence of a cohesive
66
theory, in the absence of police power, in the presence of ignorance and apathy of the
community, his only defense was precedent and persuasion. Precedent soon became rule
and the rigid application of rules was his primary weapon. It is much easier and more
diplomatic to accuse someone of breaking a rule than to accuse him of telling a lie” (p.
61).
“The Nature of Standards” in 1980s, EITF, and More “Rigid” Rules
The Emerging Issues Task Force (EITF) was established in 1984 upon the FASB’s
recommendations to form a group responsible for timely financial reporting guidance in
order to assist with emerging accounting problems [http://www.fasb.org/eitf]. The task
force did not have any formal authority, yet its views quickly became to be regarded as
de facto GAAP for managers and accountants who wanted timely guidance on new issues
(Wishon, 1986). In less than two years time after its formation, the EITF fueled the
lively debate on whether standards should be “general” or “specific” (Wishon, 1986).
Despite advocates for broad and general standards, who believed detailed questions
should be dealt by managers, the task force’s having reached a consensus on almost 50
issues in its first 20 months was clear evidence that those who supported detailed
standards had won the latest round on the long-debated issue (Wishon, 1986).
Black Monday and the Troubled FASB
There were major changes in the composition of the FASB right before the market
crash in 1987 (Flegm, 1989). The publication of a White Paper sponsored by the FEI and
the Accounting Principles Task Force suggested an increase in business-trained people on
the FASB and the trustees of the Financial Accounting Foundation (FAF), which was
followed by the appointment of Art Northrop and Vic Brown (both with primarily a
business background) to the FASB. This raised considerable controversy in the
67
accounting field with some believing it to be an attempt by business to “take over” the
standards-setting process. The resignation of Art Wyatt in mid-1987 because of the
increased influence of business in the FASB’s activities was the ultimate peak of the
controversy. As the dispute subsided following the appointments of Jim Leisenring and
Clarence Sampson to the FASB, and by the time the virtual reformation of the Board was
complete in 1987, there was yet another market crash: the Black Monday. This time the
reformation of the standard-setting committee coincided with the collapse of the financial
market. Hence, this was the FASB’s opportunity to start afresh with the financial market
in the aftermath of the crash.
The “Tech Bubble” and the Proposed Shift from “Rules-based” to “Principles-based” Standards
History seems to repeat itself as we once again embark on a search to improve the
financial reporting system after yet another market crash: the “burst of the tech bubble”.
The desirable shift is this time towards a more principles-based approach to accounting
standards as called forth by the Sarbanes-Oxley Act to which the FASB has responded by
issuing a “Proposal for a Principles-Based Approach to U.S. Standard Setting” (FASB
2002).
68
LIST OF REFERENCES
Antle, R., and B. Nalebuff. 1991. Conservatism and auditor-client negotiations. Journal of Accounting Research 29 (Supplement): 31-54.
Asare, S. K., and L. S. McDaniel. 1996. The effects of familiarity with the preparer and task complexity on the effectiveness of the audit review process. The Accounting Review 71 (April): 139-159.
Ball, R., S. P. Kothari, and A. Robin. 2000. The effect of international institutional factors on properties of accounting earnings. Journal of Accounting and Economics 29: 1-51.
Barth, M. E., W. H. Beaver, and W. R. Landsman. 2001. The relevance of the value relevance literature for financial accounting standard setting: Another view. Journal of Accounting and Economics 31: 77-104.
Basu, S. 1997. The conservatism principle and the asymmetric timeliness of earnings. Journal of Accounting and Economics 24: 3-37.
Basu, S. 2001. Discussion of ‘On the asymmetric recognition of good and bad news in France, Germany and the United Kingdom.’ Journal of Business Finance & Accounting 28 (9/10): 1333-1349.
Bazerman, M. H., K. P. Morgan, G. F. Loewenstein. 1997. The impossibility of auditor independence. Sloan Management Review 38 (4): 89-94.
Beaver, W. H. 1998. Financial reporting: An accounting revolution. Upper Saddle River, NJ: Prentice Hall
Beaver, W. H., and S. G. Ryan. 2000. Biases and lags in book value and their effects on the ability of the book-to-market ratio to predict book return on equity. Journal of Accounting Research 38 (1): 127-148.
Begley, J., and R. Freedman. 2004. The changing role of accounting numbers in public lending agreements. Accounting Horizons 18 (2): 81-96.
Bowen, R. M., L. DuCharme, and D. Shores. 1995. Stakeholders’ implicit claims and accounting method choice. Journal of Accounting and Economics 20 (3): 255-295.
69
Brasil, Jr., and S. Meira. 2001. Rules and principles in legal reasoning. A study of vagueness and collisions in artificial intelligence and law. Information and Communications Technology Law 10 (1): 67-77.
Brealey, R. A, S. C. Myers, and A. J. Marcus. 2001. Fundamentals of Corporate Finance Third Edition: McGraw-Hill Irwin.
Burton, J. C. 1978. A symposium on the conceptual framework. Journal of Accountancy 145 (1): 53-58.
Chenok, P. B., D. R. Carmichael, and T. P. Kelly. 1980. Accounting and auditing: The technical challenges ahead. Journal of Accountancy 150 (5): 62-70.
Committee on Accounting Procedures (CAP), AICPA. 1953. Accounting Research Bulletin No. 43: Restatement and Revision of Accounting Research Bulletins, Chapter 4 Paragraph 3-5.
Cuccia, A. D., K. Hackenbrack, M. W. Nelson. 1995. The ability of professional standards to mitigate aggressive reporting. The Accounting Review 70 (2): 227-248.
Davidson, S. 1969. Accounting and financial reporting in the seventies. Journal of Accountancy 128 (6): 29-37.
Devine, C. T. 1963. The rule of conservatism reexamined. Journal of Accounting Research 1 (2): 127-138.
Dopuch, N., R. R. King, and R. Schwartz. 2001. An experimental investigation of retention and rotation requirements. Journal of Accounting Research 39 (1): 93-117.
Fama, E. F., and K. R. French. 1998. Value versus growth: The international evidence. Journal of Finance 53 (6): 1975-1999.
_____. 1995. Size and book-to-market factors in earnings and returns. Journal of Finance 50 (1): 131-155.
Farmer, T. A., L. E. Rittenberg, and G. M. Trompeter. 1987. An investigation of the impact of economic and organizational factors on auditor independence. Auditing: A Journal of Practice & Theory 7 (1): 1-14.
Feltham, G., and J. A. Ohlson. 1995. Valuation and clean surplus accounting for operating and financial activities. Contemporary Accounting Research 11 (2): 689-731.
Financial Accounting Standard Board (FASB). 1980. Statement of financial accounting concepts No.2: qualitative characteristics of accounting information. Norwalk, CT: FASB.
70
__________. 1981. Statement of Financial Accounting Standards No. 45: Accounting for Franchise Fee Revenue, Paragraph 5. Stamford, CT: FASB.
__________. 1985. Statement of Financial Accounting Concepts No. 6: Elements of Financial Statements, Paragraph 79. Stamford, CT: FASB.
__________. 2002. Proposal: Principles-based approach to U.S. standard setting. File Reference No. 1125-001. Norwalk, CT: FASB.
Flegm, E. H. 1989. Commentary on the limitations of accounting. Accounting Horizons 3 (3): 90-97.
Gibbins M. 2002. Discussion of Evidence from auditors about managers’ and auditors’ earnings management decisions. The Accounting Review 77 (Supplement): 203-211.
Gibbins, M., S. McCracken, and S. Salterio. 2003. Evidence about auditor-client management negotiation concerning client’s financial reporting: The chief financial officer perspective. Working Paper.
Gibbins, M., S. Salterio, and A. Webb. 2001. Evidence about auditor-client management negotiation concerning client’s financial reporting. Journal of Accounting Research 39 (3): 535-563.
Gigler, F. B., and T. Hemmer. 2001. Conservatism, optimal disclosure policy, and the timeliness of financial reports. The Accounting Review 76 (4): 471-493.
Giner, B., and W. Rees. 2001. On the asymmetric recognition of good and bad news in France, Germany and the United Kingdom. Journal of Business Finance & Accounting 28 (9/10): 1285-1331.
Givoly, D., and C. Hayn. 2000. The changing time-series properties of earnings, cash flows and accruals: Has financial reporting become more conservative? Journal of Accounting and Economics 29 (3): 287-320.
Givoly, D., C. Hayn, and A. Natarajan. 2003. Measuring reporting conservatism. Working Paper. Smeal College of Business, Pennsylvania State University, The Anderson School Graduate School of Management, University of California –Los Angeles, and California State University –Pomona.
Glazer, A. S., and H. R. Jaenicke. 2002. A pathology of the Independence Standards Board’s Conceptual Framework Project. Accounting Horizons 16 (4): 329-352.
Hackenbrack, K., and M. W. Nelson. 1996. Auditors’ incentives and their application of financial accounting standards. The Accounting Review 71 (1): 43-59.
71
Holthausen, R. W., and R. L. Watts. 2001. The relevance of the value-relevance literature for financial accounting standard setting. Journal of Accounting and Economics 31: 3-75.
Horngren, C. T. 1981. Uses and limitations of a conceptual framework. Journal of Accountancy 151 (4): 86-95.
Johnstone, K. M., J. C. Bedard, and S. F. Biggs. 2002. Aggressive client reporting: Factors affecting auditors’ generation of financial reporting alternatives. Auditing: A Journal of Practice & Theory 21 (1): 48-65.
Kachelmeier, S. J. 1996. Discussion of “Tax advice and reporting under uncertainty: Theory and experimental evidence.” Contemporary Accounting Research 13 (1): 81-89.
Kieso, D. E., J. J. Weygandt, and T. D. Warfield. 2001. Intermediate accounting volume 1. New York: John Wiley & Sons, Inc.
Kirk, D. J. 1981. Concepts, consensus, compromise and consequences: their roles in standard setting. Journal of Accountancy 151 (4): 83-86.
Lara, J. M. G., and A. Mora. 2004. Balance sheet versus earnings conservatism in Europe. European Accounting Review 13 (2): 261-292.
Magee, R. P., and M Tseng. 1990. Audit pricing and independence. The Accounting Review 65 (2): 315-336.
Mayhew, B. W., J. W. Schatzberg, and G. R. Sevcik. 2001. The effect of accounting uncertainty and auditor reputation on auditor objectivity. Auditing: A Journal of Practice & Theory 20 (2): 49-70.
Nelson, M. W. 2003. Commentary on Behavioral evidence on the effects of principles- and rules-based standards. Accounting Horizons 17 (1): 91-104.
Nelson, M. W., J. A. Elliott, and R. L. Tarpley. 2002. Evidence from auditors about managers’ and auditors’ earnings management decisions. The Accounting Review 77 (Supplement): 175-202.
Pae, J., D. B. Thornton, and M. Welker. 2004. The link between earnings conservatism and balance sheet conservatism. Working Paper, Queen’s University.
Penman, S. H., and X. Zhang. 2002. Accounting conservatism, the quality of earnings, and stock returns. The Accounting Review 77 (2): 237-264.
Piecara, S. 2002. Accounting: the state of the profession. Presentation at CFC Independent Borrowers Conference November 15, 2002.
72
Pope, P. F., and M. Walker. 1999. International differences in the timeliness, conservatism, and classification of earnings. Journal of Accounting Research 37 (Supplement): 53-87.
Pownall, G., and K. Schipper. 1999. Implications of accounting research for the SEC’s consideration of international accounting standards for U.S. securities offerings. Accounting Horizons 13 (3): 259-280.
Ramsay, R. J. 1994. Senior/Manager differences in audit workpaper review performance. Journal of Accounting Research 32 (Spring): 127-135.
Report of the Accounting Objectives Study Group. 1973. Journal of Accountancy 136 (15): 43-44.
Salterio, S, and L. Koonce. 1997. The persuasiveness of audit evidence: The case of accounting policy decisions. Accounting, Organizations and Society 22 (6): 573-587.
Sanders, T. H., H. R. Hatfield, and U. Moore. 1938. A statement of accounting principles. New York: American Institute of Accountants.
Schipper, K. 2003. Principles-based accounting standards. Accounting Horizons 17 (1): 61-72.
Securities and Exchange Commission. Office of the Chief Accountant. 1999. Staff Accounting Bulletin: No. 101—Revenue Recognition in Financial Statements. Washington, D.C.: SEC.
Sterling, R. R. 1973. Accounting Power. Journal of Accountacy 135 (1): 61-67.
Tan, H., and K. Jamal. 2001. Do auditors objectively evaluate their subordinates’ work? The Accounting Review 76 (January): 99-110.
Trueblood, R. M. 1970. Rising expectations. Journal of Accountancy 130 (6): 35-38.
Vincent, L., L. A. Maines, E. Bartov, P. Fairfield, D. E. Hirst, T. E. Iannaconni, R. Mallett, C. M. Schrand, and D. J. Skinner. 2003. Commentary on Evaluating concepts-based vs. rules-based approaches to standard setting. Accounting Horizons 17 (1): 73-89.
Wallace, W. A. 1988. The irony of responding to regulators’ pressures: The case of management letter precautionary representations. Accounting Horizons 2 (March): 88-93.
Watts, R. L. 2003a. Conservatism in accounting part I: Explanations and implications. Accounting Horizons 17 (3): 207-221.
73
_____. 2003b. Conservatism in accounting part II: Evidence and research opportunities. Accounting Horizons 17 (4): 287-301.
Wilks, T. J. 2002. Predecisional distortion of evidence as a consequence of real-time audit review. The Accounting Review 77 (January): 51-71.
Wishon, K. 1986. Plugging the gaps in GAAP: the FASB’s Emerging Issues Task Force. Journal of Accountacy 161 (6): 96-105.
Zeff, S. A. 2003a. How the U.S. accounting profession got where it is today: Part I. Accounting Horizons 17 (3): 189-205.
_____. 2003b. How the U.S. accounting profession got where it is today: Part II. Accounting Horizons 17 (4): 267-286.
Zhang, X. 2000. Conservative accounting and equity valuation. Journal of Accounting and Economics 29: 125-149.

74
BIOGRAPHICAL SKETCH
I was born and raised in Adana, Turkey. I graduated from Bogazici University in
Istanbul, Turkey, with a Bachelor of Arts in business administration in June 1993. I
received a Master of Education in educational psychology from the University of Florida
in 2000. Currently, I am working towards a Master of Arts degree in economics.