Conservation Stewardship Program, FY2010 Overview and Enrollment Statistics€¦ · Conservation...
186
CStP FY2010_Appendix_Modified_Final_2-14-2012.docx 18 Conservation Stewardship Program, FY2010 Overview and Enrollment Statistics Appendix Table A 1. Conservation Stewardship Program Acre Allocations by State, FY 2010..................................................................... 19 Table A 2. Conservation Stewardship Program Contracts, Acres, and Obligations by Ranking Period and State, FY 2010 ......................... 20 Table A 3. Conservation Stewardship Program: Contracts, Acres, and Obligations by State and County, FY 2010 .................................. 21 Table A 4. CSP Contracts, Acres, and Obligations by State and Pool Category, FY 2010 ................................................................ 63 Table A 5. Conservation Stewardship Program: Contracts Enrolled by State and Land Use, FY 2010 ................................................. 69 Table A 6. Conservation Stewardship Program: Acres Enrolled by State and Land Use, FY 2010 ..................................................... 70 Table A 7. Conservation Stewardship Program: Financial Obligations by State and Land Use, FY 2010 ............................................. 71 Table A 8. Conservation Stewardship Program: Contracts, Acres, and Obligations by Ranking Period, State, and Land Use, FY 2010 ........... 72 Table A 9. Conservation Stewardship Program: Acre Statistics for Ranking Period 1 by State, and Land Use, FY 2010 ............................ 79 Table A 10. Conservation Stewardship Program: Acre Statistics for Ranking Period 2 by State and Land Use, FY 2010 ........................... 85 Table A 11. Conservation Stewardship Program: Acre Statistics for Two Ranking Periods by State and Land Use, FY 2010 ....................... 91 Table A 12. CSP Obligation Statistics for Ranking Period 1 by State and Land Use, FY 2010 ........................................................... 97 Table A 13. Conservation Stewardship Program: Obligation Statistics for Ranking Period 2 by State and Land Use, FY 2010 ................... 103 Table A 14. Conservation Stewardship Program: Obligation Statistics for Ranking Periods 1 and 2 by State and Land Use, FY 2010 .......... 109 Table A 15. CSP Acres, and Obligations a by State and Land Use, FY 2010 .............................................................................. 115 Table A 16. CSP Contracts, Acres, and Obligations by State and Type of Conservation Activity, FY 2010 .......................................... 116 Table A 17. CSP Contracts, Acres, and Obligations by Obligation Category and by State, FY 2010 .................................................. 117 Table A 18. CSP Total Enhancements and Practices by Ranking Period and by State, FY 2010 ....................................................... 121 Table A 19. CSP Individual Enhancements and Practices by Ranking Period and by State, FY 2010 ................................................. 122 Table A 20. CSP Enhancements and Practices , FY 2010 .................................................................................................. 194 Table A 21. CSP Enhancements and Practices by Land Use and Ranking Period, FY 2010 ............................................................. 198
Transcript of Conservation Stewardship Program, FY2010 Overview and Enrollment Statistics€¦ · Conservation...

CStP FY2010_Appendix_Modified_Final_2-14-2012.docx
18
Conservation Stewardship Program, FY2010 Overview and Enrollment Statistics
Appendix
Table A 1. Conservation Stewardship Program Acre Allocations by State, FY 2010..................................................................... 19
Table A 2. Conservation Stewardship Program Contracts, Acres, and Obligations by Ranking Period and State, FY 2010 ......................... 20
Table A 3. Conservation Stewardship Program: Contracts, Acres, and Obligations by State and County, FY 2010 .................................. 21
Table A 4. CSP Contracts, Acres, and Obligations by State and Pool Category, FY 2010 ................................................................ 63
Table A 5. Conservation Stewardship Program: Contracts Enrolled by State and Land Use, FY 2010 ................................................. 69
Table A 6. Conservation Stewardship Program: Acres Enrolled by State and Land Use, FY 2010 ..................................................... 70
Table A 7. Conservation Stewardship Program: Financial Obligations by State and Land Use, FY 2010 ............................................. 71
Table A 8. Conservation Stewardship Program: Contracts, Acres, and Obligations by Ranking Period, State, and Land Use, FY 2010 ........... 72
Table A 9. Conservation Stewardship Program: Acre Statistics for Ranking Period 1 by State, and Land Use, FY 2010 ............................ 79
Table A 10. Conservation Stewardship Program: Acre Statistics for Ranking Period 2 by State and Land Use, FY 2010 ........................... 85
Table A 11. Conservation Stewardship Program: Acre Statistics for Two Ranking Periods by State and Land Use, FY 2010 ....................... 91
Table A 12. CSP Obligation Statistics for Ranking Period 1 by State and Land Use, FY 2010 ........................................................... 97
Table A 13. Conservation Stewardship Program: Obligation Statistics for Ranking Period 2 by State and Land Use, FY 2010 ................... 103
Table A 14. Conservation Stewardship Program: Obligation Statistics for Ranking Periods 1 and 2 by State and Land Use, FY 2010 .......... 109
Table A 15. CSP Acres, and Obligationsa by State and Land Use, FY 2010 .............................................................................. 115
Table A 16. CSP Contracts, Acres, and Obligations by State and Type of Conservation Activity, FY 2010 .......................................... 116
Table A 17. CSP Contracts, Acres, and Obligations by Obligation Category and by State, FY 2010 .................................................. 117
Table A 18. CSP Total Enhancements and Practices by Ranking Period and by State, FY 2010 ....................................................... 121
Table A 19. CSP Individual Enhancements and Practices by Ranking Period and by State, FY 2010 ................................................. 122
Table A 20. CSP Enhancements and Practices , FY 2010 .................................................................................................. 194
Table A 21. CSP Enhancements and Practices by Land Use and Ranking Period, FY 2010 ............................................................. 198

CStP FY2010_Appendix_Modified_Final_2-14-2012.docx
19
Table A 1. Conservation Stewardship Program Acre Allocations by State, FY 2010
State Agricultural Land Non-Industrial Private Forestland
Alabama 49,751 135,366
Alaska 3,246 154,185
Arizona 502,280 39,843
Arkansas 193,905 25,285
California 389,849 54,526
Colorado 515,412 1,898
Connecticut 691 1,489
Delaware 7,253 513
Florida 42,787 4,351
Georgia 61,137 62,199
Guam 0 0
Hawaii 6,790 75
Idaho 106,158 7,703
Illinois 202,242 4,430
Indiana 114,140 3,160
Iowa 412,100 3,839
Kansas 568,407 232
Kentucky 40,239 17,309
Louisiana 120,288 28,364
Maine 7,879 50,591
Maryland 12,367 1,587
Massachusetts 413 1,498
Michigan 86,221 32,156
Minnesota 372,744 34,909
Mississippi 78,710 34,422
Missouri 368,951 66,040
Montana 827,591 29,311
Nebraska 671,505 5,434
Nevada 17,610 0
New Hampshire 1,701 2,104
New Jersey 0 0
New Mexico 630,086 34,175
New York 77,502 16,532
North Carolina 22,539 12,899
North Dakota 547,951 80
Ohio 84,801 8,992
Oklahoma 476,433 15,390
Oregon 224,063 37,624
Pennsylvania 61,756 19,549
Puerto Rico 1,375 47
Rhode Island 302 891
South Carolina 52,255 52,426
South Dakota 620,877 126
Tennessee 48,832 30,605
Texas 1,712,471 70,153
Utah 116,483 0
Vermont 450 85
Virginia 33,695 32,770
Washington 202,824 3,495
West Virginia 10,099 10,795
Wisconsin 162,303 23,452
Wyoming 464,644 2,562
Total 11,334,108 1,175,467

CStP FY2010_Appendix_Modified_Final_2-14-2012.docx
20
Table A 2. Conservation Stewardship Program Contracts, Acres, and Obligations by Ranking Period and State, FY 2010
State
CSP-2010-1 CSP-2010-2 FY 2010 Totals
Contracts Acres Obligations Contracts Acres Obligations Contracts Acres Obligations
ALABAMA 308 215,713 $1,980,304 123 133,193 $2,107,012 431 348,905 $4,087,316
ALASKA 11 174,416 $1,200,113 3 8,150 $129,452 14 182,565 $1,329,565
ARIZONA 39 459,967 $2,085,150 17 361,676 $1,918,187 56 821,643 $4,003,337
ARKANSAS 289 256,173 $4,454,954 331 313,346 $6,733,003 620 569,519 $11,187,957a
CALIFORNIA 198 338,031 $3,248,251 139 383,098 $2,726,952 337 721,128 $5,975,203
COLORADO 248 658,257 $5,621,967 221 606,119 $6,124,161 469 1,264,376 $11,746,128
CONNECTICUT 8 1,953 $26,954 5 6,514 $25,953 13 8,467 $52,907
DELAWARE 15 7,971 $231,980 10 6,478 $117,924 25 14,448 $349,904
FLORIDA 46 23,726 $393,098 49 41,552 $823,028 95 65,279 $1,216,126
GEORGIA 166 90,850 $2,019,639 418 264,056 $8,225,960 584 354,906 $10,245,599
HAWAII 5 5,503 $66,783 11 1,594 $39,090 16 7,098 $105,873
IDAHO 92 97,751 $1,655,466 110 253,335 $2,487,573 202 351,087 $4,143,039
ILLINOIS 265 175,941 $4,018,047 277 226,756 $4,678,677 542 402,697 $8,696,724 b
INDIANA 148 103,901 $2,654,331 160 107,664 $2,558,464 308 211,565 $5,212,795
IOWA 729 369,263 $9,338,245 751 428,342 $10,917,329 1,480 797,605 $20,255,574 c
KANSAS 454 492,690 $7,453,148 418 723,725 $10,547,462 872 1,216,415 $18,000,610
KENTUCKY 83 29,899 $386,791 99 32,212 $541,734 182 62,111 $928,525
LOUISIANA 196 143,933 $2,338,512 125 121,007 $3,216,217 321 264,940 $5,554,729 d
MAINE 59 56,949 $340,711 43 13,432 $187,683 102 70,381 $528,394
MARYLAND 37 11,426 $286,493 28 12,823 $455,421 65 24,249 $741,914
MASSACHUSETTS 4 1,826 $18,112 7 5,498 $40,023 11 7,324 $58,135
MICHIGAN 271 104,847 $2,206,112 273 125,117 $2,472,219 544 229,963 $4,678,331
MINNESOTA 906 467,660 $9,931,338 669 448,101 $11,445,982 1,575 915,761 $21,377,320
MISSISSIPPI 125 92,961 $1,325,765 194 259,304 $7,654,309 319 352,265 $8,980,074
MISSOURI 1,006 502,674 $8,233,641 933 473,327 $8,323,828 1,939 976,001 $16,557,469 e
MONTANA 222 926,476 $6,743,828 264 883,579 $8,322,708 486 1,810,055 $15,066,536
NEBRASKA 571 783,914 $8,900,070 535 1,053,015 $11,252,464 1,106 1,836,928 $20,152,534
NEVADA 4 12,918 $145,109 13 10,911 $155,015 17 23,829 $300,124
NEW HAMPSHIRE 12 2,304 $35,780 5 1,126 $10,870 17 3,430 $46,650
NEW JERSEY 0 0 0 9 2,468 $71,225 9 2,468 $71,225
NEW MEXICO 111 936,871 $3,160,535 61 541,869 $2,252,217 172 1,478,740 $5,412,752
NEW YORK 154 77,201 $1,642,775 167 82,401 $1,644,857 321 159,602 $3,287,632
NORTH CAROLINA 64 27,406 $440,251 103 40,008 $613,839 167 67,414 $1,054,090
NORTH DAKOTA 301 616,913 $9,134,784 326 663,817 $10,351,937 627 1,280,729 $19,486,721
OHIO 234 83,881 $1,968,151 90 43,951 $1,045,532 324 127,833 $3,013,683
OKLAHOMA 462 546,971 $7,531,213 456 590,901 $8,644,686 918 1,137,871 $16,175,899
OREGON 201 350,626 $2,941,938 171 490,752 $4,609,739 372 841,378 $7,551,677
PENNSYLVANIA 265 69,237 $1,662,495 300 96,864 $2,311,722 565 166,101 $3,974,217
PUERTO RICO 11 700 $19,066 0 0 0 11 700 $19,066
RHODE ISLAND 3 1,139 $11,282 18 2,586 $35,029 21 3,725 $46,311
SOUTH CAROLINA 267 170,085 $1,953,328 176 95,621 $1,469,813 443 265,706 $3,423,141
SOUTH DAKOTA 261 688,366 $7,138,773 244 606,024 $7,734,929 505 1,294,391 $14,873,702
TENNESSEE 175 48,545 $658,676 241 90,623 $1,469,131 416 139,168 $2,127,807
TEXAS 694 1,338,176 $9,754,896 295 699,688 $5,430,875 989 2,037,864 $15,185,771
UTAH 17 87,510 $450,912 61 213,677 $1,287,670 78 301,187 $1,738,582
VERMONT 2 280 $6,745 5 2,282 $28,726 7 2,562 $35,471
VIRGINIA 118 53,770 $1,075,368 152 93,074 $2,237,673 270 146,844 $3,313,041
WASHINGTON 88 186,405 $2,229,319 118 261,922 $3,779,022 206 448,327 $6,008,341
WEST VIRGINIA 76 18,517 $243,310 177 54,928 $537,102 253 73,445 $780,412
WISCONSIN 516 171,981 $3,355,623 452 188,009 $3,294,572 968 359,990 $6,650,195
WYOMING 75 522,209 $2,062,062 102 391,134 $2,528,700 177 913,343 $4,590,762
Grand Total 10,612 12,606,679 $144,782,194 9,955 12,557,648 $175,617,696 20,567 25,164,327 $320,399,890 aArkansas has 6 CCPI/MRBI contracts. Acres equal 10,492. Obligations equal $175,312.
bIllinois has 6 CCPI/MRBI contracts. Acres equal 7,461, and obligations equal $120,504.
cIowa has 23 CCPI/MRBI contracts. Acres equal 18,048, and obligations equal$482,722.
dLouisiana has 5 CCPI and CCPI/MRBI contracts. Acres equal 5,204, and obligations equal $120,807.
eMissouri has 9 CCPI/MRBI contracts. Acres equal 5,735, and obligations equal $88,159.

CStP FY2010_Appendix_Modified_Final_2-14-2012.docx
21
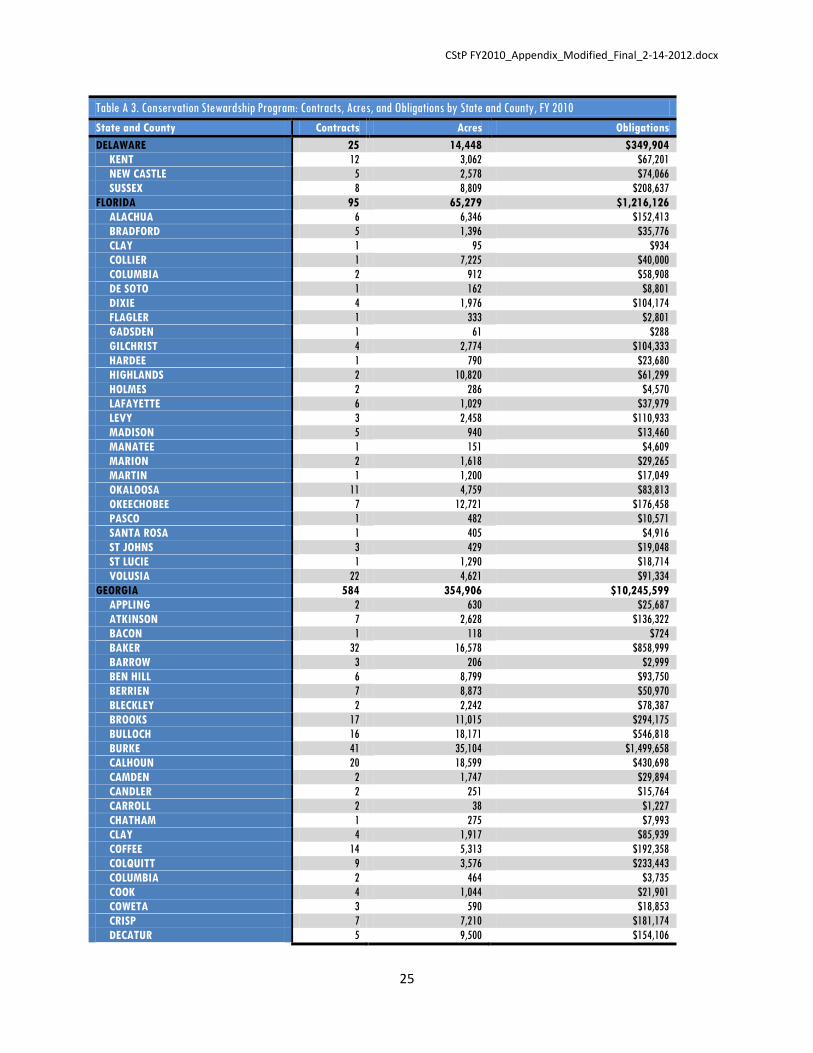
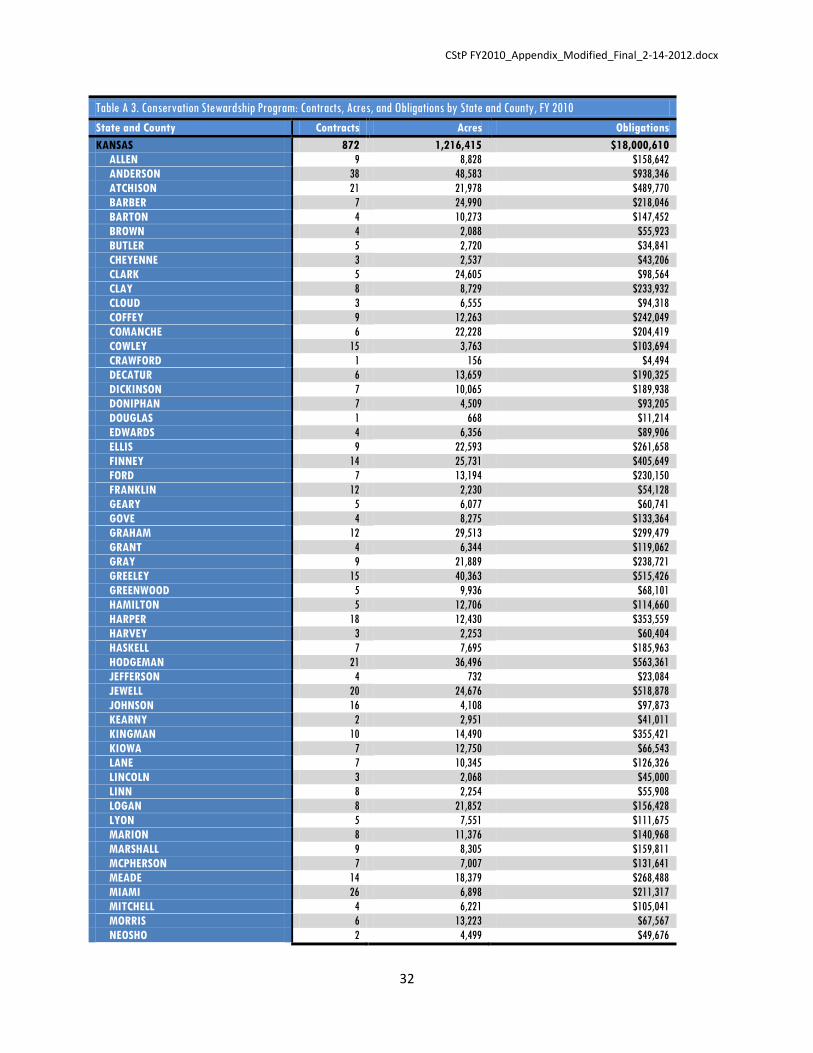
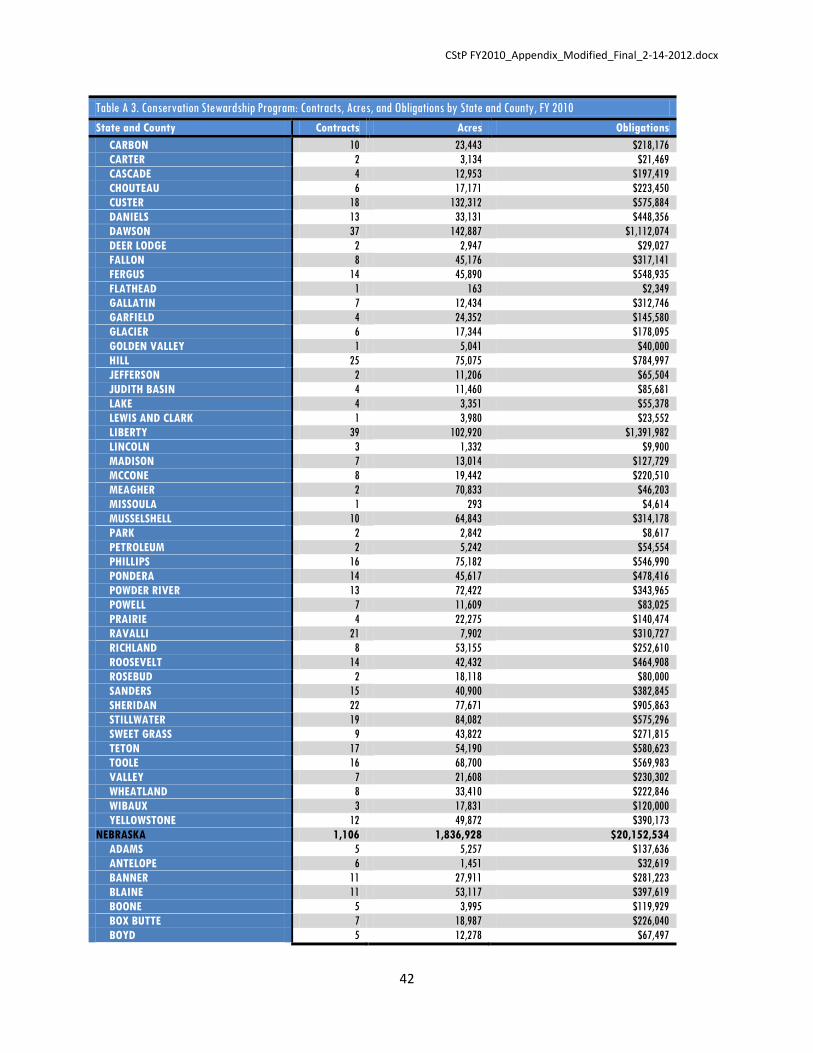
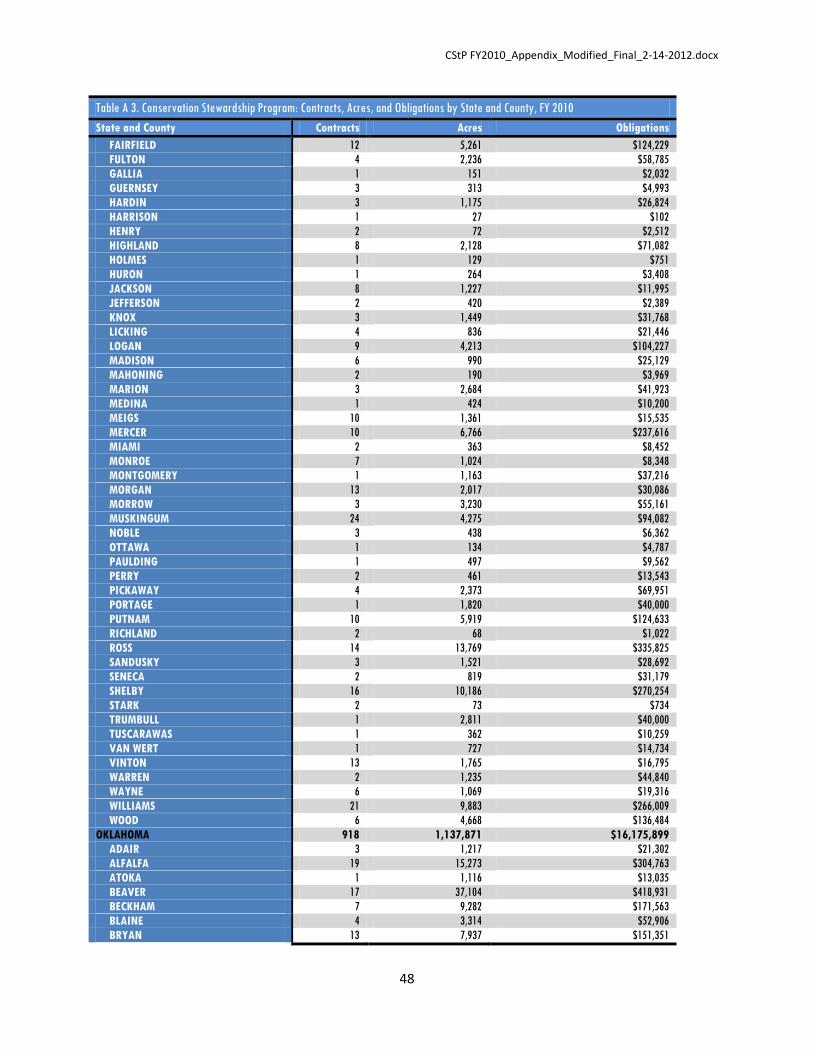
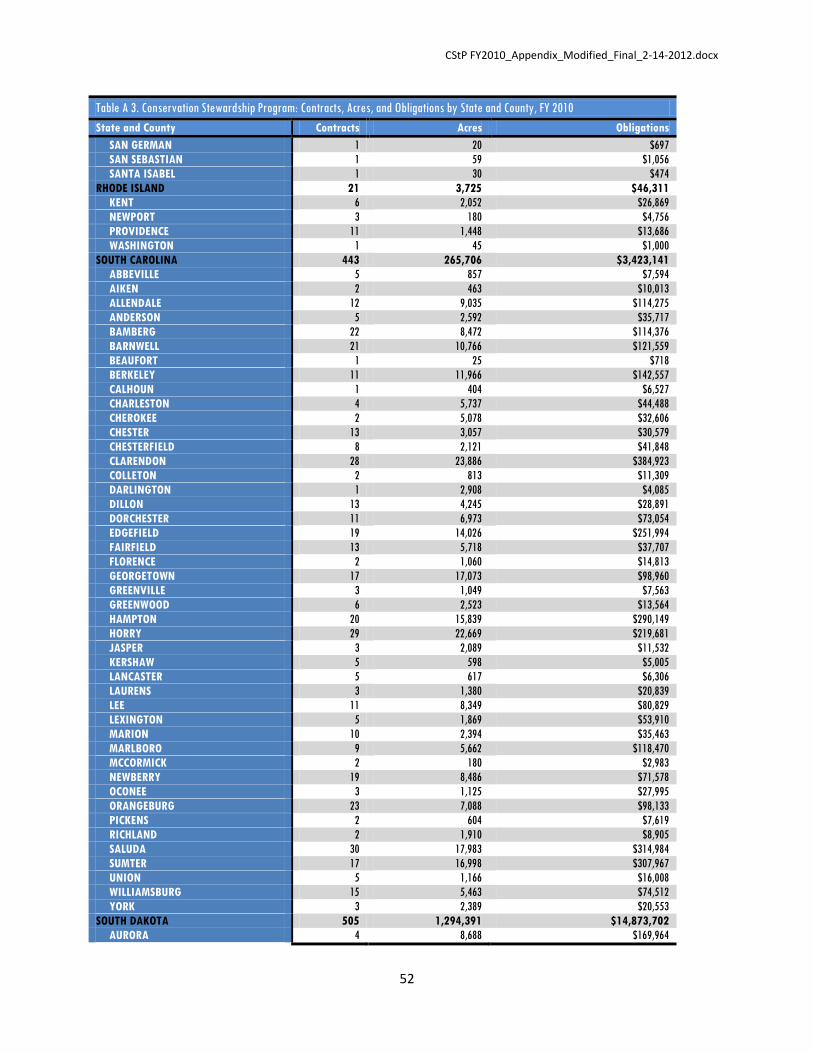
Table A 3. Conservation Stewardship Program: Contracts, Acres, and Obligations by State and County, FY 2010
State and County Contracts Acres Obligations
ALABAMA 431 348,905 $4,087,316
AUTAUGA 4 295 $4,946
BALDWIN 4 1,857 $63,225
BARBOUR 13 12,440 $130,583
BIBB 11 1,962 $18,081
BLOUNT 1 53 $705
BULLOCK 4 700 $3,902
BUTLER 1 2,341 $14,800
CALHOUN 2 182 $1,020
CHAMBERS 2 471 $3,917
CHEROKEE 9 4,344 $53,384
CHOCTAW 13 20,119 $134,811
CLARKE 3 2,051 $15,838
CLAY 8 4,018 $64,560
COFFEE 5 2,407 $36,500
COLBERT 7 5,270 $84,302
CONECUH 5 2,594 $21,373
COOSA 4 2,379 $17,714
COVINGTON 13 3,997 $66,322
CRENSHAW 2 1,709 $28,192
CULLMAN 1 2,020 $31,396
DALLAS 20 26,327 $372,885
DE KALB 4 790 $6,737
ELMORE 27 18,092 $134,293
ESCAMBIA 4 7,783 $78,403
FAYETTE 5 1,618 $17,250
FRANKLIN 5 2,117 $42,277
GENEVA 3 310 $3,207
GREENE 7 12,527 $138,832
HALE 6 4,892 $32,734
HENRY 9 8,905 $54,650
HOUSTON 13 7,432 $100,821
JACKSON 2 1,705 $54,986
LAMAR 5 6,123 $46,743
LAUDERDALE 18 6,101 $193,334
LAWRENCE 3 1,353 $27,517
LEE 1 353 $3,311
LOWNDES 1 550 $1,968
MACON 5 1,063 $18,883
MADISON 9 18,063 $434,772
MARENGO 12 9,980 $85,052
MARION 39 15,549 $189,035
MARSHALL 1 2,138 $13,995
MOBILE 1 1,620 $12,905
MONROE 4 8,993 $121,059
MONTGOMERY 25 17,276 $290,620
PERRY 11 4,485 $30,538
PICKENS 29 55,413 $476,325
PIKE 7 2,505 $25,395
RANDOLPH 6 3,953 $61,148
RUSSELL 4 4,235 $38,373
SHELBY 1 1,517 $10,649
SUMTER 7 10,126 $71,210
TALLADEGA 1 80 $1,159
TALLAPOOSA 1 56 $444
TUSCALOOSA 2 864 $15,817

CStP FY2010_Appendix_Modified_Final_2-14-2012.docx
22
Table A 3. Conservation Stewardship Program: Contracts, Acres, and Obligations by State and County, FY 2010
State and County Contracts Acres Obligations
WALKER 4 1,052 $11,461
WASHINGTON 1 2,700 $21,694
WILCOX 2 2,903 $19,586
WINSTON 14 6,150 $31,677
ALASKA 14 182,565 $1,329,565
KENAI PENINSULA 2 65,673 $428,203
KODIAK ISLAND 2 104,966 $685,328
MATANUSKA-SUSITNA 1 423 $7,569
SOUTHEAST FAIRBANKS 7 5,174 $108,272
VALDEZ-CORDOVA 1 115 $1,000
YUKON-KOYUKUK 1 6,215 $99,193
ARIZONA 56 821,643 $4,003,337
APACHE 3 6,644 $38,308
COCHISE 21 94,759 $654,561
COCONINO 2 59,419 $742,585
GRAHAM 5 22,148 $184,998
GREENLEE 2 996 $6,122
MARICOPA 3 510 $30,472
MOHAVE 12 578,848 $2,156,067
PIMA 3 17,019 $82,209
PINAL 1 1,431 $14,441
SANTA CRUZ 4 39,869 $93,574
ARKANSAS 620 569,519 $11,187,957
ARKANSAS 48 45,159 $1,298,188
BAXTER 8 1,741 $24,447
BENTON 4 3,751 $76,955
BOONE 7 3,740 $49,107
BRADLEY 1 1,036 $9,171
CALHOUN 2 729 $2,403
CARROLL 4 1,592 $24,100
CHICOT 1 740 $17,414
CLARK 1 91 $1,818
CLAY 39 54,015 $1,271,506
CLEBURNE 8 6,351 $32,799
COLUMBIA 3 700 $2,604
CONWAY 4 3,421 $54,644
CRAIGHEAD 46 52,987 $1,182,108
CRITTENDEN 14 17,351 $384,105
CROSS 11 18,507 $254,017
DREW 2 309 $3,895
FAULKNER 5 2,615 $70,451
FULTON 14 5,599 $79,761
GARLAND 1 254 $3,374
GREENE 34 37,255 $782,454
HEMPSTEAD 3 394 $1,835
INDEPENDENCE 4 1,436 $23,762
IZARD 6 2,290 $18,024
JACKSON 7 8,122 $158,057
JEFFERSON 16 16,368 $465,533
JOHNSON 3 312 $5,320
LAWRENCE 42 22,371 $466,054
LEE 12 32,086 $397,988
LOGAN 2 881 $10,156
LONOKE 23 37,445 $693,298
MARION 23 9,050 $131,890
MILLER 2 393 $1,838

CStP FY2010_Appendix_Modified_Final_2-14-2012.docx
23
Table A 3. Conservation Stewardship Program: Contracts, Acres, and Obligations by State and County, FY 2010
State and County Contracts Acres Obligations
MISSISSIPPI 49 55,224 $1,106,633
MONROE 3 3,180 $47,639
NEVADA 2 1,300 $2,587
PERRY 1 1,569 $62,461
PHILLIPS 12 23,170 $343,806
PIKE 4 4,063 $24,780
POINSETT 10 14,327 $260,723
POLK 5 1,801 $19,763
POPE 3 635 $2,638
PRAIRIE 34 29,795 $656,791
RANDOLPH 18 9,905 $172,856
SEARCY 13 4,214 $66,884
SHARP 25 9,612 $112,730
STONE 19 10,949 $117,218
VAN BUREN 5 2,162 $19,965
WASHINGTON 5 2,045 $32,066
WHITE 4 1,497 $29,062
WOODRUFF 4 2,645 $85,264
YELL 4 2,334 $25,015
CALIFORNIA 337 721,128 $5,975,203
ALAMEDA 5 9,938 $66,822
ALPINE 1 11,598 $40,000
AMADOR 9 8,297 $50,091
BUTTE 30 12,960 $160,110
CALAVERAS 6 29,585 $114,070
COLUSA 19 24,683 $302,263
CONTRA COSTA 1 422 $6,647
DEL NORTE 3 2,472 $50,324
FRESNO 2 1,058 $28,607
GLENN 16 31,536 $201,601
HUMBOLDT 9 32,388 $282,060
IMPERIAL 2 1,858 $80,000
INYO 1 9,114 $60,736
KERN 14 118,968 $436,005
LAKE 2 594 $15,360
LASSEN 20 32,978 $418,923
MADERA 7 21,508 $165,681
MARIN 3 1,811 $23,379
MARIPOSA 5 5,449 $51,033
MENDOCINO 7 61,012 $188,111
MERCED 4 13,059 $61,035
MODOC 14 44,973 $324,237
MONO 3 1,149 $32,711
MONTEREY 3 27,275 $93,119
NAPA 6 5,369 $68,431
PLACER 2 447 $32,954
PLUMAS 15 21,552 $235,721
RIVERSIDE 28 40,576 $798,891
SACRAMENTO 1 1,980 $24,858
SAN BENITO 2 15,646 $55,612
SAN JOAQUIN 2 1,886 $69,405
SAN LUIS OBISPO 11 10,040 $199,114
SANTA BARBARA 5 9,107 $76,303
SANTA CLARA 3 6,343 $45,920
SHASTA 6 6,087 $66,473
SIERRA 5 6,486 $61,087

CStP FY2010_Appendix_Modified_Final_2-14-2012.docx
24
Table A 3. Conservation Stewardship Program: Contracts, Acres, and Obligations by State and County, FY 2010
State and County Contracts Acres Obligations
SISKIYOU 11 22,877 $244,351
SONOMA 5 3,935 $86,849
STANISLAUS 3 1,206 $36,256
SUTTER 12 3,892 $102,107
TEHAMA 16 13,554 $201,164
TULARE 1 4,368 $58,131
TUOLUMNE 4 1,926 $14,338
VENTURA 9 24,372 $156,727
YOLO 2 14,430 $80,000
YUBA 2 364 $7,586
COLORADO 469 1,264,376 $11,746,128
ADAMS 8 18,464 $252,462
ALAMOSA 7 4,881 $108,849
ARAPAHOE 7 11,076 $196,258
BACA 65 203,443 $1,929,020
BENT 2 4,998 $53,920
BOULDER 13 3,505 $90,825
CHEYENNE 19 62,524 $571,535
CONEJOS 8 16,968 $214,372
COSTILLA 5 2,347 $47,800
CROWLEY 2 7,941 $54,012
DELTA 2 4,169 $31,333
DOUGLAS 1 66 $3,920
EL PASO 8 7,644 $95,643
ELBERT 13 21,730 $209,733
FREMONT 1 2,760 $14,726
GUNNISON 2 3,000 $42,481
HUERFANO 5 31,246 $128,110
KIOWA 1 824 $15,081
KIT CARSON 14 36,216 $437,259
LARIMER 4 2,103 $34,486
LAS ANIMAS 8 121,342 $320,000
LINCOLN 14 54,799 $251,173
LOGAN 69 194,280 $1,710,703
MESA 3 4,114 $35,564
MOFFAT 9 64,640 $273,688
MORGAN 30 39,625 $481,666
OTERO 3 10,204 $80,284
OURAY 1 3,435 $23,994
PARK 1 2,734 $40,000
PHILLIPS 30 60,768 $1,010,407
PROWERS 9 30,298 $242,992
PUEBLO 4 9,607 $73,740
RIO BLANCO 5 30,352 $119,670
RIO GRANDE 1 848 $13,277
ROUTT 2 2,616 $21,479
SEDGWICK 22 33,789 $557,510
WASHINGTON 36 84,466 $1,053,602
WELD 13 26,134 $336,023
YUMA 22 44,424 $568,531
CONNECTICUT 13 8,467 $52,907
HARTFORD 1 220 $4,710
LITCHFIELD 6 7,826 $41,810
NEW HAVEN 1 13 $241
TOLLAND 2 192 $2,138
WINDHAM 3 216 $4,008
CStP FY2010_Appendix_Modified_Final_2-14-2012.docx
25
Table A 3. Conservation Stewardship Program: Contracts, Acres, and Obligations by State and County, FY 2010
State and County Contracts Acres Obligations
DELAWARE 25 14,448 $349,904
KENT 12 3,062 $67,201
NEW CASTLE 5 2,578 $74,066
SUSSEX 8 8,809 $208,637
FLORIDA 95 65,279 $1,216,126
ALACHUA 6 6,346 $152,413
BRADFORD 5 1,396 $35,776
CLAY 1 95 $934
COLLIER 1 7,225 $40,000
COLUMBIA 2 912 $58,908
DE SOTO 1 162 $8,801
DIXIE 4 1,976 $104,174
FLAGLER 1 333 $2,801
GADSDEN 1 61 $288
GILCHRIST 4 2,774 $104,333
HARDEE 1 790 $23,680
HIGHLANDS 2 10,820 $61,299
HOLMES 2 286 $4,570
LAFAYETTE 6 1,029 $37,979
LEVY 3 2,458 $110,933
MADISON 5 940 $13,460
MANATEE 1 151 $4,609
MARION 2 1,618 $29,265
MARTIN 1 1,200 $17,049
OKALOOSA 11 4,759 $83,813
OKEECHOBEE 7 12,721 $176,458
PASCO 1 482 $10,571
SANTA ROSA 1 405 $4,916
ST JOHNS 3 429 $19,048
ST LUCIE 1 1,290 $18,714
VOLUSIA 22 4,621 $91,334
GEORGIA 584 354,906 $10,245,599
APPLING 2 630 $25,687
ATKINSON 7 2,628 $136,322
BACON 1 118 $724
BAKER 32 16,578 $858,999
BARROW 3 206 $2,999
BEN HILL 6 8,799 $93,750
BERRIEN 7 8,873 $50,970
BLECKLEY 2 2,242 $78,387
BROOKS 17 11,015 $294,175
BULLOCH 16 18,171 $546,818
BURKE 41 35,104 $1,499,658
CALHOUN 20 18,599 $430,698
CAMDEN 2 1,747 $29,894
CANDLER 2 251 $15,764
CARROLL 2 38 $1,227
CHATHAM 1 275 $7,993
CLAY 4 1,917 $85,939
COFFEE 14 5,313 $192,358
COLQUITT 9 3,576 $233,443
COLUMBIA 2 464 $3,735
COOK 4 1,044 $21,901
COWETA 3 590 $18,853
CRISP 7 7,210 $181,174
DECATUR 5 9,500 $154,106

CStP FY2010_Appendix_Modified_Final_2-14-2012.docx
26
Table A 3. Conservation Stewardship Program: Contracts, Acres, and Obligations by State and County, FY 2010
State and County Contracts Acres Obligations
DODGE 6 2,812 $63,832
DOOLY 32 26,822 $987,858
DOUGHERTY 10 8,610 $236,604
EARLY 14 6,547 $117,203
ELBERT 4 983 $13,702
EMANUEL 19 7,185 $176,798
FLOYD 8 3,299 $97,141
GILMER 1 252 $5,868
GLASCOCK 2 1,756 $40,480
GRADY 3 1,033 $22,834
GREENE 2 458 $7,874
HANCOCK 3 759 $16,045
HARRIS 1 718 $40,000
HART 1 92 $1,073
HOUSTON 1 1,000 $22,068
IRWIN 2 797 $44,767
JACKSON 2 678 $29,709
JASPER 1 53 $3,070
JEFF DAVIS 1 87 $2,714
JEFFERSON 6 3,241 $81,865
JENKINS 8 5,848 $143,823
JONES 1 200 $1,690
LAMAR 7 1,284 $44,741
LANIER 2 3,442 $19,136
LEE 1 431 $11,180
LIBERTY 1 73 $2,023
LONG 1 106 $2,104
LUMPKIN 1 49 $2,111
MACON 1 2,900 $40,000
MADISON 1 763 $9,752
MERIWETHER 5 2,384 $49,537
MILLER 1 1,369 $32,620
MITCHELL 47 22,906 $829,955
MONROE 5 5,721 $69,421
MORGAN 6 1,653 $38,684
MURRAY 1 298 $9,944
OCONEE 2 235 $2,820
OGLETHORPE 8 4,322 $71,934
PIKE 2 1,623 $35,160
PULASKI 13 8,985 $379,485
QUITMAN 1 1,023 $40,000
RANDOLPH 14 8,622 $171,503
RICHMOND 1 52 $502
SEMINOLE 1 329 $3,761
STEPHENS 5 907 $7,574
STEWART 1 1,595 $17,486
SUMTER 1 2,835 $26,159
TATTNALL 2 348 $21,128
TELFAIR 1 59 $767
TERRELL 12 7,308 $214,741
THOMAS 6 4,030 $123,329
TIFT 23 9,756 $169,726
TOOMBS 8 3,222 $82,579
TURNER 10 5,183 $186,795
UPSON 4 796 $9,232
WALTON 5 345 $7,464
CStP FY2010_Appendix_Modified_Final_2-14-2012.docx
27
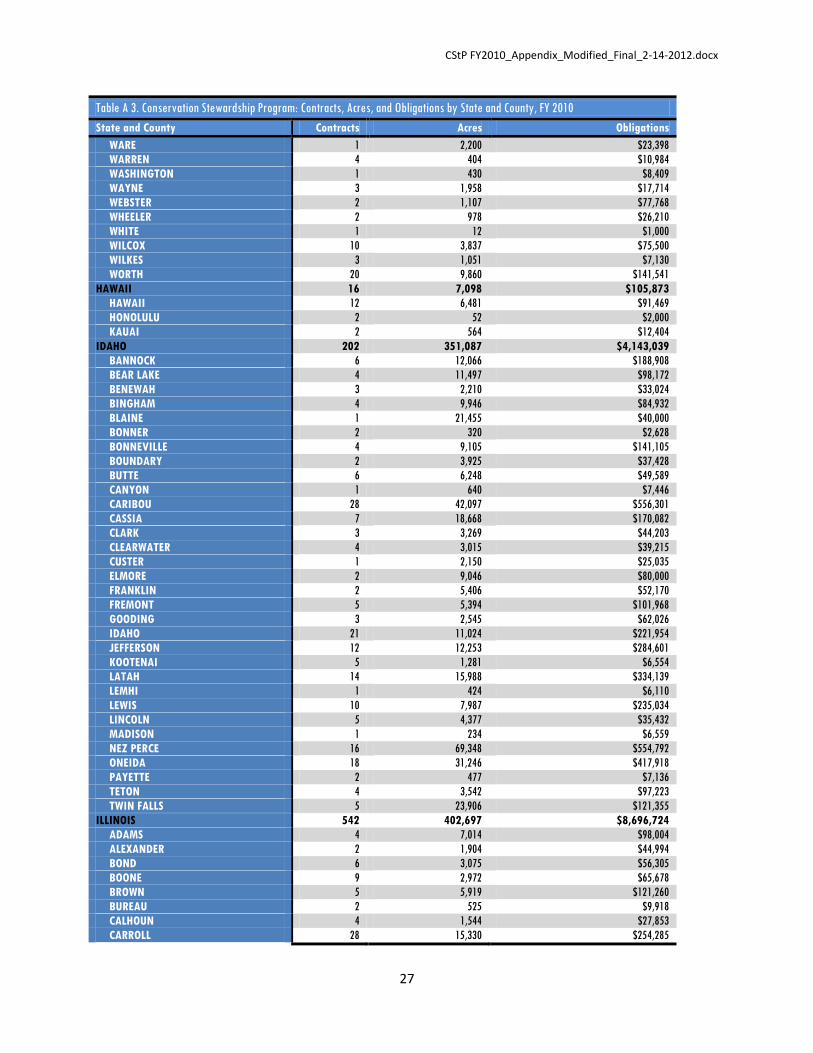
Table A 3. Conservation Stewardship Program: Contracts, Acres, and Obligations by State and County, FY 2010
State and County Contracts Acres Obligations
WARE 1 2,200 $23,398
WARREN 4 404 $10,984
WASHINGTON 1 430 $8,409
WAYNE 3 1,958 $17,714
WEBSTER 2 1,107 $77,768
WHEELER 2 978 $26,210
WHITE 1 12 $1,000
WILCOX 10 3,837 $75,500
WILKES 3 1,051 $7,130
WORTH 20 9,860 $141,541
HAWAII 16 7,098 $105,873
HAWAII 12 6,481 $91,469
HONOLULU 2 52 $2,000
KAUAI 2 564 $12,404
IDAHO 202 351,087 $4,143,039
BANNOCK 6 12,066 $188,908
BEAR LAKE 4 11,497 $98,172
BENEWAH 3 2,210 $33,024
BINGHAM 4 9,946 $84,932
BLAINE 1 21,455 $40,000
BONNER 2 320 $2,628
BONNEVILLE 4 9,105 $141,105
BOUNDARY 2 3,925 $37,428
BUTTE 6 6,248 $49,589
CANYON 1 640 $7,446
CARIBOU 28 42,097 $556,301
CASSIA 7 18,668 $170,082
CLARK 3 3,269 $44,203
CLEARWATER 4 3,015 $39,215
CUSTER 1 2,150 $25,035
ELMORE 2 9,046 $80,000
FRANKLIN 2 5,406 $52,170
FREMONT 5 5,394 $101,968
GOODING 3 2,545 $62,026
IDAHO 21 11,024 $221,954
JEFFERSON 12 12,253 $284,601
KOOTENAI 5 1,281 $6,554
LATAH 14 15,988 $334,139
LEMHI 1 424 $6,110
LEWIS 10 7,987 $235,034
LINCOLN 5 4,377 $35,432
MADISON 1 234 $6,559
NEZ PERCE 16 69,348 $554,792
ONEIDA 18 31,246 $417,918
PAYETTE 2 477 $7,136
TETON 4 3,542 $97,223
TWIN FALLS 5 23,906 $121,355
ILLINOIS 542 402,697 $8,696,724
ADAMS 4 7,014 $98,004
ALEXANDER 2 1,904 $44,994
BOND 6 3,075 $56,305
BOONE 9 2,972 $65,678
BROWN 5 5,919 $121,260
BUREAU 2 525 $9,918
CALHOUN 4 1,544 $27,853
CARROLL 28 15,330 $254,285

CStP FY2010_Appendix_Modified_Final_2-14-2012.docx
28
Table A 3. Conservation Stewardship Program: Contracts, Acres, and Obligations by State and County, FY 2010
State and County Contracts Acres Obligations
CASS 1 45 $348
CHAMPAIGN 5 5,475 $147,018
CHRISTIAN 5 2,883 $66,031
CLARK 1 209 $1,511
CLAY 3 1,038 $41,049
CLINTON 6 4,008 $157,555
COLES 8 5,919 $150,020
CRAWFORD 2 2,394 $61,361
CUMBERLAND 2 1,882 $40,140
DE KALB 19 11,342 $222,846
DE WITT 1 860 $23,249
DOUGLAS 4 2,922 $95,551
EDGAR 14 5,976 $105,366
EFFINGHAM 2 433 $21,096
FAYETTE 4 5,529 $123,717
FORD 14 9,499 $193,560
FULTON 4 3,701 $82,585
GREENE 3 2,694 $52,859
GRUNDY 5 6,594 $174,296
HANCOCK 2 1,573 $27,494
HENDERSON 2 903 $20,147
HENRY 2 1,837 $35,025
IROQUOIS 30 30,858 $686,935
JACKSON 5 552 $2,943
JASPER 3 1,147 $20,214
JERSEY 3 1,458 $28,699
JO DAVIESS 1 14 $137
JOHNSON 7 1,928 $44,738
KANKAKEE 3 2,484 $59,314
KENDALL 8 4,643 $97,810
KNOX 2 1,983 $40,876
LA SALLE 5 2,660 $70,561
LEE 8 9,601 $121,101
LIVINGSTON 30 30,866 $561,906
LOGAN 12 14,039 $297,929
MACOUPIN 2 1,215 $37,282
MADISON 2 846 $40,232
MARION 4 1,470 $31,121
MARSHALL 9 9,522 $223,571
MASON 2 1,491 $31,219
MASSAC 2 2,799 $80,000
MCDONOUGH 10 10,451 $285,346
MCHENRY 6 3,677 $73,313
MCLEAN 49 55,000 $1,055,880
MENARD 2 1,628 $26,540
MERCER 3 1,525 $33,208
MONTGOMERY 5 199 $2,589
MORGAN 4 3,521 $60,986
MOULTRIE 10 7,097 $167,045
OGLE 38 18,469 $385,087
PEORIA 3 1,046 $27,383
PIATT 3 2,601 $76,080
POPE 2 85 $2,138
PUTNAM 2 1,797 $45,313
RANDOLPH 1 96 $1,575
ROCK ISLAND 7 3,317 $84,408

CStP FY2010_Appendix_Modified_Final_2-14-2012.docx
29
Table A 3. Conservation Stewardship Program: Contracts, Acres, and Obligations by State and County, FY 2010
State and County Contracts Acres Obligations
SANGAMON 4 1,931 $47,492
SCHUYLER 8 5,403 $178,827
SCOTT 5 2,484 $50,295
SHELBY 9 6,790 $190,845
ST CLAIR 15 6,081 $124,095
STARK 2 817 $10,433
STEPHENSON 4 1,907 $29,696
TAZEWELL 5 5,422 $142,365
VERMILION 7 7,120 $113,197
WARREN 3 1,214 $22,849
WASHINGTON 3 2,034 $55,320
WHITESIDE 1 197 $3,281
WILL 4 1,644 $41,590
WINNEBAGO 8 4,259 $128,196
WOODFORD 12 9,313 $233,643
INDIANA 308 211,565 $5,212,795
ADAMS 1 218 $5,276
ALLEN 22 11,389 $296,832
BARTHOLOMEW 2 102 $2,218
BENTON 13 10,456 $343,750
CARROLL 15 11,042 $139,948
CASS 4 4,350 $76,953
CLAY 4 4,358 $117,706
CLINTON 8 7,190 $173,000
DAVIESS 5 4,253 $168,388
DE KALB 16 5,343 $86,350
DEARBORN 1 36 $344
DECATUR 1 400 $14,131
DUBOIS 3 594 $11,290
ELKHART 1 345 $15,433
FAYETTE 1 105 $1,000
FOUNTAIN 7 9,614 $221,959
FULTON 6 3,743 $67,083
GREENE 1 23 $1,000
HARRISON 1 90 $2,013
HENDRICKS 5 3,241 $100,427
HOWARD 13 11,484 $259,362
JACKSON 1 280 $2,213
JASPER 2 291 $7,486
JOHNSON 2 1,329 $80,000
KOSCIUSKO 4 1,565 $66,639
LA PORTE 3 775 $37,555
LAGRANGE 10 3,972 $119,469
LAKE 10 7,542 $290,094
MARION 1 309 $5,588
MARSHALL 1 193 $9,861
MARTIN 2 330 $5,514
MIAMI 1 610 $17,002
MONTGOMERY 10 8,378 $241,005
NOBLE 29 12,860 $317,413
ORANGE 4 1,213 $27,704
OWEN 1 579 $23,609
PARKE 2 1,519 $35,267
PERRY 2 287 $3,379
PIKE 4 3,705 $80,835
PORTER 1 1,509 $40,000
CStP FY2010_Appendix_Modified_Final_2-14-2012.docx
30
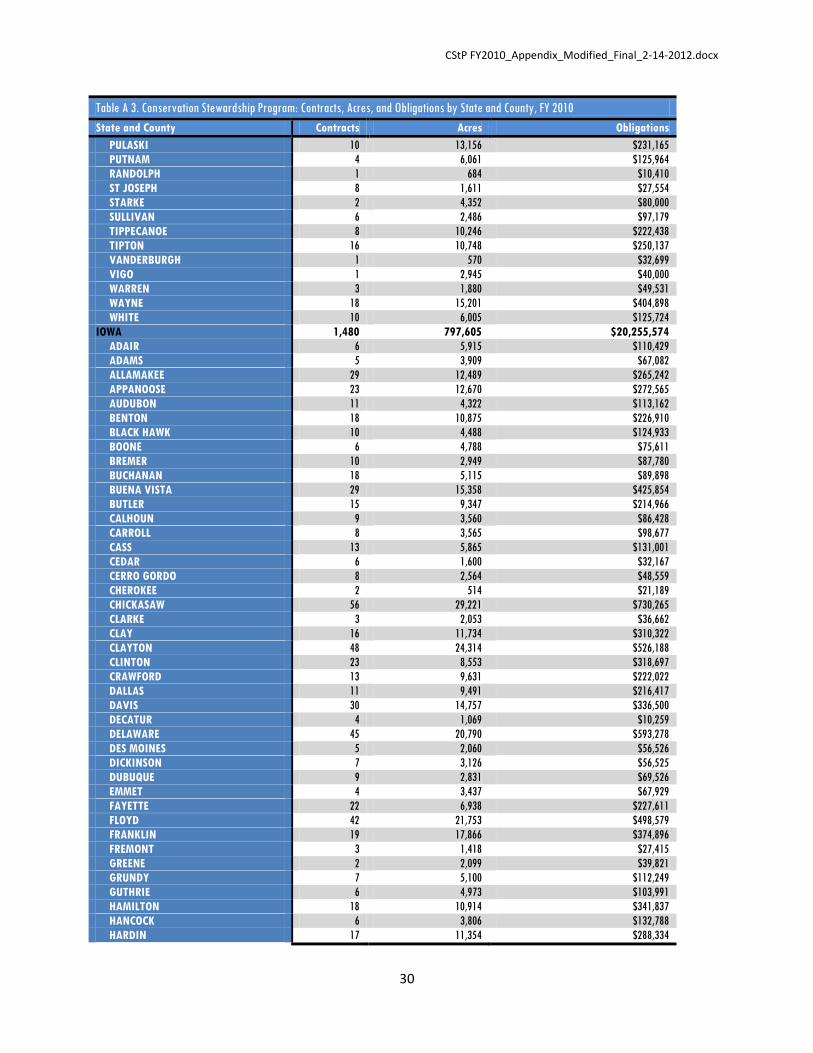
Table A 3. Conservation Stewardship Program: Contracts, Acres, and Obligations by State and County, FY 2010
State and County Contracts Acres Obligations
PULASKI 10 13,156 $231,165
PUTNAM 4 6,061 $125,964
RANDOLPH 1 684 $10,410
ST JOSEPH 8 1,611 $27,554
STARKE 2 4,352 $80,000
SULLIVAN 6 2,486 $97,179
TIPPECANOE 8 10,246 $222,438
TIPTON 16 10,748 $250,137
VANDERBURGH 1 570 $32,699
VIGO 1 2,945 $40,000
WARREN 3 1,880 $49,531
WAYNE 18 15,201 $404,898
WHITE 10 6,005 $125,724
IOWA 1,480 797,605 $20,255,574
ADAIR 6 5,915 $110,429
ADAMS 5 3,909 $67,082
ALLAMAKEE 29 12,489 $265,242
APPANOOSE 23 12,670 $272,565
AUDUBON 11 4,322 $113,162
BENTON 18 10,875 $226,910
BLACK HAWK 10 4,488 $124,933
BOONE 6 4,788 $75,611
BREMER 10 2,949 $87,780
BUCHANAN 18 5,115 $89,898
BUENA VISTA 29 15,358 $425,854
BUTLER 15 9,347 $214,966
CALHOUN 9 3,560 $86,428
CARROLL 8 3,565 $98,677
CASS 13 5,865 $131,001
CEDAR 6 1,600 $32,167
CERRO GORDO 8 2,564 $48,559
CHEROKEE 2 514 $21,189
CHICKASAW 56 29,221 $730,265
CLARKE 3 2,053 $36,662
CLAY 16 11,734 $310,322
CLAYTON 48 24,314 $526,188
CLINTON 23 8,553 $318,697
CRAWFORD 13 9,631 $222,022
DALLAS 11 9,491 $216,417
DAVIS 30 14,757 $336,500
DECATUR 4 1,069 $10,259
DELAWARE 45 20,790 $593,278
DES MOINES 5 2,060 $56,526
DICKINSON 7 3,126 $56,525
DUBUQUE 9 2,831 $69,526
EMMET 4 3,437 $67,929
FAYETTE 22 6,938 $227,611
FLOYD 42 21,753 $498,579
FRANKLIN 19 17,866 $374,896
FREMONT 3 1,418 $27,415
GREENE 2 2,099 $39,821
GRUNDY 7 5,100 $112,249
GUTHRIE 6 4,973 $103,991
HAMILTON 18 10,914 $341,837
HANCOCK 6 3,806 $132,788
HARDIN 17 11,354 $288,334

CStP FY2010_Appendix_Modified_Final_2-14-2012.docx
31
Table A 3. Conservation Stewardship Program: Contracts, Acres, and Obligations by State and County, FY 2010
State and County Contracts Acres Obligations
HARRISON 4 3,402 $59,164
HENRY 17 7,990 $186,097
HOWARD 40 19,586 $378,358
HUMBOLDT 32 22,405 $528,890
IDA 5 3,425 $82,706
IOWA 6 3,245 $94,504
JACKSON 22 13,226 $284,407
JASPER 3 244 $5,637
JEFFERSON 5 1,962 $54,929
JOHNSON 12 3,730 $109,732
JONES 12 4,745 $140,118
KEOKUK 26 13,850 $371,756
KOSSUTH 15 13,370 $283,938
LEE 8 3,312 $69,125
LINN 15 5,851 $170,015
LOUISA 6 1,978 $44,007
LUCAS 7 3,886 $79,468
LYON 21 15,265 $442,164
MADISON 10 4,857 $85,619
MAHASKA 5 2,603 $78,121
MARION 7 5,222 $118,626
MARSHALL 12 5,718 $224,687
MILLS 5 2,482 $89,618
MITCHELL 18 7,294 $137,783
MONONA 1 640 $11,999
MONROE 13 2,774 $50,032
MONTGOMERY 4 697 $26,374
MUSCATINE 12 6,441 $183,456
O BRIEN 4 2,177 $59,209
OSCEOLA 7 6,507 $167,001
PAGE 5 2,239 $55,072
PALO ALTO 17 11,867 $285,292
PLYMOUTH 15 14,317 $392,613
POCAHONTAS 52 27,362 $739,853
POTTAWATTAMIE 7 4,658 $101,614
POWESHIEK 6 2,599 $62,578
RINGGOLD 9 5,824 $110,979
SAC 9 4,784 $122,526
SCOTT 19 9,328 $271,822
SHELBY 16 7,963 $170,059
SIOUX 12 6,169 $162,194
STORY 11 8,932 $296,235
TAMA 13 6,322 $135,587
TAYLOR 13 12,693 $244,027
UNION 10 4,772 $76,856
VAN BUREN 9 5,633 $101,955
WAPELLO 9 6,292 $218,675
WARREN 4 1,453 $56,548
WASHINGTON 33 17,394 $409,515
WAYNE 13 6,010 $92,175
WEBSTER 59 35,349 $1,106,431
WINNEBAGO 12 6,390 $179,857
WINNESHIEK 108 43,280 $1,537,021
WOODBURY 2 2,184 $44,809
WORTH 7 2,285 $62,401
WRIGHT 14 13,449 $410,250
CStP FY2010_Appendix_Modified_Final_2-14-2012.docx
32
Table A 3. Conservation Stewardship Program: Contracts, Acres, and Obligations by State and County, FY 2010
State and County Contracts Acres Obligations
KANSAS 872 1,216,415 $18,000,610
ALLEN 9 8,828 $158,642
ANDERSON 38 48,583 $938,346
ATCHISON 21 21,978 $489,770
BARBER 7 24,990 $218,046
BARTON 4 10,273 $147,452
BROWN 4 2,088 $55,923
BUTLER 5 2,720 $34,841
CHEYENNE 3 2,537 $43,206
CLARK 5 24,605 $98,564
CLAY 8 8,729 $233,932
CLOUD 3 6,555 $94,318
COFFEY 9 12,263 $242,049
COMANCHE 6 22,228 $204,419
COWLEY 15 3,763 $103,694
CRAWFORD 1 156 $4,494
DECATUR 6 13,659 $190,325
DICKINSON 7 10,065 $189,938
DONIPHAN 7 4,509 $93,205
DOUGLAS 1 668 $11,214
EDWARDS 4 6,356 $89,906
ELLIS 9 22,593 $261,658
FINNEY 14 25,731 $405,649
FORD 7 13,194 $230,150
FRANKLIN 12 2,230 $54,128
GEARY 5 6,077 $60,741
GOVE 4 8,275 $133,364
GRAHAM 12 29,513 $299,479
GRANT 4 6,344 $119,062
GRAY 9 21,889 $238,721
GREELEY 15 40,363 $515,426
GREENWOOD 5 9,936 $68,101
HAMILTON 5 12,706 $114,660
HARPER 18 12,430 $353,559
HARVEY 3 2,253 $60,404
HASKELL 7 7,695 $185,963
HODGEMAN 21 36,496 $563,361
JEFFERSON 4 732 $23,084
JEWELL 20 24,676 $518,878
JOHNSON 16 4,108 $97,873
KEARNY 2 2,951 $41,011
KINGMAN 10 14,490 $355,421
KIOWA 7 12,750 $66,543
LANE 7 10,345 $126,326
LINCOLN 3 2,068 $45,000
LINN 8 2,254 $55,908
LOGAN 8 21,852 $156,428
LYON 5 7,551 $111,675
MARION 8 11,376 $140,968
MARSHALL 9 8,305 $159,811
MCPHERSON 7 7,007 $131,641
MEADE 14 18,379 $268,488
MIAMI 26 6,898 $211,317
MITCHELL 4 6,221 $105,041
MORRIS 6 13,223 $67,567
NEOSHO 2 4,499 $49,676

CStP FY2010_Appendix_Modified_Final_2-14-2012.docx
33
Table A 3. Conservation Stewardship Program: Contracts, Acres, and Obligations by State and County, FY 2010
State and County Contracts Acres Obligations
NESS 7 12,994 $163,636
NORTON 8 21,285 $247,756
OSAGE 17 20,196 $286,592
OSBORNE 9 10,514 $163,682
PAWNEE 22 21,679 $368,005
PHILLIPS 15 13,749 $179,987
POTTAWATOMIE 2 2,379 $26,040
PRATT 27 41,795 $690,258
RAWLINS 6 13,070 $203,852
RENO 9 6,324 $168,260
REPUBLIC 16 14,948 $278,980
RICE 13 9,830 $196,286
RILEY 24 16,937 $257,072
RUSH 5 8,347 $132,594
RUSSELL 3 8,376 $52,911
SALINE 2 1,056 $41,426
SCOTT 43 85,520 $1,227,850
SEDGWICK 5 2,904 $67,165
SEWARD 1 4,406 $36,370
SHAWNEE 12 5,110 $78,356
SHERIDAN 1 389 $10,891
SHERMAN 3 3,694 $79,378
SMITH 10 21,719 $285,520
STAFFORD 3 7,010 $91,615
STANTON 1 279 $1,604
SUMNER 9 15,474 $223,763
THOMAS 28 55,259 $838,946
TREGO 12 21,302 $177,395
WABAUNSEE 11 7,199 $109,010
WALLACE 10 45,011 $391,813
WASHINGTON 33 19,181 $407,169
WICHITA 18 22,696 $401,779
WILSON 5 2,339 $66,621
WOODSON 3 485 $8,662
KENTUCKY 182 62,111 $928,525
BALLARD 1 99 $1,566
BELL 2 1,389 $12,172
BOURBON 1 365 $5,152
BOYLE 3 788 $10,851
BRACKEN 2 425 $7,678
BRECKINRIDGE 7 2,935 $33,928
CALLOWAY 1 53 $1,182
CAMPBELL 2 535 $5,422
CARTER 1 500 $6,526
CASEY 4 1,199 $23,203
CRITTENDEN 4 1,056 $4,979
EDMONSON 1 316 $1,773
ELLIOTT 17 2,925 $23,097
ESTILL 2 292 $2,016
FAYETTE 2 438 $12,317
FLEMING 13 4,225 $39,681
FLOYD 1 102 $727
FRANKLIN 2 178 $3,116
GRAYSON 3 1,052 $23,691
GREEN 1 983 $5,442
GREENUP 1 178 $2,517

CStP FY2010_Appendix_Modified_Final_2-14-2012.docx
34
Table A 3. Conservation Stewardship Program: Contracts, Acres, and Obligations by State and County, FY 2010
State and County Contracts Acres Obligations
HARRISON 4 980 $19,460
HART 1 1,461 $8,570
HENDERSON 1 677 $14,331
HENRY 4 362 $3,940
HOPKINS 1 500 $10,349
KENTON 1 88 $2,674
KNOX 4 737 $4,713
LARUE 2 290 $2,537
LAWRENCE 1 242 $1,196
LEE 1 60 $768
LEWIS 3 1,443 $6,917
LINCOLN 1 144 $2,257
LOGAN 5 3,528 $52,944
MADISON 1 318 $5,331
MARION 5 2,660 $21,461
MASON 1 397 $9,032
MEADE 5 2,958 $118,183
MENIFEE 1 456 $1,006
MERCER 6 3,901 $81,974
MORGAN 2 1,038 $9,239
OHIO 2 405 $9,975
OLDHAM 1 118 $2,872
POWELL 1 250 $1,810
PULASKI 1 282 $506
ROBERTSON 1 69 $1,374
SCOTT 4 755 $20,742
SHELBY 21 5,534 $123,782
SIMPSON 2 3,258 $48,166
SPENCER 10 1,536 $25,830
TAYLOR 2 2,216 $19,052
TRIGG 1 212 $1,738
TRIMBLE 2 557 $7,772
WARREN 5 1,960 $30,784
WASHINGTON 1 150 $2,356
WAYNE 1 1,250 $9,877
WOODFORD 6 1,292 $17,971
LOUISIANA 321 264,940 $5,554,729
ACADIA 3 1,313 $14,387
ALLEN 7 10,525 $237,899
ASSUMPTION 5 8,007 $130,615
AVOYELLES 8 7,026 $171,939
BEAUREGARD 8 9,471 $204,586
BIENVILLE 2 191 $1,578
BOSSIER 5 832 $8,223
CADDO 5 9,057 $162,947
CALCASIEU 5 7,842 $126,462
CALDWELL 2 250 $3,211
CATAHOULA 11 6,837 $151,818
CLAIBORNE 3 821 $4,917
CONCORDIA 7 4,087 $29,958
DE SOTO 4 1,829 $32,200
EAST BATON ROUGE 6 468 $9,427
EAST CARROLL 12 15,186 $465,764
EAST FELICIANA 3 495 $4,394
EVANGELINE 23 11,192 $310,901
FRANKLIN 7 4,401 $101,187

CStP FY2010_Appendix_Modified_Final_2-14-2012.docx
35
Table A 3. Conservation Stewardship Program: Contracts, Acres, and Obligations by State and County, FY 2010
State and County Contracts Acres Obligations
GRANT 7 2,075 $37,436
IBERIA 2 1,474 $19,439
IBERVILLE 7 3,871 $38,037
JEFFERSON DAVIS 16 22,076 $601,742
LAFAYETTE 1 50 $1,097
LAFOURCHE 2 4,700 $67,662
LINCOLN 2 244 $3,960
LIVINGSTON 9 3,034 $51,304
MOREHOUSE 21 31,139 $1,049,564
NATCHITOCHES 3 3,814 $64,139
OUACHITA 4 1,543 $29,093
RAPIDES 3 174 $3,616
RED RIVER 6 2,790 $81,347
RICHLAND 10 3,806 $55,498
SABINE 16 2,122 $41,137
ST HELENA 2 159 $879
ST LANDRY 4 286 $3,553
ST MARTIN 4 2,230 $69,502
ST MARY 5 7,524 $105,787
ST TAMMANY 1 114 $953
TANGIPAHOA 6 2,106 $14,605
TENSAS 31 53,219 $787,369
UNION 3 2,055 $15,374
VERMILION 9 8,097 $155,097
VERNON 3 1,101 $25,039
WASHINGTON 5 374 $6,956
WEBSTER 4 768 $7,412
WEST BATON ROUGE 2 2,041 $24,562
WEST CARROLL 3 1,161 $11,725
WEST FELICIANA 2 593 $3,662
WINN 2 373 $4,770
MAINE 102 70,381 $528,394
AROOSTOOK 18 7,806 $183,793
CUMBERLAND 4 135 $6,155
FRANKLIN 18 7,600 $64,419
KENNEBEC 15 2,039 $23,566
LINCOLN 1 8 $1,000
OXFORD 19 5,217 $34,411
PENOBSCOT 3 1,728 $34,894
PISCATAQUIS 5 2,853 $17,468
SOMERSET 10 6,394 $54,614
WALDO 3 63 $4,257
WASHINGTON 6 36,538 $103,817
MARYLAND 65 24,249 $741,914
ALLEGANY 4 359 $5,165
ANNE ARUNDEL 3 1,014 $35,032
BALTIMORE 1 52 $359
CAROLINE 1 130 $5,757
CARROLL 5 2,051 $67,172
CECIL 7 1,148 $25,537
FREDERICK 5 971 $22,538
GARRETT 2 594 $13,188
HARFORD 10 5,103 $203,719
KENT 3 1,631 $45,864
MONTGOMERY 2 205 $6,203
PRINCE GEORGES 5 261 $8,170

CStP FY2010_Appendix_Modified_Final_2-14-2012.docx
36
Table A 3. Conservation Stewardship Program: Contracts, Acres, and Obligations by State and County, FY 2010
State and County Contracts Acres Obligations
QUEEN ANNE'S 3 2,777 $77,100
TALBOT 3 997 $43,146
WASHINGTON 9 6,808 $180,227
WICOMICO 2 149 $2,737
MASSACHUSETTS 11 7,324 $58,135
BERKSHIRE 9 5,821 $30,510
ESSEX 1 208 $16,845
WORCESTER 1 1,295 $10,780
MICHIGAN 544 229,963 $4,678,331
ALCONA 1 151 $2,697
ALGER 9 1,485 $17,751
ALLEGAN 1 796 $25,272
ALPENA 12 6,449 $161,095
ANTRIM 3 622 $4,098
BARRY 3 1,416 $42,552
BAY 2 823 $17,611
BENZIE 4 500 $8,350
BERRIEN 3 1,156 $44,503
BRANCH 3 2,319 $60,002
CASS 1 96 $620
CHEBOYGAN 4 762 $14,066
CHIPPEWA 7 1,145 $13,562
CLARE 3 1,818 $40,058
CLINTON 17 13,413 $214,557
DELTA 105 19,620 $195,383
DICKINSON 5 1,182 $5,882
EATON 1 285 $4,769
EMMET 2 241 $1,323
GENESEE 21 8,133 $172,933
GLADWIN 1 525 $12,423
GOGEBIC 1 154 $1,569
GRAND TRAVERSE 3 850 $20,274
HILLSDALE 14 6,339 $149,629
HOUGHTON 2 513 $11,037
HURON 5 6,117 $136,854
IONIA 17 17,045 $310,513
IOSCO 2 1,183 $27,273
IRON 6 1,591 $11,797
ISABELLA 5 2,354 $116,227
JACKSON 1 153 $3,404
KALKASKA 2 936 $8,489
KENT 1 92 $2,754
LAKE 2 336 $1,896
LAPEER 4 3,101 $65,894
LEELANAU 9 587 $17,712
LENAWEE 26 14,414 $336,355
LUCE 1 117 $3,703
MACKINAC 5 1,186 $19,632
MANISTEE 6 1,712 $53,014
MARQUETTE 26 9,606 $86,883
MASON 2 308 $7,222
MECOSTA 4 682 $5,236
MENOMINEE 28 8,752 $106,216
MIDLAND 10 4,427 $139,833
MISSAUKEE 7 5,346 $111,565
MONROE 4 1,277 $47,958

CStP FY2010_Appendix_Modified_Final_2-14-2012.docx
37
Table A 3. Conservation Stewardship Program: Contracts, Acres, and Obligations by State and County, FY 2010
State and County Contracts Acres Obligations
MONTCALM 8 5,787 $135,591
MONTMORENCY 2 1,531 $40,750
NEWAYGO 2 762 $16,268
OCEANA 6 1,556 $29,387
OGEMAW 9 4,480 $99,129
ONTONAGON 1 173 $7,919
OSCEOLA 7 1,322 $25,387
OTSEGO 2 361 $14,532
PRESQUE ISLE 4 2,924 $87,301
ROSCOMMON 2 431 $5,993
SANILAC 7 5,786 $141,122
SCHOOLCRAFT 13 3,953 $55,431
SHIAWASSEE 49 27,883 $639,446
ST CLAIR 2 1,404 $23,263
ST JOSEPH 10 8,524 $197,450
TUSCOLA 13 9,817 $255,654
VAN BUREN 1 208 $18,404
WASHTENAW 3 670 $22,281
WEXFORD 2 280 $577
MINNESOTA 1,575 915,761 $21,377,320
AITKIN 12 7,761 $94,128
BECKER 26 10,585 $198,338
BELTRAMI 43 15,015 $181,503
BENTON 12 3,780 $92,975
BIG STONE 4 13,221 $103,959
BLUE EARTH 8 5,968 $150,782
BROWN 12 5,524 $156,841
CARLTON 13 18,971 $108,179
CARVER 6 2,798 $55,946
CASS 5 4,369 $68,113
CHIPPEWA 8 7,224 $218,538
CHISAGO 8 2,067 $42,818
CLAY 3 5,824 $153,600
CLEARWATER 7 4,720 $89,544
COTTONWOOD 15 13,024 $338,186
CROW WING 3 365 $7,522
DAKOTA 11 4,040 $137,565
DODGE 7 5,272 $122,802
DOUGLAS 5 1,065 $31,070
FARIBAULT 6 7,864 $157,687
FILLMORE 40 13,690 $331,155
GOODHUE 50 18,593 $489,633
GRANT 38 46,327 $1,041,750
HOUSTON 41 10,883 $213,388
HUBBARD 22 4,587 $68,386
ISANTI 10 7,250 $193,026
ITASCA 55 10,662 $111,046
JACKSON 4 2,402 $69,808
KANABEC 9 3,542 $113,097
KANDIYOHI 27 25,344 $564,639
KITTSON 4 2,818 $55,372
KOOCHICHING 22 15,215 $135,158
LAC QUI PARLE 10 4,567 $150,644
LAKE 2 295 $1,954
LAKE OF THE WOODS 32 19,247 $253,832
LE SUEUR 3 2,893 $46,020

CStP FY2010_Appendix_Modified_Final_2-14-2012.docx
38
Table A 3. Conservation Stewardship Program: Contracts, Acres, and Obligations by State and County, FY 2010
State and County Contracts Acres Obligations
LINCOLN 7 6,023 $180,393
LYON 21 16,025 $522,159
MAHNOMEN 8 4,219 $98,536
MARSHALL 14 8,078 $112,694
MARTIN 3 4,062 $81,150
MCLEOD 22 11,728 $366,898
MEEKER 13 6,681 $206,535
MILLE LACS 13 4,295 $126,147
MORRISON 99 51,015 $1,352,247
MOWER 7 3,156 $55,963
MURRAY 66 70,461 $1,733,458
NICOLLET 1 23 $405
NOBLES 26 17,921 $503,695
NORMAN 8 6,233 $164,234
OLMSTED 29 13,463 $357,393
OTTER TAIL 106 50,431 $1,341,140
PENNINGTON 57 23,334 $445,835
PINE 11 4,063 $70,162
PIPESTONE 9 5,029 $127,073
POLK 6 2,360 $72,651
POPE 10 9,120 $251,836
RED LAKE 28 19,264 $465,074
REDWOOD 12 9,104 $267,093
RENVILLE 6 5,750 $179,748
RICE 10 3,344 $97,521
ROCK 3 2,248 $59,661
ROSEAU 64 38,820 $784,937
SCOTT 7 4,614 $122,722
SHERBURNE 7 3,191 $45,099
SIBLEY 18 16,775 $499,607
ST LOUIS 14 1,706 $17,179
STEARNS 47 23,012 $657,060
STEELE 1 590 $18,960
STEVENS 5 3,116 $71,550
SWIFT 1 1,227 $40,000
TODD 26 13,819 $505,666
TRAVERSE 29 37,958 $770,432
WABASHA 18 6,065 $141,773
WADENA 34 3,355 $37,911
WASECA 49 26,012 $763,281
WASHINGTON 7 3,562 $77,384
WATONWAN 17 11,189 $329,435
WILKIN 1 1,892 $37,096
WINONA 22 5,873 $105,575
WRIGHT 4 2,557 $65,891
YELLOW MEDICINE 26 25,230 $697,057
MISSISSIPPI 319 352,265 $8,980,074
AMITE 2 325 $4,197
ATTALA 1 544 $2,752
BOLIVAR 8 14,314 $468,114
CARROLL 3 1,606 $7,119
CHICKASAW 6 601 $9,559
CLARKE 1 140 $780
CLAY 9 2,640 $21,777
COAHOMA 58 94,893 $2,970,663
FRANKLIN 1 157 $809

CStP FY2010_Appendix_Modified_Final_2-14-2012.docx
39
Table A 3. Conservation Stewardship Program: Contracts, Acres, and Obligations by State and County, FY 2010
State and County Contracts Acres Obligations
GRENADA 1 154 $3,304
HANCOCK 2 4,934 $34,001
HARRISON 2 274 $3,414
HINDS 1 818 $27,583
HOLMES 10 9,086 $178,997
ITAWAMBA 3 965 $6,486
JACKSON 2 2,805 $41,220
JASPER 6 2,147 $25,146
JEFFERSON 1 1,741 $7,942
JEFFERSON DAVIS 3 235 $957
LAFAYETTE 2 2,238 $40,614
LAUDERDALE 1 841 $6,090
LAWRENCE 2 485 $2,919
LEE 1 274 $1,944
LEFLORE 2 1,362 $6,939
LINCOLN 1 73 $705
LOWNDES 1 196 $4,233
MADISON 1 520 $15,177
MARION 4 1,697 $12,992
MARSHALL 1 195 $920
MONROE 3 573 $4,652
MONTGOMERY 5 3,036 $43,629
NESHOBA 2 184 $1,255
NEWTON 5 1,600 $29,573
NOXUBEE 5 860 $9,293
OKTIBBEHA 7 1,994 $19,222
PANOLA 7 5,363 $75,441
PEARL RIVER 2 740 $5,456
PIKE 1 54 $590
PONTOTOC 8 1,247 $15,891
PRENTISS 4 602 $5,080
QUITMAN 37 53,167 $1,775,795
RANKIN 1 319 $2,090
SMITH 4 1,036 $12,047
STONE 2 186 $1,771
SUNFLOWER 3 4,547 $124,682
TALLAHATCHIE 11 9,042 $307,869
TATE 7 8,006 $188,737
TIPPAH 1 132 $1,660
TISHOMINGO 1 100 $1,435
TUNICA 37 89,831 $1,988,500
UNION 2 418 $10,684
WALTHALL 13 3,221 $43,606
WARREN 1 1,156 $36,597
WASHINGTON 3 7,657 $218,099
WAYNE 1 82 $461
WEBSTER 2 677 $5,023
WILKINSON 1 590 $15,206
YALOBUSHA 5 1,118 $8,378
YAZOO 2 8,469 $119,999
MISSOURI 1,939 976,001 $16,557,469
ADAIR 19 14,704 $163,987
ANDREW 29 16,762 $305,873
ATCHISON 2 2,327 $52,127
AUDRAIN 17 11,158 $211,639
BARRY 13 1,262 $17,332

CStP FY2010_Appendix_Modified_Final_2-14-2012.docx
40
Table A 3. Conservation Stewardship Program: Contracts, Acres, and Obligations by State and County, FY 2010
State and County Contracts Acres Obligations
BARTON 30 24,661 $468,481
BATES 15 10,815 $232,967
BENTON 4 848 $10,820
BOLLINGER 16 4,140 $47,927
BOONE 10 1,746 $15,570
BUCHANAN 13 5,291 $93,417
BUTLER 56 44,514 $995,557
CALDWELL 9 3,497 $48,503
CALLAWAY 21 3,609 $37,489
CAMDEN 1 835 $11,795
CAPE GIRARDEAU 7 5,572 $86,542
CARROLL 23 14,087 $227,032
CARTER 10 8,457 $48,084
CASS 18 11,746 $168,236
CEDAR 18 4,020 $71,279
CHARITON 7 2,012 $35,787
CHRISTIAN 12 1,640 $25,031
CLARK 13 4,565 $68,749
CLAY 12 849 $8,526
CLINTON 12 13,230 $262,418
COLE 8 1,668 $28,409
COOPER 16 5,115 $99,701
CRAWFORD 16 4,754 $63,836
DADE 23 11,558 $222,333
DALLAS 21 6,904 $75,752
DAVIESS 17 2,822 $25,587
DE KALB 10 5,315 $51,061
DENT 25 11,357 $135,237
DOUGLAS 12 5,900 $60,331
DUNKLIN 32 24,952 $542,140
FRANKLIN 20 3,603 $31,945
GASCONADE 13 3,429 $37,333
GENTRY 4 2,004 $33,931
GREENE 15 2,733 $43,908
GRUNDY 17 7,924 $106,808
HARRISON 14 8,510 $124,821
HENRY 22 7,314 $108,599
HICKORY 17 2,867 $33,043
HOLT 9 12,087 $212,372
HOWARD 19 5,858 $112,038
HOWELL 25 12,444 $195,504
IRON 9 2,117 $15,175
JACKSON 11 2,883 $47,371
JASPER 24 7,059 $137,963
JEFFERSON 6 896 $4,409
JOHNSON 15 8,904 $182,308
KNOX 17 7,319 $110,639
LACLEDE 18 4,437 $50,586
LAFAYETTE 6 2,184 $28,798
LAWRENCE 11 3,444 $52,965
LEWIS 11 6,976 $109,536
LINCOLN 7 1,609 $19,983
LINN 7 3,114 $44,599
LIVINGSTON 15 7,018 $117,396
MACON 14 6,385 $83,921
MADISON 1 643 $3,984

CStP FY2010_Appendix_Modified_Final_2-14-2012.docx
41
Table A 3. Conservation Stewardship Program: Contracts, Acres, and Obligations by State and County, FY 2010
State and County Contracts Acres Obligations
MARIES 15 9,976 $192,323
MARION 2 159 $710
MCDONALD 6 665 $8,015
MERCER 13 7,932 $90,043
MILLER 15 3,972 $54,073
MISSISSIPPI 15 11,895 $200,555
MONITEAU 22 6,284 $110,984
MONROE 48 17,150 $406,917
MONTGOMERY 44 41,143 $1,014,365
MORGAN 9 3,502 $61,511
NEW MADRID 15 11,692 $222,390
NEWTON 13 3,003 $46,139
NODAWAY 3 378 $5,800
OREGON 57 39,404 $257,177
OSAGE 32 7,228 $165,079
OZARK 17 9,846 $167,872
PEMISCOT 71 54,000 $1,227,802
PERRY 15 3,349 $28,173
PETTIS 19 21,840 $318,422
PHELPS 23 6,923 $115,519
PIKE 13 13,425 $214,975
PLATTE 16 14,607 $257,411
POLK 21 5,227 $80,827
PULASKI 9 1,931 $17,776
PUTNAM 16 8,254 $116,142
RALLS 13 6,488 $80,468
RANDOLPH 8 1,755 $32,232
RAY 7 2,280 $24,117
REYNOLDS 4 5,005 $9,422
RIPLEY 24 10,903 $81,432
SALINE 6 2,630 $32,574
SCHUYLER 17 7,849 $118,689
SCOTLAND 14 5,982 $123,605
SCOTT 6 3,561 $95,236
SHANNON 4 1,297 $15,533
SHELBY 18 4,894 $85,422
ST CHARLES 6 1,195 $19,085
ST CLAIR 22 8,066 $99,273
ST FRANCOIS 11 1,641 $11,697
STE GENEVIEVE 24 6,746 $47,002
STODDARD 83 81,291 $1,879,472
STONE 13 4,357 $87,336
SULLIVAN 19 6,963 $113,033
TANEY 16 9,370 $112,700
TEXAS 61 23,967 $213,425
VERNON 14 2,770 $45,013
WARREN 36 17,110 $359,852
WASHINGTON 3 759 $6,304
WAYNE 8 3,794 $35,352
WEBSTER 25 6,444 $72,623
WORTH 5 4,124 $96,887
WRIGHT 29 14,531 $209,195
MONTANA 486 1,810,055 $15,066,536
BEAVERHEAD 2 5,251 $46,302
BIG HORN 7 40,984 $225,808
BLAINE 7 18,815 $279,465
CStP FY2010_Appendix_Modified_Final_2-14-2012.docx
42
Table A 3. Conservation Stewardship Program: Contracts, Acres, and Obligations by State and County, FY 2010
State and County Contracts Acres Obligations
CARBON 10 23,443 $218,176
CARTER 2 3,134 $21,469
CASCADE 4 12,953 $197,419
CHOUTEAU 6 17,171 $223,450
CUSTER 18 132,312 $575,884
DANIELS 13 33,131 $448,356
DAWSON 37 142,887 $1,112,074
DEER LODGE 2 2,947 $29,027
FALLON 8 45,176 $317,141
FERGUS 14 45,890 $548,935
FLATHEAD 1 163 $2,349
GALLATIN 7 12,434 $312,746
GARFIELD 4 24,352 $145,580
GLACIER 6 17,344 $178,095
GOLDEN VALLEY 1 5,041 $40,000
HILL 25 75,075 $784,997
JEFFERSON 2 11,206 $65,504
JUDITH BASIN 4 11,460 $85,681
LAKE 4 3,351 $55,378
LEWIS AND CLARK 1 3,980 $23,552
LIBERTY 39 102,920 $1,391,982
LINCOLN 3 1,332 $9,900
MADISON 7 13,014 $127,729
MCCONE 8 19,442 $220,510
MEAGHER 2 70,833 $46,203
MISSOULA 1 293 $4,614
MUSSELSHELL 10 64,843 $314,178
PARK 2 2,842 $8,617
PETROLEUM 2 5,242 $54,554
PHILLIPS 16 75,182 $546,990
PONDERA 14 45,617 $478,416
POWDER RIVER 13 72,422 $343,965
POWELL 7 11,609 $83,025
PRAIRIE 4 22,275 $140,474
RAVALLI 21 7,902 $310,727
RICHLAND 8 53,155 $252,610
ROOSEVELT 14 42,432 $464,908
ROSEBUD 2 18,118 $80,000
SANDERS 15 40,900 $382,845
SHERIDAN 22 77,671 $905,863
STILLWATER 19 84,082 $575,296
SWEET GRASS 9 43,822 $271,815
TETON 17 54,190 $580,623
TOOLE 16 68,700 $569,983
VALLEY 7 21,608 $230,302
WHEATLAND 8 33,410 $222,846
WIBAUX 3 17,831 $120,000
YELLOWSTONE 12 49,872 $390,173
NEBRASKA 1,106 1,836,928 $20,152,534
ADAMS 5 5,257 $137,636
ANTELOPE 6 1,451 $32,619
BANNER 11 27,911 $281,223
BLAINE 11 53,117 $397,619
BOONE 5 3,995 $119,929
BOX BUTTE 7 18,987 $226,040
BOYD 5 12,278 $67,497

CStP FY2010_Appendix_Modified_Final_2-14-2012.docx
43
Table A 3. Conservation Stewardship Program: Contracts, Acres, and Obligations by State and County, FY 2010
State and County Contracts Acres Obligations
BROWN 1 2,686 $31,382
BUFFALO 1 1,119 $5,419
BURT 6 5,341 $94,877
BUTLER 17 9,157 $170,915
CASS 19 6,960 $184,783
CEDAR 1 166 $4,177
CHASE 9 8,523 $80,995
CHERRY 34 217,412 $1,117,569
CHEYENNE 7 18,610 $157,339
CLAY 10 7,424 $154,162
COLFAX 8 5,419 $125,042
CUMING 12 14,469 $298,886
CUSTER 7 10,164 $129,961
DAKOTA 3 2,825 $48,067
DAWES 20 38,811 $352,790
DAWSON 11 13,561 $263,910
DIXON 4 1,386 $18,822
DODGE 7 9,406 $138,503
DOUGLAS 1 142 $5,153
DUNDY 8 18,564 $147,003
FILLMORE 5 3,588 $90,461
FRANKLIN 6 11,216 $145,540
FRONTIER 5 5,294 $56,933
FURNAS 16 23,508 $281,707
GAGE 64 28,032 $621,910
GARDEN 4 10,117 $116,805
GARFIELD 10 25,655 $198,078
GOSPER 48 75,599 $1,176,699
GRANT 1 7,256 $40,000
GREELEY 4 2,102 $33,906
HALL 1 501 $1,576
HAMILTON 6 5,427 $164,937
HARLAN 8 12,273 $177,783
HAYES 12 25,994 $283,430
HITCHCOCK 6 3,672 $88,543
HOLT 9 24,518 $160,311
HOOKER 16 111,897 $468,669
HOWARD 6 1,151 $16,190
JEFFERSON 22 16,103 $211,387
JOHNSON 8 3,719 $71,599
KEARNEY 19 25,358 $670,304
KEITH 5 16,295 $123,699
KEYA PAHA 1 4,035 $40,000
KIMBALL 9 17,792 $171,624
KNOX 10 5,540 $56,073
LANCASTER 45 42,771 $870,250
LINCOLN 9 55,737 $150,064
LOGAN 2 16,665 $57,861
LOUP 9 56,476 $233,636
MADISON 14 11,746 $276,347
MCPHERSON 10 55,311 $196,602
MERRICK 12 8,783 $275,331
MORRILL 18 72,118 $439,125
NANCE 6 3,907 $80,748
NEMAHA 50 43,321 $929,327
NUCKOLLS 32 27,374 $631,944

CStP FY2010_Appendix_Modified_Final_2-14-2012.docx
44
Table A 3. Conservation Stewardship Program: Contracts, Acres, and Obligations by State and County, FY 2010
State and County Contracts Acres Obligations
OTOE 30 18,307 $344,911
PAWNEE 15 6,424 $105,392
PERKINS 9 14,657 $121,356
PHELPS 43 52,130 $1,154,458
PIERCE 15 4,584 $105,898
PLATTE 15 8,149 $211,644
RED WILLOW 6 8,258 $104,279
RICHARDSON 28 16,082 $287,992
ROCK 3 19,629 $99,793
SALINE 44 18,056 $447,816
SARPY 4 1,052 $32,655
SAUNDERS 4 123 $2,350
SCOTTS BLUFF 8 9,108 $103,631
SEWARD 7 1,530 $28,982
SHERIDAN 16 69,179 $489,779
SHERMAN 1 2,521 $27,907
SIOUX 14 60,658 $359,489
STANTON 16 10,450 $208,911
THAYER 18 9,319 $223,780
THOMAS 19 85,079 $533,892
THURSTON 13 7,788 $235,496
VALLEY 2 5,092 $64,000
WAYNE 8 4,079 $80,150
WEBSTER 13 7,560 $142,265
WHEELER 6 18,228 $169,389
YORK 5 2,904 $64,602
NEVADA 17 23,829 $300,124
CHURCHILL 6 1,853 $22,555
DOUGLAS 1 1,038 $25,109
ELKO 1 1,079 $28,062
HUMBOLDT 8 19,188 $219,523
LANDER 1 671 $4,875
NEW HAMPSHIRE 17 3,430 $46,650
BELKNAP 2 108 $3,407
GRAFTON 3 401 $5,153
HILLSBOROUGH 2 1,016 $7,340
MERRIMACK 9 1,764 $29,904
SULLIVAN 1 141 $846
NEW JERSEY 9 2,468 $71,225
ATLANTIC 1 141 $6,090
BURLINGTON 1 466 $9,865
HUNTERDON 5 615 $23,126
WARREN 2 1,246 $32,144
NEW MEXICO 172 1,478,740 $5,412,752
CATRON 5 38,369 $143,211
CHAVES 17 177,160 $569,096
CIBOLA 11 69,549 $315,740
COLFAX 2 155 $1,670
CURRY 1 2,651 $20,279
DE BACA 3 77,701 $120,000
EDDY 4 22,562 $93,902
GRANT 6 139,872 $230,313
GUADALUPE 17 157,402 $484,511
HARDING 3 9,270 $72,403
HIDALGO 3 4,588 $64,561
LEA 13 119,296 $491,082

CStP FY2010_Appendix_Modified_Final_2-14-2012.docx
45
Table A 3. Conservation Stewardship Program: Contracts, Acres, and Obligations by State and County, FY 2010
State and County Contracts Acres Obligations
LINCOLN 8 95,748 $291,984
LUNA 2 10,245 $65,145
MCKINLEY 3 12,180 $83,025
MORA 5 45,177 $82,157
OTERO 3 59,156 $366,718
QUAY 2 5,267 $93,467
RIO ARRIBA 7 30,818 $172,225
ROOSEVELT 9 72,233 $268,016
SAN JUAN 3 598 $6,919
SAN MIGUEL 10 49,846 $245,165
SANDOVAL 3 19,683 $146,838
SANTA FE 2 27,726 $42,712
SIERRA 3 13,392 $98,654
SOCORRO 2 8,412 $80,000
TAOS 4 12,063 $73,080
TORRANCE 18 186,619 $628,969
UNION 3 11,004 $60,910
NEW YORK 321 159,602 $3,287,632
ALBANY 1 372 $1,940
ALLEGANY 2 1,156 $23,318
BROOME 3 106 $2,243
CATTARAUGUS 6 4,879 $143,491
CAYUGA 6 5,617 $123,707
CHAUTAUQUA 7 4,605 $115,542
CHEMUNG 3 473 $13,018
CHENANGO 4 458 $10,271
CLINTON 4 6,326 $46,005
CORTLAND 6 2,870 $50,126
DELAWARE 34 5,190 $101,642
DUTCHESS 1 53 $1,000
ERIE 2 1,139 $9,988
ESSEX 3 673 $4,149
FRANKLIN 2 365 $13,118
FULTON 1 371 $7,999
GENESEE 6 5,120 $157,155
HERKIMER 1 304 $7,094
JEFFERSON 1 36 $910
LIVINGSTON 33 23,708 $523,800
MADISON 6 1,135 $19,195
MONROE 2 885 $29,686
MONTGOMERY 9 4,466 $88,990
ONEIDA 10 6,166 $120,892
ONONDAGA 11 7,563 $140,044
ONTARIO 22 16,076 $328,204
ORANGE 3 882 $24,792
ORLEANS 2 2,133 $31,951
OTSEGO 2 788 $19,565
RENSSELAER 1 86 $257
SARATOGA 1 403 $11,476
SCHOHARIE 5 557 $9,679
SCHUYLER 1 87 $556
SENECA 9 617 $16,677
ST LAWRENCE 1 1,400 $17,553
STEUBEN 40 17,097 $298,891
SUFFOLK 2 35 $1,302
SULLIVAN 1 82 $1,793

CStP FY2010_Appendix_Modified_Final_2-14-2012.docx
46
Table A 3. Conservation Stewardship Program: Contracts, Acres, and Obligations by State and County, FY 2010
State and County Contracts Acres Obligations
TIOGA 4 671 $6,718
TOMPKINS 1 38 $692
ULSTER 5 1,013 $37,220
WASHINGTON 4 683 $10,944
WAYNE 32 14,912 $334,936
WYOMING 9 13,965 $297,040
YATES 12 4,042 $82,063
NORTH CAROLINA 167 67,414 $1,054,090
ALAMANCE 3 814 $17,752
ANSON 8 3,349 $17,925
BEAUFORT 3 3,306 $60,648
BERTIE 3 4,677 $12,352
BUNCOMBE 4 279 $3,121
CASWELL 5 1,504 $14,208
CHATHAM 4 975 $16,631
CHEROKEE 2 69 $2,000
CLAY 2 188 $1,497
COLUMBUS 1 399 $3,461
DUPLIN 1 38 $1,000
EDGECOMBE 2 2,760 $79,320
HARNETT 13 3,534 $58,526
HAYWOOD 3 193 $774
HOKE 1 25 $1,000
HYDE 1 1,785 $30,816
IREDELL 5 2,479 $56,935
LEE 3 759 $14,804
MADISON 3 571 $3,684
MCDOWELL 2 177 $1,881
MONTGOMERY 3 737 $7,203
MOORE 4 5,696 $81,335
ORANGE 8 2,207 $25,998
PERSON 1 301 $5,968
POLK 11 1,729 $18,697
RICHMOND 1 91 $261
ROBESON 1 233 $1,279
RUTHERFORD 41 7,979 $78,243
SAMPSON 2 1,286 $33,837
STANLY 10 4,282 $144,808
SURRY 2 1,177 $7,118
TYRRELL 3 5,188 $100,296
UNION 7 7,166 $130,249
WARREN 2 614 $4,706
WASHINGTON 1 712 $11,677
WAYNE 1 138 $4,080
NORTH DAKOTA 627 1,280,729 $19,486,721
ADAMS 2 3,623 $58,159
BARNES 3 3,964 $105,826
BENSON 8 17,203 $271,560
BILLINGS 1 5,545 $40,000
BOTTINEAU 10 15,043 $288,783
BOWMAN 25 69,110 $770,015
BURKE 27 40,908 $651,823
BURLEIGH 20 35,556 $487,493
CASS 5 8,444 $206,917
CAVALIER 44 79,254 $1,471,553
DICKEY 3 7,439 $99,025

CStP FY2010_Appendix_Modified_Final_2-14-2012.docx
47
Table A 3. Conservation Stewardship Program: Contracts, Acres, and Obligations by State and County, FY 2010
State and County Contracts Acres Obligations
DIVIDE 5 10,753 $169,201
DUNN 5 17,220 $160,109
EDDY 16 21,175 $414,226
EMMONS 18 19,504 $423,246
FOSTER 10 11,857 $265,059
GOLDEN VALLEY 25 123,062 $718,154
GRAND FORKS 1 4,794 $40,000
GRANT 15 56,130 $520,041
GRIGGS 55 103,712 $1,825,500
HETTINGER 2 3,398 $55,115
LA MOURE 7 15,135 $280,000
LOGAN 3 9,532 $90,810
MCHENRY 26 43,622 $731,663
MCINTOSH 9 20,306 $217,075
MCKENZIE 17 41,932 $559,942
MCLEAN 54 97,453 $1,760,010
MERCER 12 24,274 $395,723
MORTON 7 21,217 $245,723
MOUNTRAIL 16 28,105 $501,141
NELSON 18 22,488 $633,946
PEMBINA 5 2,143 $48,138
PIERCE 9 12,745 $279,466
RAMSEY 5 8,548 $180,000
RENVILLE 12 27,387 $434,063
RICHLAND 13 13,126 $391,726
ROLETTE 4 10,621 $144,951
SARGENT 18 23,904 $583,970
SHERIDAN 16 34,285 $438,043
SIOUX 6 30,160 $220,782
SLOPE 5 11,771 $200,000
STARK 4 6,770 $111,455
STUTSMAN 3 4,546 $85,605
TOWNER 1 2,929 $40,000
TRAILL 3 3,154 $96,837
WALSH 11 18,062 $438,812
WARD 10 21,504 $322,314
WELLS 10 18,273 $294,694
WILLIAMS 23 49,045 $718,027
OHIO 324 127,833 $3,013,683
ADAMS 3 1,745 $37,325
ASHLAND 9 2,941 $66,676
ATHENS 12 1,711 $14,663
AUGLAIZE 1 174 $2,556
BELMONT 5 206 $2,773
BROWN 2 945 $19,540
BUTLER 3 297 $9,313
CARROLL 1 218 $3,026
CHAMPAIGN 3 3,323 $82,907
CLARK 2 732 $13,288
CLERMONT 4 178 $1,323
CLINTON 4 1,493 $38,778
COLUMBIANA 1 550 $5,212
COSHOCTON 2 944 $18,789
DARKE 2 139 $5,333
DEFIANCE 6 3,170 $73,868
DELAWARE 8 4,078 $99,072
CStP FY2010_Appendix_Modified_Final_2-14-2012.docx
48
Table A 3. Conservation Stewardship Program: Contracts, Acres, and Obligations by State and County, FY 2010
State and County Contracts Acres Obligations
FAIRFIELD 12 5,261 $124,229
FULTON 4 2,236 $58,785
GALLIA 1 151 $2,032
GUERNSEY 3 313 $4,993
HARDIN 3 1,175 $26,824
HARRISON 1 27 $102
HENRY 2 72 $2,512
HIGHLAND 8 2,128 $71,082
HOLMES 1 129 $751
HURON 1 264 $3,408
JACKSON 8 1,227 $11,995
JEFFERSON 2 420 $2,389
KNOX 3 1,449 $31,768
LICKING 4 836 $21,446
LOGAN 9 4,213 $104,227
MADISON 6 990 $25,129
MAHONING 2 190 $3,969
MARION 3 2,684 $41,923
MEDINA 1 424 $10,200
MEIGS 10 1,361 $15,535
MERCER 10 6,766 $237,616
MIAMI 2 363 $8,452
MONROE 7 1,024 $8,348
MONTGOMERY 1 1,163 $37,216
MORGAN 13 2,017 $30,086
MORROW 3 3,230 $55,161
MUSKINGUM 24 4,275 $94,082
NOBLE 3 438 $6,362
OTTAWA 1 134 $4,787
PAULDING 1 497 $9,562
PERRY 2 461 $13,543
PICKAWAY 4 2,373 $69,951
PORTAGE 1 1,820 $40,000
PUTNAM 10 5,919 $124,633
RICHLAND 2 68 $1,022
ROSS 14 13,769 $335,825
SANDUSKY 3 1,521 $28,692
SENECA 2 819 $31,179
SHELBY 16 10,186 $270,254
STARK 2 73 $734
TRUMBULL 1 2,811 $40,000
TUSCARAWAS 1 362 $10,259
VAN WERT 1 727 $14,734
VINTON 13 1,765 $16,795
WARREN 2 1,235 $44,840
WAYNE 6 1,069 $19,316
WILLIAMS 21 9,883 $266,009
WOOD 6 4,668 $136,484
OKLAHOMA 918 1,137,871 $16,175,899
ADAIR 3 1,217 $21,302
ALFALFA 19 15,273 $304,763
ATOKA 1 1,116 $13,035
BEAVER 17 37,104 $418,931
BECKHAM 7 9,282 $171,563
BLAINE 4 3,314 $52,906
BRYAN 13 7,937 $151,351

CStP FY2010_Appendix_Modified_Final_2-14-2012.docx
49
Table A 3. Conservation Stewardship Program: Contracts, Acres, and Obligations by State and County, FY 2010
State and County Contracts Acres Obligations
CADDO 64 66,910 $1,138,020
CANADIAN 21 17,993 $335,619
CARTER 6 8,068 $58,481
CHOCTAW 12 4,028 $59,088
CIMARRON 3 18,200 $95,789
COAL 2 3,147 $38,263
COMANCHE 9 10,013 $143,938
COTTON 27 66,595 $828,365
CRAIG 5 5,635 $101,470
CREEK 9 3,295 $63,371
CUSTER 39 59,960 $917,846
DELAWARE 4 3,335 $39,123
DEWEY 3 5,001 $50,199
ELLIS 3 3,578 $28,346
GARFIELD 5 5,762 $130,085
GARVIN 3 5,512 $77,804
GRADY 14 11,492 $203,731
GRANT 26 27,818 $483,679
GREER 55 67,644 $1,243,632
HARMON 24 28,397 $431,531
HARPER 9 21,628 $170,294
HASKELL 20 6,369 $114,329
HUGHES 13 15,701 $273,744
JACKSON 14 12,736 $311,081
JEFFERSON 3 4,539 $68,742
JOHNSTON 6 2,640 $53,428
KAY 18 10,690 $278,557
KINGFISHER 8 9,895 $163,735
KIOWA 23 34,811 $481,175
LATIMER 16 9,662 $198,832
LE FLORE 21 10,501 $179,122
LINCOLN 4 1,172 $16,940
LOVE 2 999 $20,504
MAJOR 6 9,385 $175,592
MARSHALL 4 1,280 $11,469
MAYES 16 5,405 $131,069
MCCLAIN 6 2,548 $33,945
MCCURTAIN 17 12,892 $176,166
MCINTOSH 10 16,168 $136,440
MURRAY 1 341 $3,937
MUSKOGEE 23 11,486 $339,967
NOBLE 7 13,667 $142,678
NOWATA 6 8,047 $130,790
OKMULGEE 5 9,394 $116,379
OSAGE 30 101,983 $678,979
OTTAWA 2 1,499 $20,297
PAWNEE 13 10,686 $142,861
PAYNE 14 10,836 $203,171
PITTSBURG 14 9,702 $173,381
PONTOTOC 13 16,721 $194,775
POTTAWATOMIE 48 32,310 $774,036
PUSHMATAHA 6 14,346 $70,002
ROGER MILLS 1 945 $5,116
SEMINOLE 18 4,828 $100,826
SEQUOYAH 6 7,760 $154,164
STEPHENS 8 12,837 $183,071

CStP FY2010_Appendix_Modified_Final_2-14-2012.docx
50
Table A 3. Conservation Stewardship Program: Contracts, Acres, and Obligations by State and County, FY 2010
State and County Contracts Acres Obligations
TEXAS 45 104,031 $1,267,251
TILLMAN 4 8,271 $111,162
TULSA 2 564 $30,337
WASHINGTON 2 175 $3,836
WASHITA 23 25,217 $357,211
WOODS 12 45,526 $373,077
WOODWARD 1 56 $1,200
OREGON 372 841,378 $7,551,677
BAKER 34 77,581 $632,667
BENTON 2 2,249 $62,355
CLACKAMAS 10 720 $16,613
COLUMBIA 15 4,505 $64,297
COOS 2 60 $1,420
CROOK 7 47,794 $187,863
DESCHUTES 1 20 $1,000
DOUGLAS 2 312 $3,534
GILLIAM 22 98,846 $635,560
GRANT 23 72,414 $478,919
HARNEY 8 28,899 $153,354
HOOD RIVER 1 87 $2,710
JEFFERSON 3 2,524 $46,669
KLAMATH 6 12,012 $140,062
LAKE 6 6,714 $98,402
LANE 8 715 $11,502
LINCOLN 1 18 $664
LINN 2 198 $2,430
MALHEUR 4 27,941 $142,225
MARION 12 13,909 $176,526
MORROW 29 104,599 $954,485
POLK 12 1,444 $32,891
SHERMAN 31 81,736 $1,262,795
UMATILLA 22 44,807 $890,586
UNION 11 18,453 $164,729
WALLOWA 10 21,806 $199,182
WASCO 22 99,602 $542,455
WASHINGTON 47 16,099 $352,451
WHEELER 13 52,695 $261,672
YAMHILL 6 2,623 $31,659
PENNSYLVANIA 565 166,101 $3,974,217
ADAMS 21 7,121 $169,491
ALLEGHENY 2 358 $7,970
ARMSTRONG 22 5,027 $97,456
BEAVER 8 1,301 $27,348
BEDFORD 11 4,711 $114,002
BERKS 18 3,829 $95,773
BLAIR 6 2,346 $64,054
BRADFORD 9 2,924 $138,486
BUCKS 11 1,588 $38,732
BUTLER 32 12,571 $248,126
CAMBRIA 5 1,826 $40,440
CAMERON 2 462 $6,940
CARBON 4 362 $12,025
CENTRE 28 10,605 $240,739
CHESTER 10 3,911 $144,988
CLARION 20 6,437 $101,949
CLEARFIELD 8 2,152 $33,815

CStP FY2010_Appendix_Modified_Final_2-14-2012.docx
51
Table A 3. Conservation Stewardship Program: Contracts, Acres, and Obligations by State and County, FY 2010
State and County Contracts Acres Obligations
CLINTON 5 4,191 $98,011
COLUMBIA 12 3,064 $133,461
CRAWFORD 5 1,549 $37,370
CUMBERLAND 6 1,495 $26,620
DAUPHIN 8 2,122 $31,476
ELK 2 198 $2,469
ERIE 2 109 $1,115
FAYETTE 3 286 $5,424
FOREST 1 61 $269
FRANKLIN 4 574 $8,794
FULTON 3 1,805 $15,381
GREENE 3 401 $5,898
HUNTINGDON 7 1,798 $46,295
INDIANA 8 4,821 $120,733
JEFFERSON 16 3,942 $122,346
JUNIATA 13 2,059 $40,617
LACKAWANNA 4 1,017 $24,004
LANCASTER 14 4,861 $160,069
LAWRENCE 2 251 $4,667
LEBANON 10 1,727 $33,266
LEHIGH 7 2,153 $70,486
LUZERNE 6 4,288 $85,391
LYCOMING 7 745 $19,677
MCKEAN 6 941 $12,940
MERCER 6 915 $17,147
MIFFLIN 5 1,392 $40,967
MONROE 2 295 $4,582
MONTGOMERY 1 65 $1,763
MONTOUR 3 300 $11,360
NORTHAMPTON 10 1,807 $49,663
NORTHUMBERLAND 16 7,206 $203,888
PERRY 10 4,652 $82,149
PIKE 2 220 $956
POTTER 7 1,101 $23,286
SCHUYLKILL 24 8,478 $229,167
SNYDER 6 1,469 $62,234
SOMERSET 10 1,333 $21,822
SULLIVAN 1 626 $33,517
SUSQUEHANNA 14 1,459 $26,514
TIOGA 17 3,805 $50,388
UNION 19 4,925 $127,191
VENANGO 2 531 $2,701
WARREN 5 1,244 $11,093
WASHINGTON 6 1,051 $15,125
WAYNE 8 1,388 $26,443
WESTMORELAND 4 1,273 $37,836
WYOMING 1 661 $1,252
YORK 15 7,918 $204,060
PUERTO RICO 11 700 $19,066
ADJUNTAS 1 100 $2,002
GUAYANILLA 1 60 $1,205
LAJAS 2 211 $9,551
LARES 1 13 $409
MAYAGUEZ 1 7 $125
MOCA 1 75 $1,103
SALINAS 1 125 $2,444
CStP FY2010_Appendix_Modified_Final_2-14-2012.docx
52
Table A 3. Conservation Stewardship Program: Contracts, Acres, and Obligations by State and County, FY 2010
State and County Contracts Acres Obligations
SAN GERMAN 1 20 $697
SAN SEBASTIAN 1 59 $1,056
SANTA ISABEL 1 30 $474
RHODE ISLAND 21 3,725 $46,311
KENT 6 2,052 $26,869
NEWPORT 3 180 $4,756
PROVIDENCE 11 1,448 $13,686
WASHINGTON 1 45 $1,000
SOUTH CAROLINA 443 265,706 $3,423,141
ABBEVILLE 5 857 $7,594
AIKEN 2 463 $10,013
ALLENDALE 12 9,035 $114,275
ANDERSON 5 2,592 $35,717
BAMBERG 22 8,472 $114,376
BARNWELL 21 10,766 $121,559
BEAUFORT 1 25 $718
BERKELEY 11 11,966 $142,557
CALHOUN 1 404 $6,527
CHARLESTON 4 5,737 $44,488
CHEROKEE 2 5,078 $32,606
CHESTER 13 3,057 $30,579
CHESTERFIELD 8 2,121 $41,848
CLARENDON 28 23,886 $384,923
COLLETON 2 813 $11,309
DARLINGTON 1 2,908 $4,085
DILLON 13 4,245 $28,891
DORCHESTER 11 6,973 $73,054
EDGEFIELD 19 14,026 $251,994
FAIRFIELD 13 5,718 $37,707
FLORENCE 2 1,060 $14,813
GEORGETOWN 17 17,073 $98,960
GREENVILLE 3 1,049 $7,563
GREENWOOD 6 2,523 $13,564
HAMPTON 20 15,839 $290,149
HORRY 29 22,669 $219,681
JASPER 3 2,089 $11,532
KERSHAW 5 598 $5,005
LANCASTER 5 617 $6,306
LAURENS 3 1,380 $20,839
LEE 11 8,349 $80,829
LEXINGTON 5 1,869 $53,910
MARION 10 2,394 $35,463
MARLBORO 9 5,662 $118,470
MCCORMICK 2 180 $2,983
NEWBERRY 19 8,486 $71,578
OCONEE 3 1,125 $27,995
ORANGEBURG 23 7,088 $98,133
PICKENS 2 604 $7,619
RICHLAND 2 1,910 $8,905
SALUDA 30 17,983 $314,984
SUMTER 17 16,998 $307,967
UNION 5 1,166 $16,008
WILLIAMSBURG 15 5,463 $74,512
YORK 3 2,389 $20,553
SOUTH DAKOTA 505 1,294,391 $14,873,702
AURORA 4 8,688 $169,964

CStP FY2010_Appendix_Modified_Final_2-14-2012.docx
53
Table A 3. Conservation Stewardship Program: Contracts, Acres, and Obligations by State and County, FY 2010
State and County Contracts Acres Obligations
BEADLE 15 21,384 $345,587
BON HOMME 2 1,137 $34,131
BROOKINGS 6 5,292 $193,433
BROWN 25 41,732 $995,179
BRULE 3 6,500 $100,107
BUFFALO 2 3,837 $43,497
BUTTE 6 20,709 $126,310
CAMPBELL 5 10,379 $178,009
CLARK 6 5,773 $72,043
CODINGTON 3 4,325 $76,416
CORSON 13 50,728 $415,935
CUSTER 5 15,047 $122,696
DAVISON 4 4,240 $99,503
DAY 11 21,631 $361,947
DEUEL 9 8,765 $113,904
DEWEY 25 141,586 $823,954
DOUGLAS 2 647 $19,352
EDMUNDS 6 11,598 $223,306
FALL RIVER 6 60,055 $220,348
FAULK 4 5,659 $94,739
GRANT 6 12,870 $233,276
GREGORY 4 7,386 $89,490
HAAKON 7 44,565 $260,882
HAMLIN 21 17,107 $554,717
HAND 4 5,352 $81,072
HANSON 3 3,128 $65,016
HARDING 1 592 $4,501
HUGHES 6 15,160 $274,004
HUTCHINSON 3 2,565 $84,256
HYDE 6 21,480 $184,847
JACKSON 1 1,315 $15,724
JERAULD 1 1,016 $10,650
JONES 5 15,433 $143,070
KINGSBURY 4 1,303 $28,101
LAKE 23 16,973 $477,330
LAWRENCE 1 243 $2,145
LINCOLN 2 626 $16,932
LYMAN 24 48,766 $478,035
MARSHALL 2 3,679 $80,000
MCCOOK 1 134 $2,191
MCPHERSON 2 4,130 $107,161
MEADE 8 47,157 $263,661
MELLETTE 4 26,027 $119,463
MINER 3 3,718 $79,419
MINNEHAHA 1 572 $16,388
PENNINGTON 14 45,031 $439,500
PERKINS 5 12,310 $118,950
POTTER 5 8,269 $153,463
ROBERTS 25 35,728 $733,284
SANBORN 3 2,582 $57,664
SHANNON 7 49,890 $215,090
SPINK 53 85,011 $1,822,134
STANLEY 2 45,113 $80,000
SULLY 14 28,549 $548,979
TODD 8 53,279 $290,139
TRIPP 48 107,842 $1,371,809

CStP FY2010_Appendix_Modified_Final_2-14-2012.docx
54
Table A 3. Conservation Stewardship Program: Contracts, Acres, and Obligations by State and County, FY 2010
State and County Contracts Acres Obligations
WALWORTH 3 8,672 $101,572
YANKTON 2 1,682 $47,296
ZIEBACH 11 59,427 $391,131
TENNESSEE 416 139,168 $2,127,807
BEDFORD 1 14 $333
BENTON 1 416 $1,196
BLEDSOE 1 26 $429
BRADLEY 1 130 $1,973
CANNON 3 789 $21,365
CARROLL 3 583 $6,379
CHEATHAM 1 141 $1,970
CHESTER 4 3,968 $90,645
CLAIBORNE 8 779 $8,120
CLAY 18 3,063 $35,633
COCKE 2 68 $1,470
COFFEE 5 2,449 $50,688
CROCKETT 5 3,844 $97,888
CUMBERLAND 3 137 $3,886
DE KALB 1 308 $4,171
DICKSON 2 636 $3,662
FENTRESS 17 3,628 $31,745
FRANKLIN 4 3,680 $31,896
GILES 16 5,546 $102,544
GREENE 3 166 $1,893
HAMILTON 2 219 $1,420
HANCOCK 5 361 $6,525
HARDEMAN 2 344 $5,551
HARDIN 2 5,609 $58,309
HAWKINS 13 1,630 $33,083
HAYWOOD 1 1,434 $54,580
HENRY 4 5,633 $120,588
HICKMAN 3 1,941 $13,055
HUMPHREYS 2 976 $8,024
JACKSON 26 11,776 $96,291
LAKE 3 3,205 $162,943
LAWRENCE 10 3,856 $62,732
LINCOLN 18 5,582 $81,655
LOUDON 2 95 $3,285
MACON 23 3,182 $29,158
MADISON 20 17,632 $386,032
MARION 1 480 $793
MARSHALL 1 297 $2,760
MCNAIRY 1 221 $1,347
MONROE 3 459 $6,350
MONTGOMERY 8 1,031 $6,608
MOORE 1 169 $2,483
MORGAN 2 174 $1,469
OVERTON 7 1,124 $7,126
PICKETT 10 3,199 $32,133
POLK 1 260 $825
PUTNAM 6 235 $3,569
RHEA 5 2,915 $19,692
ROANE 2 159 $2,973
RUTHERFORD 13 4,103 $89,761
SCOTT 38 4,068 $37,085
SMITH 6 2,791 $72,704
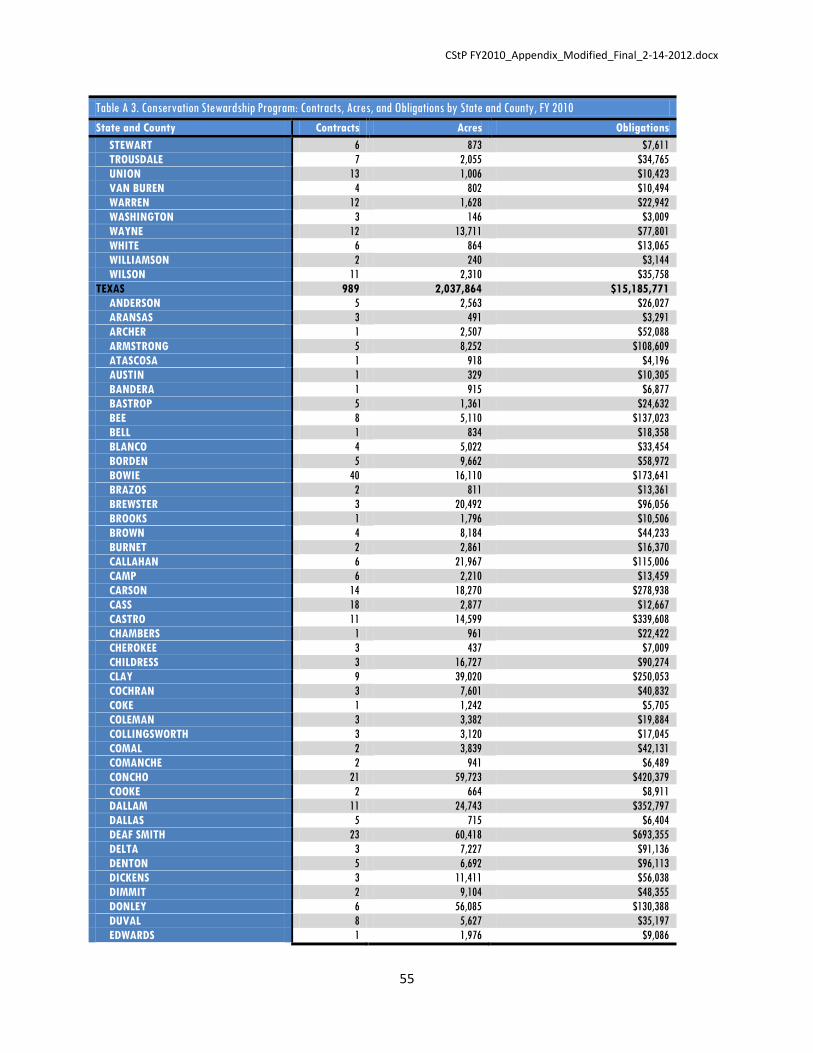
CStP FY2010_Appendix_Modified_Final_2-14-2012.docx
55
Table A 3. Conservation Stewardship Program: Contracts, Acres, and Obligations by State and County, FY 2010
State and County Contracts Acres Obligations
STEWART 6 873 $7,611
TROUSDALE 7 2,055 $34,765
UNION 13 1,006 $10,423
VAN BUREN 4 802 $10,494
WARREN 12 1,628 $22,942
WASHINGTON 3 146 $3,009
WAYNE 12 13,711 $77,801
WHITE 6 864 $13,065
WILLIAMSON 2 240 $3,144
WILSON 11 2,310 $35,758
TEXAS 989 2,037,864 $15,185,771
ANDERSON 5 2,563 $26,027
ARANSAS 3 491 $3,291
ARCHER 1 2,507 $52,088
ARMSTRONG 5 8,252 $108,609
ATASCOSA 1 918 $4,196
AUSTIN 1 329 $10,305
BANDERA 1 915 $6,877
BASTROP 5 1,361 $24,632
BEE 8 5,110 $137,023
BELL 1 834 $18,358
BLANCO 4 5,022 $33,454
BORDEN 5 9,662 $58,972
BOWIE 40 16,110 $173,641
BRAZOS 2 811 $13,361
BREWSTER 3 20,492 $96,056
BROOKS 1 1,796 $10,506
BROWN 4 8,184 $44,233
BURNET 2 2,861 $16,370
CALLAHAN 6 21,967 $115,006
CAMP 6 2,210 $13,459
CARSON 14 18,270 $278,938
CASS 18 2,877 $12,667
CASTRO 11 14,599 $339,608
CHAMBERS 1 961 $22,422
CHEROKEE 3 437 $7,009
CHILDRESS 3 16,727 $90,274
CLAY 9 39,020 $250,053
COCHRAN 3 7,601 $40,832
COKE 1 1,242 $5,705
COLEMAN 3 3,382 $19,884
COLLINGSWORTH 3 3,120 $17,045
COMAL 2 3,839 $42,131
COMANCHE 2 941 $6,489
CONCHO 21 59,723 $420,379
COOKE 2 664 $8,911
DALLAM 11 24,743 $352,797
DALLAS 5 715 $6,404
DEAF SMITH 23 60,418 $693,355
DELTA 3 7,227 $91,136
DENTON 5 6,692 $96,113
DICKENS 3 11,411 $56,038
DIMMIT 2 9,104 $48,355
DONLEY 6 56,085 $130,388
DUVAL 8 5,627 $35,197
EDWARDS 1 1,976 $9,086

CStP FY2010_Appendix_Modified_Final_2-14-2012.docx
56
Table A 3. Conservation Stewardship Program: Contracts, Acres, and Obligations by State and County, FY 2010
State and County Contracts Acres Obligations
ERATH 3 1,179 $12,294
FALLS 3 1,799 $27,045
FANNIN 1 1,517 $39,296
FISHER 3 2,057 $17,241
FLOYD 4 9,771 $104,580
FOARD 1 591 $10,657
FRANKLIN 4 1,035 $5,867
FREESTONE 3 1,435 $29,674
FRIO 6 9,724 $119,325
GARZA 2 6,426 $29,746
GILLESPIE 2 4,762 $56,522
GLASSCOCK 1 935 $24,152
GOLIAD 1 568 $11,838
GONZALES 3 2,937 $35,912
GRAY 7 33,091 $222,636
GRAYSON 12 11,234 $164,753
GREGG 1 1,142 $7,178
GRIMES 10 4,116 $55,897
GUADALUPE 6 5,491 $96,792
HALE 15 16,595 $553,397
HALL 4 23,749 $131,794
HAMILTON 2 1,328 $12,952
HANSFORD 1 524 $7,606
HARDIN 4 8,855 $49,685
HARRIS 2 6,606 $51,179
HARRISON 15 5,372 $55,806
HARTLEY 6 14,977 $188,553
HASKELL 4 9,361 $103,442
HAYS 4 3,633 $39,898
HEMPHILL 5 88,952 $188,763
HENDERSON 4 856 $12,208
HIDALGO 1 3,769 $15,278
HILL 28 9,020 $253,636
HOCKLEY 2 1,459 $28,111
HOPKINS 5 2,076 $55,737
HOUSTON 3 620 $3,778
HOWARD 4 13,251 $87,427
HUDSPETH 2 30,210 $80,000
HUNT 3 1,351 $42,256
IRION 7 32,987 $198,492
JACK 6 33,502 $137,690
JACKSON 1 2,476 $35,296
JASPER 1 112 $1,007
JEFF DAVIS 2 42,342 $80,000
JEFFERSON 9 11,458 $183,489
JOHNSON 1 608 $19,374
KARNES 8 11,263 $119,948
KENDALL 4 12,210 $95,052
KENT 1 34,218 $40,000
KERR 3 19,778 $95,707
KIMBLE 4 10,952 $106,569
KING 2 4,118 $37,735
KINNEY 1 8,473 $40,000
KLEBERG 3 5,460 $160,000
LA SALLE 1 1,978 $11,702
LAMAR 42 17,122 $251,734

CStP FY2010_Appendix_Modified_Final_2-14-2012.docx
57
Table A 3. Conservation Stewardship Program: Contracts, Acres, and Obligations by State and County, FY 2010
State and County Contracts Acres Obligations
LAMB 2 12,057 $56,172
LAMPASAS 4 1,630 $12,124
LEON 9 9,809 $118,344
LIBERTY 7 7,029 $85,590
LIMESTONE 3 6,478 $77,199
LIPSCOMB 4 13,739 $106,186
LOVING 2 141,017 $120,000
LYNN 4 2,942 $82,928
MARION 9 2,454 $8,194
MASON 1 992 $4,245
MAVERICK 2 16,809 $50,485
MCCULLOCH 1 2,156 $21,409
MCLENNAN 4 1,961 $39,813
MEDINA 2 4,442 $34,184
MENARD 3 12,283 $82,424
MILLS 2 1,901 $9,024
MONTAGUE 4 10,342 $67,794
MONTGOMERY 5 2,579 $55,556
MOORE 5 26,735 $240,000
MORRIS 8 2,156 $33,987
MOTLEY 3 4,950 $36,138
NACOGDOCHES 3 444 $2,191
NAVARRO 2 442 $8,100
NEWTON 2 566 $2,746
NOLAN 2 31,021 $80,000
NUECES 4 7,095 $147,430
OCHILTREE 4 9,662 $159,526
OLDHAM 5 85,480 $131,911
ORANGE 4 1,335 $15,881
PALO PINTO 4 13,419 $110,042
PANOLA 32 9,263 $87,584
PARKER 3 231 $3,043
PARMER 14 26,690 $324,295
PECOS 2 4,591 $25,017
POTTER 1 474 $10,860
PRESIDIO 3 47,717 $120,000
RAINS 4 4,386 $91,489
RANDALL 4 5,683 $77,091
REAGAN 1 5,156 $34,919
RED RIVER 65 34,070 $401,469
REFUGIO 1 1,223 $40,000
ROBERTS 2 13,384 $65,617
ROBERTSON 6 8,300 $115,401
ROCKWALL 2 179 $2,467
RUNNELS 5 10,217 $163,447
RUSK 6 920 $13,493
SABINE 1 493 $4,303
SAN AUGUSTINE 6 1,751 $10,855
SAN JACINTO 1 164 $557
SAN PATRICIO 7 9,020 $202,827
SAN SABA 1 1,741 $7,855
SCHLEICHER 2 9,001 $69,061
SCURRY 3 2,344 $22,970
SHACKELFORD 4 17,323 $98,199
SHELBY 2 161 $1,717
SMITH 4 806 $13,394

CStP FY2010_Appendix_Modified_Final_2-14-2012.docx
58
Table A 3. Conservation Stewardship Program: Contracts, Acres, and Obligations by State and County, FY 2010
State and County Contracts Acres Obligations
SOMERVELL 1 1,507 $15,981
STARR 1 1,685 $10,075
STEPHENS 3 1,994 $11,501
STERLING 1 20,712 $40,000
SUTTON 2 15,729 $49,812
SWISHER 16 28,520 $492,794
TARRANT 1 135 $2,050
TERRY 8 6,375 $164,032
THROCKMORTON 2 3,278 $22,289
TITUS 2 326 $919
TOM GREEN 12 86,472 $349,054
TRAVIS 4 2,106 $22,152
TRINITY 1 1,251 $7,869
TYLER 1 100 $337
UPSHUR 10 2,417 $22,116
UPTON 1 1,353 $40,000
UVALDE 5 16,038 $100,168
VAL VERDE 1 15,501 $40,000
VAN ZANDT 2 563 $8,142
WALKER 13 14,113 $108,100
WALLER 5 8,018 $84,496
WEBB 3 13,854 $58,947
WHARTON 11 15,900 $345,134
WILBARGER 2 3,022 $43,711
WILLACY 6 2,125 $31,267
WILSON 1 403 $4,419
WISE 7 3,761 $58,479
WOOD 3 739 $9,702
YOAKUM 1 2,359 $18,033
YOUNG 13 40,061 $217,041
ZAPATA 1 9,298 $40,000
ZAVALA 3 7,713 $65,212
UTAH 78 301,187 $1,738,582
BEAVER 4 15,625 $120,623
BOX ELDER 21 125,101 $745,706
CACHE 5 4,016 $77,614
CARBON 1 9,711 $40,000
DAVIS 3 672 $13,243
DUCHESNE 3 876 $9,600
EMERY 4 17,853 $62,370
GARFIELD 2 1,084 $11,665
IRON 3 8,892 $83,786
JUAB 1 1,640 $5,788
KANE 8 58,742 $195,672
MILLARD 4 10,008 $66,989
MORGAN 1 139 $2,221
SANPETE 8 15,654 $168,375
SEVIER 1 38 $1,000
SUMMIT 1 19,405 $40,000
TOOELE 1 6,236 $39,633
UINTAH 2 417 $7,404
UTAH 4 4,806 $42,309
WAYNE 1 274 $4,584
VERMONT 7 2,562 $35,471
ADDISON 1 470 $11,759
CHITTENDEN 4 1,027 $19,027

CStP FY2010_Appendix_Modified_Final_2-14-2012.docx
59
Table A 3. Conservation Stewardship Program: Contracts, Acres, and Obligations by State and County, FY 2010
State and County Contracts Acres Obligations
ORANGE 1 870 $4,257
WINDSOR 1 195 $428
VIRGINIA 270 146,844 $3,313,041
ACCOMACK 5 6,917 $174,172
AMELIA 1 142 $4,109
AMHERST 2 251 $3,824
AUGUSTA 1 173 $7,381
BEDFORD 5 1,509 $40,683
BLAND 2 213 $6,612
BOTETOURT 1 395 $16,166
BRUNSWICK 2 2,606 $33,097
CAMPBELL 2 694 $5,304
CAROLINE 2 780 $29,606
CARROLL 6 798 $22,412
CHARLES CITY 10 7,279 $206,209
ESSEX 3 3,164 $28,999
FAUQUIER 1 638 $4,323
FLOYD 4 462 $12,669
GILES 1 2,515 $16,843
GLOUCESTER 12 4,416 $84,265
GRAYSON 7 1,583 $32,665
GREENE 1 26 $166
GREENSVILLE 6 2,166 $62,097
HALIFAX 3 4,797 $54,637
HANOVER 2 2,733 $80,000
HENRICO 1 4,101 $80,000
HIGHLAND 1 24 $442
ISLE OF WIGHT 4 2,153 $15,041
KING AND QUEEN 3 4,205 $31,966
KING GEORGE 5 946 $31,425
LANCASTER 8 3,902 $137,082
LUNENBURG 3 2,015 $11,356
MADISON 2 302 $2,641
MATHEWS 3 1,028 $26,513
MECKLENBURG 2 11,037 $69,125
MIDDLESEX 7 4,989 $85,095
MONTGOMERY 1 105 $1,175
NEW KENT 5 1,626 $40,618
NORTHAMPTON 4 533 $16,952
NORTHUMBERLAND 15 9,846 $356,329
ORANGE 4 1,977 $48,288
PATRICK 3 142 $4,776
PITTSYLVANIA 8 5,174 $97,245
PRINCE EDWARD 5 520 $12,226
PRINCE GEORGE 1 95 $399
PULASKI 3 929 $33,419
RICHMOND 12 5,191 $184,992
ROCKBRIDGE 1 410 $16,340
ROCKINGHAM 8 1,960 $42,238
RUSSELL 1 559 $10,278
SCOTT 5 546 $16,548
SHENANDOAH 6 1,354 $25,333
SMYTH 8 4,869 $139,251
SOUTHAMPTON 21 14,891 $255,668
SPOTSYLVANIA 3 720 $14,595
SUFFOLK CITY 2 1,314 $36,832

CStP FY2010_Appendix_Modified_Final_2-14-2012.docx
60
Table A 3. Conservation Stewardship Program: Contracts, Acres, and Obligations by State and County, FY 2010
State and County Contracts Acres Obligations
SUSSEX 5 3,019 $108,553
TAZEWELL 3 654 $19,180
WASHINGTON 2 594 $19,151
WESTMORELAND 21 10,193 $373,006
WYTHE 5 664 $22,724
WASHINGTON 206 448,327 $6,008,341
ADAMS 36 121,855 $1,338,141
ASOTIN 18 63,828 $667,412
BENTON 5 21,560 $163,095
CHELAN 1 113 $724
COLUMBIA 2 5,931 $80,000
DOUGLAS 6 38,639 $216,933
FERRY 3 1,002 $18,408
FRANKLIN 10 28,867 $369,133
GARFIELD 4 6,541 $113,448
GRANT 21 29,027 $697,650
GRAYS HARBOR 1 218 $5,609
KING 1 221 $4,578
KITTITAS 12 6,933 $163,669
KLICKITAT 2 6,288 $80,000
LEWIS 2 1,449 $12,283
LINCOLN 25 37,563 $681,861
MASON 2 88 $1,431
OKANOGAN 6 14,200 $131,870
PACIFIC 1 67 $984
SKAGIT 1 3,372 $33,784
SNOHOMISH 1 155 $1,426
SPOKANE 18 19,706 $493,023
STEVENS 5 5,057 $87,182
WALLA WALLA 4 12,565 $200,000
WHATCOM 3 873 $17,326
WHITMAN 14 21,912 $419,659
YAKIMA 2 298 $8,712
WEST VIRGINIA 253 73,445 $780,412
BARBOUR 4 571 $10,981
BERKELEY 2 828 $19,526
BRAXTON 23 3,642 $43,187
CABELL 2 341 $4,192
CALHOUN 17 5,911 $45,264
CLAY 5 710 $5,767
DODDRIDGE 2 43 $1,730
GILMER 3 2,234 $19,108
GRANT 8 2,593 $34,783
GREENBRIER 8 1,556 $24,266
HAMPSHIRE 7 2,070 $25,601
HARDY 12 21,051 $68,731
HARRISON 5 507 $6,414
JACKSON 6 935 $20,354
JEFFERSON 1 386 $5,828
KANAWHA 1 130 $2,403
LINCOLN 3 518 $8,870
MARION 6 442 $7,011
MASON 6 2,088 $98,211
MERCER 2 448 $2,964
MINERAL 9 3,924 $67,328
MONONGALIA 2 370 $1,320
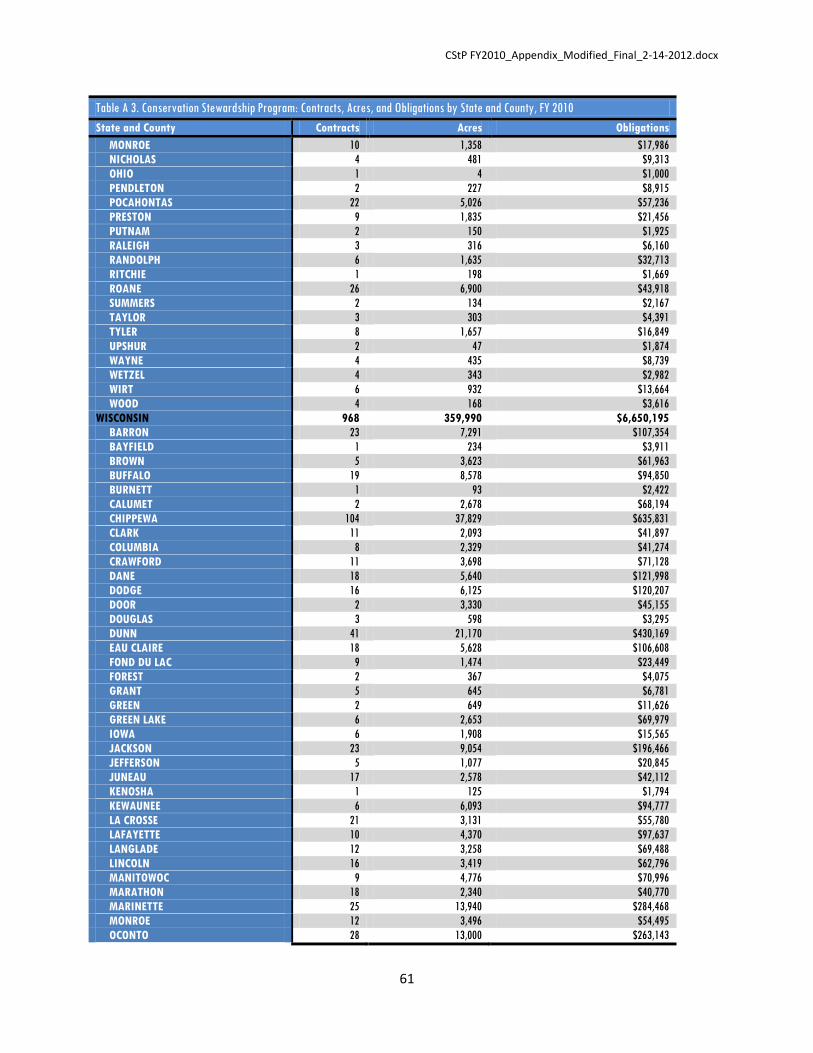
CStP FY2010_Appendix_Modified_Final_2-14-2012.docx
61
Table A 3. Conservation Stewardship Program: Contracts, Acres, and Obligations by State and County, FY 2010
State and County Contracts Acres Obligations
MONROE 10 1,358 $17,986
NICHOLAS 4 481 $9,313
OHIO 1 4 $1,000
PENDLETON 2 227 $8,915
POCAHONTAS 22 5,026 $57,236
PRESTON 9 1,835 $21,456
PUTNAM 2 150 $1,925
RALEIGH 3 316 $6,160
RANDOLPH 6 1,635 $32,713
RITCHIE 1 198 $1,669
ROANE 26 6,900 $43,918
SUMMERS 2 134 $2,167
TAYLOR 3 303 $4,391
TYLER 8 1,657 $16,849
UPSHUR 2 47 $1,874
WAYNE 4 435 $8,739
WETZEL 4 343 $2,982
WIRT 6 932 $13,664
WOOD 4 168 $3,616
WISCONSIN 968 359,990 $6,650,195
BARRON 23 7,291 $107,354
BAYFIELD 1 234 $3,911
BROWN 5 3,623 $61,963
BUFFALO 19 8,578 $94,850
BURNETT 1 93 $2,422
CALUMET 2 2,678 $68,194
CHIPPEWA 104 37,829 $635,831
CLARK 11 2,093 $41,897
COLUMBIA 8 2,329 $41,274
CRAWFORD 11 3,698 $71,128
DANE 18 5,640 $121,998
DODGE 16 6,125 $120,207
DOOR 2 3,330 $45,155
DOUGLAS 3 598 $3,295
DUNN 41 21,170 $430,169
EAU CLAIRE 18 5,628 $106,608
FOND DU LAC 9 1,474 $23,449
FOREST 2 367 $4,075
GRANT 5 645 $6,781
GREEN 2 649 $11,626
GREEN LAKE 6 2,653 $69,979
IOWA 6 1,908 $15,565
JACKSON 23 9,054 $196,466
JEFFERSON 5 1,077 $20,845
JUNEAU 17 2,578 $42,112
KENOSHA 1 125 $1,794
KEWAUNEE 6 6,093 $94,777
LA CROSSE 21 3,131 $55,780
LAFAYETTE 10 4,370 $97,637
LANGLADE 12 3,258 $69,488
LINCOLN 16 3,419 $62,796
MANITOWOC 9 4,776 $70,996
MARATHON 18 2,340 $40,770
MARINETTE 25 13,940 $284,468
MONROE 12 3,496 $54,495
OCONTO 28 13,000 $263,143

CStP FY2010_Appendix_Modified_Final_2-14-2012.docx
62
Table A 3. Conservation Stewardship Program: Contracts, Acres, and Obligations by State and County, FY 2010
State and County Contracts Acres Obligations
ONEIDA 1 88 $1,126
OUTAGAMIE 21 8,977 $180,313
OZAUKEE 2 594 $9,592
PEPIN 30 6,759 $109,167
PIERCE 63 30,270 $638,483
POLK 13 3,019 $41,752
PORTAGE 22 7,750 $171,788
PRICE 10 1,896 $23,456
RACINE 4 1,192 $24,901
RICHLAND 14 1,889 $18,523
ROCK 21 10,192 $245,379
RUSK 7 1,259 $21,958
SAUK 5 1,294 $19,725
SAWYER 2 256 $6,254
SHAWANO 51 21,379 $414,481
SHEBOYGAN 3 1,228 $28,735
ST CROIX 17 10,421 $156,594
TAYLOR 23 5,673 $93,129
TREMPEALEAU 23 11,114 $175,140
VERNON 34 7,192 $122,052
WALWORTH 4 1,492 $29,100
WASHBURN 5 1,866 $7,441
WASHINGTON 4 2,651 $53,796
WAUKESHA 5 4,987 $95,562
WAUPACA 41 16,927 $338,580
WAUSHARA 3 884 $15,903
WINNEBAGO 18 7,822 $136,649
WOOD 6 1,636 $27,318
WYOMING 177 913,343 $4,590,762
ALBANY 1 194 $2,358
BIG HORN 5 5,345 $86,714
CAMPBELL 15 125,008 $536,499
CARBON 5 77,216 $159,421
CONVERSE 7 56,037 $196,550
CROOK 10 56,162 $305,778
FREMONT 8 31,996 $195,325
GOSHEN 46 180,178 $1,088,185
HOT SPRINGS 7 45,966 $212,614
JOHNSON 2 11,800 $55,900
LARAMIE 7 12,986 $144,109
LINCOLN 2 3,513 $24,118
NIOBRARA 12 53,161 $334,020
PARK 1 1,110 $40,000
PLATTE 27 101,927 $608,147
SHERIDAN 2 23,997 $80,000
WASHAKIE 9 26,907 $216,590
WESTON 11 99,840 $304,434
Grand Total 20,567 25,164,327 $320,399,890
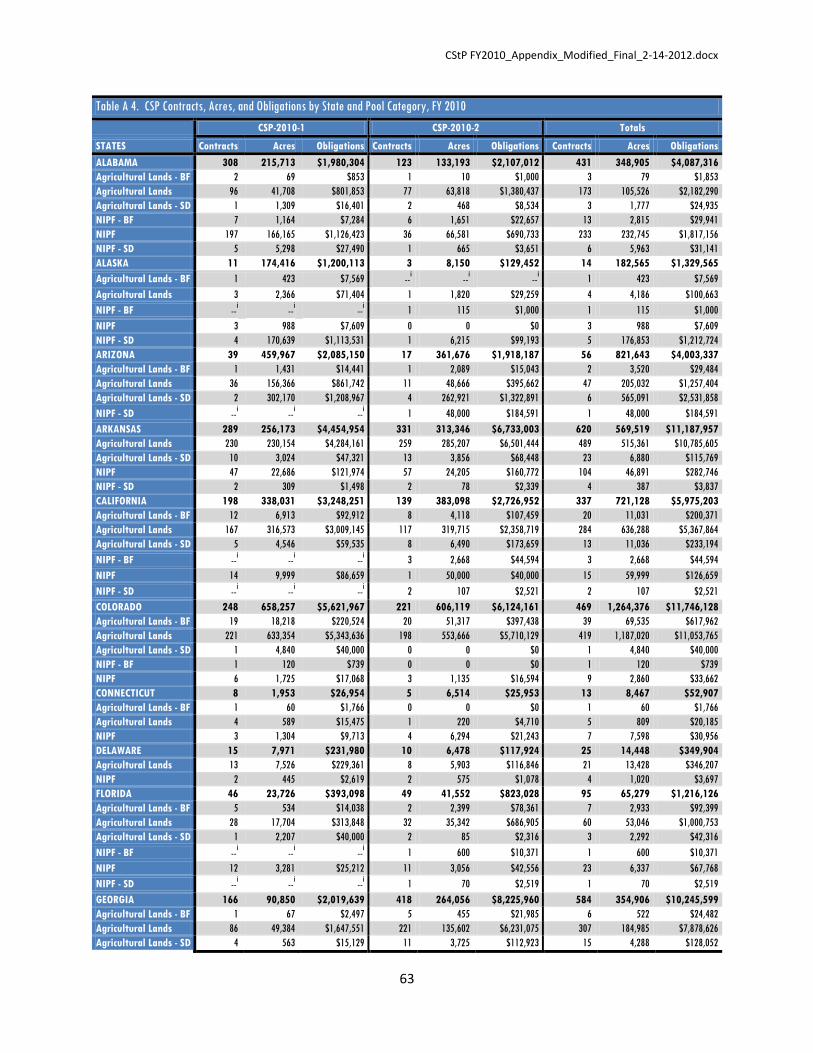
CStP FY2010_Appendix_Modified_Final_2-14-2012.docx
63
Table A 4. CSP Contracts, Acres, and Obligations by State and Pool Category, FY 2010
CSP-2010-1 CSP-2010-2 Totals
STATES Contracts Acres Obligations Contracts Acres Obligations Contracts Acres Obligations
ALABAMA 308 215,713 $1,980,304 123 133,193 $2,107,012 431 348,905 $4,087,316
Agricultural Lands - BF 2 69 $853 1 10 $1,000 3 79 $1,853
Agricultural Lands 96 41,708 $801,853 77 63,818 $1,380,437 173 105,526 $2,182,290
Agricultural Lands - SD 1 1,309 $16,401 2 468 $8,534 3 1,777 $24,935
NIPF - BF 7 1,164 $7,284 6 1,651 $22,657 13 2,815 $29,941
NIPF 197 166,165 $1,126,423 36 66,581 $690,733 233 232,745 $1,817,156
NIPF - SD 5 5,298 $27,490 1 665 $3,651 6 5,963 $31,141
ALASKA 11 174,416 $1,200,113 3 8,150 $129,452 14 182,565 $1,329,565
Agricultural Lands - BF 1 423 $7,569 --i --
i --
i 1 423 $7,569
Agricultural Lands 3 2,366 $71,404 1 1,820 $29,259 4 4,186 $100,663
NIPF - BF --i --
i --
i 1 115 $1,000 1 115 $1,000
NIPF 3 988 $7,609 0 0 $0 3 988 $7,609
NIPF - SD 4 170,639 $1,113,531 1 6,215 $99,193 5 176,853 $1,212,724
ARIZONA 39 459,967 $2,085,150 17 361,676 $1,918,187 56 821,643 $4,003,337
Agricultural Lands - BF 1 1,431 $14,441 1 2,089 $15,043 2 3,520 $29,484
Agricultural Lands 36 156,366 $861,742 11 48,666 $395,662 47 205,032 $1,257,404
Agricultural Lands - SD 2 302,170 $1,208,967 4 262,921 $1,322,891 6 565,091 $2,531,858
NIPF - SD --i --
i --
i 1 48,000 $184,591 1 48,000 $184,591
ARKANSAS 289 256,173 $4,454,954 331 313,346 $6,733,003 620 569,519 $11,187,957
Agricultural Lands 230 230,154 $4,284,161 259 285,207 $6,501,444 489 515,361 $10,785,605
Agricultural Lands - SD 10 3,024 $47,321 13 3,856 $68,448 23 6,880 $115,769
NIPF 47 22,686 $121,974 57 24,205 $160,772 104 46,891 $282,746
NIPF - SD 2 309 $1,498 2 78 $2,339 4 387 $3,837
CALIFORNIA 198 338,031 $3,248,251 139 383,098 $2,726,952 337 721,128 $5,975,203
Agricultural Lands - BF 12 6,913 $92,912 8 4,118 $107,459 20 11,031 $200,371
Agricultural Lands 167 316,573 $3,009,145 117 319,715 $2,358,719 284 636,288 $5,367,864
Agricultural Lands - SD 5 4,546 $59,535 8 6,490 $173,659 13 11,036 $233,194
NIPF - BF --i --
i --
i 3 2,668 $44,594 3 2,668 $44,594
NIPF 14 9,999 $86,659 1 50,000 $40,000 15 59,999 $126,659
NIPF - SD --i --
i --
i 2 107 $2,521 2 107 $2,521
COLORADO 248 658,257 $5,621,967 221 606,119 $6,124,161 469 1,264,376 $11,746,128
Agricultural Lands - BF 19 18,218 $220,524 20 51,317 $397,438 39 69,535 $617,962
Agricultural Lands 221 633,354 $5,343,636 198 553,666 $5,710,129 419 1,187,020 $11,053,765
Agricultural Lands - SD 1 4,840 $40,000 0 0 $0 1 4,840 $40,000
NIPF - BF 1 120 $739 0 0 $0 1 120 $739
NIPF 6 1,725 $17,068 3 1,135 $16,594 9 2,860 $33,662
CONNECTICUT 8 1,953 $26,954 5 6,514 $25,953 13 8,467 $52,907
Agricultural Lands - BF 1 60 $1,766 0 0 $0 1 60 $1,766
Agricultural Lands 4 589 $15,475 1 220 $4,710 5 809 $20,185
NIPF 3 1,304 $9,713 4 6,294 $21,243 7 7,598 $30,956
DELAWARE 15 7,971 $231,980 10 6,478 $117,924 25 14,448 $349,904
Agricultural Lands 13 7,526 $229,361 8 5,903 $116,846 21 13,428 $346,207
NIPF 2 445 $2,619 2 575 $1,078 4 1,020 $3,697
FLORIDA 46 23,726 $393,098 49 41,552 $823,028 95 65,279 $1,216,126
Agricultural Lands - BF 5 534 $14,038 2 2,399 $78,361 7 2,933 $92,399
Agricultural Lands 28 17,704 $313,848 32 35,342 $686,905 60 53,046 $1,000,753
Agricultural Lands - SD 1 2,207 $40,000 2 85 $2,316 3 2,292 $42,316
NIPF - BF --i --
i --
i 1 600 $10,371 1 600 $10,371
NIPF 12 3,281 $25,212 11 3,056 $42,556 23 6,337 $67,768
NIPF - SD --i --
i --
i 1 70 $2,519 1 70 $2,519
GEORGIA 166 90,850 $2,019,639 418 264,056 $8,225,960 584 354,906 $10,245,599
Agricultural Lands - BF 1 67 $2,497 5 455 $21,985 6 522 $24,482
Agricultural Lands 86 49,384 $1,647,551 221 135,602 $6,231,075 307 184,985 $7,878,626
Agricultural Lands - SD 4 563 $15,129 11 3,725 $112,923 15 4,288 $128,052

CStP FY2010_Appendix_Modified_Final_2-14-2012.docx
64
Table A 4. CSP Contracts, Acres, and Obligations by State and Pool Category, FY 2010
CSP-2010-1 CSP-2010-2 Totals
STATES Contracts Acres Obligations Contracts Acres Obligations Contracts Acres Obligations
NIPF - BF 3 348 $3,093 6 145 $6,000 9 493 $9,093
NIPF 72 40,489 $351,369 172 123,714 $1,843,969 244 164,203 $2,195,338
NIPF - SD --i --
i --
i 3 415 $10,008 3 415 $10,008
HAWAII 5 5,503 $66,783 11 1,594 $39,090 16 7,098 $105,873
Agricultural Lands - BF 1 19 $473 1 5 $1,000 2 23 $1,473
Agricultural Lands 2 5,376 $61,804 0 0 $0 2 5,376 $61,804
Agricultural Lands - SD 2 109 $4,506 10 1,590 $38,090 12 1,698 $42,596
IDAHO 92 97,751 $1,655,466 110 253,335 $2,487,573 202 351,087 $4,143,039
Agricultural Lands - BF 11 11,030 $185,631 12 7,869 $141,851 23 18,899 $327,482
Agricultural Lands 69 77,982 $1,394,288 85 187,030 $2,055,857 154 265,012 $3,450,145
Agricultural Lands - SD --i --
i --
i 1 402 $2,370 1 402 $2,370
NIPF - BF --i --
i --
i 1 281 $3,820 1 281 $3,820
NIPF 12 8,739 $75,547 10 4,639 $50,181 22 13,378 $125,728
NIPF - SD --i --
i --
i 1 53,114 $233,494 1 53,114 $233,494
ILLINOIS 265 175,941 $4,018,047 277 226,756 $4,678,677 542 402,697 $8,696,724
Agricultural Lands - BF 6 3,420 $93,783 6 2,105 $36,634 12 5,526 $130,417
Agricultural Lands 236 169,577 $3,906,641 249 222,540 $4,622,314 485 392,116 $8,528,955
Agricultural Lands - SD --i --
i --
i 1 429 $9,554 1 429 $9,554
NIPF 23 2,945 $17,623 21 1,683 $10,175 44 4,627 $27,798
INDIANA 148 103,901 $2,654,331 160 107,664 $2,558,464 308 211,565 $5,212,795
Agricultural Lands - BF 6 1,586 $44,182 6 609 $11,580 12 2,196 $55,762
Agricultural Lands 129 99,751 $2,594,035 146 106,356 $2,541,712 275 206,108 $5,135,747
NIPF - BF --i --
i --
i 2 229 $2,000 2 229 $2,000
NIPF 13 2,563 $16,114 6 469 $3,172 19 3,032 $19,286
IOWA 729 369,263 $9,338,245 751 428,342 $10,917,329 1,480 797,605 $20,255,574
Agricultural Lands - BF 39 8,572 $240,055 44 12,373 $280,726 83 20,945 $520,781
Agricultural Lands 671 358,492 $9,084,553 685 412,578 $10,593,946 1,356 771,070 $19,678,499
Agricultural Lands - SD --i --
i --
i 3 412 $6,661 3 412 $6,661
NIPF - BF --i --
i --
i 1 120 $4,530 1 120 $4,530
NIPF 19 2,199 $13,637 17 2,836 $30,466 36 5,035 $44,103
NIPF - SD --i --
i --
i 1 24 $1,000 1 24 $1,000
KANSAS 454 492,690 $7,453,148 418 723,725 $10,547,462 872 1,216,415 $18,000,610
Agricultural Lands - BF 18 15,187 $238,069 40 33,419 $556,916 58 48,606 $794,985
Agricultural Lands 434 477,349 $7,214,036 375 690,112 $9,989,148 809 1,167,460 $17,203,184
NIPF 2 154 $1,043 3 195 $1,398 5 349 $2,441
KENTUCKY 83 29,899 $386,791 99 32,212 $541,734 182 62,111 $928,525
Agricultural Lands - BF 1 53 $1,182 3 1,459 $70,011 4 1,512 $71,193
Agricultural Lands 50 15,114 $289,325 63 19,011 $378,074 113 34,126 $667,399
Agricultural Lands - SD --i --
i --
i 1 87 $2,260 1 87 $2,260
NIPF - BF 2 172 $1,150 2 1,024 $11,349 4 1,196 $12,499
NIPF 30 14,559 $95,134 30 10,631 $80,040 60 25,190 $175,174
LOUISIANA 196 143,933 $2,338,512 125 121,007 $3,216,217 321 264,940 $5,554,729
Agricultural Lands - BF 9 3,474 $68,590 10 5,855 $162,591 19 9,329 $231,181
Agricultural Lands 125 115,523 $2,086,749 93 107,775 $2,931,665 218 223,298 $5,018,414
Agricultural Lands - SD 7 638 $10,870 2 1,347 $43,268 9 1,985 $54,138
NIPF - BF 8 750 $5,024 5 331 $7,019 13 1,081 $12,043
NIPF 46 23,388 $165,646 14 5,680 $70,674 60 29,068 $236,320
NIPF - SD 1 160 $1,633 1 20 $1,000 2 180 $2,633
MAINE 59 56,949 $340,711 43 13,432 $187,683 102 70,381 $528,394
Agricultural Lands - BF 3 397 $12,541 6 147 $9,381 9 544 $21,922
Agricultural Lands 15 5,737 $137,680 11 3,137 $86,551 26 8,874 $224,231
Agricultural Lands - SD 1 1,709 $41,894 0 0 $0 1 1,709 $41,894
NIPF - BF 6 33,803 $50,106 8 890 $8,839 14 34,693 $58,945

CStP FY2010_Appendix_Modified_Final_2-14-2012.docx
65
Table A 4. CSP Contracts, Acres, and Obligations by State and Pool Category, FY 2010
CSP-2010-1 CSP-2010-2 Totals
STATES Contracts Acres Obligations Contracts Acres Obligations Contracts Acres Obligations
NIPF 34 15,305 $98,490 17 9,061 $81,650 51 24,365 $180,140
NIPF - SD --i --
i --
i 1 196 $1,262 1 196 $1,262
MARYLAND 37 11,426 $286,493 28 12,823 $455,421 65 24,249 $741,914
Agricultural Lands - BF 2 74 $1,227 1 639 $19,048 3 713 $20,275
Agricultural Lands 25 10,520 $278,757 22 11,800 $434,845 47 22,321 $713,602
Agricultural Lands - SD 2 32 $834 0 0 $0 2 32 $834
NIPF - BF 1 93 $990 0 0 $0 1 93 $990
NIPF 6 691 $4,606 5 384 $1,528 11 1,075 $6,134
NIPF - SD 1 16 $79 0 0 $0 1 16 $79
MASSACHUSETTS 4 1,826 $18,112 7 5,498 $40,023 11 7,324 $58,135
Agricultural Lands - BF 1 159 $3,418 0 0 $0 1 159 $3,418
Agricultural Lands 1 232 $6,273 2 261 $18,161 3 493 $24,434
NIPF - BF 1 256 $1,174 0 0 $0 1 256 $1,174
NIPF 1 1,179 $7,247 5 5,237 $21,862 6 6,416 $29,109
MICHIGAN 271 104,847 $2,206,112 273 125,117 $2,472,219 544 229,963 $4,678,331
Agricultural Lands - BF 8 2,649 $77,609 12 3,596 $91,792 20 6,245 $169,401
Agricultural Lands 139 73,768 $1,892,714 159 97,029 $2,131,902 298 170,797 $4,024,616
NIPF - BF 2 254 $953 5 5,753 $46,784 7 6,008 $47,737
NIPF 120 24,054 $194,610 97 18,739 $201,741 217 42,793 $396,351
NIPF - SD 2 4,121 $40,226 0 0 $0 2 4,121 $40,226
MINNESOTA 906 467,660 $9,931,338 669 448,101 $11,445,982 1,575 915,761 $21,377,320
Agricultural Lands - BF 53 19,436 $545,490 79 32,726 $959,281 132 52,162 $1,504,771
Agricultural Lands 592 388,924 $8,962,431 427 368,923 $10,045,461 1,019 757,847 $19,007,892
Agricultural Lands - SD 3 2,450 $70,189 4 5,096 $89,940 7 7,545 $160,129
NIPF - BF 15 1,953 $15,598 21 5,955 $65,864 36 7,908 $81,462
NIPF 240 37,255 $250,259 136 34,944 $283,394 376 72,199 $533,653
NIPF - SD 3 17,643 $87,371 2 457 $2,042 5 18,100 $89,413
MISSISSIPPI 125 92,961 $1,325,765 194 259,304 $7,654,309 319 352,265 $8,980,074
Agricultural Lands - BF 1 2,812 $40,000 12 9,181 $346,770 13 11,993 $386,770
Agricultural Lands 56 65,750 $1,128,909 136 232,514 $7,047,884 192 298,264 $8,176,793
Agricultural Lands - SD 2 588 $16,761 13 2,917 $95,860 15 3,505 $112,621
NIPF - BF --i --
i --
i 3 389 $8,470 3 389 $8,470
NIPF 65 23,445 $138,374 29 14,241 $154,325 94 37,687 $292,699
NIPF - SD 1 366 $1,721 1 62 $1,000 2 428 $2,721
MISSOURI 1,006 502,674 $8,233,641 933 473,327 $8,323,828 1,939 976,001 $16,557,469
Agricultural Lands - BF 54 12,582 $260,144 61 13,252 $273,664 115 25,834 $533,808
Agricultural Lands 711 420,920 $7,627,105 667 401,246 $7,762,111 1,378 822,167 $15,389,216
Agricultural Lands - SD 5 578 $9,808 7 1,573 $32,211 12 2,151 $42,019
NIPF - BF 21 3,426 $19,137 56 9,992 $76,749 77 13,418 $95,886
NIPF 214 65,102 $317,189 137 47,069 $174,093 351 112,171 $491,282
NIPF - SD 1 66 $258 5 195 $5,000 6 262 $5,258
MONTANA 222 926,476 $6,743,828 264 883,579 $8,322,708 486 1,810,055 $15,066,536
Agricultural Lands - BF 16 23,576 $293,276 27 44,851 $577,470 43 68,427 $870,746
Agricultural Lands 188 871,270 $6,212,345 214 803,620 $7,475,144 402 1,674,890 $13,687,489
Agricultural Lands - SD 4 14,370 $107,923 6 17,884 $149,670 10 32,254 $257,593
NIPF - BF 1 1,419 $11,410 3 3,162 $22,906 4 4,581 $34,316
NIPF 13 15,841 $118,874 13 13,780 $94,805 26 29,621 $213,679
NIPF - SD --i --
i --
i 1 282 $2,713 1 282 $2,713
NEBRASKA 571 783,914 $8,900,070 535 1,053,015 $11,252,464 1,106 1,836,928 $20,152,534
Agricultural Lands - BF 85 73,352 $715,731 49 66,627 $676,545 134 139,979 $1,392,276
Agricultural Lands 448 704,065 $8,134,023 483 985,301 $10,560,704 931 1,689,365 $18,694,727
Agricultural Lands - SD 1 2,308 $17,845 0 0 $0 1 2,308 $17,845
NIPF - BF 2 31 $140 0 0 $0 2 31 $140
NIPF 35 4,158 $32,331 3 1,087 $15,215 38 5,245 $47,546
NEVADA 4 12,918 $145,109 13 10,911 $155,015 17 23,829 $300,124

CStP FY2010_Appendix_Modified_Final_2-14-2012.docx
66
Table A 4. CSP Contracts, Acres, and Obligations by State and Pool Category, FY 2010
CSP-2010-1 CSP-2010-2 Totals
STATES Contracts Acres Obligations Contracts Acres Obligations Contracts Acres Obligations
Agricultural Lands 4 12,918 $145,109 13 10,911 $155,015 17 23,829 $300,124
NEW HAMPSHIRE 12 2,304 $35,780 5 1,126 $10,870 17 3,430 $46,650
Agricultural Lands - BF 1 86 $1,421 0 0 $0 1 86 $1,421
Agricultural Lands 7 1,112 $27,543 2 599 $8,066 9 1,710 $35,609
Agricultural Lands - SD --i --
i --
i 1 91 $1,434 1 91 $1,434
NIPF 4 1,107 $6,816 1 192 $370 5 1,299 $7,186
NIPF - SD --i --
i --
i 1 244 $1,000 1 244 $1,000
NEW JERSEY --i --
i --
i 9 2,468 $71,225 9 2,468 $71,225
Agricultural Lands - BF --i --
i --
i 3 698 $15,149 3 698 $15,149
Agricultural Lands --i --
i --
i 6 1,770 $56,076 6 1,770 $56,076
NEW MEXICO 111 936,871 $3,160,535 61 541,869 $2,252,217 172 1,478,740 $5,412,752
Agricultural Lands - BF 13 72,018 $295,764 3 10,990 $84,873 16 83,008 $380,637
Agricultural Lands 75 657,964 $2,378,556 49 460,706 $1,748,109 124 1,118,670 $4,126,665
Agricultural Lands - SD 14 172,714 $301,234 7 48,723 $255,999 21 221,437 $557,233
NIPF - BF --i --
i --
i 1 55 $1,000 1 55 $1,000
NIPF 9 34,175 $184,981 0 0 $0 9 34,175 $184,981
NIPF - SD --i --
i --
i 1 21,395 $162,236 1 21,395 $162,236
NEW YORK 154 77,201 $1,642,775 167 82,401 $1,644,857 321 159,602 $3,287,632
Agricultural Lands - BF 9 940 $23,823 4 318 $5,723 13 1,258 $29,546
Agricultural Lands 90 62,296 $1,522,301 89 68,652 $1,522,187 179 130,948 $3,044,488
Agricultural Lands - SD 2 233 $4,525 0 0 $0 2 233 $4,525
NIPF - BF 11 1,017 $6,281 12 1,282 $12,221 23 2,298 $18,502
NIPF 42 12,715 $85,845 62 12,149 $104,726 104 24,864 $190,571
NORTH CAROLINA 64 27,406 $440,251 103 40,008 $613,839 167 67,414 $1,054,090
Agricultural Lands - BF 3 736 $19,149 2 45 $2,000 5 781 $21,149
Agricultural Lands 37 19,245 $378,360 58 20,949 $503,242 95 40,194 $881,602
Agricultural Lands - SD --i --
i --
i 1 25 $1,000 1 25 $1,000
NIPF - BF 1 250 $1,337 1 44 $1,000 2 294 $2,337
NIPF 23 7,174 $41,405 41 18,945 $106,597 64 26,119 $148,002
NORTH DAKOTA 301 616,913 $9,134,784 326 663,817 $10,351,937 627 1,280,729 $19,486,721
Agricultural Lands - BF 19 29,417 $506,057 45 55,402 $1,147,444 64 84,819 $1,653,501
Agricultural Lands 280 585,174 $8,588,194 277 600,222 $9,162,443 557 1,185,396 $17,750,637
Agricultural Lands - SD 1 2,242 $40,000 1 7,746 $40,000 2 9,988 $80,000
NIPF 1 80 $533 3 446 $2,050 4 526 $2,583
OHIO 234 83,881 $1,968,151 90 43,951 $1,045,532 324 127,833 $3,013,683
Agricultural Lands - BF 4 572 $19,744 3 399 $11,794 7 971 $31,538
Agricultural Lands 170 75,571 $1,896,496 61 38,532 $961,211 231 114,104 $2,857,707
NIPF - BF 4 441 $3,422 2 379 $2,024 6 820 $5,446
NIPF 56 7,297 $48,489 24 4,641 $70,503 80 11,938 $118,992
OKLAHOMA 462 546,971 $7,531,213 456 590,901 $8,644,686 918 1,137,871 $16,175,899
Agricultural Lands - BF 29 18,663 $362,826 39 23,946 $428,415 68 42,609 $791,241
Agricultural Lands 397 498,943 $6,829,090 343 510,033 $7,368,139 740 1,008,977 $14,197,229
Agricultural Lands - SD 21 14,319 $276,070 60 47,987 $745,229 81 62,306 $1,021,299
NIPF - BF 1 77 $442 0 0 $0 1 77 $442
NIPF 13 14,899 $62,178 11 8,766 $98,078 24 23,665 $160,256
NIPF - SD 1 70 $607 3 168 $4,825 4 238 $5,432
OREGON 201 350,626 $2,941,938 171 490,752 $4,609,739 372 841,378 $7,551,677
Agricultural Lands - BF 17 37,185 $248,319 27 37,181 $558,926 44 74,366 $807,245
Agricultural Lands 110 223,785 $1,980,165 103 388,480 $3,122,612 213 612,265 $5,102,777
Agricultural Lands - SD 5 13,712 $164,161 4 5,031 $42,459 9 18,743 $206,620
NIPF - BF 4 1,566 $11,698 3 5,129 $81,000 7 6,695 $92,698
NIPF 64 74,294 $536,625 31 36,200 $349,088 95 110,494 $885,713
NIPF - SD 1 83 $970 3 18,731 $455,654 4 18,814 $456,624
PENNSYLVANIA 265 69,237 $1,662,495 300 96,864 $2,311,722 565 166,101 $3,974,217
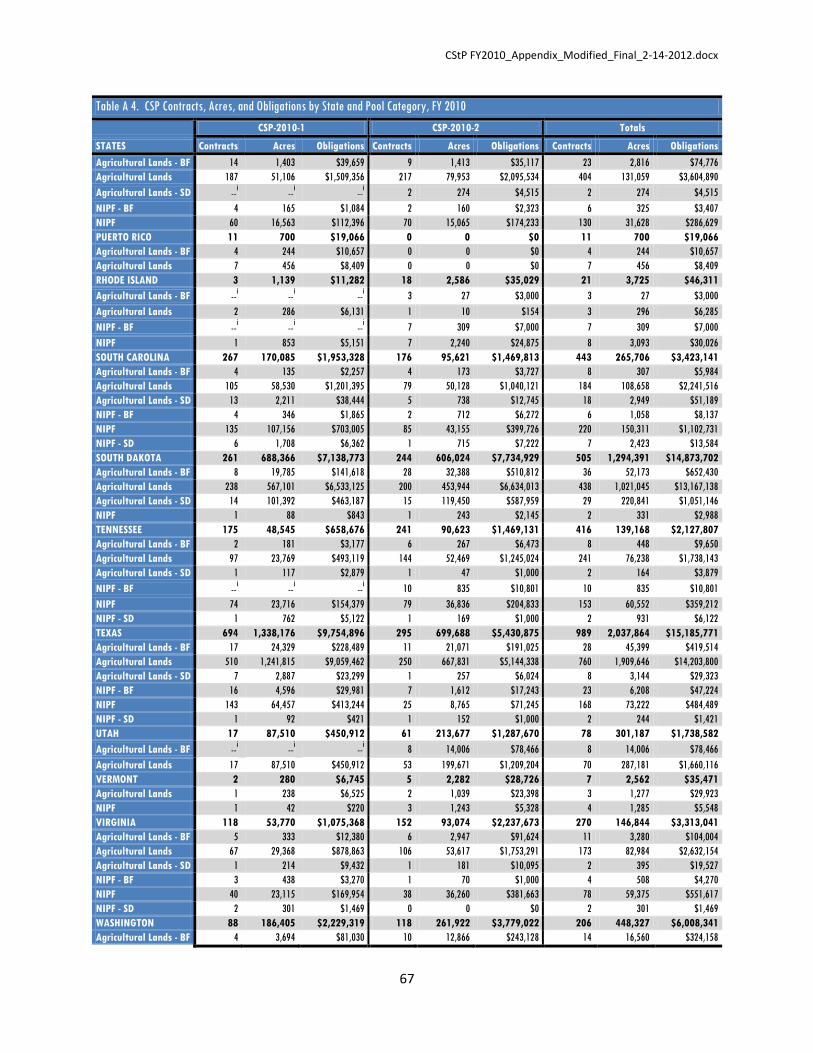
CStP FY2010_Appendix_Modified_Final_2-14-2012.docx
67
Table A 4. CSP Contracts, Acres, and Obligations by State and Pool Category, FY 2010
CSP-2010-1 CSP-2010-2 Totals
STATES Contracts Acres Obligations Contracts Acres Obligations Contracts Acres Obligations
Agricultural Lands - BF 14 1,403 $39,659 9 1,413 $35,117 23 2,816 $74,776
Agricultural Lands 187 51,106 $1,509,356 217 79,953 $2,095,534 404 131,059 $3,604,890
Agricultural Lands - SD --i --
i --
i 2 274 $4,515 2 274 $4,515
NIPF - BF 4 165 $1,084 2 160 $2,323 6 325 $3,407
NIPF 60 16,563 $112,396 70 15,065 $174,233 130 31,628 $286,629
PUERTO RICO 11 700 $19,066 0 0 $0 11 700 $19,066
Agricultural Lands - BF 4 244 $10,657 0 0 $0 4 244 $10,657
Agricultural Lands 7 456 $8,409 0 0 $0 7 456 $8,409
RHODE ISLAND 3 1,139 $11,282 18 2,586 $35,029 21 3,725 $46,311
Agricultural Lands - BF --i --
i --
i 3 27 $3,000 3 27 $3,000
Agricultural Lands 2 286 $6,131 1 10 $154 3 296 $6,285
NIPF - BF --i --
i --
i 7 309 $7,000 7 309 $7,000
NIPF 1 853 $5,151 7 2,240 $24,875 8 3,093 $30,026
SOUTH CAROLINA 267 170,085 $1,953,328 176 95,621 $1,469,813 443 265,706 $3,423,141
Agricultural Lands - BF 4 135 $2,257 4 173 $3,727 8 307 $5,984
Agricultural Lands 105 58,530 $1,201,395 79 50,128 $1,040,121 184 108,658 $2,241,516
Agricultural Lands - SD 13 2,211 $38,444 5 738 $12,745 18 2,949 $51,189
NIPF - BF 4 346 $1,865 2 712 $6,272 6 1,058 $8,137
NIPF 135 107,156 $703,005 85 43,155 $399,726 220 150,311 $1,102,731
NIPF - SD 6 1,708 $6,362 1 715 $7,222 7 2,423 $13,584
SOUTH DAKOTA 261 688,366 $7,138,773 244 606,024 $7,734,929 505 1,294,391 $14,873,702
Agricultural Lands - BF 8 19,785 $141,618 28 32,388 $510,812 36 52,173 $652,430
Agricultural Lands 238 567,101 $6,533,125 200 453,944 $6,634,013 438 1,021,045 $13,167,138
Agricultural Lands - SD 14 101,392 $463,187 15 119,450 $587,959 29 220,841 $1,051,146
NIPF 1 88 $843 1 243 $2,145 2 331 $2,988
TENNESSEE 175 48,545 $658,676 241 90,623 $1,469,131 416 139,168 $2,127,807
Agricultural Lands - BF 2 181 $3,177 6 267 $6,473 8 448 $9,650
Agricultural Lands 97 23,769 $493,119 144 52,469 $1,245,024 241 76,238 $1,738,143
Agricultural Lands - SD 1 117 $2,879 1 47 $1,000 2 164 $3,879
NIPF - BF --i --
i --
i 10 835 $10,801 10 835 $10,801
NIPF 74 23,716 $154,379 79 36,836 $204,833 153 60,552 $359,212
NIPF - SD 1 762 $5,122 1 169 $1,000 2 931 $6,122
TEXAS 694 1,338,176 $9,754,896 295 699,688 $5,430,875 989 2,037,864 $15,185,771
Agricultural Lands - BF 17 24,329 $228,489 11 21,071 $191,025 28 45,399 $419,514
Agricultural Lands 510 1,241,815 $9,059,462 250 667,831 $5,144,338 760 1,909,646 $14,203,800
Agricultural Lands - SD 7 2,887 $23,299 1 257 $6,024 8 3,144 $29,323
NIPF - BF 16 4,596 $29,981 7 1,612 $17,243 23 6,208 $47,224
NIPF 143 64,457 $413,244 25 8,765 $71,245 168 73,222 $484,489
NIPF - SD 1 92 $421 1 152 $1,000 2 244 $1,421
UTAH 17 87,510 $450,912 61 213,677 $1,287,670 78 301,187 $1,738,582
Agricultural Lands - BF --i --
i --
i 8 14,006 $78,466 8 14,006 $78,466
Agricultural Lands 17 87,510 $450,912 53 199,671 $1,209,204 70 287,181 $1,660,116
VERMONT 2 280 $6,745 5 2,282 $28,726 7 2,562 $35,471
Agricultural Lands 1 238 $6,525 2 1,039 $23,398 3 1,277 $29,923
NIPF 1 42 $220 3 1,243 $5,328 4 1,285 $5,548
VIRGINIA 118 53,770 $1,075,368 152 93,074 $2,237,673 270 146,844 $3,313,041
Agricultural Lands - BF 5 333 $12,380 6 2,947 $91,624 11 3,280 $104,004
Agricultural Lands 67 29,368 $878,863 106 53,617 $1,753,291 173 82,984 $2,632,154
Agricultural Lands - SD 1 214 $9,432 1 181 $10,095 2 395 $19,527
NIPF - BF 3 438 $3,270 1 70 $1,000 4 508 $4,270
NIPF 40 23,115 $169,954 38 36,260 $381,663 78 59,375 $551,617
NIPF - SD 2 301 $1,469 0 0 $0 2 301 $1,469
WASHINGTON 88 186,405 $2,229,319 118 261,922 $3,779,022 206 448,327 $6,008,341
Agricultural Lands - BF 4 3,694 $81,030 10 12,866 $243,128 14 16,560 $324,158

CStP FY2010_Appendix_Modified_Final_2-14-2012.docx
68
Table A 4. CSP Contracts, Acres, and Obligations by State and Pool Category, FY 2010
CSP-2010-1 CSP-2010-2 Totals
STATES Contracts Acres Obligations Contracts Acres Obligations Contracts Acres Obligations
Agricultural Lands 79 179,422 $2,112,519 94 238,815 $3,408,350 173 418,237 $5,520,869
Agricultural Lands - SD 1 521 $12,936 2 358 $4,521 3 879 $17,457
NIPF - BF --i --
i --
i 1 40 $1,000 1 40 $1,000
NIPF 4 2,768 $22,834 11 9,844 $122,023 15 12,611 $144,857
WEST VIRGINIA 76 18,517 $243,310 177 54,928 $537,102 253 73,445 $780,412
Agricultural Lands - BF 3 176 $3,801 13 904 $26,889 16 1,080 $30,690
Agricultural Lands 42 7,987 $170,109 87 16,282 $361,390 129 24,269 $531,499
Agricultural Lands - SD --i --
i --
i 3 316 $6,939 3 316 $6,939
NIPF - BF 4 853 $7,432 9 1,010 $10,075 13 1,863 $17,507
NIPF 27 9,501 $61,968 64 36,379 $130,809 91 45,880 $192,777
NIPF - SD --i --
i --
i 1 37 $1,000 1 37 $1,000
WISCONSIN 516 171,981 $3,355,623 452 188,009 $3,294,572 968 359,990 $6,650,195
Agricultural Lands - BF 14 2,266 $41,786 26 6,281 $153,319 40 8,547 $195,105
Agricultural Lands 388 150,277 $3,204,386 324 160,753 $3,048,697 712 311,030 $6,253,083
Agricultural Lands - SD 1 114 $1,919 1 752 $9,989 2 866 $11,908
NIPF - BF 2 139 $752 7 436 $7,000 9 575 $7,752
NIPF 110 19,163 $106,664 94 19,787 $75,567 204 38,950 $182,231
NIPF - SD 1 22 $116 0 0 $0 1 22 $116
WYOMING 75 522,209 $2,062,062 102 391,134 $2,528,700 177 913,343 $4,590,762
Agricultural Lands - BF 2 1,454 $28,366 1 220 $6,044 3 1,674 $34,410
Agricultural Lands 71 518,555 $2,011,488 101 390,914 $2,522,656 172 909,468 $4,534,144
NIPF - BF 1 158 $1,546 0 0 $0 1 158 $1,546
NIPF 1 2,043 $20,662 0 0 $0 1 2,043 $20,662
GRAND TOTAL 10,612 12,606,679 $144,782,194 9,955 12,557,648 $175,617,696 20,567 25,164,327 $320,399,890 aActive contracts as of September 30, 2010.
bIncludes 6 CCPI-MRBI contracts (10,492 acres and $175,312).
cIncludes 6 CCPI-MRBI contracts (7,461acres and $120,504).
dIncludes 1 CCPI-MRBI contract (33 acres and $734).
eIncludes 22 CCPI-MRBI contracts (18,015 acres and $481,988).
fIncludes 1 CCPI-MRBI contract (1,113 acres and $47,499).
gIncludes 4 CCPI contracts (4,091 acres and $73,308).
hIncludes 9 CCPI-MRBI contracts (5,735 acres and $88,159).
iNot applicable.
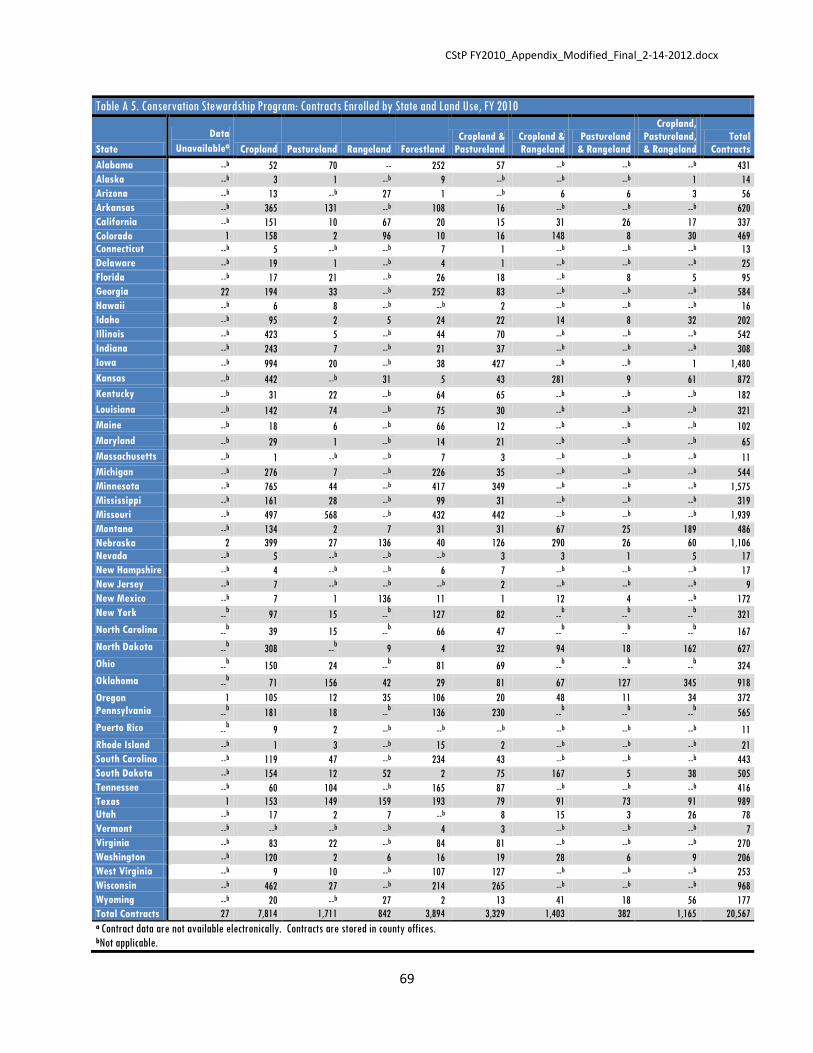
CStP FY2010_Appendix_Modified_Final_2-14-2012.docx
69
Table A 5. Conservation Stewardship Program: Contracts Enrolled by State and Land Use, FY 2010
State
Data
Unavailablea Cropland Pastureland Rangeland Forestland
Cropland &
Pastureland
Cropland &
Rangeland
Pastureland
& Rangeland
Cropland,
Pastureland,
& Rangeland
Total
Contracts
Alabama --b 52 70 -- 252 57 --b --b --b 431
Alaska --b 3 1 --b 9 --b --b --b 1 14
Arizona --b 13 --b 27 1 --b 6 6 3 56
Arkansas --b 365 131 --b 108 16 --b --b --b 620
California --b 151 10 67 20 15 31 26 17 337
Colorado 1 158 2 96 10 16 148 8 30 469
Connecticut --b 5 --b --b 7 1 --b --b --b 13
Delaware --b 19 1 --b 4 1 --b --b --b 25
Florida --b 17 21 --b 26 18 --b 8 5 95
Georgia 22 194 33 --b 252 83 --b --b --b 584
Hawaii --b 6 8 --b --b 2 --b --b --b 16
Idaho --b 95 2 5 24 22 14 8 32 202
Illinois --b 423 5 --b 44 70 --b --b --b 542
Indiana --b 243 7 --b 21 37 --b --b --b 308
Iowa --b 994 20 --b 38 427 --b --b 1 1,480
Kansas --b 442 --b 31 5 43 281 9 61 872
Kentucky --b 31 22 --b 64 65 --b --b --b 182
Louisiana --b 142 74 --b 75 30 --b --b --b 321
Maine --b 18 6 --b 66 12 --b --b --b 102
Maryland --b 29 1 --b 14 21 --b --b --b 65
Massachusetts --b 1 --b --b 7 3 --b --b --b 11
Michigan --b 276 7 --b 226 35 --b --b --b 544
Minnesota --b 765 44 --b 417 349 --b --b --b 1,575
Mississippi --b 161 28 --b 99 31 --b --b --b 319
Missouri --b 497 568 --b 432 442 --b --b --b 1,939
Montana --b 134 2 7 31 31 67 25 189 486
Nebraska 2 399 27 136 40 126 290 26 60 1,106
Nevada --b 5 --b --b --b 3 3 1 5 17
New Hampshire --b 4 --b --b 6 7 --b --b --b 17
New Jersey --b 7 --b --b --b 2 --b --b --b 9
New Mexico --b 7 1 136 11 1 12 4 --b 172
New York --b 97 15 --
b 127 82 --
b --
b --
b 321
North Carolina --b 39 15 --
b 66 47 --
b --
b --
b 167
North Dakota --b 308 --
b 9 4 32 94 18 162 627
Ohio --b 150 24 --
b 81 69 --
b --
b --
b 324
Oklahoma --b 71 156 42 29 81 67 127 345 918
Oregon 1 105 12 35 106 20 48 11 34 372
Pennsylvania --b 181 18 --
b 136 230 --
b --
b --
b 565
Puerto Rico --b 9 2 --b --b --b --b --b --b 11
Rhode Island --b 1 3 --b 15 2 --b --b --b 21
South Carolina --b 119 47 --b 234 43 --b --b --b 443
South Dakota --b 154 12 52 2 75 167 5 38 505
Tennessee --b 60 104 --b 165 87 --b --b --b 416
Texas 1 153 149 159 193 79 91 73 91 989
Utah --b 17 2 7 --b 8 15 3 26 78
Vermont --b --b --b --b 4 3 --b --b --b 7
Virginia --b 83 22 --b 84 81 --b --b --b 270
Washington --b 120 2 6 16 19 28 6 9 206
West Virginia --b 9 10 --b 107 127 --b --b --b 253
Wisconsin --b 462 27 --b 214 265 --b --b --b 968
Wyoming --b 20 --b 27 2 13 41 18 56 177
Total Contracts 27 7,814 1,711 842 3,894 3,329 1,403 382 1,165 20,567 a
Contract data are not available electronically. Contracts are stored in county offices. bNot applicable.

CStP FY2010_Appendix_Modified_Final_2-14-2012.docx
70
Table A 6. Conservation Stewardship Program: Acres Enrolled by State and Land Use, FY 2010
State
Data
Unavailable a Cropland Pastureland Rangeland Forestland
Cropland &
Pastureland
Cropland &
Rangeland
Pastureland
& Rangeland
Cropland,
Pastureland,
& Rangeland Total Acres
Alabama --b 33,896 26,163 --b 241,523 47,323 --b --b --b 348,905
Alaska --b 3,189 503 --b 177,957 --b --b --b 917 182,565
Arizona --b 10,501 --b 644,070 48,000 --b 69,235 42,113 7,724 821,643
Arkansas --b 464,727 44,743 --b 47,278 12,771 --b --b --b 569,519
California --b 101,879 6,228 329,329 62,774 6,429 60,059 79,404 75,027 721,128
Colorado 549 250,860 192 437,913 2,980 9,006 489,145 13,155 60,577 1,264,376
Connecticut --b 656 --b --b 7,598 212 --b --b --b 8,467
Delaware --b 13,201 219 --b 1,020 9 --b --b --b 14,448
Florida --b 6,556 8,358 --b 9,081 10,005 --b 23,018 8,261 65,279
Georgia 22,561 122,369 5,275 --b 156,788 47,913 --b --b --b 354,906
Hawaii --b 131 6,930 --b --b 37 --b --b --b 7,098
Idaho --b 125,764 260 8,822 66,773 17,647 22,823 40,857 68,142 351,087
Illinois --b 340,344 541 --b 4,627 57,185 --b --b --b 402,697
Indiana --b 182,027 734 --b 3,261 25,543 --b --b --b 211,565
Iowa --b 528,603 3,797 --b 5,200 258,424 --b --b 1,581 797,605
Kansas --b 431,794 --b 51,027 349 42,278 582,364 11,800 96,803 1,216,415
Kentucky --b 9,300 3,807 --b 26,386 22,618 --b --b --b 62,111
Louisiana --b 182,077 24,988 --b 30,329 27,546 --b --b --b 264,940
Maine --b 8,266 189 --b 59,254 2,672 --b --b --b 70,381
Maryland --b 15,259 40 --b 1,203 7,748 --b --b --b 24,249
Massachusetts --b 208 --b --b 6,672 444 --b --b --b 7,324
Michigan --b 166,240 1,687 --b 52,921 9,116 --b --b --b 229,963
Minnesota --b 629,294 12,440 --b 98,207 175,820 --b --b --b 915,761
Mississippi --b 284,471 5,944 --b 38,504 23,346 --b --b --b 352,265
Missouri --b 364,323 178,831 --b 125,199 307,648 --b --b --b 976,001
Montana --b 279,160 326 54,929 34,484 22,644 286,539 109,269 1,022,705 1,810,055
Nebraska 1,832 275,186 3,504 377,133 5,276 96,097 883,409 51,968 142,523 1,836,928
Nevada --b 3,512 --b --b --b 1,228 5,058 1,079 12,952 23,829
New Hampshire --b 447 --b --b 1,544 1,440 --b --b --b 3,430
New Jersey --b 2,236 --b --b --b 232 --b --b --b 2,468
New Mexico --b 4,107 47 1,362,013 55,625 146 25,784 31,019 --b 1,478,740
New York --b 83,703 1,996 --b 27,162 46,740 --b --b --b 159,602
North Carolina --b 27,499 1,879 --b 26,414 11,622 --b --b --b 67,414
North Dakota --b 496,828 --b 11,528 526 41,265 203,227 39,645 487,710 1,280,729
Ohio --b 89,555 1,705 --b 11,120 25,453 --b --b --b 127,833
Oklahoma --b 55,994 62,393 78,713 23,980 62,629 83,948 187,615 582,599 1,137,871
Oregon 1,716 129,327 1,200 125,983 136,003 6,097 214,544 69,053 157,455 841,378
Pennsylvania --b 69,947 1,148 --b 31,953 63,054 --b --b --b 166,101
Puerto Rico --b 566 134 --b --b --b --b --b --b 700
Rhode Island --b 12 174 --b 3,402 137 --b --b --b 3,725
South Carolina --b 82,449 5,958 --b 154,287 23,013 --b --b --b 265,706
South Dakota --b 199,436 4,976 288,409 331 101,939 576,211 12,606 110,483 1,294,391
Tennessee --b 42,835 11,640 --b 62,489 22,204 --b --b --b 139,168
Texas 248 141,047 63,907 1,014,517 79,675 67,373 255,120 142,820 273,159 2,037,864
Utah --b 18,141 161 29,962 --b 6,821 122,285 3,603 120,214 301,187
Vermont --b --b --b --b 1,285 1,277 --b --b --b 2,562
Virginia --b 49,299 2,812 --b 60,184 34,548 --b --b --b 146,844
Washington --b 228,589 543 27,854 12,651 14,351 109,482 17,882 36,975 448,327
West Virginia --b 600 838 --b 48,172 23,834 --b --b --b 73,445
Wisconsin --b 232,925 2,071 --b 39,547 85,447 --b --b --b 359,990
Wyoming --b 22,637 --b 235,173 2,201 10,789 220,933 134,345 287,264 913,343
Total Acres 26,906 6,811,971 499,279 5,077,374 2,092,196 1,882,115 4,210,166 1,011,251 3,553,070 25,164,327 a
Contract data are not available electronically. Contracts are stored in county offices. bNot applicable.
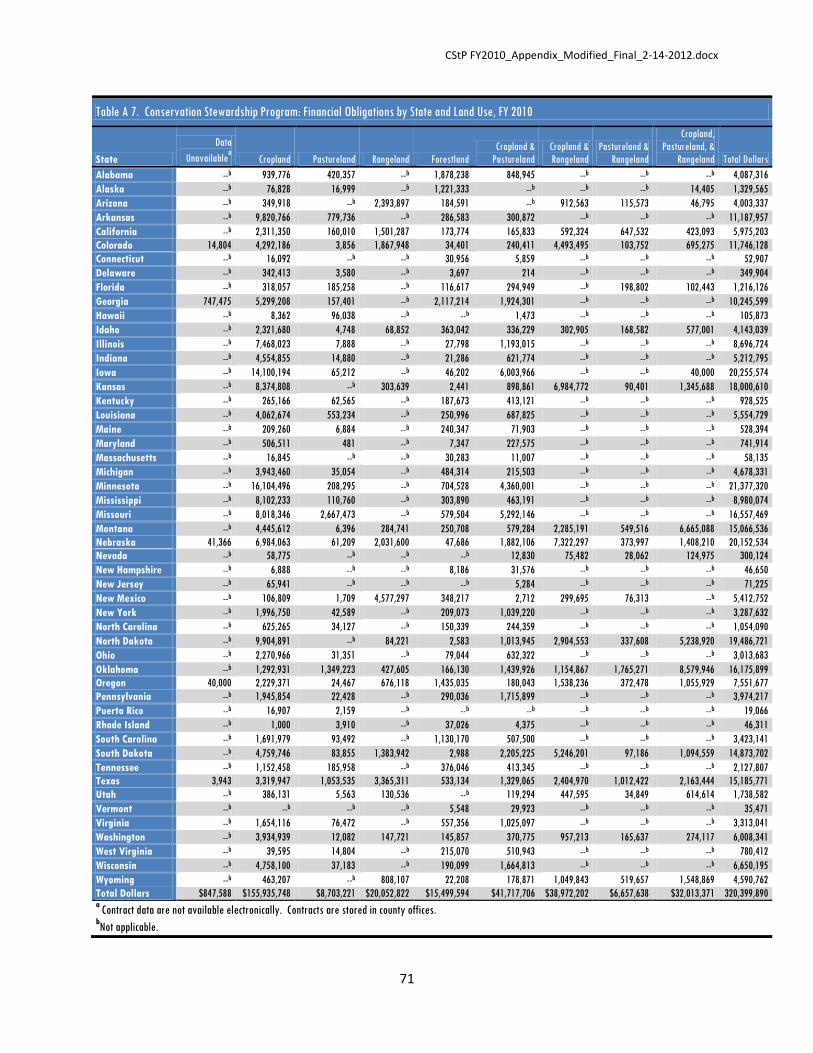
CStP FY2010_Appendix_Modified_Final_2-14-2012.docx
71
Table A 7. Conservation Stewardship Program: Financial Obligations by State and Land Use, FY 2010
State
Data
Unavailablea Cropland Pastureland Rangeland Forestland
Cropland &
Pastureland
Cropland &
Rangeland
Pastureland &
Rangeland
Cropland,
Pastureland, &
Rangeland Total Dollars
Alabama --b 939,776 420,357 --b 1,878,238 848,945 --b --b --b 4,087,316
Alaska --b 76,828 16,999 --b 1,221,333 --b --b --b 14,405 1,329,565
Arizona --b 349,918 --b 2,393,897 184,591 --b 912,563 115,573 46,795 4,003,337
Arkansas --b 9,820,766 779,736 --b 286,583 300,872 --b --b --b 11,187,957
California --b 2,311,350 160,010 1,501,287 173,774 165,833 592,324 647,532 423,093 5,975,203
Colorado 14,804 4,292,186 3,856 1,867,948 34,401 240,411 4,493,495 103,752 695,275 11,746,128
Connecticut --b 16,092 --b --b 30,956 5,859 --b --b --b 52,907
Delaware --b 342,413 3,580 --b 3,697 214 --b --b --b 349,904
Florida --b 318,057 185,258 --b 116,617 294,949 --b 198,802 102,443 1,216,126
Georgia 747,475 5,299,208 157,401 --b 2,117,214 1,924,301 --b --b --b 10,245,599
Hawaii --b 8,362 96,038 --b --b 1,473 --b --b --b 105,873
Idaho --b 2,321,680 4,748 68,852 363,042 336,229 302,905 168,582 577,001 4,143,039
Illinois --b 7,468,023 7,888 --b 27,798 1,193,015 --b --b --b 8,696,724
Indiana --b 4,554,855 14,880 --b 21,286 621,774 --b --b --b 5,212,795
Iowa --b 14,100,194 65,212 --b 46,202 6,003,966 --b --b 40,000 20,255,574
Kansas --b 8,374,808 --b 303,639 2,441 898,861 6,984,772 90,401 1,345,688 18,000,610
Kentucky --b 265,166 62,565 --b 187,673 413,121 --b --b --b 928,525
Louisiana --b 4,062,674 553,234 --b 250,996 687,825 --b --b --b 5,554,729
Maine --b 209,260 6,884 --b 240,347 71,903 --b --b --b 528,394
Maryland --b 506,511 481 --b 7,347 227,575 --b --b --b 741,914
Massachusetts --b 16,845 --b --b 30,283 11,007 --b --b --b 58,135
Michigan --b 3,943,460 35,054 --b 484,314 215,503 --b --b --b 4,678,331
Minnesota --b 16,104,496 208,295 --b 704,528 4,360,001 --b --b --b 21,377,320
Mississippi --b 8,102,233 110,760 --b 303,890 463,191 --b --b --b 8,980,074
Missouri --b 8,018,346 2,667,473 --b 579,504 5,292,146 --b --b --b 16,557,469
Montana --b 4,445,612 6,396 284,741 250,708 579,284 2,285,191 549,516 6,665,088 15,066,536
Nebraska 41,366 6,984,063 61,209 2,031,600 47,686 1,882,106 7,322,297 373,997 1,408,210 20,152,534
Nevada --b 58,775 --b --b --b 12,830 75,482 28,062 124,975 300,124
New Hampshire --b 6,888 --b --b 8,186 31,576 --b --b --b 46,650
New Jersey --b 65,941 --b --b --b 5,284 --b --b --b 71,225
New Mexico --b 106,809 1,709 4,577,297 348,217 2,712 299,695 76,313 --b 5,412,752
New York --b 1,996,750 42,589 --b 209,073 1,039,220 --b --b --b 3,287,632
North Carolina --b 625,265 34,127 --b 150,339 244,359 --b --b --b 1,054,090
North Dakota --b 9,904,891 --b 84,221 2,583 1,013,945 2,904,553 337,608 5,238,920 19,486,721
Ohio --b 2,270,966 31,351 --b 79,044 632,322 --b --b --b 3,013,683
Oklahoma --b 1,292,931 1,349,223 427,605 166,130 1,439,926 1,154,867 1,765,271 8,579,946 16,175,899
Oregon 40,000 2,229,371 24,467 676,118 1,435,035 180,043 1,538,236 372,478 1,055,929 7,551,677
Pennsylvania --b 1,945,854 22,428 --b 290,036 1,715,899 --b --b --b 3,974,217
Puerto Rico --b 16,907 2,159 --b --b --b --b --b --b 19,066
Rhode Island --b 1,000 3,910 --b 37,026 4,375 --b --b --b 46,311
South Carolina --b 1,691,979 93,492 --b 1,130,170 507,500 --b --b --b 3,423,141
South Dakota --b 4,759,746 83,855 1,383,942 2,988 2,205,225 5,246,201 97,186 1,094,559 14,873,702
Tennessee --b 1,152,458 185,958 --b 376,046 413,345 --b --b --b 2,127,807
Texas 3,943 3,319,947 1,053,535 3,365,311 533,134 1,329,065 2,404,970 1,012,422 2,163,444 15,185,771
Utah --b 386,131 5,563 130,536 --b 119,294 447,595 34,849 614,614 1,738,582
Vermont --b --b --b --b 5,548 29,923 --b --b --b 35,471
Virginia --b 1,654,116 76,472 --b 557,356 1,025,097 --b --b --b 3,313,041
Washington --b 3,934,939 12,082 147,721 145,857 370,775 957,213 165,637 274,117 6,008,341
West Virginia --b 39,595 14,804 --b 215,070 510,943 --b --b --b 780,412
Wisconsin --b 4,758,100 37,183 --b 190,099 1,664,813 --b --b --b 6,650,195
Wyoming --b 463,207 --b 808,107 22,208 178,871 1,049,843 519,657 1,548,869 4,590,762
Total Dollars $847,588 $155,935,748 $8,703,221 $20,052,822 $15,499,594 $41,717,706 $38,972,202 $6,657,638 $32,013,371 320,399,890 a
Contract data are not available electronically. Contracts are stored in county offices. bNot applicable.
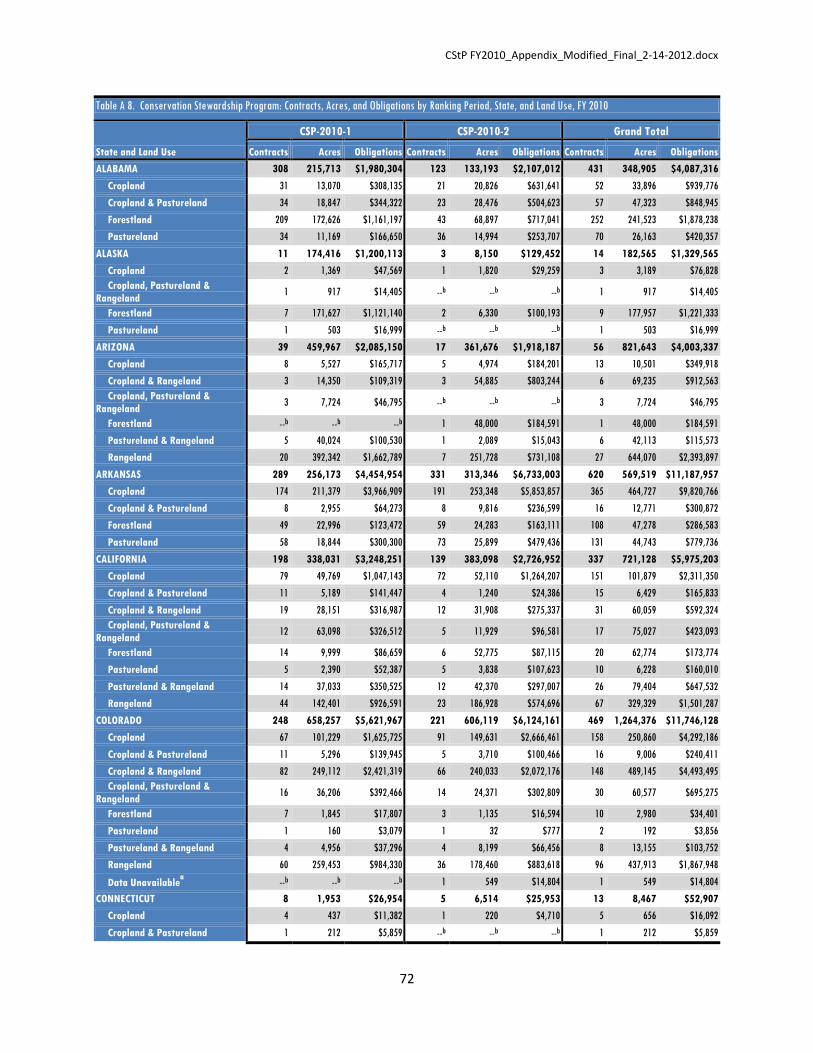
CStP FY2010_Appendix_Modified_Final_2-14-2012.docx
72
Table A 8. Conservation Stewardship Program: Contracts, Acres, and Obligations by Ranking Period, State, and Land Use, FY 2010
State and Land Use
CSP-2010-1 CSP-2010-2 Grand Total
Contracts Acres Obligations Contracts Acres Obligations Contracts Acres Obligations
ALABAMA 308 215,713 $1,980,304 123 133,193 $2,107,012 431 348,905 $4,087,316
Cropland 31 13,070 $308,135 21 20,826 $631,641 52 33,896 $939,776
Cropland & Pastureland 34 18,847 $344,322 23 28,476 $504,623 57 47,323 $848,945
Forestland 209 172,626 $1,161,197 43 68,897 $717,041 252 241,523 $1,878,238
Pastureland 34 11,169 $166,650 36 14,994 $253,707 70 26,163 $420,357
ALASKA 11 174,416 $1,200,113 3 8,150 $129,452 14 182,565 $1,329,565
Cropland 2 1,369 $47,569 1 1,820 $29,259 3 3,189 $76,828
Cropland, Pastureland &
Rangeland 1 917 $14,405 --b --b --b 1 917 $14,405
Forestland 7 171,627 $1,121,140 2 6,330 $100,193 9 177,957 $1,221,333
Pastureland 1 503 $16,999 --b --b --b 1 503 $16,999
ARIZONA 39 459,967 $2,085,150 17 361,676 $1,918,187 56 821,643 $4,003,337
Cropland 8 5,527 $165,717 5 4,974 $184,201 13 10,501 $349,918
Cropland & Rangeland 3 14,350 $109,319 3 54,885 $803,244 6 69,235 $912,563
Cropland, Pastureland &
Rangeland 3 7,724 $46,795 --b --b --b 3 7,724 $46,795
Forestland --b --b --b 1 48,000 $184,591 1 48,000 $184,591
Pastureland & Rangeland 5 40,024 $100,530 1 2,089 $15,043 6 42,113 $115,573
Rangeland 20 392,342 $1,662,789 7 251,728 $731,108 27 644,070 $2,393,897
ARKANSAS 289 256,173 $4,454,954 331 313,346 $6,733,003 620 569,519 $11,187,957
Cropland 174 211,379 $3,966,909 191 253,348 $5,853,857 365 464,727 $9,820,766
Cropland & Pastureland 8 2,955 $64,273 8 9,816 $236,599 16 12,771 $300,872
Forestland 49 22,996 $123,472 59 24,283 $163,111 108 47,278 $286,583
Pastureland 58 18,844 $300,300 73 25,899 $479,436 131 44,743 $779,736
CALIFORNIA 198 338,031 $3,248,251 139 383,098 $2,726,952 337 721,128 $5,975,203
Cropland 79 49,769 $1,047,143 72 52,110 $1,264,207 151 101,879 $2,311,350
Cropland & Pastureland 11 5,189 $141,447 4 1,240 $24,386 15 6,429 $165,833
Cropland & Rangeland 19 28,151 $316,987 12 31,908 $275,337 31 60,059 $592,324
Cropland, Pastureland &
Rangeland 12 63,098 $326,512 5 11,929 $96,581 17 75,027 $423,093
Forestland 14 9,999 $86,659 6 52,775 $87,115 20 62,774 $173,774
Pastureland 5 2,390 $52,387 5 3,838 $107,623 10 6,228 $160,010
Pastureland & Rangeland 14 37,033 $350,525 12 42,370 $297,007 26 79,404 $647,532
Rangeland 44 142,401 $926,591 23 186,928 $574,696 67 329,329 $1,501,287
COLORADO 248 658,257 $5,621,967 221 606,119 $6,124,161 469 1,264,376 $11,746,128
Cropland 67 101,229 $1,625,725 91 149,631 $2,666,461 158 250,860 $4,292,186
Cropland & Pastureland 11 5,296 $139,945 5 3,710 $100,466 16 9,006 $240,411
Cropland & Rangeland 82 249,112 $2,421,319 66 240,033 $2,072,176 148 489,145 $4,493,495
Cropland, Pastureland &
Rangeland 16 36,206 $392,466 14 24,371 $302,809 30 60,577 $695,275
Forestland 7 1,845 $17,807 3 1,135 $16,594 10 2,980 $34,401
Pastureland 1 160 $3,079 1 32 $777 2 192 $3,856
Pastureland & Rangeland 4 4,956 $37,296 4 8,199 $66,456 8 13,155 $103,752
Rangeland 60 259,453 $984,330 36 178,460 $883,618 96 437,913 $1,867,948
Data Unavailablea
--b --b --b 1 549 $14,804 1 549 $14,804
CONNECTICUT 8 1,953 $26,954 5 6,514 $25,953 13 8,467 $52,907
Cropland 4 437 $11,382 1 220 $4,710 5 656 $16,092
Cropland & Pastureland 1 212 $5,859 --b --b --b 1 212 $5,859

CStP FY2010_Appendix_Modified_Final_2-14-2012.docx
73
Table A 8. Conservation Stewardship Program: Contracts, Acres, and Obligations by Ranking Period, State, and Land Use, FY 2010
State and Land Use
CSP-2010-1 CSP-2010-2 Grand Total
Contracts Acres Obligations Contracts Acres Obligations Contracts Acres Obligations
Forestland 3 1,304 $9,713 4 6,294 $21,243 7 7,598 $30,956
DELAWARE 15 7,971 $231,980 10 6,478 $117,924 25 14,448 $349,904
Cropland 12 7,517 $229,147 7 5,684 $113,266 19 13,201 $342,413
Cropland & Pastureland 1 9 $214 --b --b --b 1 9 $214
Forestland 2 445 $2,619 2 575 $1,078 4 1,020 $3,697
Pastureland --b --b --b 1 219 $3,580 1 219 $3,580
FLORIDA 46 23,726 $393,098 49 41,552 $823,028 95 65,279 $1,216,126
Cropland 9 2,787 $137,375 8 3,769 $180,682 17 6,556 $318,057
Cropland & Pastureland 8 1,464 $68,278 10 8,542 $226,671 18 10,005 $294,949
Cropland, Pastureland &
Rangeland 1 216 $4,178 4 8,045 $98,265 5 8,261 $102,443
Forestland 12 3,281 $25,212 14 5,800 $91,405 26 9,081 $116,617
Pastureland 11 4,257 $75,985 10 4,101 $109,273 21 8,358 $185,258
Pastureland & Rangeland 5 11,722 $82,070 3 11,296 $116,732 8 23,018 $198,802
GEORGIA 166 90,850 $2,019,639 418 264,056 $8,225,960 584 354,906 $10,245,599
Cropland 48 35,306 $1,119,634 146 87,063 $4,179,574 194 122,369 $5,299,208
Cropland & Pastureland 28 12,231 $473,173 55 35,681 $1,451,128 83 47,913 $1,924,301
Forestland 76 41,037 $356,152 176 115,751 $1,761,062 252 156,788 $2,117,214
Pastureland 14 2,276 $70,680 19 2,999 $86,721 33 5,275 $157,401
Data Unavailablea --b --b --b 22 22,561 $747,475 22 22,561 $747,475
HAWAII 5 5,503 $66,783 11 1,594 $39,090 16 7,098 $105,873
Cropland 1 60 $3,362 5 71 $5,000 6 131 $8,362
Cropland & Pastureland 1 19 $473 1 18 $1,000 2 37 $1,473
Pastureland 3 5,425 $62,948 5 1,505 $33,090 8 6,930 $96,038
IDAHO 92 97,751 $1,655,466 110 253,335 $2,487,573 202 351,087 $4,143,039
Cropland 52 53,159 $1,087,781 43 72,605 $1,233,899 95 125,764 $2,321,680
Cropland & Pastureland 5 7,598 $129,044 17 10,049 $207,185 22 17,647 $336,229
Cropland & Rangeland 2 4,098 $51,798 12 18,725 $251,107 14 22,823 $302,905
Cropland, Pastureland &
Rangeland 16 17,172 $248,240 16 50,969 $328,761 32 68,142 $577,001
Forestland 12 8,739 $75,547 12 58,034 $287,495 24 66,773 $363,042
Pastureland 1 187 $3,467 1 73 $1,281 2 260 $4,748
Pastureland & Rangeland 3 6,593 $58,113 5 34,264 $110,469 8 40,857 $168,582
Rangeland 1 205 $1,476 4 8,617 $67,376 5 8,822 $68,852
ILLINOIS 265 175,941 $4,018,047 277 226,756 $4,678,677 542 402,697 $8,696,724
Cropland 204 149,344 $3,481,309 219 191,001 $3,986,714 423 340,344 $7,468,023
Cropland & Pastureland 35 23,281 $514,323 35 33,903 $678,692 70 57,185 $1,193,015
Forestland 23 2,945 $17,623 21 1,683 $10,175 44 4,627 $27,798
Pastureland 3 372 $4,792 2 169 $3,096 5 541 $7,888
INDIANA 148 103,901 $2,654,331 160 107,664 $2,558,464 308 211,565 $5,212,795
Cropland 114 87,454 $2,286,966 129 94,573 $2,267,889 243 182,027 $4,554,855
Cropland & Pastureland 18 13,449 $343,394 19 12,094 $278,380 37 25,543 $621,774
Forestland 13 2,563 $16,114 8 698 $5,172 21 3,261 $21,286
Pastureland 3 435 $7,857 4 299 $7,023 7 734 $14,880
IOWA 729 369,263 $9,338,245 751 428,342 $10,917,329 1,480 797,605 $20,255,574
Cropland 504 246,853 $6,607,881 490 281,751 $7,492,313 994 528,604 $14,100,194
Cropland & Pastureland 194 115,980 $2,633,254 233 142,444 $3,370,712 427 258,424 $6,003,966

CStP FY2010_Appendix_Modified_Final_2-14-2012.docx
74
Table A 8. Conservation Stewardship Program: Contracts, Acres, and Obligations by Ranking Period, State, and Land Use, FY 2010
State and Land Use
CSP-2010-1 CSP-2010-2 Grand Total
Contracts Acres Obligations Contracts Acres Obligations Contracts Acres Obligations
Cropland, Pastureland &
Rangeland 1 1,581 $40,000 --b --b --b 1 1,581 $40,000
Forestland 20 2,341 $14,736 18 2,859 $31,466 38 5,200 $46,202
Pastureland 10 2,508 $42,374 10 1,289 $22,838 20 3,797 $65,212
KANSAS 454 492,690 $7,453,148 418 723,725 $10,547,462 872 1,216,415 $18,000,610
Cropland 262 187,092 $3,878,166 180 244,702 $4,496,642 442 431,794 $8,374,808
Cropland & Pastureland 20 16,950 $355,784 23 25,328 $543,077 43 42,278 $898,861
Cropland & Rangeland 125 224,551 $2,643,156 156 357,813 $4,341,616 281 582,364 $6,984,772
Cropland, Pastureland &
Rangeland 23 24,752 $344,582 38 72,051 $1,001,106 61 96,803 $1,345,688
Forestland 2 154 $1,043 3 195 $1,398 5 349 $2,441
Pastureland & Rangeland 2 734 $5,073 7 11,066 $85,328 9 11,800 $90,401
Rangeland 20 38,457 $225,344 11 12,571 $78,295 31 51,027 $303,639
KENTUCKY 83 29,899 $386,791 99 32,212 $541,734 182 62,111 $928,525
Cropland 9 4,409 $96,988 22 4,891 $168,178 31 9,300 $265,166
Cropland & Pastureland 29 8,670 $164,731 36 13,948 $248,390 65 22,618 $413,121
Forestland 32 14,731 $96,284 32 11,655 $91,389 64 26,386 $187,673
Pastureland 13 2,088 $28,788 9 1,719 $33,777 22 3,807 $62,565
LOUISIANA 196 143,933 $2,338,512 125 121,007 $3,216,217 321 264,940 $5,554,729
Cropland 71 88,683 $1,587,970 71 93,395 $2,474,704 142 182,077 $4,062,674
Cropland & Pastureland 20 17,510 $333,129 10 10,036 $354,696 30 27,546 $687,825
Forestland 55 24,298 $172,303 20 6,031 $78,693 75 30,329 $250,996
Pastureland 50 13,443 $245,110 24 11,545 $308,124 74 24,988 $553,234
MAINE 59 56,949 $340,711 43 13,432 $187,683 102 70,381 $528,394
Cropland 8 5,324 $125,144 10 2,942 $84,116 18 8,266 $209,260
Cropland & Pastureland 8 2,415 $65,242 4 257 $6,661 12 2,672 $71,903
Forestland 40 49,107 $148,596 26 10,147 $91,751 66 59,254 $240,347
Pastureland 3 103 $1,729 3 86 $5,155 6 189 $6,884
MARYLAND 37 11,426 $286,493 28 12,823 $455,421 65 24,249 $741,914
Cropland 14 5,935 $165,864 15 9,324 $340,647 29 15,259 $506,511
Cropland & Pastureland 13 4,632 $114,329 8 3,116 $113,246 21 7,748 $227,575
Forestland 9 819 $5,819 5 384 $1,528 14 1,203 $7,347
Pastureland 1 40 $481 --b --b --b 1 40 $481
MASSACHUSETTS 4 1,826 $18,112 7 5,498 $40,023 11 7,324 $58,135
Cropland --b --b --b 1 208 $16,845 1 208 $16,845
Cropland & Pastureland 2 390 $9,691 1 53 $1,316 3 444 $11,007
Forestland 2 1,435 $8,421 5 5,237 $21,862 7 6,672 $30,283
MICHIGAN 271 104,847 $2,206,112 273 125,117 $2,472,219 544 229,963 $4,678,331
Cropland 122 69,121 $1,798,567 154 97,119 $2,144,893 276 166,240 $3,943,460
Cropland & Pastureland 19 5,731 $141,732 16 3,385 $73,771 35 9,116 $215,503
Forestland 124 28,429 $235,789 102 24,492 $248,525 226 52,921 $484,314
Pastureland 6 1,567 $30,024 1 120 $5,030 7 1,687 $35,054
MINNESOTA 906 467,660 $9,931,338 669 448,101 $11,445,982 1,575 915,761 $21,377,320
Cropland 410 307,148 $7,247,737 355 322,147 $8,856,759 765 629,294 $16,104,496
Cropland & Pastureland 215 99,797 $2,264,278 134 76,023 $2,095,723 349 175,820 $4,360,001
Forestland 258 56,851 $353,228 159 41,356 $351,300 417 98,207 $704,528
Pastureland 23 3,865 $66,095 21 8,575 $142,200 44 12,440 $208,295

CStP FY2010_Appendix_Modified_Final_2-14-2012.docx
75
Table A 8. Conservation Stewardship Program: Contracts, Acres, and Obligations by Ranking Period, State, and Land Use, FY 2010
State and Land Use
CSP-2010-1 CSP-2010-2 Grand Total
Contracts Acres Obligations Contracts Acres Obligations Contracts Acres Obligations
MISSISSIPPI 125 92,961 $1,325,765 194 259,304 $7,654,309 319 352,265 $8,980,074
Cropland 30 56,063 $1,023,561 131 228,408 $7,078,672 161 284,471 $8,102,233
Cropland & Pastureland 14 10,304 $130,280 17 13,042 $332,911 31 23,346 $463,191
Forestland 66 23,811 $140,095 33 14,693 $163,795 99 38,504 $303,890
Pastureland 15 2,782 $31,829 13 3,162 $78,931 28 5,944 $110,760
MISSOURI 1,006 502,674 $8,233,641 933 473,327 $8,323,828 1,939 976,001 $16,557,469
Cropland 263 179,582 $3,702,108 234 184,742 $4,316,238 497 364,323 $8,018,346
Cropland & Pastureland 221 162,801 $2,827,438 221 144,847 $2,464,708 442 307,648 $5,292,146
Forestland 236 68,588 $335,003 196 56,612 $244,501 432 125,199 $579,504
Pastureland 286 91,703 $1,369,092 282 87,128 $1,298,381 568 178,831 $2,667,473
MONTANA 222 926,476 $6,743,828 264 883,579 $8,322,708 486 1,810,055 $15,066,536
Cropland 71 163,780 $2,295,304 63 115,380 $2,150,308 134 279,160 $4,445,612
Cropland & Pastureland 12 3,645 $116,464 19 18,999 $462,820 31 22,644 $579,284
Cropland & Rangeland 31 164,156 $1,026,989 36 122,383 $1,258,202 67 286,539 $2,285,191
Cropland, Pastureland &
Rangeland 81 515,242 $2,870,432 108 507,463 $3,794,656 189 1,022,705 $6,665,088
Forestland 14 17,260 $130,284 17 17,224 $120,424 31 34,484 $250,708
Pastureland 1 253 $3,603 1 73 $2,793 2 326 $6,396
Pastureland & Rangeland 10 51,352 $239,981 15 57,917 $309,535 25 109,269 $549,516
Rangeland 2 10,789 $60,771 5 44,141 $223,970 7 54,929 $284,741
NEBRASKA 571 783,914 $8,900,070 535 1,053,015 $11,252,464 1,106 1,836,928 $20,152,534
Cropland 207 116,886 $2,995,476 192 158,300 $3,988,587 399 275,186 $6,984,063
Cropland & Pastureland 60 41,154 $837,669 66 54,943 $1,044,437 126 96,097 $1,882,106
Cropland & Rangeland 138 397,706 $3,410,849 152 485,704 $3,911,448 290 883,409 $7,322,297
Cropland, Pastureland &
Rangeland 24 49,591 $551,702 36 92,933 $856,508 60 142,523 $1,408,210
Forestland 37 4,189 $32,471 3 1,087 $15,215 40 5,276 $47,686
Pastureland 17 2,332 $42,519 10 1,172 $18,690 27 3,504 $61,209
Pastureland & Rangeland 14 22,996 $177,913 12 28,972 $196,084 26 51,968 $373,997
Rangeland 74 149,060 $851,471 62 228,073 $1,180,129 136 377,133 $2,031,600
Data Unavailablea --b --b --b 2 1,832 $41,366 2 1,832 $41,366
NEVADA 4 12,918 $145,109 13 10,911 $155,015 17 23,829 $300,124
Cropland 1 2,357 $40,000 4 1,155 $18,775 5 3,512 $58,775
Cropland & Pastureland --b --b --b 3 1,228 $12,830 3 1,228 $12,830
Cropland & Rangeland --b --b --b 3 5,058 $75,482 3 5,058 $75,482
Cropland, Pastureland &
Rangeland 3 10,561 $105,109 2 2,391 $19,866 5 12,952 $124,975
Pastureland & Rangeland --b --b --b 1 1,079 $28,062 1 1,079 $28,062
NEW HAMPSHIRE 12 2,304 $35,780 5 1,126 $10,870 17 3,430 $46,650
Cropland 3 131 $3,865 1 316 $3,023 4 447 $6,888
Cropland & Pastureland 5 1,067 $25,099 2 373 $6,477 7 1,440 $31,576
Forestland 4 1,107 $6,816 2 437 $1,370 6 1,544 $8,186
NEW JERSEY --b --b --b 9 2,468 $71,225 9 2,468 $71,225
Cropland --b --b --b 7 2,236 $65,941 7 2,236 $65,941
Cropland & Pastureland --b --b --b 2 232 $5,284 2 232 $5,284
NEW MEXICO 111 936,871 $3,160,535 61 541,869 $2,252,217 172 1,478,740 $5,412,752
Cropland 4 1,337 $48,330 3 2,770 $58,479 7 4,107 $106,809
Cropland & Pastureland 1 146 $2,712 --b --b --b 1 146 $2,712

CStP FY2010_Appendix_Modified_Final_2-14-2012.docx
76
Table A 8. Conservation Stewardship Program: Contracts, Acres, and Obligations by Ranking Period, State, and Land Use, FY 2010
State and Land Use
CSP-2010-1 CSP-2010-2 Grand Total
Contracts Acres Obligations Contracts Acres Obligations Contracts Acres Obligations
Cropland & Rangeland 7 9,286 $107,696 5 16,498 $191,999 12 25,784 $299,695
Forestland 9 34,175 $184,981 2 21,450 $163,236 11 55,625 $348,217
Pastureland --b --b --b 1 47 $1,709 1 47 $1,709
Pastureland & Rangeland 1 2,219 $18,671 3 28,800 $57,642 4 31,019 $76,313
Rangeland 89 889,708 $2,798,145 47 472,304 $1,779,152 136 1,362,013 $4,577,297
NEW YORK 154 77,201 $1,642,775 167 82,401 $1,644,857 321 159,602 $3,287,632
Cropland 51 44,584 $1,098,474 46 39,119 $898,276 97 83,703 $1,996,750
Cropland & Pastureland 41 17,258 $417,144 41 29,482 $622,076 82 46,740 $1,039,220
Forestland 53 13,731 $92,126 74 13,431 $116,947 127 27,162 $209,073
Pastureland 9 1,627 $35,031 6 370 $7,558 15 1,996 $42,589
NORTH CAROLINA 64 27,406 $440,251 103 40,008 $613,839 167 67,414 $1,054,090
Cropland 16 15,605 $323,655 23 11,894 $301,610 39 27,499 $625,265
Cropland & Pastureland 18 3,705 $61,464 29 7,917 $182,895 47 11,622 $244,359
Forestland 24 7,424 $42,742 42 18,990 $107,597 66 26,414 $150,339
Pastureland 6 672 $12,390 9 1,207 $21,737 15 1,879 $34,127
NORTH DAKOTA 301 616,913 $9,134,784 326 663,817 $10,351,937 627 1,280,729 $19,486,721
Cropland 128 219,308 $3,903,056 180 277,520 $6,001,835 308 496,828 $9,904,891
Cropland & Pastureland 12 18,873 $341,507 20 22,392 $672,438 32 41,265 $1,013,945
Cropland & Rangeland 62 137,275 $1,848,180 32 65,951 $1,056,373 94 203,227 $2,904,553
Cropland, Pastureland &
Rangeland 90 224,767 $2,894,719 72 262,943 $2,344,201 162 487,710 $5,238,920
Forestland 1 80 $533 3 446 $2,050 4 526 $2,583
Pastureland & Rangeland 7 15,629 $138,956 11 24,017 $198,652 18 39,645 $337,608
Rangeland 1 980 $7,833 8 10,548 $76,388 9 11,528 $84,221
OHIO 234 83,881 $1,968,151 90 43,951 $1,045,532 324 127,833 $3,013,683
Cropland 95 55,984 $1,394,730 55 33,570 $876,236 150 89,555 $2,270,966
Cropland & Pastureland 56 18,482 $490,659 13 6,971 $141,663 69 25,453 $632,322
Forestland 60 7,738 $51,911 21 3,382 $27,133 81 11,120 $79,044
Pastureland 23 1,677 $30,851 1 28 $500 24 1,705 $31,351
OKLAHOMA 462 546,971 $7,531,213 456 590,901 $8,644,686 918 1,137,871 $16,175,899
Cropland 35 25,682 $573,146 36 30,311 $719,785 71 55,994 $1,292,931
Cropland & Pastureland 52 42,760 $905,049 29 19,869 $534,877 81 62,629 $1,439,926
Cropland & Rangeland 45 45,239 $694,621 22 38,710 $460,246 67 83,948 $1,154,867
Cropland, Pastureland &
Rangeland 175 267,086 $4,028,849 170 315,514 $4,551,097 345 582,599 $8,579,946
Forestland 15 15,046 $63,227 14 8,934 $102,903 29 23,980 $166,130
Pastureland 66 24,330 $458,318 90 38,064 $890,905 156 62,393 $1,349,223
Pastureland & Rangeland 57 78,545 $603,554 70 109,070 $1,161,717 127 187,615 $1,765,271
Rangeland 17 48,284 $204,449 25 30,429 $223,156 42 78,713 $427,605
OREGON 201 350,626 $2,941,938 171 490,752 $4,609,739 372 841,378 $7,551,677
Cropland 62 49,647 $881,452 43 79,681 $1,347,919 105 129,327 $2,229,371
Cropland & Pastureland 11 3,598 $109,718 9 2,499 $70,325 20 6,097 $180,043
Cropland & Rangeland 18 82,729 $528,599 30 131,815 $1,009,637 48 214,544 $1,538,236
Cropland, Pastureland &
Rangeland 6 22,382 $172,509 28 135,073 $883,420 34 157,455 $1,055,929
Forestland 69 75,943 $549,293 37 60,060 $885,742 106 136,003 $1,435,035
Pastureland 9 859 $15,685 3 341 $8,782 12 1,200 $24,467
Pastureland & Rangeland 7 33,847 $218,004 4 35,206 $154,474 11 69,053 $372,478

CStP FY2010_Appendix_Modified_Final_2-14-2012.docx
77
Table A 8. Conservation Stewardship Program: Contracts, Acres, and Obligations by Ranking Period, State, and Land Use, FY 2010
State and Land Use
CSP-2010-1 CSP-2010-2 Grand Total
Contracts Acres Obligations Contracts Acres Obligations Contracts Acres Obligations
Rangeland 19 81,622 $466,678 16 44,361 $209,440 35 125,983 $676,118
Data Unavailablea --b --b --b 1 1,716 $40,000 1 1,716 $40,000
PENNSYLVANIA 265 69,237 $1,662,495 300 96,864 $2,311,722 565 166,101 $3,974,217
Cropland 72 25,663 $812,182 109 44,284 $1,133,672 181 69,946 $1,945,854
Cropland & Pastureland 120 26,211 $723,883 110 36,843 $992,016 230 63,054 $1,715,899
Forestland 64 16,728 $113,480 72 15,225 $176,556 136 31,953 $290,036
Pastureland 9 635 $12,950 9 513 $9,478 18 1,148 $22,428
PUERTO RICO 11 700 $19,066 --b --b --b 11 700 $19,066
Cropland 9 566 $16,907 --b --b --b 9 566 $16,907
Pastureland 2 134 $2,159 --b --b --b 2 134 $2,159
RHODE ISLAND 3 1,139 $11,282 18 2,586 $35,029 21 3,725 $46,311
Cropland --b --b --b 1 12 $1,000 1 12 $1,000
Cropland & Pastureland 1 125 $3,375 1 12 $1,000 2 137 $4,375
Forestland 1 853 $5,151 14 2,549 $31,875 15 3,402 $37,026
Pastureland 1 161 $2,756 2 13 $1,154 3 174 $3,910
SOUTH CAROLINA 267 170,085 $1,953,328 176 95,621 $1,469,813 443 265,706 $3,423,141
Cropland 63 37,766 $769,254 56 44,683 $922,725 119 82,449 $1,691,979
Cropland & Pastureland 35 19,964 $431,827 8 3,048 $75,673 43 23,013 $507,500
Forestland 146 109,705 $716,950 88 44,582 $413,220 234 154,287 $1,130,170
Pastureland 23 2,650 $35,297 24 3,309 $58,195 47 5,958 $93,492
SOUTH DAKOTA 261 688,366 $7,138,773 244 606,024 $7,734,929 505 1,294,391 $14,873,702
Cropland 79 96,339 $2,131,495 75 103,097 $2,628,251 154 199,436 $4,759,746
Cropland & Pastureland 43 55,484 $1,103,558 32 46,455 $1,101,667 75 101,939 $2,205,225
Cropland & Rangeland 88 349,748 $2,724,009 79 226,463 $2,522,192 167 576,211 $5,246,201
Cropland, Pastureland &
Rangeland 23 73,597 $733,631 15 36,886 $360,928 38 110,483 $1,094,559
Forestland 1 88 $843 1 243 $2,145 2 331 $2,988
Pastureland 8 1,278 $23,223 4 3,698 $60,632 12 4,976 $83,855
Pastureland & Rangeland 3 8,160 $50,471 2 4,446 $46,715 5 12,606 $97,186
Rangeland 16 103,672 $371,543 36 184,737 $1,012,399 52 288,409 $1,383,942
TENNESSEE 175 48,545 $658,676 241 90,623 $1,469,131 416 139,168 $2,127,807
Cropland 21 9,157 $224,804 39 33,678 $927,654 60 42,835 $1,152,458
Cropland & Pastureland 35 9,323 $193,727 52 12,881 $219,618 87 22,204 $413,345
Forestland 76 24,738 $160,326 89 37,751 $215,720 165 62,489 $376,046
Pastureland 43 5,328 $79,819 61 6,313 $106,139 104 11,640 $185,958
TEXAS 694 1,338,176 $9,754,896 295 699,688 $5,430,875 989 2,037,864 $15,185,771
Cropland 100 90,379 $2,130,045 53 50,668 $1,189,902 153 141,047 $3,319,947
Cropland & Pastureland 52 38,682 $730,844 27 28,690 $598,221 79 67,373 $1,329,065
Cropland & Rangeland 57 133,086 $1,368,275 34 122,034 $1,036,695 91 255,120 $2,404,970
Cropland, Pastureland &
Rangeland 64 196,587 $1,444,842 27 76,572 $718,602 91 273,159 $2,163,444
Forestland 160 69,145 $443,646 33 10,529 $89,488 193 79,675 $533,134
Pastureland 86 31,750 $534,245 63 32,157 $519,290 149 63,907 $1,053,535
Pastureland & Rangeland 54 97,378 $678,453 19 45,442 $333,969 73 142,820 $1,012,422
Rangeland 121 681,170 $2,424,546 38 333,346 $940,765 159 1,014,517 $3,365,311
Data Unavailablea --b --b --b 1 248 $3,943 1 248 $3,943
UTAH 17 87,510 $450,912 61 213,677 $1,287,670 78 301,187 $1,738,582

CStP FY2010_Appendix_Modified_Final_2-14-2012.docx
78
Table A 8. Conservation Stewardship Program: Contracts, Acres, and Obligations by Ranking Period, State, and Land Use, FY 2010
State and Land Use
CSP-2010-1 CSP-2010-2 Grand Total
Contracts Acres Obligations Contracts Acres Obligations Contracts Acres Obligations
Cropland 3 3,091 $63,393 14 15,050 $322,738 17 18,141 $386,131
Cropland & Pastureland 1 266 $5,133 7 6,555 $114,161 8 6,821 $119,294
Cropland & Rangeland 2 22,218 $80,000 13 100,067 $367,595 15 122,285 $447,595
Cropland, Pastureland &
Rangeland 7 38,346 $200,541 19 81,868 $414,073 26 120,214 $614,614
Pastureland --b --b --b 2 161 $5,563 2 161 $5,563
Pastureland & Rangeland --b --b --b 3 3,603 $34,849 3 3,603 $34,849
Rangeland 4 23,589 $101,845 3 6,373 $28,691 7 29,962 $130,536
VERMONT 2 280 $6,745 5 2,282 $28,726 7 2,562 $35,471
Cropland & Pastureland 1 238 $6,525 2 1,039 $23,398 3 1,277 $29,923
Forestland 1 42 $220 3 1,243 $5,328 4 1,285 $5,548
VIRGINIA 118 53,770 $1,075,368 152 93,074 $2,237,673 270 146,844 $3,313,041
Cropland 24 11,646 $376,872 59 37,653 $1,277,244 83 49,299 $1,654,116
Cropland & Pastureland 36 16,442 $481,394 45 18,106 $543,703 81 34,548 $1,025,097
Forestland 45 23,855 $174,693 39 36,330 $382,663 84 60,184 $557,356
Pastureland 13 1,827 $42,409 9 985 $34,063 22 2,812 $76,472
WASHINGTON 88 186,405 $2,229,319 118 261,922 $3,779,022 206 448,327 $6,008,341
Cropland 49 95,406 $1,348,797 71 133,183 $2,586,142 120 228,589 $3,934,939
Cropland & Pastureland 9 3,699 $69,349 10 10,652 $301,426 19 14,351 $370,775
Cropland & Rangeland 16 51,836 $580,241 12 57,646 $376,972 28 109,482 $957,213
Cropland, Pastureland &
Rangeland 5 24,659 $152,461 4 12,316 $121,656 9 36,975 $274,117
Forestland 4 2,768 $22,834 12 9,884 $123,023 16 12,651 $145,857
Pastureland 2 543 $12,082 --b --b --b 2 543 $12,082
Pastureland & Rangeland 2 386 $3,555 4 17,496 $162,082 6 17,882 $165,637
Rangeland 1 7,109 $40,000 5 20,745 $107,721 6 27,854 $147,721
WEST VIRGINIA 76 18,517 $243,310 177 54,928 $537,102 253 73,445 $780,412
Cropland 1 34 $1,723 8 566 $37,872 9 600 $39,595
Cropland & Pastureland 41 7,983 $170,017 86 15,851 $340,926 127 23,834 $510,943
Forestland 31 10,354 $69,400 76 37,818 $145,670 107 48,172 $215,070
Pastureland 3 145 $2,170 7 693 $12,634 10 838 $14,804
WISCONSIN 516 171,981 $3,355,623 452 188,009 $3,294,572 968 359,990 $6,650,195
Cropland 223 104,002 $2,275,334 239 128,923 $2,482,766 462 232,925 $4,758,100
Cropland & Pastureland 163 47,393 $951,312 102 38,054 $713,501 265 85,447 $1,664,813
Forestland 113 19,324 $107,532 101 20,223 $82,567 214 39,547 $190,099
Pastureland 17 1,262 $21,445 10 809 $15,738 27 2,071 $37,183
WYOMING 75 522,209 $2,062,062 102 391,134 $2,528,700 177 913,343 $4,590,762
Cropland 3 2,015 $52,260 17 20,622 $410,947 20 22,637 $463,207
Cropland & Pastureland 4 2,611 $55,617 9 8,178 $123,254 13 10,789 $178,871
Cropland & Rangeland 20 133,526 $538,221 21 87,407 $511,622 41 220,933 $1,049,843
Cropland, Pastureland &
Rangeland 24 165,850 $706,347 32 121,414 $842,522 56 287,264 $1,548,869
Forestland 2 2,201 $22,208 --b --b --b 2 2,201 $22,208
Pastureland & Rangeland 10 85,180 $309,690 8 49,166 $209,967 18 134,345 $519,657
Rangeland 12 130,826 $377,719 15 104,347 $430,388 27 235,173 $808,107
Grand Total 10,612 12,606,679 $144,782,194 9,955 12,557,648 $175,617,696 20,567 25,164,327 $320,399,890 a
Contract data are not available electronically. Contracts are stored in county offices. bNot applicable.

CStP FY2010_Appendix_Modified_Final_2-14-2012.docx
79
Table A 9. Conservation Stewardship Program: Acre Statistics for Ranking Period 1 by State, and Land Use, FY 2010
State and Land Uses Contracts Acres Avg Acres Min Acres Max Acres Std Dev Acres
ALABAMA 308 215,713 700 15 7,932 1,062
Cropland 31 13,070 422 34 2,071 503
Cropland & Pastureland 34 18,847 554 29 3,686 725
Forestland 209 172,626 826 15 7,932 1,208
Pastureland 34 11,169 328 34 2,300 441
ALASKA 11 174,416 15,856 128 88,164 28,446
Cropland 2 1,369 685 423 946 370
Cropland, Pastureland & Rangeland 1 917 917 917 917 --b
Forestland 7 171,627 24,518 128 88,164 33,285
Pastureland 1 503 503 503 503 --b
ARIZONA 39 459,967 11,794 135 165,400 33,453
Cropland 8 5,527 691 135 1,945 633
Cropland & Rangeland 3 14,350 4,783 3,561 5,493 1,063
Cropland, Pastureland & Rangeland 3 7,724 2,575 304 6,704 3,582
Forestland --b --b --b --b --b --b
Pastureland & Rangeland 5 40,024 8,005 406 27,513 11,614
Rangeland 20 392,342 19,617 280 165,400 45,463
ARKANSAS 289 256,173 886 28 6,635 1,008
Cropland 174 211,379 1,215 42 6,635 1,103
Cropland & Pastureland 8 2,955 369 32 1,407 502
Forestland 49 22,996 469 28 3,783 746
Pastureland 58 18,844 325 32 2,127 329
CALIFORNIA 198 338,031 1,707 8 19,270 2,717
Cropland 79 49,769 630 8 10,645 1,288
Cropland & Pastureland 11 5,189 472 31 1,834 493
Cropland & Rangeland 19 28,151 1,482 78 7,463 1,757
Cropland, Pastureland & Rangeland 12 63,098 5,258 121 19,270 5,813
Forestland 14 9,999 714 38 2,563 690
Pastureland 5 2,390 478 30 1,843 772
Pastureland & Rangeland 14 37,033 2,645 425 15,485 3,832
Rangeland 44 142,401 3,236 270 11,606 2,633
COLORADO 248 658,257 2,654 10 48,000 4,630
Cropland 67 101,229 1,511 27 9,440 1,699
Cropland & Pastureland 11 5,296 481 10 1,894 578
Cropland & Rangeland 82 249,112 3,038 179 15,302 2,760
Cropland, Pastureland & Rangeland 16 36,206 2,263 478 5,402 1,302
Forestland 7 1,845 264 67 1,200 415
Pastureland 1 160 160 160 160 --b
Pastureland & Rangeland 4 4,956 1,239 419 2,760 1,104
Rangeland 60 259,453 4,324 22 48,000 8,315
CONNECTICUT 8 1,953 244 16 1,100 354
Cropland 4 437 109 16 230 93
Cropland & Pastureland 1 212 212 212 212 --b
Forestland 3 1,304 435 69 1,100 577
DELAWARE 15 7,971 531 9 1,652 481
Cropland 12 7,517 626 47 1,652 492
Cropland & Pastureland 1 9 9 9 9 --b
Forestland 2 445 223 169 276 76
Pastureland --b --b --b --b --b --b
FLORIDA 46 23,726 516 14 9,758 1,453
Cropland 9 2,787 310 14 912 328
Cropland & Pastureland 8 1,464 183 28 416 151
Cropland, Pastureland & Rangeland 1 216 216 216 216 --b
Forestland 12 3,281 273 34 1,018 312
Pastureland 11 4,257 387 19 2,207 691
Pastureland & Rangeland 5 11,722 2,344 95 9,758 4,159

CStP FY2010_Appendix_Modified_Final_2-14-2012.docx
80
Table A 8. Conservation Stewardship Program: Contracts, Acres, and Obligations by Ranking Period, State, and Land Use, FY 2010
State and Land Use
CSP-2010-1 CSP-2010-2 Grand Total
Contracts Acres Obligations Contracts Acres Obligations Contracts Acres Obligations
GEORGIA 166 90,850 547 7 4,298 628
Cropland 48 35,306 736 7 4,298 808
Cropland & Pastureland 28 12,231 437 38 1,511 381
Cropland, Pastureland & Rangeland --b --b --b --b --b --b
Forestland 76 41,037 540 25 2,835 581
Pastureland 14 2,276 163 7 1,000 278
HAWAII 5 5,503 1,101 19 4,563 1,964
Cropland 1 60 60 60 60 --b
Cropland & Pastureland 1 19 19 19 19 --b
Pastureland 3 5,425 1,808 49 4,563 2,416
IDAHO 92 97,751 1,063 48 4,752 984
Cropland 52 53,159 1,022 48 3,494 886
Cropland & Pastureland 5 7,598 1,520 149 3,585 1,336
Cropland & Rangeland 2 4,098 2,049 1,485 2,613 797
Cropland, Pastureland & Rangeland 16 17,172 1,073 64 2,794 722
Forestland 12 8,739 728 72 3,866 1,084
Pastureland 1 187 187 187 187 --b
Pastureland & Rangeland 3 6,593 2,198 782 4,752 2,217
Rangeland 1 205 205 205 205 --b
ILLINOIS 265 175,941 664 4 3,737 596
Cropland 204 149,344 732 4 3,737 613
Cropland & Pastureland 35 23,281 665 69 2,025 493
Forestland 23 2,945 128 11 971 212
Pastureland 3 372 124 103 157 29
INDIANA 148 103,901 702 12 3,661 690
Cropland 114 87,454 767 37 3,661 725
Cropland & Pastureland 18 13,449 747 31 1,729 522
Forestland 13 2,563 197 12 1,165 307
Pastureland 3 435 145 58 309 142
IOWA 729 369,263 507 3 3,022 464
Cropland 504 246,853 490 6 2,862 452
Cropland & Pastureland 194 115,980 598 3 3,022 494
Cropland, Pastureland & Rangeland 1 1,581 1,581 1,581 1,581 --b
Forestland 20 2,341 117 24 391 92
Pastureland 10 2,508 251 45 654 177
KANSAS 454 492,690 1,085 4 16,639 1,630
Cropland 262 187,092 714 4 10,888 1,081
Cropland & Pastureland 20 16,950 847 74 2,682 780
Cropland & Rangeland 125 224,551 1,796 69 16,639 2,192
Cropland, Pastureland & Rangeland 23 24,752 1,076 367 3,731 840
Forestland 2 154 77 38 116 55
Pastureland & Rangeland 2 734 367 316 418 72
Rangeland 20 38,457 1,923 40 9,787 2,890
KENTUCKY 83 29,899 360 40 2,542 439
Cropland 9 4,409 490 44 2,542 797
Cropland & Pastureland 29 8,670 299 50 1,581 342
Forestland 32 14,731 460 70 1,541 448
Pastureland 13 2,088 161 40 411 102
LOUISIANA 196 143,933 734 8 6,584 1,042
Cropland 71 88,683 1,249 17 5,276 1,187
Cropland & Pastureland 20 17,510 875 53 3,383 952
Forestland 55 24,298 442 28 6,584 982
Pastureland 50 13,443 269 8 2,057 430
MAINE 59 56,949 965 13 32,550 4,219
Cropland 8 5,324 666 18 2,162 835
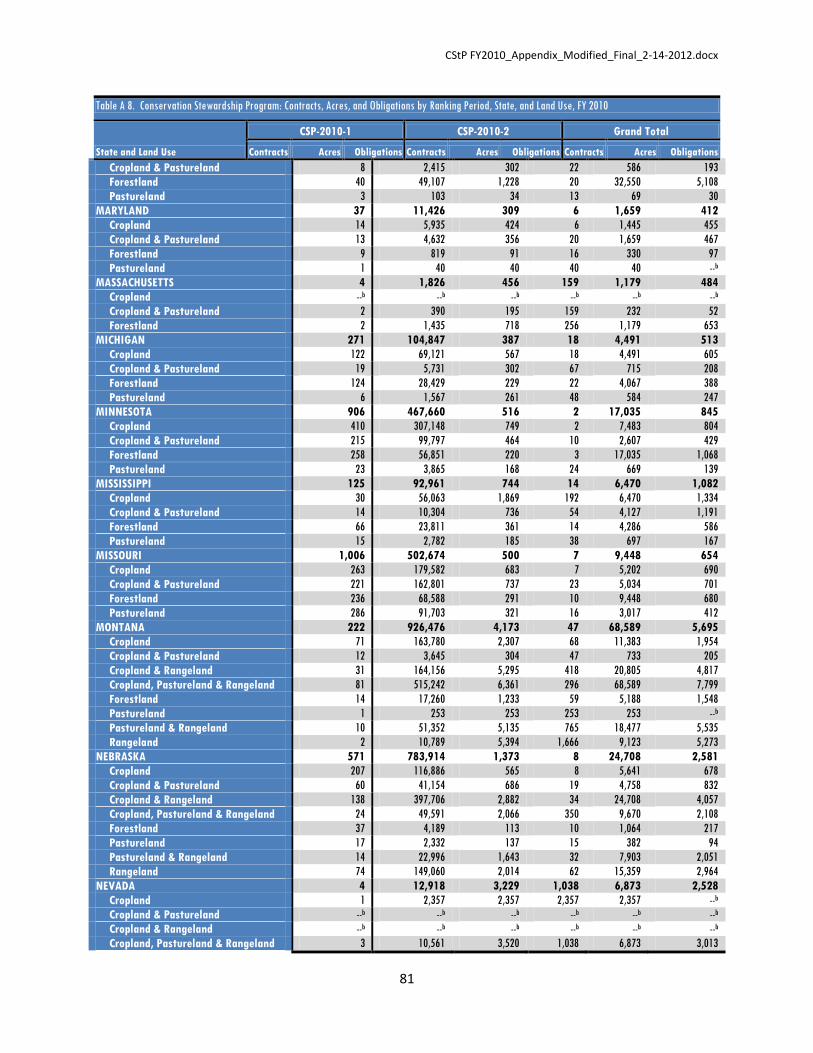
CStP FY2010_Appendix_Modified_Final_2-14-2012.docx
81
Table A 8. Conservation Stewardship Program: Contracts, Acres, and Obligations by Ranking Period, State, and Land Use, FY 2010
State and Land Use
CSP-2010-1 CSP-2010-2 Grand Total
Contracts Acres Obligations Contracts Acres Obligations Contracts Acres Obligations
Cropland & Pastureland 8 2,415 302 22 586 193
Forestland 40 49,107 1,228 20 32,550 5,108
Pastureland 3 103 34 13 69 30
MARYLAND 37 11,426 309 6 1,659 412
Cropland 14 5,935 424 6 1,445 455
Cropland & Pastureland 13 4,632 356 20 1,659 467
Forestland 9 819 91 16 330 97
Pastureland 1 40 40 40 40 --b
MASSACHUSETTS 4 1,826 456 159 1,179 484
Cropland --b --b --b --b --b --b
Cropland & Pastureland 2 390 195 159 232 52
Forestland 2 1,435 718 256 1,179 653
MICHIGAN 271 104,847 387 18 4,491 513
Cropland 122 69,121 567 18 4,491 605
Cropland & Pastureland 19 5,731 302 67 715 208
Forestland 124 28,429 229 22 4,067 388
Pastureland 6 1,567 261 48 584 247
MINNESOTA 906 467,660 516 2 17,035 845
Cropland 410 307,148 749 2 7,483 804
Cropland & Pastureland 215 99,797 464 10 2,607 429
Forestland 258 56,851 220 3 17,035 1,068
Pastureland 23 3,865 168 24 669 139
MISSISSIPPI 125 92,961 744 14 6,470 1,082
Cropland 30 56,063 1,869 192 6,470 1,334
Cropland & Pastureland 14 10,304 736 54 4,127 1,191
Forestland 66 23,811 361 14 4,286 586
Pastureland 15 2,782 185 38 697 167
MISSOURI 1,006 502,674 500 7 9,448 654
Cropland 263 179,582 683 7 5,202 690
Cropland & Pastureland 221 162,801 737 23 5,034 701
Forestland 236 68,588 291 10 9,448 680
Pastureland 286 91,703 321 16 3,017 412
MONTANA 222 926,476 4,173 47 68,589 5,695
Cropland 71 163,780 2,307 68 11,383 1,954
Cropland & Pastureland 12 3,645 304 47 733 205
Cropland & Rangeland 31 164,156 5,295 418 20,805 4,817
Cropland, Pastureland & Rangeland 81 515,242 6,361 296 68,589 7,799
Forestland 14 17,260 1,233 59 5,188 1,548
Pastureland 1 253 253 253 253 --b
Pastureland & Rangeland 10 51,352 5,135 765 18,477 5,535
Rangeland 2 10,789 5,394 1,666 9,123 5,273
NEBRASKA 571 783,914 1,373 8 24,708 2,581
Cropland 207 116,886 565 8 5,641 678
Cropland & Pastureland 60 41,154 686 19 4,758 832
Cropland & Rangeland 138 397,706 2,882 34 24,708 4,057
Cropland, Pastureland & Rangeland 24 49,591 2,066 350 9,670 2,108
Forestland 37 4,189 113 10 1,064 217
Pastureland 17 2,332 137 15 382 94
Pastureland & Rangeland 14 22,996 1,643 32 7,903 2,051
Rangeland 74 149,060 2,014 62 15,359 2,964
NEVADA 4 12,918 3,229 1,038 6,873 2,528
Cropland 1 2,357 2,357 2,357 2,357 --b
Cropland & Pastureland --b --b --b --b --b --b
Cropland & Rangeland --b --b --b --b --b --b
Cropland, Pastureland & Rangeland 3 10,561 3,520 1,038 6,873 3,013

CStP FY2010_Appendix_Modified_Final_2-14-2012.docx
82
Table A 8. Conservation Stewardship Program: Contracts, Acres, and Obligations by Ranking Period, State, and Land Use, FY 2010
State and Land Use
CSP-2010-1 CSP-2010-2 Grand Total
Contracts Acres Obligations Contracts Acres Obligations Contracts Acres Obligations
Pastureland & Rangeland --b --b --b --b --b --b
NEW HAMPSHIRE 12 2,304 192 13 700 188
Cropland 3 131 44 13 95 45
Cropland & Pastureland 5 1,067 213 86 381 109
Forestland 4 1,107 277 126 700 282
NEW JERSEY --b --b --b --b --b --b
Cropland --b --b --b --b --b --b
Cropland & Pastureland --b --b --b --b --b --b
NEW MEXICO 111 936,871 8,440 19 62,527 11,002
Cropland 4 1,337 334 45 724 330
Cropland & Pastureland 1 146 146 146 146 --b
Cropland & Rangeland 7 9,286 1,327 104 2,936 1,088
Forestland 9 34,175 3,797 19 30,281 9,951
Pastureland --b --b --b --b --b --b
Pastureland & Rangeland 1 2,219 2,219 2,219 2,219 --b
Rangeland 89 889,708 9,997 477 62,527 11,373
NEW YORK 154 77,201 501 7 3,560 645
Cropland 51 44,584 874 17 3,560 757
Cropland & Pastureland 41 17,258 421 45 2,110 506
Forestland 53 13,731 259 7 3,446 503
Pastureland 9 1,627 181 9 481 170
NORTH CAROLINA 64 27,406 428 10 2,943 570
Cropland 16 15,605 975 10 2,943 844
Cropland & Pastureland 18 3,705 206 17 758 176
Forestland 24 7,424 309 17 1,305 332
Pastureland 6 672 112 39 377 130
NORTH DAKOTA 301 616,913 2,050 80 10,257 1,585
Cropland 128 219,308 1,713 110 7,500 1,284
Cropland & Pastureland 12 18,873 1,573 138 3,794 1,240
Cropland & Rangeland 62 137,275 2,214 124 7,185 1,626
Cropland, Pastureland & Rangeland 90 224,767 2,497 352 10,257 1,817
Forestland 1 80 80 80 80 --b
Pastureland & Rangeland 7 15,629 2,233 287 5,545 2,245
Rangeland 1 980 980 980 980 --b
OHIO 234 83,881 358 5 2,811 476
Cropland 95 55,984 589 5 2,811 612
Cropland & Pastureland 56 18,482 330 18 1,309 344
Forestland 60 7,738 129 19 550 116
Pastureland 23 1,677 73 7 276 63
OKLAHOMA 462 546,971 1,184 15 14,676 1,726
Cropland 35 25,682 734 56 3,965 864
Cropland & Pastureland 52 42,760 822 77 3,724 735
Cropland & Rangeland 45 45,239 1,005 31 3,912 1,083
Cropland, Pastureland & Rangeland 175 267,086 1,526 99 8,615 1,309
Forestland 15 15,046 1,003 15 10,938 2,766
Pastureland 66 24,330 369 20 1,600 359
Pastureland & Rangeland 57 78,545 1,378 60 14,238 2,744
Rangeland 17 48,284 2,840 20 14,676 4,366
OREGON 201 350,626 1,744 6 16,547 2,772
Cropland 62 49,647 801 6 7,781 1,467
Cropland & Pastureland 11 3,598 327 18 1,329 464
Cropland & Rangeland 18 82,729 4,596 262 13,698 3,623
Cropland, Pastureland & Rangeland 6 22,382 3,730 1,231 8,456 3,072
Forestland 69 75,943 1,101 6 10,457 1,852
Pastureland 9 859 95 13 248 71

CStP FY2010_Appendix_Modified_Final_2-14-2012.docx
83
Table A 8. Conservation Stewardship Program: Contracts, Acres, and Obligations by Ranking Period, State, and Land Use, FY 2010
State and Land Use
CSP-2010-1 CSP-2010-2 Grand Total
Contracts Acres Obligations Contracts Acres Obligations Contracts Acres Obligations
Pastureland & Rangeland 7 33,847 4,835 474 13,906 4,343
Rangeland 19 81,622 4,296 866 16,547 4,054
PENNSYLVANIA 265 69,237 261 4 2,560 338
Cropland 72 25,663 356 19 2,560 451
Cropland & Pastureland 120 26,211 218 25 1,274 187
Forestland 64 16,728 261 9 2,195 404
Pastureland 9 635 71 4 224 64
PUERTO RICO 11 700 64 7 133 44
Cropland 9 566 63 7 133 49
Pastureland 2 134 67 59 75 11
RHODE ISLAND 3 1,139 380 125 853 410
Cropland --b --b --b --b --b --b
Cropland & Pastureland 1 125 125 125 125 --b
Forestland 1 853 853 853 853 --b
Pastureland 1 161 161 161 161 --b
SOUTH CAROLINA 267 170,085 637 8 8,733 1,002
Cropland 63 37,766 599 8 3,211 730
Cropland & Pastureland 35 19,964 570 22 2,210 452
Forestland 146 109,705 751 18 8,733 1,227
Pastureland 23 2,650 115 15 254 74
SOUTH DAKOTA 261 688,366 2,637 14 39,119 3,968
Cropland 79 96,339 1,219 14 4,837 1,079
Cropland & Pastureland 43 55,484 1,290 121 4,416 1,115
Cropland & Rangeland 88 349,748 3,974 243 30,175 4,097
Cropland, Pastureland & Rangeland 23 73,597 3,200 286 19,360 4,183
Forestland 1 88 88 88 88 --b
Pastureland 8 1,278 160 17 587 179
Pastureland & Rangeland 3 8,160 2,720 160 7,457 4,107
Rangeland 16 103,672 6,480 712 39,119 9,584
TENNESSEE 175 48,545 277 9 4,288 440
Cropland 21 9,157 436 14 1,997 559
Cropland & Pastureland 35 9,323 266 45 1,280 284
Forestland 76 24,738 325 9 4,288 541
Pastureland 43 5,328 124 9 958 157
TEXAS 694 1,338,176 1,928 7 35,932 4,004
Cropland 100 90,379 904 7 2,882 756
Cropland & Pastureland 52 38,682 744 39 4,135 758
Cropland & Rangeland 57 133,086 2,335 134 8,277 1,848
Cropland, Pastureland & Rangeland 64 196,587 3,072 79 34,218 4,500
Forestland 160 69,145 432 10 6,809 714
Pastureland 86 31,750 369 8 2,223 434
Pastureland & Rangeland 54 97,378 1,803 38 12,525 2,813
Rangeland 121 681,170 5,630 102 35,932 7,384
UTAH 17 87,510 5,148 110 18,708 5,491
Cropland 3 3,091 1,030 493 2,048 882
Cropland & Pastureland 1 266 266 266 266 --b
Cropland & Rangeland 2 22,218 11,109 8,873 13,345 3,162
Cropland, Pastureland & Rangeland 7 38,346 5,478 110 18,708 6,223
Pastureland --b --b --b --b --b --b
Pastureland & Rangeland --b --b --b --b --b --b
Rangeland 4 23,589 5,897 392 13,066 5,471
VERMONT 2 280 140 42 238 139
Cropland & Pastureland 1 238 238 238 238 --b
Forestland 1 42 42 42 42 --b
VIRGINIA 118 53,770 456 18 6,182 707

CStP FY2010_Appendix_Modified_Final_2-14-2012.docx
84
Table A 8. Conservation Stewardship Program: Contracts, Acres, and Obligations by Ranking Period, State, and Land Use, FY 2010
State and Land Use
CSP-2010-1 CSP-2010-2 Grand Total
Contracts Acres Obligations Contracts Acres Obligations Contracts Acres Obligations
Cropland 24 11,646 485 33 1,795 448
Cropland & Pastureland 36 16,442 457 28 1,945 493
Forestland 45 23,855 530 26 6,182 994
Pastureland 13 1,827 141 18 463 152
WASHINGTON 88 186,405 2,118 84 11,860 2,171
Cropland 49 95,406 1,947 84 10,374 1,809
Cropland & Pastureland 9 3,699 411 160 1,003 260
Cropland & Rangeland 16 51,836 3,240 755 7,034 1,845
Cropland, Pastureland & Rangeland 5 24,659 4,932 1,834 11,860 4,053
Forestland 4 2,768 692 136 1,366 559
Pastureland 2 543 272 267 276 7
Pastureland & Rangeland 2 386 193 122 263 100
Rangeland 1 7,109 7,109 7,109 7,109 --b
WEST VIRGINIA 76 18,517 244 13 1,268 267
Cropland 1 34 34 34 34 --b
Cropland & Pastureland 41 7,983 195 16 834 181
Forestland 31 10,354 334 13 1,268 344
Pastureland 3 145 48 41 61 11
WISCONSIN 516 171,981 333 19 3,164 375
Cropland 223 104,002 466 25 3,164 452
Cropland & Pastureland 163 47,393 291 29 1,653 288
Forestland 113 19,324 171 19 1,505 215
Pastureland 17 1,262 74 30 230 54
WYOMING 75 522,209 6,963 158 55,496 9,257
Cropland 3 2,015 672 165 932 439
Cropland & Pastureland 4 2,611 653 194 1,586 639
Cropland & Rangeland 20 133,526 6,676 253 27,262 7,432
Cropland, Pastureland & Rangeland 24 165,850 6,910 306 55,496 11,254
Forestland 2 2,201 1,101 158 2,043 1,333
Pastureland & Rangeland 10 85,180 8,518 506 19,313 6,532
Rangeland 12 130,826 10,902 2,185 43,175 11,410
Grand Total 10,612 12,606,679 1,188 2 165,400 3,577 bNot applicable.

CStP FY2010_Appendix_Modified_Final_2-14-2012.docx
85
Table A 10. Conservation Stewardship Program: Acre Statistics for Ranking Period 2 by State and Land Use, FY 2010
State and Land Uses Contracts Acres Avg Acres Min Acres Max Acres Std Dev Acres
ALABAMA 123 133,193 1,083 10 10,152 1,640
Cropland 21 20,826 992 26 2,789 770
Cropland & Pastureland 23 28,476 1,238 116 7,036 1,653
Forestland 43 68,897 1,602 13 10,152 2,235
Pastureland 36 14,994 417 10 3,356 716
ALASKA 3 8,150 2,717 115 6,215 3,147
Cropland 1 1,820 1,820 1,820 1,820 --b
Forestland 2 6,330 3,165 115 6,215 4,313
ARIZONA 17 361,676 21,275 229 207,647 50,372
Cropland 5 4,974 995 229 1,651 567
Cropland & Rangeland 3 54,885 18,295 2,074 49,746 27,242
Forestland 1 48,000 48,000 48,000 48,000 --b
Pastureland & Rangeland 1 2,089 2,089 2,089 2,089 --b
Rangeland 7 251,728 35,961 3,999 207,647 75,760
ARKANSAS 331 313,346 947 18 10,873 1,264
Cropland 191 253,348 1,326 35 10,873 1,493
Cropland & Pastureland 8 9,816 1,227 19 3,637 1,326
Forestland 59 24,283 412 18 2,294 462
Pastureland 73 25,899 355 34 1,612 342
CALIFORNIA 139 383,098 2,756 9 85,214 8,732
Cropland 72 52,110 724 18 5,612 1,024
Cropland & Pastureland 4 1,240 310 156 449 147
Cropland & Rangeland 12 31,908 2,659 100 10,647 2,899
Cropland, Pastureland & Rangeland 5 11,929 2,386 586 7,608 2,937
Forestland 6 52,775 8,796 9 50,000 20,206
Pastureland 5 3,838 768 493 1,544 438
Pastureland & Rangeland 12 42,370 3,531 197 9,114 3,386
Rangeland 23 186,928 8,127 155 85,214 17,735
COLORADO 221 606,119 2,743 32 44,125 4,417
Cropland 91 149,631 1,644 137 6,130 1,430
Cropland & Pastureland 5 3,710 742 204 1,436 508
Cropland & Rangeland 66 240,033 3,637 67 44,125 5,975
Cropland, Pastureland & Rangeland 14 24,371 1,741 194 6,231 1,827
Forestland 3 1,135 378 50 800 384
Pastureland 1 32 32 32 32 --b
Pastureland & Rangeland 4 8,199 2,050 36 4,312 2,294
Rangeland 36 178,460 4,957 44 33,428 6,149
Data Unavailablea 1 549 549 549 549 --b
CONNECTICUT 5 6,514 1,303 13 6,041 2,650
Cropland 1 220 220 220 220 --b
Forestland 4 6,294 1,574 13 6,041 2,979
DELAWARE 10 6,478 648 59 2,416 699
Cropland 7 5,684 812 59 2,416 792
Forestland 2 575 288 233 342 77
Pastureland 1 219 219 219 219 --b
FLORIDA 49 41,552 848 20 7,225 1,279
Cropland 8 3,769 471 20 1,070 401
Cropland & Pastureland 10 8,542 854 93 1,796 592
Cropland, Pastureland & Rangeland 4 8,045 2,011 482 5,276 2,200
Forestland 14 5,800 414 27 2,074 519
Pastureland 10 4,101 410 20 1,290 424
Pastureland & Rangeland 3 11,296 3,765 1,995 7,225 2,997
GEORGIA 418 264,056 632 11 7,552 750
Cropland 146 87,063 596 11 2,719 537
Cropland & Pastureland 55 35,681 649 11 2,044 452
Forestland 176 115,751 658 12 7,552 941
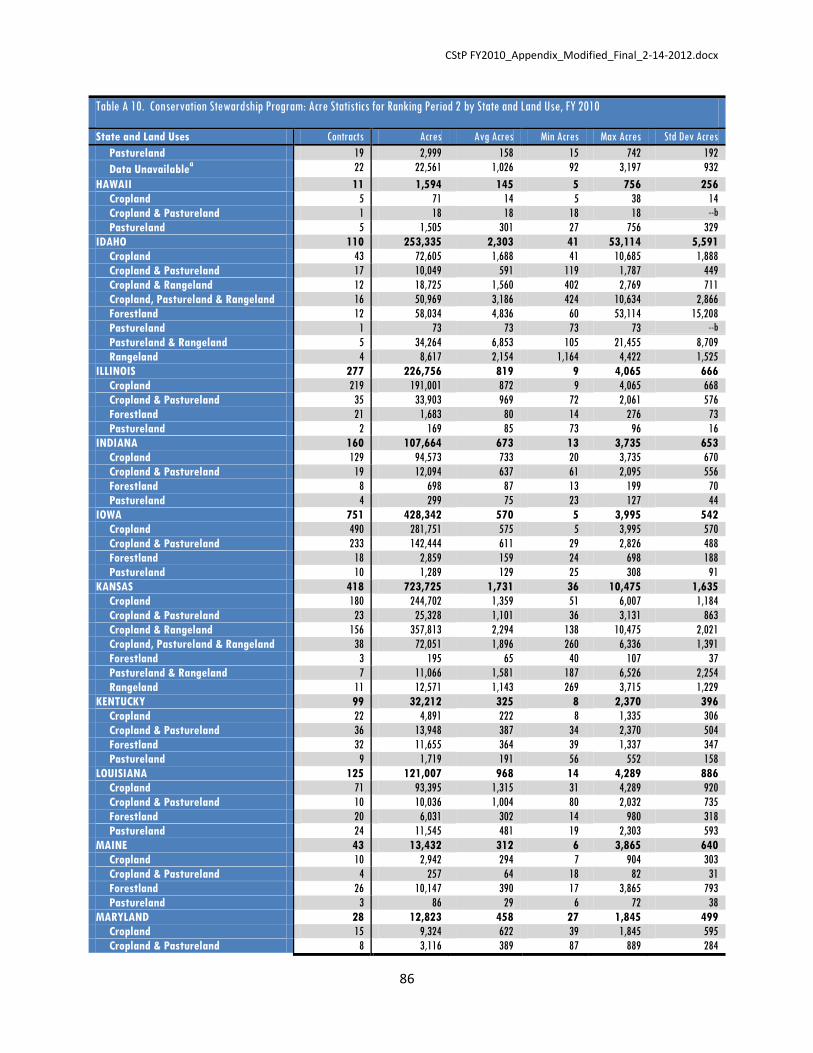
CStP FY2010_Appendix_Modified_Final_2-14-2012.docx
86
Table A 10. Conservation Stewardship Program: Acre Statistics for Ranking Period 2 by State and Land Use, FY 2010
State and Land Uses Contracts Acres Avg Acres Min Acres Max Acres Std Dev Acres
Pastureland 19 2,999 158 15 742 192
Data Unavailablea 22 22,561 1,026 92 3,197 932
HAWAII 11 1,594 145 5 756 256
Cropland 5 71 14 5 38 14
Cropland & Pastureland 1 18 18 18 18 --b
Pastureland 5 1,505 301 27 756 329
IDAHO 110 253,335 2,303 41 53,114 5,591
Cropland 43 72,605 1,688 41 10,685 1,888
Cropland & Pastureland 17 10,049 591 119 1,787 449
Cropland & Rangeland 12 18,725 1,560 402 2,769 711
Cropland, Pastureland & Rangeland 16 50,969 3,186 424 10,634 2,866
Forestland 12 58,034 4,836 60 53,114 15,208
Pastureland 1 73 73 73 73 --b
Pastureland & Rangeland 5 34,264 6,853 105 21,455 8,709
Rangeland 4 8,617 2,154 1,164 4,422 1,525
ILLINOIS 277 226,756 819 9 4,065 666
Cropland 219 191,001 872 9 4,065 668
Cropland & Pastureland 35 33,903 969 72 2,061 576
Forestland 21 1,683 80 14 276 73
Pastureland 2 169 85 73 96 16
INDIANA 160 107,664 673 13 3,735 653
Cropland 129 94,573 733 20 3,735 670
Cropland & Pastureland 19 12,094 637 61 2,095 556
Forestland 8 698 87 13 199 70
Pastureland 4 299 75 23 127 44
IOWA 751 428,342 570 5 3,995 542
Cropland 490 281,751 575 5 3,995 570
Cropland & Pastureland 233 142,444 611 29 2,826 488
Forestland 18 2,859 159 24 698 188
Pastureland 10 1,289 129 25 308 91
KANSAS 418 723,725 1,731 36 10,475 1,635
Cropland 180 244,702 1,359 51 6,007 1,184
Cropland & Pastureland 23 25,328 1,101 36 3,131 863
Cropland & Rangeland 156 357,813 2,294 138 10,475 2,021
Cropland, Pastureland & Rangeland 38 72,051 1,896 260 6,336 1,391
Forestland 3 195 65 40 107 37
Pastureland & Rangeland 7 11,066 1,581 187 6,526 2,254
Rangeland 11 12,571 1,143 269 3,715 1,229
KENTUCKY 99 32,212 325 8 2,370 396
Cropland 22 4,891 222 8 1,335 306
Cropland & Pastureland 36 13,948 387 34 2,370 504
Forestland 32 11,655 364 39 1,337 347
Pastureland 9 1,719 191 56 552 158
LOUISIANA 125 121,007 968 14 4,289 886
Cropland 71 93,395 1,315 31 4,289 920
Cropland & Pastureland 10 10,036 1,004 80 2,032 735
Forestland 20 6,031 302 14 980 318
Pastureland 24 11,545 481 19 2,303 593
MAINE 43 13,432 312 6 3,865 640
Cropland 10 2,942 294 7 904 303
Cropland & Pastureland 4 257 64 18 82 31
Forestland 26 10,147 390 17 3,865 793
Pastureland 3 86 29 6 72 38
MARYLAND 28 12,823 458 27 1,845 499
Cropland 15 9,324 622 39 1,845 595
Cropland & Pastureland 8 3,116 389 87 889 284

CStP FY2010_Appendix_Modified_Final_2-14-2012.docx
87
Table A 10. Conservation Stewardship Program: Acre Statistics for Ranking Period 2 by State and Land Use, FY 2010
State and Land Uses Contracts Acres Avg Acres Min Acres Max Acres Std Dev Acres
Forestland 5 384 77 27 185 65
MASSACHUSETTS 7 5,498 785 53 2,951 1,038
Cropland 1 208 208 208 208 --b
Cropland & Pastureland 1 53 53 53 53 --b
Forestland 5 5,237 1,047 261 2,951 1,146
MICHIGAN 273 125,117 458 6 4,960 550
Cropland 154 97,119 631 6 2,928 549
Cropland & Pastureland 16 3,385 212 46 478 141
Forestland 102 24,492 240 10 4,960 500
Pastureland 1 120 120 120 120 --b
MINNESOTA 669 448,101 670 6 6,988 802
Cropland 355 322,147 907 6 6,988 872
Cropland & Pastureland 134 76,023 567 24 4,158 535
Forestland 159 41,356 260 25 6,422 616
Pastureland 21 8,575 408 23 3,192 816
MISSISSIPPI 194 259,304 1,337 8 4,668 1,120
Cropland 131 228,408 1,744 96 4,668 1,082
Cropland & Pastureland 17 13,042 767 104 3,404 941
Forestland 33 14,693 445 8 1,477 434
Pastureland 13 3,162 243 12 818 237
MISSOURI 933 473,327 507 3 5,893 625
Cropland 234 184,742 789 3 4,238 752
Cropland & Pastureland 221 144,847 655 24 3,166 568
Forestland 196 56,612 289 10 4,673 529
Pastureland 282 87,128 309 5 5,893 474
MONTANA 264 883,579 3,347 50 19,710 3,249
Cropland 63 115,380 1,831 145 7,512 1,483
Cropland & Pastureland 19 18,999 1,000 85 5,502 1,280
Cropland & Rangeland 36 122,383 3,400 708 15,071 2,358
Cropland, Pastureland & Rangeland 108 507,463 4,699 53 19,710 3,608
Forestland 17 17,224 1,013 50 2,361 868
Pastureland 1 73 73 73 73 --b
Pastureland & Rangeland 15 57,917 3,861 313 14,776 3,835
Rangeland 5 44,141 8,828 3,026 13,974 5,020
NEBRASKA 535 1,053,015 1,968 3 41,124 3,413
Cropland 192 158,300 824 3 4,163 734
Cropland & Pastureland 66 54,943 832 11 3,334 644
Cropland & Rangeland 152 485,704 3,195 60 41,124 4,212
Cropland, Pastureland & Rangeland 36 92,933 2,581 151 14,638 2,892
Forestland 3 1,087 362 47 552 275
Pastureland 10 1,172 117 28 250 89
Pastureland & Rangeland 12 28,972 2,414 147 6,363 2,623
Rangeland 62 228,073 3,679 108 40,431 6,051
Data Unavailablea 2 1,832 916 325 1,507 836
NEVADA 13 10,911 839 107 3,349 877
Cropland 4 1,155 289 107 530 213
Cropland & Pastureland 3 1,228 409 160 534 216
Cropland & Rangeland 3 5,058 1,686 655 3,349 1,454
Cropland, Pastureland & Rangeland 2 2,391 1,196 671 1,720 742
Pastureland & Rangeland 1 1,079 1,079 1,079 1,079 --b
NEW HAMPSHIRE 5 1,126 225 91 316 88
Cropland 1 316 316 316 316 --b
Cropland & Pastureland 2 373 187 91 283 136
Forestland 2 437 218 192 244 37
NEW JERSEY 9 2,468 274 60 837 253
Cropland 7 2,236 319 117 837 271

CStP FY2010_Appendix_Modified_Final_2-14-2012.docx
88
Table A 10. Conservation Stewardship Program: Acre Statistics for Ranking Period 2 by State and Land Use, FY 2010
State and Land Uses Contracts Acres Avg Acres Min Acres Max Acres Std Dev Acres
Cropland & Pastureland 2 232 116 60 172 79
NEW MEXICO 61 541,869 8,883 47 47,110 10,039
Cropland 3 2,770 923 184 2,185 1,098
Cropland & Rangeland 5 16,498 3,300 736 6,926 2,268
Forestland 2 21,450 10,725 55 21,395 15,090
Pastureland 1 47 47 47 47 --b
Pastureland & Rangeland 3 28,800 9,600 521 27,580 15,572
Rangeland 47 472,304 10,049 453 47,110 10,231
NEW YORK 167 82,401 493 11 4,007 667
Cropland 46 39,119 850 15 4,007 770
Cropland & Pastureland 41 29,482 719 43 2,731 829
Forestland 74 13,431 182 11 1,400 218
Pastureland 6 370 62 35 182 59
NORTH CAROLINA 103 40,008 388 10 3,908 543
Cropland 23 11,894 517 10 1,645 525
Cropland & Pastureland 29 7,917 273 25 899 259
Forestland 42 18,990 452 32 3,908 707
Pastureland 9 1,207 134 12 387 131
NORTH DAKOTA 326 663,817 2,036 39 64,403 3,814
Cropland 180 277,520 1,542 104 11,045 1,316
Cropland & Pastureland 20 22,392 1,120 381 2,499 579
Cropland & Rangeland 32 65,951 2,061 368 6,194 1,241
Cropland, Pastureland & Rangeland 72 262,943 3,652 491 64,403 7,527
Forestland 3 446 149 39 345 170
Pastureland & Rangeland 11 24,017 2,183 157 9,049 2,557
Rangeland 8 10,548 1,318 80 4,228 1,373
OHIO 90 43,951 488 20 2,583 589
Cropland 55 33,570 610 22 2,441 592
Cropland & Pastureland 13 6,971 536 62 2,583 814
Forestland 21 3,382 161 20 821 181
Pastureland 1 28 28 28 28 --b
OKLAHOMA 456 590,901 1,296 11 10,542 1,521
Cropland 36 30,311 842 17 3,773 957
Cropland & Pastureland 29 19,869 685 39 1,919 603
Cropland & Rangeland 22 38,710 1,760 154 5,436 1,809
Cropland, Pastureland & Rangeland 170 315,514 1,856 153 10,407 1,564
Forestland 14 8,934 638 40 3,510 949
Pastureland 90 38,064 423 11 2,893 516
Pastureland & Rangeland 70 109,070 1,558 79 10,542 1,981
Rangeland 25 30,429 1,217 57 5,850 1,653
OREGON 171 490,752 2,870 5 30,665 4,353
Cropland 43 79,681 1,853 5 7,165 1,872
Cropland & Pastureland 9 2,499 278 34 1,499 469
Cropland & Rangeland 30 131,815 4,394 326 30,665 5,997
Cropland, Pastureland & Rangeland 28 135,073 4,824 325 17,636 4,634
Forestland 37 60,060 1,623 17 18,543 3,480
Pastureland 3 341 114 13 170 88
Pastureland & Rangeland 4 35,206 8,802 3,392 13,300 4,643
Rangeland 16 44,361 2,773 153 22,564 5,443
Data Unavailablea 1 1,716 1,716 1,716 1,716 --b
PENNSYLVANIA 300 96,864 323 7 3,412 411
Cropland 109 44,284 406 10 2,497 440
Cropland & Pastureland 110 36,843 335 20 2,385 376
Forestland 72 15,225 211 25 3,412 408
Pastureland 9 513 57 7 231 72
RHODE ISLAND 18 2,586 144 3 1,785 412

CStP FY2010_Appendix_Modified_Final_2-14-2012.docx
89
Table A 10. Conservation Stewardship Program: Acre Statistics for Ranking Period 2 by State and Land Use, FY 2010
State and Land Uses Contracts Acres Avg Acres Min Acres Max Acres Std Dev Acres
Cropland 1 12 12 12 12 --b
Cropland & Pastureland 1 12 12 12 12 --b
Forestland 14 2,549 182 7 1,785 463
Pastureland 2 13 7 3 10 5
SOUTH CAROLINA 176 95,621 543 3 4,623 654
Cropland 56 44,683 798 3 4,623 845
Cropland & Pastureland 8 3,048 381 64 1,213 376
Forestland 88 44,582 507 40 2,908 549
Pastureland 24 3,309 138 9 481 138
SOUTH DAKOTA 244 606,024 2,484 67 13,554 2,510
Cropland 75 103,097 1,375 71 9,093 1,376
Cropland & Pastureland 32 46,455 1,452 381 6,483 1,252
Cropland & Rangeland 79 226,463 2,867 136 9,994 2,122
Cropland, Pastureland & Rangeland 15 36,886 2,459 67 11,633 2,978
Forestland 1 243 243 243 243 --b
Pastureland 4 3,698 924 190 2,735 1,217
Pastureland & Rangeland 2 4,446 2,223 684 3,762 2,177
Rangeland 36 184,737 5,132 158 13,554 3,597
TENNESSEE 241 90,623 376 10 3,988 636
Cropland 39 33,678 864 23 3,153 844
Cropland & Pastureland 52 12,881 248 20 1,518 260
Forestland 89 37,751 424 10 3,988 756
Pastureland 61 6,313 103 10 994 141
TEXAS 295 699,688 2,372 29 113,251 7,695
Cropland 53 50,668 956 61 6,660 1,092
Cropland & Pastureland 27 28,690 1,063 54 3,908 930
Cropland & Rangeland 34 122,034 3,589 255 15,350 3,600
Cropland, Pastureland & Rangeland 27 76,572 2,836 185 9,235 2,445
Forestland 33 10,529 319 29 1,640 360
Pastureland 63 32,157 510 40 4,131 774
Pastureland & Rangeland 19 45,442 2,392 383 12,218 3,397
Rangeland 38 333,346 8,772 325 113,251 19,704
Data Unavailablea 1 248 248 248 248 --b
UTAH 61 213,677 3,503 36 27,806 5,407
Cropland 14 15,050 1,075 38 3,466 1,112
Cropland & Pastureland 7 6,555 936 36 2,610 891
Cropland & Rangeland 13 100,067 7,697 87 27,806 8,027
Cropland, Pastureland & Rangeland 19 81,868 4,309 139 16,926 5,483
Pastureland 2 161 80 68 93 18
Pastureland & Rangeland 3 3,603 1,201 400 2,627 1,238
Rangeland 3 6,373 2,124 1,640 2,917 692
VERMONT 5 2,282 456 178 870 287
Cropland & Pastureland 2 1,039 520 470 570 71
Forestland 3 1,243 414 178 870 395
VIRGINIA 152 93,074 612 10 7,770 864
Cropland 59 37,653 638 10 4,101 671
Cropland & Pastureland 45 18,106 402 111 1,831 323
Forestland 39 36,330 932 46 7,770 1,392
Pastureland 9 985 109 26 308 90
WASHINGTON 118 261,922 2,220 40 19,214 2,673
Cropland 71 133,183 1,876 87 12,647 1,857
Cropland & Pastureland 10 10,652 1,065 221 3,018 999
Cropland & Rangeland 12 57,646 4,804 194 19,214 5,157
Cropland, Pastureland & Rangeland 4 12,316 3,079 1,249 7,566 3,001
Forestland 12 9,884 824 40 3,372 1,224
Pastureland & Rangeland 4 17,496 4,374 849 8,178 3,039

CStP FY2010_Appendix_Modified_Final_2-14-2012.docx
90
Table A 10. Conservation Stewardship Program: Acre Statistics for Ranking Period 2 by State and Land Use, FY 2010
State and Land Uses Contracts Acres Avg Acres Min Acres Max Acres Std Dev Acres
Rangeland 5 20,745 4,149 232 8,200 3,757
WEST VIRGINIA 177 54,928 310 1 11,682 953
Cropland 8 566 71 1 325 116
Cropland & Pastureland 86 15,851 184 8 812 154
Forestland 76 37,818 498 4 11,682 1,428
Pastureland 7 693 99 6 386 132
WISCONSIN 452 188,009 416 8 3,845 530
Cropland 239 128,923 539 13 2,985 604
Cropland & Pastureland 102 38,054 373 8 1,997 363
Forestland 101 20,223 200 18 3,845 408
Pastureland 10 809 81 8 261 78
WYOMING 102 391,134 3,835 165 18,002 3,992
Cropland 17 20,622 1,213 165 4,278 1,128
Cropland & Pastureland 9 8,178 909 218 3,189 1,138
Cropland & Rangeland 21 87,407 4,162 583 15,610 3,676
Cropland, Pastureland & Rangeland 32 121,414 3,794 192 10,323 3,062
Pastureland & Rangeland 8 49,166 6,146 307 15,495 5,318
Rangeland 15 104,347 6,956 1,180 18,002 5,573
Grand Total 9,955 12,557,648 1,261 1 207,647 3,602 aContract data are not available electronically. Contracts are stored in county offices.
bNot applicable.

CStP FY2010_Appendix_Modified_Final_2-14-2012.docx
91
Table A 11. Conservation Stewardship Program: Acre Statistics for Two Ranking Periods by State and Land Use, FY 2010
State and Land Uses Contracts Acres Avg Acres Min Acres Max Acres Std Dev Acres
ALABAMA 431 348,905 810 10 10,152 1,264
Cropland 52 33,896 652 26 2,789 679
Cropland & Pastureland 57 47,323 830 29 7,036 1,224
Forestland 252 241,523 958 13 10,152 1,460
Pastureland 70 26,163 374 10 3,356 596
ALASKA 14 182,565 13,040 115 88,164 25,598
Cropland 3 3,189 1,063 423 1,820 706
Cropland, Pastureland & Rangeland 1 917 917 917 917 --b
Forestland 9 177,957 19,773 115 88,164 30,363
Pastureland 1 503 503 503 503 --b
ARIZONA 56 821,643 14,672 135 207,647 39,124
Cropland 13 10,501 808 135 1,945 604
Cropland & Rangeland 6 69,235 11,539 2,074 49,746 18,764
Cropland, Pastureland & Rangeland 3 7,724 2,575 304 6,704 3,582
Forestland 1 48,000 48,000 48,000 48,000 --b
Pastureland & Rangeland 6 42,113 7,019 406 27,513 10,665
Rangeland 27 644,070 23,854 280 207,647 53,742
ARKANSAS 620 569,519 919 18 10,873 1,152
Cropland 365 464,727 1,273 35 10,873 1,321
Cropland & Pastureland 16 12,771 798 19 3,637 1,065
Forestland 108 47,278 438 18 3,783 605
Pastureland 131 44,743 342 32 2,127 335
CALIFORNIA 337 721,128 2,140 8 85,214 5,992
Cropland 151 101,879 675 8 10,645 1,167
Cropland & Pastureland 15 6,429 429 31 1,834 428
Cropland & Rangeland 31 60,059 1,937 78 10,647 2,296
Cropland, Pastureland & Rangeland 17 75,027 4,413 121 19,270 5,216
Forestland 20 62,774 3,139 9 50,000 11,055
Pastureland 10 6,228 623 30 1,843 611
Pastureland & Rangeland 26 79,404 3,054 197 15,485 3,589
Rangeland 67 329,329 4,915 155 85,214 10,716
COLORADO 469 1,264,376 2,696 10 48,000 4,527
Cropland 158 250,860 1,588 27 9,440 1,546
Cropland & Pastureland 16 9,006 563 10 1,894 554
Cropland & Rangeland 148 489,145 3,305 67 44,125 4,480
Cropland, Pastureland & Rangeland 30 60,577 2,019 194 6,231 1,563
Forestland 10 2,980 298 50 1,200 388
Pastureland 2 192 96 32 160 91
Pastureland & Rangeland 8 13,155 1,644 36 4,312 1,722
Rangeland 96 437,913 4,562 22 48,000 7,547
Data Unavailablea 1 549 549 549 549 --b
CONNECTICUT 13 8,467 651 13 6,041 1,643
Cropland 5 656 131 16 230 95
Cropland & Pastureland 1 212 212 212 212 --b
Forestland 7 7,598 1,085 13 6,041 2,218
DELAWARE 25 14,448 578 9 2,416 567
Cropland 19 13,201 695 47 2,416 604
Cropland & Pastureland 1 9 9 9 9 --b
Forestland 4 1,020 255 169 342 73
Pastureland 1 219 219 219 219 --b
FLORIDA 95 65,279 687 14 9,758 1,369
Cropland 17 6,556 386 14 1,070 362
Cropland & Pastureland 18 10,005 556 28 1,796 559
Cropland, Pastureland & Rangeland 5 8,261 1,652 216 5,276 2,067
Forestland 26 9,081 349 27 2,074 434
Pastureland 21 8,358 398 19 2,207 566

CStP FY2010_Appendix_Modified_Final_2-14-2012.docx
92
Table A 11. Conservation Stewardship Program: Acre Statistics for Two Ranking Periods by State and Land Use, FY 2010
State and Land Uses Contracts Acres Avg Acres Min Acres Max Acres Std Dev Acres
Pastureland & Rangeland 8 23,018 2,877 95 9,758 3,604
GEORGIA 584 354,906 608 7 7,552 718
Cropland 194 122,369 631 7 4,298 616
Cropland & Pastureland 83 47,913 577 11 2,044 439
Forestland 252 156,788 622 12 7,552 849
Pastureland 33 5,275 160 7 1,000 228
Data Unavailablea 22 22,561 1,026 92 3,197 932
HAWAII 16 7,098 444 5 4,563 1,132
Cropland 6 131 22 5 60 22
Cropland & Pastureland 2 37 18 18 19 0
Pastureland 8 6,930 866 27 4,563 1,529
IDAHO 202 351,087 1,738 41 53,114 4,216
Cropland 95 125,764 1,324 41 10,685 1,459
Cropland & Pastureland 22 17,647 802 119 3,585 808
Cropland & Rangeland 14 22,823 1,630 402 2,769 713
Cropland, Pastureland & Rangeland 32 68,142 2,129 64 10,634 2,319
Forestland 24 66,773 2,782 60 53,114 10,750
Pastureland 2 260 130 73 187 81
Pastureland & Rangeland 8 40,857 5,107 105 21,455 7,110
Rangeland 5 8,822 1,764 205 4,422 1,583
ILLINOIS 542 402,697 743 4 4,065 637
Cropland 423 340,344 805 4 4,065 645
Cropland & Pastureland 70 57,185 817 69 2,061 554
Forestland 44 4,627 105 11 971 161
Pastureland 5 541 108 73 157 31
INDIANA 308 211,565 687 12 3,735 670
Cropland 243 182,027 749 20 3,735 695
Cropland & Pastureland 37 25,543 690 31 2,095 535
Forestland 21 3,261 155 12 1,165 247
Pastureland 7 734 105 23 309 96
IOWA 1,480 797,605 539 3 3,995 506
Cropland 994 528,604 532 5 3,995 515
Cropland & Pastureland 427 258,424 605 3 3,022 490
Cropland, Pastureland & Rangeland 1 1,581 1,581 1,581 1,581 --b
Forestland 38 5,200 137 24 698 145
Pastureland 20 3,797 190 25 654 151
KANSAS 872 1,216,415 1,395 4 16,639 1,663
Cropland 442 431,794 977 4 10,888 1,167
Cropland & Pastureland 43 42,278 983 36 3,131 826
Cropland & Rangeland 281 582,364 2,072 69 16,639 2,110
Cropland, Pastureland & Rangeland 61 96,803 1,587 260 6,336 1,270
Forestland 5 349 70 38 116 39
Pastureland & Rangeland 9 11,800 1,311 187 6,526 2,024
Rangeland 31 51,027 1,646 40 9,787 2,436
KENTUCKY 182 62,111 341 8 2,542 415
Cropland 31 9,300 300 8 2,542 500
Cropland & Pastureland 65 22,618 348 34 2,370 438
Forestland 64 26,386 412 39 1,541 401
Pastureland 22 3,807 173 40 552 125
LOUISIANA 321 264,940 825 8 6,584 989
Cropland 142 182,077 1,282 17 5,276 1,059
Cropland & Pastureland 30 27,546 918 53 3,383 875
Forestland 75 30,329 404 14 6,584 856
Pastureland 74 24,988 338 8 2,303 495
MAINE 102 70,381 690 6 32,550 3,240
Cropland 18 8,266 459 7 2,162 610

CStP FY2010_Appendix_Modified_Final_2-14-2012.docx
93
Table A 11. Conservation Stewardship Program: Acre Statistics for Two Ranking Periods by State and Land Use, FY 2010
State and Land Uses Contracts Acres Avg Acres Min Acres Max Acres Std Dev Acres
Cropland & Pastureland 12 2,672 223 18 586 194
Forestland 66 59,254 898 17 32,550 4,008
Pastureland 6 189 32 6 72 31
MARYLAND 65 24,249 373 6 1,845 453
Cropland 29 15,259 526 6 1,845 533
Cropland & Pastureland 21 7,748 369 20 1,659 399
Forestland 14 1,203 86 16 330 84
Pastureland 1 40 40 40 40 --b
MASSACHUSETTS 11 7,324 666 53 2,951 863
Cropland 1 208 208 208 208 --b
Cropland & Pastureland 3 444 148 53 232 90
Forestland 7 6,672 953 256 2,951 986
MICHIGAN 544 229,963 423 6 4,960 533
Cropland 276 166,240 602 6 4,491 574
Cropland & Pastureland 35 9,116 260 46 715 184
Forestland 226 52,921 234 10 4,960 441
Pastureland 7 1,687 241 48 584 231
MINNESOTA 1,575 915,761 581 2 17,035 830
Cropland 765 629,294 823 2 7,483 839
Cropland & Pastureland 349 175,820 504 10 4,158 474
Forestland 417 98,207 236 3 17,035 922
Pastureland 44 12,440 283 23 3,192 578
MISSISSIPPI 319 352,265 1,104 8 6,470 1,141
Cropland 161 284,471 1,767 96 6,470 1,130
Cropland & Pastureland 31 23,346 753 54 4,127 1,043
Forestland 99 38,504 389 8 4,286 540
Pastureland 28 5,944 212 12 818 201
MISSOURI 1,939 976,001 503 3 9,448 640
Cropland 497 364,323 733 3 5,202 721
Cropland & Pastureland 442 307,648 696 23 5,034 639
Forestland 432 125,199 290 10 9,448 615
Pastureland 568 178,831 315 5 5,893 444
MONTANA 486 1,810,055 3,724 47 68,589 4,547
Cropland 134 279,160 2,083 68 11,383 1,759
Cropland & Pastureland 31 22,644 730 47 5,502 1,057
Cropland & Rangeland 67 286,539 4,277 418 20,805 3,795
Cropland, Pastureland & Rangeland 189 1,022,705 5,411 53 68,589 5,829
Forestland 31 34,484 1,112 50 5,188 1,205
Pastureland 2 326 163 73 253 127
Pastureland & Rangeland 25 109,269 4,371 313 18,477 4,525
Rangeland 7 54,929 7,847 1,666 13,974 4,924
NEBRASKA 1,106 1,836,928 1,661 3 41,124 3,025
Cropland 399 275,186 690 3 5,641 716
Cropland & Pastureland 126 96,097 763 11 4,758 740
Cropland & Rangeland 290 883,409 3,046 34 41,124 4,135
Cropland, Pastureland & Rangeland 60 142,523 2,375 151 14,638 2,600
Forestland 40 5,276 132 10 1,064 228
Pastureland 27 3,504 130 15 382 91
Pastureland & Rangeland 26 51,968 1,999 32 7,903 2,317
Rangeland 136 377,133 2,773 62 40,431 4,689
Data Unavailablea 2 1,832 916 325 1,507 836
NEVADA 17 23,829 1,402 107 6,873 1,693
Cropland 5 3,512 702 107 2,357 943
Cropland & Pastureland 3 1,228 409 160 534 216
Cropland & Rangeland 3 5,058 1,686 655 3,349 1,454
Cropland, Pastureland & Rangeland 5 12,952 2,590 671 6,873 2,510
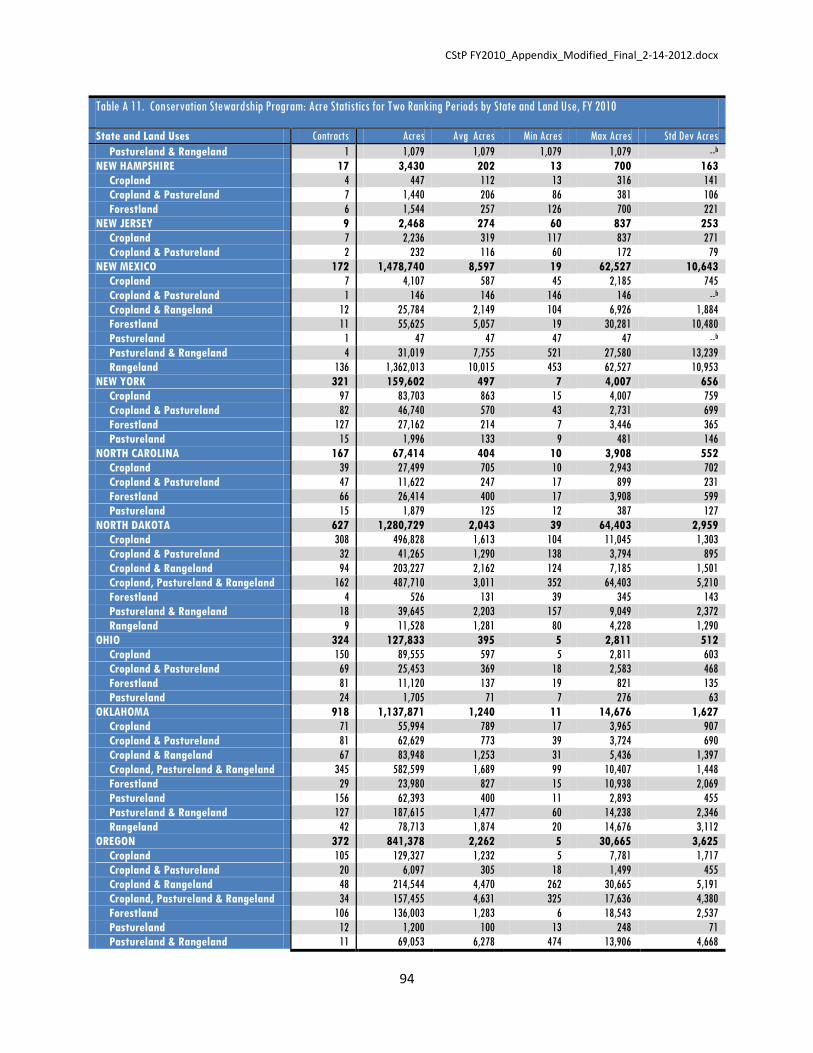
CStP FY2010_Appendix_Modified_Final_2-14-2012.docx
94
Table A 11. Conservation Stewardship Program: Acre Statistics for Two Ranking Periods by State and Land Use, FY 2010
State and Land Uses Contracts Acres Avg Acres Min Acres Max Acres Std Dev Acres
Pastureland & Rangeland 1 1,079 1,079 1,079 1,079 --b
NEW HAMPSHIRE 17 3,430 202 13 700 163
Cropland 4 447 112 13 316 141
Cropland & Pastureland 7 1,440 206 86 381 106
Forestland 6 1,544 257 126 700 221
NEW JERSEY 9 2,468 274 60 837 253
Cropland 7 2,236 319 117 837 271
Cropland & Pastureland 2 232 116 60 172 79
NEW MEXICO 172 1,478,740 8,597 19 62,527 10,643
Cropland 7 4,107 587 45 2,185 745
Cropland & Pastureland 1 146 146 146 146 --b
Cropland & Rangeland 12 25,784 2,149 104 6,926 1,884
Forestland 11 55,625 5,057 19 30,281 10,480
Pastureland 1 47 47 47 47 --b
Pastureland & Rangeland 4 31,019 7,755 521 27,580 13,239
Rangeland 136 1,362,013 10,015 453 62,527 10,953
NEW YORK 321 159,602 497 7 4,007 656
Cropland 97 83,703 863 15 4,007 759
Cropland & Pastureland 82 46,740 570 43 2,731 699
Forestland 127 27,162 214 7 3,446 365
Pastureland 15 1,996 133 9 481 146
NORTH CAROLINA 167 67,414 404 10 3,908 552
Cropland 39 27,499 705 10 2,943 702
Cropland & Pastureland 47 11,622 247 17 899 231
Forestland 66 26,414 400 17 3,908 599
Pastureland 15 1,879 125 12 387 127
NORTH DAKOTA 627 1,280,729 2,043 39 64,403 2,959
Cropland 308 496,828 1,613 104 11,045 1,303
Cropland & Pastureland 32 41,265 1,290 138 3,794 895
Cropland & Rangeland 94 203,227 2,162 124 7,185 1,501
Cropland, Pastureland & Rangeland 162 487,710 3,011 352 64,403 5,210
Forestland 4 526 131 39 345 143
Pastureland & Rangeland 18 39,645 2,203 157 9,049 2,372
Rangeland 9 11,528 1,281 80 4,228 1,290
OHIO 324 127,833 395 5 2,811 512
Cropland 150 89,555 597 5 2,811 603
Cropland & Pastureland 69 25,453 369 18 2,583 468
Forestland 81 11,120 137 19 821 135
Pastureland 24 1,705 71 7 276 63
OKLAHOMA 918 1,137,871 1,240 11 14,676 1,627
Cropland 71 55,994 789 17 3,965 907
Cropland & Pastureland 81 62,629 773 39 3,724 690
Cropland & Rangeland 67 83,948 1,253 31 5,436 1,397
Cropland, Pastureland & Rangeland 345 582,599 1,689 99 10,407 1,448
Forestland 29 23,980 827 15 10,938 2,069
Pastureland 156 62,393 400 11 2,893 455
Pastureland & Rangeland 127 187,615 1,477 60 14,238 2,346
Rangeland 42 78,713 1,874 20 14,676 3,112
OREGON 372 841,378 2,262 5 30,665 3,625
Cropland 105 129,327 1,232 5 7,781 1,717
Cropland & Pastureland 20 6,097 305 18 1,499 455
Cropland & Rangeland 48 214,544 4,470 262 30,665 5,191
Cropland, Pastureland & Rangeland 34 157,455 4,631 325 17,636 4,380
Forestland 106 136,003 1,283 6 18,543 2,537
Pastureland 12 1,200 100 13 248 71
Pastureland & Rangeland 11 69,053 6,278 474 13,906 4,668
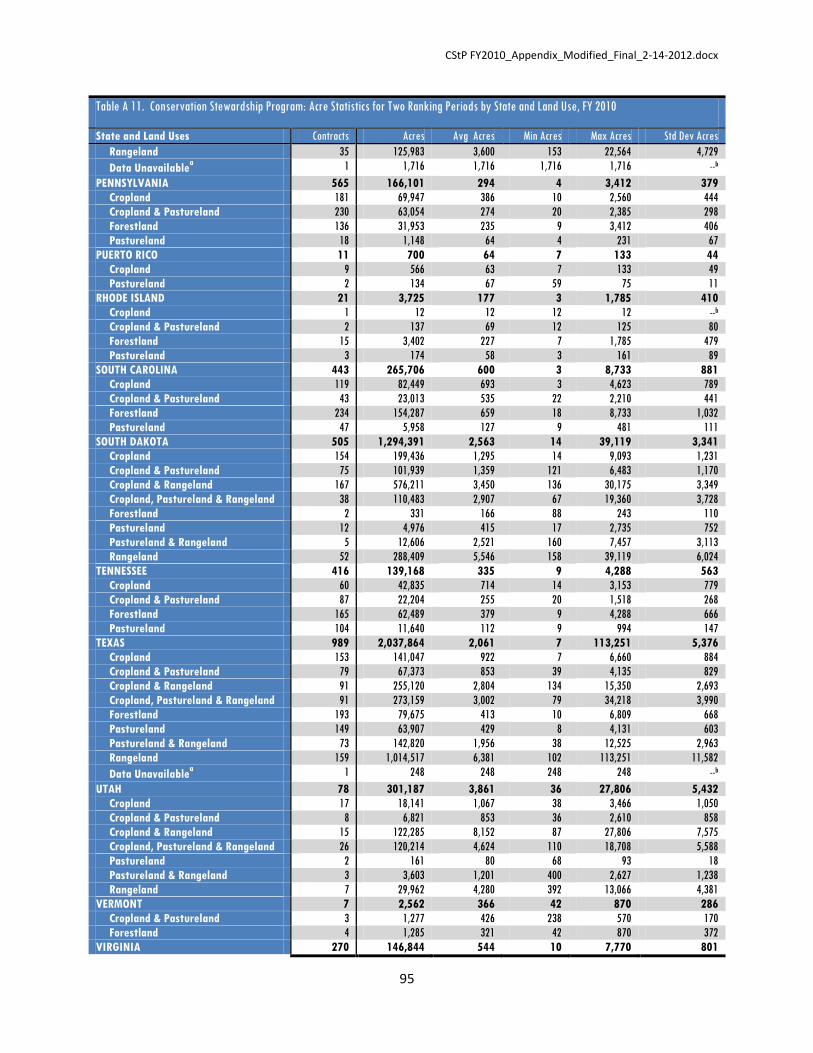
CStP FY2010_Appendix_Modified_Final_2-14-2012.docx
95
Table A 11. Conservation Stewardship Program: Acre Statistics for Two Ranking Periods by State and Land Use, FY 2010
State and Land Uses Contracts Acres Avg Acres Min Acres Max Acres Std Dev Acres
Rangeland 35 125,983 3,600 153 22,564 4,729
Data Unavailablea 1 1,716 1,716 1,716 1,716 --b
PENNSYLVANIA 565 166,101 294 4 3,412 379
Cropland 181 69,947 386 10 2,560 444
Cropland & Pastureland 230 63,054 274 20 2,385 298
Forestland 136 31,953 235 9 3,412 406
Pastureland 18 1,148 64 4 231 67
PUERTO RICO 11 700 64 7 133 44
Cropland 9 566 63 7 133 49
Pastureland 2 134 67 59 75 11
RHODE ISLAND 21 3,725 177 3 1,785 410
Cropland 1 12 12 12 12 --b
Cropland & Pastureland 2 137 69 12 125 80
Forestland 15 3,402 227 7 1,785 479
Pastureland 3 174 58 3 161 89
SOUTH CAROLINA 443 265,706 600 3 8,733 881
Cropland 119 82,449 693 3 4,623 789
Cropland & Pastureland 43 23,013 535 22 2,210 441
Forestland 234 154,287 659 18 8,733 1,032
Pastureland 47 5,958 127 9 481 111
SOUTH DAKOTA 505 1,294,391 2,563 14 39,119 3,341
Cropland 154 199,436 1,295 14 9,093 1,231
Cropland & Pastureland 75 101,939 1,359 121 6,483 1,170
Cropland & Rangeland 167 576,211 3,450 136 30,175 3,349
Cropland, Pastureland & Rangeland 38 110,483 2,907 67 19,360 3,728
Forestland 2 331 166 88 243 110
Pastureland 12 4,976 415 17 2,735 752
Pastureland & Rangeland 5 12,606 2,521 160 7,457 3,113
Rangeland 52 288,409 5,546 158 39,119 6,024
TENNESSEE 416 139,168 335 9 4,288 563
Cropland 60 42,835 714 14 3,153 779
Cropland & Pastureland 87 22,204 255 20 1,518 268
Forestland 165 62,489 379 9 4,288 666
Pastureland 104 11,640 112 9 994 147
TEXAS 989 2,037,864 2,061 7 113,251 5,376
Cropland 153 141,047 922 7 6,660 884
Cropland & Pastureland 79 67,373 853 39 4,135 829
Cropland & Rangeland 91 255,120 2,804 134 15,350 2,693
Cropland, Pastureland & Rangeland 91 273,159 3,002 79 34,218 3,990
Forestland 193 79,675 413 10 6,809 668
Pastureland 149 63,907 429 8 4,131 603
Pastureland & Rangeland 73 142,820 1,956 38 12,525 2,963
Rangeland 159 1,014,517 6,381 102 113,251 11,582
Data Unavailablea 1 248 248 248 248 --b
UTAH 78 301,187 3,861 36 27,806 5,432
Cropland 17 18,141 1,067 38 3,466 1,050
Cropland & Pastureland 8 6,821 853 36 2,610 858
Cropland & Rangeland 15 122,285 8,152 87 27,806 7,575
Cropland, Pastureland & Rangeland 26 120,214 4,624 110 18,708 5,588
Pastureland 2 161 80 68 93 18
Pastureland & Rangeland 3 3,603 1,201 400 2,627 1,238
Rangeland 7 29,962 4,280 392 13,066 4,381
VERMONT 7 2,562 366 42 870 286
Cropland & Pastureland 3 1,277 426 238 570 170
Forestland 4 1,285 321 42 870 372
VIRGINIA 270 146,844 544 10 7,770 801

CStP FY2010_Appendix_Modified_Final_2-14-2012.docx
96
Table A 11. Conservation Stewardship Program: Acre Statistics for Two Ranking Periods by State and Land Use, FY 2010
State and Land Uses Contracts Acres Avg Acres Min Acres Max Acres Std Dev Acres
Cropland 83 49,299 594 10 4,101 616
Cropland & Pastureland 81 34,548 427 28 1,945 405
Forestland 84 60,184 716 26 7,770 1,205
Pastureland 22 2,812 128 18 463 129
WASHINGTON 206 448,327 2,176 40 19,214 2,466
Cropland 120 228,589 1,905 84 12,647 1,830
Cropland & Pastureland 19 14,351 755 160 3,018 801
Cropland & Rangeland 28 109,482 3,910 194 19,214 3,653
Cropland, Pastureland & Rangeland 9 36,975 4,108 1,249 11,860 3,542
Forestland 16 12,651 791 40 3,372 1,079
Pastureland 2 543 272 267 276 7
Pastureland & Rangeland 6 17,882 2,980 122 8,178 3,195
Rangeland 6 27,854 4,642 232 8,200 3,571
WEST VIRGINIA 253 73,445 290 1 11,682 811
Cropland 9 600 67 1 325 110
Cropland & Pastureland 127 23,834 188 8 834 162
Forestland 107 48,172 450 4 11,682 1,217
Pastureland 10 838 84 6 386 111
WISCONSIN 968 359,990 372 8 3,845 455
Cropland 462 232,925 504 13 3,164 537
Cropland & Pastureland 265 85,447 322 8 1,997 321
Forestland 214 39,547 185 18 3,845 320
Pastureland 27 2,071 77 8 261 62
WYOMING 177 913,343 5,160 158 55,496 6,898
Cropland 20 22,637 1,132 165 4,278 1,064
Cropland & Pastureland 13 10,789 830 194 3,189 990
Cropland & Rangeland 41 220,933 5,389 253 27,262 5,883
Cropland, Pastureland & Rangeland 56 287,264 5,130 192 55,496 7,789
Forestland 2 2,201 1,101 158 2,043 1,333
Pastureland & Rangeland 18 134,345 7,464 307 19,313 5,976
Rangeland 27 235,173 8,710 1,180 43,175 8,706
Grand Total 20,567 25,164,327 1,224 1 207,647 3,589 aContract data are not available electronically. Contracts are stored in county offices.
bNot applicable.

CStP FY2010_Appendix_Modified_Final_2-14-2012.docx
97
Table A 12. CSP Obligation Statistics for Ranking Period 1 by State and Land Use, FY 2010
State and Land Uses Contracts Obligation Avg Oblig Max Oblig Min Oblig Std Dev Oblig
ALABAMA 308 $1,980,304 $6,430 $40,000 $91 $8,663
Cropland 31 $308,135 $9,940 $40,000 $228 $10,256
Cropland & Pastureland 34 $344,322 $10,127 $40,000 $563 $10,676
Forestland 209 $1,161,197 $5,556 $40,000 $91 $7,903
Pastureland 34 $166,650 $4,901 $40,000 $447 $7,867
ALASKA 11 $1,200,113 $109,101 $563,318 $1,916 $178,113
Cropland 2 $47,569 $23,785 $40,000 $7,569 $22,932
Cropland, Pastureland & Rangeland 1 $14,405 $14,405 $14,405 $14,405 --b
Forestland 7 $1,121,140 $160,163 $563,318 $1,916 $210,736
Pastureland 1 $16,999 $16,999 $16,999 $16,999 --b
ARIZONA 39 $2,085,150 $53,465 $692,993 $1,536 $132,057
Cropland 8 $165,717 $20,715 $40,000 $8,822 $11,517
Cropland & Rangeland 3 $109,319 $36,440 $40,000 $29,319 $6,167
Cropland, Pastureland & Rangeland 3 $46,795 $15,598 $40,000 $2,209 $21,166
Forestland --b --b --b --b --b --b
Pastureland & Rangeland 5 $100,530 $20,106 $40,000 $4,038 $18,396
Rangeland 20 $1,662,789 $83,139 $692,993 $1,536 $181,006
ARKANSAS 289 $4,454,954 $15,415 $40,000 $202 $14,365
Cropland 174 $3,966,909 $22,798 $40,000 $993 $13,482
Cropland & Pastureland 8 $64,273 $8,034 $32,177 $626 $11,857
Forestland 49 $123,472 $2,520 $22,603 $202 $4,233
Pastureland 58 $300,300 $5,178 $40,000 $509 $5,909
CALIFORNIA 198 $3,248,251 $16,405 $40,000 $293 $13,725
Cropland 79 $1,047,143 $13,255 $40,000 $293 $12,404
Cropland & Pastureland 11 $141,447 $12,859 $40,000 $824 $12,281
Cropland & Rangeland 19 $316,987 $16,684 $40,000 $1,722 $14,568
Cropland, Pastureland & Rangeland 12 $326,512 $27,209 $40,000 $1,076 $14,002
Forestland 14 $86,659 $6,190 $25,123 $375 $6,751
Pastureland 5 $52,387 $10,477 $38,973 $428 $16,318
Pastureland & Rangeland 14 $350,525 $25,038 $40,000 $7,338 $12,177
Rangeland 44 $926,591 $21,059 $40,000 $777 $13,707
COLORADO 248 $5,621,967 $22,669 $40,000 $133 $15,109
Cropland 67 $1,625,725 $24,265 $40,000 $875 $14,256
Cropland & Pastureland 11 $139,945 $12,722 $40,000 $133 $13,688
Cropland & Rangeland 82 $2,421,319 $29,528 $40,000 $2,121 $13,419
Cropland, Pastureland & Rangeland 16 $392,466 $24,529 $40,000 $5,706 $9,483
Forestland 7 $17,807 $2,544 $12,552 $346 $4,435
Pastureland 1 $3,079 $3,079 $3,079 $3,079 --b
Pastureland & Rangeland 4 $37,296 $9,324 $14,726 $3,489 $4,849
Rangeland 60 $984,330 $16,406 $40,000 $230 $15,136
CONNECTICUT 8 $26,954 $3,369 $8,080 $557 $2,936
Cropland 4 $11,382 $2,846 $6,208 $557 $2,430
Cropland & Pastureland 1 $5,859 $5,859 $5,859 $5,859 --b
Forestland 3 $9,713 $3,238 $8,080 $600 $4,199
DELAWARE 15 $231,980 $15,465 $40,000 $214 $14,559
Cropland 12 $229,147 $19,096 $40,000 $1,319 $14,063
Cropland & Pastureland 1 $214 $214 $214 $214 --b
Forestland 2 $2,619 $1,310 $1,703 $916 $556
Pastureland --b --b --b --b --b --b
FLORIDA 46 $393,098 $8,546 $40,000 $288 $11,926
Cropland 9 $137,375 $15,264 $40,000 $736 $16,094
Cropland & Pastureland 8 $68,278 $8,535 $26,883 $974 $9,045
Cropland, Pastureland & Rangeland 1 $4,178 $4,178 $4,178 $4,178 --b
Forestland 12 $25,212 $2,101 $5,933 $288 $2,087
Pastureland 11 $75,985 $6,908 $40,000 $608 $11,932
Pastureland & Rangeland 5 $82,070 $16,414 $40,000 $1,599 $15,982

CStP FY2010_Appendix_Modified_Final_2-14-2012.docx
98
Table A 12. CSP Obligation Statistics for Ranking Period 1 by State and Land Use, FY 2010
State and Land Uses Contracts Obligation Avg Oblig Max Oblig Min Oblig Std Dev Oblig
GEORGIA 166 $2,019,639 $12,167 $40,000 $124 $13,298
Cropland 48 $1,119,634 $23,326 $40,000 $227 $14,131
Cropland & Pastureland 28 $473,173 $16,899 $40,000 $797 $13,005
Cropland, Pastureland & Rangeland --b --b --b --b --b --b
Forestland 76 $356,152 $4,686 $26,159 $124 $5,686
Pastureland 14 $70,680 $5,049 $34,153 $138 $9,742
HAWAII 5 $66,783 $13,357 $40,000 $473 $17,293
Cropland 1 $3,362 $3,362 $3,362 $3,362 --b
Cropland & Pastureland 1 $473 $473 $473 $473 --b
Pastureland 3 $62,948 $20,983 $40,000 $1,144 $19,441
IDAHO 92 $1,655,466 $17,994 $40,000 $552 $14,032
Cropland 52 $1,087,781 $20,919 $40,000 $961 $14,044
Cropland & Pastureland 5 $129,044 $25,809 $40,000 $3,836 $18,477
Cropland & Rangeland 2 $51,798 $25,899 $26,944 $24,854 $1,478
Cropland, Pastureland & Rangeland 16 $248,240 $15,515 $40,000 $858 $11,387
Forestland 12 $75,547 $6,296 $36,428 $552 $10,565
Pastureland 1 $3,467 $3,467 $3,467 $3,467 --b
Pastureland & Rangeland 3 $58,113 $19,371 $30,961 $11,177 $10,320
Rangeland 1 $1,476 $1,476 $1,476 $1,476 --b
ILLINOIS 265 $4,018,047 $15,162 $40,000 $49 $13,042
Cropland 204 $3,481,309 $17,065 $40,000 $72 $12,937
Cropland & Pastureland 35 $514,323 $14,695 $40,000 $1,270 $11,911
Forestland 23 $17,623 $766 $6,381 $49 $1,341
Pastureland 3 $4,792 $1,597 $2,087 $853 $655
INDIANA 148 $2,654,331 $17,935 $40,000 $62 $14,682
Cropland 114 $2,286,966 $20,061 $40,000 $860 $14,549
Cropland & Pastureland 18 $343,394 $19,077 $40,000 $792 $12,928
Forestland 13 $16,114 $1,240 $7,249 $62 $1,934
Pastureland 3 $7,857 $2,619 $5,588 $864 $2,585
IOWA 729 $9,338,245 $12,810 $40,000 $111 $11,284
Cropland 504 $6,607,881 $13,111 $40,000 $203 $11,541
Cropland & Pastureland 194 $2,633,254 $13,573 $40,000 $111 $10,447
Cropland, Pastureland & Rangeland 1 $40,000 $40,000 $40,000 $40,000 --b
Forestland 20 $14,736 $737 $2,216 $122 $587
Pastureland 10 $42,374 $4,237 $9,748 $578 $3,079
KANSAS 454 $7,453,148 $16,417 $40,000 $117 $14,412
Cropland 262 $3,878,166 $14,802 $40,000 $117 $13,939
Cropland & Pastureland 20 $355,784 $17,789 $40,000 $1,144 $13,497
Cropland & Rangeland 125 $2,643,156 $21,145 $40,000 $411 $15,072
Cropland, Pastureland & Rangeland 23 $344,582 $14,982 $40,000 $2,701 $10,796
Forestland 2 $1,043 $522 $809 $234 $407
Pastureland & Rangeland 2 $5,073 $2,537 $2,921 $2,152 $544
Rangeland 20 $225,344 $11,267 $40,000 $186 $14,866
KENTUCKY 83 $386,791 $4,660 $40,000 $323 $6,895
Cropland 9 $96,988 $10,776 $40,000 $1,182 $12,322
Cropland & Pastureland 29 $164,731 $5,680 $40,000 $465 $7,937
Forestland 32 $96,284 $3,009 $11,300 $323 $3,311
Pastureland 13 $28,788 $2,214 $8,183 $437 $2,005
LOUISIANA 196 $2,338,512 $11,931 $40,000 $148 $14,755
Cropland 71 $1,587,970 $22,366 $40,000 $268 $15,631
Cropland & Pastureland 20 $333,129 $16,656 $40,000 $889 $16,605
Forestland 55 $172,303 $3,133 $40,000 $148 $6,267
Pastureland 50 $245,110 $4,902 $38,703 $159 $7,937
MAINE 59 $340,711 $5,775 $41,894 $109 $9,640
Cropland 8 $125,144 $15,643 $41,894 $436 $17,897
Cropland & Pastureland 8 $65,242 $8,155 $17,822 $590 $5,820

CStP FY2010_Appendix_Modified_Final_2-14-2012.docx
99
Table A 12. CSP Obligation Statistics for Ranking Period 1 by State and Land Use, FY 2010
State and Land Uses Contracts Obligation Avg Oblig Max Oblig Min Oblig Std Dev Oblig
Forestland 40 $148,596 $3,715 $40,000 $109 $6,858
Pastureland 3 $1,729 $576 $1,233 $245 $569
MARYLAND 37 $286,493 $7,743 $40,000 $79 $10,712
Cropland 14 $165,864 $11,847 $40,000 $245 $11,684
Cropland & Pastureland 13 $114,329 $8,795 $40,000 $511 $11,535
Forestland 9 $5,819 $647 $2,074 $79 $639
Pastureland 1 $481 $481 $481 $481 --b
MASSACHUSETTS 4 $18,112 $4,528 $7,247 $1,174 $2,764
Cropland --b --b --b --b --b --b
Cropland & Pastureland 2 $9,691 $4,846 $6,273 $3,418 $2,019
Forestland 2 $8,421 $4,211 $7,247 $1,174 $4,294
MICHIGAN 271 $2,206,112 $8,141 $40,000 $116 $10,904
Cropland 122 $1,798,567 $14,742 $40,000 $619 $12,655
Cropland & Pastureland 19 $141,732 $7,460 $19,996 $1,036 $5,842
Forestland 124 $235,789 $1,902 $40,000 $116 $3,804
Pastureland 6 $30,024 $5,004 $12,319 $875 $4,844
MINNESOTA 906 $9,931,338 $10,962 $82,633 $21 $12,698
Cropland 410 $7,247,737 $17,677 $45,525 $64 $13,427
Cropland & Pastureland 215 $2,264,278 $10,532 $40,000 $163 $9,913
Forestland 258 $353,228 $1,369 $82,633 $21 $5,319
Pastureland 23 $66,095 $2,874 $8,041 $422 $2,266
MISSISSIPPI 125 $1,325,765 $10,606 $40,000 $69 $15,441
Cropland 30 $1,023,561 $34,119 $40,000 $4,863 $11,679
Cropland & Pastureland 14 $130,280 $9,306 $40,000 $590 $13,389
Forestland 66 $140,095 $2,123 $26,256 $69 $3,525
Pastureland 15 $31,829 $2,122 $6,324 $656 $1,545
MISSOURI 1,006 $8,233,641 $8,185 $40,000 $34 $10,534
Cropland 263 $3,702,108 $14,076 $40,000 $155 $12,952
Cropland & Pastureland 221 $2,827,438 $12,794 $40,000 $454 $11,100
Forestland 236 $335,003 $1,420 $40,000 $34 $3,117
Pastureland 286 $1,369,092 $4,787 $40,000 $269 $5,996
MONTANA 222 $6,743,828 $30,378 $40,000 $387 $13,825
Cropland 71 $2,295,304 $32,328 $40,000 $3,086 $13,110
Cropland & Pastureland 12 $116,464 $9,705 $21,666 $1,016 $6,088
Cropland & Rangeland 31 $1,026,989 $33,129 $40,000 $10,205 $10,824
Cropland, Pastureland & Rangeland 81 $2,870,432 $35,437 $40,000 $2,910 $9,240
Forestland 14 $130,284 $9,306 $40,000 $387 $13,430
Pastureland 1 $3,603 $3,603 $3,603 $3,603 --b
Pastureland & Rangeland 10 $239,981 $23,998 $40,000 $7,096 $14,439
Rangeland 2 $60,771 $30,386 $40,000 $20,771 $13,597
NEBRASKA 571 $8,900,070 $15,587 $40,000 $64 $14,503
Cropland 207 $2,995,476 $14,471 $40,000 $195 $13,554
Cropland & Pastureland 60 $837,669 $13,961 $40,000 $324 $12,336
Cropland & Rangeland 138 $3,410,849 $24,716 $40,000 $806 $14,596
Cropland, Pastureland & Rangeland 24 $551,702 $22,988 $40,000 $4,937 $12,912
Forestland 37 $32,471 $878 $11,657 $64 $2,308
Pastureland 17 $42,519 $2,501 $8,074 $192 $2,042
Pastureland & Rangeland 14 $177,913 $12,708 $40,000 $293 $11,988
Rangeland 74 $851,471 $11,506 $40,000 $333 $13,047
NEVADA 4 $145,109 $36,277 $40,000 $25,109 $7,446
Cropland 1 $40,000 $40,000 $40,000 $40,000 --b
Cropland & Pastureland --b --b --b --b --b --b
Cropland & Rangeland --b --b --b --b --b --b
Cropland, Pastureland & Rangeland 3 $105,109 $35,036 $40,000 $25,109 $8,597
Pastureland & Rangeland --b --b --b --b --b --b
NEW HAMPSHIRE 12 $35,780 $2,982 $9,131 $406 $2,809

CStP FY2010_Appendix_Modified_Final_2-14-2012.docx
100
Table A 12. CSP Obligation Statistics for Ranking Period 1 by State and Land Use, FY 2010
State and Land Uses Contracts Obligation Avg Oblig Max Oblig Min Oblig Std Dev Oblig
Cropland 3 $3,865 $1,288 $3,001 $406 $1,483
Cropland & Pastureland 5 $25,099 $5,020 $9,131 $1,421 $3,057
Forestland 4 $6,816 $1,704 $4,317 $791 $1,742
NEW JERSEY --b --b --b --b --b --b
Cropland --b --b --b --b --b --b
Cropland & Pastureland --b --b --b --b --b --b
NEW MEXICO 111 $3,160,535 $28,473 $164,482 $93 $19,672
Cropland 4 $48,330 $12,083 $22,974 $1,385 $11,715
Cropland & Pastureland 1 $2,712 $2,712 $2,712 $2,712 --b
Cropland & Rangeland 7 $107,696 $15,385 $40,000 $2,556 $13,005
Forestland 9 $184,981 $20,553 $164,482 $93 $54,042
Pastureland --b --b --b --b --b --b
Pastureland & Rangeland 1 $18,671 $18,671 $18,671 $18,671 --b
Rangeland 89 $2,798,145 $31,440 $40,000 $3,000 $12,338
NEW YORK 154 $1,642,775 $10,667 $40,000 $59 $13,673
Cropland 51 $1,098,474 $21,539 $40,000 $302 $15,288
Cropland & Pastureland 41 $417,144 $10,174 $39,961 $1,035 $11,523
Forestland 53 $92,126 $1,738 $27,257 $59 $3,902
Pastureland 9 $35,031 $3,892 $12,202 $209 $4,135
NORTH CAROLINA 64 $440,251 $6,879 $40,000 $77 $10,669
Cropland 16 $323,655 $20,228 $40,000 $505 $14,323
Cropland & Pastureland 18 $61,464 $3,415 $12,792 $294 $2,918
Forestland 24 $42,742 $1,781 $6,613 $77 $1,782
Pastureland 6 $12,390 $2,065 $8,240 $409 $3,049
NORTH DAKOTA 301 $9,134,784 $30,348 $40,000 $533 $12,194
Cropland 128 $3,903,056 $30,493 $40,000 $3,058 $12,295
Cropland & Pastureland 12 $341,507 $28,459 $40,000 $2,652 $13,043
Cropland & Rangeland 62 $1,848,180 $29,809 $40,000 $2,390 $12,920
Cropland, Pastureland & Rangeland 90 $2,894,719 $32,164 $40,000 $7,971 $10,022
Forestland 1 $533 $533 $533 $533 --b
Pastureland & Rangeland 7 $138,956 $19,851 $40,000 $3,213 $17,768
Rangeland 1 $7,833 $7,833 $7,833 $7,833 --b
OHIO 234 $1,968,151 $8,411 $40,000 $98 $11,727
Cropland 95 $1,394,730 $14,681 $40,000 $100 $13,617
Cropland & Pastureland 56 $490,659 $8,762 $40,000 $267 $10,637
Forestland 60 $51,911 $865 $5,212 $98 $947
Pastureland 23 $30,851 $1,341 $5,046 $109 $1,224
OKLAHOMA 462 $7,531,213 $16,301 $40,000 $78 $14,085
Cropland 35 $573,146 $16,376 $40,000 $1,200 $15,068
Cropland & Pastureland 52 $905,049 $17,405 $40,000 $2,035 $11,652
Cropland & Rangeland 45 $694,621 $15,436 $40,000 $564 $14,321
Cropland, Pastureland & Rangeland 175 $4,028,849 $23,022 $40,000 $484 $14,002
Forestland 15 $63,227 $4,215 $40,000 $78 $10,097
Pastureland 66 $458,318 $6,944 $33,215 $369 $6,829
Pastureland & Rangeland 57 $603,554 $10,589 $40,000 $550 $11,838
Rangeland 17 $204,449 $12,026 $40,000 $137 $14,200
OREGON 201 $2,941,938 $14,637 $61,012 $20 $15,178
Cropland 62 $881,452 $14,217 $61,012 $147 $15,419
Cropland & Pastureland 11 $109,718 $9,974 $40,000 $664 $15,404
Cropland & Rangeland 18 $528,599 $29,367 $40,000 $6,669 $11,890
Cropland, Pastureland & Rangeland 6 $172,509 $28,752 $40,000 $8,761 $13,255
Forestland 69 $549,293 $7,961 $40,000 $20 $10,959
Pastureland 9 $15,685 $1,743 $4,401 $264 $1,214
Pastureland & Rangeland 7 $218,004 $31,143 $50,457 $9,637 $14,374
Rangeland 19 $466,678 $24,562 $40,000 $6,315 $12,463
PENNSYLVANIA 265 $1,662,495 $6,274 $40,000 $61 $8,829
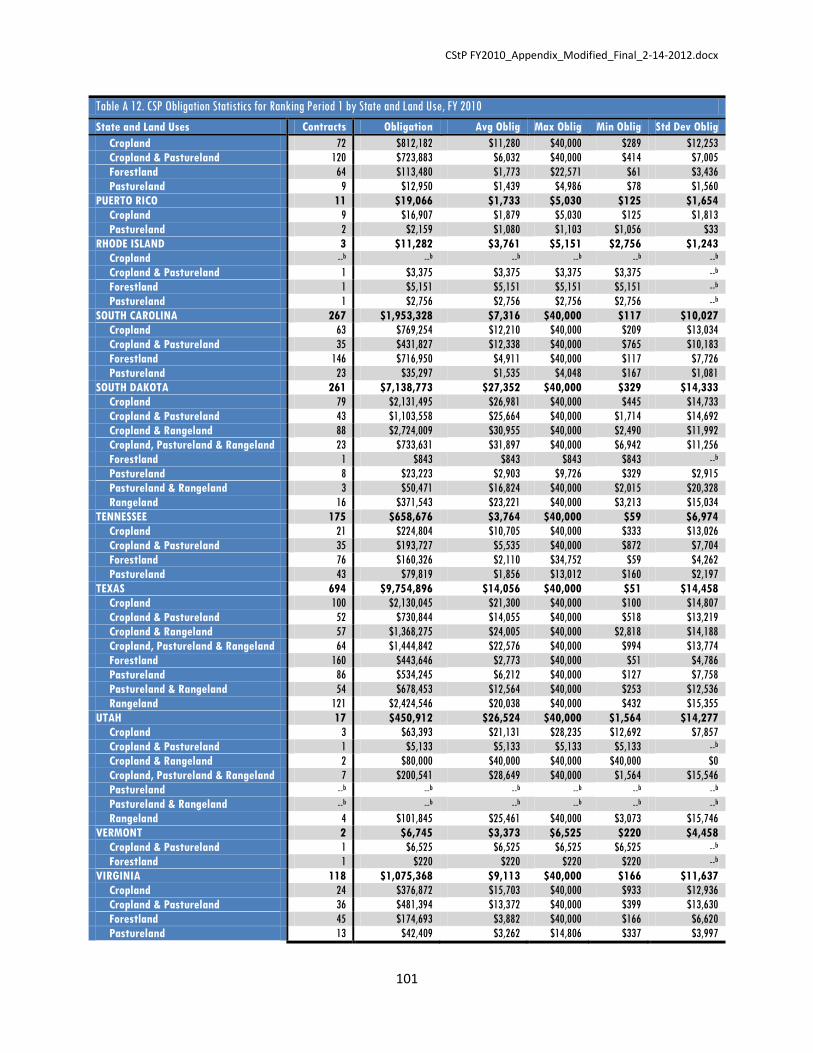
CStP FY2010_Appendix_Modified_Final_2-14-2012.docx
101
Table A 12. CSP Obligation Statistics for Ranking Period 1 by State and Land Use, FY 2010
State and Land Uses Contracts Obligation Avg Oblig Max Oblig Min Oblig Std Dev Oblig
Cropland 72 $812,182 $11,280 $40,000 $289 $12,253
Cropland & Pastureland 120 $723,883 $6,032 $40,000 $414 $7,005
Forestland 64 $113,480 $1,773 $22,571 $61 $3,436
Pastureland 9 $12,950 $1,439 $4,986 $78 $1,560
PUERTO RICO 11 $19,066 $1,733 $5,030 $125 $1,654
Cropland 9 $16,907 $1,879 $5,030 $125 $1,813
Pastureland 2 $2,159 $1,080 $1,103 $1,056 $33
RHODE ISLAND 3 $11,282 $3,761 $5,151 $2,756 $1,243
Cropland --b --b --b --b --b --b
Cropland & Pastureland 1 $3,375 $3,375 $3,375 $3,375 --b
Forestland 1 $5,151 $5,151 $5,151 $5,151 --b
Pastureland 1 $2,756 $2,756 $2,756 $2,756 --b
SOUTH CAROLINA 267 $1,953,328 $7,316 $40,000 $117 $10,027
Cropland 63 $769,254 $12,210 $40,000 $209 $13,034
Cropland & Pastureland 35 $431,827 $12,338 $40,000 $765 $10,183
Forestland 146 $716,950 $4,911 $40,000 $117 $7,726
Pastureland 23 $35,297 $1,535 $4,048 $167 $1,081
SOUTH DAKOTA 261 $7,138,773 $27,352 $40,000 $329 $14,333
Cropland 79 $2,131,495 $26,981 $40,000 $445 $14,733
Cropland & Pastureland 43 $1,103,558 $25,664 $40,000 $1,714 $14,692
Cropland & Rangeland 88 $2,724,009 $30,955 $40,000 $2,490 $11,992
Cropland, Pastureland & Rangeland 23 $733,631 $31,897 $40,000 $6,942 $11,256
Forestland 1 $843 $843 $843 $843 --b
Pastureland 8 $23,223 $2,903 $9,726 $329 $2,915
Pastureland & Rangeland 3 $50,471 $16,824 $40,000 $2,015 $20,328
Rangeland 16 $371,543 $23,221 $40,000 $3,213 $15,034
TENNESSEE 175 $658,676 $3,764 $40,000 $59 $6,974
Cropland 21 $224,804 $10,705 $40,000 $333 $13,026
Cropland & Pastureland 35 $193,727 $5,535 $40,000 $872 $7,704
Forestland 76 $160,326 $2,110 $34,752 $59 $4,262
Pastureland 43 $79,819 $1,856 $13,012 $160 $2,197
TEXAS 694 $9,754,896 $14,056 $40,000 $51 $14,458
Cropland 100 $2,130,045 $21,300 $40,000 $100 $14,807
Cropland & Pastureland 52 $730,844 $14,055 $40,000 $518 $13,219
Cropland & Rangeland 57 $1,368,275 $24,005 $40,000 $2,818 $14,188
Cropland, Pastureland & Rangeland 64 $1,444,842 $22,576 $40,000 $994 $13,774
Forestland 160 $443,646 $2,773 $40,000 $51 $4,786
Pastureland 86 $534,245 $6,212 $40,000 $127 $7,758
Pastureland & Rangeland 54 $678,453 $12,564 $40,000 $253 $12,536
Rangeland 121 $2,424,546 $20,038 $40,000 $432 $15,355
UTAH 17 $450,912 $26,524 $40,000 $1,564 $14,277
Cropland 3 $63,393 $21,131 $28,235 $12,692 $7,857
Cropland & Pastureland 1 $5,133 $5,133 $5,133 $5,133 --b
Cropland & Rangeland 2 $80,000 $40,000 $40,000 $40,000 $0
Cropland, Pastureland & Rangeland 7 $200,541 $28,649 $40,000 $1,564 $15,546
Pastureland --b --b --b --b --b --b
Pastureland & Rangeland --b --b --b --b --b --b
Rangeland 4 $101,845 $25,461 $40,000 $3,073 $15,746
VERMONT 2 $6,745 $3,373 $6,525 $220 $4,458
Cropland & Pastureland 1 $6,525 $6,525 $6,525 $6,525 --b
Forestland 1 $220 $220 $220 $220 --b
VIRGINIA 118 $1,075,368 $9,113 $40,000 $166 $11,637
Cropland 24 $376,872 $15,703 $40,000 $933 $12,936
Cropland & Pastureland 36 $481,394 $13,372 $40,000 $399 $13,630
Forestland 45 $174,693 $3,882 $40,000 $166 $6,620
Pastureland 13 $42,409 $3,262 $14,806 $337 $3,997

CStP FY2010_Appendix_Modified_Final_2-14-2012.docx
102
Table A 12. CSP Obligation Statistics for Ranking Period 1 by State and Land Use, FY 2010
State and Land Uses Contracts Obligation Avg Oblig Max Oblig Min Oblig Std Dev Oblig
WASHINGTON 88 $2,229,319 $25,333 $40,000 $762 $14,858
Cropland 49 $1,348,797 $27,526 $40,000 $1,520 $13,800
Cropland & Pastureland 9 $69,349 $7,705 $17,607 $2,461 $5,317
Cropland & Rangeland 16 $580,241 $36,265 $40,000 $13,792 $7,768
Cropland, Pastureland & Rangeland 5 $152,461 $30,492 $40,000 $22,324 $6,724
Forestland 4 $22,834 $5,709 $11,523 $946 $4,413
Pastureland 2 $12,082 $6,041 $7,633 $4,449 $2,251
Pastureland & Rangeland 2 $3,555 $1,778 $2,793 $762 $1,436
Rangeland 1 $40,000 $40,000 $40,000 $40,000 --b
WEST VIRGINIA 76 $243,310 $3,201 $24,123 $151 $3,830
Cropland 1 $1,723 $1,723 $1,723 $1,723 --b
Cropland & Pastureland 41 $170,017 $4,147 $24,123 $232 $4,663
Forestland 31 $69,400 $2,239 $8,201 $151 $2,194
Pastureland 3 $2,170 $723 $874 $616 $134
WISCONSIN 516 $3,355,623 $6,503 $40,000 $116 $8,036
Cropland 223 $2,275,334 $10,203 $40,000 $419 $9,515
Cropland & Pastureland 163 $951,312 $5,836 $40,000 $343 $6,053
Forestland 113 $107,532 $952 $7,107 $116 $1,126
Pastureland 17 $21,445 $1,261 $3,531 $380 $834
WYOMING 75 $2,062,062 $27,494 $40,000 $1,546 $13,914
Cropland 3 $52,260 $17,420 $30,326 $3,022 $13,713
Cropland & Pastureland 4 $55,617 $13,904 $34,083 $2,358 $14,099
Cropland & Rangeland 20 $538,221 $26,911 $40,000 $2,008 $14,161
Cropland, Pastureland & Rangeland 24 $706,347 $29,431 $40,000 $2,938 $13,658
Forestland 2 $22,208 $11,104 $20,662 $1,546 $13,517
Pastureland & Rangeland 10 $309,690 $30,969 $40,000 $4,353 $12,008
Rangeland 12 $377,719 $31,477 $40,000 $9,627 $12,736
Grand Total 10,612 $144,782,194 $13,643 $692,993 $20 $17,551 aContract data are not available electronically. Contracts are stored in county offices.
bNot applicable.

CStP FY2010_Appendix_Modified_Final_2-14-2012.docx
103
Table A 13. Conservation Stewardship Program: Obligation Statistics for Ranking Period 2 by State and Land Use, FY 2010
State and Land Uses Contracts Obligation Avg Oblig Max Oblig Min Oblig Std Dev Oblig
ALABAMA 123 $2,107,012 $17,130 $80,000 $193 $18,940
Cropland 21 $631,641 $30,078 $80,000 $463 $23,256
Cropland & Pastureland 23 $504,623 $21,940 $80,000 $1,758 $23,269
Forestland 43 $717,041 $16,675 $40,000 $962 $15,095
Pastureland 36 $253,707 $7,047 $40,000 $193 $10,342
ALASKA 3 $129,452 $43,151 $99,193 $1,000 $50,549
Cropland 1 $29,259 $29,259 $29,259 $29,259 --b
Forestland 2 $100,193 $50,097 $99,193 $1,000 $69,433
ARIZONA 17 $1,918,187 $112,835 $710,085 $9,856 $196,247
Cropland 5 $184,201 $36,840 $55,151 $9,856 $18,023
Cropland & Rangeland 3 $803,244 $267,748 $710,085 $13,159 $384,530
Forestland 1 $184,591 $184,591 $184,591 $184,591 --b
Pastureland & Rangeland 1 $15,043 $15,043 $15,043 $15,043 --b
Rangeland 7 $731,108 $104,444 $521,253 $17,355 $183,985
ARKANSAS 331 $6,733,003 $20,341 $80,000 $89 $23,515
Cropland 191 $5,853,857 $30,648 $80,000 $768 $24,998
Cropland & Pastureland 8 $236,599 $29,575 $80,000 $789 $29,726
Forestland 59 $163,111 $2,765 $23,799 $89 $4,524
Pastureland 73 $479,436 $6,568 $38,811 $450 $6,789
CALIFORNIA 139 $2,726,952 $19,618 $103,533 $456 $20,238
Cropland 72 $1,264,207 $17,558 $103,533 $456 $22,095
Cropland & Pastureland 4 $24,386 $6,097 $9,181 $3,411 $2,626
Cropland & Rangeland 12 $275,337 $22,945 $40,000 $1,852 $14,533
Cropland, Pastureland & Rangeland 5 $96,581 $19,316 $40,000 $9,424 $12,913
Forestland 6 $87,115 $14,519 $40,000 $1,000 $19,745
Pastureland 5 $107,623 $21,525 $40,000 $8,549 $12,339
Pastureland & Rangeland 12 $297,007 $24,751 $60,736 $2,821 $18,821
Rangeland 23 $574,696 $24,987 $80,000 $1,573 $21,393
COLORADO 221 $6,124,161 $27,711 $80,000 $207 $16,643
Cropland 91 $2,666,461 $29,302 $80,000 $2,109 $17,399
Cropland & Pastureland 5 $100,466 $20,093 $39,429 $3,590 $15,572
Cropland & Rangeland 66 $2,072,176 $31,397 $80,000 $1,250 $15,725
Cropland, Pastureland & Rangeland 14 $302,809 $21,629 $40,000 $2,481 $13,458
Forestland 3 $16,594 $5,531 $7,534 $1,579 $3,423
Pastureland 1 $777 $777 $777 $777 --b
Pastureland & Rangeland 4 $66,456 $16,614 $36,396 $1,000 $18,242
Rangeland 36 $883,618 $24,545 $40,000 $207 $15,227
Data Unavailablea 1 $14,804 $14,804 $14,804 $14,804 --b
CONNECTICUT 5 $25,953 $5,191 $20,233 $241 $8,620
Cropland 1 $4,710 $4,710 $4,710 $4,710 --b
Forestland 4 $21,243 $5,311 $20,233 $241 $9,948
DELAWARE 10 $117,924 $11,792 $40,000 $450 $12,771
Cropland 7 $113,266 $16,181 $40,000 $1,262 $12,989
Forestland 2 $1,078 $539 $628 $450 $126
Pastureland 1 $3,580 $3,580 $3,580 $3,580 --b
FLORIDA 49 $823,028 $16,796 $40,000 $433 $14,595
Cropland 8 $180,682 $22,585 $40,000 $433 $16,826
Cropland & Pastureland 10 $226,671 $22,667 $40,000 $3,242 $12,755
Cropland, Pastureland & Rangeland 4 $98,265 $24,566 $40,000 $10,571 $12,221
Forestland 14 $91,405 $6,529 $35,959 $829 $9,220
Pastureland 10 $109,273 $10,927 $32,359 $1,000 $10,963
Pastureland & Rangeland 3 $116,732 $38,911 $40,000 $38,347 $944
GEORGIA 418 $8,225,960 $19,679 $80,000 $247 $18,699
Cropland 146 $4,179,574 $28,627 $80,000 $1,000 $18,576
Cropland & Pastureland 55 $1,451,128 $26,384 $80,000 $1,000 $18,551
Forestland 176 $1,761,062 $10,006 $80,000 $502 $12,124

CStP FY2010_Appendix_Modified_Final_2-14-2012.docx
104
Table A 13. Conservation Stewardship Program: Obligation Statistics for Ranking Period 2 by State and Land Use, FY 2010
State and Land Uses Contracts Obligation Avg Oblig Max Oblig Min Oblig Std Dev Oblig
Pastureland 19 $86,721 $4,564 $25,229 $385 $7,234
Data Unavailablea 22 $747,475 $33,976 $80,000 $247 $22,938
HAWAII 11 $39,090 $3,554 $16,875 $1,000 $5,388
Cropland 5 $5,000 $1,000 $1,000 $1,000 $0
Cropland & Pastureland 1 $1,000 $1,000 $1,000 $1,000 --b
Pastureland 5 $33,090 $6,618 $16,875 $1,000 $7,145
IDAHO 110 $2,487,573 $22,614 $233,494 $411 $26,443
Cropland 43 $1,233,899 $28,695 $80,000 $1,090 $19,411
Cropland & Pastureland 17 $207,185 $12,187 $31,512 $2,519 $9,511
Cropland & Rangeland 12 $251,107 $20,926 $40,000 $2,295 $12,611
Cropland, Pastureland & Rangeland 16 $328,761 $20,548 $40,000 $6,110 $13,554
Forestland 12 $287,495 $23,958 $233,494 $411 $66,197
Pastureland 1 $1,281 $1,281 $1,281 $1,281 --b
Pastureland & Rangeland 5 $110,469 $22,094 $40,000 $1,000 $18,507
Rangeland 4 $67,376 $16,844 $40,000 $8,677 $15,441
ILLINOIS 277 $4,678,677 $16,891 $74,239 $34 $14,092
Cropland 219 $3,986,714 $18,204 $74,239 $343 $13,931
Cropland & Pastureland 35 $678,692 $19,391 $40,000 $1,965 $13,039
Forestland 21 $10,175 $485 $2,301 $34 $511
Pastureland 2 $3,096 $1,548 $1,575 $1,521 $38
INDIANA 160 $2,558,464 $15,990 $80,000 $44 $15,467
Cropland 129 $2,267,889 $17,581 $80,000 $390 $15,723
Cropland & Pastureland 19 $278,380 $14,652 $40,000 $1,158 $13,611
Forestland 8 $5,172 $647 $1,939 $44 $635
Pastureland 4 $7,023 $1,756 $3,013 $997 $965
IOWA 751 $10,917,329 $14,537 $80,000 $134 $13,076
Cropland 490 $7,492,313 $15,290 $80,000 $206 $13,474
Cropland & Pastureland 233 $3,370,712 $14,467 $80,000 $543 $12,217
Forestland 18 $31,466 $1,748 $9,416 $134 $2,263
Pastureland 10 $22,838 $2,284 $5,320 $935 $1,509
KANSAS 418 $10,547,462 $25,233 $80,000 $148 $16,481
Cropland 180 $4,496,642 $24,981 $80,000 $1,100 $16,526
Cropland & Pastureland 23 $543,077 $23,612 $68,069 $148 $18,968
Cropland & Rangeland 156 $4,341,616 $27,831 $80,000 $807 $15,813
Cropland, Pastureland & Rangeland 38 $1,001,106 $26,345 $59,488 $1,254 $14,627
Forestland 3 $1,398 $466 $718 $240 $240
Pastureland & Rangeland 7 $85,328 $12,190 $40,000 $1,173 $15,163
Rangeland 11 $78,295 $7,118 $22,943 $1,604 $7,728
KENTUCKY 99 $541,734 $5,472 $40,000 $111 $8,359
Cropland 22 $168,178 $7,644 $40,000 $111 $11,855
Cropland & Pastureland 36 $248,390 $6,900 $40,000 $448 $9,214
Forestland 32 $91,389 $2,856 $14,145 $119 $3,712
Pastureland 9 $33,777 $3,753 $9,196 $872 $3,053
LOUISIANA 125 $3,216,217 $25,730 $80,000 $328 $24,083
Cropland 71 $2,474,704 $34,855 $80,000 $678 $22,388
Cropland & Pastureland 10 $354,696 $35,470 $80,000 $1,565 $29,012
Forestland 20 $78,693 $3,935 $17,967 $328 $4,703
Pastureland 24 $308,124 $12,839 $80,000 $533 $19,211
MAINE 43 $187,683 $4,365 $40,000 $57 $8,017
Cropland 10 $84,116 $8,412 $26,497 $1,000 $8,472
Cropland & Pastureland 4 $6,661 $1,665 $2,656 $1,000 $706
Forestland 26 $91,751 $3,529 $40,000 $57 $8,524
Pastureland 3 $5,155 $1,718 $3,155 $1,000 $1,244
MARYLAND 28 $455,421 $16,265 $80,000 $59 $18,890
Cropland 15 $340,647 $22,710 $80,000 $1,100 $22,066
Cropland & Pastureland 8 $113,246 $14,156 $29,801 $1,566 $11,245
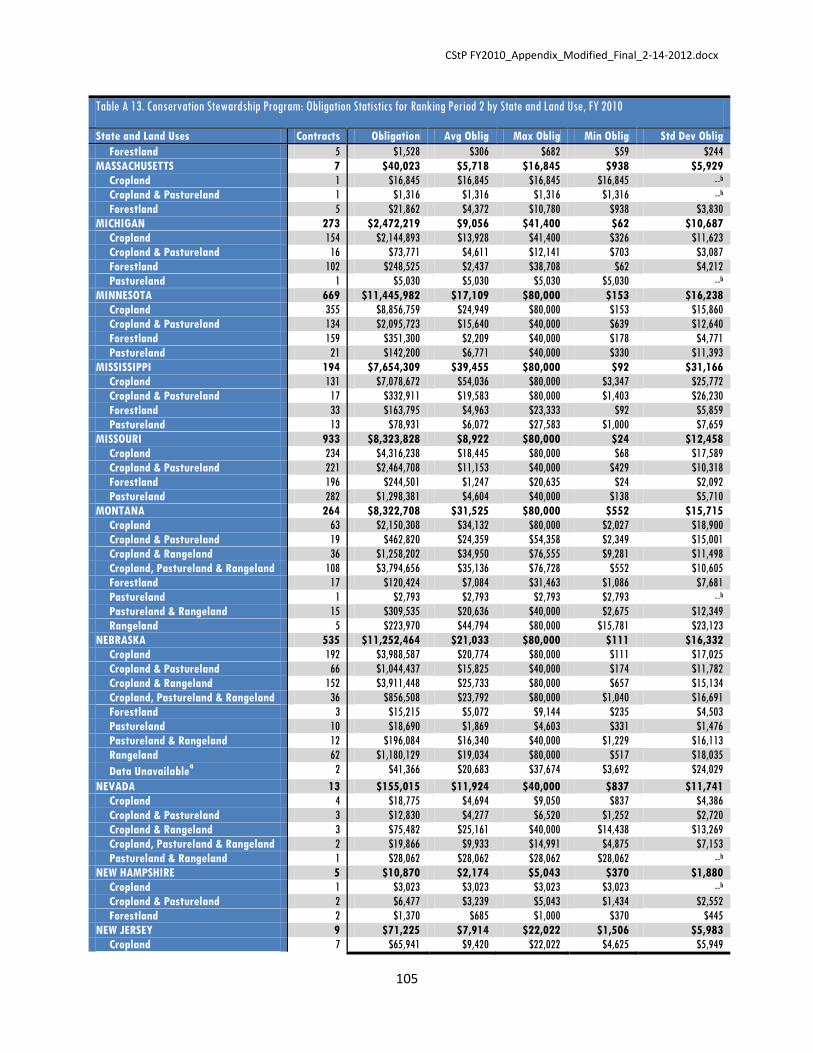
CStP FY2010_Appendix_Modified_Final_2-14-2012.docx
105
Table A 13. Conservation Stewardship Program: Obligation Statistics for Ranking Period 2 by State and Land Use, FY 2010
State and Land Uses Contracts Obligation Avg Oblig Max Oblig Min Oblig Std Dev Oblig
Forestland 5 $1,528 $306 $682 $59 $244
MASSACHUSETTS 7 $40,023 $5,718 $16,845 $938 $5,929
Cropland 1 $16,845 $16,845 $16,845 $16,845 --b
Cropland & Pastureland 1 $1,316 $1,316 $1,316 $1,316 --b
Forestland 5 $21,862 $4,372 $10,780 $938 $3,830
MICHIGAN 273 $2,472,219 $9,056 $41,400 $62 $10,687
Cropland 154 $2,144,893 $13,928 $41,400 $326 $11,623
Cropland & Pastureland 16 $73,771 $4,611 $12,141 $703 $3,087
Forestland 102 $248,525 $2,437 $38,708 $62 $4,212
Pastureland 1 $5,030 $5,030 $5,030 $5,030 --b
MINNESOTA 669 $11,445,982 $17,109 $80,000 $153 $16,238
Cropland 355 $8,856,759 $24,949 $80,000 $153 $15,860
Cropland & Pastureland 134 $2,095,723 $15,640 $40,000 $639 $12,640
Forestland 159 $351,300 $2,209 $40,000 $178 $4,771
Pastureland 21 $142,200 $6,771 $40,000 $330 $11,393
MISSISSIPPI 194 $7,654,309 $39,455 $80,000 $92 $31,166
Cropland 131 $7,078,672 $54,036 $80,000 $3,347 $25,772
Cropland & Pastureland 17 $332,911 $19,583 $80,000 $1,403 $26,230
Forestland 33 $163,795 $4,963 $23,333 $92 $5,859
Pastureland 13 $78,931 $6,072 $27,583 $1,000 $7,659
MISSOURI 933 $8,323,828 $8,922 $80,000 $24 $12,458
Cropland 234 $4,316,238 $18,445 $80,000 $68 $17,589
Cropland & Pastureland 221 $2,464,708 $11,153 $40,000 $429 $10,318
Forestland 196 $244,501 $1,247 $20,635 $24 $2,092
Pastureland 282 $1,298,381 $4,604 $40,000 $138 $5,710
MONTANA 264 $8,322,708 $31,525 $80,000 $552 $15,715
Cropland 63 $2,150,308 $34,132 $80,000 $2,027 $18,900
Cropland & Pastureland 19 $462,820 $24,359 $54,358 $2,349 $15,001
Cropland & Rangeland 36 $1,258,202 $34,950 $76,555 $9,281 $11,498
Cropland, Pastureland & Rangeland 108 $3,794,656 $35,136 $76,728 $552 $10,605
Forestland 17 $120,424 $7,084 $31,463 $1,086 $7,681
Pastureland 1 $2,793 $2,793 $2,793 $2,793 --b
Pastureland & Rangeland 15 $309,535 $20,636 $40,000 $2,675 $12,349
Rangeland 5 $223,970 $44,794 $80,000 $15,781 $23,123
NEBRASKA 535 $11,252,464 $21,033 $80,000 $111 $16,332
Cropland 192 $3,988,587 $20,774 $80,000 $111 $17,025
Cropland & Pastureland 66 $1,044,437 $15,825 $40,000 $174 $11,782
Cropland & Rangeland 152 $3,911,448 $25,733 $80,000 $657 $15,134
Cropland, Pastureland & Rangeland 36 $856,508 $23,792 $80,000 $1,040 $16,691
Forestland 3 $15,215 $5,072 $9,144 $235 $4,503
Pastureland 10 $18,690 $1,869 $4,603 $331 $1,476
Pastureland & Rangeland 12 $196,084 $16,340 $40,000 $1,229 $16,113
Rangeland 62 $1,180,129 $19,034 $80,000 $517 $18,035
Data Unavailablea 2 $41,366 $20,683 $37,674 $3,692 $24,029
NEVADA 13 $155,015 $11,924 $40,000 $837 $11,741
Cropland 4 $18,775 $4,694 $9,050 $837 $4,386
Cropland & Pastureland 3 $12,830 $4,277 $6,520 $1,252 $2,720
Cropland & Rangeland 3 $75,482 $25,161 $40,000 $14,438 $13,269
Cropland, Pastureland & Rangeland 2 $19,866 $9,933 $14,991 $4,875 $7,153
Pastureland & Rangeland 1 $28,062 $28,062 $28,062 $28,062 --b
NEW HAMPSHIRE 5 $10,870 $2,174 $5,043 $370 $1,880
Cropland 1 $3,023 $3,023 $3,023 $3,023 --b
Cropland & Pastureland 2 $6,477 $3,239 $5,043 $1,434 $2,552
Forestland 2 $1,370 $685 $1,000 $370 $445
NEW JERSEY 9 $71,225 $7,914 $22,022 $1,506 $5,983
Cropland 7 $65,941 $9,420 $22,022 $4,625 $5,949

CStP FY2010_Appendix_Modified_Final_2-14-2012.docx
106
Table A 13. Conservation Stewardship Program: Obligation Statistics for Ranking Period 2 by State and Land Use, FY 2010
State and Land Uses Contracts Obligation Avg Oblig Max Oblig Min Oblig Std Dev Oblig
Cropland & Pastureland 2 $5,284 $2,642 $3,778 $1,506 $1,607
NEW MEXICO 61 $2,252,217 $36,922 $162,236 $1,000 $24,882
Cropland 3 $58,479 $19,493 $40,000 $5,890 $18,073
Cropland & Rangeland 5 $191,999 $38,400 $63,214 $9,856 $18,947
Forestland 2 $163,236 $81,618 $162,236 $1,000 $114,011
Pastureland 1 $1,709 $1,709 $1,709 $1,709 --b
Pastureland & Rangeland 3 $57,642 $19,214 $40,000 $8,261 $18,010
Rangeland 47 $1,779,152 $37,854 $105,129 $5,290 $17,613
NEW YORK 167 $1,644,857 $9,849 $80,000 $90 $14,920
Cropland 46 $898,276 $19,528 $80,000 $1,000 $16,498
Cropland & Pastureland 41 $622,076 $15,173 $78,881 $305 $18,210
Forestland 74 $116,947 $1,580 $17,553 $90 $2,513
Pastureland 6 $7,558 $1,260 $3,095 $549 $932
NORTH CAROLINA 103 $613,839 $5,960 $40,000 $85 $9,592
Cropland 23 $301,610 $13,113 $40,000 $85 $14,485
Cropland & Pastureland 29 $182,895 $6,307 $28,507 $323 $7,781
Forestland 42 $107,597 $2,562 $35,463 $94 $5,470
Pastureland 9 $21,737 $2,415 $9,212 $134 $2,913
NORTH DAKOTA 326 $10,351,937 $31,754 $80,000 $139 $13,806
Cropland 180 $6,001,835 $33,344 $80,000 $2,917 $13,365
Cropland & Pastureland 20 $672,438 $33,622 $40,000 $10,909 $9,956
Cropland & Rangeland 32 $1,056,373 $33,012 $40,000 $10,722 $9,374
Cropland, Pastureland & Rangeland 72 $2,344,201 $32,558 $80,000 $10,810 $13,304
Forestland 3 $2,050 $683 $1,407 $139 $653
Pastureland & Rangeland 11 $198,652 $18,059 $40,000 $1,985 $15,297
Rangeland 8 $76,388 $9,549 $35,869 $542 $11,538
OHIO 90 $1,045,532 $11,617 $80,000 $100 $14,581
Cropland 55 $876,236 $15,932 $80,000 $349 $15,402
Cropland & Pastureland 13 $141,663 $10,897 $46,724 $1,121 $14,861
Forestland 21 $27,133 $1,292 $8,129 $100 $1,851
Pastureland 1 $500 $500 $500 $500 --b
OKLAHOMA 456 $8,644,686 $18,958 $80,000 $257 $16,039
Cropland 36 $719,785 $19,994 $65,463 $999 $16,850
Cropland & Pastureland 29 $534,877 $18,444 $40,000 $718 $14,774
Cropland & Rangeland 22 $460,246 $20,920 $40,000 $2,255 $14,236
Cropland, Pastureland & Rangeland 170 $4,551,097 $26,771 $80,000 $1,401 $16,313
Forestland 14 $102,903 $7,350 $40,000 $659 $10,832
Pastureland 90 $890,905 $9,899 $40,000 $257 $10,805
Pastureland & Rangeland 70 $1,161,717 $16,596 $40,000 $991 $14,183
Rangeland 25 $223,156 $8,926 $40,000 $523 $11,700
OREGON 171 $4,609,739 $26,958 $453,654 $166 $38,758
Cropland 43 $1,347,919 $31,347 $80,000 $1,000 $22,702
Cropland & Pastureland 9 $70,325 $7,814 $37,514 $687 $11,771
Cropland & Rangeland 30 $1,009,637 $33,655 $80,000 $5,252 $20,944
Cropland, Pastureland & Rangeland 28 $883,420 $31,551 $80,000 $4,491 $17,108
Forestland 37 $885,742 $23,939 $453,654 $166 $73,965
Pastureland 3 $8,782 $2,927 $4,101 $595 $2,020
Pastureland & Rangeland 4 $154,474 $38,619 $40,000 $35,790 $1,985
Rangeland 16 $209,440 $13,090 $40,000 $1,000 $14,378
Data Unavailablea 1 $40,000 $40,000 $40,000 $40,000 --b
PENNSYLVANIA 300 $2,311,722 $7,706 $74,183 $96 $10,227
Cropland 109 $1,133,672 $10,401 $43,206 $411 $10,367
Cropland & Pastureland 110 $992,016 $9,018 $74,183 $627 $11,540
Forestland 72 $176,556 $2,452 $40,000 $96 $4,996
Pastureland 9 $9,478 $1,053 $3,898 $139 $1,168
RHODE ISLAND 18 $35,029 $1,946 $20,436 $58 $4,626

CStP FY2010_Appendix_Modified_Final_2-14-2012.docx
107
Table A 13. Conservation Stewardship Program: Obligation Statistics for Ranking Period 2 by State and Land Use, FY 2010
State and Land Uses Contracts Obligation Avg Oblig Max Oblig Min Oblig Std Dev Oblig
Cropland 1 $1,000 $1,000 $1,000 $1,000 --b
Cropland & Pastureland 1 $1,000 $1,000 $1,000 $1,000 --b
Forestland 14 $31,875 $2,277 $20,436 $58 $5,236
Pastureland 2 $1,154 $577 $1,000 $154 $598
SOUTH CAROLINA 176 $1,469,813 $8,351 $80,000 $75 $12,080
Cropland 56 $922,725 $16,477 $80,000 $1,000 $15,843
Cropland & Pastureland 8 $75,673 $9,459 $34,368 $376 $10,649
Forestland 88 $413,220 $4,696 $45,632 $129 $7,612
Pastureland 24 $58,195 $2,425 $11,715 $75 $2,735
SOUTH DAKOTA 244 $7,734,929 $31,701 $80,000 $1,004 $16,298
Cropland 75 $2,628,251 $35,043 $80,000 $1,004 $18,402
Cropland & Pastureland 32 $1,101,667 $34,427 $80,000 $8,140 $14,031
Cropland & Rangeland 79 $2,522,192 $31,926 $80,000 $2,081 $15,336
Cropland, Pastureland & Rangeland 15 $360,928 $24,062 $40,000 $1,099 $14,785
Forestland 1 $2,145 $2,145 $2,145 $2,145 --b
Pastureland 4 $60,632 $15,158 $40,000 $3,502 $17,072
Pastureland & Rangeland 2 $46,715 $23,358 $34,736 $11,979 $16,092
Rangeland 36 $1,012,399 $28,122 $40,000 $1,069 $13,439
TENNESSEE 241 $1,469,131 $6,096 $80,000 $29 $12,692
Cropland 39 $927,654 $23,786 $80,000 $281 $22,909
Cropland & Pastureland 52 $219,618 $4,223 $18,871 $252 $4,613
Forestland 89 $215,720 $2,424 $40,000 $29 $5,427
Pastureland 61 $106,139 $1,740 $14,730 $140 $2,220
TEXAS 295 $5,430,875 $18,410 $80,000 $244 $18,745
Cropland 53 $1,189,902 $22,451 $80,000 $792 $20,276
Cropland & Pastureland 27 $598,221 $22,156 $66,354 $906 $19,680
Cropland & Rangeland 34 $1,036,695 $30,491 $80,000 $1,131 $19,638
Cropland, Pastureland & Rangeland 27 $718,602 $26,615 $58,522 $1,780 $14,952
Forestland 33 $89,488 $2,712 $14,468 $244 $3,538
Pastureland 63 $519,290 $8,243 $40,000 $669 $11,257
Pastureland & Rangeland 19 $333,969 $17,577 $51,005 $4,635 $13,814
Rangeland 38 $940,765 $24,757 $80,000 $1,150 $21,564
Data Unavailablea 1 $3,943 $3,943 $3,943 $3,943 --b
UTAH 61 $1,287,670 $21,109 $72,221 $317 $16,710
Cropland 14 $322,738 $23,053 $72,221 $1,000 $21,253
Cropland & Pastureland 7 $114,161 $16,309 $40,000 $317 $14,124
Cropland & Rangeland 13 $367,595 $28,277 $40,000 $1,000 $13,405
Cropland, Pastureland & Rangeland 19 $414,073 $21,793 $40,000 $2,221 $16,132
Pastureland 2 $5,563 $2,782 $2,860 $2,703 $111
Pastureland & Rangeland 3 $34,849 $11,616 $31,094 $1,737 $16,869
Rangeland 3 $28,691 $9,564 $14,582 $5,788 $4,527
VERMONT 5 $28,726 $5,745 $11,759 $428 $5,644
Cropland & Pastureland 2 $23,398 $11,699 $11,759 $11,639 $85
Forestland 3 $5,328 $1,776 $4,257 $428 $2,151
VIRGINIA 152 $2,237,673 $14,722 $80,000 $339 $14,461
Cropland 59 $1,277,244 $21,648 $80,000 $339 $16,828
Cropland & Pastureland 45 $543,703 $12,082 $40,000 $1,832 $9,213
Forestland 39 $382,663 $9,812 $40,000 $506 $12,763
Pastureland 9 $34,063 $3,785 $8,929 $1,037 $2,931
WASHINGTON 118 $3,779,022 $32,026 $80,000 $431 $20,766
Cropland 71 $2,586,142 $36,425 $80,000 $2,598 $18,635
Cropland & Pastureland 10 $301,426 $30,143 $80,000 $4,578 $29,222
Cropland & Rangeland 12 $376,972 $31,414 $80,000 $1,426 $20,678
Cropland, Pastureland & Rangeland 4 $121,656 $30,414 $40,000 $20,730 $10,873
Forestland 12 $123,023 $10,252 $40,000 $431 $14,220
Pastureland & Rangeland 4 $162,082 $40,521 $75,764 $14,865 $25,709
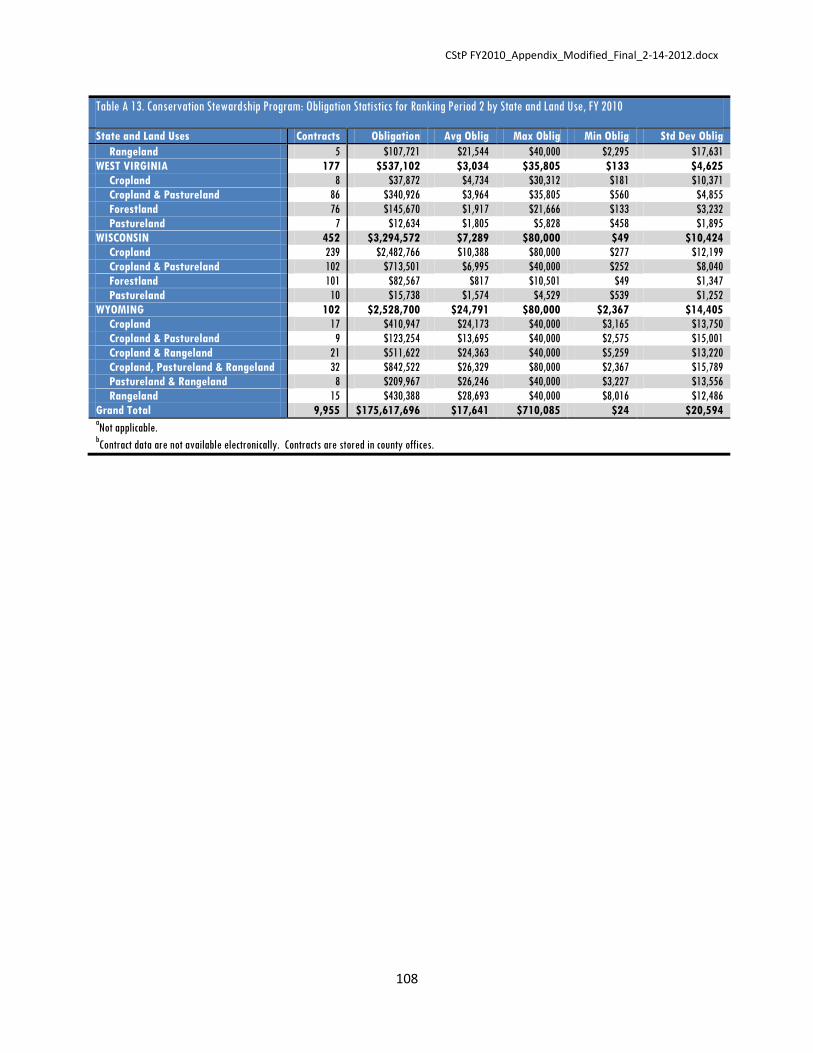
CStP FY2010_Appendix_Modified_Final_2-14-2012.docx
108
Table A 13. Conservation Stewardship Program: Obligation Statistics for Ranking Period 2 by State and Land Use, FY 2010
State and Land Uses Contracts Obligation Avg Oblig Max Oblig Min Oblig Std Dev Oblig
Rangeland 5 $107,721 $21,544 $40,000 $2,295 $17,631
WEST VIRGINIA 177 $537,102 $3,034 $35,805 $133 $4,625
Cropland 8 $37,872 $4,734 $30,312 $181 $10,371
Cropland & Pastureland 86 $340,926 $3,964 $35,805 $560 $4,855
Forestland 76 $145,670 $1,917 $21,666 $133 $3,232
Pastureland 7 $12,634 $1,805 $5,828 $458 $1,895
WISCONSIN 452 $3,294,572 $7,289 $80,000 $49 $10,424
Cropland 239 $2,482,766 $10,388 $80,000 $277 $12,199
Cropland & Pastureland 102 $713,501 $6,995 $40,000 $252 $8,040
Forestland 101 $82,567 $817 $10,501 $49 $1,347
Pastureland 10 $15,738 $1,574 $4,529 $539 $1,252
WYOMING 102 $2,528,700 $24,791 $80,000 $2,367 $14,405
Cropland 17 $410,947 $24,173 $40,000 $3,165 $13,750
Cropland & Pastureland 9 $123,254 $13,695 $40,000 $2,575 $15,001
Cropland & Rangeland 21 $511,622 $24,363 $40,000 $5,259 $13,220
Cropland, Pastureland & Rangeland 32 $842,522 $26,329 $80,000 $2,367 $15,789
Pastureland & Rangeland 8 $209,967 $26,246 $40,000 $3,227 $13,556
Rangeland 15 $430,388 $28,693 $40,000 $8,016 $12,486
Grand Total 9,955 $175,617,696 $17,641 $710,085 $24 $20,594 aNot applicable.
bContract data are not available electronically. Contracts are stored in county offices.

CStP FY2010_Appendix_Modified_Final_2-14-2012.docx
109
Table A 14. Conservation Stewardship Program: Obligation Statistics for Ranking Periods 1 and 2 by State and Land Use, FY 2010
State and Land Uses Contracts Obligation Avg. Oblig Max Oblig Min Oblig Std Dev Oblig
ALABAMA 431 $4,087,316 $9,483 $80,000 $91 $13,370
Cropland 52 $939,776 $18,073 $80,000 $228 $19,327
Cropland & Pastureland 57 $848,945 $14,894 $80,000 $563 $17,722
Forestland 252 $1,878,238 $7,453 $40,000 $91 $10,366
Pastureland 70 $420,357 $6,005 $40,000 $193 $9,221
ALASKA 14 $1,329,565 $94,969 $563,318 $1,000 $159,954
Cropland 3 $76,828 $25,609 $40,000 $7,569 $16,521
Cropland, Pastureland & Rangeland 1 $14,405 $14,405 $14,405 $14,405 --b
Forestland 9 $1,221,333 $135,704 $563,318 $1,000 $190,435
Pastureland 1 $16,999 $16,999 $16,999 $16,999 --b
ARIZONA 56 $4,003,337 $71,488 $710,085 $1,536 $154,955
Cropland 13 $349,918 $26,917 $55,151 $8,822 $15,885
Cropland & Rangeland 6 $912,563 $152,094 $710,085 $13,159 $274,247
Cropland, Pastureland & Rangeland 3 $46,795 $15,598 $40,000 $2,209 $21,166
Forestland 1 $184,591 $184,591 $184,591 $184,591 --b
Pastureland & Rangeland 6 $115,573 $19,262 $40,000 $4,038 $16,583
Rangeland 27 $2,393,897 $88,663 $692,993 $1,536 $178,450
ARKANSAS 620 $11,187,957 $18,045 $80,000 $89 $19,921
Cropland 365 $9,820,766 $26,906 $80,000 $768 $20,688
Cropland & Pastureland 16 $300,872 $18,805 $80,000 $626 $24,530
Forestland 108 $286,583 $2,654 $23,799 $89 $4,376
Pastureland 131 $779,736 $5,952 $40,000 $450 $6,428
CALIFORNIA 337 $5,975,203 $17,731 $103,533 $293 $16,768
Cropland 151 $2,311,350 $15,307 $103,533 $293 $17,769
Cropland & Pastureland 15 $165,833 $11,056 $40,000 $824 $10,899
Cropland & Rangeland 31 $592,324 $19,107 $40,000 $1,722 $14,642
Cropland, Pastureland & Rangeland 17 $423,093 $24,888 $40,000 $1,076 $13,792
Forestland 20 $173,774 $8,689 $40,000 $375 $12,211
Pastureland 10 $160,010 $16,001 $40,000 $428 $14,829
Pastureland & Rangeland 26 $647,532 $24,905 $60,736 $2,821 $15,264
Rangeland 67 $1,501,287 $22,407 $80,000 $777 $16,688
COLORADO 469 $11,746,128 $25,045 $80,000 $133 $16,032
Cropland 158 $4,292,186 $27,166 $80,000 $875 $16,285
Cropland & Pastureland 16 $240,411 $15,026 $40,000 $133 $14,213
Cropland & Rangeland 148 $4,493,495 $30,361 $80,000 $1,250 $14,472
Cropland, Pastureland & Rangeland 30 $695,275 $23,176 $40,000 $2,481 $11,396
Forestland 10 $34,401 $3,440 $12,552 $346 $4,219
Pastureland 2 $3,856 $1,928 $3,079 $777 $1,628
Pastureland & Rangeland 8 $103,752 $12,969 $36,396 $1,000 $12,957
Rangeland 96 $1,867,948 $19,458 $40,000 $207 $15,602
Data Unavailablea 1 $14,804 $14,804 $14,804 $14,804 --b
CONNECTICUT 13 $52,907 $4,070 $20,233 $241 $5,536
Cropland 5 $16,092 $3,218 $6,208 $557 $2,263
Cropland & Pastureland 1 $5,859 $5,859 $5,859 $5,859 --b
Forestland 7 $30,956 $4,422 $20,233 $241 $7,523
DELAWARE 25 $349,904 $13,996 $40,000 $214 $13,718
Cropland 19 $342,413 $18,022 $40,000 $1,262 $13,386
Cropland & Pastureland 1 $214 $214 $214 $214 --b
Forestland 4 $3,697 $924 $1,703 $450 $554
Pastureland 1 $3,580 $3,580 $3,580 $3,580 --b
FLORIDA 95 $1,216,126 $12,801 $40,000 $288 $13,930
Cropland 17 $318,057 $18,709 $40,000 $433 $16,357
Cropland & Pastureland 18 $294,949 $16,386 $40,000 $974 $13,116
Cropland, Pastureland & Rangeland 5 $102,443 $20,489 $40,000 $4,178 $13,970
Forestland 26 $116,617 $4,485 $35,959 $288 $7,154
Pastureland 21 $185,258 $8,822 $40,000 $608 $11,380

CStP FY2010_Appendix_Modified_Final_2-14-2012.docx
110
Table A 14. Conservation Stewardship Program: Obligation Statistics for Ranking Periods 1 and 2 by State and Land Use, FY 2010
State and Land Uses Contracts Obligation Avg. Oblig Max Oblig Min Oblig Std Dev Oblig
Pastureland & Rangeland 8 $198,802 $24,850 $40,000 $1,599 $16,786
GEORGIA 584 $10,245,599 $17,544 $80,000 $124 $17,653
Cropland 194 $5,299,208 $27,316 $80,000 $227 $17,696
Cropland & Pastureland 83 $1,924,301 $23,184 $80,000 $797 $17,398
Forestland 252 $2,117,214 $8,402 $80,000 $124 $10,869
Pastureland 33 $157,401 $4,770 $34,153 $138 $8,249
Data Unavailablea 22 $747,475 $33,976 $80,000 $247 $22,938
HAWAII 16 $105,873 $6,617 $40,000 $473 $11,006
Cropland 6 $8,362 $1,394 $3,362 $1,000 $964
Cropland & Pastureland 2 $1,473 $737 $1,000 $473 $373
Pastureland 8 $96,038 $12,005 $40,000 $1,000 $13,872
IDAHO 202 $4,143,039 $20,510 $233,494 $411 $21,764
Cropland 95 $2,321,680 $24,439 $80,000 $961 $17,044
Cropland & Pastureland 22 $336,229 $15,283 $40,000 $2,519 $12,965
Cropland & Rangeland 14 $302,905 $21,636 $40,000 $2,295 $11,748
Cropland, Pastureland & Rangeland 32 $577,001 $18,031 $40,000 $858 $12,576
Forestland 24 $363,042 $15,127 $233,494 $411 $47,228
Pastureland 2 $4,748 $2,374 $3,467 $1,281 $1,546
Pastureland & Rangeland 8 $168,582 $21,073 $40,000 $1,000 $15,104
Rangeland 5 $68,852 $13,770 $40,000 $1,476 $15,035
ILLINOIS 542 $8,696,724 $16,046 $74,239 $34 $13,604
Cropland 423 $7,468,023 $17,655 $74,239 $72 $13,457
Cropland & Pastureland 70 $1,193,015 $17,043 $40,000 $1,270 $12,621
Forestland 44 $27,798 $632 $6,381 $34 $1,030
Pastureland 5 $7,888 $1,578 $2,087 $853 $464
INDIANA 308 $5,212,795 $16,925 $80,000 $44 $15,102
Cropland 243 $4,554,855 $18,744 $80,000 $390 $15,203
Cropland & Pastureland 37 $621,774 $16,805 $40,000 $792 $13,289
Forestland 21 $21,286 $1,014 $7,249 $44 $1,572
Pastureland 7 $14,880 $2,126 $5,588 $864 $1,705
IOWA 1,480 $20,255,574 $13,686 $80,000 $111 $12,253
Cropland 994 $14,100,194 $14,185 $80,000 $203 $12,572
Cropland & Pastureland 427 $6,003,966 $14,061 $80,000 $111 $11,442
Cropland, Pastureland & Rangeland 1 $40,000 $40,000 $40,000 $40,000 --b
Forestland 38 $46,202 $1,216 $9,416 $122 $1,671
Pastureland 20 $65,212 $3,261 $9,748 $578 $2,564
KANSAS 872 $18,000,610 $20,643 $80,000 $117 $16,046
Cropland 442 $8,374,808 $18,948 $80,000 $117 $15,840
Cropland & Pastureland 43 $898,861 $20,904 $68,069 $148 $16,718
Cropland & Rangeland 281 $6,984,772 $24,857 $80,000 $411 $15,815
Cropland, Pastureland & Rangeland 61 $1,345,688 $22,060 $59,488 $1,254 $14,336
Forestland 5 $2,441 $488 $809 $234 $267
Pastureland & Rangeland 9 $90,401 $10,045 $40,000 $1,173 $13,805
Rangeland 31 $303,639 $9,795 $40,000 $186 $12,804
KENTUCKY 182 $928,525 $5,102 $40,000 $111 $7,716
Cropland 31 $265,166 $8,554 $40,000 $111 $11,873
Cropland & Pastureland 65 $413,121 $6,356 $40,000 $448 $8,624
Forestland 64 $187,673 $2,932 $14,145 $119 $3,490
Pastureland 22 $62,565 $2,844 $9,196 $437 $2,539
LOUISIANA 321 $5,554,729 $17,304 $80,000 $148 $20,071
Cropland 142 $4,062,674 $28,610 $80,000 $268 $20,234
Cropland & Pastureland 30 $687,825 $22,928 $80,000 $889 $22,874
Forestland 75 $250,996 $3,347 $40,000 $148 $5,871
Pastureland 74 $553,234 $7,476 $80,000 $159 $13,136
MAINE 102 $528,394 $5,180 $41,894 $57 $8,976
Cropland 18 $209,260 $11,626 $41,894 $436 $13,548

CStP FY2010_Appendix_Modified_Final_2-14-2012.docx
111
Table A 14. Conservation Stewardship Program: Obligation Statistics for Ranking Periods 1 and 2 by State and Land Use, FY 2010
State and Land Uses Contracts Obligation Avg. Oblig Max Oblig Min Oblig Std Dev Oblig
Cropland & Pastureland 12 $71,903 $5,992 $17,822 $590 $5,648
Forestland 66 $240,347 $3,642 $40,000 $57 $7,495
Pastureland 6 $6,884 $1,147 $3,155 $245 $1,068
MARYLAND 65 $741,914 $11,414 $80,000 $59 $15,270
Cropland 29 $506,511 $17,466 $80,000 $245 $18,367
Cropland & Pastureland 21 $227,575 $10,837 $40,000 $511 $11,455
Forestland 14 $7,347 $525 $2,074 $59 $547
Pastureland 1 $481 $481 $481 $481 --b
MASSACHUSETTS 11 $58,135 $5,285 $16,845 $938 $4,873
Cropland 1 $16,845 $16,845 $16,845 $16,845 --b
Cropland & Pastureland 3 $11,007 $3,669 $6,273 $1,316 $2,488
Forestland 7 $30,283 $4,326 $10,780 $938 $3,586
MICHIGAN 544 $4,678,331 $8,600 $41,400 $62 $10,795
Cropland 276 $3,943,460 $14,288 $41,400 $326 $12,075
Cropland & Pastureland 35 $215,503 $6,157 $19,996 $703 $4,934
Forestland 226 $484,314 $2,143 $40,000 $62 $3,993
Pastureland 7 $35,054 $5,008 $12,319 $875 $4,422
MINNESOTA 1,575 $21,377,320 $13,573 $82,633 $21 $14,624
Cropland 765 $16,104,496 $21,052 $80,000 $64 $15,041
Cropland & Pastureland 349 $4,360,001 $12,493 $40,000 $163 $11,300
Forestland 417 $704,528 $1,690 $82,633 $21 $5,127
Pastureland 44 $208,295 $4,734 $40,000 $330 $8,178
MISSISSIPPI 319 $8,980,074 $28,151 $80,000 $69 $29,689
Cropland 161 $8,102,233 $50,324 $80,000 $3,347 $24,998
Cropland & Pastureland 31 $463,191 $14,942 $80,000 $590 $21,718
Forestland 99 $303,890 $3,070 $26,256 $69 $4,611
Pastureland 28 $110,760 $3,956 $27,583 $656 $5,597
MISSOURI 1,939 $16,557,469 $8,539 $80,000 $24 $11,503
Cropland 497 $8,018,346 $16,133 $80,000 $68 $15,450
Cropland & Pastureland 442 $5,292,146 $11,973 $40,000 $429 $10,736
Forestland 432 $579,504 $1,341 $40,000 $24 $2,699
Pastureland 568 $2,667,473 $4,696 $40,000 $138 $5,852
MONTANA 486 $15,066,536 $31,001 $80,000 $387 $14,877
Cropland 134 $4,445,612 $33,176 $80,000 $2,027 $16,056
Cropland & Pastureland 31 $579,284 $18,687 $54,358 $1,016 $14,186
Cropland & Rangeland 67 $2,285,191 $34,107 $76,555 $9,281 $11,144
Cropland, Pastureland & Rangeland 189 $6,665,088 $35,265 $76,728 $552 $10,018
Forestland 31 $250,708 $8,087 $40,000 $387 $10,531
Pastureland 2 $6,396 $3,198 $3,603 $2,793 $573
Pastureland & Rangeland 25 $549,516 $21,981 $40,000 $2,675 $13,037
Rangeland 7 $284,741 $40,677 $80,000 $15,781 $20,897
NEBRASKA 1,106 $20,152,534 $18,221 $80,000 $64 $15,647
Cropland 399 $6,984,063 $17,504 $80,000 $111 $15,624
Cropland & Pastureland 126 $1,882,106 $14,937 $40,000 $174 $12,037
Cropland & Rangeland 290 $7,322,297 $25,249 $80,000 $657 $14,863
Cropland, Pastureland & Rangeland 60 $1,408,210 $23,470 $80,000 $1,040 $15,179
Forestland 40 $47,686 $1,192 $11,657 $64 $2,685
Pastureland 27 $61,209 $2,267 $8,074 $192 $1,849
Pastureland & Rangeland 26 $373,997 $14,385 $40,000 $293 $13,870
Rangeland 136 $2,031,600 $14,938 $80,000 $333 $15,912
Data Unavailablea 2 $41,366 $20,683 $37,674 $3,692 $24,029
NEVADA 17 $300,124 $17,654 $40,000 $837 $15,072
Cropland 5 $58,775 $11,755 $40,000 $837 $16,240
Cropland & Pastureland 3 $12,830 $4,277 $6,520 $1,252 $2,720
Cropland & Rangeland 3 $75,482 $25,161 $40,000 $14,438 $13,269
Cropland, Pastureland & Rangeland 5 $124,975 $24,995 $40,000 $4,875 $15,453
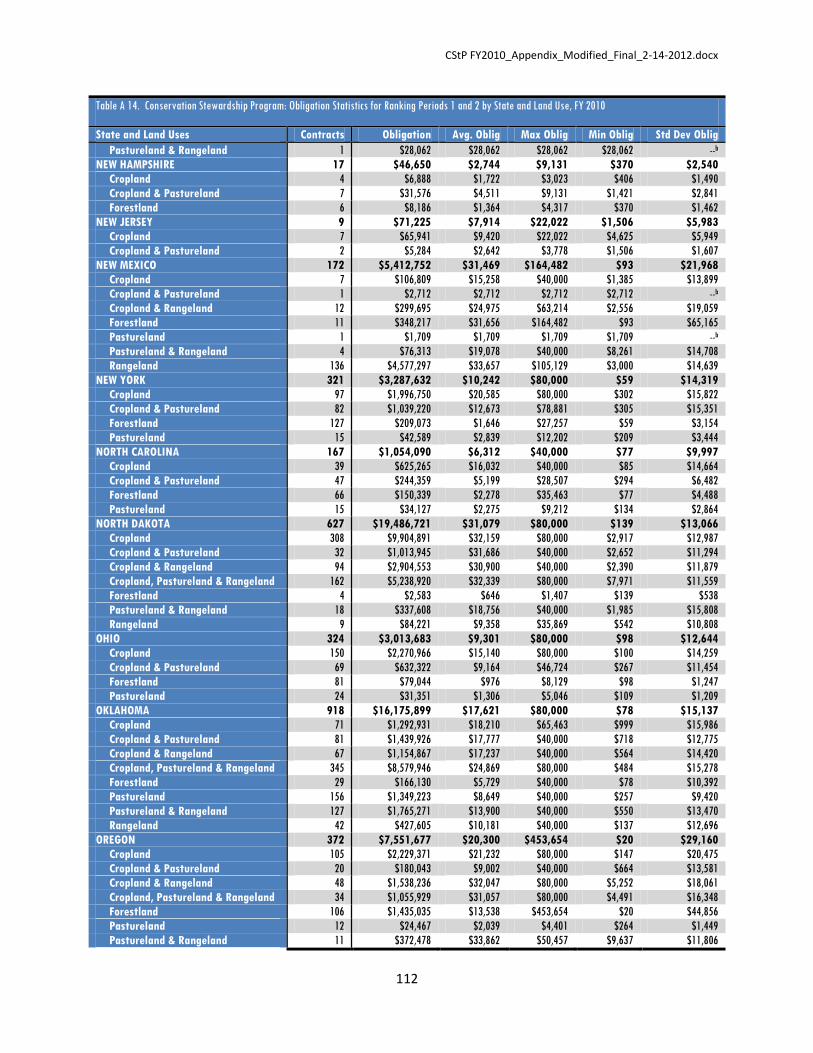
CStP FY2010_Appendix_Modified_Final_2-14-2012.docx
112
Table A 14. Conservation Stewardship Program: Obligation Statistics for Ranking Periods 1 and 2 by State and Land Use, FY 2010
State and Land Uses Contracts Obligation Avg. Oblig Max Oblig Min Oblig Std Dev Oblig
Pastureland & Rangeland 1 $28,062 $28,062 $28,062 $28,062 --b
NEW HAMPSHIRE 17 $46,650 $2,744 $9,131 $370 $2,540
Cropland 4 $6,888 $1,722 $3,023 $406 $1,490
Cropland & Pastureland 7 $31,576 $4,511 $9,131 $1,421 $2,841
Forestland 6 $8,186 $1,364 $4,317 $370 $1,462
NEW JERSEY 9 $71,225 $7,914 $22,022 $1,506 $5,983
Cropland 7 $65,941 $9,420 $22,022 $4,625 $5,949
Cropland & Pastureland 2 $5,284 $2,642 $3,778 $1,506 $1,607
NEW MEXICO 172 $5,412,752 $31,469 $164,482 $93 $21,968
Cropland 7 $106,809 $15,258 $40,000 $1,385 $13,899
Cropland & Pastureland 1 $2,712 $2,712 $2,712 $2,712 --b
Cropland & Rangeland 12 $299,695 $24,975 $63,214 $2,556 $19,059
Forestland 11 $348,217 $31,656 $164,482 $93 $65,165
Pastureland 1 $1,709 $1,709 $1,709 $1,709 --b
Pastureland & Rangeland 4 $76,313 $19,078 $40,000 $8,261 $14,708
Rangeland 136 $4,577,297 $33,657 $105,129 $3,000 $14,639
NEW YORK 321 $3,287,632 $10,242 $80,000 $59 $14,319
Cropland 97 $1,996,750 $20,585 $80,000 $302 $15,822
Cropland & Pastureland 82 $1,039,220 $12,673 $78,881 $305 $15,351
Forestland 127 $209,073 $1,646 $27,257 $59 $3,154
Pastureland 15 $42,589 $2,839 $12,202 $209 $3,444
NORTH CAROLINA 167 $1,054,090 $6,312 $40,000 $77 $9,997
Cropland 39 $625,265 $16,032 $40,000 $85 $14,664
Cropland & Pastureland 47 $244,359 $5,199 $28,507 $294 $6,482
Forestland 66 $150,339 $2,278 $35,463 $77 $4,488
Pastureland 15 $34,127 $2,275 $9,212 $134 $2,864
NORTH DAKOTA 627 $19,486,721 $31,079 $80,000 $139 $13,066
Cropland 308 $9,904,891 $32,159 $80,000 $2,917 $12,987
Cropland & Pastureland 32 $1,013,945 $31,686 $40,000 $2,652 $11,294
Cropland & Rangeland 94 $2,904,553 $30,900 $40,000 $2,390 $11,879
Cropland, Pastureland & Rangeland 162 $5,238,920 $32,339 $80,000 $7,971 $11,559
Forestland 4 $2,583 $646 $1,407 $139 $538
Pastureland & Rangeland 18 $337,608 $18,756 $40,000 $1,985 $15,808
Rangeland 9 $84,221 $9,358 $35,869 $542 $10,808
OHIO 324 $3,013,683 $9,301 $80,000 $98 $12,644
Cropland 150 $2,270,966 $15,140 $80,000 $100 $14,259
Cropland & Pastureland 69 $632,322 $9,164 $46,724 $267 $11,454
Forestland 81 $79,044 $976 $8,129 $98 $1,247
Pastureland 24 $31,351 $1,306 $5,046 $109 $1,209
OKLAHOMA 918 $16,175,899 $17,621 $80,000 $78 $15,137
Cropland 71 $1,292,931 $18,210 $65,463 $999 $15,986
Cropland & Pastureland 81 $1,439,926 $17,777 $40,000 $718 $12,775
Cropland & Rangeland 67 $1,154,867 $17,237 $40,000 $564 $14,420
Cropland, Pastureland & Rangeland 345 $8,579,946 $24,869 $80,000 $484 $15,278
Forestland 29 $166,130 $5,729 $40,000 $78 $10,392
Pastureland 156 $1,349,223 $8,649 $40,000 $257 $9,420
Pastureland & Rangeland 127 $1,765,271 $13,900 $40,000 $550 $13,470
Rangeland 42 $427,605 $10,181 $40,000 $137 $12,696
OREGON 372 $7,551,677 $20,300 $453,654 $20 $29,160
Cropland 105 $2,229,371 $21,232 $80,000 $147 $20,475
Cropland & Pastureland 20 $180,043 $9,002 $40,000 $664 $13,581
Cropland & Rangeland 48 $1,538,236 $32,047 $80,000 $5,252 $18,061
Cropland, Pastureland & Rangeland 34 $1,055,929 $31,057 $80,000 $4,491 $16,348
Forestland 106 $1,435,035 $13,538 $453,654 $20 $44,856
Pastureland 12 $24,467 $2,039 $4,401 $264 $1,449
Pastureland & Rangeland 11 $372,478 $33,862 $50,457 $9,637 $11,806

CStP FY2010_Appendix_Modified_Final_2-14-2012.docx
113
Table A 14. Conservation Stewardship Program: Obligation Statistics for Ranking Periods 1 and 2 by State and Land Use, FY 2010
State and Land Uses Contracts Obligation Avg. Oblig Max Oblig Min Oblig Std Dev Oblig
Rangeland 35 $676,118 $19,318 $40,000 $1,000 $14,389
Data Unavailablea 1 $40,000 $40,000 $40,000 $40,000 --b
PENNSYLVANIA 565 $3,974,217 $7,034 $74,183 $61 $9,615
Cropland 181 $1,945,854 $10,751 $43,206 $289 $11,131
Cropland & Pastureland 230 $1,715,899 $7,460 $74,183 $414 $9,546
Forestland 136 $290,036 $2,133 $40,000 $61 $4,331
Pastureland 18 $22,428 $1,246 $4,986 $78 $1,351
PUERTO RICO 11 $19,066 $1,733 $5,030 $125 $1,654
Cropland 9 $16,907 $1,879 $5,030 $125 $1,813
Pastureland 2 $2,159 $1,080 $1,103 $1,056 $33
RHODE ISLAND 21 $46,311 $2,205 $20,436 $58 $4,332
Cropland 1 $1,000 $1,000 $1,000 $1,000 --b
Cropland & Pastureland 2 $4,375 $2,188 $3,375 $1,000 $1,679
Forestland 15 $37,026 $2,468 $20,436 $58 $5,100
Pastureland 3 $3,910 $1,303 $2,756 $154 $1,327
SOUTH CAROLINA 443 $3,423,141 $7,727 $80,000 $75 $10,888
Cropland 119 $1,691,979 $14,218 $80,000 $209 $14,520
Cropland & Pastureland 43 $507,500 $11,802 $40,000 $376 $10,205
Forestland 234 $1,130,170 $4,830 $45,632 $117 $7,667
Pastureland 47 $93,492 $1,989 $11,715 $75 $2,122
SOUTH DAKOTA 505 $14,873,702 $29,453 $80,000 $329 $15,452
Cropland 154 $4,759,746 $30,907 $80,000 $445 $17,052
Cropland & Pastureland 75 $2,205,225 $29,403 $80,000 $1,714 $14,967
Cropland & Rangeland 167 $5,246,201 $31,414 $80,000 $2,081 $13,643
Cropland, Pastureland & Rangeland 38 $1,094,559 $28,804 $40,000 $1,099 $13,157
Forestland 2 $2,988 $1,494 $2,145 $843 $921
Pastureland 12 $83,855 $6,988 $40,000 $329 $11,014
Pastureland & Rangeland 5 $97,186 $19,437 $40,000 $2,015 $16,857
Rangeland 52 $1,383,942 $26,614 $40,000 $1,069 $13,987
TENNESSEE 416 $2,127,807 $5,115 $80,000 $29 $10,718
Cropland 60 $1,152,458 $19,208 $80,000 $281 $20,860
Cropland & Pastureland 87 $413,345 $4,751 $40,000 $252 $6,042
Forestland 165 $376,046 $2,279 $40,000 $29 $4,913
Pastureland 104 $185,958 $1,788 $14,730 $140 $2,200
TEXAS 989 $15,185,771 $15,355 $80,000 $51 $15,974
Cropland 153 $3,319,947 $21,699 $80,000 $100 $16,844
Cropland & Pastureland 79 $1,329,065 $16,824 $66,354 $518 $16,072
Cropland & Rangeland 91 $2,404,970 $26,428 $80,000 $1,131 $16,632
Cropland, Pastureland & Rangeland 91 $2,163,444 $23,774 $58,522 $994 $14,171
Forestland 193 $533,134 $2,762 $40,000 $51 $4,589
Pastureland 149 $1,053,535 $7,071 $40,000 $127 $9,416
Pastureland & Rangeland 73 $1,012,422 $13,869 $51,005 $253 $12,973
Rangeland 159 $3,365,311 $21,165 $80,000 $432 $17,089
Data Unavailablea 1 $3,943 $3,943 $3,943 $3,943 --b
UTAH 78 $1,738,582 $22,290 $72,221 $317 $16,278
Cropland 17 $386,131 $22,714 $72,221 $1,000 $19,372
Cropland & Pastureland 8 $119,294 $14,912 $40,000 $317 $13,660
Cropland & Rangeland 15 $447,595 $29,840 $40,000 $1,000 $13,079
Cropland, Pastureland & Rangeland 26 $614,614 $23,639 $40,000 $1,564 $15,969
Pastureland 2 $5,563 $2,782 $2,860 $2,703 $111
Pastureland & Rangeland 3 $34,849 $11,616 $31,094 $1,737 $16,869
Rangeland 7 $130,536 $18,648 $40,000 $3,073 $14,248
VERMONT 7 $35,471 $5,067 $11,759 $220 $5,088
Cropland & Pastureland 3 $29,923 $9,974 $11,759 $6,525 $2,988
Forestland 4 $5,548 $1,387 $4,257 $220 $1,921
VIRGINIA 270 $3,313,041 $12,271 $80,000 $166 $13,567

CStP FY2010_Appendix_Modified_Final_2-14-2012.docx
114
Table A 14. Conservation Stewardship Program: Obligation Statistics for Ranking Periods 1 and 2 by State and Land Use, FY 2010
State and Land Uses Contracts Obligation Avg. Oblig Max Oblig Min Oblig Std Dev Oblig
Cropland 83 $1,654,116 $19,929 $80,000 $339 $15,956
Cropland & Pastureland 81 $1,025,097 $12,656 $40,000 $399 $11,331
Forestland 84 $557,356 $6,635 $40,000 $166 $10,328
Pastureland 22 $76,472 $3,476 $14,806 $337 $3,531
WASHINGTON 206 $6,008,341 $29,167 $80,000 $431 $18,730
Cropland 120 $3,934,939 $32,791 $80,000 $1,520 $17,331
Cropland & Pastureland 19 $370,775 $19,514 $80,000 $2,461 $23,917
Cropland & Rangeland 28 $957,213 $34,186 $80,000 $1,426 $14,618
Cropland, Pastureland & Rangeland 9 $274,117 $30,457 $40,000 $20,730 $8,182
Forestland 16 $145,857 $9,116 $40,000 $431 $12,502
Pastureland 2 $12,082 $6,041 $7,633 $4,449 $2,251
Pastureland & Rangeland 6 $165,637 $27,606 $75,764 $762 $28,236
Rangeland 6 $147,721 $24,620 $40,000 $2,295 $17,477
WEST VIRGINIA 253 $780,412 $3,085 $35,805 $133 $4,394
Cropland 9 $39,595 $4,399 $30,312 $181 $9,753
Cropland & Pastureland 127 $510,943 $4,023 $35,805 $232 $4,776
Forestland 107 $215,070 $2,010 $21,666 $133 $2,962
Pastureland 10 $14,804 $1,480 $5,828 $458 $1,634
WISCONSIN 968 $6,650,195 $6,870 $80,000 $49 $9,232
Cropland 462 $4,758,100 $10,299 $80,000 $277 $10,974
Cropland & Pastureland 265 $1,664,813 $6,282 $40,000 $252 $6,894
Forestland 214 $190,099 $888 $10,501 $49 $1,234
Pastureland 27 $37,183 $1,377 $4,529 $380 $997
WYOMING 177 $4,590,762 $25,937 $80,000 $1,546 $14,222
Cropland 20 $463,207 $23,160 $40,000 $3,022 $13,606
Cropland & Pastureland 13 $178,871 $13,759 $40,000 $2,358 $14,133
Cropland & Rangeland 41 $1,049,843 $25,606 $40,000 $2,008 $13,575
Cropland, Pastureland & Rangeland 56 $1,548,869 $27,658 $80,000 $2,367 $14,863
Forestland 2 $22,208 $11,104 $20,662 $1,546 $13,517
Pastureland & Rangeland 18 $519,657 $28,870 $40,000 $3,227 $12,563
Rangeland 27 $808,107 $29,930 $40,000 $8,016 $12,433
Grand Total 20,567 $320,399,890 $15,578 $710,085 $20 $19,188 aNot applicable.
bContract data are not available electronically. Contracts are stored in county offices.
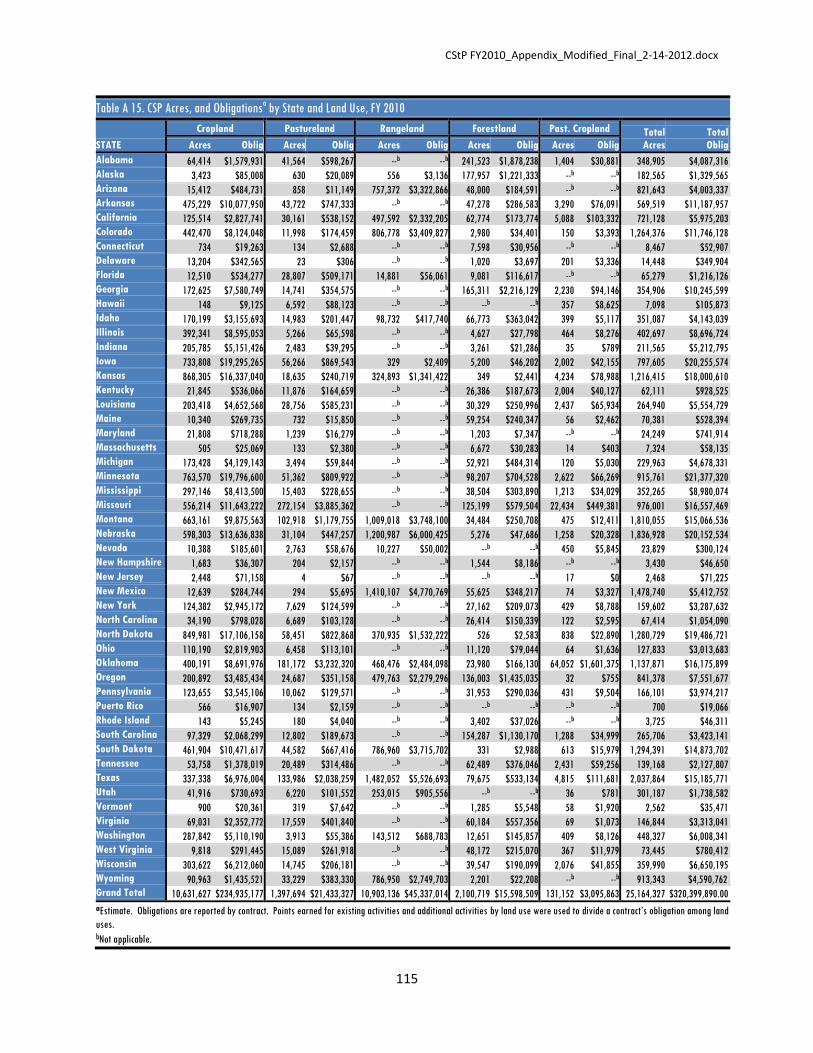
CStP FY2010_Appendix_Modified_Final_2-14-2012.docx
115
Table A 15. CSP Acres, and Obligationsa by State and Land Use, FY 2010
STATE
Cropland Pastureland Rangeland Forestland Past. Cropland Total
Acres
Total
Oblig Acres Oblig Acres Oblig Acres Oblig Acres Oblig Acres Oblig
Alabama 64,414 $1,579,931 41,564 $598,267 --b --b 241,523 $1,878,238 1,404 $30,881 348,905 $4,087,316
Alaska 3,423 $85,008 630 $20,089 556 $3,136 177,957 $1,221,333 --b --b 182,565 $1,329,565
Arizona 15,412 $484,731 858 $11,149 757,372 $3,322,866 48,000 $184,591 --b --b 821,643 $4,003,337
Arkansas 475,229 $10,077,950 43,722 $747,333 --b --b 47,278 $286,583 3,290 $76,091 569,519 $11,187,957
California 125,514 $2,827,741 30,161 $538,152 497,592 $2,332,205 62,774 $173,774 5,088 $103,332 721,128 $5,975,203
Colorado 442,470 $8,124,048 11,998 $174,459 806,778 $3,409,827 2,980 $34,401 150 $3,393 1,264,376 $11,746,128
Connecticut 734 $19,263 134 $2,688 --b --b 7,598 $30,956 --b --b 8,467 $52,907
Delaware 13,204 $342,565 23 $306 --b --b 1,020 $3,697 201 $3,336 14,448 $349,904
Florida 12,510 $534,277 28,807 $509,171 14,881 $56,061 9,081 $116,617 --b --b 65,279 $1,216,126
Georgia 172,625 $7,580,749 14,741 $354,575 --b --b 165,311 $2,216,129 2,230 $94,146 354,906 $10,245,599
Hawaii 148 $9,125 6,592 $88,123 --b --b --b --b 357 $8,625 7,098 $105,873
Idaho 170,199 $3,155,693 14,983 $201,447 98,732 $417,740 66,773 $363,042 399 $5,117 351,087 $4,143,039
Illinois 392,341 $8,595,053 5,266 $65,598 --b --b 4,627 $27,798 464 $8,276 402,697 $8,696,724
Indiana 205,785 $5,151,426 2,483 $39,295 --b --b 3,261 $21,286 35 $789 211,565 $5,212,795
Iowa 733,808 $19,295,265 56,266 $869,543 329 $2,409 5,200 $46,202 2,002 $42,155 797,605 $20,255,574
Kansas 868,305 $16,337,040 18,635 $240,719 324,893 $1,341,422 349 $2,441 4,234 $78,988 1,216,415 $18,000,610
Kentucky 21,845 $536,066 11,876 $164,659 --b --b 26,386 $187,673 2,004 $40,127 62,111 $928,525
Louisiana 203,418 $4,652,568 28,756 $585,231 --b --b 30,329 $250,996 2,437 $65,934 264,940 $5,554,729
Maine 10,340 $269,735 732 $15,850 --b --b 59,254 $240,347 56 $2,462 70,381 $528,394
Maryland 21,808 $718,288 1,239 $16,279 --b --b 1,203 $7,347 --b --b 24,249 $741,914
Massachusetts 505 $25,069 133 $2,380 --b --b 6,672 $30,283 14 $403 7,324 $58,135
Michigan 173,428 $4,129,143 3,494 $59,844 --b --b 52,921 $484,314 120 $5,030 229,963 $4,678,331
Minnesota 763,570 $19,796,600 51,362 $809,922 --b --b 98,207 $704,528 2,622 $66,269 915,761 $21,377,320
Mississippi 297,146 $8,413,500 15,403 $228,655 --b --b 38,504 $303,890 1,213 $34,029 352,265 $8,980,074
Missouri 556,214 $11,643,222 272,154 $3,885,362 --b --b 125,199 $579,504 22,434 $449,381 976,001 $16,557,469
Montana 663,161 $9,875,563 102,918 $1,179,755 1,009,018 $3,748,100 34,484 $250,708 475 $12,411 1,810,055 $15,066,536
Nebraska 598,303 $13,636,838 31,104 $447,257 1,200,987 $6,000,425 5,276 $47,686 1,258 $20,328 1,836,928 $20,152,534
Nevada 10,388 $185,601 2,763 $58,676 10,227 $50,002 --b --b 450 $5,845 23,829 $300,124
New Hampshire 1,683 $36,307 204 $2,157 --b --b 1,544 $8,186 --b --b 3,430 $46,650
New Jersey 2,448 $71,158 4 $67 --b --b --b --b 17 $0 2,468 $71,225
New Mexico 12,639 $284,744 294 $5,695 1,410,107 $4,770,769 55,625 $348,217 74 $3,327 1,478,740 $5,412,752
New York 124,382 $2,945,172 7,629 $124,599 --b --b 27,162 $209,073 429 $8,788 159,602 $3,287,632
North Carolina 34,190 $798,028 6,689 $103,128 --b --b 26,414 $150,339 122 $2,595 67,414 $1,054,090
North Dakota 849,981 $17,106,158 58,451 $822,868 370,935 $1,532,222 526 $2,583 838 $22,890 1,280,729 $19,486,721
Ohio 110,190 $2,819,903 6,458 $113,101 --b --b 11,120 $79,044 64 $1,636 127,833 $3,013,683
Oklahoma 400,191 $8,691,976 181,172 $3,232,320 468,476 $2,484,098 23,980 $166,130 64,052 $1,601,375 1,137,871 $16,175,899
Oregon 200,892 $3,485,434 24,687 $351,158 479,763 $2,279,296 136,003 $1,435,035 32 $755 841,378 $7,551,677
Pennsylvania 123,655 $3,545,106 10,062 $129,571 --b --b 31,953 $290,036 431 $9,504 166,101 $3,974,217
Puerto Rico 566 $16,907 134 $2,159 --b --b --b --b --b --b 700 $19,066
Rhode Island 143 $5,245 180 $4,040 --b --b 3,402 $37,026 --b --b 3,725 $46,311
South Carolina 97,329 $2,068,299 12,802 $189,673 --b --b 154,287 $1,130,170 1,288 $34,999 265,706 $3,423,141
South Dakota 461,904 $10,471,617 44,582 $667,416 786,960 $3,715,702 331 $2,988 613 $15,979 1,294,391 $14,873,702
Tennessee 53,758 $1,378,019 20,489 $314,486 --b --b 62,489 $376,046 2,431 $59,256 139,168 $2,127,807
Texas 337,338 $6,976,004 133,986 $2,038,259 1,482,052 $5,526,693 79,675 $533,134 4,815 $111,681 2,037,864 $15,185,771
Utah 41,916 $730,693 6,220 $101,552 253,015 $905,556 --b --b 36 $781 301,187 $1,738,582
Vermont 900 $20,361 319 $7,642 --b --b 1,285 $5,548 58 $1,920 2,562 $35,471
Virginia 69,031 $2,352,772 17,559 $401,840 --b --b 60,184 $557,356 69 $1,073 146,844 $3,313,041
Washington 287,842 $5,110,190 3,913 $55,386 143,512 $688,783 12,651 $145,857 409 $8,126 448,327 $6,008,341
West Virginia 9,818 $291,445 15,089 $261,918 --b --b 48,172 $215,070 367 $11,979 73,445 $780,412
Wisconsin 303,622 $6,212,060 14,745 $206,181 --b --b 39,547 $190,099 2,076 $41,855 359,990 $6,650,195
Wyoming 90,963 $1,435,521 33,229 $383,330 786,950 $2,749,703 2,201 $22,208 --b --b 913,343 $4,590,762
Grand Total 10,631,627 $234,935,177 1,397,694 $21,433,327 10,903,136 $45,337,014 2,100,719 $15,598,509 131,152 $3,095,863 25,164,327 $320,399,890.00
aEstimate. Obligations are reported by contract. Points earned for existing activities and additional activities by land use were used to divide a contract’s obligation among land
uses. bNot applicable.

CStP FY2010_Appendix_Modified_Final_2-14-2012.docx
116
Table A 16. CSP Contracts, Acres, and Obligations by State and Type of Conservation Activity, FY 2010
Obligationsa
State Contracts Acres Existing Activities Additional Activities All Activities
Alabama 498 348,905 $2,094,816 $1,992,500 $4,087,316
Alaska 16 182,565 $1,017,772 $311,793 $1,329,565
Arizona 74 821,643 $2,186,560 $1,816,777 $4,003,337
Arkansas 656 569,519 $5,546,928 $5,641,029 $11,187,957
California 452 721,128 $2,722,441 $3,252,762 $5,975,203
Colorado 702 1,264,376 $5,562,522 $6,183,606 $11,746,128
Connecticut 14 8,467 $30,943 $21,964 $52,907
Delaware 27 14,448 $235,161 $114,743 $349,904
Florida 131 65,279 $442,251 $773,875 $1,216,126
Georgia 678 354,906 $2,729,755 $7,515,844 $10,245,599
Hawaii 20 7,098 $63,333 $42,540 $105,873
Idaho 313 351,087 $2,152,779 $1,990,260 $4,143,039
Illinois 614 402,697 $4,922,099 $3,774,625 $8,696,724
Indiana 345 211,565 $2,893,219 $2,319,576 $5,212,795
Iowa 1,943 797,605 $10,863,216 $9,392,358 $20,255,574
Kansas 1,343 1,216,415 $9,644,462 $8,356,148 $18,000,610
Kentucky 257 62,111 $512,419 $416,106 $928,525
Louisiana 352 264,940 $2,161,074 $3,393,655 $5,554,729
Maine 116 70,381 $329,380 $199,014 $528,394
Maryland 86 24,249 $350,122 $391,792 $741,914
Massachusetts 15 7,324 $30,726 $27,409 $58,135
Michigan 579 229,963 $2,528,879 $2,149,452 $4,678,331
Minnesota 1,948 915,761 $10,122,739 $11,254,581 $21,377,320
Mississippi 359 352,265 $2,777,875 $6,202,199 $8,980,074
Missouri 2,589 976,001 $8,649,111 $7,908,358 $16,557,469
Montana 991 1,810,055 $7,256,049 $7,810,487 $15,066,536
Nebraska 1,687 1,836,928 $9,405,303 $10,747,230 $20,152,534
Nevada 35 23,829 $189,553 $110,571 $300,124
New Hampshire 24 3,430 $40,539 $6,111 $46,650
New Jersey 11 2,468 $29,348 $41,877 $71,225
New Mexico 189 1,478,740 $2,265,204 $3,147,548 $5,412,752
New York 411 159,602 $2,109,387 $1,178,245 $3,287,632
North Carolina 218 67,414 $630,475 $423,615 $1,054,090
North Dakota 1,109 1,280,729 $9,253,563 $10,233,158 $19,486,721
Ohio 394 127,833 $1,719,621 $1,294,062 $3,013,683
Oklahoma 2,076 1,137,871 $8,294,494 $7,881,405 $16,175,899
Oregon 520 841,378 $3,150,818 $4,400,859 $7,551,677
Pennsylvania 808 166,101 $2,305,868 $1,668,349 $3,974,217
Puerto Rico 11 700 $13,182 $5,884 $19,066
Rhode Island 23 3,725 $18,488 $27,823 $46,311
South Carolina 489 265,706 $1,996,316 $1,426,825 $3,423,141
South Dakota 839 1,294,391 $7,085,568 $7,788,134 $14,873,702
Tennessee 549 139,168 $1,099,139 $1,028,668 $2,127,807
Texas 1,433 2,037,864 $8,321,991 $6,863,780 $15,185,771
Utah 158 301,187 $813,874 $924,708 $1,738,582
Vermont 11 2,562 $20,122 $15,349 $35,471
Virginia 352 146,844 $1,313,730 $1,999,311 $3,313,041
Washington 279 448,327 $2,397,078 $3,611,263 $6,008,341
West Virginia 386 73,445 $448,818 $331,594 $780,412
Wisconsin 1,260 359,990 $4,528,211 $2,121,984 $6,650,195
Wyoming 361 913,343 $2,419,636 $2,171,126 $4,590,762
Grand Total 28,751 25,164,327 $157,696,956 $162,702,934 $320,399,890 aEstimate. Obligations are reported by contract. Points earned for existing activities and additional activities by land use were used to divide a contract’s obligation among
land uses.

CStP FY2010_Appendix_Modified_Final_2-14-2012.docx
117
Table A 17. CSP Contracts, Acres, and Obligations by Obligation Category and by State, FY 2010
State/Categorya
CSP-2010-1 CSP-2010-2 FY 2010
Contracts Acres Obligations Contracts Acres Obligations Contracts Acres Obligations
Alabama 308 215,713 $1,980,304 123 133,193 $2,107,012 431 348,905 $4,087,316
<40k 300 180,791 $1,660,304 98 45,792 $928,147 398 226,583 $2,588,451
40k 8 34,922 $320,000 19 67,301 $760,000 27 102,222 $1,080,000
>40k,<80k --b --b --b 2 3,315 $98,865 2 3,315 $98,865
80k --b --b --b 4 16,785 $320,000 4 16,785 $320,000
Alaska 11 174,416 $1,200,113 3 8,150 $129,452 14 182,565 $1,329,565
<40k 6 2,831 $46,582 2 1,935 $30,259 8 4,766 $76,841
40k 1 946 $40,000 --b --b --b 1 946 $40,000
>80k 4 170,639 $1,113,531 1 6,215 $99,193 5 176,853 $1,212,724
Arizona 39 459,967 $2,085,150 17 361,676 $1,918,187 56 821,643 $4,003,337
<40k 25 43,001 $396,183 7 21,414 $155,554 32 64,415 $551,737
40k 12 114,796 $480,000 4 29,328 $160,000 16 144,124 $640,000
>40k,<80k --b --b --b 2 2,476 $106,704 2 2,476 $106,704
80k --b --b --b 1 3,065 $80,000 1 3,065 $80,000
>80k 2 302,170 $1,208,967 3 305,393 $1,415,929 5 607,563 $2,624,896
Arkansas 289 256,173 $4,454,954 331 313,346 $6,733,003 620 569,519 $11,187,957
<40k 246 142,569 $2,734,954 265 129,975 $2,726,280 511 272,545 $5,461,234
40k 43 113,604 $1,720,000 18 35,433 $720,000 61 149,037 $2,440,000
>40k,<80k --b --b --b 25 52,092 $1,446,723 25 52,092 $1,446,723
80k --b --b --b 23 95,846 $1,840,000 23 95,846 $1,840,000
California 198 338,031 $3,248,251 139 383,098 $2,726,952 337 721,128 $5,975,203
<40k 168 163,818 $2,048,251 104 72,072 $1,031,926 272 235,890 $3,080,177
40k 30 174,213 $1,200,000 24 191,483 $960,000 54 365,696 $2,160,000
>40k,<80k --b --b --b 7 22,262 $391,493 7 22,262 $391,493
80k --b --b --b 3 93,264 $240,000 3 93,264 $240,000
>80k --b --b --b 1 4,016 $103,533 1 4,016 $103,533
Colorado 248 658,257 $5,621,967 221 606,119 $6,124,161 469 1,264,376 $11,746,128
<40k 167 190,626 $2,381,967 132 179,995 $2,312,538 299 370,621 $4,694,505
40k 81 467,631 $3,240,000 80 394,808 $3,200,000 161 862,439 $6,440,000
>40k,<80k --b --b --b 5 14,247 $291,623 5 14,247 $291,623
80k --b --b --b 4 17,068 $320,000 4 17,068 $320,000
Connecticut 8 1,953 $26,954 5 6,514 $25,953 13 8,467 $52,907
<40k 8 1,953 $26,954 5 6,514 $25,953 13 8,467 $52,907
Delaware 15 7,971 $231,980 10 6,478 $117,924 25 14,448 $349,904
<40k 14 6,926 $191,980 9 4,062 $77,924 23 10,987 $269,904
40k 1 1,045 $40,000 1 2,416 $40,000 2 3,461 $80,000
Florida 46 23,726 $393,098 49 41,552 $823,028 95 65,279 $1,216,126
<40k 42 10,231 $233,098 43 23,411 $583,028 85 33,642 $816,126
40k 4 13,495 $160,000 6 18,141 $240,000 10 31,637 $400,000
Georgia 166 90,850 $2,019,639 418 264,056 $8,225,960 584 354,906 $10,245,599
<40k 151 67,328 $1,419,639 323 144,601 $3,842,549 474 211,929 $5,262,188
40k 15 23,522 $600,000 76 89,749 $3,040,000 91 113,271 $3,640,000
>40k,<80k --b --b --b 8 6,350 $463,411 8 6,350 $463,411
80k --b --b --b 11 23,356 $880,000 11 23,356 $880,000
Hawaii 5 5,503 $66,783 11 1,594 $39,090 16 7,098 $105,873
<40k 4 940 $26,783 11 1,594 $39,090 15 2,535 $65,873
40k 1 4,563 $40,000 --b --b --b 1 4,563 $40,000
Idaho 92 97,751 $1,655,466 110 253,335 $2,487,573 202 351,087 $4,143,039
<40k 79 69,065 $1,135,466 90 102,203 $1,383,181 169 171,268 $2,518,647
40k 13 28,686 $520,000 16 80,306 $640,000 29 108,993 $1,160,000
>40k,<80k --b --b --b 1 3,204 $70,898 1 3,204 $70,898
80k --b --b --b 2 14,508 $160,000 2 14,508 $160,000
>80k --b --b --b 1 53,114 $233,494 1 53,114 $233,494
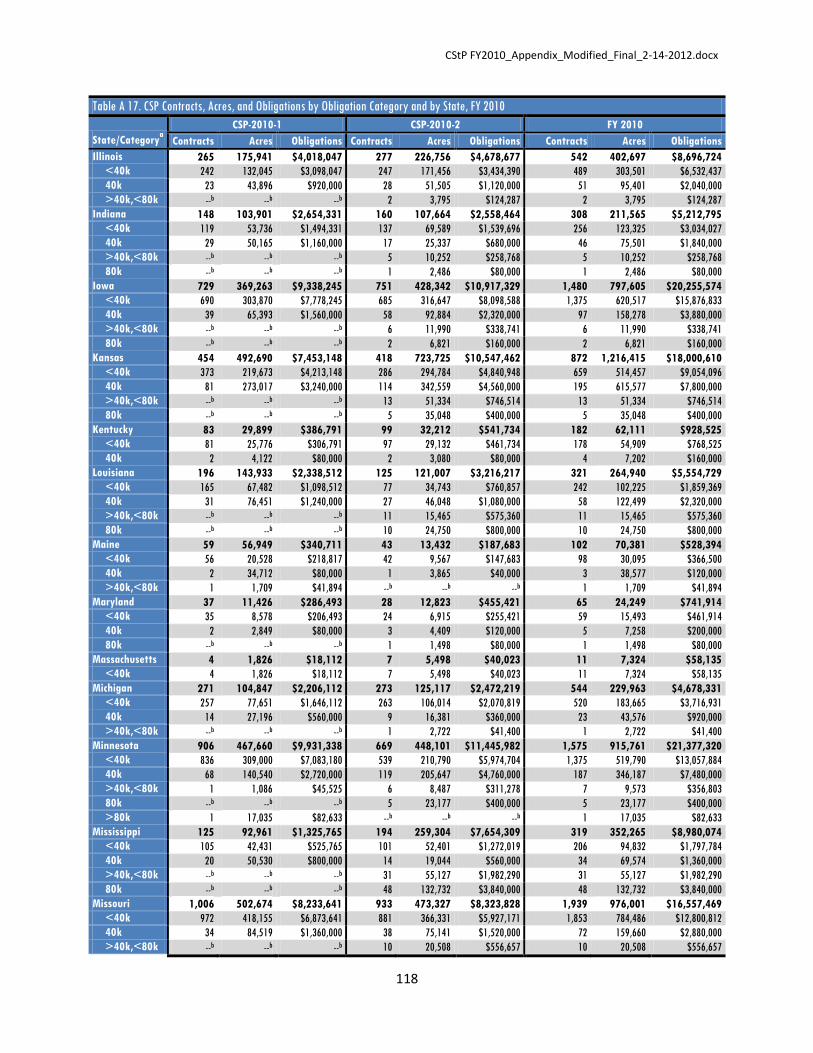
CStP FY2010_Appendix_Modified_Final_2-14-2012.docx
118
Table A 17. CSP Contracts, Acres, and Obligations by Obligation Category and by State, FY 2010
State/Categorya
CSP-2010-1 CSP-2010-2 FY 2010
Contracts Acres Obligations Contracts Acres Obligations Contracts Acres Obligations
Illinois 265 175,941 $4,018,047 277 226,756 $4,678,677 542 402,697 $8,696,724
<40k 242 132,045 $3,098,047 247 171,456 $3,434,390 489 303,501 $6,532,437
40k 23 43,896 $920,000 28 51,505 $1,120,000 51 95,401 $2,040,000
>40k,<80k --b --b --b 2 3,795 $124,287 2 3,795 $124,287
Indiana 148 103,901 $2,654,331 160 107,664 $2,558,464 308 211,565 $5,212,795
<40k 119 53,736 $1,494,331 137 69,589 $1,539,696 256 123,325 $3,034,027
40k 29 50,165 $1,160,000 17 25,337 $680,000 46 75,501 $1,840,000
>40k,<80k --b --b --b 5 10,252 $258,768 5 10,252 $258,768
80k --b --b --b 1 2,486 $80,000 1 2,486 $80,000
Iowa 729 369,263 $9,338,245 751 428,342 $10,917,329 1,480 797,605 $20,255,574
<40k 690 303,870 $7,778,245 685 316,647 $8,098,588 1,375 620,517 $15,876,833
40k 39 65,393 $1,560,000 58 92,884 $2,320,000 97 158,278 $3,880,000
>40k,<80k --b --b --b 6 11,990 $338,741 6 11,990 $338,741
80k --b --b --b 2 6,821 $160,000 2 6,821 $160,000
Kansas 454 492,690 $7,453,148 418 723,725 $10,547,462 872 1,216,415 $18,000,610
<40k 373 219,673 $4,213,148 286 294,784 $4,840,948 659 514,457 $9,054,096
40k 81 273,017 $3,240,000 114 342,559 $4,560,000 195 615,577 $7,800,000
>40k,<80k --b --b --b 13 51,334 $746,514 13 51,334 $746,514
80k --b --b --b 5 35,048 $400,000 5 35,048 $400,000
Kentucky 83 29,899 $386,791 99 32,212 $541,734 182 62,111 $928,525
<40k 81 25,776 $306,791 97 29,132 $461,734 178 54,909 $768,525
40k 2 4,122 $80,000 2 3,080 $80,000 4 7,202 $160,000
Louisiana 196 143,933 $2,338,512 125 121,007 $3,216,217 321 264,940 $5,554,729
<40k 165 67,482 $1,098,512 77 34,743 $760,857 242 102,225 $1,859,369
40k 31 76,451 $1,240,000 27 46,048 $1,080,000 58 122,499 $2,320,000
>40k,<80k --b --b --b 11 15,465 $575,360 11 15,465 $575,360
80k --b --b --b 10 24,750 $800,000 10 24,750 $800,000
Maine 59 56,949 $340,711 43 13,432 $187,683 102 70,381 $528,394
<40k 56 20,528 $218,817 42 9,567 $147,683 98 30,095 $366,500
40k 2 34,712 $80,000 1 3,865 $40,000 3 38,577 $120,000
>40k,<80k 1 1,709 $41,894 --b --b --b 1 1,709 $41,894
Maryland 37 11,426 $286,493 28 12,823 $455,421 65 24,249 $741,914
<40k 35 8,578 $206,493 24 6,915 $255,421 59 15,493 $461,914
40k 2 2,849 $80,000 3 4,409 $120,000 5 7,258 $200,000
80k --b --b --b 1 1,498 $80,000 1 1,498 $80,000
Massachusetts 4 1,826 $18,112 7 5,498 $40,023 11 7,324 $58,135
<40k 4 1,826 $18,112 7 5,498 $40,023 11 7,324 $58,135
Michigan 271 104,847 $2,206,112 273 125,117 $2,472,219 544 229,963 $4,678,331
<40k 257 77,651 $1,646,112 263 106,014 $2,070,819 520 183,665 $3,716,931
40k 14 27,196 $560,000 9 16,381 $360,000 23 43,576 $920,000
>40k,<80k --b --b --b 1 2,722 $41,400 1 2,722 $41,400
Minnesota 906 467,660 $9,931,338 669 448,101 $11,445,982 1,575 915,761 $21,377,320
<40k 836 309,000 $7,083,180 539 210,790 $5,974,704 1,375 519,790 $13,057,884
40k 68 140,540 $2,720,000 119 205,647 $4,760,000 187 346,187 $7,480,000
>40k,<80k 1 1,086 $45,525 6 8,487 $311,278 7 9,573 $356,803
80k --b --b --b 5 23,177 $400,000 5 23,177 $400,000
>80k 1 17,035 $82,633 --b --b --b 1 17,035 $82,633
Mississippi 125 92,961 $1,325,765 194 259,304 $7,654,309 319 352,265 $8,980,074
<40k 105 42,431 $525,765 101 52,401 $1,272,019 206 94,832 $1,797,784
40k 20 50,530 $800,000 14 19,044 $560,000 34 69,574 $1,360,000
>40k,<80k --b --b --b 31 55,127 $1,982,290 31 55,127 $1,982,290
80k --b --b --b 48 132,732 $3,840,000 48 132,732 $3,840,000
Missouri 1,006 502,674 $8,233,641 933 473,327 $8,323,828 1,939 976,001 $16,557,469
<40k 972 418,155 $6,873,641 881 366,331 $5,927,171 1,853 784,486 $12,800,812
40k 34 84,519 $1,360,000 38 75,141 $1,520,000 72 159,660 $2,880,000
>40k,<80k --b --b --b 10 20,508 $556,657 10 20,508 $556,657

CStP FY2010_Appendix_Modified_Final_2-14-2012.docx
119
Table A 17. CSP Contracts, Acres, and Obligations by Obligation Category and by State, FY 2010
State/Categorya
CSP-2010-1 CSP-2010-2 FY 2010
Contracts Acres Obligations Contracts Acres Obligations Contracts Acres Obligations
80k --b --b --b 4 11,347 $320,000 4 11,347 $320,000
Montana 222 926,476 $6,743,828 264 883,579 $8,322,708 486 1,810,055 $15,066,536
<40k 90 141,248 $1,463,828 123 193,364 $2,320,532 213 334,612 $3,784,360
40k 132 785,228 $5,280,000 128 629,041 $5,120,000 260 1,414,269 $10,400,000
>40k,<80k --b --b --b 7 24,477 $402,176 7 24,477 $402,176
80k --b --b --b 6 36,697 $480,000 6 36,697 $480,000
Nebraska 571 783,914 $8,900,070 535 1,053,015 $11,252,464 1,106 1,836,928 $20,152,534
<40k 480 334,321 $5,260,070 414 416,141 $6,051,268 894 750,461 $11,311,338
40k 91 449,593 $3,640,000 109 590,592 $4,360,000 200 1,040,185 $8,000,000
>40k,<80k --b --b --b 4 6,416 $201,196 4 6,416 $201,196
80k --b --b --b 8 39,866 $640,000 8 39,866 $640,000
Nevada 4 12,918 $145,109 13 10,911 $155,015 17 23,829 $300,124
<40k 1 1,038 $25,109 12 7,562 $115,015 13 8,600 $140,124
40k 3 11,880 $120,000 1 3,349 $40,000 4 15,229 $160,000
New Hampshire 12 2,304 $35,780 5 1,126 $10,870 17 3,430 $46,650
<40k 12 2,304 $35,780 5 1,126 $10,870 17 3,430 $46,650
New Jersey --b --b --b 9 2,468 $71,225 9 2,468 $71,225
<40k --b --b --b 9 2,468 $71,225 9 2,468 $71,225
New Mexico 111 936,871 $3,160,535 61 541,869 $2,252,217 172 1,478,740 $5,412,752
<40k 57 114,729 $876,053 18 20,385 $241,638 75 135,115 $1,117,691
40k 53 791,861 $2,120,000 38 449,857 $1,520,000 91 1,241,718 $3,640,000
>40k,<80k --b --b --b 1 2,384 $63,214 1 2,384 $63,214
80k --b --b --b 2 39,278 $160,000 2 39,278 $160,000
>80k 1 30,281 $164,482 2 29,965 $267,365 3 60,246 $431,847
New York 154 77,201 $1,642,775 167 82,401 $1,644,857 321 159,602 $3,287,632
<40k 139 50,241 $1,042,775 154 54,321 $1,020,913 293 104,561 $2,063,688
40k 15 26,960 $600,000 9 16,415 $360,000 24 43,374 $960,000
>40k,<80k --b --b --b 3 7,659 $183,944 3 7,659 $183,944
80k --b --b --b 1 4,007 $80,000 1 4,007 $80,000
North Carolina 64 27,406 $440,251 103 40,008 $613,839 167 67,414 $1,054,090
<40k 61 20,812 $320,251 101 37,463 $533,839 162 58,275 $854,090
40k 3 6,594 $120,000 2 2,545 $80,000 5 9,139 $200,000
North Dakota 301 616,913 $9,134,784 326 663,817 $10,351,937 627 1,280,729 $19,486,721
<40k 162 180,879 $3,574,784 151 144,251 $3,086,209 313 325,130 $6,660,993
40k 139 436,034 $5,560,000 167 429,112 $6,680,000 306 865,146 $12,240,000
>40k,<80k --b --b --b 3 4,810 $185,728 3 4,810 $185,728
80k --b --b --b 5 85,644 $400,000 5 85,644 $400,000
Ohio 234 83,881 $1,968,151 90 43,951 $1,045,532 324 127,833 $3,013,683
<40k 220 59,878 $1,408,151 80 26,488 $594,745 300 86,366 $2,002,896
40k 14 24,004 $560,000 7 11,382 $280,000 21 35,385 $840,000
>40k,<80k --b --b --b 2 3,948 $90,787 2 3,948 $90,787
80k --b --b --b 1 2,134 $80,000 1 2,134 $80,000
Oklahoma 462 546,971 $7,531,213 456 590,901 $8,644,686 918 1,137,871 $16,175,899
<40k 387 268,313 $4,531,213 369 283,236 $4,900,927 756 551,549 $9,432,140
40k 75 278,657 $3,000,000 79 266,474 $3,160,000 154 545,131 $6,160,000
>40k,<80k --b --b --b 3 8,919 $183,759 3 8,919 $183,759
80k --b --b --b 5 32,272 $400,000 5 32,272 $400,000
Oregon 201 350,626 $2,941,938 171 490,752 $4,609,739 372 841,378 $7,551,677
<40k 167 140,886 $1,550,469 112 143,163 $1,415,279 279 284,049 $2,965,748
40k 32 203,600 $1,280,000 46 269,955 $1,840,000 78 473,555 $3,120,000
>40k,<80k 2 6,140 $111,469 4 21,211 $260,806 6 27,351 $372,275
80k --b --b --b 8 37,880 $640,000 8 37,880 $640,000
>80k --b --b --b 1 18,543 $453,654 1 18,543 $453,654
Pennsylvania 265 69,237 $1,662,495 300 96,864 $2,311,722 565 166,101 $3,974,217
<40k 257 58,679 $1,342,495 292 81,429 $1,954,333 549 140,109 $3,296,828
40k 8 10,558 $320,000 6 11,599 $240,000 14 22,156 $560,000

CStP FY2010_Appendix_Modified_Final_2-14-2012.docx
120
Table A 17. CSP Contracts, Acres, and Obligations by Obligation Category and by State, FY 2010
State/Categorya
CSP-2010-1 CSP-2010-2 FY 2010
Contracts Acres Obligations Contracts Acres Obligations Contracts Acres Obligations
>40k,<80k --b --b --b 2 3,836 $117,389 2 3,836 $117,389
Puerto Rico 11 700 $19,066 --b --b --b 11 700 $19,066
<40k 11 700 $19,066 --b --b --b 11 700 $19,066
Rhode Island 3 1,139 $11,282 18 2,586 $35,029 21 3,725 $46,311
<40k 3 1,139 $11,282 18 2,586 $35,029 21 3,725 $46,311
South Carolina 267 170,085 $1,953,328 176 95,621 $1,469,813 443 265,706 $3,423,141
<40k 255 125,479 $1,473,328 171 83,848 $1,180,980 426 209,327 $2,654,308
40k 12 44,606 $480,000 --b --b --b 12 44,606 $480,000
>40k,<80k --b --b --b 4 8,273 $208,833 4 8,273 $208,833
80k --b --b --b 1 3,500 $80,000 1 3,500 $80,000
South Dakota 261 688,366 $7,138,773 244 606,024 $7,734,929 505 1,294,391 $14,873,702
<40k 144 161,247 $2,458,773 119 162,737 $2,305,610 263 323,983 $4,764,383
40k 117 527,119 $4,680,000 111 387,442 $4,440,000 228 914,562 $9,120,000
>40k,<80k --b --b --b 5 9,056 $269,319 5 9,056 $269,319
80k --b --b --b 9 46,789 $720,000 9 46,789 $720,000
Tennessee 175 48,545 $658,676 241 90,623 $1,469,131 416 139,168 $2,127,807
<40k 172 43,668 $538,676 227 64,582 $803,182 399 108,250 $1,341,858
40k 3 4,877 $120,000 9 17,778 $360,000 12 22,655 $480,000
>40k,<80k --b --b --b 3 3,573 $145,949 3 3,573 $145,949
80k --b --b --b 2 4,690 $160,000 2 4,690 $160,000
Texas 694 1,338,176 $9,754,896 295 699,688 $5,430,875 989 2,037,864 $15,185,771
<40k 587 526,512 $5,474,896 238 227,462 $2,692,948 825 753,974 $8,167,844
40k 107 811,664 $4,280,000 39 359,997 $1,560,000 146 1,171,661 $5,840,000
>40k,<80k --b --b --b 11 40,817 $617,927 11 40,817 $617,927
80k --b --b --b 7 71,412 $560,000 7 71,412 $560,000
Utah 17 87,510 $450,912 61 213,677 $1,287,670 78 301,187 $1,738,582
<40k 12 28,116 $250,912 44 64,664 $575,449 56 92,780 $826,361
40k 5 59,394 $200,000 16 145,548 $640,000 21 204,941 $840,000
>40k,<80k --b --b --b 1 3,466 $72,221 1 3,466 $72,221
Vermont 2 280 $6,745 5 2,282 $28,726 7 2,562 $35,471
<40k 2 280 $6,745 5 2,282 $28,726 7 2,562 $35,471
Virginia 118 53,770 $1,075,368 152 93,074 $2,237,673 270 146,844 $3,313,041
<40k 109 36,007 $715,368 134 61,807 $1,464,159 243 97,813 $2,179,527
40k 9 17,763 $360,000 16 25,474 $640,000 25 43,237 $1,000,000
>40k,<80k --b --b --b 1 1,693 $53,514 1 1,693 $53,514
80k --b --b --b 1 4,101 $80,000 1 4,101 $80,000
Washington 88 186,405 $2,229,319 118 261,922 $3,779,022 206 448,327 $6,008,341
<40k 54 64,300 $869,319 59 49,515 $972,288 113 113,815 $1,841,607
40k 34 122,104 $1,360,000 46 157,974 $1,840,000 80 280,078 $3,200,000
>40k,<80k --b --b --b 6 18,576 $406,734 6 18,576 $406,734
80k --b --b --b 7 35,858 $560,000 7 35,858 $560,000
West Virginia 76 18,517 $243,310 177 54,928 $537,102 253 73,445 $780,412
<40k 76 18,517 $243,310 177 54,928 $537,102 253 73,445 $780,412
Wisconsin 516 171,981 $3,355,623 452 188,009 $3,294,572 968 359,990 $6,650,195
<40k 509 157,627 $3,075,623 440 160,924 $2,732,549 949 318,551 $5,808,172
40k 7 14,353 $280,000 8 16,807 $320,000 15 31,160 $600,000
>40k,<80k --b --b --b 3 7,293 $162,023 3 7,293 $162,023
80k --b --b --b 1 2,985 $80,000 1 2,985 $80,000
Wyoming 75 522,209 $2,062,062 102 391,134 $2,528,700 177 913,343 $4,590,762
<40k 42 86,929 $742,062 73 154,671 $1,328,700 115 241,600 $2,070,762
40k 33 435,280 $1,320,000 28 226,140 $1,120,000 61 661,420 $2,440,000
80k --b --b --b 1 10,323 $80,000 1 10,323 $80,000
Grand Total 10,612 12,606,679 $144,782,194 9,955 12,557,648 $175,617,696 20,567 25,164,327 $320,399,890
aThe 40k and 80k categories include contracts that exceeded the caps and earn either $40,000 or $80,000 annually. bNot applicable.

CStP FY2010_Appendix_Modified_Final_2-14-2012.docx
121
Table A 18. CSP Total Enhancements and Practices by Ranking Period and by State, FY 2010
State
CSP-2010-1 CSP-2010-2a FY 2010
a
Enhancements Practices Total Enhancements Practices Total Grand Total
Alabama 593 123 716 307 53 360 1,076
Alaska 55 9 64 6 6 12 76
Arizona 207 10 217 60 2 62 279
Arkansas 746 43 789 1,106 14 1,120 1,909
California 1,292 78 1,370 656 38 694 2,064
Colorado 1,125 80 1,205 926 67 993 2,198
Connecticut 23 1 24 8 1 9 33
Delaware 26 2 28 25 --b 25 53
Florida 399 74 473 356 36 392 865
Georgia 857 224 1,081 2,479 516 2,995 4,076
Hawaii 22 --b 22 22 --b 22 44
Idaho 308 30 338 397 30 427 765
Illinois 701 22 723 740 10 750 1,473
Indiana 464 15 479 352 22 374 853
Iowa 2,201 19 2,220 2,664 34 2,698 4,918
Kansas 1,658 32 1,690 1,353 10 1,363 3,053
Kentucky 191 --b 191 231 --b 231 422
Louisiana 742 130 872 576 46 622 1,494
Maine 139 5 144 152 1 153 297
Maryland 130 7 137 113 3 116 253
Massachusetts 16 --b 16 26 --b 26 42
Michigan 681 146 827 670 97 767 1,594
Minnesota 2,795 78 2,873 3,054 36 3,090 5,963
Mississippi 259 33 292 682 4 686 978
Missouri 2,643 19 2,662 2,401 41 2,442 5,104
Montana 1,410 24 1,434 1,517 98 1,615 3,049
Nebraska 2,488 50 2,538 2,147 72 2,219 4,757
Nevada 27 --b 27 46 --b 46 73
New Hampshire 21 2 23 10 1 11 34
New Jersey --b --b --b 36 --b 36 36
New Mexico 464 13 477 206 4 210 687
New York 457 7 464 446 6 452 916
North Carolina 164 7 171 207 1 208 379
North Dakota 1,801 28 1,829 2,283 12 2,295 4,124
Ohio 675 44 719 250 10 260 979
Oklahoma 2,590 130 2,720 2,659 106 2,765 5,485
Oregon 880 54 934 746 57 803 1,737
Pennsylvania 744 12 756 882 8 890 1,646
Puerto Rico 36 --b 36 --b --b --b 36
Rhode Island 4 --b 4 35 --b 35 39
South Carolina 615 4 619 438 5 443 1,062
South Dakota 1,345 28 1,373 1,499 19 1,518 2,891
Tennessee 441 2 443 591 1 592 1,035
Texas 2,361 195 2,556 947 28 975 3,531
Utah 78 14 92 283 8 291 383
Vermont 11 --b 11 12 2 14 25
Virginia 650 100 750 783 86 869 1,619
Washington 326 21 347 542 41 583 930
West Virginia 207 8 215 572 19 591 806
Wisconsin 1,090 27 1,117 911 11 922 2,039
Wyoming 325 11 336 425 6 431 767
Grand Total 37,483 1,961 39,444 37,835 1,668 39,503 78,947 aEnhancement and practice data are not available for 27 contracts. Contracts are stored in county offices.
bNot applicable.

CStP FY2010_Appendix_Modified_Final_2-14-2012.docx
122
Table A 19. CSP Individual Enhancements and Practices by Ranking Period and by State, FY 2010
State/Conservation Activity CSP-2010-1 CSP-2010-2a Total
a
ALABAMA 716 360 1,076
314 - Brush Management 3 2 5
328 - Conservation Crop Rotation 1 --b 1
338 - Prescribed Burning 31 6 37
342 - Critical Area Planting 4 1 5
383 - Fuel Break --b 1 1
384 - Forest Slash Treatment 2 3 5
394 - Firebreak 42 8 50
395 - Stream Habitat Improvement and Management 1 2 3
511 - Forage Harvest Management --b 2 2
512 - Forage and Biomass Planting --b 1 1
528 - Prescribed Grazing 3 1 4
612 - Tree/Shrub Establishment 5 5 10
643 - Restoration and Management of Rare and Declining Habitats 3 1 4
644 - Wetland Wildlife Habitat Management 1 --b 1
645 - Upland Wildlife Habitat Management 11 7 18
647 - Early Successional Habitat Development/Management 3 2 5
654 - Road/Trail/Landing Closure and Treatment --b 1 1
655 - Forest Trails and Landings 1 2 3
660 - Tree/Shrub Pruning 1 2 3
666 - Forest Stand Improvement 10 6 16
722 - Road/Landing Removal 1 --b 1
AIR02 - Nitrogen Stabilizers for Air Emissions Control 5 --b 5
AIR03 - Replace burning of prunings and other crop residues with non-burning alternatives 1 --b 1
AIR04 - Use drift reducing nozzles, low pressures, lower boom height and adjuvants to reduce pesticide drift 19 36 55
AIR05 - Dust control on unpaved roads and surfaces 6 --b 6
AIR07 - GPS, targeted spray application (SmartSprayer), or other chemical application electronic control tech 10 18 28
ANM01 - Drainage water management for seasonal wildlife habitat --b 1 1
ANM03 - Incorporate native grasses and/or legumes into 15% or more of the forage base 7 8 15
ANM04 - Extend existing filter strips for water quality Protection and wildlife habitat 2 --b 2
ANM05 - Extending riparian forest buffers for water quality Protection and wildlife habitat 1 --b 1
ANM07 - Extending existing field borders for water quality Protection and wildlife habitat 1 3 4
ANM08 - Improve the plant diversity and structure of non-cropped areas for wildlife food and habitat 3 8 11
ANM09 - Grazing management to improve wildlife habitat --b 4 4
ANM10 - Harvest hay in a manner that allows wildlife to flush and escape 2 10 12
ANM11 - Patch-burning to enhance wildlife habitat 5 4 9
ANM12 - Shallow water habitat 4 1 5
ANM14 - Riparian forest buffer, terrestrial and aquatic wildlife habitat 22 5 27
ANM15 - Forest stand improvement for habitat and soil quality 20 8 28
ANM17 - Monitoring nutritional status of livestock using the NUTBAL PRO System --b 1 1
ANM18 - Retrofit watering facility for wildlife escape 18 13 31
ANM19 - Wildlife corridors 12 3 15
ANM20 - Silvopasture for wildlife habitat --b 1 1
ANM22 - Restoration and Management of Rare or Declining Habitats 5 5 10
ANM24 - Forest Wildlife Structures --b 7 7
ANM25 - Stockpiling Forages to Extend the Grazing Season --b 5 5
ANM26 - Managing Calving to Coincide with Forage Availability --b 4 4
BCR02 - Crop Technology Bundle #2 --b 1 1
BFO01 - SE Pine Forest Bundle #1 --b 20 20
BFO02 - Forest Bundle #2 --b 5 5
BPA01 - Pasture Grazing Bundle #1 --b 8 8
CCR99 - Resource-Conserving Crop Rotation 6 2 8
ENR02 - Solar powered electric fence charging systems 3 --b 3

CStP FY2010_Appendix_Modified_Final_2-14-2012.docx
123
Table A 19. CSP Individual Enhancements and Practices by Ranking Period and by State, FY 2010
State/Conservation Activity CSP-2010-1 CSP-2010-2a Total
a
ENR04 - Recycle 100% of farm lubricants 241 --b 241
ENR05 - Locally grown and marketed farm products 3 5 8
FPP02 - On Farm Pilot Projects --b 1 1
PLT01 - Establish pollinator habitat 8 4 12
PLT02 - Monitor key grazing areas to improve grazing management 9 5 14
PLT03 - Forest stand improvement pre-treating vegetation and fuels 4 5 9
PLT04 - Forest Stand Improvement, Prescribed burning 98 6 104
PLT06 - Renovation of a windbreak or shelter belt, or hedgerow for wildlife habitat 2 --b 2
PLT07 - Hardwood Crop Tree Release 8 2 10
PLT08 - Habitat Development for Beneficial Insects for Pest Management --b 1 1
PLT10 - Intensive Management of Rotational Grazing 4 1 5
PLT12 - Patch Harvesting --b 4 4
SOE01 - Continuous no till with high residue --b 2 2
SOE02 - Protection of cultural resources sites with conservation cover 3 1 4
SQL01 - Controlled traffic system 3 1 4
SQL02 - Continuous cover crops --b 2 2
SQL04 - Use of Cover Crop Mixes 9 1 10
SQL05 - Use deep rooted crops to breakup soil compaction 1 8 9
SQL07 - Forest Stand Improvement for Soil Quality --b 6 6
WQL02 - Biological suppression and other non-chemical techniques to manage herbaceous weeds invasive species 1 --b 1
WQL03 - Rotation of supplement and feeding areas 18 26 44
WQL04 - Plant Tissue Testing and Analysis to Improve Nitrogen Management 5 2 7
WQL05 - Apply nutrients no more than 30 days prior to planned planting date 4 --b 4
WQL06 - Apply controlled release nitrogen fertilizer 1 7 8
WQL07 - Split nitrogen applications 50% after crop/pasture emergence/green up 5 14 19
WQL10 - Plant an annual grass-type cover crop that will scavenge residual nitrogen 1 3 4
WQL11 - Precision application technology to apply nutrients --b 3 3
WQL13 - High level Integrated Pest Management to reduce pesticide environmental risk 7 7 14
WQL14 - Land application of only treated manure --b 1 1
WQL15 - Reduce the concentration of nutrients on livestock farms 2 --b 2
WQL16 - Use of legume cover crops as a nitrogen source 2 5 7
WQL17 - Use of non-chemical methods to kill cover crops --b 1 1
WQL18 - Non- Chemical Pest Control for Livestock 1 --b 1
WQL23 - Provide Livestock Protection Away from Sensitive Areas --b 1 1
WQT02 - Mulching for moisture conservation --b 1 1
WQT04 - Regional weather networks for irrigation scheduling 1 --b 1
ALASKA 64 12 76
314 - Brush Management 1 --b 1
383 - Fuel Break --b 1 1
384 - Forest Slash Treatment 1 1 2
394 - Firebreak 1 1 2
395 - Stream Habitat Improvement and Management 2 --b 2
511 - Forage Harvest Management --b 1 1
612 - Tree/Shrub Establishment 2 1 3
666 - Forest Stand Improvement 1 1 2
722 - Road/Landing Removal 1 --b 1
AIR04 - Use drift reducing nozzles, low pressures, lower boom height and adjuvants to reduce pesticide drift 4 --b 4
AIR05 - Dust control on unpaved roads and surfaces 5 --b 5
AIR07 - GPS, targeted spray application (SmartSprayer), or other chemical application electronic control tech 2 --b 2
ANM09 - Grazing management to improve wildlife habitat 1 --b 1
ANM10 - Harvest hay in a manner that allows wildlife to flush and escape 2 1 3
ANM12 - Shallow water habitat 1 --b 1
ANM14 - Riparian forest buffer, terrestrial and aquatic wildlife habitat --b 1 1

CStP FY2010_Appendix_Modified_Final_2-14-2012.docx
124
Table A 19. CSP Individual Enhancements and Practices by Ranking Period and by State, FY 2010
State/Conservation Activity CSP-2010-1 CSP-2010-2a Total
a
ANM15 - Forest stand improvement for habitat and soil quality 1 --b 1
ANM18 - Retrofit watering facility for wildlife escape 3 --b 3
ANM20 - Silvopasture for wildlife habitat 1 --b 1
ANM24 - Forest Wildlife Structures --b 1 1
CCR99 - Resource-Conserving Crop Rotation 2 --b 2
ENR03 - Pumping plant powered by renewable energy 1 --b 1
ENR04 - Recycle 100% of farm lubricants 3 --b 3
ENR05 - Locally grown and marketed farm products 5 1 6
PLT01 - Establish pollinator habitat 5 1 6
PLT02 - Monitor key grazing areas to improve grazing management 1 --b 1
PLT05 - Multi-story cropping, sustainable management of nontimber forest plants 2 --b 2
PLT12 - Patch Harvesting --b 1 1
SQL06 - Conversion of cropped land to grass-based agriculture 1 --b 1
WQL01 - Biological suppression and other non-chemical techniques to manage brush, weeds, invasive species 2 --b 2
WQL03 - Rotation of supplement and feeding areas 2 --b 2
WQL05 - Apply nutrients no more than 30 days prior to planned planting date 1 --b 1
WQL07 - Split nitrogen applications 50% after crop/pasture emergence/green up 1 --b 1
WQL11 - Precision application technology to apply nutrients 2 --b 2
WQL12 - Managing livestock access to water bodies/courses 1 --b 1
WQL13 - High level Integrated Pest Management to reduce pesticide environmental risk 6 --b 6
ARIZONA 217 62 279
344 - Residue Management, Seasonal 2 --b 2
390 - Riparian Herbaceous Cover 1 --b 1
449 - Irrigation Water Management 2 --b 2
528 - Prescribed Grazing 4 1 5
643 - Restoration and Management of Rare and Declining Habitats 1 --b 1
645 - Upland Wildlife Habitat Management --b 1 1
AIR01 - Injecting or incorporating manure 4 --b 4
AIR02 - Nitrogen Stabilizers for Air Emissions Control 1 --b 1
AIR03 - Replace burning of prunings and other crop residues with non-burning alternatives 2 1 3
AIR04 - Use drift reducing nozzles, low pressures, lower boom height and adjuvants to reduce pesticide drift 4 1 5
AIR07 - GPS, targeted spray application (SmartSprayer), or other chemical application electronic control tech --b 1 1
ANM01 - Drainage water management for seasonal wildlife habitat 2 --b 2
ANM07 - Extending existing field borders for water quality Protection and wildlife habitat 1 --b 1
ANM08 - Improve the plant diversity and structure of non-cropped areas for wildlife food and habitat 3 --b 3
ANM09 - Grazing management to improve wildlife habitat 7 5 12
ANM10 - Harvest hay in a manner that allows wildlife to flush and escape 1 --b 1
ANM12 - Shallow water habitat 3 --b 3
ANM16 - Harvesting crops using a stripper header 1 --b 1
ANM17 - Monitoring nutritional status of livestock using the NUTBAL PRO System 10 6 16
ANM18 - Retrofit watering facility for wildlife escape 24 9 33
ANM23 - Multi-species Native Perennials for Biomass/Wildlife Habitat 1 1 2
ANM26 - Managing Calving to Coincide with Forage Availability --b 4 4
BCR02 - Crop Technology Bundle #2 --b 1 1
BRA01 - Range Grazing Bundle #1 --b 3 3
CCR99 - Resource-Conserving Crop Rotation 3 --b 3
ENR01 - Fuel use reduction for field operations 3 --b 3
ENR02 - Solar powered electric fence charging systems 2 --b 2
ENR03 - Pumping plant powered by renewable energy 5 1 6
ENR04 - Recycle 100% of farm lubricants 29 --b 29
ENR05 - Locally grown and marketed farm products 4 --b 4
PLT01 - Establish pollinator habitat 1 2 3
PLT02 - Monitor key grazing areas to improve grazing management 22 5 27

CStP FY2010_Appendix_Modified_Final_2-14-2012.docx
125
Table A 19. CSP Individual Enhancements and Practices by Ranking Period and by State, FY 2010
State/Conservation Activity CSP-2010-1 CSP-2010-2a Total
a
PLT10 - Intensive Management of Rotational Grazing 2 1 3
SQL01 - Controlled traffic system 2 2 4
SQL02 - Continuous cover crops 1 2 3
SQL03 - Drainage water management for nutrient, pathogen, or pesticide reduction 3 --b 3
SQL04 - Use of Cover Crop Mixes 1 2 3
SQL05 - Use deep rooted crops to breakup soil compaction 1 --b 1
WQL01 - Biological suppression and other non-chemical techniques to manage brush, weeds, invasive species 2 --b 2
WQL02 - Biological suppression and other non-chemical techniques to manage herbaceous weeds invasive species 1 --b 1
WQL03 - Rotation of supplement and feeding areas 12 5 17
WQL04 - Plant Tissue Testing and Analysis to Improve Nitrogen Management 8 1 9
WQL05 - Apply nutrients no more than 30 days prior to planned planting date 10 --b 10
WQL06 - Apply controlled release nitrogen fertilizer 1 --b 1
WQL07 - Split nitrogen applications 50% after crop/pasture emergence/green up 3 --b 3
WQL08 - Apply split applications of nitrogen based on a pre-sidedress nitrogen test on cropland 3 --b 3
WQL09 - Apply phosphorus fertilizer below soil surface 3 --b 3
WQL10 - Plant an annual grass-type cover crop that will scavenge residual nitrogen 2 --b 2
WQL11 - Precision application technology to apply nutrients 1 --b 1
WQL12 - Managing livestock access to water bodies/courses 1 3 4
WQL13 - High level Integrated Pest Management to reduce pesticide environmental risk 5 3 8
WQL17 - Use of non-chemical methods to kill cover crops 2 --b 2
WQL18 - Non- Chemical Pest Control for Livestock 3 --b 3
WQT03 - Irrigation pumping plant evaluation 1 --b 1
WQT04 - Regional weather networks for irrigation scheduling 6 1 7
ARKANSAS 789 1,120 1,909
328 - Conservation Crop Rotation 4 2 6
329 - Residue and Tillage Management, No-Till/Strip Till/Direct Seed 3 --b 3
338 - Prescribed Burning 1 1 2
342 - Critical Area Planting 1 1 2
344 - Residue Management, Seasonal 4 2 6
384 - Forest Slash Treatment 1 --b 1
394 - Firebreak 6 1 7
449 - Irrigation Water Management 9 --b 9
511 - Forage Harvest Management 1 1 2
512 - Forage and Biomass Planting 2 1 3
528 - Prescribed Grazing 2 --b 2
612 - Tree/Shrub Establishment --b 2 2
644 - Wetland Wildlife Habitat Management 4 --b 4
645 - Upland Wildlife Habitat Management 2 --b 2
655 - Forest Trails and Landings 1 --b 1
660 - Tree/Shrub Pruning 1 --b 1
666 - Forest Stand Improvement 1 3 4
AIR01 - Injecting or incorporating manure 8 --b 8
AIR02 - Nitrogen Stabilizers for Air Emissions Control 31 --b 31
AIR03 - Replace burning of prunings and other crop residues with non-burning alternatives 2 7 9
AIR04 - Use drift reducing nozzles, low pressures, lower boom height and adjuvants to reduce pesticide drift 127 173 300
AIR05 - Dust control on unpaved roads and surfaces 6 --b 6
AIR06 - Replacing oil- and wood-fired heaters in orchards and vineyards --b 1 1
AIR07 - GPS, targeted spray application (SmartSprayer), or other chemical application electronic control tech 42 104 146
ANM01 - Drainage water management for seasonal wildlife habitat 22 48 70
ANM02 - Defer crop production on temporary and seasonal wetlands --b 9 9
ANM03 - Incorporate native grasses and/or legumes into 15% or more of the forage base 11 7 18
ANM04 - Extend existing filter strips for water quality Protection and wildlife habitat 4 10 14
ANM05 - Extending riparian forest buffers for water quality Protection and wildlife habitat 1 9 10

CStP FY2010_Appendix_Modified_Final_2-14-2012.docx
126
Table A 19. CSP Individual Enhancements and Practices by Ranking Period and by State, FY 2010
State/Conservation Activity CSP-2010-1 CSP-2010-2a Total
a
ANM06 - Extending existing riparian herbaceous cover for water quality Protection and wildlife habitat --b 5 5
ANM07 - Extending existing field borders for water quality Protection and wildlife habitat 2 8 10
ANM08 - Improve the plant diversity and structure of non-cropped areas for wildlife food and habitat 12 17 29
ANM09 - Grazing management to improve wildlife habitat 1 5 6
ANM10 - Harvest hay in a manner that allows wildlife to flush and escape 3 2 5
ANM11 - Patch-burning to enhance wildlife habitat 21 29 50
ANM12 - Shallow water habitat 1 8 9
ANM13 - Non-forested riparian zone enhancement for fish and wildlife 2 --b 2
ANM14 - Riparian forest buffer, terrestrial and aquatic wildlife habitat 2 6 8
ANM15 - Forest stand improvement for habitat and soil quality 12 14 26
ANM16 - Harvesting crops using a stripper header 7 --b 7
ANM17 - Monitoring nutritional status of livestock using the NUTBAL PRO System 2 --b 2
ANM18 - Retrofit watering facility for wildlife escape 5 15 20
ANM19 - Wildlife corridors 3 9 12
ANM20 - Silvopasture for wildlife habitat 2 2 4
ANM21 - Prairie Restoration for Grazing and Wildlife Habitat --b 1 1
ANM22 - Restoration and Management of Rare or Declining Habitats 1 1 2
ANM24 - Forest Wildlife Structures --b 29 29
ANM25 - Stockpiling Forages to Extend the Grazing Season --b 17 17
ANM26 - Managing Calving to Coincide with Forage Availability --b 27 27
BCR02 - Crop Technology Bundle #2 --b 5 5
BCR03 - Crop Technology Bundle #3 --b 2 2
BFO01 - SE Pine Forest Bundle #1 --b 1 1
BFO02 - Forest Bundle #2 --b 1 1
CCR99 - Resource-Conserving Crop Rotation 4 10 14
ENR01 - Fuel use reduction for field operations 18 --b 18
ENR02 - Solar powered electric fence charging systems 9 --b 9
ENR04 - Recycle 100% of farm lubricants 135 --b 135
ENR05 - Locally grown and marketed farm products 8 22 30
FPP02 - On Farm Pilot Projects --b 1 1
FRD01 - On Farm Research and Demonstrations 5 7 12
PLT01 - Establish pollinator habitat 4 14 18
PLT02 - Monitor key grazing areas to improve grazing management 10 7 17
PLT03 - Forest stand improvement pre-treating vegetation and fuels --b 3 3
PLT04 - Forest Stand Improvement, Prescribed burning 17 10 27
PLT06 - Renovation of a windbreak or shelter belt, or hedgerow for wildlife habitat --b 1 1
PLT07 - Hardwood Crop Tree Release 9 5 14
PLT10 - Intensive Management of Rotational Grazing 1 6 7
PLT11 - Conifer Crop Tree Release --b 1 1
PLT12 - Patch Harvesting --b 1 1
SOE01 - Continuous no till with high residue 2 19 21
SOE03 - Continuous No Till Organic System --b 1 1
SQL01 - Controlled traffic system 6 35 41
SQL02 - Continuous cover crops --b 8 8
SQL03 - Drainage water management for nutrient, pathogen, or pesticide reduction 5 20 25
SQL04 - Use of Cover Crop Mixes 3 2 5
SQL05 - Use deep rooted crops to breakup soil compaction 2 3 5
SQL06 - Conversion of cropped land to grass-based agriculture 1 --b 1
SQL07 - Forest Stand Improvement for Soil Quality --b 4 4
WQL01 - Biological suppression and other non-chemical techniques to manage brush, weeds, invasive species --b 16 16
WQL03 - Rotation of supplement and feeding areas 32 41 73
WQL04 - Plant Tissue Testing and Analysis to Improve Nitrogen Management 10 22 32
WQL05 - Apply nutrients no more than 30 days prior to planned planting date 21 --b 21

CStP FY2010_Appendix_Modified_Final_2-14-2012.docx
127
Table A 19. CSP Individual Enhancements and Practices by Ranking Period and by State, FY 2010
State/Conservation Activity CSP-2010-1 CSP-2010-2a Total
a
WQL06 - Apply controlled release nitrogen fertilizer 18 94 112
WQL07 - Split nitrogen applications 50% after crop/pasture emergence/green up 14 57 71
WQL08 - Apply split applications of nitrogen based on a pre-sidedress nitrogen test on cropland 6 6 12
WQL09 - Apply phosphorus fertilizer below soil surface 4 --b 4
WQL10 - Plant an annual grass-type cover crop that will scavenge residual nitrogen --b 1 1
WQL11 - Precision application technology to apply nutrients 17 34 51
WQL12 - Managing livestock access to water bodies/courses 4 4 8
WQL13 - High level Integrated Pest Management to reduce pesticide environmental risk 8 20 28
WQL14 - Land application of only treated manure 3 1 4
WQL15 - Reduce the concentration of nutrients on livestock farms 5 1 6
WQL16 - Use of legume cover crops as a nitrogen source 2 2 4
WQL17 - Use of non-chemical methods to kill cover crops --b 3 3
WQL18 - Non- Chemical Pest Control for Livestock --b 1 1
WQT01 - Irrigation system automation 1 1 2
WQT03 - Irrigation pumping plant evaluation 5 12 17
WQT04 - Regional weather networks for irrigation scheduling 21 30 51
WQT05 - Remote monitoring and notification of irrigation pumping plant operation 6 8 14
CALIFORNIA 1,370 694 2,064
314 - Brush Management 9 3 12
328 - Conservation Crop Rotation 2 2 4
329 - Residue and Tillage Management, No-Till/Strip Till/Direct Seed 1 2 3
338 - Prescribed Burning 1 --b 1
340 - Cover Crop 2 1 3
342 - Critical Area Planting 6 2 8
344 - Residue Management, Seasonal --b 1 1
345 - Residue and Tillage Management, Mulch Till 1 3 4
380 - Windbreak/Shelterbelt Establishment 3 --b 3
383 - Fuel Break --b 1 1
386 - Field Border 1 1 2
390 - Riparian Herbaceous Cover 3 1 4
394 - Firebreak 1 2 3
395 - Stream Habitat Improvement and Management 4 1 5
449 - Irrigation Water Management 13 2 15
511 - Forage Harvest Management 1 1 2
512 - Forage and Biomass Planting 1 --b 1
528 - Prescribed Grazing 15 5 20
550 - Range Planting 4 3 7
643 - Restoration and Management of Rare and Declining Habitats 1 2 3
644 - Wetland Wildlife Habitat Management 4 --b 4
645 - Upland Wildlife Habitat Management 4 3 7
647 - Early Successional Habitat Development/Management --b 2 2
655 - Forest Trails and Landings 1 --b 1
AIR01 - Injecting or incorporating manure 9 --b 9
AIR02 - Nitrogen Stabilizers for Air Emissions Control 2 --b 2
AIR03 - Replace burning of prunings and other crop residues with non-burning alternatives 27 18 45
AIR04 - Use drift reducing nozzles, low pressures, lower boom height and adjuvants to reduce pesticide drift 36 32 68
AIR05 - Dust control on unpaved roads and surfaces 20 --b 20
AIR06 - Replacing oil- and wood-fired heaters in orchards and vineyards 5 1 6
AIR07 - GPS, targeted spray application (SmartSprayer), or other chemical application electronic control tech 14 10 24
ANM01 - Drainage water management for seasonal wildlife habitat 9 13 22
ANM02 - Defer crop production on temporary and seasonal wetlands 2 --b 2
ANM03 - Incorporate native grasses and/or legumes into 15% or more of the forage base 8 1 9
ANM04 - Extend existing filter strips for water quality Protection and wildlife habitat 9 2 11
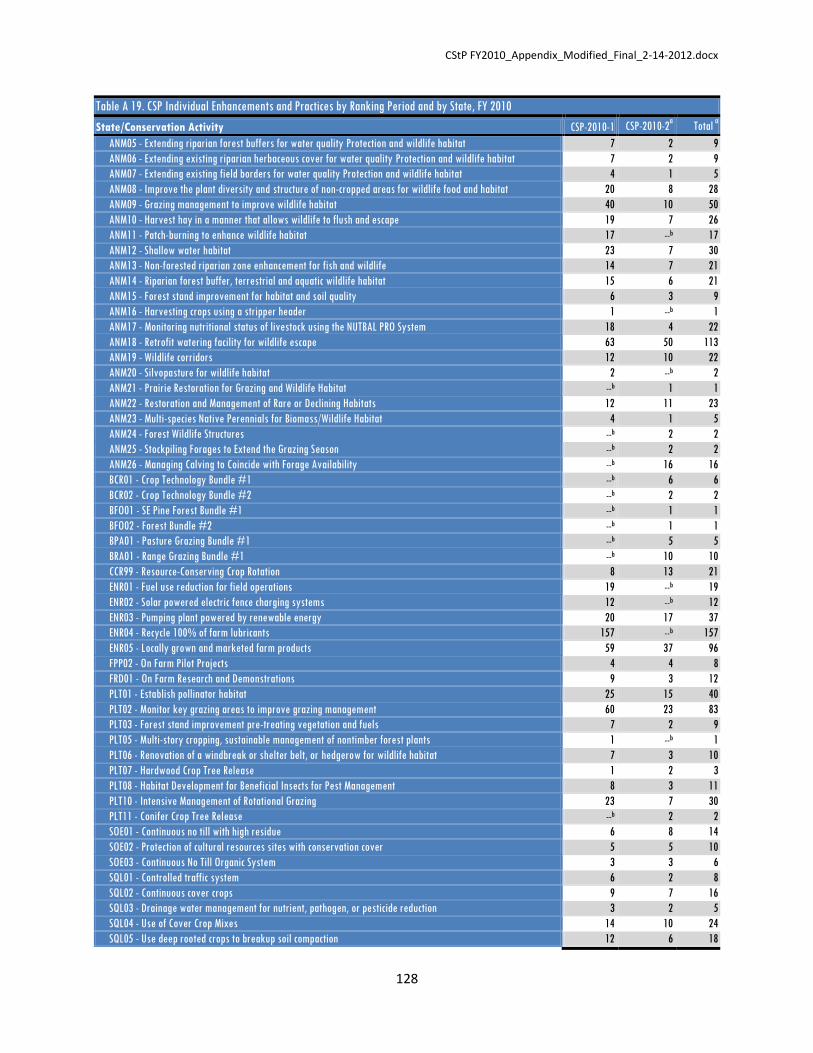
CStP FY2010_Appendix_Modified_Final_2-14-2012.docx
128
Table A 19. CSP Individual Enhancements and Practices by Ranking Period and by State, FY 2010
State/Conservation Activity CSP-2010-1 CSP-2010-2a Total
a
ANM05 - Extending riparian forest buffers for water quality Protection and wildlife habitat 7 2 9
ANM06 - Extending existing riparian herbaceous cover for water quality Protection and wildlife habitat 7 2 9
ANM07 - Extending existing field borders for water quality Protection and wildlife habitat 4 1 5
ANM08 - Improve the plant diversity and structure of non-cropped areas for wildlife food and habitat 20 8 28
ANM09 - Grazing management to improve wildlife habitat 40 10 50
ANM10 - Harvest hay in a manner that allows wildlife to flush and escape 19 7 26
ANM11 - Patch-burning to enhance wildlife habitat 17 --b 17
ANM12 - Shallow water habitat 23 7 30
ANM13 - Non-forested riparian zone enhancement for fish and wildlife 14 7 21
ANM14 - Riparian forest buffer, terrestrial and aquatic wildlife habitat 15 6 21
ANM15 - Forest stand improvement for habitat and soil quality 6 3 9
ANM16 - Harvesting crops using a stripper header 1 --b 1
ANM17 - Monitoring nutritional status of livestock using the NUTBAL PRO System 18 4 22
ANM18 - Retrofit watering facility for wildlife escape 63 50 113
ANM19 - Wildlife corridors 12 10 22
ANM20 - Silvopasture for wildlife habitat 2 --b 2
ANM21 - Prairie Restoration for Grazing and Wildlife Habitat --b 1 1
ANM22 - Restoration and Management of Rare or Declining Habitats 12 11 23
ANM23 - Multi-species Native Perennials for Biomass/Wildlife Habitat 4 1 5
ANM24 - Forest Wildlife Structures --b 2 2
ANM25 - Stockpiling Forages to Extend the Grazing Season --b 2 2
ANM26 - Managing Calving to Coincide with Forage Availability --b 16 16
BCR01 - Crop Technology Bundle #1 --b 6 6
BCR02 - Crop Technology Bundle #2 --b 2 2
BFO01 - SE Pine Forest Bundle #1 --b 1 1
BFO02 - Forest Bundle #2 --b 1 1
BPA01 - Pasture Grazing Bundle #1 --b 5 5
BRA01 - Range Grazing Bundle #1 --b 10 10
CCR99 - Resource-Conserving Crop Rotation 8 13 21
ENR01 - Fuel use reduction for field operations 19 --b 19
ENR02 - Solar powered electric fence charging systems 12 --b 12
ENR03 - Pumping plant powered by renewable energy 20 17 37
ENR04 - Recycle 100% of farm lubricants 157 --b 157
ENR05 - Locally grown and marketed farm products 59 37 96
FPP02 - On Farm Pilot Projects 4 4 8
FRD01 - On Farm Research and Demonstrations 9 3 12
PLT01 - Establish pollinator habitat 25 15 40
PLT02 - Monitor key grazing areas to improve grazing management 60 23 83
PLT03 - Forest stand improvement pre-treating vegetation and fuels 7 2 9
PLT05 - Multi-story cropping, sustainable management of nontimber forest plants 1 --b 1
PLT06 - Renovation of a windbreak or shelter belt, or hedgerow for wildlife habitat 7 3 10
PLT07 - Hardwood Crop Tree Release 1 2 3
PLT08 - Habitat Development for Beneficial Insects for Pest Management 8 3 11
PLT10 - Intensive Management of Rotational Grazing 23 7 30
PLT11 - Conifer Crop Tree Release --b 2 2
SOE01 - Continuous no till with high residue 6 8 14
SOE02 - Protection of cultural resources sites with conservation cover 5 5 10
SOE03 - Continuous No Till Organic System 3 3 6
SQL01 - Controlled traffic system 6 2 8
SQL02 - Continuous cover crops 9 7 16
SQL03 - Drainage water management for nutrient, pathogen, or pesticide reduction 3 2 5
SQL04 - Use of Cover Crop Mixes 14 10 24
SQL05 - Use deep rooted crops to breakup soil compaction 12 6 18

CStP FY2010_Appendix_Modified_Final_2-14-2012.docx
129
Table A 19. CSP Individual Enhancements and Practices by Ranking Period and by State, FY 2010
State/Conservation Activity CSP-2010-1 CSP-2010-2a Total
a
SQL06 - Conversion of cropped land to grass-based agriculture 1 --b 1
SQL07 - Forest Stand Improvement for Soil Quality --b 1 1
WQL01 - Biological suppression and other non-chemical techniques to manage brush, weeds, invasive species 21 17 38
WQL02 - Biological suppression and other non-chemical techniques to manage herbaceous weeds invasive species 29 --b 29
WQL03 - Rotation of supplement and feeding areas 63 34 97
WQL04 - Plant Tissue Testing and Analysis to Improve Nitrogen Management 29 40 69
WQL05 - Apply nutrients no more than 30 days prior to planned planting date 12 --b 12
WQL06 - Apply controlled release nitrogen fertilizer 4 5 9
WQL07 - Split nitrogen applications 50% after crop/pasture emergence/green up 4 13 17
WQL08 - Apply split applications of nitrogen based on a pre-sidedress nitrogen test on cropland 3 1 4
WQL09 - Apply phosphorus fertilizer below soil surface 12 --b 12
WQL10 - Plant an annual grass-type cover crop that will scavenge residual nitrogen 4 4 8
WQL11 - Precision application technology to apply nutrients 13 1 14
WQL12 - Managing livestock access to water bodies/courses 31 13 44
WQL13 - High level Integrated Pest Management to reduce pesticide environmental risk 25 10 35
WQL14 - Land application of only treated manure 9 7 16
WQL15 - Reduce the concentration of nutrients on livestock farms 12 1 13
WQL16 - Use of legume cover crops as a nitrogen source 5 6 11
WQL17 - Use of non-chemical methods to kill cover crops 5 4 9
WQL18 - Non- Chemical Pest Control for Livestock 11 3 14
WQL19 - Transition to Organic Grazing Systems 3 --b 3
WQL20 - Transition to Organic Cropping Systems 3 3 6
WQL21 - Integrated Pest Management for Organic Farming. 12 6 18
WQL22 - On Farm Composting of Farm Organic Waste --b 5 5
WQL23 - Provide Livestock Protection Away from Sensitive Areas --b 4 4
WQT01 - Irrigation system automation 3 7 10
WQT02 - Mulching for moisture conservation 6 4 10
WQT03 - Irrigation pumping plant evaluation 31 16 47
WQT04 - Regional weather networks for irrigation scheduling 34 22 56
WQT05 - Remote monitoring and notification of irrigation pumping plant operation 4 3 7
COLORADO 1,205 993 2,198
314 - Brush Management 3 3 6
328 - Conservation Crop Rotation 8 7 15
329 - Residue and Tillage Management, No-Till/Strip Till/Direct Seed 1 3 4
340 - Cover Crop 1 --b 1
342 - Critical Area Planting --b 2 2
344 - Residue Management, Seasonal 10 4 14
345 - Residue and Tillage Management, Mulch Till 4 --b 4
380 - Windbreak/Shelterbelt Establishment 2 10 12
383 - Fuel Break 1 --b 1
384 - Forest Slash Treatment 3 --b 3
386 - Field Border 1 1 2
394 - Firebreak 1 --b 1
449 - Irrigation Water Management 9 11 20
511 - Forage Harvest Management 1 3 4
512 - Forage and Biomass Planting 1 5 6
528 - Prescribed Grazing 20 14 34
550 - Range Planting --b 1 1
645 - Upland Wildlife Habitat Management 10 2 12
650 - Windbreak/Shelterbelt Renovation 2 1 3
655 - Forest Trails and Landings 1 --b 1
666 - Forest Stand Improvement 1 --b 1
AIR01 - Injecting or incorporating manure 6 --b 6
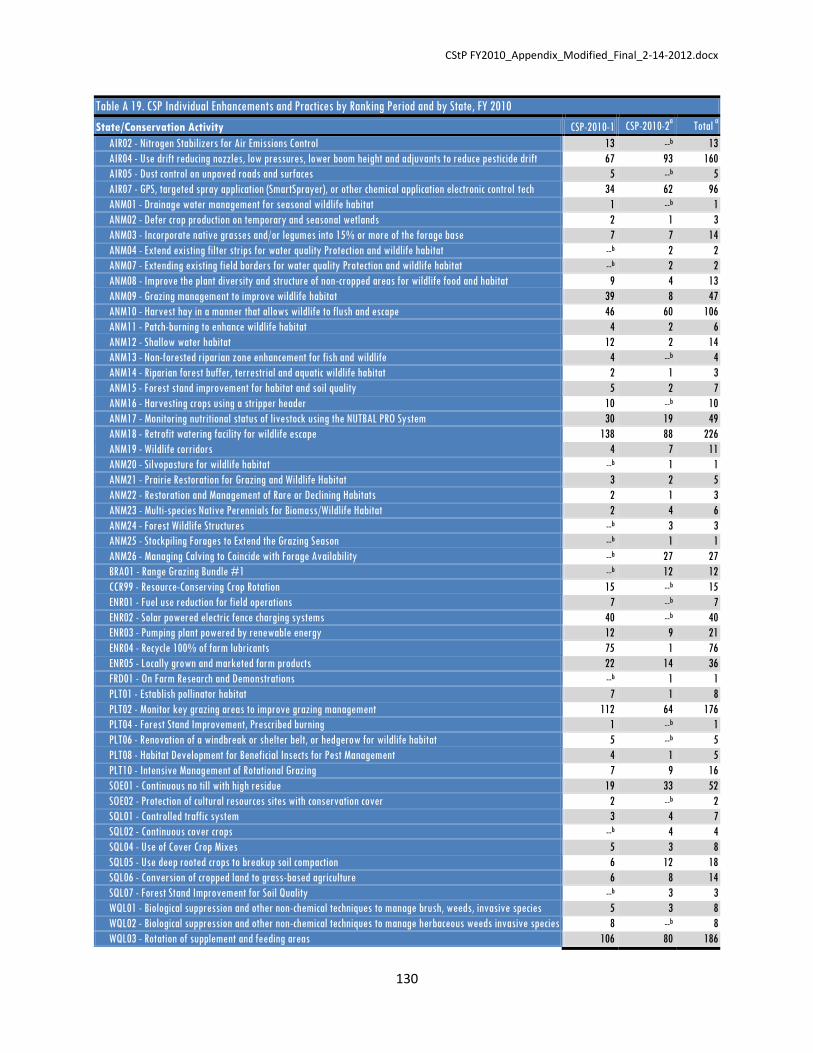
CStP FY2010_Appendix_Modified_Final_2-14-2012.docx
130
Table A 19. CSP Individual Enhancements and Practices by Ranking Period and by State, FY 2010
State/Conservation Activity CSP-2010-1 CSP-2010-2a Total
a
AIR02 - Nitrogen Stabilizers for Air Emissions Control 13 --b 13
AIR04 - Use drift reducing nozzles, low pressures, lower boom height and adjuvants to reduce pesticide drift 67 93 160
AIR05 - Dust control on unpaved roads and surfaces 5 --b 5
AIR07 - GPS, targeted spray application (SmartSprayer), or other chemical application electronic control tech 34 62 96
ANM01 - Drainage water management for seasonal wildlife habitat 1 --b 1
ANM02 - Defer crop production on temporary and seasonal wetlands 2 1 3
ANM03 - Incorporate native grasses and/or legumes into 15% or more of the forage base 7 7 14
ANM04 - Extend existing filter strips for water quality Protection and wildlife habitat --b 2 2
ANM07 - Extending existing field borders for water quality Protection and wildlife habitat --b 2 2
ANM08 - Improve the plant diversity and structure of non-cropped areas for wildlife food and habitat 9 4 13
ANM09 - Grazing management to improve wildlife habitat 39 8 47
ANM10 - Harvest hay in a manner that allows wildlife to flush and escape 46 60 106
ANM11 - Patch-burning to enhance wildlife habitat 4 2 6
ANM12 - Shallow water habitat 12 2 14
ANM13 - Non-forested riparian zone enhancement for fish and wildlife 4 --b 4
ANM14 - Riparian forest buffer, terrestrial and aquatic wildlife habitat 2 1 3
ANM15 - Forest stand improvement for habitat and soil quality 5 2 7
ANM16 - Harvesting crops using a stripper header 10 --b 10
ANM17 - Monitoring nutritional status of livestock using the NUTBAL PRO System 30 19 49
ANM18 - Retrofit watering facility for wildlife escape 138 88 226
ANM19 - Wildlife corridors 4 7 11
ANM20 - Silvopasture for wildlife habitat --b 1 1
ANM21 - Prairie Restoration for Grazing and Wildlife Habitat 3 2 5
ANM22 - Restoration and Management of Rare or Declining Habitats 2 1 3
ANM23 - Multi-species Native Perennials for Biomass/Wildlife Habitat 2 4 6
ANM24 - Forest Wildlife Structures --b 3 3
ANM25 - Stockpiling Forages to Extend the Grazing Season --b 1 1
ANM26 - Managing Calving to Coincide with Forage Availability --b 27 27
BRA01 - Range Grazing Bundle #1 --b 12 12
CCR99 - Resource-Conserving Crop Rotation 15 --b 15
ENR01 - Fuel use reduction for field operations 7 --b 7
ENR02 - Solar powered electric fence charging systems 40 --b 40
ENR03 - Pumping plant powered by renewable energy 12 9 21
ENR04 - Recycle 100% of farm lubricants 75 1 76
ENR05 - Locally grown and marketed farm products 22 14 36
FRD01 - On Farm Research and Demonstrations --b 1 1
PLT01 - Establish pollinator habitat 7 1 8
PLT02 - Monitor key grazing areas to improve grazing management 112 64 176
PLT04 - Forest Stand Improvement, Prescribed burning 1 --b 1
PLT06 - Renovation of a windbreak or shelter belt, or hedgerow for wildlife habitat 5 --b 5
PLT08 - Habitat Development for Beneficial Insects for Pest Management 4 1 5
PLT10 - Intensive Management of Rotational Grazing 7 9 16
SOE01 - Continuous no till with high residue 19 33 52
SOE02 - Protection of cultural resources sites with conservation cover 2 --b 2
SQL01 - Controlled traffic system 3 4 7
SQL02 - Continuous cover crops --b 4 4
SQL04 - Use of Cover Crop Mixes 5 3 8
SQL05 - Use deep rooted crops to breakup soil compaction 6 12 18
SQL06 - Conversion of cropped land to grass-based agriculture 6 8 14
SQL07 - Forest Stand Improvement for Soil Quality --b 3 3
WQL01 - Biological suppression and other non-chemical techniques to manage brush, weeds, invasive species 5 3 8
WQL02 - Biological suppression and other non-chemical techniques to manage herbaceous weeds invasive species 8 --b 8
WQL03 - Rotation of supplement and feeding areas 106 80 186

CStP FY2010_Appendix_Modified_Final_2-14-2012.docx
131
Table A 19. CSP Individual Enhancements and Practices by Ranking Period and by State, FY 2010
State/Conservation Activity CSP-2010-1 CSP-2010-2a Total
a
WQL04 - Plant Tissue Testing and Analysis to Improve Nitrogen Management 34 69 103
WQL05 - Apply nutrients no more than 30 days prior to planned planting date 21 --b 21
WQL06 - Apply controlled release nitrogen fertilizer 1 8 9
WQL07 - Split nitrogen applications 50% after crop/pasture emergence/green up 7 33 40
WQL08 - Apply split applications of nitrogen based on a pre-sidedress nitrogen test on cropland 3 2 5
WQL09 - Apply phosphorus fertilizer below soil surface 11 --b 11
WQL10 - Plant an annual grass-type cover crop that will scavenge residual nitrogen 1 1 2
WQL11 - Precision application technology to apply nutrients 5 5 10
WQL12 - Managing livestock access to water bodies/courses 11 6 17
WQL13 - High level Integrated Pest Management to reduce pesticide environmental risk 56 49 105
WQL14 - Land application of only treated manure 4 8 12
WQL15 - Reduce the concentration of nutrients on livestock farms 3 7 10
WQL16 - Use of legume cover crops as a nitrogen source 1 2 3
WQL17 - Use of non-chemical methods to kill cover crops 4 2 6
WQL18 - Non- Chemical Pest Control for Livestock 3 --b 3
WQL19 - Transition to Organic Grazing Systems 1 1 2
WQL20 - Transition to Organic Cropping Systems 2 3 5
WQL21 - Integrated Pest Management for Organic Farming. 2 4 6
WQL22 - On Farm Composting of Farm Organic Waste --b 2 2
WQT01 - Irrigation system automation 4 7 11
WQT03 - Irrigation pumping plant evaluation 15 20 35
WQT04 - Regional weather networks for irrigation scheduling 19 13 32
WQT05 - Remote monitoring and notification of irrigation pumping plant operation 5 23 28
CONNECTICUT 24 9 33
386 - Field Border 1 --b 1
612 - Tree/Shrub Establishment --b 1 1
AIR02 - Nitrogen Stabilizers for Air Emissions Control 2 --b 2
AIR04 - Use drift reducing nozzles, low pressures, lower boom height and adjuvants to reduce pesticide drift 1 --b 1
ANM10 - Harvest hay in a manner that allows wildlife to flush and escape 2 --b 2
ANM14 - Riparian forest buffer, terrestrial and aquatic wildlife habitat 1 1 2
ANM15 - Forest stand improvement for habitat and soil quality 3 3 6
ANM18 - Retrofit watering facility for wildlife escape 1 --b 1
ANM24 - Forest Wildlife Structures --b 2 2
PLT01 - Establish pollinator habitat 1 1 2
PLT02 - Monitor key grazing areas to improve grazing management 1 --b 1
PLT05 - Multi-story cropping, sustainable management of nontimber forest plants --b 1 1
PLT06 - Renovation of a windbreak or shelter belt, or hedgerow for wildlife habitat 1 --b 1
SQL01 - Controlled traffic system 1 --b 1
SQL02 - Continuous cover crops 1 --b 1
SQL04 - Use of Cover Crop Mixes 1 --b 1
WQL04 - Plant Tissue Testing and Analysis to Improve Nitrogen Management 2 --b 2
WQL06 - Apply controlled release nitrogen fertilizer 2 --b 2
WQL07 - Split nitrogen applications 50% after crop/pasture emergence/green up 2 --b 2
WQT02 - Mulching for moisture conservation 1 --b 1
DELAWARE 28 25 53
644 - Wetland Wildlife Habitat Management 1 --b 1
666 - Forest Stand Improvement 1 --b 1
AIR03 - Replace burning of prunings and other crop residues with non-burning alternatives --b 1 1
AIR04 - Use drift reducing nozzles, low pressures, lower boom height and adjuvants to reduce pesticide drift --b 3 3
AIR07 - GPS, targeted spray application (SmartSprayer), or other chemical application electronic control tech --b 1 1
ANM03 - Incorporate native grasses and/or legumes into 15% or more of the forage base --b 1 1
ANM04 - Extend existing filter strips for water quality Protection and wildlife habitat --b 1 1
ANM08 - Improve the plant diversity and structure of non-cropped areas for wildlife food and habitat 3 1 4
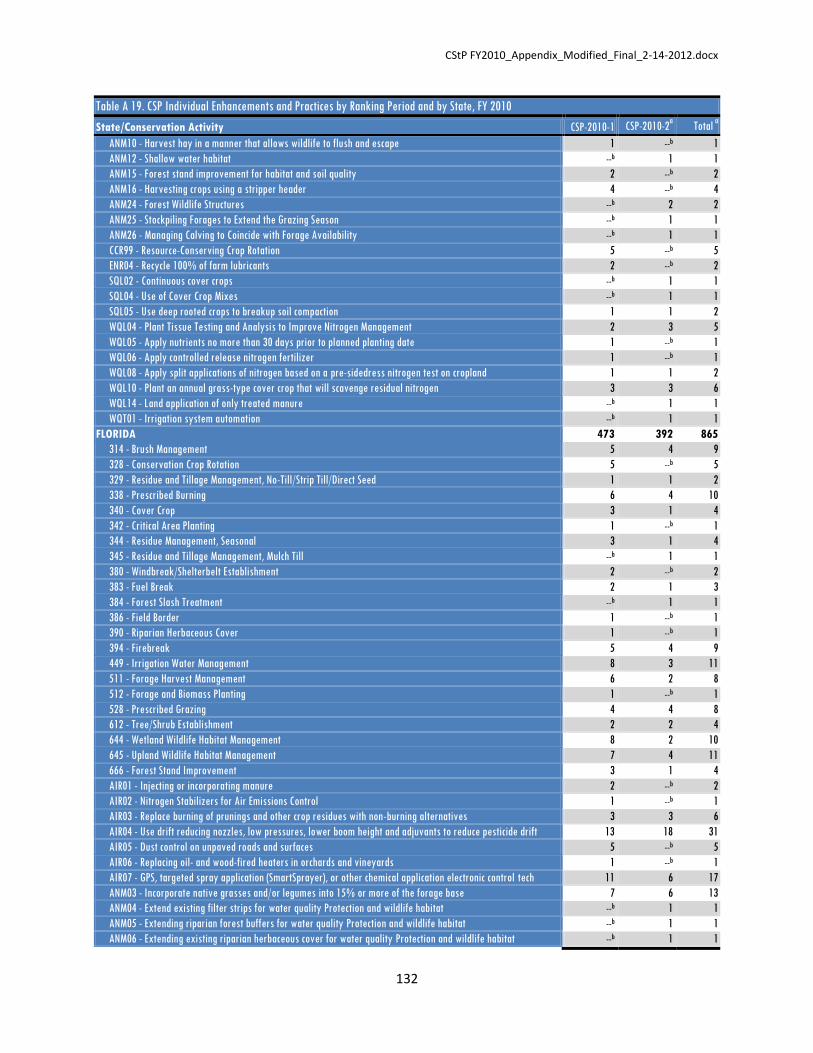
CStP FY2010_Appendix_Modified_Final_2-14-2012.docx
132
Table A 19. CSP Individual Enhancements and Practices by Ranking Period and by State, FY 2010
State/Conservation Activity CSP-2010-1 CSP-2010-2a Total
a
ANM10 - Harvest hay in a manner that allows wildlife to flush and escape 1 --b 1
ANM12 - Shallow water habitat --b 1 1
ANM15 - Forest stand improvement for habitat and soil quality 2 --b 2
ANM16 - Harvesting crops using a stripper header 4 --b 4
ANM24 - Forest Wildlife Structures --b 2 2
ANM25 - Stockpiling Forages to Extend the Grazing Season --b 1 1
ANM26 - Managing Calving to Coincide with Forage Availability --b 1 1
CCR99 - Resource-Conserving Crop Rotation 5 --b 5
ENR04 - Recycle 100% of farm lubricants 2 --b 2
SQL02 - Continuous cover crops --b 1 1
SQL04 - Use of Cover Crop Mixes --b 1 1
SQL05 - Use deep rooted crops to breakup soil compaction 1 1 2
WQL04 - Plant Tissue Testing and Analysis to Improve Nitrogen Management 2 3 5
WQL05 - Apply nutrients no more than 30 days prior to planned planting date 1 --b 1
WQL06 - Apply controlled release nitrogen fertilizer 1 --b 1
WQL08 - Apply split applications of nitrogen based on a pre-sidedress nitrogen test on cropland 1 1 2
WQL10 - Plant an annual grass-type cover crop that will scavenge residual nitrogen 3 3 6
WQL14 - Land application of only treated manure --b 1 1
WQT01 - Irrigation system automation --b 1 1
FLORIDA 473 392 865
314 - Brush Management 5 4 9
328 - Conservation Crop Rotation 5 --b 5
329 - Residue and Tillage Management, No-Till/Strip Till/Direct Seed 1 1 2
338 - Prescribed Burning 6 4 10
340 - Cover Crop 3 1 4
342 - Critical Area Planting 1 --b 1
344 - Residue Management, Seasonal 3 1 4
345 - Residue and Tillage Management, Mulch Till --b 1 1
380 - Windbreak/Shelterbelt Establishment 2 --b 2
383 - Fuel Break 2 1 3
384 - Forest Slash Treatment --b 1 1
386 - Field Border 1 --b 1
390 - Riparian Herbaceous Cover 1 --b 1
394 - Firebreak 5 4 9
449 - Irrigation Water Management 8 3 11
511 - Forage Harvest Management 6 2 8
512 - Forage and Biomass Planting 1 --b 1
528 - Prescribed Grazing 4 4 8
612 - Tree/Shrub Establishment 2 2 4
644 - Wetland Wildlife Habitat Management 8 2 10
645 - Upland Wildlife Habitat Management 7 4 11
666 - Forest Stand Improvement 3 1 4
AIR01 - Injecting or incorporating manure 2 --b 2
AIR02 - Nitrogen Stabilizers for Air Emissions Control 1 --b 1
AIR03 - Replace burning of prunings and other crop residues with non-burning alternatives 3 3 6
AIR04 - Use drift reducing nozzles, low pressures, lower boom height and adjuvants to reduce pesticide drift 13 18 31
AIR05 - Dust control on unpaved roads and surfaces 5 --b 5
AIR06 - Replacing oil- and wood-fired heaters in orchards and vineyards 1 --b 1
AIR07 - GPS, targeted spray application (SmartSprayer), or other chemical application electronic control tech 11 6 17
ANM03 - Incorporate native grasses and/or legumes into 15% or more of the forage base 7 6 13
ANM04 - Extend existing filter strips for water quality Protection and wildlife habitat --b 1 1
ANM05 - Extending riparian forest buffers for water quality Protection and wildlife habitat --b 1 1
ANM06 - Extending existing riparian herbaceous cover for water quality Protection and wildlife habitat --b 1 1
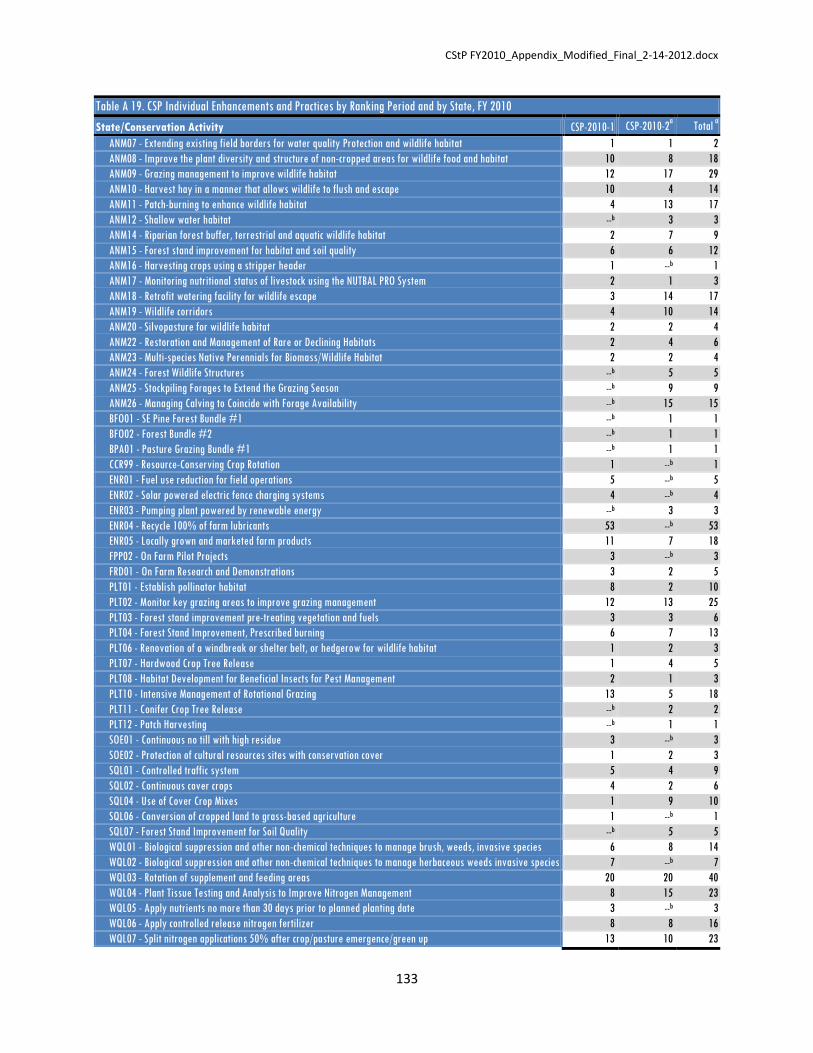
CStP FY2010_Appendix_Modified_Final_2-14-2012.docx
133
Table A 19. CSP Individual Enhancements and Practices by Ranking Period and by State, FY 2010
State/Conservation Activity CSP-2010-1 CSP-2010-2a Total
a
ANM07 - Extending existing field borders for water quality Protection and wildlife habitat 1 1 2
ANM08 - Improve the plant diversity and structure of non-cropped areas for wildlife food and habitat 10 8 18
ANM09 - Grazing management to improve wildlife habitat 12 17 29
ANM10 - Harvest hay in a manner that allows wildlife to flush and escape 10 4 14
ANM11 - Patch-burning to enhance wildlife habitat 4 13 17
ANM12 - Shallow water habitat --b 3 3
ANM14 - Riparian forest buffer, terrestrial and aquatic wildlife habitat 2 7 9
ANM15 - Forest stand improvement for habitat and soil quality 6 6 12
ANM16 - Harvesting crops using a stripper header 1 --b 1
ANM17 - Monitoring nutritional status of livestock using the NUTBAL PRO System 2 1 3
ANM18 - Retrofit watering facility for wildlife escape 3 14 17
ANM19 - Wildlife corridors 4 10 14
ANM20 - Silvopasture for wildlife habitat 2 2 4
ANM22 - Restoration and Management of Rare or Declining Habitats 2 4 6
ANM23 - Multi-species Native Perennials for Biomass/Wildlife Habitat 2 2 4
ANM24 - Forest Wildlife Structures --b 5 5
ANM25 - Stockpiling Forages to Extend the Grazing Season --b 9 9
ANM26 - Managing Calving to Coincide with Forage Availability --b 15 15
BFO01 - SE Pine Forest Bundle #1 --b 1 1
BFO02 - Forest Bundle #2 --b 1 1
BPA01 - Pasture Grazing Bundle #1 --b 1 1
CCR99 - Resource-Conserving Crop Rotation 1 --b 1
ENR01 - Fuel use reduction for field operations 5 --b 5
ENR02 - Solar powered electric fence charging systems 4 --b 4
ENR03 - Pumping plant powered by renewable energy --b 3 3
ENR04 - Recycle 100% of farm lubricants 53 --b 53
ENR05 - Locally grown and marketed farm products 11 7 18
FPP02 - On Farm Pilot Projects 3 --b 3
FRD01 - On Farm Research and Demonstrations 3 2 5
PLT01 - Establish pollinator habitat 8 2 10
PLT02 - Monitor key grazing areas to improve grazing management 12 13 25
PLT03 - Forest stand improvement pre-treating vegetation and fuels 3 3 6
PLT04 - Forest Stand Improvement, Prescribed burning 6 7 13
PLT06 - Renovation of a windbreak or shelter belt, or hedgerow for wildlife habitat 1 2 3
PLT07 - Hardwood Crop Tree Release 1 4 5
PLT08 - Habitat Development for Beneficial Insects for Pest Management 2 1 3
PLT10 - Intensive Management of Rotational Grazing 13 5 18
PLT11 - Conifer Crop Tree Release --b 2 2
PLT12 - Patch Harvesting --b 1 1
SOE01 - Continuous no till with high residue 3 --b 3
SOE02 - Protection of cultural resources sites with conservation cover 1 2 3
SQL01 - Controlled traffic system 5 4 9
SQL02 - Continuous cover crops 4 2 6
SQL04 - Use of Cover Crop Mixes 1 9 10
SQL06 - Conversion of cropped land to grass-based agriculture 1 --b 1
SQL07 - Forest Stand Improvement for Soil Quality --b 5 5
WQL01 - Biological suppression and other non-chemical techniques to manage brush, weeds, invasive species 6 8 14
WQL02 - Biological suppression and other non-chemical techniques to manage herbaceous weeds invasive species 7 --b 7
WQL03 - Rotation of supplement and feeding areas 20 20 40
WQL04 - Plant Tissue Testing and Analysis to Improve Nitrogen Management 8 15 23
WQL05 - Apply nutrients no more than 30 days prior to planned planting date 3 --b 3
WQL06 - Apply controlled release nitrogen fertilizer 8 8 16
WQL07 - Split nitrogen applications 50% after crop/pasture emergence/green up 13 10 23

CStP FY2010_Appendix_Modified_Final_2-14-2012.docx
134
Table A 19. CSP Individual Enhancements and Practices by Ranking Period and by State, FY 2010
State/Conservation Activity CSP-2010-1 CSP-2010-2a Total
a
WQL08 - Apply split applications of nitrogen based on a pre-sidedress nitrogen test on cropland 1 --b 1
WQL09 - Apply phosphorus fertilizer below soil surface 2 --b 2
WQL10 - Plant an annual grass-type cover crop that will scavenge residual nitrogen 5 1 6
WQL11 - Precision application technology to apply nutrients 8 8 16
WQL12 - Managing livestock access to water bodies/courses 6 2 8
WQL13 - High level Integrated Pest Management to reduce pesticide environmental risk 27 23 50
WQL14 - Land application of only treated manure 4 1 5
WQL15 - Reduce the concentration of nutrients on livestock farms 2 2 4
WQL16 - Use of legume cover crops as a nitrogen source 1 1 2
WQL17 - Use of non-chemical methods to kill cover crops --b 1 1
WQL18 - Non- Chemical Pest Control for Livestock 4 1 5
WQL21 - Integrated Pest Management for Organic Farming. 1 --b 1
WQL22 - On Farm Composting of Farm Organic Waste --b 1 1
WQT01 - Irrigation system automation 4 1 5
WQT02 - Mulching for moisture conservation 3 1 4
WQT03 - Irrigation pumping plant evaluation 8 4 12
WQT04 - Regional weather networks for irrigation scheduling 12 13 25
WQT05 - Remote monitoring and notification of irrigation pumping plant operation 1 1 2
GEORGIA 1,081 2,995 4,076
314 - Brush Management 5 13 18
328 - Conservation Crop Rotation 1 56 57
329 - Residue and Tillage Management, No-Till/Strip Till/Direct Seed 4 42 46
338 - Prescribed Burning 30 31 61
340 - Cover Crop 4 13 17
342 - Critical Area Planting 7 4 11
344 - Residue Management, Seasonal 3 20 23
345 - Residue and Tillage Management, Mulch Till 1 1 2
380 - Windbreak/Shelterbelt Establishment --b 1 1
383 - Fuel Break 2 9 11
384 - Forest Slash Treatment 3 4 7
386 - Field Border 1 12 13
390 - Riparian Herbaceous Cover --b 1 1
391 - Riparian Forest Buffer --b 24 24
393 - Filter Strip 1 2 3
394 - Firebreak 34 54 88
395 - Stream Habitat Improvement and Management 4 4 8
449 - Irrigation Water Management 2 35 37
511 - Forage Harvest Management 3 7 10
512 - Forage and Biomass Planting 2 8 10
528 - Prescribed Grazing 5 7 12
612 - Tree/Shrub Establishment 13 17 30
643 - Restoration and Management of Rare and Declining Habitats 6 5 11
644 - Wetland Wildlife Habitat Management 9 8 17
645 - Upland Wildlife Habitat Management 22 55 77
647 - Early Successional Habitat Development/Management 16 21 37
654 - Road/Trail/Landing Closure and Treatment --b 5 5
655 - Forest Trails and Landings 12 10 22
660 - Tree/Shrub Pruning 6 9 15
666 - Forest Stand Improvement 27 38 65
722 - Road/Landing Removal 1 --b 1
AIR01 - Injecting or incorporating manure 2 --b 2
AIR02 - Nitrogen Stabilizers for Air Emissions Control 16 --b 16
AIR03 - Replace burning of prunings and other crop residues with non-burning alternatives 1 10 11
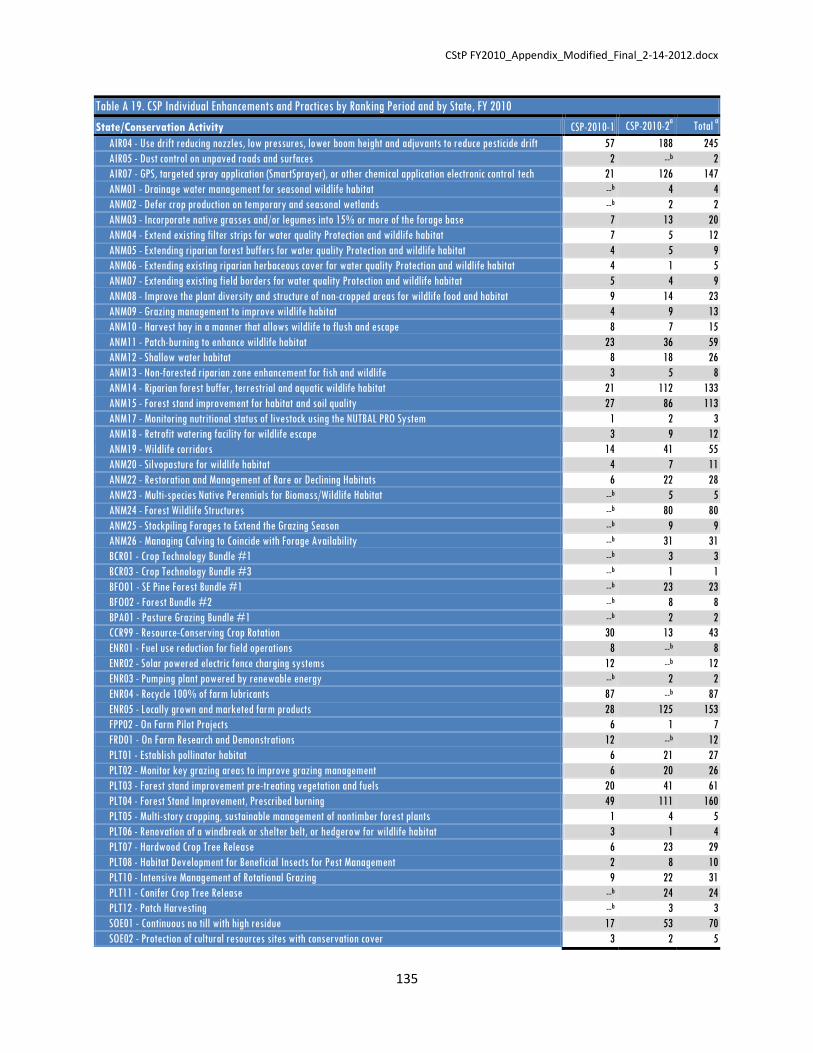
CStP FY2010_Appendix_Modified_Final_2-14-2012.docx
135
Table A 19. CSP Individual Enhancements and Practices by Ranking Period and by State, FY 2010
State/Conservation Activity CSP-2010-1 CSP-2010-2a Total
a
AIR04 - Use drift reducing nozzles, low pressures, lower boom height and adjuvants to reduce pesticide drift 57 188 245
AIR05 - Dust control on unpaved roads and surfaces 2 --b 2
AIR07 - GPS, targeted spray application (SmartSprayer), or other chemical application electronic control tech 21 126 147
ANM01 - Drainage water management for seasonal wildlife habitat --b 4 4
ANM02 - Defer crop production on temporary and seasonal wetlands --b 2 2
ANM03 - Incorporate native grasses and/or legumes into 15% or more of the forage base 7 13 20
ANM04 - Extend existing filter strips for water quality Protection and wildlife habitat 7 5 12
ANM05 - Extending riparian forest buffers for water quality Protection and wildlife habitat 4 5 9
ANM06 - Extending existing riparian herbaceous cover for water quality Protection and wildlife habitat 4 1 5
ANM07 - Extending existing field borders for water quality Protection and wildlife habitat 5 4 9
ANM08 - Improve the plant diversity and structure of non-cropped areas for wildlife food and habitat 9 14 23
ANM09 - Grazing management to improve wildlife habitat 4 9 13
ANM10 - Harvest hay in a manner that allows wildlife to flush and escape 8 7 15
ANM11 - Patch-burning to enhance wildlife habitat 23 36 59
ANM12 - Shallow water habitat 8 18 26
ANM13 - Non-forested riparian zone enhancement for fish and wildlife 3 5 8
ANM14 - Riparian forest buffer, terrestrial and aquatic wildlife habitat 21 112 133
ANM15 - Forest stand improvement for habitat and soil quality 27 86 113
ANM17 - Monitoring nutritional status of livestock using the NUTBAL PRO System 1 2 3
ANM18 - Retrofit watering facility for wildlife escape 3 9 12
ANM19 - Wildlife corridors 14 41 55
ANM20 - Silvopasture for wildlife habitat 4 7 11
ANM22 - Restoration and Management of Rare or Declining Habitats 6 22 28
ANM23 - Multi-species Native Perennials for Biomass/Wildlife Habitat --b 5 5
ANM24 - Forest Wildlife Structures --b 80 80
ANM25 - Stockpiling Forages to Extend the Grazing Season --b 9 9
ANM26 - Managing Calving to Coincide with Forage Availability --b 31 31
BCR01 - Crop Technology Bundle #1 --b 3 3
BCR03 - Crop Technology Bundle #3 --b 1 1
BFO01 - SE Pine Forest Bundle #1 --b 23 23
BFO02 - Forest Bundle #2 --b 8 8
BPA01 - Pasture Grazing Bundle #1 --b 2 2
CCR99 - Resource-Conserving Crop Rotation 30 13 43
ENR01 - Fuel use reduction for field operations 8 --b 8
ENR02 - Solar powered electric fence charging systems 12 --b 12
ENR03 - Pumping plant powered by renewable energy --b 2 2
ENR04 - Recycle 100% of farm lubricants 87 --b 87
ENR05 - Locally grown and marketed farm products 28 125 153
FPP02 - On Farm Pilot Projects 6 1 7
FRD01 - On Farm Research and Demonstrations 12 --b 12
PLT01 - Establish pollinator habitat 6 21 27
PLT02 - Monitor key grazing areas to improve grazing management 6 20 26
PLT03 - Forest stand improvement pre-treating vegetation and fuels 20 41 61
PLT04 - Forest Stand Improvement, Prescribed burning 49 111 160
PLT05 - Multi-story cropping, sustainable management of nontimber forest plants 1 4 5
PLT06 - Renovation of a windbreak or shelter belt, or hedgerow for wildlife habitat 3 1 4
PLT07 - Hardwood Crop Tree Release 6 23 29
PLT08 - Habitat Development for Beneficial Insects for Pest Management 2 8 10
PLT10 - Intensive Management of Rotational Grazing 9 22 31
PLT11 - Conifer Crop Tree Release --b 24 24
PLT12 - Patch Harvesting --b 3 3
SOE01 - Continuous no till with high residue 17 53 70
SOE02 - Protection of cultural resources sites with conservation cover 3 2 5

CStP FY2010_Appendix_Modified_Final_2-14-2012.docx
136
Table A 19. CSP Individual Enhancements and Practices by Ranking Period and by State, FY 2010
State/Conservation Activity CSP-2010-1 CSP-2010-2a Total
a
SOE03 - Continuous No Till Organic System 2 1 3
SQL01 - Controlled traffic system 12 74 86
SQL02 - Continuous cover crops 29 71 100
SQL04 - Use of Cover Crop Mixes 7 36 43
SQL05 - Use deep rooted crops to breakup soil compaction 7 20 27
SQL06 - Conversion of cropped land to grass-based agriculture --b 8 8
SQL07 - Forest Stand Improvement for Soil Quality --b 67 67
WQL01 - Biological suppression and other non-chemical techniques to manage brush, weeds, invasive species 6 4 10
WQL02 - Biological suppression and other non-chemical techniques to manage herbaceous weeds invasive species 8 --b 8
WQL03 - Rotation of supplement and feeding areas 24 52 76
WQL04 - Plant Tissue Testing and Analysis to Improve Nitrogen Management 14 84 98
WQL05 - Apply nutrients no more than 30 days prior to planned planting date 32 --b 32
WQL06 - Apply controlled release nitrogen fertilizer 14 73 87
WQL07 - Split nitrogen applications 50% after crop/pasture emergence/green up 29 175 204
WQL08 - Apply split applications of nitrogen based on a pre-sidedress nitrogen test on cropland 3 8 11
WQL09 - Apply phosphorus fertilizer below soil surface 5 --b 5
WQL10 - Plant an annual grass-type cover crop that will scavenge residual nitrogen 14 46 60
WQL11 - Precision application technology to apply nutrients 7 84 91
WQL12 - Managing livestock access to water bodies/courses 16 32 48
WQL13 - High level Integrated Pest Management to reduce pesticide environmental risk 27 130 157
WQL14 - Land application of only treated manure 3 21 24
WQL15 - Reduce the concentration of nutrients on livestock farms 1 10 11
WQL16 - Use of legume cover crops as a nitrogen source 8 20 28
WQL17 - Use of non-chemical methods to kill cover crops 4 8 12
WQL18 - Non- Chemical Pest Control for Livestock 2 3 5
WQL19 - Transition to Organic Grazing Systems 1 --b 1
WQL20 - Transition to Organic Cropping Systems 1 --b 1
WQL21 - Integrated Pest Management for Organic Farming. 2 1 3
WQL22 - On Farm Composting of Farm Organic Waste --b 1 1
WQL23 - Provide Livestock Protection Away from Sensitive Areas --b 1 1
WQT01 - Irrigation system automation 1 8 9
WQT02 - Mulching for moisture conservation 2 2 4
WQT03 - Irrigation pumping plant evaluation 7 14 21
WQT04 - Regional weather networks for irrigation scheduling 6 45 51
WQT05 - Remote monitoring and notification of irrigation pumping plant operation 1 18 19
HAWAII 22 22 44
AIR03 - Replace burning of prunings and other crop residues with non-burning alternatives --b 1 1
AIR04 - Use drift reducing nozzles, low pressures, lower boom height and adjuvants to reduce pesticide drift --b 4 4
ANM08 - Improve the plant diversity and structure of non-cropped areas for wildlife food and habitat --b 1 1
ANM19 - Wildlife corridors --b 1 1
ENR01 - Fuel use reduction for field operations 1 --b 1
ENR04 - Recycle 100% of farm lubricants 6 --b 6
ENR05 - Locally grown and marketed farm products 2 --b 2
FRD01 - On Farm Research and Demonstrations --b 2 2
PLT02 - Monitor key grazing areas to improve grazing management 4 3 7
PLT06 - Renovation of a windbreak or shelter belt, or hedgerow for wildlife habitat --b 1 1
PLT10 - Intensive Management of Rotational Grazing 4 --b 4
WQL01 - Biological suppression and other non-chemical techniques to manage brush, weeds, invasive species --b 1 1
WQL03 - Rotation of supplement and feeding areas 3 4 7
WQL06 - Apply controlled release nitrogen fertilizer 1 1 2
WQL13 - High level Integrated Pest Management to reduce pesticide environmental risk --b 2 2
WQL14 - Land application of only treated manure --b 1 1
WQL18 - Non- Chemical Pest Control for Livestock 1 --b 1
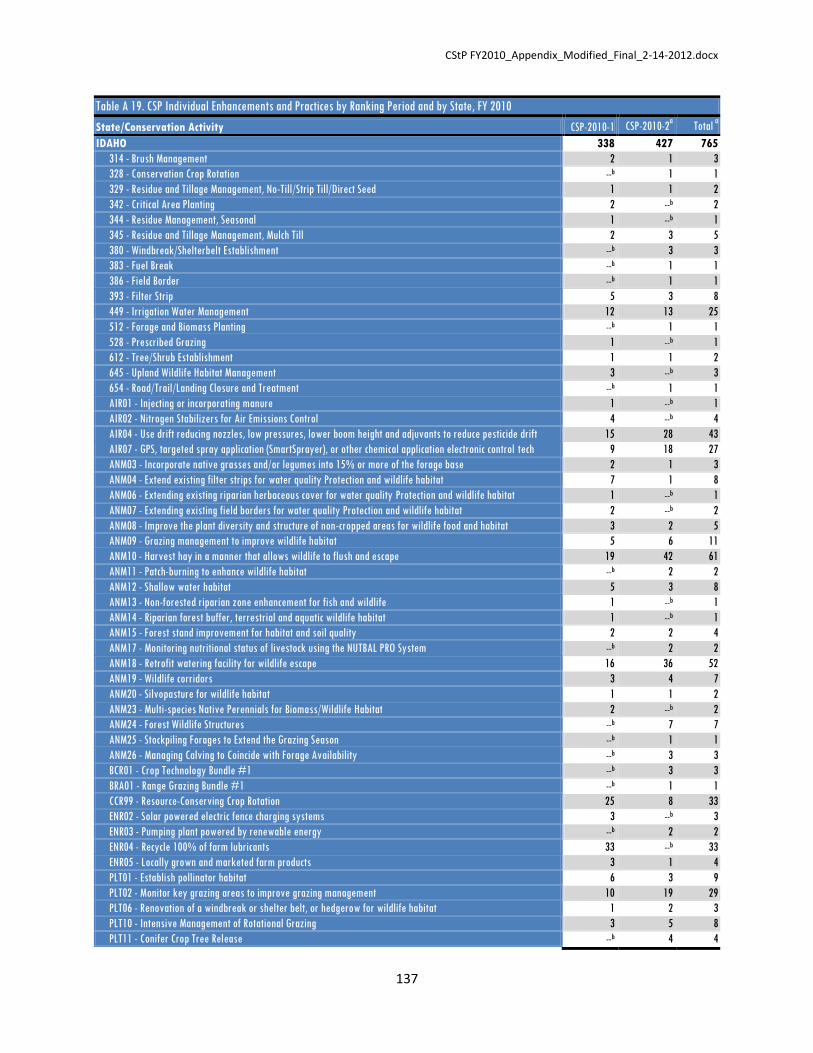
CStP FY2010_Appendix_Modified_Final_2-14-2012.docx
137
Table A 19. CSP Individual Enhancements and Practices by Ranking Period and by State, FY 2010
State/Conservation Activity CSP-2010-1 CSP-2010-2a Total
a
IDAHO 338 427 765
314 - Brush Management 2 1 3
328 - Conservation Crop Rotation --b 1 1
329 - Residue and Tillage Management, No-Till/Strip Till/Direct Seed 1 1 2
342 - Critical Area Planting 2 --b 2
344 - Residue Management, Seasonal 1 --b 1
345 - Residue and Tillage Management, Mulch Till 2 3 5
380 - Windbreak/Shelterbelt Establishment --b 3 3
383 - Fuel Break --b 1 1
386 - Field Border --b 1 1
393 - Filter Strip 5 3 8
449 - Irrigation Water Management 12 13 25
512 - Forage and Biomass Planting --b 1 1
528 - Prescribed Grazing 1 --b 1
612 - Tree/Shrub Establishment 1 1 2
645 - Upland Wildlife Habitat Management 3 --b 3
654 - Road/Trail/Landing Closure and Treatment --b 1 1
AIR01 - Injecting or incorporating manure 1 --b 1
AIR02 - Nitrogen Stabilizers for Air Emissions Control 4 --b 4
AIR04 - Use drift reducing nozzles, low pressures, lower boom height and adjuvants to reduce pesticide drift 15 28 43
AIR07 - GPS, targeted spray application (SmartSprayer), or other chemical application electronic control tech 9 18 27
ANM03 - Incorporate native grasses and/or legumes into 15% or more of the forage base 2 1 3
ANM04 - Extend existing filter strips for water quality Protection and wildlife habitat 7 1 8
ANM06 - Extending existing riparian herbaceous cover for water quality Protection and wildlife habitat 1 --b 1
ANM07 - Extending existing field borders for water quality Protection and wildlife habitat 2 --b 2
ANM08 - Improve the plant diversity and structure of non-cropped areas for wildlife food and habitat 3 2 5
ANM09 - Grazing management to improve wildlife habitat 5 6 11
ANM10 - Harvest hay in a manner that allows wildlife to flush and escape 19 42 61
ANM11 - Patch-burning to enhance wildlife habitat --b 2 2
ANM12 - Shallow water habitat 5 3 8
ANM13 - Non-forested riparian zone enhancement for fish and wildlife 1 --b 1
ANM14 - Riparian forest buffer, terrestrial and aquatic wildlife habitat 1 --b 1
ANM15 - Forest stand improvement for habitat and soil quality 2 2 4
ANM17 - Monitoring nutritional status of livestock using the NUTBAL PRO System --b 2 2
ANM18 - Retrofit watering facility for wildlife escape 16 36 52
ANM19 - Wildlife corridors 3 4 7
ANM20 - Silvopasture for wildlife habitat 1 1 2
ANM23 - Multi-species Native Perennials for Biomass/Wildlife Habitat 2 --b 2
ANM24 - Forest Wildlife Structures --b 7 7
ANM25 - Stockpiling Forages to Extend the Grazing Season --b 1 1
ANM26 - Managing Calving to Coincide with Forage Availability --b 3 3
BCR01 - Crop Technology Bundle #1 --b 3 3
BRA01 - Range Grazing Bundle #1 --b 1 1
CCR99 - Resource-Conserving Crop Rotation 25 8 33
ENR02 - Solar powered electric fence charging systems 3 --b 3
ENR03 - Pumping plant powered by renewable energy --b 2 2
ENR04 - Recycle 100% of farm lubricants 33 --b 33
ENR05 - Locally grown and marketed farm products 3 1 4
PLT01 - Establish pollinator habitat 6 3 9
PLT02 - Monitor key grazing areas to improve grazing management 10 19 29
PLT06 - Renovation of a windbreak or shelter belt, or hedgerow for wildlife habitat 1 2 3
PLT10 - Intensive Management of Rotational Grazing 3 5 8
PLT11 - Conifer Crop Tree Release --b 4 4
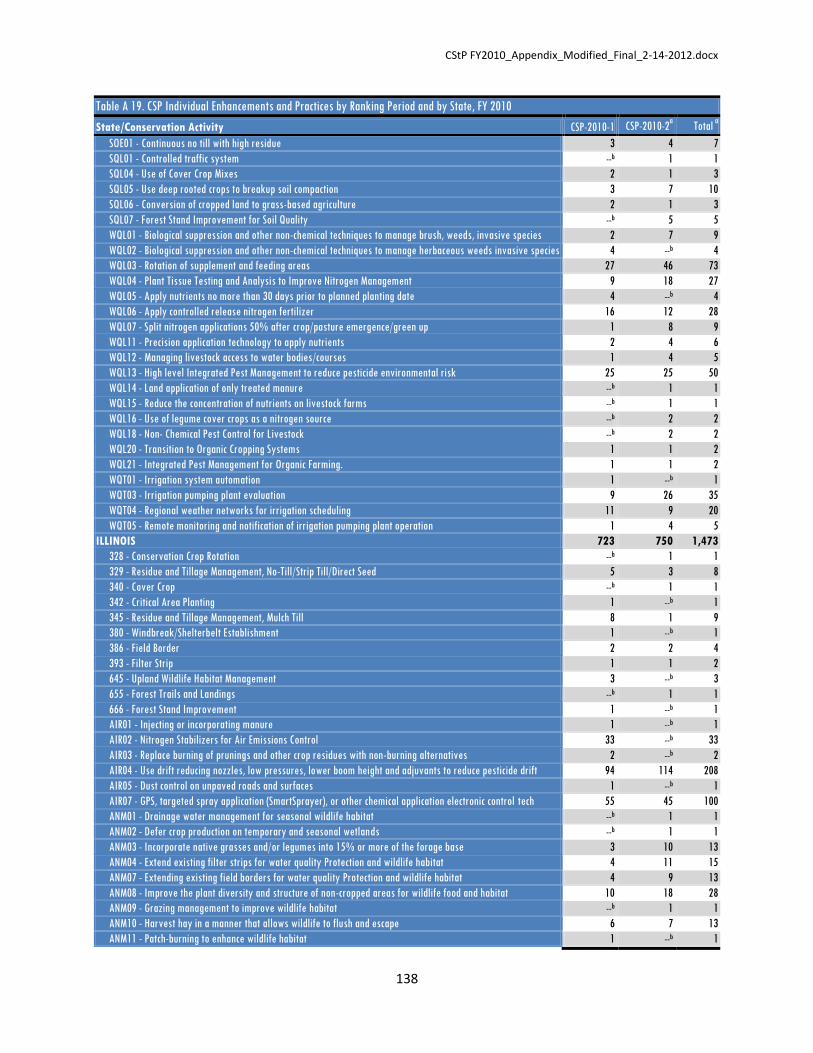
CStP FY2010_Appendix_Modified_Final_2-14-2012.docx
138
Table A 19. CSP Individual Enhancements and Practices by Ranking Period and by State, FY 2010
State/Conservation Activity CSP-2010-1 CSP-2010-2a Total
a
SOE01 - Continuous no till with high residue 3 4 7
SQL01 - Controlled traffic system --b 1 1
SQL04 - Use of Cover Crop Mixes 2 1 3
SQL05 - Use deep rooted crops to breakup soil compaction 3 7 10
SQL06 - Conversion of cropped land to grass-based agriculture 2 1 3
SQL07 - Forest Stand Improvement for Soil Quality --b 5 5
WQL01 - Biological suppression and other non-chemical techniques to manage brush, weeds, invasive species 2 7 9
WQL02 - Biological suppression and other non-chemical techniques to manage herbaceous weeds invasive species 4 --b 4
WQL03 - Rotation of supplement and feeding areas 27 46 73
WQL04 - Plant Tissue Testing and Analysis to Improve Nitrogen Management 9 18 27
WQL05 - Apply nutrients no more than 30 days prior to planned planting date 4 --b 4
WQL06 - Apply controlled release nitrogen fertilizer 16 12 28
WQL07 - Split nitrogen applications 50% after crop/pasture emergence/green up 1 8 9
WQL11 - Precision application technology to apply nutrients 2 4 6
WQL12 - Managing livestock access to water bodies/courses 1 4 5
WQL13 - High level Integrated Pest Management to reduce pesticide environmental risk 25 25 50
WQL14 - Land application of only treated manure --b 1 1
WQL15 - Reduce the concentration of nutrients on livestock farms --b 1 1
WQL16 - Use of legume cover crops as a nitrogen source --b 2 2
WQL18 - Non- Chemical Pest Control for Livestock --b 2 2
WQL20 - Transition to Organic Cropping Systems 1 1 2
WQL21 - Integrated Pest Management for Organic Farming. 1 1 2
WQT01 - Irrigation system automation 1 --b 1
WQT03 - Irrigation pumping plant evaluation 9 26 35
WQT04 - Regional weather networks for irrigation scheduling 11 9 20
WQT05 - Remote monitoring and notification of irrigation pumping plant operation 1 4 5
ILLINOIS 723 750 1,473
328 - Conservation Crop Rotation --b 1 1
329 - Residue and Tillage Management, No-Till/Strip Till/Direct Seed 5 3 8
340 - Cover Crop --b 1 1
342 - Critical Area Planting 1 --b 1
345 - Residue and Tillage Management, Mulch Till 8 1 9
380 - Windbreak/Shelterbelt Establishment 1 --b 1
386 - Field Border 2 2 4
393 - Filter Strip 1 1 2
645 - Upland Wildlife Habitat Management 3 --b 3
655 - Forest Trails and Landings --b 1 1
666 - Forest Stand Improvement 1 --b 1
AIR01 - Injecting or incorporating manure 1 --b 1
AIR02 - Nitrogen Stabilizers for Air Emissions Control 33 --b 33
AIR03 - Replace burning of prunings and other crop residues with non-burning alternatives 2 --b 2
AIR04 - Use drift reducing nozzles, low pressures, lower boom height and adjuvants to reduce pesticide drift 94 114 208
AIR05 - Dust control on unpaved roads and surfaces 1 --b 1
AIR07 - GPS, targeted spray application (SmartSprayer), or other chemical application electronic control tech 55 45 100
ANM01 - Drainage water management for seasonal wildlife habitat --b 1 1
ANM02 - Defer crop production on temporary and seasonal wetlands --b 1 1
ANM03 - Incorporate native grasses and/or legumes into 15% or more of the forage base 3 10 13
ANM04 - Extend existing filter strips for water quality Protection and wildlife habitat 4 11 15
ANM07 - Extending existing field borders for water quality Protection and wildlife habitat 4 9 13
ANM08 - Improve the plant diversity and structure of non-cropped areas for wildlife food and habitat 10 18 28
ANM09 - Grazing management to improve wildlife habitat --b 1 1
ANM10 - Harvest hay in a manner that allows wildlife to flush and escape 6 7 13
ANM11 - Patch-burning to enhance wildlife habitat 1 --b 1

CStP FY2010_Appendix_Modified_Final_2-14-2012.docx
139
Table A 19. CSP Individual Enhancements and Practices by Ranking Period and by State, FY 2010
State/Conservation Activity CSP-2010-1 CSP-2010-2a Total
a
ANM12 - Shallow water habitat 6 1 7
ANM13 - Non-forested riparian zone enhancement for fish and wildlife 1 --b 1
ANM14 - Riparian forest buffer, terrestrial and aquatic wildlife habitat 1 5 6
ANM15 - Forest stand improvement for habitat and soil quality 10 6 16
ANM17 - Monitoring nutritional status of livestock using the NUTBAL PRO System 2 --b 2
ANM18 - Retrofit watering facility for wildlife escape 8 5 13
ANM19 - Wildlife corridors 2 3 5
ANM21 - Prairie Restoration for Grazing and Wildlife Habitat 2 2 4
ANM22 - Restoration and Management of Rare or Declining Habitats 2 --b 2
ANM23 - Multi-species Native Perennials for Biomass/Wildlife Habitat 1 --b 1
ANM24 - Forest Wildlife Structures --b 14 14
ANM25 - Stockpiling Forages to Extend the Grazing Season --b 3 3
ANM26 - Managing Calving to Coincide with Forage Availability --b 2 2
BCR01 - Crop Technology Bundle #1 --b 5 5
BCR03 - Crop Technology Bundle #3 --b 1 1
BFO02 - Forest Bundle #2 --b 1 1
CCR99 - Resource-Conserving Crop Rotation 14 1 15
ENR01 - Fuel use reduction for field operations 17 --b 17
ENR02 - Solar powered electric fence charging systems 4 --b 4
ENR03 - Pumping plant powered by renewable energy 1 1 2
ENR04 - Recycle 100% of farm lubricants 114 --b 114
ENR05 - Locally grown and marketed farm products 3 2 5
FRD01 - On Farm Research and Demonstrations 1 --b 1
PLT01 - Establish pollinator habitat 2 29 31
PLT02 - Monitor key grazing areas to improve grazing management 2 3 5
PLT04 - Forest Stand Improvement, Prescribed burning 5 1 6
PLT05 - Multi-story cropping, sustainable management of nontimber forest plants 2 1 3
PLT06 - Renovation of a windbreak or shelter belt, or hedgerow for wildlife habitat 6 5 11
PLT07 - Hardwood Crop Tree Release 1 2 3
PLT08 - Habitat Development for Beneficial Insects for Pest Management 2 1 3
PLT10 - Intensive Management of Rotational Grazing --b 2 2
PLT11 - Conifer Crop Tree Release --b 1 1
SOE01 - Continuous no till with high residue 18 25 43
SOE02 - Protection of cultural resources sites with conservation cover 1 --b 1
SQL01 - Controlled traffic system 11 4 15
SQL02 - Continuous cover crops 8 9 17
SQL03 - Drainage water management for nutrient, pathogen, or pesticide reduction 3 --b 3
SQL04 - Use of Cover Crop Mixes 4 18 22
SQL05 - Use deep rooted crops to breakup soil compaction 8 24 32
SQL06 - Conversion of cropped land to grass-based agriculture 4 1 5
SQL07 - Forest Stand Improvement for Soil Quality --b 1 1
WQL01 - Biological suppression and other non-chemical techniques to manage brush, weeds, invasive species --b 5 5
WQL02 - Biological suppression and other non-chemical techniques to manage herbaceous weeds invasive species 2 --b 2
WQL03 - Rotation of supplement and feeding areas 4 2 6
WQL04 - Plant Tissue Testing and Analysis to Improve Nitrogen Management 48 105 153
WQL05 - Apply nutrients no more than 30 days prior to planned planting date 11 --b 11
WQL06 - Apply controlled release nitrogen fertilizer 19 24 43
WQL07 - Split nitrogen applications 50% after crop/pasture emergence/green up 26 55 81
WQL08 - Apply split applications of nitrogen based on a pre-sidedress nitrogen test on cropland 9 22 31
WQL09 - Apply phosphorus fertilizer below soil surface 14 --b 14
WQL10 - Plant an annual grass-type cover crop that will scavenge residual nitrogen 5 27 32
WQL11 - Precision application technology to apply nutrients 46 24 70
WQL12 - Managing livestock access to water bodies/courses --b 1 1

CStP FY2010_Appendix_Modified_Final_2-14-2012.docx
140
Table A 19. CSP Individual Enhancements and Practices by Ranking Period and by State, FY 2010
State/Conservation Activity CSP-2010-1 CSP-2010-2a Total
a
WQL13 - High level Integrated Pest Management to reduce pesticide environmental risk 29 67 96
WQL14 - Land application of only treated manure 2 1 3
WQL15 - Reduce the concentration of nutrients on livestock farms 2 2 4
WQL16 - Use of legume cover crops as a nitrogen source 1 3 4
WQL20 - Transition to Organic Cropping Systems --b 1 1
WQL21 - Integrated Pest Management for Organic Farming. 2 2 4
WQT01 - Irrigation system automation 1 --b 1
WQT02 - Mulching for moisture conservation --b 1 1
WQT03 - Irrigation pumping plant evaluation --b 1 1
WQT05 - Remote monitoring and notification of irrigation pumping plant operation --b 1 1
INDIANA 479 374 853
328 - Conservation Crop Rotation 1 --b 1
329 - Residue and Tillage Management, No-Till/Strip Till/Direct Seed 1 1 2
340 - Cover Crop --b 1 1
342 - Critical Area Planting 2 1 3
344 - Residue Management, Seasonal 2 1 3
345 - Residue and Tillage Management, Mulch Till --b 6 6
386 - Field Border 1 7 8
393 - Filter Strip --b 3 3
511 - Forage Harvest Management 1 1 2
512 - Forage and Biomass Planting 3 --b 3
528 - Prescribed Grazing 1 --b 1
644 - Wetland Wildlife Habitat Management 1 --b 1
655 - Forest Trails and Landings 1 --b 1
660 - Tree/Shrub Pruning --b 1 1
666 - Forest Stand Improvement 1 --b 1
AIR01 - Injecting or incorporating manure 8 --b 8
AIR02 - Nitrogen Stabilizers for Air Emissions Control 26 --b 26
AIR04 - Use drift reducing nozzles, low pressures, lower boom height and adjuvants to reduce pesticide drift 65 57 122
AIR07 - GPS, targeted spray application (SmartSprayer), or other chemical application electronic control tech 32 24 56
ANM02 - Defer crop production on temporary and seasonal wetlands --b 1 1
ANM03 - Incorporate native grasses and/or legumes into 15% or more of the forage base 5 7 12
ANM04 - Extend existing filter strips for water quality Protection and wildlife habitat 5 4 9
ANM07 - Extending existing field borders for water quality Protection and wildlife habitat 1 1 2
ANM08 - Improve the plant diversity and structure of non-cropped areas for wildlife food and habitat 5 4 9
ANM09 - Grazing management to improve wildlife habitat --b 1 1
ANM10 - Harvest hay in a manner that allows wildlife to flush and escape 1 1 2
ANM12 - Shallow water habitat 2 --b 2
ANM14 - Riparian forest buffer, terrestrial and aquatic wildlife habitat 1 --b 1
ANM15 - Forest stand improvement for habitat and soil quality 6 1 7
ANM17 - Monitoring nutritional status of livestock using the NUTBAL PRO System --b 1 1
ANM18 - Retrofit watering facility for wildlife escape 4 3 7
ANM19 - Wildlife corridors --b 1 1
ANM21 - Prairie Restoration for Grazing and Wildlife Habitat 1 --b 1
ANM24 - Forest Wildlife Structures --b 4 4
ANM25 - Stockpiling Forages to Extend the Grazing Season --b 2 2
ANM26 - Managing Calving to Coincide with Forage Availability --b 2 2
BCR01 - Crop Technology Bundle #1 --b 1 1
BCR03 - Crop Technology Bundle #3 --b 1 1
BPA01 - Pasture Grazing Bundle #1 --b 1 1
CCR99 - Resource-Conserving Crop Rotation 25 1 26
ENR01 - Fuel use reduction for field operations 6 --b 6
ENR02 - Solar powered electric fence charging systems 6 --b 6

CStP FY2010_Appendix_Modified_Final_2-14-2012.docx
141
Table A 19. CSP Individual Enhancements and Practices by Ranking Period and by State, FY 2010
State/Conservation Activity CSP-2010-1 CSP-2010-2a Total
a
ENR03 - Pumping plant powered by renewable energy 1 --b 1
ENR04 - Recycle 100% of farm lubricants 76 --b 76
ENR05 - Locally grown and marketed farm products 1 7 8
FRD01 - On Farm Research and Demonstrations 3 1 4
PLT01 - Establish pollinator habitat 5 13 18
PLT02 - Monitor key grazing areas to improve grazing management 4 --b 4
PLT06 - Renovation of a windbreak or shelter belt, or hedgerow for wildlife habitat --b 4 4
PLT07 - Hardwood Crop Tree Release 4 --b 4
PLT10 - Intensive Management of Rotational Grazing 1 2 3
SOE01 - Continuous no till with high residue 10 11 21
SQL01 - Controlled traffic system 7 1 8
SQL02 - Continuous cover crops 6 8 14
SQL03 - Drainage water management for nutrient, pathogen, or pesticide reduction 1 --b 1
SQL04 - Use of Cover Crop Mixes 14 17 31
SQL05 - Use deep rooted crops to breakup soil compaction 8 19 27
SQL07 - Forest Stand Improvement for Soil Quality --b 3 3
WQL01 - Biological suppression and other non-chemical techniques to manage brush, weeds, invasive species --b 1 1
WQL02 - Biological suppression and other non-chemical techniques to manage herbaceous weeds invasive species 1 --b 1
WQL03 - Rotation of supplement and feeding areas 2 3 5
WQL04 - Plant Tissue Testing and Analysis to Improve Nitrogen Management 26 64 90
WQL05 - Apply nutrients no more than 30 days prior to planned planting date 9 --b 9
WQL06 - Apply controlled release nitrogen fertilizer 12 18 30
WQL07 - Split nitrogen applications 50% after crop/pasture emergence/green up 14 9 23
WQL08 - Apply split applications of nitrogen based on a pre-sidedress nitrogen test on cropland 8 8 16
WQL09 - Apply phosphorus fertilizer below soil surface 7 --b 7
WQL10 - Plant an annual grass-type cover crop that will scavenge residual nitrogen 13 20 33
WQL11 - Precision application technology to apply nutrients 14 8 22
WQL12 - Managing livestock access to water bodies/courses 1 1 2
WQL13 - High level Integrated Pest Management to reduce pesticide environmental risk 10 4 14
WQL14 - Land application of only treated manure 1 1 2
WQL15 - Reduce the concentration of nutrients on livestock farms 1 2 3
WQL16 - Use of legume cover crops as a nitrogen source 1 2 3
WQL22 - On Farm Composting of Farm Organic Waste --b 1 1
WQT01 - Irrigation system automation --b 1 1
WQT03 - Irrigation pumping plant evaluation 4 2 6
WQT04 - Regional weather networks for irrigation scheduling --b 2 2
WQT05 - Remote monitoring and notification of irrigation pumping plant operation --b 1 1
IOWA 2,220 2,698 4,918
314 - Brush Management 2 --b 2
328 - Conservation Crop Rotation --b 3 3
329 - Residue and Tillage Management, No-Till/Strip Till/Direct Seed --b 3 3
338 - Prescribed Burning 1 --b 1
340 - Cover Crop --b 2 2
342 - Critical Area Planting 1 5 6
344 - Residue Management, Seasonal --b 1 1
345 - Residue and Tillage Management, Mulch Till 3 4 7
386 - Field Border 2 3 5
393 - Filter Strip --b 4 4
511 - Forage Harvest Management --b 2 2
512 - Forage and Biomass Planting 2 1 3
528 - Prescribed Grazing --b 1 1
612 - Tree/Shrub Establishment 2 --b 2
645 - Upland Wildlife Habitat Management 3 4 7

CStP FY2010_Appendix_Modified_Final_2-14-2012.docx
142
Table A 19. CSP Individual Enhancements and Practices by Ranking Period and by State, FY 2010
State/Conservation Activity CSP-2010-1 CSP-2010-2a Total
a
647 - Early Successional Habitat Development/Management 1 --b 1
650 - Windbreak/Shelterbelt Renovation --b 1 1
666 - Forest Stand Improvement 2 --b 2
AIR01 - Injecting or incorporating manure 26 --b 26
AIR02 - Nitrogen Stabilizers for Air Emissions Control 123 --b 123
AIR03 - Replace burning of prunings and other crop residues with non-burning alternatives 3 --b 3
AIR04 - Use drift reducing nozzles, low pressures, lower boom height and adjuvants to reduce pesticide drift 278 422 700
AIR05 - Dust control on unpaved roads and surfaces 2 --b 2
AIR07 - GPS, targeted spray application (SmartSprayer), or other chemical application electronic control tech 155 239 394
ANM02 - Defer crop production on temporary and seasonal wetlands 1 1 2
ANM03 - Incorporate native grasses and/or legumes into 15% or more of the forage base 50 55 105
ANM04 - Extend existing filter strips for water quality Protection and wildlife habitat 20 31 51
ANM05 - Extending riparian forest buffers for water quality Protection and wildlife habitat 1 --b 1
ANM06 - Extending existing riparian herbaceous cover for water quality Protection and wildlife habitat 1 3 4
ANM07 - Extending existing field borders for water quality Protection and wildlife habitat 14 32 46
ANM08 - Improve the plant diversity and structure of non-cropped areas for wildlife food and habitat 18 22 40
ANM09 - Grazing management to improve wildlife habitat 6 3 9
ANM10 - Harvest hay in a manner that allows wildlife to flush and escape 58 152 210
ANM11 - Patch-burning to enhance wildlife habitat 7 5 12
ANM12 - Shallow water habitat 10 9 19
ANM13 - Non-forested riparian zone enhancement for fish and wildlife 4 --b 4
ANM14 - Riparian forest buffer, terrestrial and aquatic wildlife habitat 3 3 6
ANM15 - Forest stand improvement for habitat and soil quality 6 7 13
ANM16 - Harvesting crops using a stripper header 1 --b 1
ANM17 - Monitoring nutritional status of livestock using the NUTBAL PRO System 2 4 6
ANM18 - Retrofit watering facility for wildlife escape 23 36 59
ANM19 - Wildlife corridors 8 24 32
ANM20 - Silvopasture for wildlife habitat --b 2 2
ANM21 - Prairie Restoration for Grazing and Wildlife Habitat 4 19 23
ANM22 - Restoration and Management of Rare or Declining Habitats 6 9 15
ANM23 - Multi-species Native Perennials for Biomass/Wildlife Habitat 5 9 14
ANM24 - Forest Wildlife Structures --b 4 4
ANM25 - Stockpiling Forages to Extend the Grazing Season --b 6 6
ANM26 - Managing Calving to Coincide with Forage Availability --b 20 20
BCR01 - Crop Technology Bundle #1 --b 41 41
BCR02 - Crop Technology Bundle #2 --b 1 1
BCR03 - Crop Technology Bundle #3 --b 1 1
BFO02 - Forest Bundle #2 --b 4 4
BPA01 - Pasture Grazing Bundle #1 --b 17 17
CCR99 - Resource-Conserving Crop Rotation 36 63 99
ENR01 - Fuel use reduction for field operations 26 --b 26
ENR02 - Solar powered electric fence charging systems 56 --b 56
ENR03 - Pumping plant powered by renewable energy 2 2 4
ENR04 - Recycle 100% of farm lubricants 324 --b 324
ENR05 - Locally grown and marketed farm products 11 9 20
FPP02 - On Farm Pilot Projects 5 --b 5
FRD01 - On Farm Research and Demonstrations 6 3 9
PLT01 - Establish pollinator habitat 23 39 62
PLT02 - Monitor key grazing areas to improve grazing management 24 20 44
PLT03 - Forest stand improvement pre-treating vegetation and fuels 5 4 9
PLT04 - Forest Stand Improvement, Prescribed burning 5 5 10
PLT05 - Multi-story cropping, sustainable management of nontimber forest plants 2 2 4
PLT06 - Renovation of a windbreak or shelter belt, or hedgerow for wildlife habitat 43 64 107

CStP FY2010_Appendix_Modified_Final_2-14-2012.docx
143
Table A 19. CSP Individual Enhancements and Practices by Ranking Period and by State, FY 2010
State/Conservation Activity CSP-2010-1 CSP-2010-2a Total
a
PLT07 - Hardwood Crop Tree Release 3 2 5
PLT08 - Habitat Development for Beneficial Insects for Pest Management 2 3 5
PLT10 - Intensive Management of Rotational Grazing 12 16 28
SOE01 - Continuous no till with high residue 30 61 91
SOE02 - Protection of cultural resources sites with conservation cover --b 1 1
SOE03 - Continuous No Till Organic System 1 --b 1
SQL01 - Controlled traffic system 49 39 88
SQL02 - Continuous cover crops 9 16 25
SQL03 - Drainage water management for nutrient, pathogen, or pesticide reduction 4 1 5
SQL04 - Use of Cover Crop Mixes 14 22 36
SQL05 - Use deep rooted crops to breakup soil compaction 12 13 25
SQL06 - Conversion of cropped land to grass-based agriculture 4 6 10
SQL07 - Forest Stand Improvement for Soil Quality --b 2 2
WQL01 - Biological suppression and other non-chemical techniques to manage brush, weeds, invasive species 9 19 28
WQL02 - Biological suppression and other non-chemical techniques to manage herbaceous weeds invasive species 8 --b 8
WQL03 - Rotation of supplement and feeding areas 53 117 170
WQL04 - Plant Tissue Testing and Analysis to Improve Nitrogen Management 254 483 737
WQL05 - Apply nutrients no more than 30 days prior to planned planting date 30 --b 30
WQL06 - Apply controlled release nitrogen fertilizer 32 60 92
WQL07 - Split nitrogen applications 50% after crop/pasture emergence/green up 52 104 156
WQL08 - Apply split applications of nitrogen based on a pre-sidedress nitrogen test on cropland 19 41 60
WQL09 - Apply phosphorus fertilizer below soil surface 32 --b 32
WQL10 - Plant an annual grass-type cover crop that will scavenge residual nitrogen 19 45 64
WQL11 - Precision application technology to apply nutrients 60 74 134
WQL12 - Managing livestock access to water bodies/courses 9 7 16
WQL13 - High level Integrated Pest Management to reduce pesticide environmental risk 43 94 137
WQL14 - Land application of only treated manure 13 14 27
WQL15 - Reduce the concentration of nutrients on livestock farms 8 13 21
WQL16 - Use of legume cover crops as a nitrogen source 7 5 12
WQL17 - Use of non-chemical methods to kill cover crops 4 5 9
WQL18 - Non- Chemical Pest Control for Livestock 1 --b 1
WQL19 - Transition to Organic Grazing Systems --b 1 1
WQL20 - Transition to Organic Cropping Systems --b 1 1
WQL21 - Integrated Pest Management for Organic Farming. 2 2 4
WQL22 - On Farm Composting of Farm Organic Waste --b 2 2
WQL23 - Provide Livestock Protection Away from Sensitive Areas --b 1 1
WQT02 - Mulching for moisture conservation 1 --b 1
WQT03 - Irrigation pumping plant evaluation 1 2 3
WQT04 - Regional weather networks for irrigation scheduling 1 --b 1
KANSAS 1,690 1,363 3,053
314 - Brush Management 7 --b 7
328 - Conservation Crop Rotation 3 1 4
329 - Residue and Tillage Management, No-Till/Strip Till/Direct Seed 5 --b 5
338 - Prescribed Burning 5 --b 5
342 - Critical Area Planting 2 1 3
344 - Residue Management, Seasonal 1 --b 1
345 - Residue and Tillage Management, Mulch Till 2 --b 2
380 - Windbreak/Shelterbelt Establishment 2 --b 2
511 - Forage Harvest Management --b 1 1
528 - Prescribed Grazing 1 1 2
612 - Tree/Shrub Establishment 1 --b 1
645 - Upland Wildlife Habitat Management 1 6 7
650 - Windbreak/Shelterbelt Renovation 2 --b 2

CStP FY2010_Appendix_Modified_Final_2-14-2012.docx
144
Table A 19. CSP Individual Enhancements and Practices by Ranking Period and by State, FY 2010
State/Conservation Activity CSP-2010-1 CSP-2010-2a Total
a
AIR01 - Injecting or incorporating manure 5 --b 5
AIR02 - Nitrogen Stabilizers for Air Emissions Control 39 --b 39
AIR03 - Replace burning of prunings and other crop residues with non-burning alternatives 2 --b 2
AIR04 - Use drift reducing nozzles, low pressures, lower boom height and adjuvants to reduce pesticide drift 198 218 416
AIR07 - GPS, targeted spray application (SmartSprayer), or other chemical application electronic control tech 100 158 258
ANM02 - Defer crop production on temporary and seasonal wetlands 4 1 5
ANM03 - Incorporate native grasses and/or legumes into 15% or more of the forage base 9 15 24
ANM04 - Extend existing filter strips for water quality Protection and wildlife habitat 10 7 17
ANM05 - Extending riparian forest buffers for water quality Protection and wildlife habitat 3 --b 3
ANM06 - Extending existing riparian herbaceous cover for water quality Protection and wildlife habitat 3 1 4
ANM07 - Extending existing field borders for water quality Protection and wildlife habitat 1 3 4
ANM08 - Improve the plant diversity and structure of non-cropped areas for wildlife food and habitat 4 5 9
ANM09 - Grazing management to improve wildlife habitat 15 11 26
ANM10 - Harvest hay in a manner that allows wildlife to flush and escape 41 61 102
ANM11 - Patch-burning to enhance wildlife habitat 13 13 26
ANM12 - Shallow water habitat 3 1 4
ANM13 - Non-forested riparian zone enhancement for fish and wildlife --b 1 1
ANM14 - Riparian forest buffer, terrestrial and aquatic wildlife habitat 1 --b 1
ANM15 - Forest stand improvement for habitat and soil quality 2 1 3
ANM16 - Harvesting crops using a stripper header 14 --b 14
ANM17 - Monitoring nutritional status of livestock using the NUTBAL PRO System 10 7 17
ANM18 - Retrofit watering facility for wildlife escape 74 126 200
ANM19 - Wildlife corridors 4 4 8
ANM21 - Prairie Restoration for Grazing and Wildlife Habitat 3 5 8
ANM22 - Restoration and Management of Rare or Declining Habitats 2 1 3
ANM23 - Multi-species Native Perennials for Biomass/Wildlife Habitat 1 1 2
ANM24 - Forest Wildlife Structures --b 3 3
ANM25 - Stockpiling Forages to Extend the Grazing Season --b 3 3
ANM26 - Managing Calving to Coincide with Forage Availability --b 7 7
BCR01 - Crop Technology Bundle #1 --b 2 2
BRA01 - Range Grazing Bundle #1 --b 1 1
CCR99 - Resource-Conserving Crop Rotation 91 13 104
ENR01 - Fuel use reduction for field operations 12 --b 12
ENR02 - Solar powered electric fence charging systems 50 --b 50
ENR03 - Pumping plant powered by renewable energy 10 8 18
ENR04 - Recycle 100% of farm lubricants 211 --b 211
ENR05 - Locally grown and marketed farm products 6 --b 6
FRD01 - On Farm Research and Demonstrations 1 --b 1
PLT01 - Establish pollinator habitat 15 28 43
PLT02 - Monitor key grazing areas to improve grazing management 58 68 126
PLT06 - Renovation of a windbreak or shelter belt, or hedgerow for wildlife habitat 5 4 9
PLT08 - Habitat Development for Beneficial Insects for Pest Management 1 --b 1
PLT10 - Intensive Management of Rotational Grazing 6 1 7
SOE01 - Continuous no till with high residue 52 67 119
SOE03 - Continuous No Till Organic System --b 1 1
SQL01 - Controlled traffic system 11 10 21
SQL02 - Continuous cover crops 7 5 12
SQL04 - Use of Cover Crop Mixes 25 24 49
SQL05 - Use deep rooted crops to breakup soil compaction 28 37 65
SQL06 - Conversion of cropped land to grass-based agriculture 8 5 13
SQL07 - Forest Stand Improvement for Soil Quality --b 1 1
WQL01 - Biological suppression and other non-chemical techniques to manage brush, weeds, invasive species 3 2 5
WQL02 - Biological suppression and other non-chemical techniques to manage herbaceous weeds invasive species 2 --b 2

CStP FY2010_Appendix_Modified_Final_2-14-2012.docx
145
Table A 19. CSP Individual Enhancements and Practices by Ranking Period and by State, FY 2010
State/Conservation Activity CSP-2010-1 CSP-2010-2a Total
a
WQL03 - Rotation of supplement and feeding areas 95 145 240
WQL04 - Plant Tissue Testing and Analysis to Improve Nitrogen Management 54 20 74
WQL05 - Apply nutrients no more than 30 days prior to planned planting date 62 --b 62
WQL06 - Apply controlled release nitrogen fertilizer 14 40 54
WQL07 - Split nitrogen applications 50% after crop/pasture emergence/green up 64 57 121
WQL08 - Apply split applications of nitrogen based on a pre-sidedress nitrogen test on cropland 2 6 8
WQL09 - Apply phosphorus fertilizer below soil surface 63 --b 63
WQL10 - Plant an annual grass-type cover crop that will scavenge residual nitrogen 7 7 14
WQL11 - Precision application technology to apply nutrients 24 24 48
WQL12 - Managing livestock access to water bodies/courses 4 9 13
WQL13 - High level Integrated Pest Management to reduce pesticide environmental risk 58 17 75
WQL14 - Land application of only treated manure 8 15 23
WQL16 - Use of legume cover crops as a nitrogen source 2 --b 2
WQL17 - Use of non-chemical methods to kill cover crops 2 3 5
WQL18 - Non- Chemical Pest Control for Livestock 2 --b 2
WQL19 - Transition to Organic Grazing Systems 1 --b 1
WQL20 - Transition to Organic Cropping Systems 1 --b 1
WQT01 - Irrigation system automation 1 4 5
WQT03 - Irrigation pumping plant evaluation 10 25 35
WQT04 - Regional weather networks for irrigation scheduling 12 18 30
WQT05 - Remote monitoring and notification of irrigation pumping plant operation 9 33 42
KENTUCKY 191 231 422
AIR01 - Injecting or incorporating manure 1 --b 1
AIR02 - Nitrogen Stabilizers for Air Emissions Control 6 --b 6
AIR04 - Use drift reducing nozzles, low pressures, lower boom height and adjuvants to reduce pesticide drift 7 9 16
AIR05 - Dust control on unpaved roads and surfaces 1 --b 1
AIR07 - GPS, targeted spray application (SmartSprayer), or other chemical application electronic control tech 2 5 7
ANM03 - Incorporate native grasses and/or legumes into 15% or more of the forage base 3 8 11
ANM08 - Improve the plant diversity and structure of non-cropped areas for wildlife food and habitat 2 15 17
ANM09 - Grazing management to improve wildlife habitat 1 --b 1
ANM10 - Harvest hay in a manner that allows wildlife to flush and escape 6 24 30
ANM12 - Shallow water habitat 12 6 18
ANM13 - Non-forested riparian zone enhancement for fish and wildlife 1 2 3
ANM14 - Riparian forest buffer, terrestrial and aquatic wildlife habitat 1 1 2
ANM15 - Forest stand improvement for habitat and soil quality 10 11 21
ANM17 - Monitoring nutritional status of livestock using the NUTBAL PRO System 2 --b 2
ANM18 - Retrofit watering facility for wildlife escape 3 10 13
ANM19 - Wildlife corridors --b 1 1
ANM22 - Restoration and Management of Rare or Declining Habitats --b 1 1
ANM23 - Multi-species Native Perennials for Biomass/Wildlife Habitat 1 --b 1
ANM24 - Forest Wildlife Structures --b 13 13
ANM25 - Stockpiling Forages to Extend the Grazing Season --b 6 6
ANM26 - Managing Calving to Coincide with Forage Availability --b 8 8
BCR01 - Crop Technology Bundle #1 --b 3 3
BFO02 - Forest Bundle #2 --b 1 1
CCR99 - Resource-Conserving Crop Rotation 1 1 2
ENR02 - Solar powered electric fence charging systems 12 --b 12
ENR03 - Pumping plant powered by renewable energy 1 1 2
ENR04 - Recycle 100% of farm lubricants 48 --b 48
ENR05 - Locally grown and marketed farm products 2 6 8
PLT01 - Establish pollinator habitat 6 14 20
PLT02 - Monitor key grazing areas to improve grazing management 16 6 22
PLT05 - Multi-story cropping, sustainable management of nontimber forest plants 1 1 2

CStP FY2010_Appendix_Modified_Final_2-14-2012.docx
146
Table A 19. CSP Individual Enhancements and Practices by Ranking Period and by State, FY 2010
State/Conservation Activity CSP-2010-1 CSP-2010-2a Total
a
PLT07 - Hardwood Crop Tree Release 8 8 16
PLT10 - Intensive Management of Rotational Grazing 3 3 6
PLT12 - Patch Harvesting --b 2 2
SOE01 - Continuous no till with high residue 2 --b 2
SQL02 - Continuous cover crops 1 6 7
SQL04 - Use of Cover Crop Mixes 1 3 4
SQL05 - Use deep rooted crops to breakup soil compaction 1 1 2
SQL07 - Forest Stand Improvement for Soil Quality --b 1 1
WQL01 - Biological suppression and other non-chemical techniques to manage brush, weeds, invasive species 1 --b 1
WQL02 - Biological suppression and other non-chemical techniques to manage herbaceous weeds invasive species 1 --b 1
WQL03 - Rotation of supplement and feeding areas 3 8 11
WQL04 - Plant Tissue Testing and Analysis to Improve Nitrogen Management 2 3 5
WQL05 - Apply nutrients no more than 30 days prior to planned planting date 2 --b 2
WQL06 - Apply controlled release nitrogen fertilizer 5 24 29
WQL07 - Split nitrogen applications 50% after crop/pasture emergence/green up 4 11 15
WQL08 - Apply split applications of nitrogen based on a pre-sidedress nitrogen test on cropland 1 --b 1
WQL09 - Apply phosphorus fertilizer below soil surface 1 --b 1
WQL10 - Plant an annual grass-type cover crop that will scavenge residual nitrogen 1 2 3
WQL11 - Precision application technology to apply nutrients 2 2 4
WQL12 - Managing livestock access to water bodies/courses 4 4 8
WQL13 - High level Integrated Pest Management to reduce pesticide environmental risk 1 --b 1
WQL15 - Reduce the concentration of nutrients on livestock farms 1 --b 1
LOUISIANA 872 622 1,494
314 - Brush Management 6 --b 6
328 - Conservation Crop Rotation 12 4 16
338 - Prescribed Burning 2 --b 2
340 - Cover Crop 3 2 5
342 - Critical Area Planting 1 --b 1
344 - Residue Management, Seasonal 15 7 22
383 - Fuel Break 1 1 2
386 - Field Border 1 2 3
390 - Riparian Herbaceous Cover --b 1 1
393 - Filter Strip --b 1 1
394 - Firebreak 8 4 12
395 - Stream Habitat Improvement and Management 2 --b 2
449 - Irrigation Water Management 8 3 11
511 - Forage Harvest Management 1 1 2
512 - Forage and Biomass Planting 1 1 2
528 - Prescribed Grazing 14 2 16
612 - Tree/Shrub Establishment 3 1 4
643 - Restoration and Management of Rare and Declining Habitats 3 --b 3
644 - Wetland Wildlife Habitat Management 13 2 15
645 - Upland Wildlife Habitat Management 23 7 30
647 - Early Successional Habitat Development/Management 4 2 6
655 - Forest Trails and Landings 1 2 3
666 - Forest Stand Improvement 7 3 10
722 - Road/Landing Removal 1 --b 1
AIR01 - Injecting or incorporating manure 1 --b 1
AIR02 - Nitrogen Stabilizers for Air Emissions Control 21 --b 21
AIR03 - Replace burning of prunings and other crop residues with non-burning alternatives 2 1 3
AIR04 - Use drift reducing nozzles, low pressures, lower boom height and adjuvants to reduce pesticide drift 70 71 141
AIR05 - Dust control on unpaved roads and surfaces 2 --b 2
AIR07 - GPS, targeted spray application (SmartSprayer), or other chemical application electronic control tech 25 42 67

CStP FY2010_Appendix_Modified_Final_2-14-2012.docx
147
Table A 19. CSP Individual Enhancements and Practices by Ranking Period and by State, FY 2010
State/Conservation Activity CSP-2010-1 CSP-2010-2a Total
a
ANM01 - Drainage water management for seasonal wildlife habitat 25 35 60
ANM02 - Defer crop production on temporary and seasonal wetlands 4 1 5
ANM03 - Incorporate native grasses and/or legumes into 15% or more of the forage base 4 11 15
ANM04 - Extend existing filter strips for water quality Protection and wildlife habitat 1 1 2
ANM05 - Extending riparian forest buffers for water quality Protection and wildlife habitat 2 3 5
ANM06 - Extending existing riparian herbaceous cover for water quality Protection and wildlife habitat --b 4 4
ANM07 - Extending existing field borders for water quality Protection and wildlife habitat --b 9 9
ANM08 - Improve the plant diversity and structure of non-cropped areas for wildlife food and habitat 5 4 9
ANM09 - Grazing management to improve wildlife habitat 5 5 10
ANM10 - Harvest hay in a manner that allows wildlife to flush and escape 4 2 6
ANM11 - Patch-burning to enhance wildlife habitat 10 1 11
ANM12 - Shallow water habitat 19 3 22
ANM13 - Non-forested riparian zone enhancement for fish and wildlife 2 1 3
ANM14 - Riparian forest buffer, terrestrial and aquatic wildlife habitat 29 6 35
ANM15 - Forest stand improvement for habitat and soil quality 17 6 23
ANM16 - Harvesting crops using a stripper header 4 --b 4
ANM17 - Monitoring nutritional status of livestock using the NUTBAL PRO System 2 1 3
ANM18 - Retrofit watering facility for wildlife escape 31 23 54
ANM19 - Wildlife corridors 5 2 7
ANM20 - Silvopasture for wildlife habitat 3 --b 3
ANM21 - Prairie Restoration for Grazing and Wildlife Habitat 4 --b 4
ANM22 - Restoration and Management of Rare or Declining Habitats 12 2 14
ANM23 - Multi-species Native Perennials for Biomass/Wildlife Habitat 1 1 2
ANM24 - Forest Wildlife Structures --b 12 12
ANM25 - Stockpiling Forages to Extend the Grazing Season --b 3 3
ANM26 - Managing Calving to Coincide with Forage Availability --b 8 8
BCR01 - Crop Technology Bundle #1 --b 1 1
CCR99 - Resource-Conserving Crop Rotation 17 4 21
ENR01 - Fuel use reduction for field operations 4 --b 4
ENR02 - Solar powered electric fence charging systems 3 --b 3
ENR03 - Pumping plant powered by renewable energy --b 1 1
ENR04 - Recycle 100% of farm lubricants 126 --b 126
ENR05 - Locally grown and marketed farm products 23 6 29
PLT01 - Establish pollinator habitat 14 12 26
PLT02 - Monitor key grazing areas to improve grazing management 22 10 32
PLT03 - Forest stand improvement pre-treating vegetation and fuels 1 3 4
PLT04 - Forest Stand Improvement, Prescribed burning 6 6 12
PLT05 - Multi-story cropping, sustainable management of nontimber forest plants 2 1 3
PLT07 - Hardwood Crop Tree Release 4 --b 4
PLT08 - Habitat Development for Beneficial Insects for Pest Management 1 --b 1
PLT10 - Intensive Management of Rotational Grazing 16 7 23
PLT12 - Patch Harvesting --b 1 1
SOE01 - Continuous no till with high residue 3 6 9
SOE02 - Protection of cultural resources sites with conservation cover 5 1 6
SQL01 - Controlled traffic system 1 21 22
SQL02 - Continuous cover crops 3 6 9
SQL03 - Drainage water management for nutrient, pathogen, or pesticide reduction 4 --b 4
SQL04 - Use of Cover Crop Mixes 1 1 2
SQL05 - Use deep rooted crops to breakup soil compaction 2 1 3
SQL07 - Forest Stand Improvement for Soil Quality --b 5 5
WQL01 - Biological suppression and other non-chemical techniques to manage brush, weeds, invasive species 2 5 7
WQL02 - Biological suppression and other non-chemical techniques to manage herbaceous weeds invasive species 3 --b 3
WQL03 - Rotation of supplement and feeding areas 32 21 53

CStP FY2010_Appendix_Modified_Final_2-14-2012.docx
148
Table A 19. CSP Individual Enhancements and Practices by Ranking Period and by State, FY 2010
State/Conservation Activity CSP-2010-1 CSP-2010-2a Total
a
WQL04 - Plant Tissue Testing and Analysis to Improve Nitrogen Management 3 7 10
WQL05 - Apply nutrients no more than 30 days prior to planned planting date 20 --b 20
WQL06 - Apply controlled release nitrogen fertilizer 4 41 45
WQL07 - Split nitrogen applications 50% after crop/pasture emergence/green up 27 52 79
WQL08 - Apply split applications of nitrogen based on a pre-sidedress nitrogen test on cropland 1 3 4
WQL09 - Apply phosphorus fertilizer below soil surface 6 --b 6
WQL10 - Plant an annual grass-type cover crop that will scavenge residual nitrogen 3 --b 3
WQL11 - Precision application technology to apply nutrients 14 25 39
WQL12 - Managing livestock access to water bodies/courses 5 --b 5
WQL13 - High level Integrated Pest Management to reduce pesticide environmental risk 23 19 42
WQL14 - Land application of only treated manure 2 --b 2
WQL15 - Reduce the concentration of nutrients on livestock farms 1 --b 1
WQL16 - Use of legume cover crops as a nitrogen source 3 1 4
WQL17 - Use of non-chemical methods to kill cover crops 2 --b 2
WQL18 - Non- Chemical Pest Control for Livestock 4 1 5
WQL19 - Transition to Organic Grazing Systems 2 --b 2
WQL21 - Integrated Pest Management for Organic Farming. 2 --b 2
WQT03 - Irrigation pumping plant evaluation 9 37 46
WQT04 - Regional weather networks for irrigation scheduling 6 8 14
WQT05 - Remote monitoring and notification of irrigation pumping plant operation --b 5 5
MAINE 144 153 297
314 - Brush Management 3 --b 3
512 - Forage and Biomass Planting --b 1 1
645 - Upland Wildlife Habitat Management 1 --b 1
660 - Tree/Shrub Pruning 1 --b 1
AIR01 - Injecting or incorporating manure 1 --b 1
AIR03 - Replace burning of prunings and other crop residues with non-burning alternatives 1 3 4
AIR04 - Use drift reducing nozzles, low pressures, lower boom height and adjuvants to reduce pesticide drift 1 5 6
AIR07 - GPS, targeted spray application (SmartSprayer), or other chemical application electronic control tech 2 2 4
ANM03 - Incorporate native grasses and/or legumes into 15% or more of the forage base 2 2 4
ANM07 - Extending existing field borders for water quality Protection and wildlife habitat 1 --b 1
ANM08 - Improve the plant diversity and structure of non-cropped areas for wildlife food and habitat 1 3 4
ANM09 - Grazing management to improve wildlife habitat --b 2 2
ANM10 - Harvest hay in a manner that allows wildlife to flush and escape 7 4 11
ANM14 - Riparian forest buffer, terrestrial and aquatic wildlife habitat 8 3 11
ANM15 - Forest stand improvement for habitat and soil quality 25 13 38
ANM17 - Monitoring nutritional status of livestock using the NUTBAL PRO System --b 1 1
ANM18 - Retrofit watering facility for wildlife escape 4 --b 4
ANM19 - Wildlife corridors 4 3 7
ANM20 - Silvopasture for wildlife habitat --b 1 1
ANM24 - Forest Wildlife Structures --b 16 16
ANM25 - Stockpiling Forages to Extend the Grazing Season --b 2 2
ANM26 - Managing Calving to Coincide with Forage Availability --b 1 1
CCR99 - Resource-Conserving Crop Rotation 5 1 6
ENR01 - Fuel use reduction for field operations 1 --b 1
ENR02 - Solar powered electric fence charging systems 3 --b 3
ENR03 - Pumping plant powered by renewable energy 1 1 2
ENR04 - Recycle 100% of farm lubricants 5 --b 5
ENR05 - Locally grown and marketed farm products 5 10 15
PLT01 - Establish pollinator habitat 5 8 13
PLT02 - Monitor key grazing areas to improve grazing management 4 3 7
PLT05 - Multi-story cropping, sustainable management of nontimber forest plants 2 3 5
PLT06 - Renovation of a windbreak or shelter belt, or hedgerow for wildlife habitat 2 --b 2
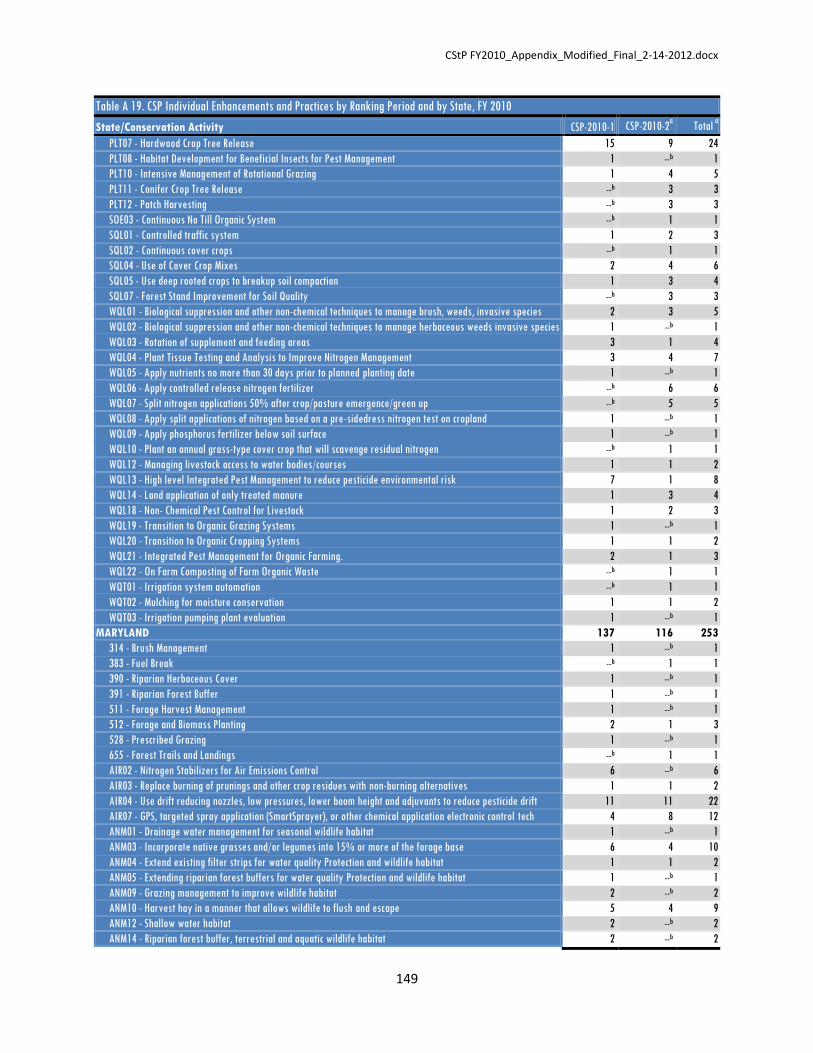
CStP FY2010_Appendix_Modified_Final_2-14-2012.docx
149
Table A 19. CSP Individual Enhancements and Practices by Ranking Period and by State, FY 2010
State/Conservation Activity CSP-2010-1 CSP-2010-2a Total
a
PLT07 - Hardwood Crop Tree Release 15 9 24
PLT08 - Habitat Development for Beneficial Insects for Pest Management 1 --b 1
PLT10 - Intensive Management of Rotational Grazing 1 4 5
PLT11 - Conifer Crop Tree Release --b 3 3
PLT12 - Patch Harvesting --b 3 3
SOE03 - Continuous No Till Organic System --b 1 1
SQL01 - Controlled traffic system 1 2 3
SQL02 - Continuous cover crops --b 1 1
SQL04 - Use of Cover Crop Mixes 2 4 6
SQL05 - Use deep rooted crops to breakup soil compaction 1 3 4
SQL07 - Forest Stand Improvement for Soil Quality --b 3 3
WQL01 - Biological suppression and other non-chemical techniques to manage brush, weeds, invasive species 2 3 5
WQL02 - Biological suppression and other non-chemical techniques to manage herbaceous weeds invasive species 1 --b 1
WQL03 - Rotation of supplement and feeding areas 3 1 4
WQL04 - Plant Tissue Testing and Analysis to Improve Nitrogen Management 3 4 7
WQL05 - Apply nutrients no more than 30 days prior to planned planting date 1 --b 1
WQL06 - Apply controlled release nitrogen fertilizer --b 6 6
WQL07 - Split nitrogen applications 50% after crop/pasture emergence/green up --b 5 5
WQL08 - Apply split applications of nitrogen based on a pre-sidedress nitrogen test on cropland 1 --b 1
WQL09 - Apply phosphorus fertilizer below soil surface 1 --b 1
WQL10 - Plant an annual grass-type cover crop that will scavenge residual nitrogen --b 1 1
WQL12 - Managing livestock access to water bodies/courses 1 1 2
WQL13 - High level Integrated Pest Management to reduce pesticide environmental risk 7 1 8
WQL14 - Land application of only treated manure 1 3 4
WQL18 - Non- Chemical Pest Control for Livestock 1 2 3
WQL19 - Transition to Organic Grazing Systems 1 --b 1
WQL20 - Transition to Organic Cropping Systems 1 1 2
WQL21 - Integrated Pest Management for Organic Farming. 2 1 3
WQL22 - On Farm Composting of Farm Organic Waste --b 1 1
WQT01 - Irrigation system automation --b 1 1
WQT02 - Mulching for moisture conservation 1 1 2
WQT03 - Irrigation pumping plant evaluation 1 --b 1
MARYLAND 137 116 253
314 - Brush Management 1 --b 1
383 - Fuel Break --b 1 1
390 - Riparian Herbaceous Cover 1 --b 1
391 - Riparian Forest Buffer 1 --b 1
511 - Forage Harvest Management 1 --b 1
512 - Forage and Biomass Planting 2 1 3
528 - Prescribed Grazing 1 --b 1
655 - Forest Trails and Landings --b 1 1
AIR02 - Nitrogen Stabilizers for Air Emissions Control 6 --b 6
AIR03 - Replace burning of prunings and other crop residues with non-burning alternatives 1 1 2
AIR04 - Use drift reducing nozzles, low pressures, lower boom height and adjuvants to reduce pesticide drift 11 11 22
AIR07 - GPS, targeted spray application (SmartSprayer), or other chemical application electronic control tech 4 8 12
ANM01 - Drainage water management for seasonal wildlife habitat 1 --b 1
ANM03 - Incorporate native grasses and/or legumes into 15% or more of the forage base 6 4 10
ANM04 - Extend existing filter strips for water quality Protection and wildlife habitat 1 1 2
ANM05 - Extending riparian forest buffers for water quality Protection and wildlife habitat 1 --b 1
ANM09 - Grazing management to improve wildlife habitat 2 --b 2
ANM10 - Harvest hay in a manner that allows wildlife to flush and escape 5 4 9
ANM12 - Shallow water habitat 2 --b 2
ANM14 - Riparian forest buffer, terrestrial and aquatic wildlife habitat 2 --b 2

CStP FY2010_Appendix_Modified_Final_2-14-2012.docx
150
Table A 19. CSP Individual Enhancements and Practices by Ranking Period and by State, FY 2010
State/Conservation Activity CSP-2010-1 CSP-2010-2a Total
a
ANM15 - Forest stand improvement for habitat and soil quality 8 3 11
ANM17 - Monitoring nutritional status of livestock using the NUTBAL PRO System 1 --b 1
ANM18 - Retrofit watering facility for wildlife escape 3 1 4
ANM19 - Wildlife corridors 1 --b 1
ANM22 - Restoration and Management of Rare or Declining Habitats 1 1 2
ANM24 - Forest Wildlife Structures --b 4 4
ANM26 - Managing Calving to Coincide with Forage Availability --b 1 1
BCR02 - Crop Technology Bundle #2 --b 1 1
CCR99 - Resource-Conserving Crop Rotation 4 2 6
ENR02 - Solar powered electric fence charging systems 5 --b 5
ENR03 - Pumping plant powered by renewable energy 1 --b 1
ENR04 - Recycle 100% of farm lubricants 9 --b 9
ENR05 - Locally grown and marketed farm products 5 3 8
PLT01 - Establish pollinator habitat 3 1 4
PLT02 - Monitor key grazing areas to improve grazing management 3 1 4
PLT04 - Forest Stand Improvement, Prescribed burning 1 --b 1
PLT05 - Multi-story cropping, sustainable management of nontimber forest plants --b 1 1
PLT06 - Renovation of a windbreak or shelter belt, or hedgerow for wildlife habitat 1 --b 1
PLT07 - Hardwood Crop Tree Release 1 --b 1
PLT10 - Intensive Management of Rotational Grazing 3 1 4
SOE01 - Continuous no till with high residue --b 8 8
SOE02 - Protection of cultural resources sites with conservation cover 1 --b 1
SQL01 - Controlled traffic system 1 --b 1
SQL02 - Continuous cover crops 2 4 6
SQL03 - Drainage water management for nutrient, pathogen, or pesticide reduction --b 1 1
SQL04 - Use of Cover Crop Mixes --b 5 5
SQL05 - Use deep rooted crops to breakup soil compaction 3 5 8
WQL03 - Rotation of supplement and feeding areas 2 4 6
WQL04 - Plant Tissue Testing and Analysis to Improve Nitrogen Management 6 10 16
WQL05 - Apply nutrients no more than 30 days prior to planned planting date 4 --b 4
WQL06 - Apply controlled release nitrogen fertilizer 5 14 19
WQL07 - Split nitrogen applications 50% after crop/pasture emergence/green up 1 6 7
WQL08 - Apply split applications of nitrogen based on a pre-sidedress nitrogen test on cropland --b 1 1
WQL10 - Plant an annual grass-type cover crop that will scavenge residual nitrogen --b 3 3
WQL11 - Precision application technology to apply nutrients 2 1 3
WQL12 - Managing livestock access to water bodies/courses 2 --b 2
WQL13 - High level Integrated Pest Management to reduce pesticide environmental risk 1 --b 1
WQL15 - Reduce the concentration of nutrients on livestock farms 1 --b 1
WQL16 - Use of legume cover crops as a nitrogen source 2 1 3
WQL17 - Use of non-chemical methods to kill cover crops 1 1 2
WQL21 - Integrated Pest Management for Organic Farming. 1 --b 1
WQT02 - Mulching for moisture conservation 1 --b 1
WQT03 - Irrigation pumping plant evaluation 1 --b 1
WQT05 - Remote monitoring and notification of irrigation pumping plant operation 1 --b 1
MASSACHUSETTS 16 26 42
ANM02 - Defer crop production on temporary and seasonal wetlands --b 1 1
ANM10 - Harvest hay in a manner that allows wildlife to flush and escape --b 2 2
ANM14 - Riparian forest buffer, terrestrial and aquatic wildlife habitat 2 3 5
ANM15 - Forest stand improvement for habitat and soil quality 1 2 3
ANM24 - Forest Wildlife Structures --b 2 2
ENR02 - Solar powered electric fence charging systems 1 --b 1
ENR04 - Recycle 100% of farm lubricants 6 --b 6
ENR05 - Locally grown and marketed farm products --b 1 1

CStP FY2010_Appendix_Modified_Final_2-14-2012.docx
151
Table A 19. CSP Individual Enhancements and Practices by Ranking Period and by State, FY 2010
State/Conservation Activity CSP-2010-1 CSP-2010-2a Total
a
PLT01 - Establish pollinator habitat --b 2 2
PLT02 - Monitor key grazing areas to improve grazing management 2 1 3
PLT07 - Hardwood Crop Tree Release --b 1 1
PLT10 - Intensive Management of Rotational Grazing --b 1 1
SQL02 - Continuous cover crops 1 1 2
SQL04 - Use of Cover Crop Mixes --b 1 1
WQL04 - Plant Tissue Testing and Analysis to Improve Nitrogen Management 1 --b 1
WQL06 - Apply controlled release nitrogen fertilizer --b 1 1
WQL07 - Split nitrogen applications 50% after crop/pasture emergence/green up --b 1 1
WQL08 - Apply split applications of nitrogen based on a pre-sidedress nitrogen test on cropland --b 1 1
WQL12 - Managing livestock access to water bodies/courses 2 1 3
WQL14 - Land application of only treated manure --b 1 1
WQL15 - Reduce the concentration of nutrients on livestock farms --b 1 1
WQL16 - Use of legume cover crops as a nitrogen source --b 1 1
WQL22 - On Farm Composting of Farm Organic Waste --b 1 1
MICHIGAN 827 767 1,594
314 - Brush Management 9 2 11
328 - Conservation Crop Rotation --b 2 2
329 - Residue and Tillage Management, No-Till/Strip Till/Direct Seed 1 1 2
338 - Prescribed Burning --b 1 1
340 - Cover Crop 6 2 8
342 - Critical Area Planting 4 2 6
344 - Residue Management, Seasonal --b 1 1
345 - Residue and Tillage Management, Mulch Till 1 2 3
380 - Windbreak/Shelterbelt Establishment --b 2 2
383 - Fuel Break 1 --b 1
384 - Forest Slash Treatment 1 --b 1
386 - Field Border 3 2 5
390 - Riparian Herbaceous Cover --b 1 1
391 - Riparian Forest Buffer --b 1 1
393 - Filter Strip 3 1 4
395 - Stream Habitat Improvement and Management --b 1 1
511 - Forage Harvest Management 1 2 3
512 - Forage and Biomass Planting 2 3 5
528 - Prescribed Grazing 1 1 2
612 - Tree/Shrub Establishment 30 11 41
644 - Wetland Wildlife Habitat Management 21 28 49
645 - Upland Wildlife Habitat Management 34 20 54
647 - Early Successional Habitat Development/Management 4 4 8
655 - Forest Trails and Landings 2 2 4
660 - Tree/Shrub Pruning 2 1 3
666 - Forest Stand Improvement 20 4 24
AIR01 - Injecting or incorporating manure 6 --b 6
AIR02 - Nitrogen Stabilizers for Air Emissions Control 6 --b 6
AIR03 - Replace burning of prunings and other crop residues with non-burning alternatives 3 3 6
AIR04 - Use drift reducing nozzles, low pressures, lower boom height and adjuvants to reduce pesticide drift 33 59 92
AIR05 - Dust control on unpaved roads and surfaces 3 --b 3
AIR07 - GPS, targeted spray application (SmartSprayer), or other chemical application electronic control tech 26 33 59
ANM01 - Drainage water management for seasonal wildlife habitat 1 --b 1
ANM02 - Defer crop production on temporary and seasonal wetlands 1 1 2
ANM03 - Incorporate native grasses and/or legumes into 15% or more of the forage base 3 3 6
ANM04 - Extend existing filter strips for water quality Protection and wildlife habitat 6 9 15
ANM06 - Extending existing riparian herbaceous cover for water quality Protection and wildlife habitat 1 3 4

CStP FY2010_Appendix_Modified_Final_2-14-2012.docx
152
Table A 19. CSP Individual Enhancements and Practices by Ranking Period and by State, FY 2010
State/Conservation Activity CSP-2010-1 CSP-2010-2a Total
a
ANM07 - Extending existing field borders for water quality Protection and wildlife habitat 3 11 14
ANM08 - Improve the plant diversity and structure of non-cropped areas for wildlife food and habitat 7 5 12
ANM09 - Grazing management to improve wildlife habitat 1 --b 1
ANM10 - Harvest hay in a manner that allows wildlife to flush and escape 19 21 40
ANM11 - Patch-burning to enhance wildlife habitat --b 1 1
ANM12 - Shallow water habitat 5 6 11
ANM14 - Riparian forest buffer, terrestrial and aquatic wildlife habitat 42 61 103
ANM15 - Forest stand improvement for habitat and soil quality 86 74 160
ANM16 - Harvesting crops using a stripper header 4 --b 4
ANM17 - Monitoring nutritional status of livestock using the NUTBAL PRO System 1 1 2
ANM18 - Retrofit watering facility for wildlife escape 5 3 8
ANM19 - Wildlife corridors 13 14 27
ANM22 - Restoration and Management of Rare or Declining Habitats 1 --b 1
ANM24 - Forest Wildlife Structures --b 61 61
ANM25 - Stockpiling Forages to Extend the Grazing Season --b 3 3
ANM26 - Managing Calving to Coincide with Forage Availability --b 1 1
BCR01 - Crop Technology Bundle #1 --b 3 3
CCR99 - Resource-Conserving Crop Rotation 19 4 23
ENR01 - Fuel use reduction for field operations 5 --b 5
ENR02 - Solar powered electric fence charging systems 5 --b 5
ENR03 - Pumping plant powered by renewable energy 2 --b 2
ENR04 - Recycle 100% of farm lubricants 45 --b 45
ENR05 - Locally grown and marketed farm products 11 11 22
PLT01 - Establish pollinator habitat 9 9 18
PLT02 - Monitor key grazing areas to improve grazing management 8 3 11
PLT05 - Multi-story cropping, sustainable management of nontimber forest plants --b 5 5
PLT06 - Renovation of a windbreak or shelter belt, or hedgerow for wildlife habitat 6 9 15
PLT07 - Hardwood Crop Tree Release 55 18 73
PLT08 - Habitat Development for Beneficial Insects for Pest Management 4 1 5
PLT10 - Intensive Management of Rotational Grazing 3 3 6
PLT11 - Conifer Crop Tree Release --b 3 3
PLT12 - Patch Harvesting --b 5 5
SOE01 - Continuous no till with high residue 10 5 15
SOE03 - Continuous No Till Organic System 1 --b 1
SQL01 - Controlled traffic system 9 7 16
SQL02 - Continuous cover crops 11 1 12
SQL03 - Drainage water management for nutrient, pathogen, or pesticide reduction 3 --b 3
SQL04 - Use of Cover Crop Mixes 5 9 14
SQL05 - Use deep rooted crops to breakup soil compaction 7 9 16
SQL07 - Forest Stand Improvement for Soil Quality --b 5 5
WQL01 - Biological suppression and other non-chemical techniques to manage brush, weeds, invasive species 2 --b 2
WQL02 - Biological suppression and other non-chemical techniques to manage herbaceous weeds invasive species 2 --b 2
WQL03 - Rotation of supplement and feeding areas 6 5 11
WQL04 - Plant Tissue Testing and Analysis to Improve Nitrogen Management 34 55 89
WQL05 - Apply nutrients no more than 30 days prior to planned planting date 21 --b 21
WQL06 - Apply controlled release nitrogen fertilizer 27 27 54
WQL07 - Split nitrogen applications 50% after crop/pasture emergence/green up 13 15 28
WQL08 - Apply split applications of nitrogen based on a pre-sidedress nitrogen test on cropland 1 16 17
WQL09 - Apply phosphorus fertilizer below soil surface 12 --b 12
WQL10 - Plant an annual grass-type cover crop that will scavenge residual nitrogen 10 17 27
WQL11 - Precision application technology to apply nutrients 13 16 29
WQL12 - Managing livestock access to water bodies/courses 2 3 5
WQL13 - High level Integrated Pest Management to reduce pesticide environmental risk 13 10 23

CStP FY2010_Appendix_Modified_Final_2-14-2012.docx
153
Table A 19. CSP Individual Enhancements and Practices by Ranking Period and by State, FY 2010
State/Conservation Activity CSP-2010-1 CSP-2010-2a Total
a
WQL14 - Land application of only treated manure 5 --b 5
WQL15 - Reduce the concentration of nutrients on livestock farms 3 2 5
WQL16 - Use of legume cover crops as a nitrogen source 6 9 15
WQL17 - Use of non-chemical methods to kill cover crops 3 1 4
WQL18 - Non- Chemical Pest Control for Livestock 1 --b 1
WQL20 - Transition to Organic Cropping Systems 1 1 2
WQL21 - Integrated Pest Management for Organic Farming. 4 1 5
WQT01 - Irrigation system automation --b 1 1
WQT03 - Irrigation pumping plant evaluation 5 3 8
WQT04 - Regional weather networks for irrigation scheduling 2 2 4
WQT05 - Remote monitoring and notification of irrigation pumping plant operation 1 3 4
MINNESOTA 2,873 3,090 5,963
314 - Brush Management 4 --b 4
328 - Conservation Crop Rotation 1 --b 1
329 - Residue and Tillage Management, No-Till/Strip Till/Direct Seed 7 1 8
342 - Critical Area Planting 2 --b 2
345 - Residue and Tillage Management, Mulch Till 2 1 3
380 - Windbreak/Shelterbelt Establishment 4 3 7
386 - Field Border 1 5 6
393 - Filter Strip 1 3 4
394 - Firebreak 1 1 2
395 - Stream Habitat Improvement and Management 1 --b 1
449 - Irrigation Water Management --b 3 3
512 - Forage and Biomass Planting 4 --b 4
528 - Prescribed Grazing 1 --b 1
612 - Tree/Shrub Establishment 21 12 33
644 - Wetland Wildlife Habitat Management 1 1 2
645 - Upland Wildlife Habitat Management 8 1 9
647 - Early Successional Habitat Development/Management 1 2 3
650 - Windbreak/Shelterbelt Renovation 1 --b 1
655 - Forest Trails and Landings 7 1 8
660 - Tree/Shrub Pruning 1 --b 1
666 - Forest Stand Improvement 9 2 11
AIR01 - Injecting or incorporating manure 43 --b 43
AIR02 - Nitrogen Stabilizers for Air Emissions Control 54 --b 54
AIR03 - Replace burning of prunings and other crop residues with non-burning alternatives 4 3 7
AIR04 - Use drift reducing nozzles, low pressures, lower boom height and adjuvants to reduce pesticide drift 273 406 679
AIR05 - Dust control on unpaved roads and surfaces 11 --b 11
AIR07 - GPS, targeted spray application (SmartSprayer), or other chemical application electronic control tech 140 281 421
ANM01 - Drainage water management for seasonal wildlife habitat 1 1 2
ANM02 - Defer crop production on temporary and seasonal wetlands 3 4 7
ANM03 - Incorporate native grasses and/or legumes into 15% or more of the forage base 40 25 65
ANM04 - Extend existing filter strips for water quality Protection and wildlife habitat 17 22 39
ANM05 - Extending riparian forest buffers for water quality Protection and wildlife habitat 1 1 2
ANM06 - Extending existing riparian herbaceous cover for water quality Protection and wildlife habitat 2 7 9
ANM07 - Extending existing field borders for water quality Protection and wildlife habitat 2 5 7
ANM08 - Improve the plant diversity and structure of non-cropped areas for wildlife food and habitat 32 18 50
ANM09 - Grazing management to improve wildlife habitat 9 18 27
ANM10 - Harvest hay in a manner that allows wildlife to flush and escape 136 217 353
ANM11 - Patch-burning to enhance wildlife habitat 13 18 31
ANM12 - Shallow water habitat 28 35 63
ANM13 - Non-forested riparian zone enhancement for fish and wildlife --b 1 1
ANM14 - Riparian forest buffer, terrestrial and aquatic wildlife habitat 28 25 53

CStP FY2010_Appendix_Modified_Final_2-14-2012.docx
154
Table A 19. CSP Individual Enhancements and Practices by Ranking Period and by State, FY 2010
State/Conservation Activity CSP-2010-1 CSP-2010-2a Total
a
ANM15 - Forest stand improvement for habitat and soil quality 155 122 277
ANM16 - Harvesting crops using a stripper header 3 --b 3
ANM17 - Monitoring nutritional status of livestock using the NUTBAL PRO System 5 5 10
ANM18 - Retrofit watering facility for wildlife escape 64 52 116
ANM19 - Wildlife corridors 14 34 48
ANM20 - Silvopasture for wildlife habitat 5 4 9
ANM21 - Prairie Restoration for Grazing and Wildlife Habitat 1 5 6
ANM22 - Restoration and Management of Rare or Declining Habitats 13 15 28
ANM23 - Multi-species Native Perennials for Biomass/Wildlife Habitat 3 1 4
ANM24 - Forest Wildlife Structures --b 122 122
ANM25 - Stockpiling Forages to Extend the Grazing Season --b 6 6
ANM26 - Managing Calving to Coincide with Forage Availability --b 22 22
BCR01 - Crop Technology Bundle #1 --b 16 16
BCR02 - Crop Technology Bundle #2 --b 1 1
BCR03 - Crop Technology Bundle #3 --b 2 2
BFO02 - Forest Bundle #2 --b 5 5
BPA01 - Pasture Grazing Bundle #1 --b 6 6
CCR99 - Resource-Conserving Crop Rotation 50 19 69
ENR01 - Fuel use reduction for field operations 23 --b 23
ENR02 - Solar powered electric fence charging systems 46 --b 46
ENR03 - Pumping plant powered by renewable energy --b 2 2
ENR04 - Recycle 100% of farm lubricants 533 --b 533
ENR05 - Locally grown and marketed farm products 54 22 76
PLT01 - Establish pollinator habitat 97 91 188
PLT02 - Monitor key grazing areas to improve grazing management 23 15 38
PLT03 - Forest stand improvement pre-treating vegetation and fuels 3 --b 3
PLT04 - Forest Stand Improvement, Prescribed burning 13 3 16
PLT05 - Multi-story cropping, sustainable management of nontimber forest plants 10 3 13
PLT06 - Renovation of a windbreak or shelter belt, or hedgerow for wildlife habitat 27 44 71
PLT07 - Hardwood Crop Tree Release 54 30 84
PLT08 - Habitat Development for Beneficial Insects for Pest Management 5 --b 5
PLT10 - Intensive Management of Rotational Grazing 9 12 21
PLT11 - Conifer Crop Tree Release --b 18 18
PLT12 - Patch Harvesting --b 16 16
SOE01 - Continuous no till with high residue 14 13 27
SOE02 - Protection of cultural resources sites with conservation cover 2 --b 2
SQL01 - Controlled traffic system 17 10 27
SQL02 - Continuous cover crops 2 3 5
SQL03 - Drainage water management for nutrient, pathogen, or pesticide reduction 3 3 6
SQL04 - Use of Cover Crop Mixes 8 19 27
SQL05 - Use deep rooted crops to breakup soil compaction 19 39 58
SQL06 - Conversion of cropped land to grass-based agriculture 2 61 63
SQL07 - Forest Stand Improvement for Soil Quality --b 24 24
WQL01 - Biological suppression and other non-chemical techniques to manage brush, weeds, invasive species 3 8 11
WQL02 - Biological suppression and other non-chemical techniques to manage herbaceous weeds invasive species 5 --b 5
WQL03 - Rotation of supplement and feeding areas 81 100 181
WQL04 - Plant Tissue Testing and Analysis to Improve Nitrogen Management 173 324 497
WQL05 - Apply nutrients no more than 30 days prior to planned planting date 51 --b 51
WQL06 - Apply controlled release nitrogen fertilizer 49 86 135
WQL07 - Split nitrogen applications 50% after crop/pasture emergence/green up 53 64 117
WQL08 - Apply split applications of nitrogen based on a pre-sidedress nitrogen test on cropland 15 92 107
WQL09 - Apply phosphorus fertilizer below soil surface 45 --b 45
WQL10 - Plant an annual grass-type cover crop that will scavenge residual nitrogen 7 24 31

CStP FY2010_Appendix_Modified_Final_2-14-2012.docx
155
Table A 19. CSP Individual Enhancements and Practices by Ranking Period and by State, FY 2010
State/Conservation Activity CSP-2010-1 CSP-2010-2a Total
a
WQL11 - Precision application technology to apply nutrients 72 84 156
WQL12 - Managing livestock access to water bodies/courses 4 5 9
WQL13 - High level Integrated Pest Management to reduce pesticide environmental risk 49 184 233
WQL14 - Land application of only treated manure 22 16 38
WQL15 - Reduce the concentration of nutrients on livestock farms 11 47 58
WQL16 - Use of legume cover crops as a nitrogen source 5 4 9
WQL17 - Use of non-chemical methods to kill cover crops 1 6 7
WQL18 - Non- Chemical Pest Control for Livestock 8 6 14
WQL19 - Transition to Organic Grazing Systems --b 2 2
WQL20 - Transition to Organic Cropping Systems 2 3 5
WQL21 - Integrated Pest Management for Organic Farming. 6 4 10
WQL22 - On Farm Composting of Farm Organic Waste --b 6 6
WQL23 - Provide Livestock Protection Away from Sensitive Areas --b 2 2
WQT01 - Irrigation system automation 4 6 10
WQT03 - Irrigation pumping plant evaluation 7 8 15
WQT04 - Regional weather networks for irrigation scheduling 6 18 24
WQT05 - Remote monitoring and notification of irrigation pumping plant operation 2 3 5
MISSISSIPPI 292 686 978
314 - Brush Management 4 2 6
329 - Residue and Tillage Management, No-Till/Strip Till/Direct Seed 1 --b 1
338 - Prescribed Burning --b 1 1
342 - Critical Area Planting 1 --b 1
394 - Firebreak 7 1 8
449 - Irrigation Water Management 4 --b 4
512 - Forage and Biomass Planting 1 --b 1
528 - Prescribed Grazing 1 --b 1
612 - Tree/Shrub Establishment 3 --b 3
643 - Restoration and Management of Rare and Declining Habitats 1 --b 1
644 - Wetland Wildlife Habitat Management 1 --b 1
645 - Upland Wildlife Habitat Management 1 --b 1
647 - Early Successional Habitat Development/Management 1 --b 1
655 - Forest Trails and Landings 2 --b 2
660 - Tree/Shrub Pruning 1 --b 1
666 - Forest Stand Improvement 4 --b 4
AIR01 - Injecting or incorporating manure 1 --b 1
AIR02 - Nitrogen Stabilizers for Air Emissions Control 17 --b 17
AIR04 - Use drift reducing nozzles, low pressures, lower boom height and adjuvants to reduce pesticide drift 22 53 75
AIR07 - GPS, targeted spray application (SmartSprayer), or other chemical application electronic control tech 12 34 46
ANM01 - Drainage water management for seasonal wildlife habitat 8 103 111
ANM02 - Defer crop production on temporary and seasonal wetlands 3 5 8
ANM03 - Incorporate native grasses and/or legumes into 15% or more of the forage base 10 9 19
ANM04 - Extend existing filter strips for water quality Protection and wildlife habitat --b 4 4
ANM07 - Extending existing field borders for water quality Protection and wildlife habitat 1 2 3
ANM08 - Improve the plant diversity and structure of non-cropped areas for wildlife food and habitat 1 3 4
ANM10 - Harvest hay in a manner that allows wildlife to flush and escape 2 7 9
ANM11 - Patch-burning to enhance wildlife habitat 4 3 7
ANM12 - Shallow water habitat 3 6 9
ANM14 - Riparian forest buffer, terrestrial and aquatic wildlife habitat 9 5 14
ANM15 - Forest stand improvement for habitat and soil quality 8 6 14
ANM18 - Retrofit watering facility for wildlife escape 1 4 5
ANM19 - Wildlife corridors --b 27 27
ANM22 - Restoration and Management of Rare or Declining Habitats --b 1 1
ANM24 - Forest Wildlife Structures --b 10 10

CStP FY2010_Appendix_Modified_Final_2-14-2012.docx
156
Table A 19. CSP Individual Enhancements and Practices by Ranking Period and by State, FY 2010
State/Conservation Activity CSP-2010-1 CSP-2010-2a Total
a
ANM25 - Stockpiling Forages to Extend the Grazing Season --b 2 2
ANM26 - Managing Calving to Coincide with Forage Availability --b 6 6
BCR01 - Crop Technology Bundle #1 --b 70 70
BFO01 - SE Pine Forest Bundle #1 --b 4 4
BFO02 - Forest Bundle #2 --b 5 5
BPA01 - Pasture Grazing Bundle #1 --b 1 1
CCR99 - Resource-Conserving Crop Rotation 1 --b 1
ENR02 - Solar powered electric fence charging systems 3 --b 3
ENR04 - Recycle 100% of farm lubricants 81 --b 81
ENR05 - Locally grown and marketed farm products 1 4 5
FRD01 - On Farm Research and Demonstrations --b 1 1
PLT01 - Establish pollinator habitat 4 8 12
PLT02 - Monitor key grazing areas to improve grazing management 2 8 10
PLT03 - Forest stand improvement pre-treating vegetation and fuels 1 --b 1
PLT04 - Forest Stand Improvement, Prescribed burning 15 6 21
PLT07 - Hardwood Crop Tree Release 2 1 3
PLT10 - Intensive Management of Rotational Grazing 2 4 6
SOE01 - Continuous no till with high residue 1 17 18
SQL01 - Controlled traffic system 2 3 5
SQL02 - Continuous cover crops --b 13 13
SQL03 - Drainage water management for nutrient, pathogen, or pesticide reduction --b 4 4
SQL07 - Forest Stand Improvement for Soil Quality --b 13 13
WQL01 - Biological suppression and other non-chemical techniques to manage brush, weeds, invasive species --b 5 5
WQL03 - Rotation of supplement and feeding areas 8 18 26
WQL04 - Plant Tissue Testing and Analysis to Improve Nitrogen Management 1 48 49
WQL06 - Apply controlled release nitrogen fertilizer 2 8 10
WQL07 - Split nitrogen applications 50% after crop/pasture emergence/green up 12 45 57
WQL08 - Apply split applications of nitrogen based on a pre-sidedress nitrogen test on cropland 1 2 3
WQL09 - Apply phosphorus fertilizer below soil surface 2 --b 2
WQL10 - Plant an annual grass-type cover crop that will scavenge residual nitrogen --b 27 27
WQL11 - Precision application technology to apply nutrients 4 26 30
WQL12 - Managing livestock access to water bodies/courses 1 --b 1
WQL13 - High level Integrated Pest Management to reduce pesticide environmental risk 1 46 47
WQL14 - Land application of only treated manure 1 --b 1
WQL15 - Reduce the concentration of nutrients on livestock farms 1 --b 1
WQL16 - Use of legume cover crops as a nitrogen source --b 4 4
WQT04 - Regional weather networks for irrigation scheduling 8 1 9
MISSOURI 2,662 2,442 5,104
329 - Residue and Tillage Management, No-Till/Strip Till/Direct Seed 1 --b 1
338 - Prescribed Burning 1 --b 1
344 - Residue Management, Seasonal --b 1 1
386 - Field Border 1 1 2
449 - Irrigation Water Management 11 39 50
645 - Upland Wildlife Habitat Management 1 --b 1
655 - Forest Trails and Landings 3 --b 3
666 - Forest Stand Improvement 1 --b 1
AIR01 - Injecting or incorporating manure 3 --b 3
AIR02 - Nitrogen Stabilizers for Air Emissions Control 125 --b 125
AIR03 - Replace burning of prunings and other crop residues with non-burning alternatives 1 --b 1
AIR04 - Use drift reducing nozzles, low pressures, lower boom height and adjuvants to reduce pesticide drift 245 281 526
AIR07 - GPS, targeted spray application (SmartSprayer), or other chemical application electronic control tech 101 154 255
ANM01 - Drainage water management for seasonal wildlife habitat 47 9 56
ANM02 - Defer crop production on temporary and seasonal wetlands 2 1 3

CStP FY2010_Appendix_Modified_Final_2-14-2012.docx
157
Table A 19. CSP Individual Enhancements and Practices by Ranking Period and by State, FY 2010
State/Conservation Activity CSP-2010-1 CSP-2010-2a Total
a
ANM03 - Incorporate native grasses and/or legumes into 15% or more of the forage base 71 91 162
ANM04 - Extend existing filter strips for water quality Protection and wildlife habitat 5 7 12
ANM06 - Extending existing riparian herbaceous cover for water quality Protection and wildlife habitat 1 2 3
ANM07 - Extending existing field borders for water quality Protection and wildlife habitat 5 1 6
ANM08 - Improve the plant diversity and structure of non-cropped areas for wildlife food and habitat 52 66 118
ANM09 - Grazing management to improve wildlife habitat 21 12 33
ANM10 - Harvest hay in a manner that allows wildlife to flush and escape 36 59 95
ANM11 - Patch-burning to enhance wildlife habitat 29 10 39
ANM12 - Shallow water habitat 9 4 13
ANM14 - Riparian forest buffer, terrestrial and aquatic wildlife habitat 54 86 140
ANM15 - Forest stand improvement for habitat and soil quality 126 64 190
ANM17 - Monitoring nutritional status of livestock using the NUTBAL PRO System 4 7 11
ANM18 - Retrofit watering facility for wildlife escape 122 178 300
ANM19 - Wildlife corridors 11 18 29
ANM20 - Silvopasture for wildlife habitat 3 --b 3
ANM21 - Prairie Restoration for Grazing and Wildlife Habitat 6 1 7
ANM22 - Restoration and Management of Rare or Declining Habitats 26 11 37
ANM24 - Forest Wildlife Structures --b 120 120
ANM25 - Stockpiling Forages to Extend the Grazing Season --b 20 20
ANM26 - Managing Calving to Coincide with Forage Availability --b 75 75
BCR01 - Crop Technology Bundle #1 --b 1 1
BFO02 - Forest Bundle #2 --b 3 3
BPA01 - Pasture Grazing Bundle #1 --b 6 6
CCR99 - Resource-Conserving Crop Rotation 26 2 28
ENR01 - Fuel use reduction for field operations 7 --b 7
ENR02 - Solar powered electric fence charging systems 38 --b 38
ENR03 - Pumping plant powered by renewable energy 5 --b 5
ENR04 - Recycle 100% of farm lubricants 442 --b 442
ENR05 - Locally grown and marketed farm products 1 --b 1
FPP02 - On Farm Pilot Projects 1 --b 1
FRD01 - On Farm Research and Demonstrations 1 18 19
PLT01 - Establish pollinator habitat 113 111 224
PLT02 - Monitor key grazing areas to improve grazing management 138 159 297
PLT03 - Forest stand improvement pre-treating vegetation and fuels 2 1 3
PLT04 - Forest Stand Improvement, Prescribed burning 32 19 51
PLT05 - Multi-story cropping, sustainable management of nontimber forest plants 4 1 5
PLT06 - Renovation of a windbreak or shelter belt, or hedgerow for wildlife habitat 1 --b 1
PLT07 - Hardwood Crop Tree Release 17 9 26
PLT08 - Habitat Development for Beneficial Insects for Pest Management 1 1 2
PLT10 - Intensive Management of Rotational Grazing 29 25 54
SOE01 - Continuous no till with high residue 16 21 37
SOE02 - Protection of cultural resources sites with conservation cover 1 --b 1
SQL01 - Controlled traffic system 2 --b 2
SQL02 - Continuous cover crops 8 8 16
SQL03 - Drainage water management for nutrient, pathogen, or pesticide reduction 1 --b 1
SQL04 - Use of Cover Crop Mixes 7 11 18
SQL05 - Use deep rooted crops to breakup soil compaction --b 8 8
SQL06 - Conversion of cropped land to grass-based agriculture 6 2 8
SQL07 - Forest Stand Improvement for Soil Quality --b 1 1
WQL01 - Biological suppression and other non-chemical techniques to manage brush, weeds, invasive species 7 9 16
WQL02 - Biological suppression and other non-chemical techniques to manage herbaceous weeds invasive species 9 --b 9
WQL03 - Rotation of supplement and feeding areas 288 331 619
WQL04 - Plant Tissue Testing and Analysis to Improve Nitrogen Management 16 6 22
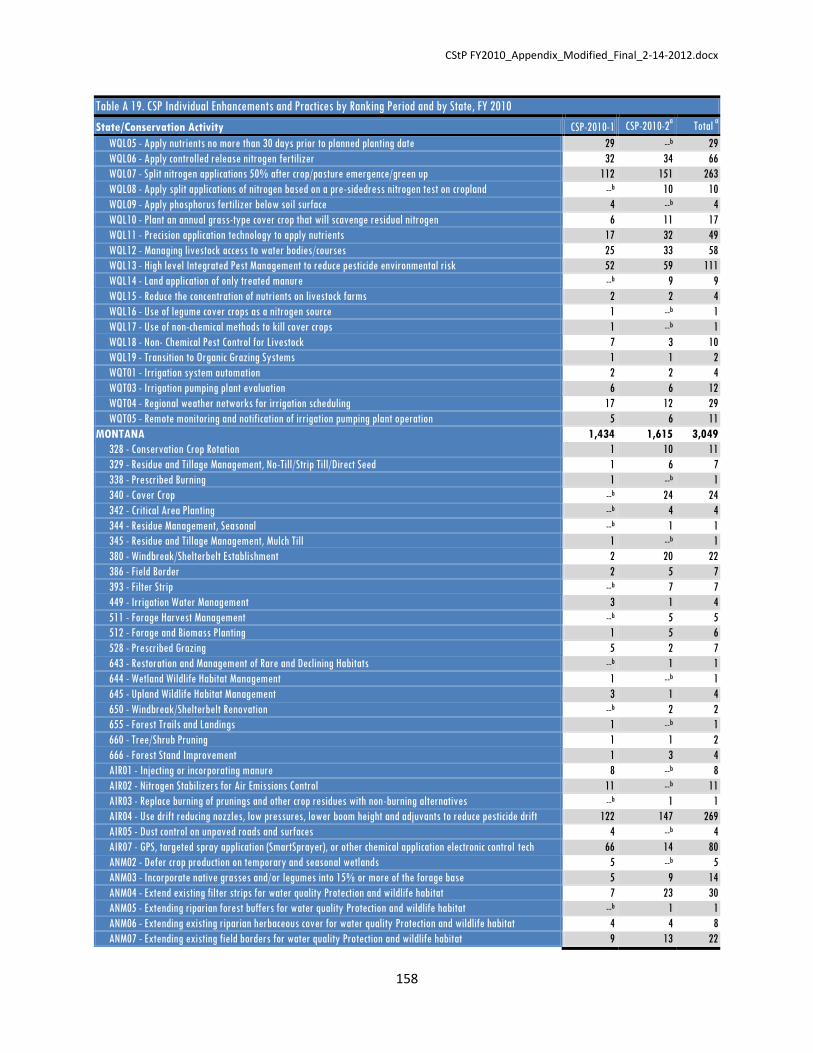
CStP FY2010_Appendix_Modified_Final_2-14-2012.docx
158
Table A 19. CSP Individual Enhancements and Practices by Ranking Period and by State, FY 2010
State/Conservation Activity CSP-2010-1 CSP-2010-2a Total
a
WQL05 - Apply nutrients no more than 30 days prior to planned planting date 29 --b 29
WQL06 - Apply controlled release nitrogen fertilizer 32 34 66
WQL07 - Split nitrogen applications 50% after crop/pasture emergence/green up 112 151 263
WQL08 - Apply split applications of nitrogen based on a pre-sidedress nitrogen test on cropland --b 10 10
WQL09 - Apply phosphorus fertilizer below soil surface 4 --b 4
WQL10 - Plant an annual grass-type cover crop that will scavenge residual nitrogen 6 11 17
WQL11 - Precision application technology to apply nutrients 17 32 49
WQL12 - Managing livestock access to water bodies/courses 25 33 58
WQL13 - High level Integrated Pest Management to reduce pesticide environmental risk 52 59 111
WQL14 - Land application of only treated manure --b 9 9
WQL15 - Reduce the concentration of nutrients on livestock farms 2 2 4
WQL16 - Use of legume cover crops as a nitrogen source 1 --b 1
WQL17 - Use of non-chemical methods to kill cover crops 1 --b 1
WQL18 - Non- Chemical Pest Control for Livestock 7 3 10
WQL19 - Transition to Organic Grazing Systems 1 1 2
WQT01 - Irrigation system automation 2 2 4
WQT03 - Irrigation pumping plant evaluation 6 6 12
WQT04 - Regional weather networks for irrigation scheduling 17 12 29
WQT05 - Remote monitoring and notification of irrigation pumping plant operation 5 6 11
MONTANA 1,434 1,615 3,049
328 - Conservation Crop Rotation 1 10 11
329 - Residue and Tillage Management, No-Till/Strip Till/Direct Seed 1 6 7
338 - Prescribed Burning 1 --b 1
340 - Cover Crop --b 24 24
342 - Critical Area Planting --b 4 4
344 - Residue Management, Seasonal --b 1 1
345 - Residue and Tillage Management, Mulch Till 1 --b 1
380 - Windbreak/Shelterbelt Establishment 2 20 22
386 - Field Border 2 5 7
393 - Filter Strip --b 7 7
449 - Irrigation Water Management 3 1 4
511 - Forage Harvest Management --b 5 5
512 - Forage and Biomass Planting 1 5 6
528 - Prescribed Grazing 5 2 7
643 - Restoration and Management of Rare and Declining Habitats --b 1 1
644 - Wetland Wildlife Habitat Management 1 --b 1
645 - Upland Wildlife Habitat Management 3 1 4
650 - Windbreak/Shelterbelt Renovation --b 2 2
655 - Forest Trails and Landings 1 --b 1
660 - Tree/Shrub Pruning 1 1 2
666 - Forest Stand Improvement 1 3 4
AIR01 - Injecting or incorporating manure 8 --b 8
AIR02 - Nitrogen Stabilizers for Air Emissions Control 11 --b 11
AIR03 - Replace burning of prunings and other crop residues with non-burning alternatives --b 1 1
AIR04 - Use drift reducing nozzles, low pressures, lower boom height and adjuvants to reduce pesticide drift 122 147 269
AIR05 - Dust control on unpaved roads and surfaces 4 --b 4
AIR07 - GPS, targeted spray application (SmartSprayer), or other chemical application electronic control tech 66 14 80
ANM02 - Defer crop production on temporary and seasonal wetlands 5 --b 5
ANM03 - Incorporate native grasses and/or legumes into 15% or more of the forage base 5 9 14
ANM04 - Extend existing filter strips for water quality Protection and wildlife habitat 7 23 30
ANM05 - Extending riparian forest buffers for water quality Protection and wildlife habitat --b 1 1
ANM06 - Extending existing riparian herbaceous cover for water quality Protection and wildlife habitat 4 4 8
ANM07 - Extending existing field borders for water quality Protection and wildlife habitat 9 13 22

CStP FY2010_Appendix_Modified_Final_2-14-2012.docx
159
Table A 19. CSP Individual Enhancements and Practices by Ranking Period and by State, FY 2010
State/Conservation Activity CSP-2010-1 CSP-2010-2a Total
a
ANM08 - Improve the plant diversity and structure of non-cropped areas for wildlife food and habitat 16 28 44
ANM09 - Grazing management to improve wildlife habitat 56 34 90
ANM10 - Harvest hay in a manner that allows wildlife to flush and escape 67 101 168
ANM11 - Patch-burning to enhance wildlife habitat 5 2 7
ANM12 - Shallow water habitat 12 4 16
ANM13 - Non-forested riparian zone enhancement for fish and wildlife 7 12 19
ANM14 - Riparian forest buffer, terrestrial and aquatic wildlife habitat 7 11 18
ANM15 - Forest stand improvement for habitat and soil quality 1 4 5
ANM16 - Harvesting crops using a stripper header 2 --b 2
ANM17 - Monitoring nutritional status of livestock using the NUTBAL PRO System 39 75 114
ANM18 - Retrofit watering facility for wildlife escape 121 157 278
ANM19 - Wildlife corridors 2 17 19
ANM20 - Silvopasture for wildlife habitat 3 1 4
ANM21 - Prairie Restoration for Grazing and Wildlife Habitat 3 6 9
ANM22 - Restoration and Management of Rare or Declining Habitats --b 7 7
ANM23 - Multi-species Native Perennials for Biomass/Wildlife Habitat 1 7 8
ANM24 - Forest Wildlife Structures --b 5 5
ANM25 - Stockpiling Forages to Extend the Grazing Season --b 6 6
ANM26 - Managing Calving to Coincide with Forage Availability --b 32 32
BCR01 - Crop Technology Bundle #1 --b 5 5
BCR03 - Crop Technology Bundle #3 --b 4 4
BPA01 - Pasture Grazing Bundle #1 --b 21 21
BRA01 - Range Grazing Bundle #1 --b 48 48
CCR99 - Resource-Conserving Crop Rotation 37 25 62
ENR01 - Fuel use reduction for field operations 21 --b 21
ENR02 - Solar powered electric fence charging systems 27 --b 27
ENR03 - Pumping plant powered by renewable energy 14 24 38
ENR04 - Recycle 100% of farm lubricants 88 --b 88
ENR05 - Locally grown and marketed farm products 17 25 42
FPP02 - On Farm Pilot Projects 2 --b 2
FRD01 - On Farm Research and Demonstrations --b 1 1
PLT01 - Establish pollinator habitat 20 26 46
PLT02 - Monitor key grazing areas to improve grazing management 121 5 126
PLT03 - Forest stand improvement pre-treating vegetation and fuels 2 --b 2
PLT04 - Forest Stand Improvement, Prescribed burning 2 --b 2
PLT05 - Multi-story cropping, sustainable management of nontimber forest plants 2 --b 2
PLT06 - Renovation of a windbreak or shelter belt, or hedgerow for wildlife habitat 29 42 71
PLT08 - Habitat Development for Beneficial Insects for Pest Management --b 3 3
PLT10 - Intensive Management of Rotational Grazing 1 6 7
PLT11 - Conifer Crop Tree Release --b 2 2
SOE01 - Continuous no till with high residue 15 25 40
SOE02 - Protection of cultural resources sites with conservation cover 1 2 3
SQL01 - Controlled traffic system 1 1 2
SQL02 - Continuous cover crops 2 --b 2
SQL03 - Drainage water management for nutrient, pathogen, or pesticide reduction 2 --b 2
SQL04 - Use of Cover Crop Mixes 5 6 11
SQL05 - Use deep rooted crops to breakup soil compaction 11 17 28
SQL06 - Conversion of cropped land to grass-based agriculture 6 15 21
SQL07 - Forest Stand Improvement for Soil Quality --b 2 2
WQL01 - Biological suppression and other non-chemical techniques to manage brush, weeds, invasive species --b 24 24
WQL02 - Biological suppression and other non-chemical techniques to manage herbaceous weeds invasive species 26 --b 26
WQL03 - Rotation of supplement and feeding areas 127 193 320
WQL04 - Plant Tissue Testing and Analysis to Improve Nitrogen Management 4 --b 4

CStP FY2010_Appendix_Modified_Final_2-14-2012.docx
160
Table A 19. CSP Individual Enhancements and Practices by Ranking Period and by State, FY 2010
State/Conservation Activity CSP-2010-1 CSP-2010-2a Total
a
WQL05 - Apply nutrients no more than 30 days prior to planned planting date 25 --b 25
WQL06 - Apply controlled release nitrogen fertilizer 65 74 139
WQL07 - Split nitrogen applications 50% after crop/pasture emergence/green up 19 46 65
WQL09 - Apply phosphorus fertilizer below soil surface 13 --b 13
WQL10 - Plant an annual grass-type cover crop that will scavenge residual nitrogen 2 4 6
WQL11 - Precision application technology to apply nutrients 29 13 42
WQL12 - Managing livestock access to water bodies/courses 17 14 31
WQL13 - High level Integrated Pest Management to reduce pesticide environmental risk 27 42 69
WQL14 - Land application of only treated manure 4 2 6
WQL15 - Reduce the concentration of nutrients on livestock farms 5 9 14
WQL16 - Use of legume cover crops as a nitrogen source 3 11 14
WQL17 - Use of non-chemical methods to kill cover crops 1 2 3
WQL20 - Transition to Organic Cropping Systems --b 1 1
WQL21 - Integrated Pest Management for Organic Farming. 3 --b 3
WQL22 - On Farm Composting of Farm Organic Waste --b 2 2
WQL23 - Provide Livestock Protection Away from Sensitive Areas --b 13 13
WQT01 - Irrigation system automation 4 3 7
WQT03 - Irrigation pumping plant evaluation 10 18 28
WQT04 - Regional weather networks for irrigation scheduling 14 14 28
WQT05 - Remote monitoring and notification of irrigation pumping plant operation 3 6 9
NEBRASKA 2,538 2,219 4,757
314 - Brush Management 5 4 9
328 - Conservation Crop Rotation 1 2 3
329 - Residue and Tillage Management, No-Till/Strip Till/Direct Seed 6 8 14
338 - Prescribed Burning 2 1 3
340 - Cover Crop 1 5 6
342 - Critical Area Planting --b 3 3
345 - Residue and Tillage Management, Mulch Till 1 --b 1
380 - Windbreak/Shelterbelt Establishment 7 10 17
386 - Field Border --b 4 4
393 - Filter Strip 3 6 9
449 - Irrigation Water Management 10 12 22
511 - Forage Harvest Management --b 1 1
512 - Forage and Biomass Planting 1 --b 1
528 - Prescribed Grazing 7 9 16
550 - Range Planting --b 1 1
612 - Tree/Shrub Establishment 1 --b 1
645 - Upland Wildlife Habitat Management 1 3 4
650 - Windbreak/Shelterbelt Renovation 3 3 6
666 - Forest Stand Improvement 1 --b 1
AIR01 - Injecting or incorporating manure 11 --b 11
AIR02 - Nitrogen Stabilizers for Air Emissions Control 26 --b 26
AIR03 - Replace burning of prunings and other crop residues with non-burning alternatives 1 --b 1
AIR04 - Use drift reducing nozzles, low pressures, lower boom height and adjuvants to reduce pesticide drift 177 196 373
AIR05 - Dust control on unpaved roads and surfaces 4 --b 4
AIR07 - GPS, targeted spray application (SmartSprayer), or other chemical application electronic control tech 109 124 233
ANM01 - Drainage water management for seasonal wildlife habitat 2 1 3
ANM02 - Defer crop production on temporary and seasonal wetlands 6 4 10
ANM03 - Incorporate native grasses and/or legumes into 15% or more of the forage base 20 17 37
ANM04 - Extend existing filter strips for water quality Protection and wildlife habitat 20 20 40
ANM05 - Extending riparian forest buffers for water quality Protection and wildlife habitat 1 2 3
ANM06 - Extending existing riparian herbaceous cover for water quality Protection and wildlife habitat 2 3 5
ANM07 - Extending existing field borders for water quality Protection and wildlife habitat 13 7 20

CStP FY2010_Appendix_Modified_Final_2-14-2012.docx
161
Table A 19. CSP Individual Enhancements and Practices by Ranking Period and by State, FY 2010
State/Conservation Activity CSP-2010-1 CSP-2010-2a Total
a
ANM08 - Improve the plant diversity and structure of non-cropped areas for wildlife food and habitat 53 26 79
ANM09 - Grazing management to improve wildlife habitat 77 55 132
ANM10 - Harvest hay in a manner that allows wildlife to flush and escape 106 146 252
ANM11 - Patch-burning to enhance wildlife habitat 19 15 34
ANM12 - Shallow water habitat 13 9 22
ANM13 - Non-forested riparian zone enhancement for fish and wildlife 5 --b 5
ANM14 - Riparian forest buffer, terrestrial and aquatic wildlife habitat 4 3 7
ANM15 - Forest stand improvement for habitat and soil quality 26 --b 26
ANM16 - Harvesting crops using a stripper header 11 --b 11
ANM17 - Monitoring nutritional status of livestock using the NUTBAL PRO System 23 9 32
ANM18 - Retrofit watering facility for wildlife escape 202 187 389
ANM19 - Wildlife corridors 12 12 24
ANM20 - Silvopasture for wildlife habitat 1 1 2
ANM21 - Prairie Restoration for Grazing and Wildlife Habitat 9 4 13
ANM22 - Restoration and Management of Rare or Declining Habitats 5 2 7
ANM23 - Multi-species Native Perennials for Biomass/Wildlife Habitat 4 4 8
ANM24 - Forest Wildlife Structures --b 1 1
ANM25 - Stockpiling Forages to Extend the Grazing Season --b 1 1
ANM26 - Managing Calving to Coincide with Forage Availability --b 17 17
BCR01 - Crop Technology Bundle #1 --b 3 3
BCR03 - Crop Technology Bundle #3 --b 3 3
BPA01 - Pasture Grazing Bundle #1 --b 1 1
BRA01 - Range Grazing Bundle #1 --b 74 74
CCR99 - Resource-Conserving Crop Rotation 41 8 49
ENR01 - Fuel use reduction for field operations 5 --b 5
ENR02 - Solar powered electric fence charging systems 87 --b 87
ENR03 - Pumping plant powered by renewable energy 9 5 14
ENR04 - Recycle 100% of farm lubricants 230 --b 230
ENR05 - Locally grown and marketed farm products 3 5 8
FRD01 - On Farm Research and Demonstrations --b 3 3
PLT01 - Establish pollinator habitat 44 96 140
PLT02 - Monitor key grazing areas to improve grazing management 190 106 296
PLT03 - Forest stand improvement pre-treating vegetation and fuels 2 --b 2
PLT04 - Forest Stand Improvement, Prescribed burning 3 --b 3
PLT06 - Renovation of a windbreak or shelter belt, or hedgerow for wildlife habitat 40 20 60
PLT07 - Hardwood Crop Tree Release 3 --b 3
PLT08 - Habitat Development for Beneficial Insects for Pest Management 1 1 2
PLT10 - Intensive Management of Rotational Grazing 27 28 55
SOE01 - Continuous no till with high residue 14 33 47
SOE02 - Protection of cultural resources sites with conservation cover --b 1 1
SQL01 - Controlled traffic system 3 8 11
SQL02 - Continuous cover crops 6 6 12
SQL04 - Use of Cover Crop Mixes 18 17 35
SQL05 - Use deep rooted crops to breakup soil compaction 9 8 17
SQL06 - Conversion of cropped land to grass-based agriculture 30 40 70
WQL01 - Biological suppression and other non-chemical techniques to manage brush, weeds, invasive species 9 14 23
WQL02 - Biological suppression and other non-chemical techniques to manage herbaceous weeds invasive species 6 --b 6
WQL03 - Rotation of supplement and feeding areas 228 218 446
WQL04 - Plant Tissue Testing and Analysis to Improve Nitrogen Management 135 156 291
WQL05 - Apply nutrients no more than 30 days prior to planned planting date 21 --b 21
WQL06 - Apply controlled release nitrogen fertilizer 28 50 78
WQL07 - Split nitrogen applications 50% after crop/pasture emergence/green up 25 41 66
WQL08 - Apply split applications of nitrogen based on a pre-sidedress nitrogen test on cropland 6 8 14

CStP FY2010_Appendix_Modified_Final_2-14-2012.docx
162
Table A 19. CSP Individual Enhancements and Practices by Ranking Period and by State, FY 2010
State/Conservation Activity CSP-2010-1 CSP-2010-2a Total
a
WQL09 - Apply phosphorus fertilizer below soil surface 22 --b 22
WQL10 - Plant an annual grass-type cover crop that will scavenge residual nitrogen 8 8 16
WQL11 - Precision application technology to apply nutrients 45 12 57
WQL12 - Managing livestock access to water bodies/courses 23 14 37
WQL13 - High level Integrated Pest Management to reduce pesticide environmental risk 36 70 106
WQL14 - Land application of only treated manure 4 1 5
WQL15 - Reduce the concentration of nutrients on livestock farms 1 --b 1
WQL16 - Use of legume cover crops as a nitrogen source 5 3 8
WQL17 - Use of non-chemical methods to kill cover crops 2 2 4
WQL18 - Non- Chemical Pest Control for Livestock 4 --b 4
WQL19 - Transition to Organic Grazing Systems 3 --b 3
WQL20 - Transition to Organic Cropping Systems 3 --b 3
WQL21 - Integrated Pest Management for Organic Farming. 6 1 7
WQT01 - Irrigation system automation 6 2 8
WQT03 - Irrigation pumping plant evaluation 50 89 139
WQT04 - Regional weather networks for irrigation scheduling 57 89 146
WQT05 - Remote monitoring and notification of irrigation pumping plant operation 28 37 65
NEVADA 27 46 73
AIR04 - Use drift reducing nozzles, low pressures, lower boom height and adjuvants to reduce pesticide drift 1 --b 1
ANM03 - Incorporate native grasses and/or legumes into 15% or more of the forage base --b 1 1
ANM08 - Improve the plant diversity and structure of non-cropped areas for wildlife food and habitat 3 4 7
ANM09 - Grazing management to improve wildlife habitat 4 2 6
ANM10 - Harvest hay in a manner that allows wildlife to flush and escape 1 10 11
ANM18 - Retrofit watering facility for wildlife escape 2 5 7
ANM25 - Stockpiling Forages to Extend the Grazing Season --b 1 1
ANM26 - Managing Calving to Coincide with Forage Availability --b 2 2
ENR02 - Solar powered electric fence charging systems 1 --b 1
ENR04 - Recycle 100% of farm lubricants 2 --b 2
PLT02 - Monitor key grazing areas to improve grazing management 5 4 9
PLT06 - Renovation of a windbreak or shelter belt, or hedgerow for wildlife habitat --b 1 1
PLT08 - Habitat Development for Beneficial Insects for Pest Management --b 1 1
PLT10 - Intensive Management of Rotational Grazing --b 2 2
SQL02 - Continuous cover crops --b 1 1
WQL03 - Rotation of supplement and feeding areas 3 3 6
WQL04 - Plant Tissue Testing and Analysis to Improve Nitrogen Management --b 1 1
WQL12 - Managing livestock access to water bodies/courses 1 3 4
WQL15 - Reduce the concentration of nutrients on livestock farms 1 --b 1
WQL21 - Integrated Pest Management for Organic Farming. 2 --b 2
WQT03 - Irrigation pumping plant evaluation 1 5 6
NEW HAMPSHIRE 23 11 34
340 - Cover Crop 1 --b 1
386 - Field Border --b 1 1
666 - Forest Stand Improvement 1 --b 1
AIR03 - Replace burning of prunings and other crop residues with non-burning alternatives 1 --b 1
ANM02 - Defer crop production on temporary and seasonal wetlands 1 --b 1
ANM04 - Extend existing filter strips for water quality Protection and wildlife habitat --b 1 1
ANM08 - Improve the plant diversity and structure of non-cropped areas for wildlife food and habitat --b 2 2
ANM10 - Harvest hay in a manner that allows wildlife to flush and escape 1 --b 1
ANM12 - Shallow water habitat 1 --b 1
ANM22 - Restoration and Management of Rare or Declining Habitats 1 --b 1
ANM24 - Forest Wildlife Structures --b 2 2
ENR04 - Recycle 100% of farm lubricants 8 --b 8
PLT01 - Establish pollinator habitat 1 1 2

CStP FY2010_Appendix_Modified_Final_2-14-2012.docx
163
Table A 19. CSP Individual Enhancements and Practices by Ranking Period and by State, FY 2010
State/Conservation Activity CSP-2010-1 CSP-2010-2a Total
a
PLT05 - Multi-story cropping, sustainable management of nontimber forest plants 1 --b 1
PLT07 - Hardwood Crop Tree Release 1 --b 1
SQL04 - Use of Cover Crop Mixes --b 1 1
WQL03 - Rotation of supplement and feeding areas 1 --b 1
WQL06 - Apply controlled release nitrogen fertilizer 1 1 2
WQL10 - Plant an annual grass-type cover crop that will scavenge residual nitrogen 1 --b 1
WQL12 - Managing livestock access to water bodies/courses 1 --b 1
WQL14 - Land application of only treated manure 1 1 2
WQL18 - Non- Chemical Pest Control for Livestock --b 1 1
NEW JERSEY --b 36 36
AIR04 - Use drift reducing nozzles, low pressures, lower boom height and adjuvants to reduce pesticide drift --b 4 4
AIR07 - GPS, targeted spray application (SmartSprayer), or other chemical application electronic control tech --b 3 3
ANM08 - Improve the plant diversity and structure of non-cropped areas for wildlife food and habitat --b 1 1
ANM10 - Harvest hay in a manner that allows wildlife to flush and escape --b 1 1
CCR99 - Resource-Conserving Crop Rotation --b 1 1
ENR05 - Locally grown and marketed farm products --b 2 2
PLT01 - Establish pollinator habitat --b 1 1
PLT06 - Renovation of a windbreak or shelter belt, or hedgerow for wildlife habitat --b 1 1
SQL01 - Controlled traffic system --b 1 1
SQL02 - Continuous cover crops --b 2 2
SQL05 - Use deep rooted crops to breakup soil compaction --b 2 2
WQL01 - Biological suppression and other non-chemical techniques to manage brush, weeds, invasive species --b 1 1
WQL03 - Rotation of supplement and feeding areas --b 1 1
WQL04 - Plant Tissue Testing and Analysis to Improve Nitrogen Management --b 6 6
WQL06 - Apply controlled release nitrogen fertilizer --b 2 2
WQL07 - Split nitrogen applications 50% after crop/pasture emergence/green up --b 2 2
WQL08 - Apply split applications of nitrogen based on a pre-sidedress nitrogen test on cropland --b 1 1
WQL10 - Plant an annual grass-type cover crop that will scavenge residual nitrogen --b 1 1
WQL13 - High level Integrated Pest Management to reduce pesticide environmental risk --b 2 2
WQT04 - Regional weather networks for irrigation scheduling --b 1 1
NEW MEXICO 477 210 687
314 - Brush Management 1 1 2
328 - Conservation Crop Rotation 1 --b 1
329 - Residue and Tillage Management, No-Till/Strip Till/Direct Seed --b 1 1
340 - Cover Crop 1 1 2
449 - Irrigation Water Management 1 --b 1
528 - Prescribed Grazing 2 1 3
550 - Range Planting 1 --b 1
645 - Upland Wildlife Habitat Management 5 --b 5
666 - Forest Stand Improvement 1 --b 1
AIR03 - Replace burning of prunings and other crop residues with non-burning alternatives --b 1 1
AIR04 - Use drift reducing nozzles, low pressures, lower boom height and adjuvants to reduce pesticide drift 1 5 6
AIR07 - GPS, targeted spray application (SmartSprayer), or other chemical application electronic control tech 1 3 4
ANM03 - Incorporate native grasses and/or legumes into 15% or more of the forage base 1 --b 1
ANM06 - Extending existing riparian herbaceous cover for water quality Protection and wildlife habitat --b 1 1
ANM08 - Improve the plant diversity and structure of non-cropped areas for wildlife food and habitat 2 --b 2
ANM09 - Grazing management to improve wildlife habitat 33 10 43
ANM10 - Harvest hay in a manner that allows wildlife to flush and escape 2 4 6
ANM11 - Patch-burning to enhance wildlife habitat 4 1 5
ANM13 - Non-forested riparian zone enhancement for fish and wildlife 1 2 3
ANM14 - Riparian forest buffer, terrestrial and aquatic wildlife habitat 1 --b 1
ANM17 - Monitoring nutritional status of livestock using the NUTBAL PRO System 22 17 39
ANM18 - Retrofit watering facility for wildlife escape 93 14 107

CStP FY2010_Appendix_Modified_Final_2-14-2012.docx
164
Table A 19. CSP Individual Enhancements and Practices by Ranking Period and by State, FY 2010
State/Conservation Activity CSP-2010-1 CSP-2010-2a Total
a
ANM19 - Wildlife corridors 3 3 6
ANM20 - Silvopasture for wildlife habitat 1 1 2
ANM21 - Prairie Restoration for Grazing and Wildlife Habitat 2 --b 2
ANM22 - Restoration and Management of Rare or Declining Habitats 3 --b 3
ANM23 - Multi-species Native Perennials for Biomass/Wildlife Habitat 1 --b 1
ANM24 - Forest Wildlife Structures --b 1 1
ANM26 - Managing Calving to Coincide with Forage Availability --b 22 22
BPA01 - Pasture Grazing Bundle #1 --b 1 1
BRA01 - Range Grazing Bundle #1 --b 40 40
CCR99 - Resource-Conserving Crop Rotation 1 --b 1
ENR01 - Fuel use reduction for field operations 1 --b 1
ENR02 - Solar powered electric fence charging systems 7 --b 7
ENR03 - Pumping plant powered by renewable energy 31 16 47
ENR04 - Recycle 100% of farm lubricants 64 --b 64
ENR05 - Locally grown and marketed farm products 8 2 10
FPP02 - On Farm Pilot Projects --b 2 2
PLT01 - Establish pollinator habitat 2 2 4
PLT02 - Monitor key grazing areas to improve grazing management 60 16 76
PLT06 - Renovation of a windbreak or shelter belt, or hedgerow for wildlife habitat --b 1 1
PLT10 - Intensive Management of Rotational Grazing 2 2 4
SOE02 - Protection of cultural resources sites with conservation cover 3 1 4
SOE03 - Continuous No Till Organic System 1 --b 1
SQL04 - Use of Cover Crop Mixes 2 --b 2
WQL01 - Biological suppression and other non-chemical techniques to manage brush, weeds, invasive species 10 4 14
WQL02 - Biological suppression and other non-chemical techniques to manage herbaceous weeds invasive species 3 --b 3
WQL03 - Rotation of supplement and feeding areas 76 17 93
WQL04 - Plant Tissue Testing and Analysis to Improve Nitrogen Management 3 1 4
WQL05 - Apply nutrients no more than 30 days prior to planned planting date 1 --b 1
WQL07 - Split nitrogen applications 50% after crop/pasture emergence/green up --b 1 1
WQL12 - Managing livestock access to water bodies/courses 13 3 16
WQL13 - High level Integrated Pest Management to reduce pesticide environmental risk --b 1 1
WQL14 - Land application of only treated manure 1 1 2
WQL15 - Reduce the concentration of nutrients on livestock farms --b 1 1
WQL17 - Use of non-chemical methods to kill cover crops 1 --b 1
WQL18 - Non- Chemical Pest Control for Livestock 1 2 3
WQL19 - Transition to Organic Grazing Systems --b 1 1
WQL21 - Integrated Pest Management for Organic Farming. 1 --b 1
WQL23 - Provide Livestock Protection Away from Sensitive Areas --b 1 1
WQT03 - Irrigation pumping plant evaluation --b 1 1
WQT04 - Regional weather networks for irrigation scheduling --b 3 3
WQT05 - Remote monitoring and notification of irrigation pumping plant operation 1 1 2
NEW YORK 464 452 916
328 - Conservation Crop Rotation --b 1 1
340 - Cover Crop 1 --b 1
342 - Critical Area Planting --b 1 1
345 - Residue and Tillage Management, Mulch Till --b 1 1
393 - Filter Strip --b 1 1
449 - Irrigation Water Management 1 --b 1
511 - Forage Harvest Management --b 2 2
512 - Forage and Biomass Planting 1 --b 1
528 - Prescribed Grazing 1 --b 1
644 - Wetland Wildlife Habitat Management 1 --b 1
666 - Forest Stand Improvement 2 --b 2

CStP FY2010_Appendix_Modified_Final_2-14-2012.docx
165
Table A 19. CSP Individual Enhancements and Practices by Ranking Period and by State, FY 2010
State/Conservation Activity CSP-2010-1 CSP-2010-2a Total
a
AIR01 - Injecting or incorporating manure 5 --b 5
AIR02 - Nitrogen Stabilizers for Air Emissions Control 15 --b 15
AIR03 - Replace burning of prunings and other crop residues with non-burning alternatives 1 4 5
AIR04 - Use drift reducing nozzles, low pressures, lower boom height and adjuvants to reduce pesticide drift 24 23 47
AIR05 - Dust control on unpaved roads and surfaces 1 --b 1
AIR07 - GPS, targeted spray application (SmartSprayer), or other chemical application electronic control tech 4 12 16
ANM03 - Incorporate native grasses and/or legumes into 15% or more of the forage base 2 3 5
ANM04 - Extend existing filter strips for water quality Protection and wildlife habitat 1 1 2
ANM05 - Extending riparian forest buffers for water quality Protection and wildlife habitat --b 1 1
ANM06 - Extending existing riparian herbaceous cover for water quality Protection and wildlife habitat 3 --b 3
ANM07 - Extending existing field borders for water quality Protection and wildlife habitat 2 --b 2
ANM08 - Improve the plant diversity and structure of non-cropped areas for wildlife food and habitat 9 11 20
ANM09 - Grazing management to improve wildlife habitat 3 1 4
ANM10 - Harvest hay in a manner that allows wildlife to flush and escape 14 19 33
ANM12 - Shallow water habitat 10 10 20
ANM14 - Riparian forest buffer, terrestrial and aquatic wildlife habitat 14 11 25
ANM15 - Forest stand improvement for habitat and soil quality 44 55 99
ANM16 - Harvesting crops using a stripper header 1 --b 1
ANM17 - Monitoring nutritional status of livestock using the NUTBAL PRO System 1 --b 1
ANM18 - Retrofit watering facility for wildlife escape 12 15 27
ANM19 - Wildlife corridors 13 3 16
ANM20 - Silvopasture for wildlife habitat 1 --b 1
ANM22 - Restoration and Management of Rare or Declining Habitats 10 3 13
ANM23 - Multi-species Native Perennials for Biomass/Wildlife Habitat 1 --b 1
ANM24 - Forest Wildlife Structures --b 41 41
ANM25 - Stockpiling Forages to Extend the Grazing Season --b 4 4
ANM26 - Managing Calving to Coincide with Forage Availability --b 3 3
BCR02 - Crop Technology Bundle #2 --b 2 2
BFO02 - Forest Bundle #2 --b 6 6
BPA01 - Pasture Grazing Bundle #1 --b 2 2
CCR99 - Resource-Conserving Crop Rotation 10 5 15
ENR01 - Fuel use reduction for field operations 2 --b 2
ENR02 - Solar powered electric fence charging systems 9 --b 9
ENR03 - Pumping plant powered by renewable energy 2 2 4
ENR04 - Recycle 100% of farm lubricants 28 --b 28
ENR05 - Locally grown and marketed farm products 9 8 17
PLT01 - Establish pollinator habitat 5 7 12
PLT02 - Monitor key grazing areas to improve grazing management 11 7 18
PLT05 - Multi-story cropping, sustainable management of nontimber forest plants 1 4 5
PLT06 - Renovation of a windbreak or shelter belt, or hedgerow for wildlife habitat 1 1 2
PLT07 - Hardwood Crop Tree Release 18 23 41
PLT08 - Habitat Development for Beneficial Insects for Pest Management --b 1 1
PLT10 - Intensive Management of Rotational Grazing 13 6 19
PLT11 - Conifer Crop Tree Release --b 4 4
PLT12 - Patch Harvesting --b 1 1
SOE01 - Continuous no till with high residue 4 4 8
SOE03 - Continuous No Till Organic System 1 --b 1
SQL02 - Continuous cover crops 6 5 11
SQL04 - Use of Cover Crop Mixes 9 6 15
SQL05 - Use deep rooted crops to breakup soil compaction 5 10 15
SQL07 - Forest Stand Improvement for Soil Quality --b 13 13
WQL01 - Biological suppression and other non-chemical techniques to manage brush, weeds, invasive species 6 6 12
WQL02 - Biological suppression and other non-chemical techniques to manage herbaceous weeds invasive species 9 --b 9

CStP FY2010_Appendix_Modified_Final_2-14-2012.docx
166
Table A 19. CSP Individual Enhancements and Practices by Ranking Period and by State, FY 2010
State/Conservation Activity CSP-2010-1 CSP-2010-2a Total
a
WQL03 - Rotation of supplement and feeding areas 14 12 26
WQL04 - Plant Tissue Testing and Analysis to Improve Nitrogen Management 17 29 46
WQL05 - Apply nutrients no more than 30 days prior to planned planting date 5 --b 5
WQL06 - Apply controlled release nitrogen fertilizer 17 14 31
WQL07 - Split nitrogen applications 50% after crop/pasture emergence/green up 3 4 7
WQL08 - Apply split applications of nitrogen based on a pre-sidedress nitrogen test on cropland 8 2 10
WQL09 - Apply phosphorus fertilizer below soil surface 3 --b 3
WQL10 - Plant an annual grass-type cover crop that will scavenge residual nitrogen 4 7 11
WQL11 - Precision application technology to apply nutrients --b 1 1
WQL12 - Managing livestock access to water bodies/courses 7 4 11
WQL13 - High level Integrated Pest Management to reduce pesticide environmental risk 10 7 17
WQL14 - Land application of only treated manure 5 1 6
WQL15 - Reduce the concentration of nutrients on livestock farms 8 6 14
WQL16 - Use of legume cover crops as a nitrogen source 1 3 4
WQL17 - Use of non-chemical methods to kill cover crops 2 1 3
WQL18 - Non- Chemical Pest Control for Livestock 5 1 6
WQL19 - Transition to Organic Grazing Systems 1 1 2
WQL20 - Transition to Organic Cropping Systems 1 2 3
WQL21 - Integrated Pest Management for Organic Farming. 3 4 7
WQL22 - On Farm Composting of Farm Organic Waste --b 2 2
WQT01 - Irrigation system automation --b 1 1
WQT02 - Mulching for moisture conservation --b 1 1
WQT04 - Regional weather networks for irrigation scheduling 2 --b 2
WQT05 - Remote monitoring and notification of irrigation pumping plant operation 1 --b 1
NORTH CAROLINA 171 208 379
340 - Cover Crop 1 --b 1
342 - Critical Area Planting 2 --b 2
384 - Forest Slash Treatment 1 --b 1
394 - Firebreak 1 --b 1
449 - Irrigation Water Management 1 --b 1
511 - Forage Harvest Management 1 --b 1
612 - Tree/Shrub Establishment --b 1 1
AIR02 - Nitrogen Stabilizers for Air Emissions Control 2 --b 2
AIR03 - Replace burning of prunings and other crop residues with non-burning alternatives 3 --b 3
AIR04 - Use drift reducing nozzles, low pressures, lower boom height and adjuvants to reduce pesticide drift 16 43 59
AIR07 - GPS, targeted spray application (SmartSprayer), or other chemical application electronic control tech 3 3 6
ANM03 - Incorporate native grasses and/or legumes into 15% or more of the forage base 9 9 18
ANM06 - Extending existing riparian herbaceous cover for water quality Protection and wildlife habitat --b 1 1
ANM07 - Extending existing field borders for water quality Protection and wildlife habitat --b 2 2
ANM08 - Improve the plant diversity and structure of non-cropped areas for wildlife food and habitat 2 3 5
ANM10 - Harvest hay in a manner that allows wildlife to flush and escape 6 21 27
ANM11 - Patch-burning to enhance wildlife habitat 1 --b 1
ANM12 - Shallow water habitat --b 1 1
ANM14 - Riparian forest buffer, terrestrial and aquatic wildlife habitat 2 8 10
ANM15 - Forest stand improvement for habitat and soil quality 9 11 20
ANM18 - Retrofit watering facility for wildlife escape 2 2 4
ANM19 - Wildlife corridors --b 4 4
ANM22 - Restoration and Management of Rare or Declining Habitats 1 1 2
ANM24 - Forest Wildlife Structures --b 22 22
ANM26 - Managing Calving to Coincide with Forage Availability --b 3 3
CCR99 - Resource-Conserving Crop Rotation 5 2 7
ENR02 - Solar powered electric fence charging systems 5 --b 5
ENR04 - Recycle 100% of farm lubricants 43 --b 43

CStP FY2010_Appendix_Modified_Final_2-14-2012.docx
167
Table A 19. CSP Individual Enhancements and Practices by Ranking Period and by State, FY 2010
State/Conservation Activity CSP-2010-1 CSP-2010-2a Total
a
ENR05 - Locally grown and marketed farm products 5 1 6
PLT01 - Establish pollinator habitat 5 3 8
PLT02 - Monitor key grazing areas to improve grazing management 6 1 7
PLT03 - Forest stand improvement pre-treating vegetation and fuels 1 1 2
PLT04 - Forest Stand Improvement, Prescribed burning 5 6 11
PLT05 - Multi-story cropping, sustainable management of nontimber forest plants 1 1 2
PLT06 - Renovation of a windbreak or shelter belt, or hedgerow for wildlife habitat 1 --b 1
PLT07 - Hardwood Crop Tree Release 1 --b 1
PLT10 - Intensive Management of Rotational Grazing 1 1 2
SOE01 - Continuous no till with high residue --b 5 5
SOE02 - Protection of cultural resources sites with conservation cover 1 --b 1
SQL02 - Continuous cover crops 1 1 2
SQL04 - Use of Cover Crop Mixes 1 5 6
SQL05 - Use deep rooted crops to breakup soil compaction 2 --b 2
SQL07 - Forest Stand Improvement for Soil Quality --b 2 2
WQL01 - Biological suppression and other non-chemical techniques to manage brush, weeds, invasive species --b 1 1
WQL03 - Rotation of supplement and feeding areas 7 20 27
WQL04 - Plant Tissue Testing and Analysis to Improve Nitrogen Management 2 1 3
WQL05 - Apply nutrients no more than 30 days prior to planned planting date 2 --b 2
WQL06 - Apply controlled release nitrogen fertilizer 3 2 5
WQL07 - Split nitrogen applications 50% after crop/pasture emergence/green up 2 3 5
WQL08 - Apply split applications of nitrogen based on a pre-sidedress nitrogen test on cropland --b 1 1
WQL10 - Plant an annual grass-type cover crop that will scavenge residual nitrogen 2 --b 2
WQL11 - Precision application technology to apply nutrients --b 3 3
WQL12 - Managing livestock access to water bodies/courses 1 5 6
WQL14 - Land application of only treated manure 2 1 3
WQL15 - Reduce the concentration of nutrients on livestock farms 1 --b 1
WQL16 - Use of legume cover crops as a nitrogen source --b 6 6
WQL17 - Use of non-chemical methods to kill cover crops --b 1 1
WQL18 - Non- Chemical Pest Control for Livestock 1 --b 1
WQL19 - Transition to Organic Grazing Systems 1 --b 1
NORTH DAKOTA 1,829 2,295 4,124
314 - Brush Management 2 --b 2
328 - Conservation Crop Rotation 5 --b 5
329 - Residue and Tillage Management, No-Till/Strip Till/Direct Seed 3 1 4
340 - Cover Crop 2 4 6
342 - Critical Area Planting 1 1 2
345 - Residue and Tillage Management, Mulch Till 3 1 4
380 - Windbreak/Shelterbelt Establishment 1 --b 1
393 - Filter Strip 5 3 8
528 - Prescribed Grazing 1 2 3
550 - Range Planting 1 --b 1
644 - Wetland Wildlife Habitat Management 1 --b 1
645 - Upland Wildlife Habitat Management 2 --b 2
647 - Early Successional Habitat Development/Management 1 --b 1
AIR01 - Injecting or incorporating manure 7 --b 7
AIR02 - Nitrogen Stabilizers for Air Emissions Control 17 --b 17
AIR03 - Replace burning of prunings and other crop residues with non-burning alternatives 1 1 2
AIR04 - Use drift reducing nozzles, low pressures, lower boom height and adjuvants to reduce pesticide drift 149 247 396
AIR05 - Dust control on unpaved roads and surfaces 2 --b 2
AIR07 - GPS, targeted spray application (SmartSprayer), or other chemical application electronic control tech 98 238 336
ANM02 - Defer crop production on temporary and seasonal wetlands 1 15 16
ANM03 - Incorporate native grasses and/or legumes into 15% or more of the forage base 4 11 15

CStP FY2010_Appendix_Modified_Final_2-14-2012.docx
168
Table A 19. CSP Individual Enhancements and Practices by Ranking Period and by State, FY 2010
State/Conservation Activity CSP-2010-1 CSP-2010-2a Total
a
ANM04 - Extend existing filter strips for water quality Protection and wildlife habitat 4 36 40
ANM06 - Extending existing riparian herbaceous cover for water quality Protection and wildlife habitat 2 15 17
ANM07 - Extending existing field borders for water quality Protection and wildlife habitat 3 13 16
ANM08 - Improve the plant diversity and structure of non-cropped areas for wildlife food and habitat 11 8 19
ANM09 - Grazing management to improve wildlife habitat 17 44 61
ANM10 - Harvest hay in a manner that allows wildlife to flush and escape 101 86 187
ANM11 - Patch-burning to enhance wildlife habitat 1 --b 1
ANM12 - Shallow water habitat --b 2 2
ANM13 - Non-forested riparian zone enhancement for fish and wildlife 3 1 4
ANM15 - Forest stand improvement for habitat and soil quality 1 3 4
ANM16 - Harvesting crops using a stripper header 4 --b 4
ANM17 - Monitoring nutritional status of livestock using the NUTBAL PRO System 40 39 79
ANM18 - Retrofit watering facility for wildlife escape 94 101 195
ANM19 - Wildlife corridors 3 9 12
ANM21 - Prairie Restoration for Grazing and Wildlife Habitat 1 2 3
ANM22 - Restoration and Management of Rare or Declining Habitats --b 2 2
ANM23 - Multi-species Native Perennials for Biomass/Wildlife Habitat 2 1 3
ANM25 - Stockpiling Forages to Extend the Grazing Season --b 1 1
ANM26 - Managing Calving to Coincide with Forage Availability --b 50 50
BCR01 - Crop Technology Bundle #1 --b 13 13
BRA01 - Range Grazing Bundle #1 --b 2 2
CCR99 - Resource-Conserving Crop Rotation 30 8 38
ENR01 - Fuel use reduction for field operations 12 --b 12
ENR02 - Solar powered electric fence charging systems 58 --b 58
ENR03 - Pumping plant powered by renewable energy 10 13 23
ENR04 - Recycle 100% of farm lubricants 108 --b 108
ENR05 - Locally grown and marketed farm products 7 4 11
FPP02 - On Farm Pilot Projects 1 1 2
FRD01 - On Farm Research and Demonstrations --b 4 4
PLT01 - Establish pollinator habitat 1 10 11
PLT02 - Monitor key grazing areas to improve grazing management 97 116 213
PLT06 - Renovation of a windbreak or shelter belt, or hedgerow for wildlife habitat 11 16 27
PLT07 - Hardwood Crop Tree Release --b 1 1
PLT08 - Habitat Development for Beneficial Insects for Pest Management 1 1 2
PLT10 - Intensive Management of Rotational Grazing 7 15 22
SOE01 - Continuous no till with high residue 26 65 91
SOE02 - Protection of cultural resources sites with conservation cover 1 --b 1
SOE03 - Continuous No Till Organic System --b 2 2
SQL02 - Continuous cover crops 18 10 28
SQL04 - Use of Cover Crop Mixes 104 143 247
SQL05 - Use deep rooted crops to breakup soil compaction 46 149 195
SQL06 - Conversion of cropped land to grass-based agriculture 21 27 48
WQL01 - Biological suppression and other non-chemical techniques to manage brush, weeds, invasive species 19 4 23
WQL02 - Biological suppression and other non-chemical techniques to manage herbaceous weeds invasive species 35 --b 35
WQL03 - Rotation of supplement and feeding areas 174 191 365
WQL04 - Plant Tissue Testing and Analysis to Improve Nitrogen Management 63 2 65
WQL05 - Apply nutrients no more than 30 days prior to planned planting date 47 --b 47
WQL06 - Apply controlled release nitrogen fertilizer 41 84 125
WQL07 - Split nitrogen applications 50% after crop/pasture emergence/green up 16 61 77
WQL08 - Apply split applications of nitrogen based on a pre-sidedress nitrogen test on cropland --b 3 3
WQL09 - Apply phosphorus fertilizer below soil surface 41 --b 41
WQL10 - Plant an annual grass-type cover crop that will scavenge residual nitrogen 52 71 123
WQL11 - Precision application technology to apply nutrients 31 69 100
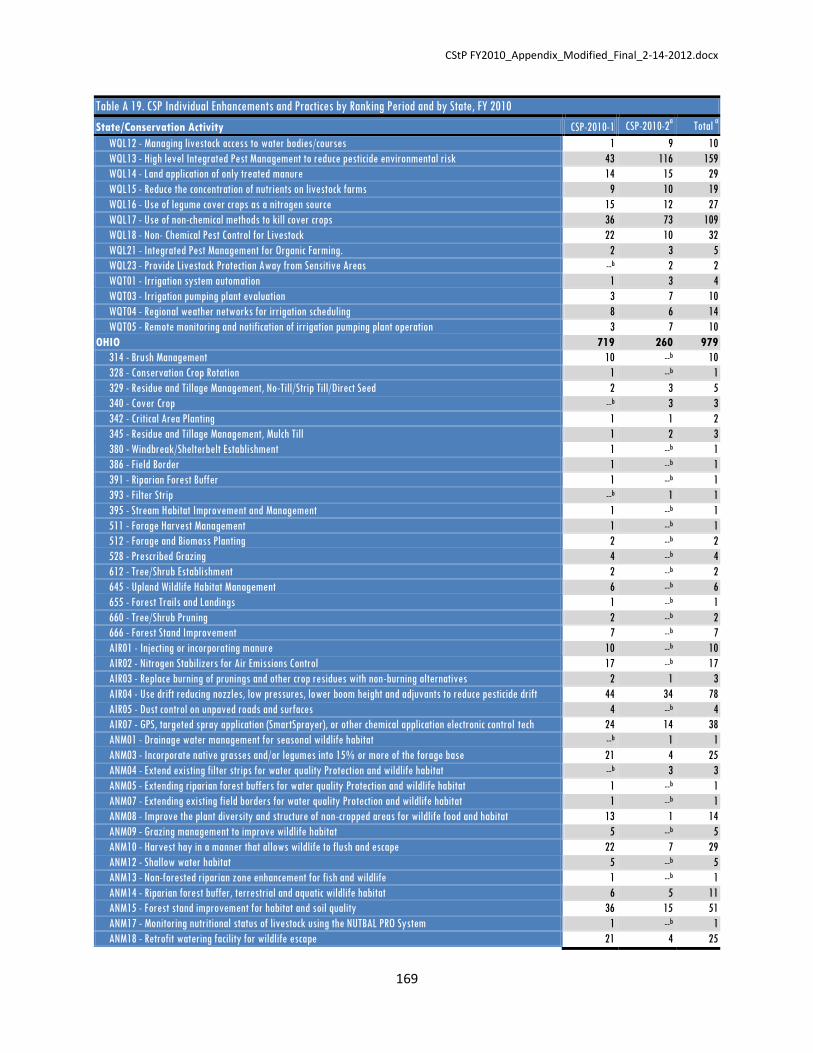
CStP FY2010_Appendix_Modified_Final_2-14-2012.docx
169
Table A 19. CSP Individual Enhancements and Practices by Ranking Period and by State, FY 2010
State/Conservation Activity CSP-2010-1 CSP-2010-2a Total
a
WQL12 - Managing livestock access to water bodies/courses 1 9 10
WQL13 - High level Integrated Pest Management to reduce pesticide environmental risk 43 116 159
WQL14 - Land application of only treated manure 14 15 29
WQL15 - Reduce the concentration of nutrients on livestock farms 9 10 19
WQL16 - Use of legume cover crops as a nitrogen source 15 12 27
WQL17 - Use of non-chemical methods to kill cover crops 36 73 109
WQL18 - Non- Chemical Pest Control for Livestock 22 10 32
WQL21 - Integrated Pest Management for Organic Farming. 2 3 5
WQL23 - Provide Livestock Protection Away from Sensitive Areas --b 2 2
WQT01 - Irrigation system automation 1 3 4
WQT03 - Irrigation pumping plant evaluation 3 7 10
WQT04 - Regional weather networks for irrigation scheduling 8 6 14
WQT05 - Remote monitoring and notification of irrigation pumping plant operation 3 7 10
OHIO 719 260 979
314 - Brush Management 10 --b 10
328 - Conservation Crop Rotation 1 --b 1
329 - Residue and Tillage Management, No-Till/Strip Till/Direct Seed 2 3 5
340 - Cover Crop --b 3 3
342 - Critical Area Planting 1 1 2
345 - Residue and Tillage Management, Mulch Till 1 2 3
380 - Windbreak/Shelterbelt Establishment 1 --b 1
386 - Field Border 1 --b 1
391 - Riparian Forest Buffer 1 --b 1
393 - Filter Strip --b 1 1
395 - Stream Habitat Improvement and Management 1 --b 1
511 - Forage Harvest Management 1 --b 1
512 - Forage and Biomass Planting 2 --b 2
528 - Prescribed Grazing 4 --b 4
612 - Tree/Shrub Establishment 2 --b 2
645 - Upland Wildlife Habitat Management 6 --b 6
655 - Forest Trails and Landings 1 --b 1
660 - Tree/Shrub Pruning 2 --b 2
666 - Forest Stand Improvement 7 --b 7
AIR01 - Injecting or incorporating manure 10 --b 10
AIR02 - Nitrogen Stabilizers for Air Emissions Control 17 --b 17
AIR03 - Replace burning of prunings and other crop residues with non-burning alternatives 2 1 3
AIR04 - Use drift reducing nozzles, low pressures, lower boom height and adjuvants to reduce pesticide drift 44 34 78
AIR05 - Dust control on unpaved roads and surfaces 4 --b 4
AIR07 - GPS, targeted spray application (SmartSprayer), or other chemical application electronic control tech 24 14 38
ANM01 - Drainage water management for seasonal wildlife habitat --b 1 1
ANM03 - Incorporate native grasses and/or legumes into 15% or more of the forage base 21 4 25
ANM04 - Extend existing filter strips for water quality Protection and wildlife habitat --b 3 3
ANM05 - Extending riparian forest buffers for water quality Protection and wildlife habitat 1 --b 1
ANM07 - Extending existing field borders for water quality Protection and wildlife habitat 1 --b 1
ANM08 - Improve the plant diversity and structure of non-cropped areas for wildlife food and habitat 13 1 14
ANM09 - Grazing management to improve wildlife habitat 5 --b 5
ANM10 - Harvest hay in a manner that allows wildlife to flush and escape 22 7 29
ANM12 - Shallow water habitat 5 --b 5
ANM13 - Non-forested riparian zone enhancement for fish and wildlife 1 --b 1
ANM14 - Riparian forest buffer, terrestrial and aquatic wildlife habitat 6 5 11
ANM15 - Forest stand improvement for habitat and soil quality 36 15 51
ANM17 - Monitoring nutritional status of livestock using the NUTBAL PRO System 1 --b 1
ANM18 - Retrofit watering facility for wildlife escape 21 4 25

CStP FY2010_Appendix_Modified_Final_2-14-2012.docx
170
Table A 19. CSP Individual Enhancements and Practices by Ranking Period and by State, FY 2010
State/Conservation Activity CSP-2010-1 CSP-2010-2a Total
a
ANM19 - Wildlife corridors 4 4 8
ANM22 - Restoration and Management of Rare or Declining Habitats 1 1 2
ANM23 - Multi-species Native Perennials for Biomass/Wildlife Habitat 1 --b 1
ANM24 - Forest Wildlife Structures --b 10 10
ANM25 - Stockpiling Forages to Extend the Grazing Season --b 1 1
CCR99 - Resource-Conserving Crop Rotation 14 4 18
ENR01 - Fuel use reduction for field operations 5 --b 5
ENR02 - Solar powered electric fence charging systems 17 --b 17
ENR04 - Recycle 100% of farm lubricants 78 --b 78
ENR05 - Locally grown and marketed farm products 17 6 23
FPP02 - On Farm Pilot Projects --b 1 1
FRD01 - On Farm Research and Demonstrations 3 --b 3
PLT01 - Establish pollinator habitat 10 3 13
PLT02 - Monitor key grazing areas to improve grazing management 23 --b 23
PLT05 - Multi-story cropping, sustainable management of nontimber forest plants 9 1 10
PLT06 - Renovation of a windbreak or shelter belt, or hedgerow for wildlife habitat 5 --b 5
PLT07 - Hardwood Crop Tree Release 13 2 15
PLT10 - Intensive Management of Rotational Grazing 11 1 12
PLT11 - Conifer Crop Tree Release --b 2 2
PLT12 - Patch Harvesting --b 1 1
SOE01 - Continuous no till with high residue 14 10 24
SOE02 - Protection of cultural resources sites with conservation cover --b 1 1
SQL01 - Controlled traffic system 3 4 7
SQL02 - Continuous cover crops 7 6 13
SQL03 - Drainage water management for nutrient, pathogen, or pesticide reduction 2 1 3
SQL04 - Use of Cover Crop Mixes 7 6 13
SQL05 - Use deep rooted crops to breakup soil compaction 24 6 30
SQL07 - Forest Stand Improvement for Soil Quality --b 3 3
WQL01 - Biological suppression and other non-chemical techniques to manage brush, weeds, invasive species 5 2 7
WQL02 - Biological suppression and other non-chemical techniques to manage herbaceous weeds invasive species 3 --b 3
WQL03 - Rotation of supplement and feeding areas 29 3 32
WQL04 - Plant Tissue Testing and Analysis to Improve Nitrogen Management 22 15 37
WQL05 - Apply nutrients no more than 30 days prior to planned planting date 6 --b 6
WQL06 - Apply controlled release nitrogen fertilizer 16 18 34
WQL07 - Split nitrogen applications 50% after crop/pasture emergence/green up 10 8 18
WQL08 - Apply split applications of nitrogen based on a pre-sidedress nitrogen test on cropland 9 8 17
WQL09 - Apply phosphorus fertilizer below soil surface 1 --b 1
WQL10 - Plant an annual grass-type cover crop that will scavenge residual nitrogen 12 12 24
WQL11 - Precision application technology to apply nutrients 19 6 25
WQL12 - Managing livestock access to water bodies/courses 8 1 9
WQL13 - High level Integrated Pest Management to reduce pesticide environmental risk 16 6 22
WQL14 - Land application of only treated manure 3 3 6
WQL15 - Reduce the concentration of nutrients on livestock farms 5 --b 5
WQL16 - Use of legume cover crops as a nitrogen source 2 --b 2
WQL17 - Use of non-chemical methods to kill cover crops 2 1 3
WQL18 - Non- Chemical Pest Control for Livestock 2 2 4
WQL19 - Transition to Organic Grazing Systems 1 --b 1
WQL21 - Integrated Pest Management for Organic Farming. 2 --b 2
WQT01 - Irrigation system automation --b 1 1
WQT03 - Irrigation pumping plant evaluation --b 1 1
OKLAHOMA 2,720 2,765 5,485
314 - Brush Management 11 7 18
328 - Conservation Crop Rotation --b 2 2
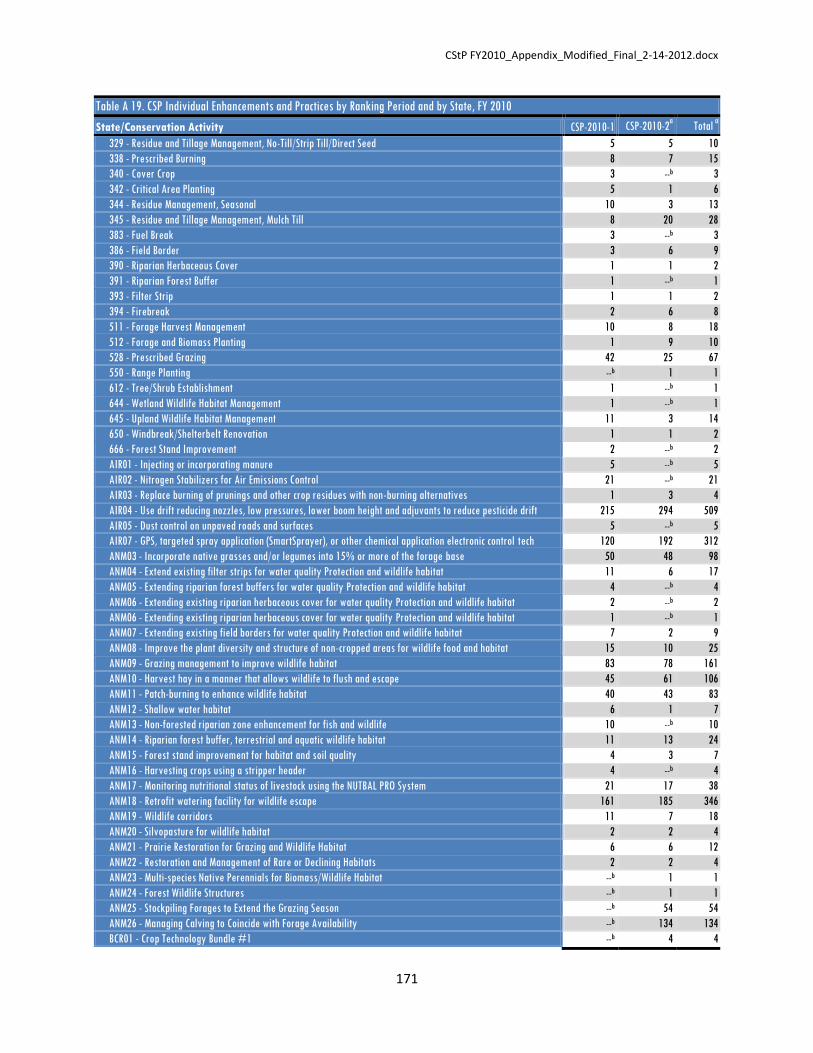
CStP FY2010_Appendix_Modified_Final_2-14-2012.docx
171
Table A 19. CSP Individual Enhancements and Practices by Ranking Period and by State, FY 2010
State/Conservation Activity CSP-2010-1 CSP-2010-2a Total
a
329 - Residue and Tillage Management, No-Till/Strip Till/Direct Seed 5 5 10
338 - Prescribed Burning 8 7 15
340 - Cover Crop 3 --b 3
342 - Critical Area Planting 5 1 6
344 - Residue Management, Seasonal 10 3 13
345 - Residue and Tillage Management, Mulch Till 8 20 28
383 - Fuel Break 3 --b 3
386 - Field Border 3 6 9
390 - Riparian Herbaceous Cover 1 1 2
391 - Riparian Forest Buffer 1 --b 1
393 - Filter Strip 1 1 2
394 - Firebreak 2 6 8
511 - Forage Harvest Management 10 8 18
512 - Forage and Biomass Planting 1 9 10
528 - Prescribed Grazing 42 25 67
550 - Range Planting --b 1 1
612 - Tree/Shrub Establishment 1 --b 1
644 - Wetland Wildlife Habitat Management 1 --b 1
645 - Upland Wildlife Habitat Management 11 3 14
650 - Windbreak/Shelterbelt Renovation 1 1 2
666 - Forest Stand Improvement 2 --b 2
AIR01 - Injecting or incorporating manure 5 --b 5
AIR02 - Nitrogen Stabilizers for Air Emissions Control 21 --b 21
AIR03 - Replace burning of prunings and other crop residues with non-burning alternatives 1 3 4
AIR04 - Use drift reducing nozzles, low pressures, lower boom height and adjuvants to reduce pesticide drift 215 294 509
AIR05 - Dust control on unpaved roads and surfaces 5 --b 5
AIR07 - GPS, targeted spray application (SmartSprayer), or other chemical application electronic control tech 120 192 312
ANM03 - Incorporate native grasses and/or legumes into 15% or more of the forage base 50 48 98
ANM04 - Extend existing filter strips for water quality Protection and wildlife habitat 11 6 17
ANM05 - Extending riparian forest buffers for water quality Protection and wildlife habitat 4 --b 4
ANM06 - Extending existing riparian herbaceous cover for water quality Protection and wildlife habitat 2 --b 2
ANM06 - Extending existing riparian herbaceous cover for water quality Protection and wildlife habitat 1 --b 1
ANM07 - Extending existing field borders for water quality Protection and wildlife habitat 7 2 9
ANM08 - Improve the plant diversity and structure of non-cropped areas for wildlife food and habitat 15 10 25
ANM09 - Grazing management to improve wildlife habitat 83 78 161
ANM10 - Harvest hay in a manner that allows wildlife to flush and escape 45 61 106
ANM11 - Patch-burning to enhance wildlife habitat 40 43 83
ANM12 - Shallow water habitat 6 1 7
ANM13 - Non-forested riparian zone enhancement for fish and wildlife 10 --b 10
ANM14 - Riparian forest buffer, terrestrial and aquatic wildlife habitat 11 13 24
ANM15 - Forest stand improvement for habitat and soil quality 4 3 7
ANM16 - Harvesting crops using a stripper header 4 --b 4
ANM17 - Monitoring nutritional status of livestock using the NUTBAL PRO System 21 17 38
ANM18 - Retrofit watering facility for wildlife escape 161 185 346
ANM19 - Wildlife corridors 11 7 18
ANM20 - Silvopasture for wildlife habitat 2 2 4
ANM21 - Prairie Restoration for Grazing and Wildlife Habitat 6 6 12
ANM22 - Restoration and Management of Rare or Declining Habitats 2 2 4
ANM23 - Multi-species Native Perennials for Biomass/Wildlife Habitat --b 1 1
ANM24 - Forest Wildlife Structures --b 1 1
ANM25 - Stockpiling Forages to Extend the Grazing Season --b 54 54
ANM26 - Managing Calving to Coincide with Forage Availability --b 134 134
BCR01 - Crop Technology Bundle #1 --b 4 4

CStP FY2010_Appendix_Modified_Final_2-14-2012.docx
172
Table A 19. CSP Individual Enhancements and Practices by Ranking Period and by State, FY 2010
State/Conservation Activity CSP-2010-1 CSP-2010-2a Total
a
BFO02 - Forest Bundle #2 --b 1 1
BPA01 - Pasture Grazing Bundle #1 --b 1 1
BRA01 - Range Grazing Bundle #1 --b 4 4
CCR99 - Resource-Conserving Crop Rotation 36 9 45
ENR01 - Fuel use reduction for field operations 9 --b 9
ENR02 - Solar powered electric fence charging systems 74 --b 74
ENR03 - Pumping plant powered by renewable energy 22 20 42
ENR04 - Recycle 100% of farm lubricants 463 --b 463
ENR05 - Locally grown and marketed farm products 69 155 224
FRD01 - On Farm Research and Demonstrations 1 --b 1
PLT01 - Establish pollinator habitat 10 5 15
PLT02 - Monitor key grazing areas to improve grazing management 202 255 457
PLT03 - Forest stand improvement pre-treating vegetation and fuels --b 3 3
PLT04 - Forest Stand Improvement, Prescribed burning 2 2 4
PLT05 - Multi-story cropping, sustainable management of nontimber forest plants --b 1 1
PLT06 - Renovation of a windbreak or shelter belt, or hedgerow for wildlife habitat 4 1 5
PLT07 - Hardwood Crop Tree Release 1 2 3
PLT10 - Intensive Management of Rotational Grazing 36 17 53
PLT11 - Conifer Crop Tree Release --b 3 3
PLT12 - Patch Harvesting --b 1 1
SOE01 - Continuous no till with high residue 19 33 52
SOE02 - Protection of cultural resources sites with conservation cover 5 1 6
SQL01 - Controlled traffic system 12 23 35
SQL02 - Continuous cover crops 4 9 13
SQL04 - Use of Cover Crop Mixes 2 4 6
SQL05 - Use deep rooted crops to breakup soil compaction 20 27 47
SQL06 - Conversion of cropped land to grass-based agriculture 10 19 29
SQL07 - Forest Stand Improvement for Soil Quality --b 5 5
WQL01 - Biological suppression and other non-chemical techniques to manage brush, weeds, invasive species 37 26 63
WQL02 - Biological suppression and other non-chemical techniques to manage herbaceous weeds invasive species 33 --b 33
WQL03 - Rotation of supplement and feeding areas 397 591 988
WQL04 - Plant Tissue Testing and Analysis to Improve Nitrogen Management 14 27 41
WQL05 - Apply nutrients no more than 30 days prior to planned planting date 45 --b 45
WQL05 - Apply nutrients no more than 30 days prior to planned planting date 10 --b 10
WQL06 - Apply controlled release nitrogen fertilizer 8 24 32
WQL07 - Split nitrogen applications 50% after crop/pasture emergence/green up 63 115 178
WQL08 - Apply split applications of nitrogen based on a pre-sidedress nitrogen test on cropland 3 1 4
WQL09 - Apply phosphorus fertilizer below soil surface 34 --b 34
WQL10 - Plant an annual grass-type cover crop that will scavenge residual nitrogen 2 2 4
WQL11 - Precision application technology to apply nutrients 16 16 32
WQL12 - Managing livestock access to water bodies/courses 22 13 35
WQL13 - High level Integrated Pest Management to reduce pesticide environmental risk 17 36 53
WQL14 - Land application of only treated manure 1 1 2
WQL15 - Reduce the concentration of nutrients on livestock farms 5 3 8
WQL16 - Use of legume cover crops as a nitrogen source 8 5 13
WQL18 - Non- Chemical Pest Control for Livestock 4 4 8
WQL22 - On Farm Composting of Farm Organic Waste --b 2 2
WQL23 - Provide Livestock Protection Away from Sensitive Areas --b 2 2
WQT01 - Irrigation system automation --b 1 1
WQT03 - Irrigation pumping plant evaluation --b 3 3
WQT04 - Regional weather networks for irrigation scheduling 3 2 5
WQT05 - Remote monitoring and notification of irrigation pumping plant operation 4 17 21
OREGON 934 803 1,737

CStP FY2010_Appendix_Modified_Final_2-14-2012.docx
173
Table A 19. CSP Individual Enhancements and Practices by Ranking Period and by State, FY 2010
State/Conservation Activity CSP-2010-1 CSP-2010-2a Total
a
314 - Brush Management 4 4 8
328 - Conservation Crop Rotation 2 1 3
329 - Residue and Tillage Management, No-Till/Strip Till/Direct Seed --b 6 6
338 - Prescribed Burning --b 1 1
342 - Critical Area Planting 2 12 14
344 - Residue Management, Seasonal 1 --b 1
380 - Windbreak/Shelterbelt Establishment 2 2 4
384 - Forest Slash Treatment 3 1 4
386 - Field Border 1 1 2
390 - Riparian Herbaceous Cover --b 1 1
391 - Riparian Forest Buffer --b 2 2
394 - Firebreak 1 1 2
395 - Stream Habitat Improvement and Management 3 2 5
449 - Irrigation Water Management 7 3 10
528 - Prescribed Grazing 4 2 6
550 - Range Planting 1 5 6
612 - Tree/Shrub Establishment 3 2 5
643 - Restoration and Management of Rare and Declining Habitats --b 1 1
644 - Wetland Wildlife Habitat Management 1 2 3
645 - Upland Wildlife Habitat Management 10 3 13
654 - Road/Trail/Landing Closure and Treatment --b 1 1
655 - Forest Trails and Landings 2 1 3
660 - Tree/Shrub Pruning 3 --b 3
666 - Forest Stand Improvement 4 3 7
AIR01 - Injecting or incorporating manure 1 --b 1
AIR03 - Replace burning of prunings and other crop residues with non-burning alternatives 9 3 12
AIR04 - Use drift reducing nozzles, low pressures, lower boom height and adjuvants to reduce pesticide drift 31 43 74
AIR05 - Dust control on unpaved roads and surfaces 11 --b 11
AIR06 - Replacing oil- and wood-fired heaters in orchards and vineyards --b 2 2
AIR07 - GPS, targeted spray application (SmartSprayer), or other chemical application electronic control tech 21 24 45
ANM01 - Drainage water management for seasonal wildlife habitat 1 --b 1
ANM02 - Defer crop production on temporary and seasonal wetlands --b 3 3
ANM03 - Incorporate native grasses and/or legumes into 15% or more of the forage base 5 10 15
ANM04 - Extend existing filter strips for water quality Protection and wildlife habitat 1 3 4
ANM05 - Extending riparian forest buffers for water quality Protection and wildlife habitat 2 --b 2
ANM06 - Extending existing riparian herbaceous cover for water quality Protection and wildlife habitat 2 2 4
ANM07 - Extending existing field borders for water quality Protection and wildlife habitat 2 1 3
ANM08 - Improve the plant diversity and structure of non-cropped areas for wildlife food and habitat 25 11 36
ANM09 - Grazing management to improve wildlife habitat 22 22 44
ANM10 - Harvest hay in a manner that allows wildlife to flush and escape 18 38 56
ANM11 - Patch-burning to enhance wildlife habitat 15 7 22
ANM12 - Shallow water habitat 15 9 24
ANM13 - Non-forested riparian zone enhancement for fish and wildlife 7 3 10
ANM14 - Riparian forest buffer, terrestrial and aquatic wildlife habitat 23 6 29
ANM15 - Forest stand improvement for habitat and soil quality 28 16 44
ANM17 - Monitoring nutritional status of livestock using the NUTBAL PRO System 11 13 24
ANM18 - Retrofit watering facility for wildlife escape 51 52 103
ANM19 - Wildlife corridors 10 5 15
ANM20 - Silvopasture for wildlife habitat 12 5 17
ANM21 - Prairie Restoration for Grazing and Wildlife Habitat --b 1 1
ANM22 - Restoration and Management of Rare or Declining Habitats 13 8 21
ANM23 - Multi-species Native Perennials for Biomass/Wildlife Habitat 1 1 2
ANM24 - Forest Wildlife Structures --b 12 12

CStP FY2010_Appendix_Modified_Final_2-14-2012.docx
174
Table A 19. CSP Individual Enhancements and Practices by Ranking Period and by State, FY 2010
State/Conservation Activity CSP-2010-1 CSP-2010-2a Total
a
ANM25 - Stockpiling Forages to Extend the Grazing Season --b 6 6
ANM26 - Managing Calving to Coincide with Forage Availability --b 17 17
BCR01 - Crop Technology Bundle #1 --b 13 13
BCR02 - Crop Technology Bundle #2 --b 1 1
BFO01 - SE Pine Forest Bundle #1 --b 1 1
BFO02 - Forest Bundle #2 --b 3 3
BPA01 - Pasture Grazing Bundle #1 --b 8 8
BRA01 - Range Grazing Bundle #1 --b 24 24
CCR99 - Resource-Conserving Crop Rotation 7 3 10
ENR01 - Fuel use reduction for field operations 5 --b 5
ENR02 - Solar powered electric fence charging systems 17 --b 17
ENR03 - Pumping plant powered by renewable energy 9 7 16
ENR04 - Recycle 100% of farm lubricants 69 --b 69
ENR05 - Locally grown and marketed farm products 14 30 44
FPP02 - On Farm Pilot Projects 4 --b 4
FRD01 - On Farm Research and Demonstrations 3 --b 3
PLT01 - Establish pollinator habitat 25 14 39
PLT02 - Monitor key grazing areas to improve grazing management 52 47 99
PLT03 - Forest stand improvement pre-treating vegetation and fuels 8 3 11
PLT04 - Forest Stand Improvement, Prescribed burning 5 2 7
PLT05 - Multi-story cropping, sustainable management of nontimber forest plants 6 1 7
PLT06 - Renovation of a windbreak or shelter belt, or hedgerow for wildlife habitat 3 3 6
PLT07 - Hardwood Crop Tree Release 5 2 7
PLT08 - Habitat Development for Beneficial Insects for Pest Management 8 6 14
PLT10 - Intensive Management of Rotational Grazing 14 6 20
PLT11 - Conifer Crop Tree Release --b 12 12
PLT12 - Patch Harvesting --b 2 2
SOE01 - Continuous no till with high residue 9 4 13
SOE02 - Protection of cultural resources sites with conservation cover 2 4 6
SOE03 - Continuous No Till Organic System --b 1 1
SQL01 - Controlled traffic system 1 5 6
SQL02 - Continuous cover crops 3 2 5
SQL04 - Use of Cover Crop Mixes 12 3 15
SQL05 - Use deep rooted crops to breakup soil compaction 10 3 13
SQL06 - Conversion of cropped land to grass-based agriculture 2 --b 2
SQL07 - Forest Stand Improvement for Soil Quality --b 8 8
WQL01 - Biological suppression and other non-chemical techniques to manage brush, weeds, invasive species 11 19 30
WQL02 - Biological suppression and other non-chemical techniques to manage herbaceous weeds invasive species 19 --b 19
WQL03 - Rotation of supplement and feeding areas 75 74 149
WQL04 - Plant Tissue Testing and Analysis to Improve Nitrogen Management 14 7 21
WQL05 - Apply nutrients no more than 30 days prior to planned planting date 10 --b 10
WQL06 - Apply controlled release nitrogen fertilizer 6 9 15
WQL07 - Split nitrogen applications 50% after crop/pasture emergence/green up 9 11 20
WQL08 - Apply split applications of nitrogen based on a pre-sidedress nitrogen test on cropland 4 1 5
WQL09 - Apply phosphorus fertilizer below soil surface 2 --b 2
WQL10 - Plant an annual grass-type cover crop that will scavenge residual nitrogen 4 --b 4
WQL11 - Precision application technology to apply nutrients 4 5 9
WQL12 - Managing livestock access to water bodies/courses 16 10 26
WQL13 - High level Integrated Pest Management to reduce pesticide environmental risk 17 21 38
WQL14 - Land application of only treated manure 4 1 5
WQL15 - Reduce the concentration of nutrients on livestock farms 1 1 2
WQL16 - Use of legume cover crops as a nitrogen source 7 2 9
WQL17 - Use of non-chemical methods to kill cover crops 1 1 2
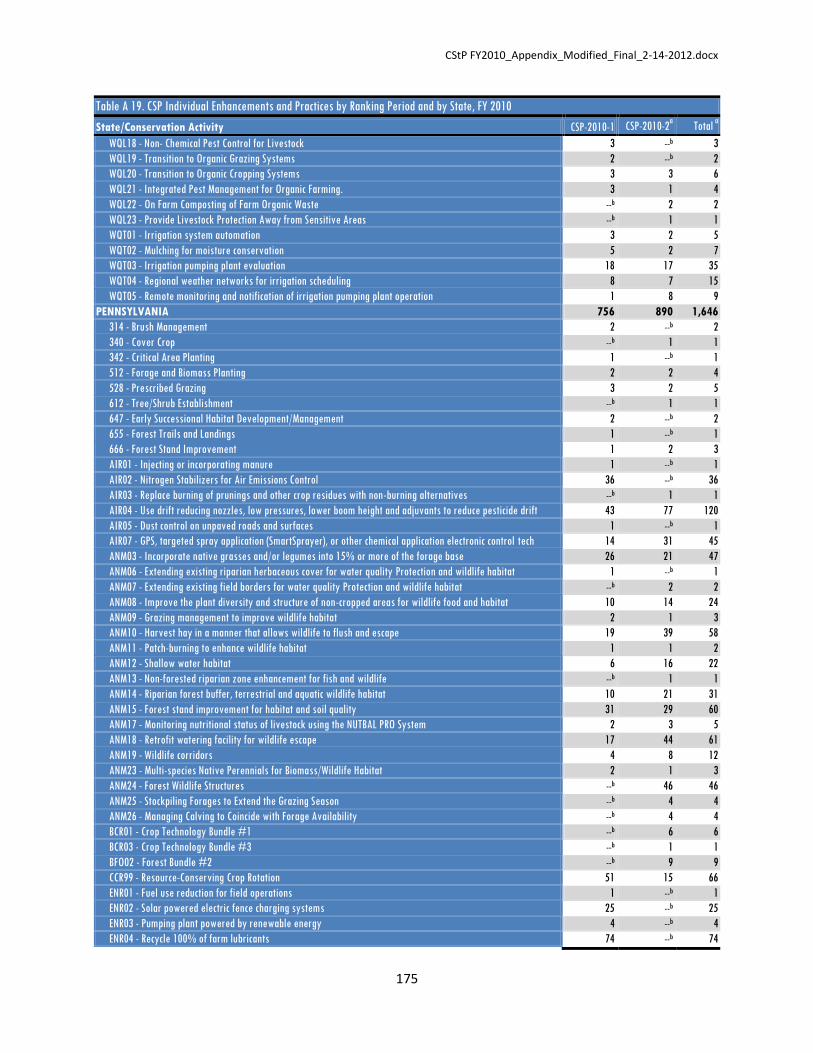
CStP FY2010_Appendix_Modified_Final_2-14-2012.docx
175
Table A 19. CSP Individual Enhancements and Practices by Ranking Period and by State, FY 2010
State/Conservation Activity CSP-2010-1 CSP-2010-2a Total
a
WQL18 - Non- Chemical Pest Control for Livestock 3 --b 3
WQL19 - Transition to Organic Grazing Systems 2 --b 2
WQL20 - Transition to Organic Cropping Systems 3 3 6
WQL21 - Integrated Pest Management for Organic Farming. 3 1 4
WQL22 - On Farm Composting of Farm Organic Waste --b 2 2
WQL23 - Provide Livestock Protection Away from Sensitive Areas --b 1 1
WQT01 - Irrigation system automation 3 2 5
WQT02 - Mulching for moisture conservation 5 2 7
WQT03 - Irrigation pumping plant evaluation 18 17 35
WQT04 - Regional weather networks for irrigation scheduling 8 7 15
WQT05 - Remote monitoring and notification of irrigation pumping plant operation 1 8 9
PENNSYLVANIA 756 890 1,646
314 - Brush Management 2 --b 2
340 - Cover Crop --b 1 1
342 - Critical Area Planting 1 --b 1
512 - Forage and Biomass Planting 2 2 4
528 - Prescribed Grazing 3 2 5
612 - Tree/Shrub Establishment --b 1 1
647 - Early Successional Habitat Development/Management 2 --b 2
655 - Forest Trails and Landings 1 --b 1
666 - Forest Stand Improvement 1 2 3
AIR01 - Injecting or incorporating manure 1 --b 1
AIR02 - Nitrogen Stabilizers for Air Emissions Control 36 --b 36
AIR03 - Replace burning of prunings and other crop residues with non-burning alternatives --b 1 1
AIR04 - Use drift reducing nozzles, low pressures, lower boom height and adjuvants to reduce pesticide drift 43 77 120
AIR05 - Dust control on unpaved roads and surfaces 1 --b 1
AIR07 - GPS, targeted spray application (SmartSprayer), or other chemical application electronic control tech 14 31 45
ANM03 - Incorporate native grasses and/or legumes into 15% or more of the forage base 26 21 47
ANM06 - Extending existing riparian herbaceous cover for water quality Protection and wildlife habitat 1 --b 1
ANM07 - Extending existing field borders for water quality Protection and wildlife habitat --b 2 2
ANM08 - Improve the plant diversity and structure of non-cropped areas for wildlife food and habitat 10 14 24
ANM09 - Grazing management to improve wildlife habitat 2 1 3
ANM10 - Harvest hay in a manner that allows wildlife to flush and escape 19 39 58
ANM11 - Patch-burning to enhance wildlife habitat 1 1 2
ANM12 - Shallow water habitat 6 16 22
ANM13 - Non-forested riparian zone enhancement for fish and wildlife --b 1 1
ANM14 - Riparian forest buffer, terrestrial and aquatic wildlife habitat 10 21 31
ANM15 - Forest stand improvement for habitat and soil quality 31 29 60
ANM17 - Monitoring nutritional status of livestock using the NUTBAL PRO System 2 3 5
ANM18 - Retrofit watering facility for wildlife escape 17 44 61
ANM19 - Wildlife corridors 4 8 12
ANM23 - Multi-species Native Perennials for Biomass/Wildlife Habitat 2 1 3
ANM24 - Forest Wildlife Structures --b 46 46
ANM25 - Stockpiling Forages to Extend the Grazing Season --b 4 4
ANM26 - Managing Calving to Coincide with Forage Availability --b 4 4
BCR01 - Crop Technology Bundle #1 --b 6 6
BCR03 - Crop Technology Bundle #3 --b 1 1
BFO02 - Forest Bundle #2 --b 9 9
CCR99 - Resource-Conserving Crop Rotation 51 15 66
ENR01 - Fuel use reduction for field operations 1 --b 1
ENR02 - Solar powered electric fence charging systems 25 --b 25
ENR03 - Pumping plant powered by renewable energy 4 --b 4
ENR04 - Recycle 100% of farm lubricants 74 --b 74

CStP FY2010_Appendix_Modified_Final_2-14-2012.docx
176
Table A 19. CSP Individual Enhancements and Practices by Ranking Period and by State, FY 2010
State/Conservation Activity CSP-2010-1 CSP-2010-2a Total
a
ENR05 - Locally grown and marketed farm products 19 28 47
FPP02 - On Farm Pilot Projects 4 1 5
FRD01 - On Farm Research and Demonstrations 2 15 17
PLT01 - Establish pollinator habitat 15 45 60
PLT02 - Monitor key grazing areas to improve grazing management 18 18 36
PLT05 - Multi-story cropping, sustainable management of nontimber forest plants 12 16 28
PLT06 - Renovation of a windbreak or shelter belt, or hedgerow for wildlife habitat --b 1 1
PLT07 - Hardwood Crop Tree Release 22 19 41
PLT08 - Habitat Development for Beneficial Insects for Pest Management 1 4 5
PLT10 - Intensive Management of Rotational Grazing 7 3 10
PLT11 - Conifer Crop Tree Release --b 3 3
PLT12 - Patch Harvesting --b 10 10
SOE01 - Continuous no till with high residue 10 11 21
SQL01 - Controlled traffic system 5 2 7
SQL02 - Continuous cover crops 12 14 26
SQL04 - Use of Cover Crop Mixes 49 57 106
SQL05 - Use deep rooted crops to breakup soil compaction 13 20 33
SQL06 - Conversion of cropped land to grass-based agriculture 1 --b 1
SQL07 - Forest Stand Improvement for Soil Quality --b 13 13
WQL01 - Biological suppression and other non-chemical techniques to manage brush, weeds, invasive species 8 7 15
WQL02 - Biological suppression and other non-chemical techniques to manage herbaceous weeds invasive species 4 --b 4
WQL03 - Rotation of supplement and feeding areas 19 18 37
WQL04 - Plant Tissue Testing and Analysis to Improve Nitrogen Management 44 56 100
WQL05 - Apply nutrients no more than 30 days prior to planned planting date 2 --b 2
WQL06 - Apply controlled release nitrogen fertilizer 22 42 64
WQL07 - Split nitrogen applications 50% after crop/pasture emergence/green up 11 17 28
WQL08 - Apply split applications of nitrogen based on a pre-sidedress nitrogen test on cropland 3 8 11
WQL09 - Apply phosphorus fertilizer below soil surface 8 --b 8
WQL10 - Plant an annual grass-type cover crop that will scavenge residual nitrogen 14 17 31
WQL11 - Precision application technology to apply nutrients 1 4 5
WQL12 - Managing livestock access to water bodies/courses 5 1 6
WQL13 - High level Integrated Pest Management to reduce pesticide environmental risk 5 8 13
WQL14 - Land application of only treated manure 3 4 7
WQL15 - Reduce the concentration of nutrients on livestock farms 10 8 18
WQL16 - Use of legume cover crops as a nitrogen source 6 8 14
WQL17 - Use of non-chemical methods to kill cover crops --b 1 1
WQL18 - Non- Chemical Pest Control for Livestock 6 3 9
WQL19 - Transition to Organic Grazing Systems 1 --b 1
WQL22 - On Farm Composting of Farm Organic Waste --b 4 4
WQT02 - Mulching for moisture conservation 1 --b 1
WQT03 - Irrigation pumping plant evaluation --b 1 1
PUERTO RICO 36 --b 36
AIR03 - Replace burning of prunings and other crop residues with non-burning alternatives 2 --b 2
ANM07 - Extending existing field borders for water quality Protection and wildlife habitat 1 --b 1
ANM08 - Improve the plant diversity and structure of non-cropped areas for wildlife food and habitat 1 --b 1
ANM09 - Grazing management to improve wildlife habitat 2 --b 2
ANM10 - Harvest hay in a manner that allows wildlife to flush and escape 2 --b 2
ENR01 - Fuel use reduction for field operations 2 --b 2
ENR04 - Recycle 100% of farm lubricants 6 --b 6
ENR05 - Locally grown and marketed farm products 3 --b 3
FPP02 - On Farm Pilot Projects 3 --b 3
FRD01 - On Farm Research and Demonstrations 3 --b 3
PLT10 - Intensive Management of Rotational Grazing 2 --b 2

CStP FY2010_Appendix_Modified_Final_2-14-2012.docx
177
Table A 19. CSP Individual Enhancements and Practices by Ranking Period and by State, FY 2010
State/Conservation Activity CSP-2010-1 CSP-2010-2a Total
a
SOE01 - Continuous no till with high residue 5 --b 5
SQL01 - Controlled traffic system 3 --b 3
WQL16 - Use of legume cover crops as a nitrogen source 1 --b 1
RHODE ISLAND 4 35 39
ANM10 - Harvest hay in a manner that allows wildlife to flush and escape --b 1 1
ANM14 - Riparian forest buffer, terrestrial and aquatic wildlife habitat --b 5 5
ANM15 - Forest stand improvement for habitat and soil quality 1 8 9
ANM22 - Restoration and Management of Rare or Declining Habitats --b 1 1
ANM24 - Forest Wildlife Structures --b 7 7
ANM26 - Managing Calving to Coincide with Forage Availability --b 1 1
ENR04 - Recycle 100% of farm lubricants 1 --b 1
PLT01 - Establish pollinator habitat 1 7 8
SOE02 - Protection of cultural resources sites with conservation cover --b 1 1
SQL05 - Use deep rooted crops to breakup soil compaction 1 --b 1
SQL07 - Forest Stand Improvement for Soil Quality --b 1 1
WQL03 - Rotation of supplement and feeding areas --b 1 1
WQL07 - Split nitrogen applications 50% after crop/pasture emergence/green up --b 1 1
WQL18 - Non- Chemical Pest Control for Livestock --b 1 1
SOUTH CAROLINA 619 443 1,062
340 - Cover Crop --b 1 1
342 - Critical Area Planting --b 2 2
612 - Tree/Shrub Establishment --b 1 1
645 - Upland Wildlife Habitat Management 1 1 2
647 - Early Successional Habitat Development/Management 2 --b 2
666 - Forest Stand Improvement 1 --b 1
AIR01 - Injecting or incorporating manure 1 --b 1
AIR02 - Nitrogen Stabilizers for Air Emissions Control 12 --b 12
AIR03 - Replace burning of prunings and other crop residues with non-burning alternatives 3 1 4
AIR04 - Use drift reducing nozzles, low pressures, lower boom height and adjuvants to reduce pesticide drift 8 40 48
AIR05 - Dust control on unpaved roads and surfaces 2 --b 2
AIR07 - GPS, targeted spray application (SmartSprayer), or other chemical application electronic control tech 12 10 22
ANM03 - Incorporate native grasses and/or legumes into 15% or more of the forage base 7 3 10
ANM04 - Extend existing filter strips for water quality Protection and wildlife habitat 1 --b 1
ANM05 - Extending riparian forest buffers for water quality Protection and wildlife habitat 1 --b 1
ANM08 - Improve the plant diversity and structure of non-cropped areas for wildlife food and habitat 5 2 7
ANM09 - Grazing management to improve wildlife habitat 2 1 3
ANM10 - Harvest hay in a manner that allows wildlife to flush and escape 4 2 6
ANM11 - Patch-burning to enhance wildlife habitat 20 5 25
ANM12 - Shallow water habitat 6 3 9
ANM13 - Non-forested riparian zone enhancement for fish and wildlife 1 --b 1
ANM14 - Riparian forest buffer, terrestrial and aquatic wildlife habitat 11 7 18
ANM15 - Forest stand improvement for habitat and soil quality 13 10 23
ANM18 - Retrofit watering facility for wildlife escape --b 5 5
ANM19 - Wildlife corridors 13 2 15
ANM20 - Silvopasture for wildlife habitat 1 --b 1
ANM22 - Restoration and Management of Rare or Declining Habitats 11 2 13
ANM23 - Multi-species Native Perennials for Biomass/Wildlife Habitat --b 2 2
ANM24 - Forest Wildlife Structures --b 57 57
ANM25 - Stockpiling Forages to Extend the Grazing Season --b 4 4
ANM26 - Managing Calving to Coincide with Forage Availability --b 7 7
BFO01 - SE Pine Forest Bundle #1 --b 5 5
CCR99 - Resource-Conserving Crop Rotation 11 2 13
ENR02 - Solar powered electric fence charging systems 3 --b 3

CStP FY2010_Appendix_Modified_Final_2-14-2012.docx
178
Table A 19. CSP Individual Enhancements and Practices by Ranking Period and by State, FY 2010
State/Conservation Activity CSP-2010-1 CSP-2010-2a Total
a
ENR03 - Pumping plant powered by renewable energy 1 1 2
ENR04 - Recycle 100% of farm lubricants 214 --b 214
ENR05 - Locally grown and marketed farm products 32 51 83
FPP02 - On Farm Pilot Projects 1 --b 1
FRD01 - On Farm Research and Demonstrations 8 1 9
PLT01 - Establish pollinator habitat 39 27 66
PLT02 - Monitor key grazing areas to improve grazing management 4 6 10
PLT03 - Forest stand improvement pre-treating vegetation and fuels 12 10 22
PLT04 - Forest Stand Improvement, Prescribed burning 40 37 77
PLT07 - Hardwood Crop Tree Release 6 1 7
PLT08 - Habitat Development for Beneficial Insects for Pest Management 1 --b 1
PLT10 - Intensive Management of Rotational Grazing 5 3 8
PLT11 - Conifer Crop Tree Release --b 1 1
SOE01 - Continuous no till with high residue 7 1 8
SQL01 - Controlled traffic system 2 2 4
SQL02 - Continuous cover crops 4 4 8
SQL04 - Use of Cover Crop Mixes 5 20 25
SQL05 - Use deep rooted crops to breakup soil compaction 1 --b 1
SQL07 - Forest Stand Improvement for Soil Quality --b 19 19
WQL01 - Biological suppression and other non-chemical techniques to manage brush, weeds, invasive species 2 --b 2
WQL02 - Biological suppression and other non-chemical techniques to manage herbaceous weeds invasive species 3 --b 3
WQL03 - Rotation of supplement and feeding areas 21 17 38
WQL04 - Plant Tissue Testing and Analysis to Improve Nitrogen Management 4 3 7
WQL05 - Apply nutrients no more than 30 days prior to planned planting date 5 --b 5
WQL06 - Apply controlled release nitrogen fertilizer 12 5 17
WQL07 - Split nitrogen applications 50% after crop/pasture emergence/green up 11 36 47
WQL08 - Apply split applications of nitrogen based on a pre-sidedress nitrogen test on cropland 1 1 2
WQL10 - Plant an annual grass-type cover crop that will scavenge residual nitrogen 1 --b 1
WQL11 - Precision application technology to apply nutrients 9 3 12
WQL12 - Managing livestock access to water bodies/courses 2 4 6
WQL13 - High level Integrated Pest Management to reduce pesticide environmental risk 4 2 6
WQL15 - Reduce the concentration of nutrients on livestock farms 1 7 8
WQL16 - Use of legume cover crops as a nitrogen source 3 --b 3
WQL17 - Use of non-chemical methods to kill cover crops 1 --b 1
WQL18 - Non- Chemical Pest Control for Livestock 1 --b 1
WQL19 - Transition to Organic Grazing Systems --b 1 1
WQL20 - Transition to Organic Cropping Systems 1 --b 1
WQL21 - Integrated Pest Management for Organic Farming. 1 --b 1
WQT01 - Irrigation system automation 1 --b 1
WQT02 - Mulching for moisture conservation --b 1 1
WQT03 - Irrigation pumping plant evaluation --b 3 3
WQT04 - Regional weather networks for irrigation scheduling 1 --b 1
WQT05 - Remote monitoring and notification of irrigation pumping plant operation --b 1 1
SOUTH DAKOTA 1,373 1,518 2,891
314 - Brush Management 2 --b 2
328 - Conservation Crop Rotation 3 4 7
329 - Residue and Tillage Management, No-Till/Strip Till/Direct Seed 1 2 3
338 - Prescribed Burning 1 --b 1
340 - Cover Crop 2 --b 2
342 - Critical Area Planting 4 --b 4
345 - Residue and Tillage Management, Mulch Till --b 3 3
380 - Windbreak/Shelterbelt Establishment 2 3 5
384 - Forest Slash Treatment 1 --b 1

CStP FY2010_Appendix_Modified_Final_2-14-2012.docx
179
Table A 19. CSP Individual Enhancements and Practices by Ranking Period and by State, FY 2010
State/Conservation Activity CSP-2010-1 CSP-2010-2a Total
a
386 - Field Border 1 1 2
393 - Filter Strip 1 1 2
394 - Firebreak 1 1 2
512 - Forage and Biomass Planting 1 1 2
528 - Prescribed Grazing 4 2 6
644 - Wetland Wildlife Habitat Management 1 --b 1
645 - Upland Wildlife Habitat Management 2 --b 2
647 - Early Successional Habitat Development/Management 1 --b 1
650 - Windbreak/Shelterbelt Renovation --b 1 1
AIR01 - Injecting or incorporating manure 6 --b 6
AIR02 - Nitrogen Stabilizers for Air Emissions Control 9 --b 9
AIR03 - Replace burning of prunings and other crop residues with non-burning alternatives 1 --b 1
AIR04 - Use drift reducing nozzles, low pressures, lower boom height and adjuvants to reduce pesticide drift 99 149 248
AIR05 - Dust control on unpaved roads and surfaces 1 --b 1
AIR07 - GPS, targeted spray application (SmartSprayer), or other chemical application electronic control tech 48 78 126
ANM02 - Defer crop production on temporary and seasonal wetlands 1 3 4
ANM03 - Incorporate native grasses and/or legumes into 15% or more of the forage base 9 3 12
ANM04 - Extend existing filter strips for water quality Protection and wildlife habitat 11 6 17
ANM05 - Extending riparian forest buffers for water quality Protection and wildlife habitat 1 --b 1
ANM06 - Extending existing riparian herbaceous cover for water quality Protection and wildlife habitat --b 12 12
ANM07 - Extending existing field borders for water quality Protection and wildlife habitat 4 3 7
ANM08 - Improve the plant diversity and structure of non-cropped areas for wildlife food and habitat 14 6 20
ANM09 - Grazing management to improve wildlife habitat 29 35 64
ANM10 - Harvest hay in a manner that allows wildlife to flush and escape 72 76 148
ANM11 - Patch-burning to enhance wildlife habitat 1 1 2
ANM12 - Shallow water habitat 6 1 7
ANM13 - Non-forested riparian zone enhancement for fish and wildlife 7 7 14
ANM14 - Riparian forest buffer, terrestrial and aquatic wildlife habitat 5 2 7
ANM15 - Forest stand improvement for habitat and soil quality 1 --b 1
ANM16 - Harvesting crops using a stripper header 8 --b 8
ANM17 - Monitoring nutritional status of livestock using the NUTBAL PRO System 14 31 45
ANM18 - Retrofit watering facility for wildlife escape 112 99 211
ANM19 - Wildlife corridors 8 9 17
ANM20 - Silvopasture for wildlife habitat 1 --b 1
ANM21 - Prairie Restoration for Grazing and Wildlife Habitat 1 2 3
ANM22 - Restoration and Management of Rare or Declining Habitats 1 1 2
ANM23 - Multi-species Native Perennials for Biomass/Wildlife Habitat 2 1 3
ANM24 - Forest Wildlife Structures --b 1 1
ANM26 - Managing Calving to Coincide with Forage Availability --b 32 32
BCR01 - Crop Technology Bundle #1 --b 3 3
BPA01 - Pasture Grazing Bundle #1 --b 4 4
BRA01 - Range Grazing Bundle #1 --b 32 32
CCR99 - Resource-Conserving Crop Rotation 57 40 97
ENR01 - Fuel use reduction for field operations 9 --b 9
ENR02 - Solar powered electric fence charging systems 37 --b 37
ENR03 - Pumping plant powered by renewable energy --b 1 1
ENR04 - Recycle 100% of farm lubricants 39 --b 39
ENR05 - Locally grown and marketed farm products 6 --b 6
FPP02 - On Farm Pilot Projects --b 1 1
PLT01 - Establish pollinator habitat 5 11 16
PLT02 - Monitor key grazing areas to improve grazing management 98 102 200
PLT06 - Renovation of a windbreak or shelter belt, or hedgerow for wildlife habitat 10 22 32
PLT10 - Intensive Management of Rotational Grazing 16 11 27
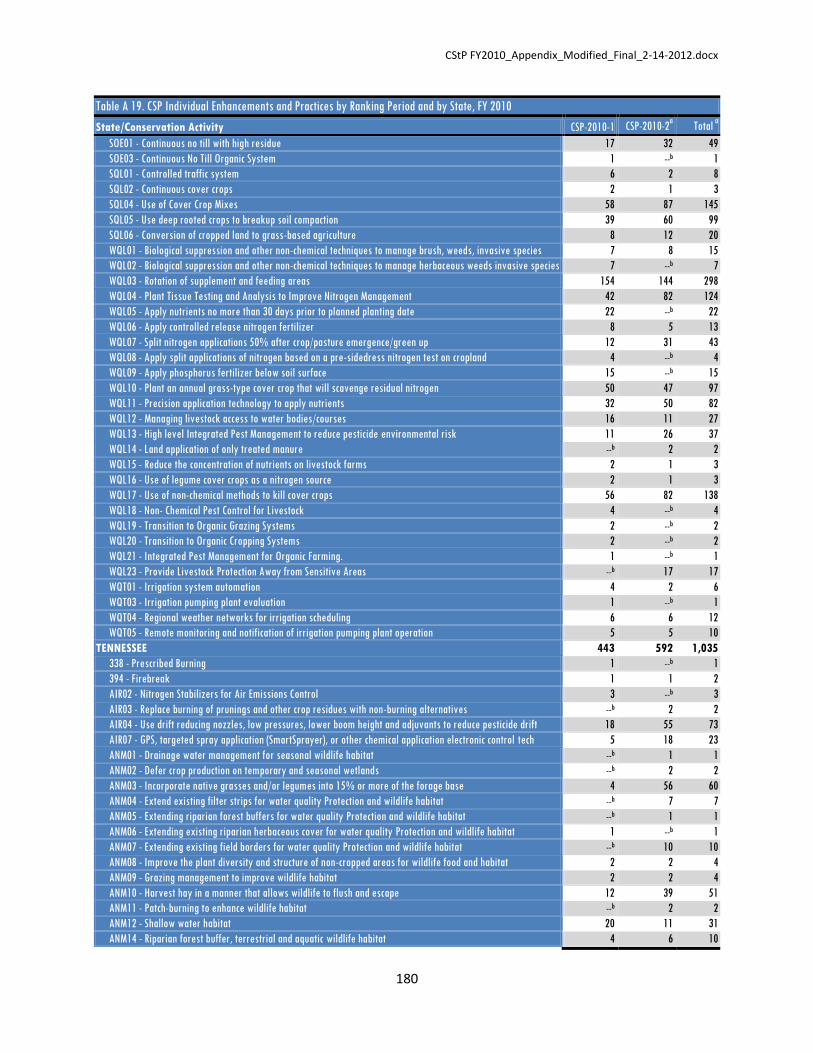
CStP FY2010_Appendix_Modified_Final_2-14-2012.docx
180
Table A 19. CSP Individual Enhancements and Practices by Ranking Period and by State, FY 2010
State/Conservation Activity CSP-2010-1 CSP-2010-2a Total
a
SOE01 - Continuous no till with high residue 17 32 49
SOE03 - Continuous No Till Organic System 1 --b 1
SQL01 - Controlled traffic system 6 2 8
SQL02 - Continuous cover crops 2 1 3
SQL04 - Use of Cover Crop Mixes 58 87 145
SQL05 - Use deep rooted crops to breakup soil compaction 39 60 99
SQL06 - Conversion of cropped land to grass-based agriculture 8 12 20
WQL01 - Biological suppression and other non-chemical techniques to manage brush, weeds, invasive species 7 8 15
WQL02 - Biological suppression and other non-chemical techniques to manage herbaceous weeds invasive species 7 --b 7
WQL03 - Rotation of supplement and feeding areas 154 144 298
WQL04 - Plant Tissue Testing and Analysis to Improve Nitrogen Management 42 82 124
WQL05 - Apply nutrients no more than 30 days prior to planned planting date 22 --b 22
WQL06 - Apply controlled release nitrogen fertilizer 8 5 13
WQL07 - Split nitrogen applications 50% after crop/pasture emergence/green up 12 31 43
WQL08 - Apply split applications of nitrogen based on a pre-sidedress nitrogen test on cropland 4 --b 4
WQL09 - Apply phosphorus fertilizer below soil surface 15 --b 15
WQL10 - Plant an annual grass-type cover crop that will scavenge residual nitrogen 50 47 97
WQL11 - Precision application technology to apply nutrients 32 50 82
WQL12 - Managing livestock access to water bodies/courses 16 11 27
WQL13 - High level Integrated Pest Management to reduce pesticide environmental risk 11 26 37
WQL14 - Land application of only treated manure --b 2 2
WQL15 - Reduce the concentration of nutrients on livestock farms 2 1 3
WQL16 - Use of legume cover crops as a nitrogen source 2 1 3
WQL17 - Use of non-chemical methods to kill cover crops 56 82 138
WQL18 - Non- Chemical Pest Control for Livestock 4 --b 4
WQL19 - Transition to Organic Grazing Systems 2 --b 2
WQL20 - Transition to Organic Cropping Systems 2 --b 2
WQL21 - Integrated Pest Management for Organic Farming. 1 --b 1
WQL23 - Provide Livestock Protection Away from Sensitive Areas --b 17 17
WQT01 - Irrigation system automation 4 2 6
WQT03 - Irrigation pumping plant evaluation 1 --b 1
WQT04 - Regional weather networks for irrigation scheduling 6 6 12
WQT05 - Remote monitoring and notification of irrigation pumping plant operation 5 5 10
TENNESSEE 443 592 1,035
338 - Prescribed Burning 1 --b 1
394 - Firebreak 1 1 2
AIR02 - Nitrogen Stabilizers for Air Emissions Control 3 --b 3
AIR03 - Replace burning of prunings and other crop residues with non-burning alternatives --b 2 2
AIR04 - Use drift reducing nozzles, low pressures, lower boom height and adjuvants to reduce pesticide drift 18 55 73
AIR07 - GPS, targeted spray application (SmartSprayer), or other chemical application electronic control tech 5 18 23
ANM01 - Drainage water management for seasonal wildlife habitat --b 1 1
ANM02 - Defer crop production on temporary and seasonal wetlands --b 2 2
ANM03 - Incorporate native grasses and/or legumes into 15% or more of the forage base 4 56 60
ANM04 - Extend existing filter strips for water quality Protection and wildlife habitat --b 7 7
ANM05 - Extending riparian forest buffers for water quality Protection and wildlife habitat --b 1 1
ANM06 - Extending existing riparian herbaceous cover for water quality Protection and wildlife habitat 1 --b 1
ANM07 - Extending existing field borders for water quality Protection and wildlife habitat --b 10 10
ANM08 - Improve the plant diversity and structure of non-cropped areas for wildlife food and habitat 2 2 4
ANM09 - Grazing management to improve wildlife habitat 2 2 4
ANM10 - Harvest hay in a manner that allows wildlife to flush and escape 12 39 51
ANM11 - Patch-burning to enhance wildlife habitat --b 2 2
ANM12 - Shallow water habitat 20 11 31
ANM14 - Riparian forest buffer, terrestrial and aquatic wildlife habitat 4 6 10
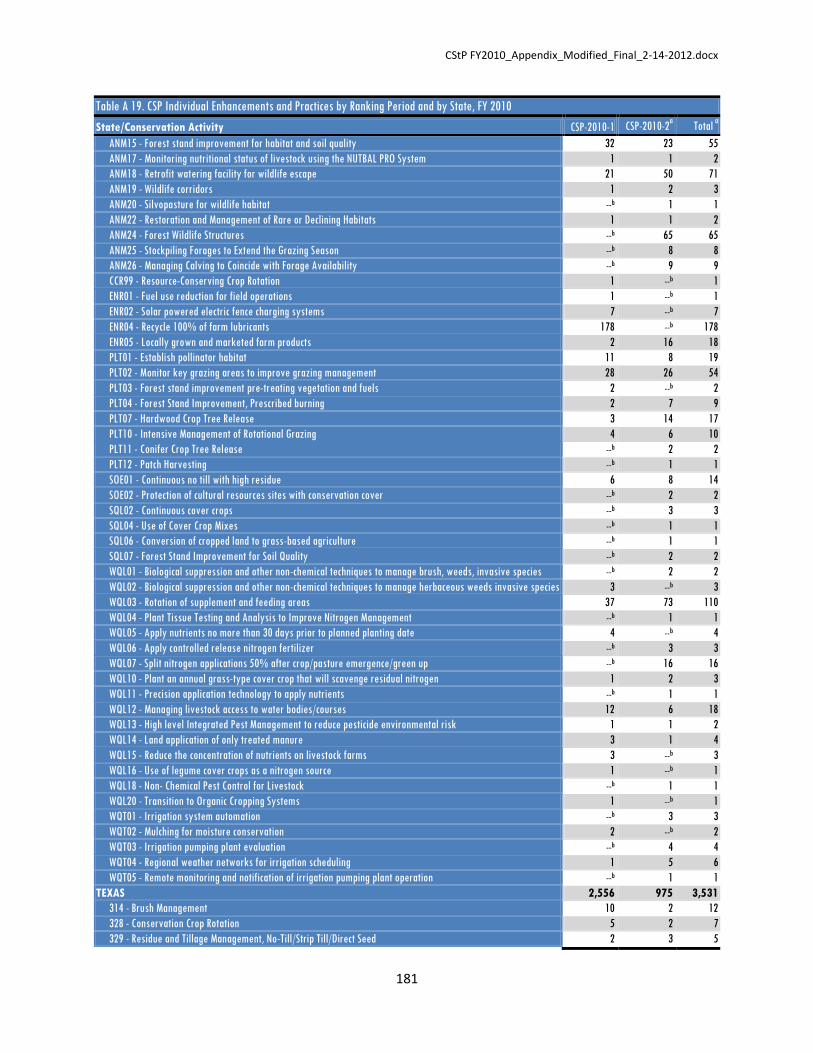
CStP FY2010_Appendix_Modified_Final_2-14-2012.docx
181
Table A 19. CSP Individual Enhancements and Practices by Ranking Period and by State, FY 2010
State/Conservation Activity CSP-2010-1 CSP-2010-2a Total
a
ANM15 - Forest stand improvement for habitat and soil quality 32 23 55
ANM17 - Monitoring nutritional status of livestock using the NUTBAL PRO System 1 1 2
ANM18 - Retrofit watering facility for wildlife escape 21 50 71
ANM19 - Wildlife corridors 1 2 3
ANM20 - Silvopasture for wildlife habitat --b 1 1
ANM22 - Restoration and Management of Rare or Declining Habitats 1 1 2
ANM24 - Forest Wildlife Structures --b 65 65
ANM25 - Stockpiling Forages to Extend the Grazing Season --b 8 8
ANM26 - Managing Calving to Coincide with Forage Availability --b 9 9
CCR99 - Resource-Conserving Crop Rotation 1 --b 1
ENR01 - Fuel use reduction for field operations 1 --b 1
ENR02 - Solar powered electric fence charging systems 7 --b 7
ENR04 - Recycle 100% of farm lubricants 178 --b 178
ENR05 - Locally grown and marketed farm products 2 16 18
PLT01 - Establish pollinator habitat 11 8 19
PLT02 - Monitor key grazing areas to improve grazing management 28 26 54
PLT03 - Forest stand improvement pre-treating vegetation and fuels 2 --b 2
PLT04 - Forest Stand Improvement, Prescribed burning 2 7 9
PLT07 - Hardwood Crop Tree Release 3 14 17
PLT10 - Intensive Management of Rotational Grazing 4 6 10
PLT11 - Conifer Crop Tree Release --b 2 2
PLT12 - Patch Harvesting --b 1 1
SOE01 - Continuous no till with high residue 6 8 14
SOE02 - Protection of cultural resources sites with conservation cover --b 2 2
SQL02 - Continuous cover crops --b 3 3
SQL04 - Use of Cover Crop Mixes --b 1 1
SQL06 - Conversion of cropped land to grass-based agriculture --b 1 1
SQL07 - Forest Stand Improvement for Soil Quality --b 2 2
WQL01 - Biological suppression and other non-chemical techniques to manage brush, weeds, invasive species --b 2 2
WQL02 - Biological suppression and other non-chemical techniques to manage herbaceous weeds invasive species 3 --b 3
WQL03 - Rotation of supplement and feeding areas 37 73 110
WQL04 - Plant Tissue Testing and Analysis to Improve Nitrogen Management --b 1 1
WQL05 - Apply nutrients no more than 30 days prior to planned planting date 4 --b 4
WQL06 - Apply controlled release nitrogen fertilizer --b 3 3
WQL07 - Split nitrogen applications 50% after crop/pasture emergence/green up --b 16 16
WQL10 - Plant an annual grass-type cover crop that will scavenge residual nitrogen 1 2 3
WQL11 - Precision application technology to apply nutrients --b 1 1
WQL12 - Managing livestock access to water bodies/courses 12 6 18
WQL13 - High level Integrated Pest Management to reduce pesticide environmental risk 1 1 2
WQL14 - Land application of only treated manure 3 1 4
WQL15 - Reduce the concentration of nutrients on livestock farms 3 --b 3
WQL16 - Use of legume cover crops as a nitrogen source 1 --b 1
WQL18 - Non- Chemical Pest Control for Livestock --b 1 1
WQL20 - Transition to Organic Cropping Systems 1 --b 1
WQT01 - Irrigation system automation --b 3 3
WQT02 - Mulching for moisture conservation 2 --b 2
WQT03 - Irrigation pumping plant evaluation --b 4 4
WQT04 - Regional weather networks for irrigation scheduling 1 5 6
WQT05 - Remote monitoring and notification of irrigation pumping plant operation --b 1 1
TEXAS 2,556 975 3,531
314 - Brush Management 10 2 12
328 - Conservation Crop Rotation 5 2 7
329 - Residue and Tillage Management, No-Till/Strip Till/Direct Seed 2 3 5

CStP FY2010_Appendix_Modified_Final_2-14-2012.docx
182
Table A 19. CSP Individual Enhancements and Practices by Ranking Period and by State, FY 2010
State/Conservation Activity CSP-2010-1 CSP-2010-2a Total
a
338 - Prescribed Burning 14 2 16
340 - Cover Crop 1 --b 1
342 - Critical Area Planting 3 --b 3
344 - Residue Management, Seasonal 11 1 12
345 - Residue and Tillage Management, Mulch Till 5 2 7
380 - Windbreak/Shelterbelt Establishment 1 --b 1
383 - Fuel Break 4 --b 4
386 - Field Border 1 1 2
390 - Riparian Herbaceous Cover 3 --b 3
391 - Riparian Forest Buffer 1 --b 1
394 - Firebreak 21 4 25
395 - Stream Habitat Improvement and Management 8 --b 8
449 - Irrigation Water Management 6 1 7
511 - Forage Harvest Management 5 2 7
512 - Forage and Biomass Planting 5 1 6
528 - Prescribed Grazing 32 4 36
550 - Range Planting 2 --b 2
612 - Tree/Shrub Establishment 11 1 12
644 - Wetland Wildlife Habitat Management 2 --b 2
645 - Upland Wildlife Habitat Management 32 2 34
655 - Forest Trails and Landings 3 --b 3
660 - Tree/Shrub Pruning 1 --b 1
666 - Forest Stand Improvement 6 --b 6
AIR02 - Nitrogen Stabilizers for Air Emissions Control 24 --b 24
AIR03 - Replace burning of prunings and other crop residues with non-burning alternatives 2 --b 2
AIR04 - Use drift reducing nozzles, low pressures, lower boom height and adjuvants to reduce pesticide drift 121 77 198
AIR05 - Dust control on unpaved roads and surfaces 5 --b 5
AIR07 - GPS, targeted spray application (SmartSprayer), or other chemical application electronic control tech 66 36 102
ANM01 - Drainage water management for seasonal wildlife habitat 9 --b 9
ANM02 - Defer crop production on temporary and seasonal wetlands 2 1 3
ANM03 - Incorporate native grasses and/or legumes into 15% or more of the forage base 22 15 37
ANM04 - Extend existing filter strips for water quality Protection and wildlife habitat 5 --b 5
ANM05 - Extending riparian forest buffers for water quality Protection and wildlife habitat 2 2 4
ANM06 - Extending existing riparian herbaceous cover for water quality Protection and wildlife habitat 2 --b 2
ANM07 - Extending existing field borders for water quality Protection and wildlife habitat 1 --b 1
ANM08 - Improve the plant diversity and structure of non-cropped areas for wildlife food and habitat 25 14 39
ANM09 - Grazing management to improve wildlife habitat 109 34 143
ANM10 - Harvest hay in a manner that allows wildlife to flush and escape 21 16 37
ANM11 - Patch-burning to enhance wildlife habitat 45 9 54
ANM12 - Shallow water habitat 24 4 28
ANM13 - Non-forested riparian zone enhancement for fish and wildlife 8 1 9
ANM14 - Riparian forest buffer, terrestrial and aquatic wildlife habitat 51 24 75
ANM15 - Forest stand improvement for habitat and soil quality 19 5 24
ANM16 - Harvesting crops using a stripper header 4 --b 4
ANM17 - Monitoring nutritional status of livestock using the NUTBAL PRO System 42 6 48
ANM18 - Retrofit watering facility for wildlife escape 130 84 214
ANM19 - Wildlife corridors 18 12 30
ANM20 - Silvopasture for wildlife habitat 2 --b 2
ANM21 - Prairie Restoration for Grazing and Wildlife Habitat 8 2 10
ANM22 - Restoration and Management of Rare or Declining Habitats --b 1 1
ANM24 - Forest Wildlife Structures --b 16 16
ANM26 - Managing Calving to Coincide with Forage Availability --b 28 28
BCR01 - Crop Technology Bundle #1 --b 1 1

CStP FY2010_Appendix_Modified_Final_2-14-2012.docx
183
Table A 19. CSP Individual Enhancements and Practices by Ranking Period and by State, FY 2010
State/Conservation Activity CSP-2010-1 CSP-2010-2a Total
a
BPA01 - Pasture Grazing Bundle #1 --b 4 4
BRA01 - Range Grazing Bundle #1 --b 9 9
CCR99 - Resource-Conserving Crop Rotation 8 1 9
ENR01 - Fuel use reduction for field operations 34 --b 34
ENR02 - Solar powered electric fence charging systems 23 --b 23
ENR03 - Pumping plant powered by renewable energy 24 9 33
ENR04 - Recycle 100% of farm lubricants 570 --b 570
ENR05 - Locally grown and marketed farm products 41 12 53
FPP02 - On Farm Pilot Projects --b 3 3
FRD01 - On Farm Research and Demonstrations 9 3 12
PLT01 - Establish pollinator habitat 9 3 12
PLT02 - Monitor key grazing areas to improve grazing management 163 65 228
PLT03 - Forest stand improvement pre-treating vegetation and fuels 9 2 11
PLT04 - Forest Stand Improvement, Prescribed burning 13 9 22
PLT06 - Renovation of a windbreak or shelter belt, or hedgerow for wildlife habitat 3 --b 3
PLT07 - Hardwood Crop Tree Release 4 2 6
PLT08 - Habitat Development for Beneficial Insects for Pest Management 4 --b 4
PLT10 - Intensive Management of Rotational Grazing 56 14 70
PLT11 - Conifer Crop Tree Release --b 3 3
PLT12 - Patch Harvesting --b 2 2
SOE01 - Continuous no till with high residue 13 12 25
SOE02 - Protection of cultural resources sites with conservation cover 4 2 6
SQL01 - Controlled traffic system 15 20 35
SQL02 - Continuous cover crops 1 --b 1
SQL03 - Drainage water management for nutrient, pathogen, or pesticide reduction 1 --b 1
SQL04 - Use of Cover Crop Mixes 2 --b 2
SQL05 - Use deep rooted crops to breakup soil compaction 3 --b 3
SQL06 - Conversion of cropped land to grass-based agriculture 12 5 17
SQL07 - Forest Stand Improvement for Soil Quality --b 7 7
WQL01 - Biological suppression and other non-chemical techniques to manage brush, weeds, invasive species 22 11 33
WQL02 - Biological suppression and other non-chemical techniques to manage herbaceous weeds invasive species 13 --b 13
WQL03 - Rotation of supplement and feeding areas 265 170 435
WQL04 - Plant Tissue Testing and Analysis to Improve Nitrogen Management 23 25 48
WQL05 - Apply nutrients no more than 30 days prior to planned planting date 27 --b 27
WQL06 - Apply controlled release nitrogen fertilizer 18 19 37
WQL07 - Split nitrogen applications 50% after crop/pasture emergence/green up 16 46 62
WQL08 - Apply split applications of nitrogen based on a pre-sidedress nitrogen test on cropland 3 1 4
WQL09 - Apply phosphorus fertilizer below soil surface 25 --b 25
WQL10 - Plant an annual grass-type cover crop that will scavenge residual nitrogen --b 1 1
WQL11 - Precision application technology to apply nutrients 12 15 27
WQL12 - Managing livestock access to water bodies/courses 19 9 28
WQL13 - High level Integrated Pest Management to reduce pesticide environmental risk 26 14 40
WQL14 - Land application of only treated manure 5 4 9
WQL15 - Reduce the concentration of nutrients on livestock farms 7 --b 7
WQL16 - Use of legume cover crops as a nitrogen source 2 1 3
WQL17 - Use of non-chemical methods to kill cover crops 2 --b 2
WQL18 - Non- Chemical Pest Control for Livestock 5 1 6
WQL20 - Transition to Organic Cropping Systems 4 1 5
WQL21 - Integrated Pest Management for Organic Farming. 4 1 5
WQL23 - Provide Livestock Protection Away from Sensitive Areas --b 1 1
WQT01 - Irrigation system automation 5 --b 5
WQT03 - Irrigation pumping plant evaluation 25 14 39
WQT04 - Regional weather networks for irrigation scheduling 34 29 63
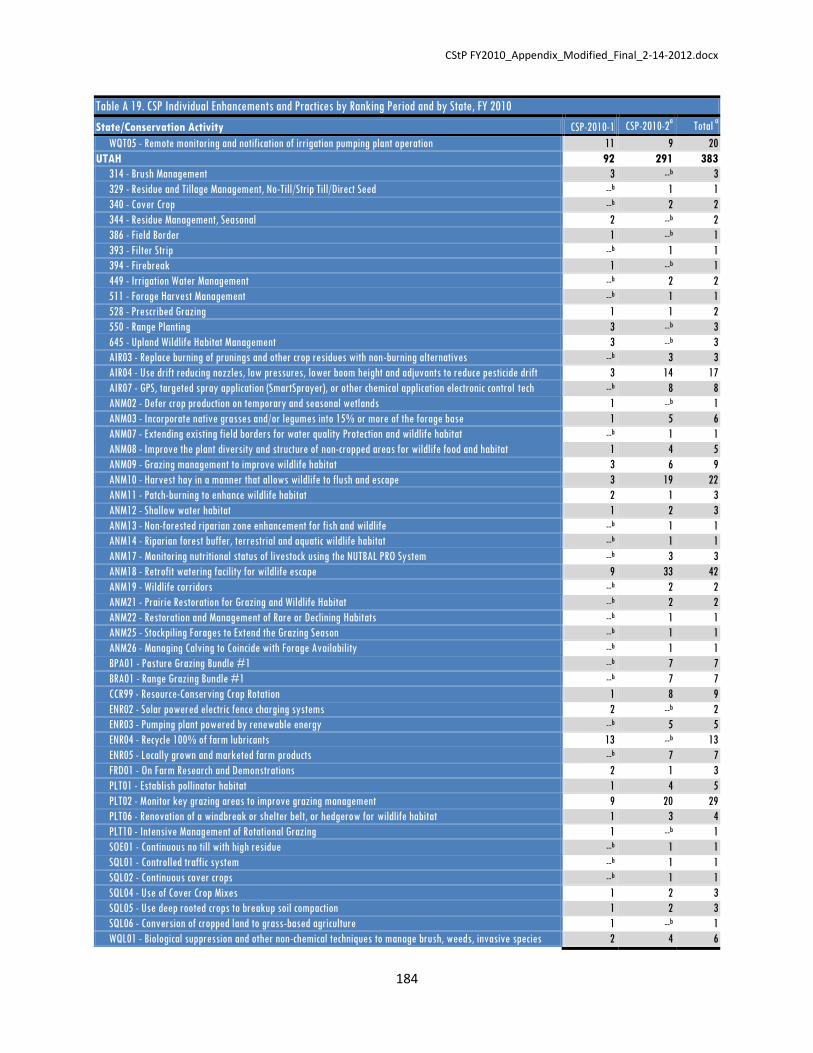
CStP FY2010_Appendix_Modified_Final_2-14-2012.docx
184
Table A 19. CSP Individual Enhancements and Practices by Ranking Period and by State, FY 2010
State/Conservation Activity CSP-2010-1 CSP-2010-2a Total
a
WQT05 - Remote monitoring and notification of irrigation pumping plant operation 11 9 20
UTAH 92 291 383
314 - Brush Management 3 --b 3
329 - Residue and Tillage Management, No-Till/Strip Till/Direct Seed --b 1 1
340 - Cover Crop --b 2 2
344 - Residue Management, Seasonal 2 --b 2
386 - Field Border 1 --b 1
393 - Filter Strip --b 1 1
394 - Firebreak 1 --b 1
449 - Irrigation Water Management --b 2 2
511 - Forage Harvest Management --b 1 1
528 - Prescribed Grazing 1 1 2
550 - Range Planting 3 --b 3
645 - Upland Wildlife Habitat Management 3 --b 3
AIR03 - Replace burning of prunings and other crop residues with non-burning alternatives --b 3 3
AIR04 - Use drift reducing nozzles, low pressures, lower boom height and adjuvants to reduce pesticide drift 3 14 17
AIR07 - GPS, targeted spray application (SmartSprayer), or other chemical application electronic control tech --b 8 8
ANM02 - Defer crop production on temporary and seasonal wetlands 1 --b 1
ANM03 - Incorporate native grasses and/or legumes into 15% or more of the forage base 1 5 6
ANM07 - Extending existing field borders for water quality Protection and wildlife habitat --b 1 1
ANM08 - Improve the plant diversity and structure of non-cropped areas for wildlife food and habitat 1 4 5
ANM09 - Grazing management to improve wildlife habitat 3 6 9
ANM10 - Harvest hay in a manner that allows wildlife to flush and escape 3 19 22
ANM11 - Patch-burning to enhance wildlife habitat 2 1 3
ANM12 - Shallow water habitat 1 2 3
ANM13 - Non-forested riparian zone enhancement for fish and wildlife --b 1 1
ANM14 - Riparian forest buffer, terrestrial and aquatic wildlife habitat --b 1 1
ANM17 - Monitoring nutritional status of livestock using the NUTBAL PRO System --b 3 3
ANM18 - Retrofit watering facility for wildlife escape 9 33 42
ANM19 - Wildlife corridors --b 2 2
ANM21 - Prairie Restoration for Grazing and Wildlife Habitat --b 2 2
ANM22 - Restoration and Management of Rare or Declining Habitats --b 1 1
ANM25 - Stockpiling Forages to Extend the Grazing Season --b 1 1
ANM26 - Managing Calving to Coincide with Forage Availability --b 1 1
BPA01 - Pasture Grazing Bundle #1 --b 7 7
BRA01 - Range Grazing Bundle #1 --b 7 7
CCR99 - Resource-Conserving Crop Rotation 1 8 9
ENR02 - Solar powered electric fence charging systems 2 --b 2
ENR03 - Pumping plant powered by renewable energy --b 5 5
ENR04 - Recycle 100% of farm lubricants 13 --b 13
ENR05 - Locally grown and marketed farm products --b 7 7
FRD01 - On Farm Research and Demonstrations 2 1 3
PLT01 - Establish pollinator habitat 1 4 5
PLT02 - Monitor key grazing areas to improve grazing management 9 20 29
PLT06 - Renovation of a windbreak or shelter belt, or hedgerow for wildlife habitat 1 3 4
PLT10 - Intensive Management of Rotational Grazing 1 --b 1
SOE01 - Continuous no till with high residue --b 1 1
SQL01 - Controlled traffic system --b 1 1
SQL02 - Continuous cover crops --b 1 1
SQL04 - Use of Cover Crop Mixes 1 2 3
SQL05 - Use deep rooted crops to breakup soil compaction 1 2 3
SQL06 - Conversion of cropped land to grass-based agriculture 1 --b 1
WQL01 - Biological suppression and other non-chemical techniques to manage brush, weeds, invasive species 2 4 6
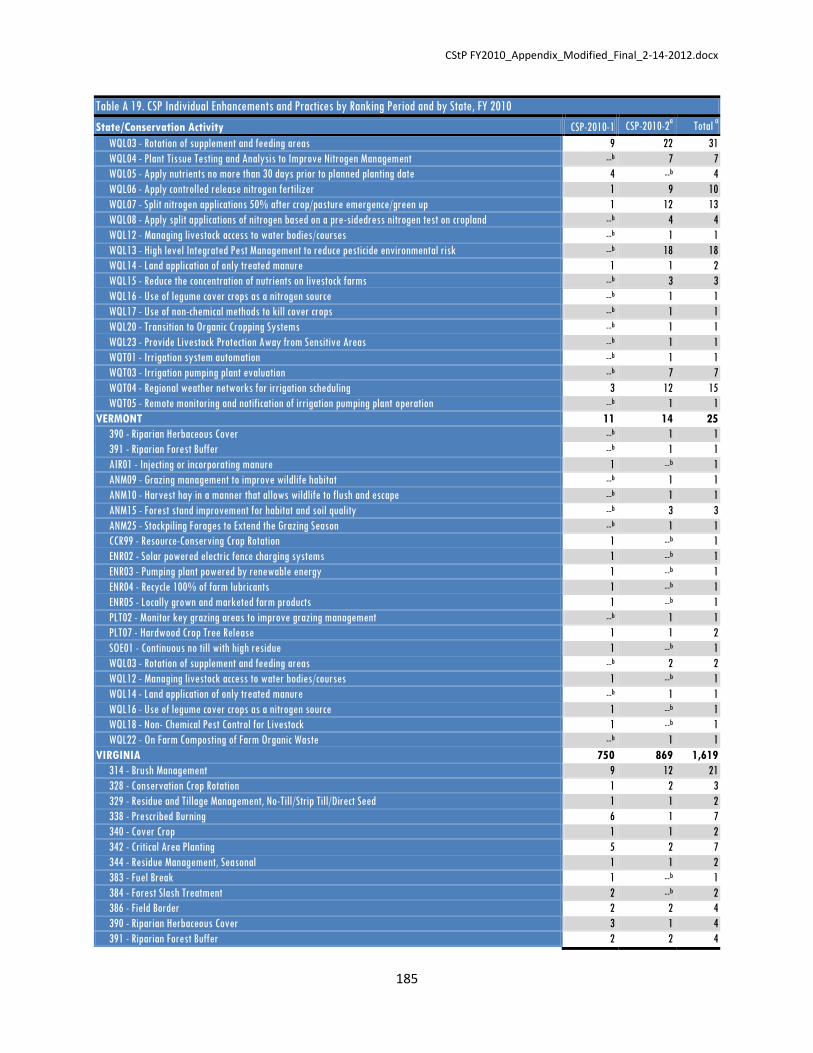
CStP FY2010_Appendix_Modified_Final_2-14-2012.docx
185
Table A 19. CSP Individual Enhancements and Practices by Ranking Period and by State, FY 2010
State/Conservation Activity CSP-2010-1 CSP-2010-2a Total
a
WQL03 - Rotation of supplement and feeding areas 9 22 31
WQL04 - Plant Tissue Testing and Analysis to Improve Nitrogen Management --b 7 7
WQL05 - Apply nutrients no more than 30 days prior to planned planting date 4 --b 4
WQL06 - Apply controlled release nitrogen fertilizer 1 9 10
WQL07 - Split nitrogen applications 50% after crop/pasture emergence/green up 1 12 13
WQL08 - Apply split applications of nitrogen based on a pre-sidedress nitrogen test on cropland --b 4 4
WQL12 - Managing livestock access to water bodies/courses --b 1 1
WQL13 - High level Integrated Pest Management to reduce pesticide environmental risk --b 18 18
WQL14 - Land application of only treated manure 1 1 2
WQL15 - Reduce the concentration of nutrients on livestock farms --b 3 3
WQL16 - Use of legume cover crops as a nitrogen source --b 1 1
WQL17 - Use of non-chemical methods to kill cover crops --b 1 1
WQL20 - Transition to Organic Cropping Systems --b 1 1
WQL23 - Provide Livestock Protection Away from Sensitive Areas --b 1 1
WQT01 - Irrigation system automation --b 1 1
WQT03 - Irrigation pumping plant evaluation --b 7 7
WQT04 - Regional weather networks for irrigation scheduling 3 12 15
WQT05 - Remote monitoring and notification of irrigation pumping plant operation --b 1 1
VERMONT 11 14 25
390 - Riparian Herbaceous Cover --b 1 1
391 - Riparian Forest Buffer --b 1 1
AIR01 - Injecting or incorporating manure 1 --b 1
ANM09 - Grazing management to improve wildlife habitat --b 1 1
ANM10 - Harvest hay in a manner that allows wildlife to flush and escape --b 1 1
ANM15 - Forest stand improvement for habitat and soil quality --b 3 3
ANM25 - Stockpiling Forages to Extend the Grazing Season --b 1 1
CCR99 - Resource-Conserving Crop Rotation 1 --b 1
ENR02 - Solar powered electric fence charging systems 1 --b 1
ENR03 - Pumping plant powered by renewable energy 1 --b 1
ENR04 - Recycle 100% of farm lubricants 1 --b 1
ENR05 - Locally grown and marketed farm products 1 --b 1
PLT02 - Monitor key grazing areas to improve grazing management --b 1 1
PLT07 - Hardwood Crop Tree Release 1 1 2
SOE01 - Continuous no till with high residue 1 --b 1
WQL03 - Rotation of supplement and feeding areas --b 2 2
WQL12 - Managing livestock access to water bodies/courses 1 --b 1
WQL14 - Land application of only treated manure --b 1 1
WQL16 - Use of legume cover crops as a nitrogen source 1 --b 1
WQL18 - Non- Chemical Pest Control for Livestock 1 --b 1
WQL22 - On Farm Composting of Farm Organic Waste --b 1 1
VIRGINIA 750 869 1,619
314 - Brush Management 9 12 21
328 - Conservation Crop Rotation 1 2 3
329 - Residue and Tillage Management, No-Till/Strip Till/Direct Seed 1 1 2
338 - Prescribed Burning 6 1 7
340 - Cover Crop 1 1 2
342 - Critical Area Planting 5 2 7
344 - Residue Management, Seasonal 1 1 2
383 - Fuel Break 1 --b 1
384 - Forest Slash Treatment 2 --b 2
386 - Field Border 2 2 4
390 - Riparian Herbaceous Cover 3 1 4
391 - Riparian Forest Buffer 2 2 4

CStP FY2010_Appendix_Modified_Final_2-14-2012.docx
186
Table A 19. CSP Individual Enhancements and Practices by Ranking Period and by State, FY 2010
State/Conservation Activity CSP-2010-1 CSP-2010-2a Total
a
393 - Filter Strip 1 1 2
394 - Firebreak 6 4 10
395 - Stream Habitat Improvement and Management 1 1 2
511 - Forage Harvest Management 1 11 12
512 - Forage and Biomass Planting 4 12 16
528 - Prescribed Grazing 11 8 19
612 - Tree/Shrub Establishment 4 2 6
644 - Wetland Wildlife Habitat Management 5 2 7
645 - Upland Wildlife Habitat Management 11 11 22
647 - Early Successional Habitat Development/Management 4 6 10
650 - Windbreak/Shelterbelt Renovation --b 1 1
655 - Forest Trails and Landings 6 1 7
660 - Tree/Shrub Pruning 1 --b 1
666 - Forest Stand Improvement 11 1 12
AIR02 - Nitrogen Stabilizers for Air Emissions Control 19 --b 19
AIR03 - Replace burning of prunings and other crop residues with non-burning alternatives 1 1 2
AIR04 - Use drift reducing nozzles, low pressures, lower boom height and adjuvants to reduce pesticide drift 43 89 132
AIR05 - Dust control on unpaved roads and surfaces 1 --b 1
AIR07 - GPS, targeted spray application (SmartSprayer), or other chemical application electronic control tech 26 51 77
ANM03 - Incorporate native grasses and/or legumes into 15% or more of the forage base 22 23 45
ANM04 - Extend existing filter strips for water quality Protection and wildlife habitat 4 8 12
ANM05 - Extending riparian forest buffers for water quality Protection and wildlife habitat 4 2 6
ANM06 - Extending existing riparian herbaceous cover for water quality Protection and wildlife habitat 3 6 9
ANM07 - Extending existing field borders for water quality Protection and wildlife habitat 7 7 14
ANM08 - Improve the plant diversity and structure of non-cropped areas for wildlife food and habitat 12 15 27
ANM09 - Grazing management to improve wildlife habitat 9 4 13
ANM10 - Harvest hay in a manner that allows wildlife to flush and escape 10 15 25
ANM11 - Patch-burning to enhance wildlife habitat 6 --b 6
ANM12 - Shallow water habitat 5 1 6
ANM13 - Non-forested riparian zone enhancement for fish and wildlife 5 1 6
ANM14 - Riparian forest buffer, terrestrial and aquatic wildlife habitat 19 10 29
ANM15 - Forest stand improvement for habitat and soil quality 22 7 29
ANM17 - Monitoring nutritional status of livestock using the NUTBAL PRO System 3 1 4
ANM18 - Retrofit watering facility for wildlife escape 3 7 10
ANM19 - Wildlife corridors 8 12 20
ANM20 - Silvopasture for wildlife habitat 5 2 7
ANM22 - Restoration and Management of Rare or Declining Habitats 4 --b 4
ANM23 - Multi-species Native Perennials for Biomass/Wildlife Habitat 2 2 4
ANM24 - Forest Wildlife Structures --b 13 13
ANM25 - Stockpiling Forages to Extend the Grazing Season --b 16 16
ANM26 - Managing Calving to Coincide with Forage Availability --b 12 12
BCR03 - Crop Technology Bundle #3 --b 2 2
BFO01 - SE Pine Forest Bundle #1 --b 5 5
BFO02 - Forest Bundle #2 --b 4 4
BPA01 - Pasture Grazing Bundle #1 --b 2 2
CCR99 - Resource-Conserving Crop Rotation 12 3 15
ENR02 - Solar powered electric fence charging systems 19 --b 19
ENR03 - Pumping plant powered by renewable energy 1 2 3
ENR04 - Recycle 100% of farm lubricants 98 --b 98
ENR05 - Locally grown and marketed farm products 27 20 47
FPP02 - On Farm Pilot Projects 1 --b 1
FRD01 - On Farm Research and Demonstrations 1 --b 1
PLT01 - Establish pollinator habitat 9 25 34

CStP FY2010_Appendix_Modified_Final_2-14-2012.docx
187
Table A 19. CSP Individual Enhancements and Practices by Ranking Period and by State, FY 2010
State/Conservation Activity CSP-2010-1 CSP-2010-2a Total
a
PLT02 - Monitor key grazing areas to improve grazing management 21 15 36
PLT03 - Forest stand improvement pre-treating vegetation and fuels 4 3 7
PLT04 - Forest Stand Improvement, Prescribed burning 6 14 20
PLT05 - Multi-story cropping, sustainable management of nontimber forest plants 5 1 6
PLT06 - Renovation of a windbreak or shelter belt, or hedgerow for wildlife habitat 2 1 3
PLT07 - Hardwood Crop Tree Release 9 2 11
PLT10 - Intensive Management of Rotational Grazing 19 18 37
PLT11 - Conifer Crop Tree Release --b 11 11
SOE01 - Continuous no till with high residue 7 53 60
SOE02 - Protection of cultural resources sites with conservation cover 1 --b 1
SOE03 - Continuous No Till Organic System --b 1 1
SQL01 - Controlled traffic system 7 4 11
SQL02 - Continuous cover crops 11 8 19
SQL04 - Use of Cover Crop Mixes 6 4 10
SQL05 - Use deep rooted crops to breakup soil compaction 7 7 14
SQL06 - Conversion of cropped land to grass-based agriculture 2 --b 2
SQL07 - Forest Stand Improvement for Soil Quality --b 7 7
WQL01 - Biological suppression and other non-chemical techniques to manage brush, weeds, invasive species 12 10 22
WQL02 - Biological suppression and other non-chemical techniques to manage herbaceous weeds invasive species 9 --b 9
WQL03 - Rotation of supplement and feeding areas 21 25 46
WQL04 - Plant Tissue Testing and Analysis to Improve Nitrogen Management 7 34 41
WQL05 - Apply nutrients no more than 30 days prior to planned planting date 17 --b 17
WQL06 - Apply controlled release nitrogen fertilizer 11 32 43
WQL07 - Split nitrogen applications 50% after crop/pasture emergence/green up 8 57 65
WQL08 - Apply split applications of nitrogen based on a pre-sidedress nitrogen test on cropland 5 35 40
WQL09 - Apply phosphorus fertilizer below soil surface 2 --b 2
WQL10 - Plant an annual grass-type cover crop that will scavenge residual nitrogen 4 15 19
WQL11 - Precision application technology to apply nutrients 4 18 22
WQL12 - Managing livestock access to water bodies/courses 13 10 23
WQL13 - High level Integrated Pest Management to reduce pesticide environmental risk 7 13 20
WQL14 - Land application of only treated manure 2 5 7
WQL15 - Reduce the concentration of nutrients on livestock farms 6 5 11
WQL16 - Use of legume cover crops as a nitrogen source 1 3 4
WQL18 - Non- Chemical Pest Control for Livestock 2 --b 2
WQL21 - Integrated Pest Management for Organic Farming. 1 --b 1
WQL22 - On Farm Composting of Farm Organic Waste --b 3 3
WQT02 - Mulching for moisture conservation --b 1 1
WASHINGTON 347 583 930
328 - Conservation Crop Rotation 1 1 2
329 - Residue and Tillage Management, No-Till/Strip Till/Direct Seed 3 3 6
342 - Critical Area Planting 10 8 18
344 - Residue Management, Seasonal --b 2 2
345 - Residue and Tillage Management, Mulch Till 1 6 7
380 - Windbreak/Shelterbelt Establishment --b 7 7
386 - Field Border --b 4 4
390 - Riparian Herbaceous Cover --b 1 1
393 - Filter Strip --b 2 2
449 - Irrigation Water Management 3 2 5
512 - Forage and Biomass Planting --b 3 3
528 - Prescribed Grazing --b 1 1
645 - Upland Wildlife Habitat Management 3 1 4
AIR01 - Injecting or incorporating manure 1 --b 1
AIR02 - Nitrogen Stabilizers for Air Emissions Control 5 --b 5
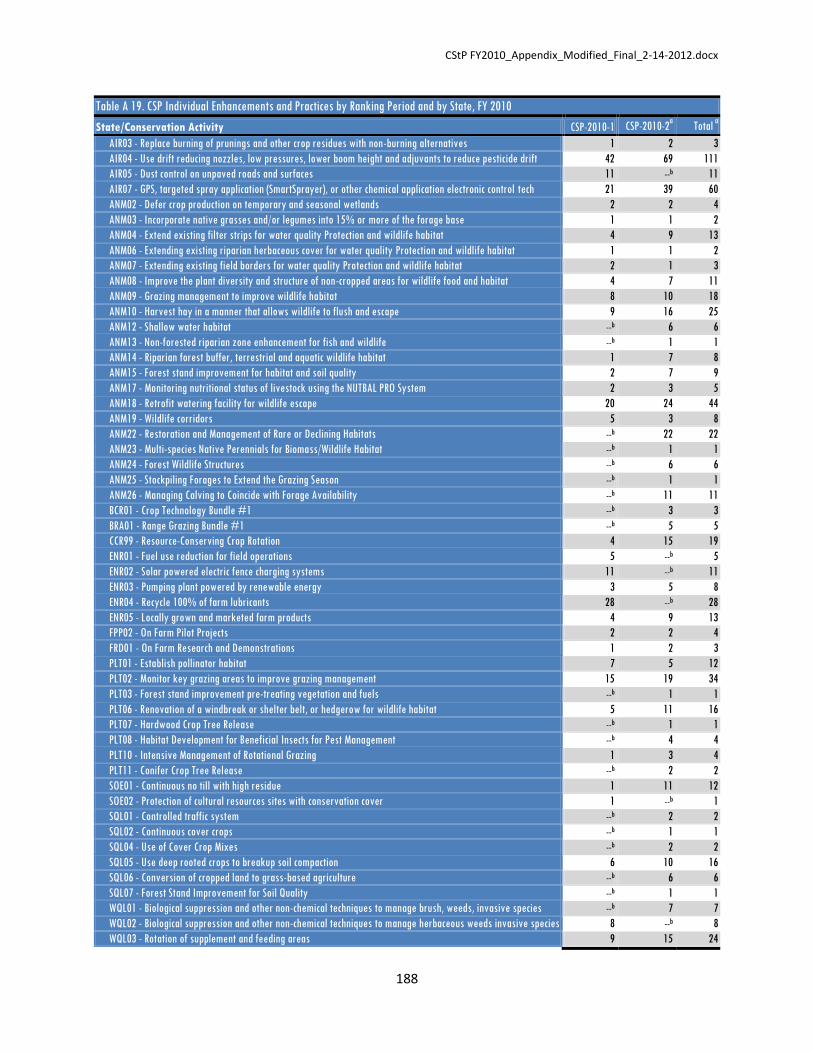
CStP FY2010_Appendix_Modified_Final_2-14-2012.docx
188
Table A 19. CSP Individual Enhancements and Practices by Ranking Period and by State, FY 2010
State/Conservation Activity CSP-2010-1 CSP-2010-2a Total
a
AIR03 - Replace burning of prunings and other crop residues with non-burning alternatives 1 2 3
AIR04 - Use drift reducing nozzles, low pressures, lower boom height and adjuvants to reduce pesticide drift 42 69 111
AIR05 - Dust control on unpaved roads and surfaces 11 --b 11
AIR07 - GPS, targeted spray application (SmartSprayer), or other chemical application electronic control tech 21 39 60
ANM02 - Defer crop production on temporary and seasonal wetlands 2 2 4
ANM03 - Incorporate native grasses and/or legumes into 15% or more of the forage base 1 1 2
ANM04 - Extend existing filter strips for water quality Protection and wildlife habitat 4 9 13
ANM06 - Extending existing riparian herbaceous cover for water quality Protection and wildlife habitat 1 1 2
ANM07 - Extending existing field borders for water quality Protection and wildlife habitat 2 1 3
ANM08 - Improve the plant diversity and structure of non-cropped areas for wildlife food and habitat 4 7 11
ANM09 - Grazing management to improve wildlife habitat 8 10 18
ANM10 - Harvest hay in a manner that allows wildlife to flush and escape 9 16 25
ANM12 - Shallow water habitat --b 6 6
ANM13 - Non-forested riparian zone enhancement for fish and wildlife --b 1 1
ANM14 - Riparian forest buffer, terrestrial and aquatic wildlife habitat 1 7 8
ANM15 - Forest stand improvement for habitat and soil quality 2 7 9
ANM17 - Monitoring nutritional status of livestock using the NUTBAL PRO System 2 3 5
ANM18 - Retrofit watering facility for wildlife escape 20 24 44
ANM19 - Wildlife corridors 5 3 8
ANM22 - Restoration and Management of Rare or Declining Habitats --b 22 22
ANM23 - Multi-species Native Perennials for Biomass/Wildlife Habitat --b 1 1
ANM24 - Forest Wildlife Structures --b 6 6
ANM25 - Stockpiling Forages to Extend the Grazing Season --b 1 1
ANM26 - Managing Calving to Coincide with Forage Availability --b 11 11
BCR01 - Crop Technology Bundle #1 --b 3 3
BRA01 - Range Grazing Bundle #1 --b 5 5
CCR99 - Resource-Conserving Crop Rotation 4 15 19
ENR01 - Fuel use reduction for field operations 5 --b 5
ENR02 - Solar powered electric fence charging systems 11 --b 11
ENR03 - Pumping plant powered by renewable energy 3 5 8
ENR04 - Recycle 100% of farm lubricants 28 --b 28
ENR05 - Locally grown and marketed farm products 4 9 13
FPP02 - On Farm Pilot Projects 2 2 4
FRD01 - On Farm Research and Demonstrations 1 2 3
PLT01 - Establish pollinator habitat 7 5 12
PLT02 - Monitor key grazing areas to improve grazing management 15 19 34
PLT03 - Forest stand improvement pre-treating vegetation and fuels --b 1 1
PLT06 - Renovation of a windbreak or shelter belt, or hedgerow for wildlife habitat 5 11 16
PLT07 - Hardwood Crop Tree Release --b 1 1
PLT08 - Habitat Development for Beneficial Insects for Pest Management --b 4 4
PLT10 - Intensive Management of Rotational Grazing 1 3 4
PLT11 - Conifer Crop Tree Release --b 2 2
SOE01 - Continuous no till with high residue 1 11 12
SOE02 - Protection of cultural resources sites with conservation cover 1 --b 1
SQL01 - Controlled traffic system --b 2 2
SQL02 - Continuous cover crops --b 1 1
SQL04 - Use of Cover Crop Mixes --b 2 2
SQL05 - Use deep rooted crops to breakup soil compaction 6 10 16
SQL06 - Conversion of cropped land to grass-based agriculture --b 6 6
SQL07 - Forest Stand Improvement for Soil Quality --b 1 1
WQL01 - Biological suppression and other non-chemical techniques to manage brush, weeds, invasive species --b 7 7
WQL02 - Biological suppression and other non-chemical techniques to manage herbaceous weeds invasive species 8 --b 8
WQL03 - Rotation of supplement and feeding areas 9 15 24
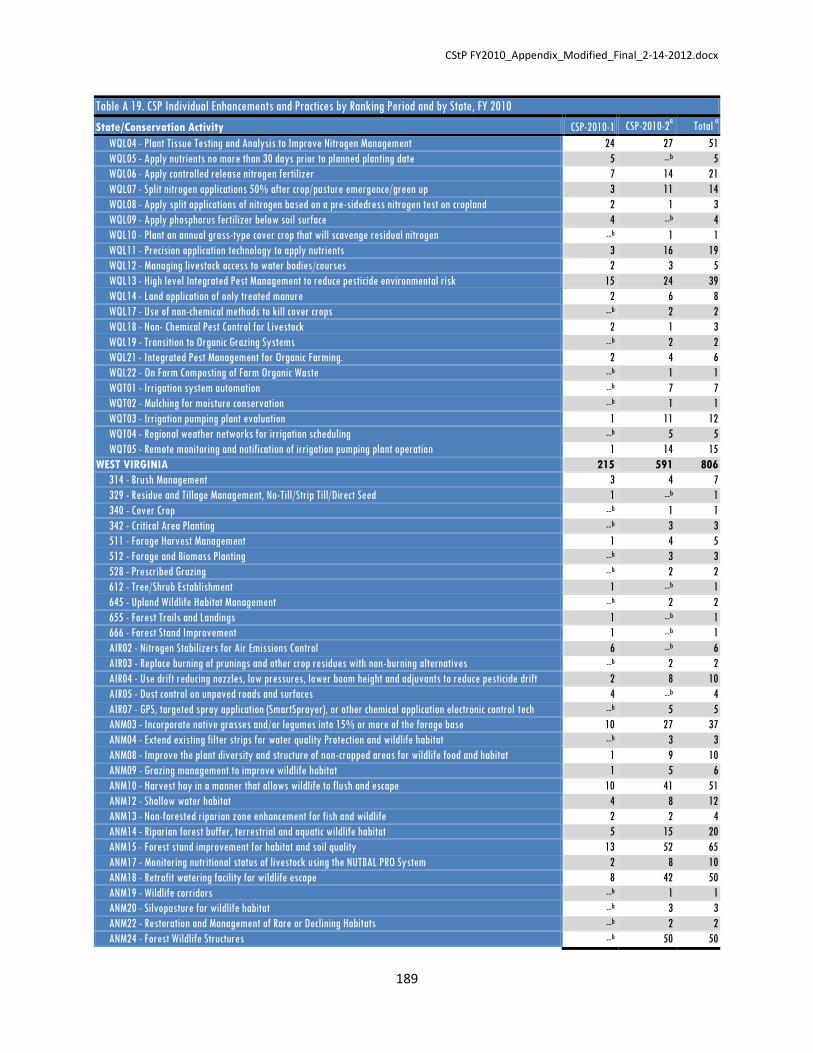
CStP FY2010_Appendix_Modified_Final_2-14-2012.docx
189
Table A 19. CSP Individual Enhancements and Practices by Ranking Period and by State, FY 2010
State/Conservation Activity CSP-2010-1 CSP-2010-2a Total
a
WQL04 - Plant Tissue Testing and Analysis to Improve Nitrogen Management 24 27 51
WQL05 - Apply nutrients no more than 30 days prior to planned planting date 5 --b 5
WQL06 - Apply controlled release nitrogen fertilizer 7 14 21
WQL07 - Split nitrogen applications 50% after crop/pasture emergence/green up 3 11 14
WQL08 - Apply split applications of nitrogen based on a pre-sidedress nitrogen test on cropland 2 1 3
WQL09 - Apply phosphorus fertilizer below soil surface 4 --b 4
WQL10 - Plant an annual grass-type cover crop that will scavenge residual nitrogen --b 1 1
WQL11 - Precision application technology to apply nutrients 3 16 19
WQL12 - Managing livestock access to water bodies/courses 2 3 5
WQL13 - High level Integrated Pest Management to reduce pesticide environmental risk 15 24 39
WQL14 - Land application of only treated manure 2 6 8
WQL17 - Use of non-chemical methods to kill cover crops --b 2 2
WQL18 - Non- Chemical Pest Control for Livestock 2 1 3
WQL19 - Transition to Organic Grazing Systems --b 2 2
WQL21 - Integrated Pest Management for Organic Farming. 2 4 6
WQL22 - On Farm Composting of Farm Organic Waste --b 1 1
WQT01 - Irrigation system automation --b 7 7
WQT02 - Mulching for moisture conservation --b 1 1
WQT03 - Irrigation pumping plant evaluation 1 11 12
WQT04 - Regional weather networks for irrigation scheduling --b 5 5
WQT05 - Remote monitoring and notification of irrigation pumping plant operation 1 14 15
WEST VIRGINIA 215 591 806
314 - Brush Management 3 4 7
329 - Residue and Tillage Management, No-Till/Strip Till/Direct Seed 1 --b 1
340 - Cover Crop --b 1 1
342 - Critical Area Planting --b 3 3
511 - Forage Harvest Management 1 4 5
512 - Forage and Biomass Planting --b 3 3
528 - Prescribed Grazing --b 2 2
612 - Tree/Shrub Establishment 1 --b 1
645 - Upland Wildlife Habitat Management --b 2 2
655 - Forest Trails and Landings 1 --b 1
666 - Forest Stand Improvement 1 --b 1
AIR02 - Nitrogen Stabilizers for Air Emissions Control 6 --b 6
AIR03 - Replace burning of prunings and other crop residues with non-burning alternatives --b 2 2
AIR04 - Use drift reducing nozzles, low pressures, lower boom height and adjuvants to reduce pesticide drift 2 8 10
AIR05 - Dust control on unpaved roads and surfaces 4 --b 4
AIR07 - GPS, targeted spray application (SmartSprayer), or other chemical application electronic control tech --b 5 5
ANM03 - Incorporate native grasses and/or legumes into 15% or more of the forage base 10 27 37
ANM04 - Extend existing filter strips for water quality Protection and wildlife habitat --b 3 3
ANM08 - Improve the plant diversity and structure of non-cropped areas for wildlife food and habitat 1 9 10
ANM09 - Grazing management to improve wildlife habitat 1 5 6
ANM10 - Harvest hay in a manner that allows wildlife to flush and escape 10 41 51
ANM12 - Shallow water habitat 4 8 12
ANM13 - Non-forested riparian zone enhancement for fish and wildlife 2 2 4
ANM14 - Riparian forest buffer, terrestrial and aquatic wildlife habitat 5 15 20
ANM15 - Forest stand improvement for habitat and soil quality 13 52 65
ANM17 - Monitoring nutritional status of livestock using the NUTBAL PRO System 2 8 10
ANM18 - Retrofit watering facility for wildlife escape 8 42 50
ANM19 - Wildlife corridors --b 1 1
ANM20 - Silvopasture for wildlife habitat --b 3 3
ANM22 - Restoration and Management of Rare or Declining Habitats --b 2 2
ANM24 - Forest Wildlife Structures --b 50 50
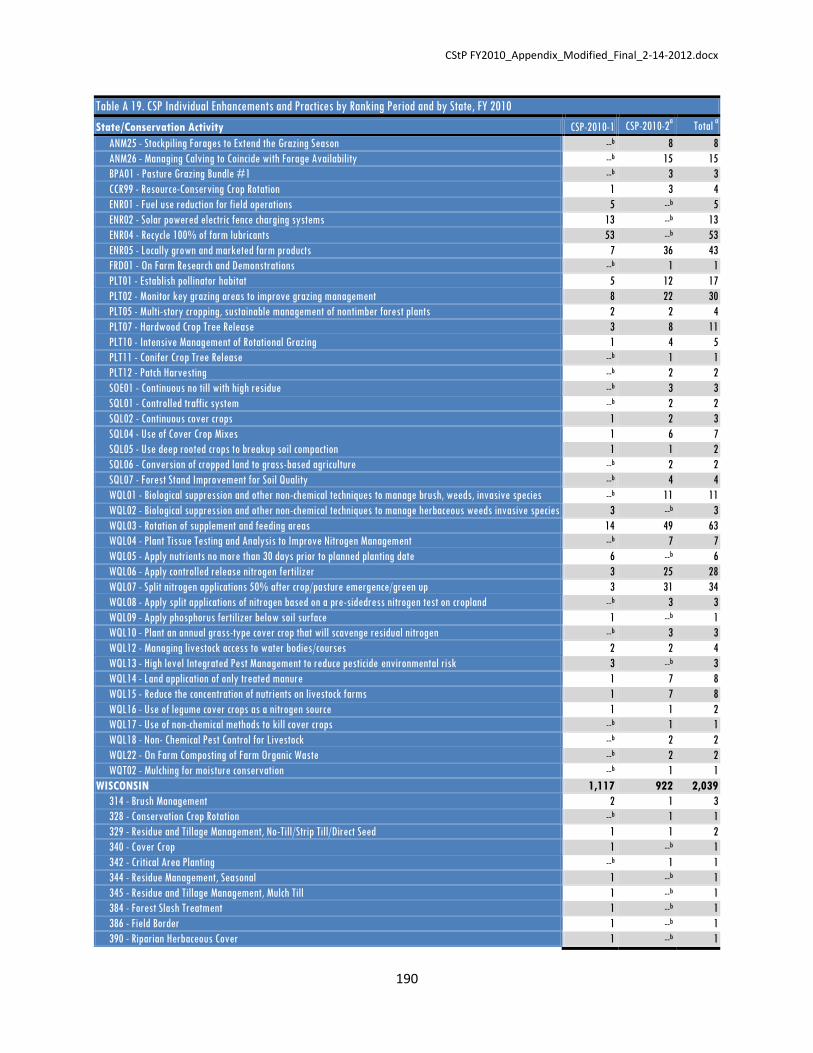
CStP FY2010_Appendix_Modified_Final_2-14-2012.docx
190
Table A 19. CSP Individual Enhancements and Practices by Ranking Period and by State, FY 2010
State/Conservation Activity CSP-2010-1 CSP-2010-2a Total
a
ANM25 - Stockpiling Forages to Extend the Grazing Season --b 8 8
ANM26 - Managing Calving to Coincide with Forage Availability --b 15 15
BPA01 - Pasture Grazing Bundle #1 --b 3 3
CCR99 - Resource-Conserving Crop Rotation 1 3 4
ENR01 - Fuel use reduction for field operations 5 --b 5
ENR02 - Solar powered electric fence charging systems 13 --b 13
ENR04 - Recycle 100% of farm lubricants 53 --b 53
ENR05 - Locally grown and marketed farm products 7 36 43
FRD01 - On Farm Research and Demonstrations --b 1 1
PLT01 - Establish pollinator habitat 5 12 17
PLT02 - Monitor key grazing areas to improve grazing management 8 22 30
PLT05 - Multi-story cropping, sustainable management of nontimber forest plants 2 2 4
PLT07 - Hardwood Crop Tree Release 3 8 11
PLT10 - Intensive Management of Rotational Grazing 1 4 5
PLT11 - Conifer Crop Tree Release --b 1 1
PLT12 - Patch Harvesting --b 2 2
SOE01 - Continuous no till with high residue --b 3 3
SQL01 - Controlled traffic system --b 2 2
SQL02 - Continuous cover crops 1 2 3
SQL04 - Use of Cover Crop Mixes 1 6 7
SQL05 - Use deep rooted crops to breakup soil compaction 1 1 2
SQL06 - Conversion of cropped land to grass-based agriculture --b 2 2
SQL07 - Forest Stand Improvement for Soil Quality --b 4 4
WQL01 - Biological suppression and other non-chemical techniques to manage brush, weeds, invasive species --b 11 11
WQL02 - Biological suppression and other non-chemical techniques to manage herbaceous weeds invasive species 3 --b 3
WQL03 - Rotation of supplement and feeding areas 14 49 63
WQL04 - Plant Tissue Testing and Analysis to Improve Nitrogen Management --b 7 7
WQL05 - Apply nutrients no more than 30 days prior to planned planting date 6 --b 6
WQL06 - Apply controlled release nitrogen fertilizer 3 25 28
WQL07 - Split nitrogen applications 50% after crop/pasture emergence/green up 3 31 34
WQL08 - Apply split applications of nitrogen based on a pre-sidedress nitrogen test on cropland --b 3 3
WQL09 - Apply phosphorus fertilizer below soil surface 1 --b 1
WQL10 - Plant an annual grass-type cover crop that will scavenge residual nitrogen --b 3 3
WQL12 - Managing livestock access to water bodies/courses 2 2 4
WQL13 - High level Integrated Pest Management to reduce pesticide environmental risk 3 --b 3
WQL14 - Land application of only treated manure 1 7 8
WQL15 - Reduce the concentration of nutrients on livestock farms 1 7 8
WQL16 - Use of legume cover crops as a nitrogen source 1 1 2
WQL17 - Use of non-chemical methods to kill cover crops --b 1 1
WQL18 - Non- Chemical Pest Control for Livestock --b 2 2
WQL22 - On Farm Composting of Farm Organic Waste --b 2 2
WQT02 - Mulching for moisture conservation --b 1 1
WISCONSIN 1,117 922 2,039
314 - Brush Management 2 1 3
328 - Conservation Crop Rotation --b 1 1
329 - Residue and Tillage Management, No-Till/Strip Till/Direct Seed 1 1 2
340 - Cover Crop 1 --b 1
342 - Critical Area Planting --b 1 1
344 - Residue Management, Seasonal 1 --b 1
345 - Residue and Tillage Management, Mulch Till 1 --b 1
384 - Forest Slash Treatment 1 --b 1
386 - Field Border 1 --b 1
390 - Riparian Herbaceous Cover 1 --b 1
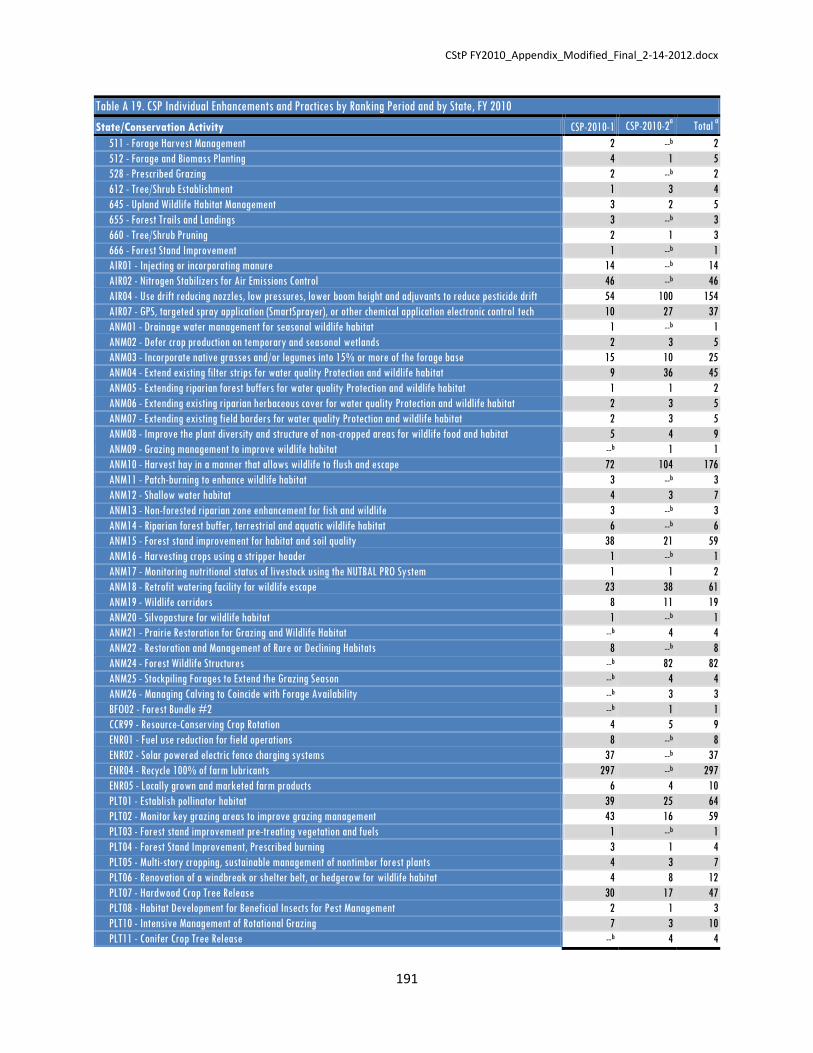
CStP FY2010_Appendix_Modified_Final_2-14-2012.docx
191
Table A 19. CSP Individual Enhancements and Practices by Ranking Period and by State, FY 2010
State/Conservation Activity CSP-2010-1 CSP-2010-2a Total
a
511 - Forage Harvest Management 2 --b 2
512 - Forage and Biomass Planting 4 1 5
528 - Prescribed Grazing 2 --b 2
612 - Tree/Shrub Establishment 1 3 4
645 - Upland Wildlife Habitat Management 3 2 5
655 - Forest Trails and Landings 3 --b 3
660 - Tree/Shrub Pruning 2 1 3
666 - Forest Stand Improvement 1 --b 1
AIR01 - Injecting or incorporating manure 14 --b 14
AIR02 - Nitrogen Stabilizers for Air Emissions Control 46 --b 46
AIR04 - Use drift reducing nozzles, low pressures, lower boom height and adjuvants to reduce pesticide drift 54 100 154
AIR07 - GPS, targeted spray application (SmartSprayer), or other chemical application electronic control tech 10 27 37
ANM01 - Drainage water management for seasonal wildlife habitat 1 --b 1
ANM02 - Defer crop production on temporary and seasonal wetlands 2 3 5
ANM03 - Incorporate native grasses and/or legumes into 15% or more of the forage base 15 10 25
ANM04 - Extend existing filter strips for water quality Protection and wildlife habitat 9 36 45
ANM05 - Extending riparian forest buffers for water quality Protection and wildlife habitat 1 1 2
ANM06 - Extending existing riparian herbaceous cover for water quality Protection and wildlife habitat 2 3 5
ANM07 - Extending existing field borders for water quality Protection and wildlife habitat 2 3 5
ANM08 - Improve the plant diversity and structure of non-cropped areas for wildlife food and habitat 5 4 9
ANM09 - Grazing management to improve wildlife habitat --b 1 1
ANM10 - Harvest hay in a manner that allows wildlife to flush and escape 72 104 176
ANM11 - Patch-burning to enhance wildlife habitat 3 --b 3
ANM12 - Shallow water habitat 4 3 7
ANM13 - Non-forested riparian zone enhancement for fish and wildlife 3 --b 3
ANM14 - Riparian forest buffer, terrestrial and aquatic wildlife habitat 6 --b 6
ANM15 - Forest stand improvement for habitat and soil quality 38 21 59
ANM16 - Harvesting crops using a stripper header 1 --b 1
ANM17 - Monitoring nutritional status of livestock using the NUTBAL PRO System 1 1 2
ANM18 - Retrofit watering facility for wildlife escape 23 38 61
ANM19 - Wildlife corridors 8 11 19
ANM20 - Silvopasture for wildlife habitat 1 --b 1
ANM21 - Prairie Restoration for Grazing and Wildlife Habitat --b 4 4
ANM22 - Restoration and Management of Rare or Declining Habitats 8 --b 8
ANM24 - Forest Wildlife Structures --b 82 82
ANM25 - Stockpiling Forages to Extend the Grazing Season --b 4 4
ANM26 - Managing Calving to Coincide with Forage Availability --b 3 3
BFO02 - Forest Bundle #2 --b 1 1
CCR99 - Resource-Conserving Crop Rotation 4 5 9
ENR01 - Fuel use reduction for field operations 8 --b 8
ENR02 - Solar powered electric fence charging systems 37 --b 37
ENR04 - Recycle 100% of farm lubricants 297 --b 297
ENR05 - Locally grown and marketed farm products 6 4 10
PLT01 - Establish pollinator habitat 39 25 64
PLT02 - Monitor key grazing areas to improve grazing management 43 16 59
PLT03 - Forest stand improvement pre-treating vegetation and fuels 1 --b 1
PLT04 - Forest Stand Improvement, Prescribed burning 3 1 4
PLT05 - Multi-story cropping, sustainable management of nontimber forest plants 4 3 7
PLT06 - Renovation of a windbreak or shelter belt, or hedgerow for wildlife habitat 4 8 12
PLT07 - Hardwood Crop Tree Release 30 17 47
PLT08 - Habitat Development for Beneficial Insects for Pest Management 2 1 3
PLT10 - Intensive Management of Rotational Grazing 7 3 10
PLT11 - Conifer Crop Tree Release --b 4 4

CStP FY2010_Appendix_Modified_Final_2-14-2012.docx
192
Table A 19. CSP Individual Enhancements and Practices by Ranking Period and by State, FY 2010
State/Conservation Activity CSP-2010-1 CSP-2010-2a Total
a
PLT12 - Patch Harvesting --b 4 4
SOE01 - Continuous no till with high residue 5 11 16
SOE03 - Continuous No Till Organic System 1 --b 1
SQL01 - Controlled traffic system 1 3 4
SQL02 - Continuous cover crops 4 9 13
SQL04 - Use of Cover Crop Mixes 3 11 14
SQL05 - Use deep rooted crops to breakup soil compaction 6 6 12
SQL06 - Conversion of cropped land to grass-based agriculture --b 1 1
SQL07 - Forest Stand Improvement for Soil Quality --b 8 8
WQL01 - Biological suppression and other non-chemical techniques to manage brush, weeds, invasive species 4 10 14
WQL02 - Biological suppression and other non-chemical techniques to manage herbaceous weeds invasive species 12 --b 12
WQL03 - Rotation of supplement and feeding areas 32 29 61
WQL04 - Plant Tissue Testing and Analysis to Improve Nitrogen Management 67 116 183
WQL05 - Apply nutrients no more than 30 days prior to planned planting date 10 --b 10
WQL06 - Apply controlled release nitrogen fertilizer 31 32 63
WQL07 - Split nitrogen applications 50% after crop/pasture emergence/green up 25 28 53
WQL08 - Apply split applications of nitrogen based on a pre-sidedress nitrogen test on cropland 11 18 29
WQL09 - Apply phosphorus fertilizer below soil surface 3 --b 3
WQL10 - Plant an annual grass-type cover crop that will scavenge residual nitrogen 11 19 30
WQL11 - Precision application technology to apply nutrients 8 23 31
WQL12 - Managing livestock access to water bodies/courses 1 4 5
WQL13 - High level Integrated Pest Management to reduce pesticide environmental risk 8 4 12
WQL14 - Land application of only treated manure 6 11 17
WQL15 - Reduce the concentration of nutrients on livestock farms 5 5 10
WQL16 - Use of legume cover crops as a nitrogen source 9 3 12
WQL17 - Use of non-chemical methods to kill cover crops 2 1 3
WQL18 - Non- Chemical Pest Control for Livestock 3 2 5
WQL20 - Transition to Organic Cropping Systems --b 1 1
WQL21 - Integrated Pest Management for Organic Farming. 3 --b 3
WQT01 - Irrigation system automation 1 --b 1
WQT03 - Irrigation pumping plant evaluation 1 4 5
WQT04 - Regional weather networks for irrigation scheduling 3 --b 3
WQT05 - Remote monitoring and notification of irrigation pumping plant operation --b 1 1
WYOMING 336 431 767
314 - Brush Management 1 --b 1
328 - Conservation Crop Rotation --b 1 1
380 - Windbreak/Shelterbelt Establishment 2 4 6
395 - Stream Habitat Improvement and Management 1 --b 1
449 - Irrigation Water Management 6 --b 6
644 - Wetland Wildlife Habitat Management 1 1 2
AIR01 - Injecting or incorporating manure 3 --b 3
AIR03 - Replace burning of prunings and other crop residues with non-burning alternatives 1 --b 1
AIR04 - Use drift reducing nozzles, low pressures, lower boom height and adjuvants to reduce pesticide drift 2 15 17
AIR07 - GPS, targeted spray application (SmartSprayer), or other chemical application electronic control tech 2 9 11
ANM03 - Incorporate native grasses and/or legumes into 15% or more of the forage base --b 1 1
ANM04 - Extend existing filter strips for water quality Protection and wildlife habitat --b 3 3
ANM05 - Extending riparian forest buffers for water quality Protection and wildlife habitat --b 2 2
ANM06 - Extending existing riparian herbaceous cover for water quality Protection and wildlife habitat --b 1 1
ANM07 - Extending existing field borders for water quality Protection and wildlife habitat 1 8 9
ANM08 - Improve the plant diversity and structure of non-cropped areas for wildlife food and habitat 2 5 7
ANM09 - Grazing management to improve wildlife habitat 16 13 29
ANM10 - Harvest hay in a manner that allows wildlife to flush and escape 24 47 71
ANM11 - Patch-burning to enhance wildlife habitat 2 2 4

CStP FY2010_Appendix_Modified_Final_2-14-2012.docx
193
Table A 19. CSP Individual Enhancements and Practices by Ranking Period and by State, FY 2010
State/Conservation Activity CSP-2010-1 CSP-2010-2a Total
a
ANM12 - Shallow water habitat 3 2 5
ANM13 - Non-forested riparian zone enhancement for fish and wildlife 2 1 3
ANM14 - Riparian forest buffer, terrestrial and aquatic wildlife habitat 1 --b 1
ANM17 - Monitoring nutritional status of livestock using the NUTBAL PRO System 8 --b 8
ANM18 - Retrofit watering facility for wildlife escape 65 66 131
ANM19 - Wildlife corridors --b 1 1
ANM20 - Silvopasture for wildlife habitat 2 --b 2
ANM21 - Prairie Restoration for Grazing and Wildlife Habitat --b 2 2
ANM26 - Managing Calving to Coincide with Forage Availability --b 12 12
BPA01 - Pasture Grazing Bundle #1 --b 5 5
BRA01 - Range Grazing Bundle #1 --b 10 10
ENR01 - Fuel use reduction for field operations 1 --b 1
ENR02 - Solar powered electric fence charging systems 7 --b 7
ENR03 - Pumping plant powered by renewable energy 2 8 10
ENR04 - Recycle 100% of farm lubricants 28 --b 28
ENR05 - Locally grown and marketed farm products 1 2 3
PLT01 - Establish pollinator habitat 2 5 7
PLT02 - Monitor key grazing areas to improve grazing management 51 35 86
PLT06 - Renovation of a windbreak or shelter belt, or hedgerow for wildlife habitat 8 8 16
PLT10 - Intensive Management of Rotational Grazing 1 --b 1
SOE01 - Continuous no till with high residue --b 8 8
SOE02 - Protection of cultural resources sites with conservation cover --b 1 1
SQL02 - Continuous cover crops 1 --b 1
SQL05 - Use deep rooted crops to breakup soil compaction 1 1 2
SQL06 - Conversion of cropped land to grass-based agriculture --b 1 1
WQL01 - Biological suppression and other non-chemical techniques to manage brush, weeds, invasive species 1 9 10
WQL02 - Biological suppression and other non-chemical techniques to manage herbaceous weeds invasive species 7 --b 7
WQL03 - Rotation of supplement and feeding areas 44 75 119
WQL04 - Plant Tissue Testing and Analysis to Improve Nitrogen Management 5 4 9
WQL05 - Apply nutrients no more than 30 days prior to planned planting date 6 --b 6
WQL06 - Apply controlled release nitrogen fertilizer 3 14 17
WQL07 - Split nitrogen applications 50% after crop/pasture emergence/green up 6 5 11
WQL08 - Apply split applications of nitrogen based on a pre-sidedress nitrogen test on cropland 1 --b 1
WQL11 - Precision application technology to apply nutrients --b 2 2
WQL12 - Managing livestock access to water bodies/courses 1 2 3
WQL13 - High level Integrated Pest Management to reduce pesticide environmental risk 4 7 11
WQL14 - Land application of only treated manure --b 1 1
WQL16 - Use of legume cover crops as a nitrogen source --b 1 1
WQL23 - Provide Livestock Protection Away from Sensitive Areas --b 1 1
WQT01 - Irrigation system automation 2 2 4
WQT02 - Mulching for moisture conservation --b 1 1
WQT03 - Irrigation pumping plant evaluation 4 20 24
WQT04 - Regional weather networks for irrigation scheduling 3 6 9
WQT05 - Remote monitoring and notification of irrigation pumping plant operation 1 1 2
Grand Total 39,444 39,503 78,947 aEnhancement and practice data are not available for 27 contracts. Contracts are stored in county offices.
bNot applicable.

CStP FY2010_Appendix_Modified_Final_2-14-2012.docx
194
Table A 20. CSP Enhancements and Practices , FY 2010
Code Enhancements/Practices
Enhancements/Practices Measured in Acres Other Measurement Units
CSP-2010-1 CSP-2010-2a FY 2010
a
CSP-
2010-1
CSP-
2010-2 a
FY
2010 a
Amt. Ac. Treat. Amt. Ac. Treat. Amt. Ac. Treat. Amt. Amt. Amt.
314 Brush Management 129 13,416 65 6,335 194 19,751 --b --b --b
328 Conservation Crop Rotation 59 33,667 106 62,059 165 95,726 --b --b --b
329 Residue and Tillage Management, No-Till/Strip
Till/Direct Seed 58 23,314 99 42,491 157 65,805 --b --b --b
338 Prescribed Burning 111 20,407 56 13,983 167 34,390 --b --b --b
340 Cover Crop 34 6,246 66 13,051 100 19,297 --b --b --b
342 Critical Area Planting 69 354 58 286 127 640 --b --b --b
344 Residue Management, Seasonal 67 22,176 47 24,557 114 46,733 --b --b --b
345 Residue and Tillage Management, Mulch Till 45 29,439 57 44,182 102 73,620 --b --b --b
380 Windbreak/Shelterbelt Establishment --b --b --b --b --b --b 32 65 97
383 Fuel Break 15 579 16 2,004 31 2,583 --b --b --b
384 Forest Slash Treatment 19 949 10 642 29 1,591 --b --b --b
386 Field Border 29 420 62 35,361 91 35,781 --b --b --b
390 Riparian Herbaceous Cover 14 62 9 41 23 102 --b --b --b
391 Riparian Forest Buffer 6 48 30 37,894 36 37,941 --b --b --b
393 Filter Strip 22 117 42 180 64 297 --b --b --b
394 Firebreak --b --b --b --b --b --b 140 93 233
395 Stream Habitat Improvement and Management 28 1,158 11 89 39 1,247 --b --b --b
449 Irrigation Water Management 116 38,140 130 55,594 246 93,734 --b --b --b
511 Forage Harvest Management 37 3,592 58 5,213 95 8,805 --b --b --b
512 Forage and Biomass Planting 44 1,280 60 3,114 104 4,395 --b --b --b
528 Prescribed Grazing 193 140,463 98 56,462 291 196,925 --b --b --b
550 Range Planting 12 6,781 11 511 23 7,292 --b --b --b
612 Tree/Shrub Establishment 107 3,448 64 2,120 171 5,567 --b --b --b
643 Restoration and Management of Rare and
Declining Habitats 15 656 10 302 25 958 --b --b --b
644 Wetland Wildlife Habitat Management 78 8,890 46 2,491 124 11,381 --b --b --b
645 Upland Wildlife Habitat Management 227 77,646 139 29,174 366 106,821 --b --b --b
647 Early Successional Habitat
Development/Management 40 3,157 39 750 79 3,907 --b --b --b
650 Windbreak/Shelterbelt Renovation --b --b --b --b --b --b 9 10 19
654 Road/Trail/Landing Closure and Treatment --b --b --b --b --b --b --b 8 8
655 Forest Trails and Landings 50 534 21 21,607 71 22,141 --b --b --b
660 Tree/Shrub Pruning 23 273 15 2,137 38 2,410 --b --b --b
666 Forest Stand Improvement 129 9,735 67 6,672 196 16,408 --b --b --b
722 Road/Landing Removal 4 109 --b --b 4 109 --b --b --b
AIR01 Injecting or incorporating manure 202 62,139 --b --b 202 62,139 --b --b --b
AIR02 Nitrogen Stabilizers for Air Emissions Control 800 377,479 --b --b 800 377,479 --b --b --b
AIR03 Replace burning of prunings and other crop
residues with non-burning alternatives 85 24,914 78 19,895 163 44,809 --b --b --b
AIR04
Use drift reducing nozzles, low pressures, lower
boom height and adjuvants to reduce pesticide
drift
2,855 2,331,646 4,011 3,379,429 6,866 5,711,075 --b --b --b

CStP FY2010_Appendix_Modified_Final_2-14-2012.docx
195
Table A 20. CSP Enhancements and Practices , FY 2010
Code Enhancements/Practices
Enhancements/Practices Measured in Acres Other Measurement Units
CSP-2010-1 CSP-2010-2a FY 2010
a
CSP-
2010-1
CSP-
2010-2 a
FY
2010 a
Amt. Ac. Treat. Amt. Ac. Treat. Amt. Ac. Treat. Amt. Amt. Amt.
AIR05 Dust control on unpaved roads and surfaces 125 8,360 --b --b 125 8,360 --b --b --b
AIR06 Replacing oil- and wood-fired heaters in orchards
and vineyards --b --b --b --b --b --b 6 4 10
AIR07
GPS, targeted spray application (SmartSprayer),
or other chemical application electronic control
technology
1,447 1,344,961 2,310 2,172,571 3,757 3,517,532 --b --b --b
ANM01 Drainage water management for seasonal
wildlife habitat 130 28,740 218 52,600 348 81,339 --b --b --b
ANM02 Defer crop production on temporary and seasonal
wetlands 43 4,330 62 3,620 105 7,950 --b --b --b
ANM03 Incorporate native grasses and/or legumes into
15% or more of the forage base 489 30,196 561 38,336 1,050 68,532 --b --b --b
ANM04 Extend existing filter strips for water quality
Protection and wildlife habitat 176 4,474 284 1,829 460 6,303 --b --b --b
ANM05 Extending riparian forest buffers for water
quality Protection and wildlife habitat 38 917 33 255 71 1,172 --b --b --b
ANM06 Extending existing riparian herbaceous cover for
water quality Protection and wildlife habitat 46 1,543 78 746 124 2,289 --b --b --b
ANM07 Extending existing field borders for water quality
Protection and wildlife habitat 103 2,939 165 1,104 268 4,042 --b --b --b
ANM08 Improve the plant diversity and structure of non-
cropped areas for wildlife food and habitat 440 11,756 413 12,895 853 24,650 --b --b --b
ANM09 Grazing management to improve wildlife habitat 652 1,226,353 476 694,782 1,128 1,921,134 --b --b --b
ANM10 Harvest hay in a manner that allows wildlife to
flush and escape 1,075 179,676 1,604 313,889 2,679 493,565 --b --b --b
ANM11 Patch-burning to enhance wildlife habitat 316 62,842 226 40,067 542 102,909 --b --b --b
ANM12 Shallow water habitat 297 6,658 207 2,341 504 8,999 --b --b --b
ANM13 Non-forested riparian zone enhancement for fish
and wildlife --b --b --b --b --b --b 94 50 144
ANM14 Riparian forest buffer, terrestrial and aquatic
wildlife habitat --b --b --b --b --b --b 428 492 920
ANM15 Forest stand improvement for habitat and soil
quality 865 57,561 712 84,578 1,577 142,139 --b --b --b
ANM16 Harvesting crops using a stripper header 85 59,132 --b --b 85 59,132 --b --b --b
ANM17 Monitoring nutritional status of livestock using
the NUTBAL PRO System 325 920,666 289 872,322 614 1,792,988 --b --b --b
ANM18 Retrofit watering facility for wildlife escape --b --b --b --b --b --b 1,783 1,889 3,672
ANM19 Wildlife corridors 237 8,487 343 34,318 580 42,805 --b --b --b
ANM20 Silvopasture for wildlife habitat 55 9,583 37 17,546 92 27,129 --b --b --b
ANM21 Prairie Restoration for Grazing and Wildlife
Habitat 54 1,333 67 1,287 121 2,620 --b --b --b
ANM22 Restoration and Management of Rare or Declining
Habitats 152 21,197 142 21,004 294 42,201 --b --b --b
ANM23 Multi-species Native Perennials for
Biomass/Wildlife Habitat 40 708 46 407 86 1,115 --b --b --b
ANM24 Forest Wildlife Structures --b --b 961 92,603 961 92,603 --b --b --b
ANM25 Stockpiling Forages to Extend the Grazing Season --b --b 222 25,127 222 25,127 --b --b --b
ANM26 Managing Calving to Coincide with Forage
Availability --b --b 696 888,247 696 888,247 --b --b --b
BCR01 Crop Technology Bundle #1 --b --b 206 185,786 206 185,786 --b --b --b
BCR02 Crop Technology Bundle #2 --b --b 15 6,811 15 6,811 --b --b --b
BCR03 Crop Technology Bundle #3 --b --b 18 17,258 18 17,258 --b --b --b
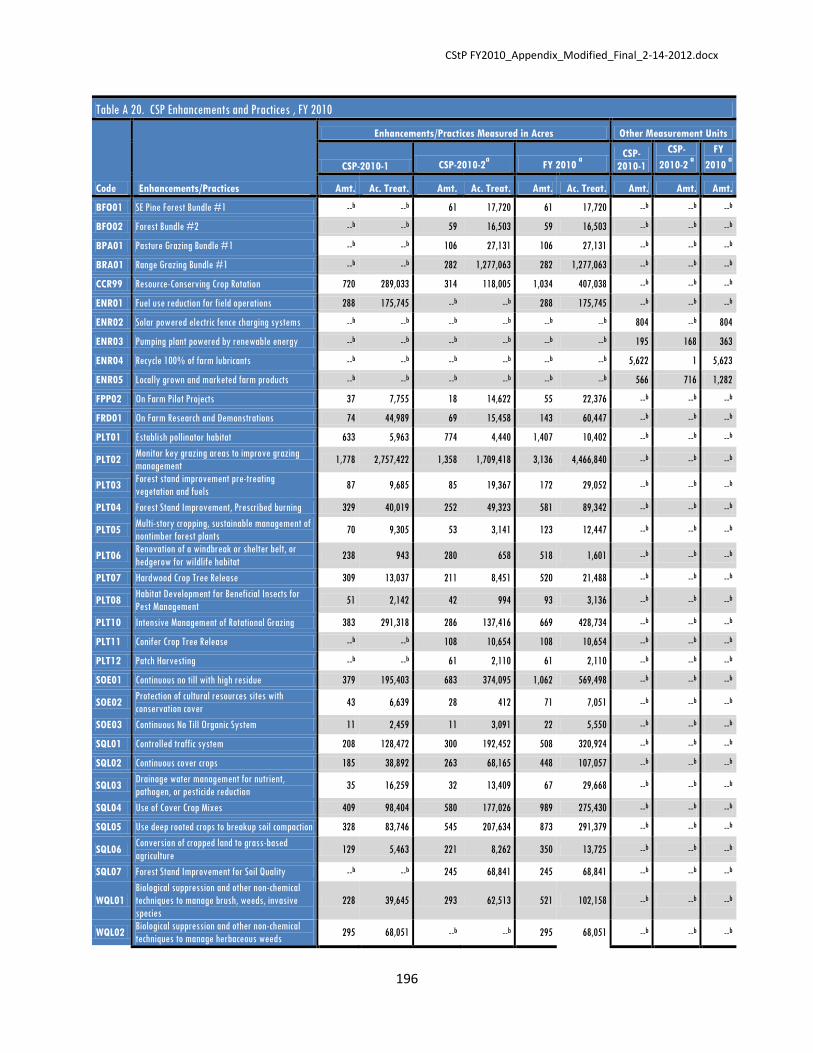
CStP FY2010_Appendix_Modified_Final_2-14-2012.docx
196
Table A 20. CSP Enhancements and Practices , FY 2010
Code Enhancements/Practices
Enhancements/Practices Measured in Acres Other Measurement Units
CSP-2010-1 CSP-2010-2a FY 2010
a
CSP-
2010-1
CSP-
2010-2 a
FY
2010 a
Amt. Ac. Treat. Amt. Ac. Treat. Amt. Ac. Treat. Amt. Amt. Amt.
BFO01 SE Pine Forest Bundle #1 --b --b 61 17,720 61 17,720 --b --b --b
BFO02 Forest Bundle #2 --b --b 59 16,503 59 16,503 --b --b --b
BPA01 Pasture Grazing Bundle #1 --b --b 106 27,131 106 27,131 --b --b --b
BRA01 Range Grazing Bundle #1 --b --b 282 1,277,063 282 1,277,063 --b --b --b
CCR99 Resource-Conserving Crop Rotation 720 289,033 314 118,005 1,034 407,038 --b --b --b
ENR01 Fuel use reduction for field operations 288 175,745 --b --b 288 175,745 --b --b --b
ENR02 Solar powered electric fence charging systems --b --b --b --b --b --b 804 --b 804
ENR03 Pumping plant powered by renewable energy --b --b --b --b --b --b 195 168 363
ENR04 Recycle 100% of farm lubricants --b --b --b --b --b --b 5,622 1 5,623
ENR05 Locally grown and marketed farm products --b --b --b --b --b --b 566 716 1,282
FPP02 On Farm Pilot Projects 37 7,755 18 14,622 55 22,376 --b --b --b
FRD01 On Farm Research and Demonstrations 74 44,989 69 15,458 143 60,447 --b --b --b
PLT01 Establish pollinator habitat 633 5,963 774 4,440 1,407 10,402 --b --b --b
PLT02 Monitor key grazing areas to improve grazing
management 1,778 2,757,422 1,358 1,709,418 3,136 4,466,840 --b --b --b
PLT03 Forest stand improvement pre-treating
vegetation and fuels 87 9,685 85 19,367 172 29,052 --b --b --b
PLT04 Forest Stand Improvement, Prescribed burning 329 40,019 252 49,323 581 89,342 --b --b --b
PLT05 Multi-story cropping, sustainable management of
nontimber forest plants 70 9,305 53 3,141 123 12,447 --b --b --b
PLT06 Renovation of a windbreak or shelter belt, or
hedgerow for wildlife habitat 238 943 280 658 518 1,601 --b --b --b
PLT07 Hardwood Crop Tree Release 309 13,037 211 8,451 520 21,488 --b --b --b
PLT08 Habitat Development for Beneficial Insects for
Pest Management 51 2,142 42 994 93 3,136 --b --b --b
PLT10 Intensive Management of Rotational Grazing 383 291,318 286 137,416 669 428,734 --b --b --b
PLT11 Conifer Crop Tree Release --b --b 108 10,654 108 10,654 --b --b --b
PLT12 Patch Harvesting --b --b 61 2,110 61 2,110 --b --b --b
SOE01 Continuous no till with high residue 379 195,403 683 374,095 1,062 569,498 --b --b --b
SOE02 Protection of cultural resources sites with
conservation cover 43 6,639 28 412 71 7,051 --b --b --b
SOE03 Continuous No Till Organic System 11 2,459 11 3,091 22 5,550 --b --b --b
SQL01 Controlled traffic system 208 128,472 300 192,452 508 320,924 --b --b --b
SQL02 Continuous cover crops 185 38,892 263 68,165 448 107,057 --b --b --b
SQL03 Drainage water management for nutrient,
pathogen, or pesticide reduction 35 16,259 32 13,409 67 29,668 --b --b --b
SQL04 Use of Cover Crop Mixes 409 98,404 580 177,026 989 275,430 --b --b --b
SQL05 Use deep rooted crops to breakup soil compaction 328 83,746 545 207,634 873 291,379 --b --b --b
SQL06 Conversion of cropped land to grass-based
agriculture 129 5,463 221 8,262 350 13,725 --b --b --b
SQL07 Forest Stand Improvement for Soil Quality --b --b 245 68,841 245 68,841 --b --b --b
WQL01
Biological suppression and other non-chemical
techniques to manage brush, weeds, invasive
species
228 39,645 293 62,513 521 102,158 --b --b --b
WQL02 Biological suppression and other non-chemical
techniques to manage herbaceous weeds 295 68,051 --b --b 295 68,051 --b --b --b
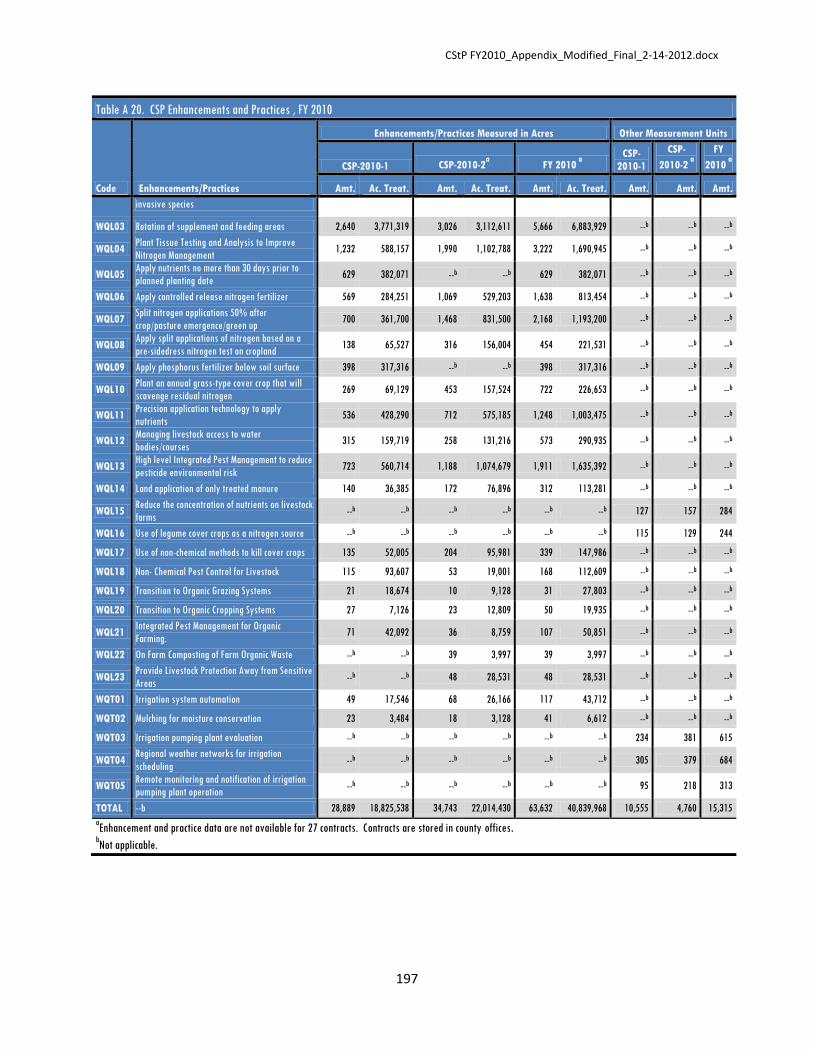
CStP FY2010_Appendix_Modified_Final_2-14-2012.docx
197
Table A 20. CSP Enhancements and Practices , FY 2010
Code Enhancements/Practices
Enhancements/Practices Measured in Acres Other Measurement Units
CSP-2010-1 CSP-2010-2a FY 2010
a
CSP-
2010-1
CSP-
2010-2 a
FY
2010 a
Amt. Ac. Treat. Amt. Ac. Treat. Amt. Ac. Treat. Amt. Amt. Amt.
invasive species
WQL03 Rotation of supplement and feeding areas 2,640 3,771,319 3,026 3,112,611 5,666 6,883,929 --b --b --b
WQL04 Plant Tissue Testing and Analysis to Improve
Nitrogen Management 1,232 588,157 1,990 1,102,788 3,222 1,690,945 --b --b --b
WQL05 Apply nutrients no more than 30 days prior to
planned planting date 629 382,071 --b --b 629 382,071 --b --b --b
WQL06 Apply controlled release nitrogen fertilizer 569 284,251 1,069 529,203 1,638 813,454 --b --b --b
WQL07 Split nitrogen applications 50% after
crop/pasture emergence/green up 700 361,700 1,468 831,500 2,168 1,193,200 --b --b --b
WQL08 Apply split applications of nitrogen based on a
pre-sidedress nitrogen test on cropland 138 65,527 316 156,004 454 221,531 --b --b --b
WQL09 Apply phosphorus fertilizer below soil surface 398 317,316 --b --b 398 317,316 --b --b --b
WQL10 Plant an annual grass-type cover crop that will
scavenge residual nitrogen 269 69,129 453 157,524 722 226,653 --b --b --b
WQL11 Precision application technology to apply
nutrients 536 428,290 712 575,185 1,248 1,003,475 --b --b --b
WQL12 Managing livestock access to water
bodies/courses 315 159,719 258 131,216 573 290,935 --b --b --b
WQL13 High level Integrated Pest Management to reduce
pesticide environmental risk 723 560,714 1,188 1,074,679 1,911 1,635,392 --b --b --b
WQL14 Land application of only treated manure 140 36,385 172 76,896 312 113,281 --b --b --b
WQL15 Reduce the concentration of nutrients on livestock
farms --b --b --b --b --b --b 127 157 284
WQL16 Use of legume cover crops as a nitrogen source --b --b --b --b --b --b 115 129 244
WQL17 Use of non-chemical methods to kill cover crops 135 52,005 204 95,981 339 147,986 --b --b --b
WQL18 Non- Chemical Pest Control for Livestock 115 93,607 53 19,001 168 112,609 --b --b --b
WQL19 Transition to Organic Grazing Systems 21 18,674 10 9,128 31 27,803 --b --b --b
WQL20 Transition to Organic Cropping Systems 27 7,126 23 12,809 50 19,935 --b --b --b
WQL21 Integrated Pest Management for Organic
Farming. 71 42,092 36 8,759 107 50,851 --b --b --b
WQL22 On Farm Composting of Farm Organic Waste --b --b 39 3,997 39 3,997 --b --b --b
WQL23 Provide Livestock Protection Away from Sensitive
Areas --b --b 48 28,531 48 28,531 --b --b --b
WQT01 Irrigation system automation 49 17,546 68 26,166 117 43,712 --b --b --b
WQT02 Mulching for moisture conservation 23 3,484 18 3,128 41 6,612 --b --b --b
WQT03 Irrigation pumping plant evaluation --b --b --b --b --b --b 234 381 615
WQT04 Regional weather networks for irrigation
scheduling --b --b --b --b --b --b 305 379 684
WQT05 Remote monitoring and notification of irrigation
pumping plant operation --b --b --b --b --b --b 95 218 313
TOTAL --b 28,889 18,825,538 34,743 22,014,430 63,632 40,839,968 10,555 4,760 15,315
aEnhancement and practice data are not available for 27 contracts. Contracts are stored in county offices.
bNot applicable.

CStP FY2010_Appendix_Modified_Final_2-14-2012.docx
198
Table A 21. CSP Enhancements and Practices by Land Use and Ranking Period, FY 2010
Code Enhancement/Practice
CSP-2010-1 CSP-2010-2a FY 2010
a
Crop Pasture Range Forest Total Crop Pasture Range Forest Total Grand Total
314 Brush Management --b 42 36 51 129 --b 25 17 23 65 194
328 Conservation Crop Rotation 59 --b --b --b 59 106 --b --b --b 106 165
329
Residue and Tillage
Management, No-Till/Strip
Till/Direct Seed
58 --b --b --b 58 99 --b --b --b 99 157
338 Prescribed Burning --b 13 13 85 111 --b 7 10 39 56 167
340 Cover Crop 34 --b --b --b 34 66 --b --b --b 66 100
342 Critical Area Planting 31 5 10 23 69 38 9 2 9 58 127
344 Residue Management,
Seasonal 67 --b --b --b 67 47 --b --b --b 47 114
345 Residue and Tillage
Management, Mulch Till 45 --b --b --b 45 57 --b --b --b 57 102
380 Windbreak/Shelterbelt
Establishment 12 8 12 --b 32 35 11 19 --b 65 97
383 Fuel Break --b 2 2 11 15 --b --b 3 13 16 31
384 Forest Slash Treatment --b --b --b 19 19 --b --b --b 10 10 29
386 Field Border 29 --b --b --b 29 62 --b --b --b 62 91
390 Riparian Herbaceous Cover 1 8 5 --b 14 4 2 3 --b 9 23
391 Riparian Forest Buffer --b 6 --b --b 6 22 8 --b --b 30 36
393 Filter Strip 22 --b --b --b 22 42 --b --b --b 42 64
394 Firebreak --b 3 4 133 140 --b 4 10 79 93 233
395 Stream Habitat Improvement
and Management 1 4 2 21 28 --b 2 1 8 11 39
449 Irrigation Water
Management 92 24 --b --b 116 120 10 --b --b 130 246
511 Forage Harvest Management --b 37 --b --b 37 35 23 --b --b 58 95
512 Forage and Biomass Planting --b 44 --b --b 44 37 23 --b --b 60 104
528 Prescribed Grazing --b 107 78 8 193 --b 59 35 4 98 291
550 Range Planting --b --b 12 --b 12 --b --b 11 --b 11 23
612 Tree/Shrub Establishment --b --b --b 107 107 --b --b --b 64 64 171
643
Restoration and
Management of Rare and
Declining Habitats --b 1 2 12 15 1 --b 2 7 10 25
644 Wetland Wildlife Habitat
Management 12 11 6 49 78 2 4 --b 40 46 124
645 Upland Wildlife Habitat
Management 31 27 38 131 227 32 10 9 88 139 366

CStP FY2010_Appendix_Modified_Final_2-14-2012.docx
199
Table A 21. CSP Enhancements and Practices by Land Use and Ranking Period, FY 2010
Code Enhancement/Practice
CSP-2010-1 CSP-2010-2a FY 2010
a
Crop Pasture Range Forest Total Crop Pasture Range Forest Total Grand Total
647 Early Successional Habitat
Development/Management 3 2 2 33 40 4 3 1 31 39 79
650 Windbreak/Shelterbelt
Renovation 3 3 3 --b 9 5 1 4 --b 10 19
654 Road/Trail/Landing Closure
and Treatment --b --b --b --b --b --b --b --b 8 8 8
655 Forest Trails and Landings --b --b --b 50 50 --b --b --b 21 21 71
660 Tree/Shrub Pruning --b --b --b 23 23 --b --b --b 15 15 38
666 Forest Stand Improvement --b --b --b 129 129 --b --b --b 67 67 196
722 Road/Landing Removal --b --b --b 4 4 --b --b --b --b --b 4
AIR01 Injecting or incorporating
manure 202 --b --b --b 202 --b --b --b --b --b 202
AIR02 Nitrogen Stabilizers for Air
Emissions Control 713 87 --b --b 800 --b --b --b --b --b 800
AIR03
Replace burning of prunings
and other crop residues with
non-burning alternatives
85 --b --b --b 85 78 --b --b --b 78 163
AIR04
Use drift reducing nozzles,
low pressures, lower boom
height and adjuvants to
reduce pesticide drift
2,522 333 --b --b 2,855 3,495 516 --b --b 4,011 6,866
AIR05 Dust control on unpaved
roads and surfaces 79 18 7 21 125 --b --b --b --b --b 125
AIR06
Replacing oil- and wood-fired
heaters in orchards and
vineyards
6 --b --b --b 6 4 --b --b --b 4 10
AIR07
GPS, targeted spray
application (SmartSprayer),
or other chemical application
electronic control tec
1,282 88 42 35 1,447 2,039 175 57 39 2,310 3,757
ANM01 Drainage water management
for seasonal wildlife habitat 130 --b --b --b 130 218 --b --b --b 218 348
ANM02
Defer crop production on
temporary and seasonal
wetlands
43 --b --b --b 43 62 --b --b --b 62 105
ANM03
Incorporate native grasses
and/or legumes into 15% or
more of the forage base --b 489 --b --b 489 --b 561 --b --b 561 1,050
ANM04
Extend existing filter strips
for water quality protection
and wildlife habitat
155 21 --b --b 176 269 15 --b --b 284 460
ANM05
Extending riparian forest
buffers for water quality
protection and wildlife
habitat
20 18 --b --b 38 23 7 3 --b 33 71
ANM06
Extending existing riparian
herbaceous cover for water
quality protection and
wildlife habitat
32 14 --b --b 46 65 9 4 --b 78 124
ANM07
Extending existing field
borders for water quality
protection and wildlife
habitat
93 10 --b --b 103 159 6 --b --b 165 268

CStP FY2010_Appendix_Modified_Final_2-14-2012.docx
200
Table A 21. CSP Enhancements and Practices by Land Use and Ranking Period, FY 2010
Code Enhancement/Practice
CSP-2010-1 CSP-2010-2a FY 2010
a
Crop Pasture Range Forest Total Crop Pasture Range Forest Total Grand Total
ANM08
Improve the plant diversity
and structure of non-cropped
areas for wildlife food and
habitat
310 130 --b --b 440 319 94 --b --b 413 853
ANM09 Grazing management to
improve wildlife habitat --b 220 432 --b 652 --b 169 279 28 476 1,128
ANM10
Harvest hay in a manner that
allows wildlife to flush and
escape
1,075 --b --b --b 1,075 1,604 --b --b --b 1,604 2,679
ANM11 Patch-burning to enhance
wildlife habitat --b 99 108 109 316 --b 75 70 81 226 542
ANM12 Shallow water habitat 62 47 51 137 297 52 24 18 113 207 504
ANM13
Non-forested riparian zone
enhancement for fish and
wildlife
19 35 40 --b 94 18 13 19 --b 50 144
ANM14
Riparian forest buffer,
terrestrial and aquatic
wildlife habitat
30 50 20 328 428 75 49 16 352 492 920
ANM15 Forest stand improvement
for habitat and soil quality --b --b --b 865 865 --b --b --b 712 712 1,577
ANM16 Harvesting crops using a
stripper header 85 --b --b --b 85 --b --b --b --b --b 85
ANM17
Monitoring nutritional status
of livestock using the
NUTBAL PRO System --b 112 213 --b 325 --b 118 171 --b 289 614
ANM18 Retrofit watering facility for
wildlife escape --b 674 1,057 52 1,783 --b 906 930 53 1,889 3,672
ANM19 Wildlife corridors 84 33 27 93 237 169 25 30 119 343 580
ANM20 Silvopasture for wildlife
habitat --b 15 --b 40 55 --b 15 --b 22 37 92
ANM21 Prairie Restoration for
Grazing and Wildlife Habitat 20 15 19 --b 54 42 9 16 --b 67 121
ANM22
Restoration and
Management of Rare or
Declining Habitats
25 16 17 94 152 40 8 20 74 142 294
ANM23
Multi-species Native
Perennials for
Biomass/Wildlife Habitat
30 3 7 --b 40 38 8 --b --b 46 86
ANM24 Forest Wildlife Structures --b --b --b --b --b --b --b --b 961 961 961
ANM25 Stockpiling Forages to
Extend the Grazing Season --b --b --b --b --b --b 222 --b --b 222 222
ANM26 Managing Calving to Coincide
with Forage Availability --b --b --b --b --b --b 444 252 --b 696 696
BCR01 Crop Technology Bundle #1 --b --b --b --b --b 206 --b --b --b 206 206
BCR02 Crop Technology Bundle #2 --b --b --b --b --b 15 --b --b --b 15 15
BCR03 Crop Technology Bundle #3 --b --b --b --b --b 18 --b --b --b 18 18
BFO01 SE Pine Forest Bundle #1 --b --b --b --b --b --b --b --b 61 61 61
BFO02 Forest Bundle #2 --b --b --b --b --b --b --b --b 59 59 59
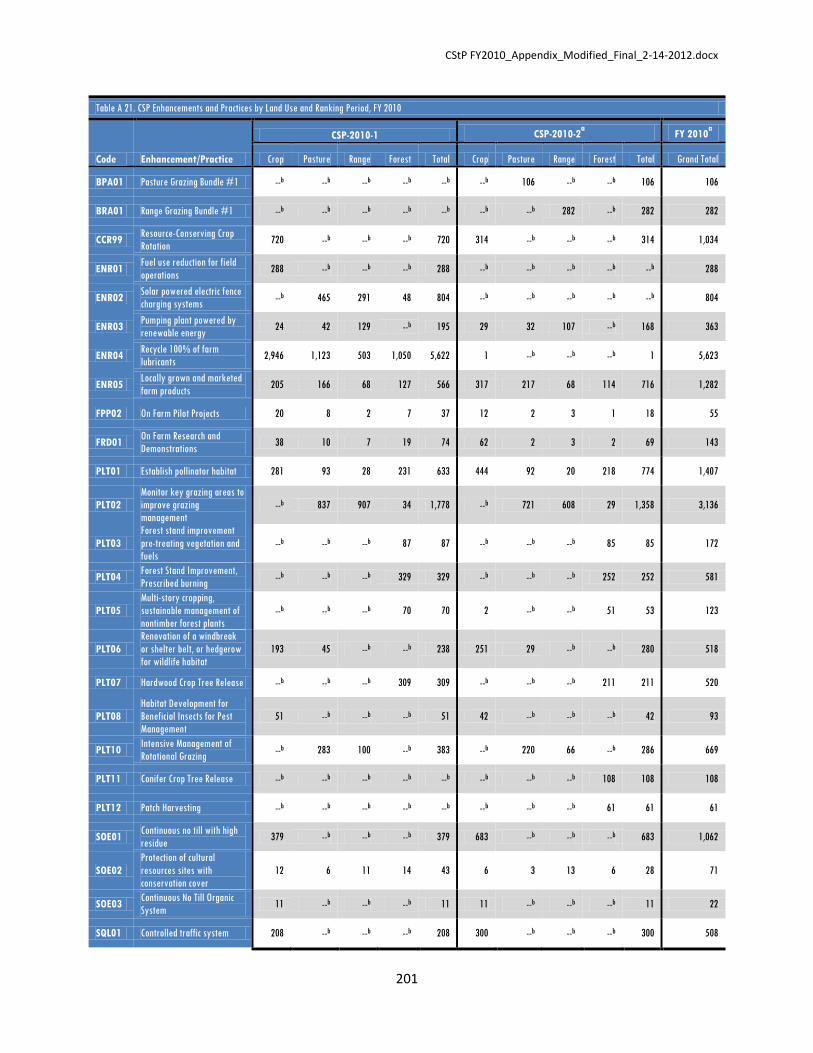
CStP FY2010_Appendix_Modified_Final_2-14-2012.docx
201
Table A 21. CSP Enhancements and Practices by Land Use and Ranking Period, FY 2010
Code Enhancement/Practice
CSP-2010-1 CSP-2010-2a FY 2010
a
Crop Pasture Range Forest Total Crop Pasture Range Forest Total Grand Total
BPA01 Pasture Grazing Bundle #1 --b --b --b --b --b --b 106 --b --b 106 106
BRA01 Range Grazing Bundle #1 --b --b --b --b --b --b --b 282 --b 282 282
CCR99 Resource-Conserving Crop
Rotation 720 --b --b --b 720 314 --b --b --b 314 1,034
ENR01 Fuel use reduction for field
operations 288 --b --b --b 288 --b --b --b --b --b 288
ENR02 Solar powered electric fence
charging systems --b 465 291 48 804 --b --b --b --b --b 804
ENR03 Pumping plant powered by
renewable energy 24 42 129 --b 195 29 32 107 --b 168 363
ENR04 Recycle 100% of farm
lubricants 2,946 1,123 503 1,050 5,622 1 --b --b --b 1 5,623
ENR05 Locally grown and marketed
farm products 205 166 68 127 566 317 217 68 114 716 1,282
FPP02 On Farm Pilot Projects 20 8 2 7 37 12 2 3 1 18 55
FRD01 On Farm Research and
Demonstrations 38 10 7 19 74 62 2 3 2 69 143
PLT01 Establish pollinator habitat 281 93 28 231 633 444 92 20 218 774 1,407
PLT02
Monitor key grazing areas to
improve grazing
management --b 837 907 34 1,778 --b 721 608 29 1,358 3,136
PLT03
Forest stand improvement
pre-treating vegetation and
fuels --b --b --b 87 87 --b --b --b 85 85 172
PLT04 Forest Stand Improvement,
Prescribed burning --b --b --b 329 329 --b --b --b 252 252 581
PLT05
Multi-story cropping,
sustainable management of
nontimber forest plants --b --b --b 70 70 2 --b --b 51 53 123
PLT06
Renovation of a windbreak
or shelter belt, or hedgerow
for wildlife habitat
193 45 --b --b 238 251 29 --b --b 280 518
PLT07 Hardwood Crop Tree Release --b --b --b 309 309 --b --b --b 211 211 520
PLT08
Habitat Development for
Beneficial Insects for Pest
Management
51 --b --b --b 51 42 --b --b --b 42 93
PLT10 Intensive Management of
Rotational Grazing --b 283 100 --b 383 --b 220 66 --b 286 669
PLT11 Conifer Crop Tree Release --b --b --b --b --b --b --b --b 108 108 108
PLT12 Patch Harvesting --b --b --b --b --b --b --b --b 61 61 61
SOE01 Continuous no till with high
residue 379 --b --b --b 379 683 --b --b --b 683 1,062
SOE02
Protection of cultural
resources sites with
conservation cover
12 6 11 14 43 6 3 13 6 28 71
SOE03 Continuous No Till Organic
System 11 --b --b --b 11 11 --b --b --b 11 22
SQL01 Controlled traffic system 208 --b --b --b 208 300 --b --b --b 300 508

CStP FY2010_Appendix_Modified_Final_2-14-2012.docx
202
Table A 21. CSP Enhancements and Practices by Land Use and Ranking Period, FY 2010
Code Enhancement/Practice
CSP-2010-1 CSP-2010-2a FY 2010
a
Crop Pasture Range Forest Total Crop Pasture Range Forest Total Grand Total
SQL02 Continuous cover crops 185 --b --b --b 185 263 --b --b --b 263 448
SQL03
Drainage water management
for nutrient, pathogen, or
pesticide reduction
35 --b --b --b 35 32 --b --b --b 32 67
SQL04 Use of Cover Crop Mixes 409 --b --b --b 409 580 --b --b --b 580 989
SQL05 Use deep rooted crops to
breakup soil compaction 328 --b --b --b 328 545 --b --b --b 545 873
SQL06 Conversion of cropped land
to grass-based agriculture 129 --b --b --b 129 221 --b --b --b 221 350
SQL07 Forest Stand Improvement
for Soil Quality --b --b --b --b --b --b --b --b 245 245 245
WQL01
Biological suppression and
other non-chemical
techniques to manage brush,
weeds and invasive species
--b 121 107 --b 228 --b 185 108 --b 293 521
WQL02
Biological suppression and
other non-chemical
techniques to manage
herbaceous weeds invasive
species
--b 166 129 --b 295 --b --b --b --b --b 295
WQL03 Rotation of supplement and
feeding areas --b 1,391 1,201 48 2,640 --b 1,807 1,153 66 3,026 5,666
WQL04
Plant Tissue Testsing and
Analysis to Improve
Nitrogen Management
1,232 --b --b --b 1,232 1,990 --b --b --b 1,990 3,222
WQL05
Apply nutrients no more
than 30 days prior to
planned planting date
629 --b --b --b 629 --b --b --b --b --b 629
WQL06 Apply controlled release
nitrogen fertilizer 459 110 --b --b 569 897 172 --b --b 1,069 1,638
WQL07
Split nitrogen applications
50% after crop/pasture
emergence/green up
700 --b --b --b 700 1,246 222 --b --b 1,468 2,168
WQL08
Apply split applications of
nitrogen based on a pre-
sidedress nitrogen test on
cropland
138 --b --b --b 138 316 --b --b --b 316 454
WQL09 Apply phosphorus fertilizer
below soil surface 398 --b --b --b 398 --b --b --b --b --b 398
WQL10
Plant an annual grass-type
cover crop that will scavenge
residual nitrogen
269 --b --b --b 269 453 --b --b --b 453 722
WQL11
Precision application
technology to apply
nutrients
513 23 --b --b 536 672 40 --b --b 712 1,248
WQL12 Managing livestock access to
water bodies/courses --b 179 119 17 315 --b 162 79 17 258 573
WQL13
High level Integrated Pest
Management to reduce
pesticide environmental risk
501 85 53 84 723 964 99 50 75 1,188 1,911
WQL14 Land application of only
treated manure 103 37 --b --b 140 144 28 --b --b 172 312
WQL15 Reduce the concentration of
nutrients on livestock farms 74 53 --b --b 127 99 58 --b --b 157 284
WQL16 Use of legume cover crops as
a nitrogen source 115 --b --b --b 115 129 --b --b --b 129 244
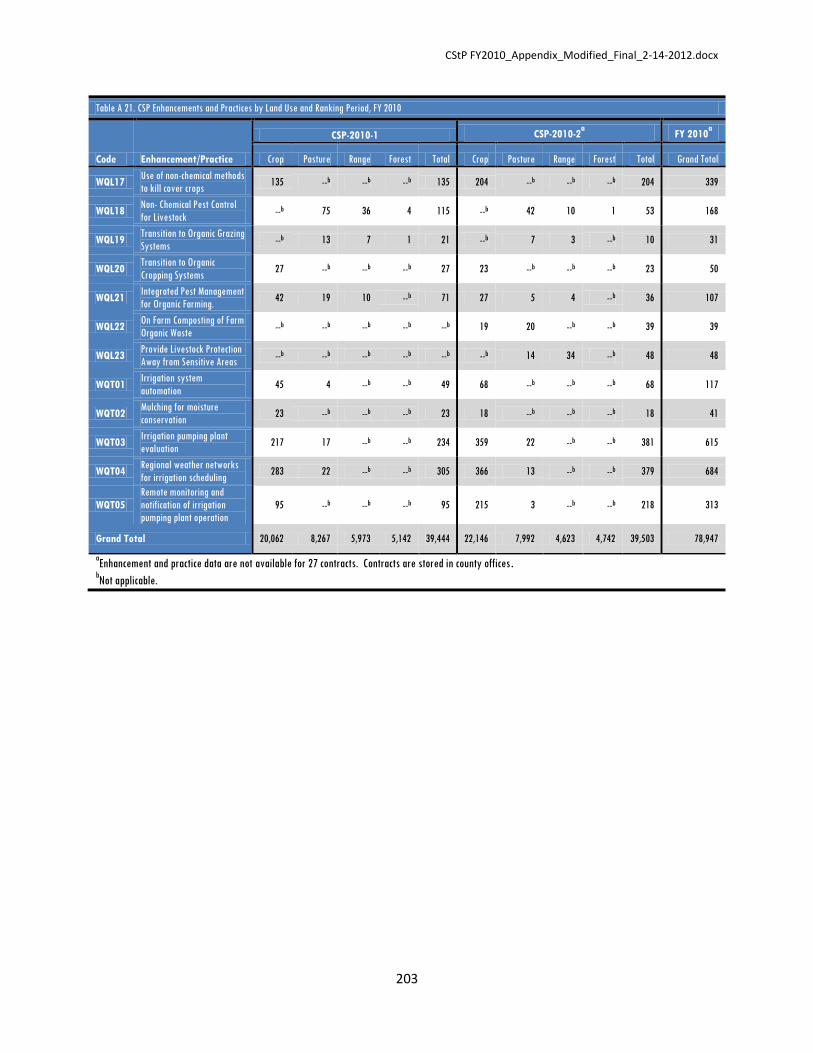
CStP FY2010_Appendix_Modified_Final_2-14-2012.docx
203
Table A 21. CSP Enhancements and Practices by Land Use and Ranking Period, FY 2010
Code Enhancement/Practice
CSP-2010-1 CSP-2010-2a FY 2010
a
Crop Pasture Range Forest Total Crop Pasture Range Forest Total Grand Total
WQL17 Use of non-chemical methods
to kill cover crops 135 --b --b --b 135 204 --b --b --b 204 339
WQL18 Non- Chemical Pest Control
for Livestock --b 75 36 4 115 --b 42 10 1 53 168
WQL19 Transition to Organic Grazing
Systems --b 13 7 1 21 --b 7 3 --b 10 31
WQL20 Transition to Organic
Cropping Systems 27 --b --b --b 27 23 --b --b --b 23 50
WQL21 Integrated Pest Management
for Organic Farming. 42 19 10 --b 71 27 5 4 --b 36 107
WQL22 On Farm Composting of Farm
Organic Waste --b --b --b --b --b 19 20 --b --b 39 39
WQL23 Provide Livestock Protection
Away from Sensitive Areas --b --b --b --b --b --b 14 34 --b 48 48
WQT01 Irrigation system
automation 45 4 --b --b 49 68 --b --b --b 68 117
WQT02 Mulching for moisture
conservation 23 --b --b --b 23 18 --b --b --b 18 41
WQT03 Irrigation pumping plant
evaluation 217 17 --b --b 234 359 22 --b --b 381 615
WQT04 Regional weather networks
for irrigation scheduling 283 22 --b --b 305 366 13 --b --b 379 684
WQT05
Remote monitoring and
notification of irrigation
pumping plant operation
95 --b --b --b 95 215 3 --b --b 218 313
Grand Total 20,062 8,267 5,973 5,142 39,444 22,146 7,992 4,623 4,742 39,503 78,947
aEnhancement and practice data are not available for 27 contracts. Contracts are stored in county offices.
bNot applicable.