Conservation phylogenetics of helodermatid lizards … · Conservation phylogenetics of...
15
Conservation phylogenetics of helodermatid lizards using multiple molecular markers and a supertree approach Michael E. Douglas a, * , Marlis R. Douglas a , Gordon W. Schuett b , Daniel D. Beck c , Brian K. Sullivan d a Illinois Natural History Survey, Institute for Natural Resource Sustainability, University of Illinois, Champaign, IL 61820, USA b Department of Biology and Center for Behavioral Neuroscience, Georgia State University, Atlanta, GA 30303-3088, USA c Department of Biological Sciences, Central Washington University, Ellensburg, WA 98926, USA d Division of Mathematics & Natural Sciences, Arizona State University, Phoenix, AZ 85069, USA article info Article history: Received 30 June 2009 Revised 6 December 2009 Accepted 7 December 2009 Available online 16 December 2009 Keywords: Anguimorpha ATPase Enolase Indel Intron MCIC MTDNA Ornithine decarboxilase Varanoidea abstract We analyzed both mitochondrial (MT-) and nuclear (N) DNAs in a conservation phylogenetic framework to examine deep and shallow histories of the Beaded Lizard (Heloderma horridum) and Gila Monster (H. suspectum) throughout their geographic ranges in North and Central America. Both MTDNA and intron markers clearly partitioned each species. One intron and MTDNA further subdivided H. horridum into its four recognized subspecies (H. n. alvarezi, charlesbogerti, exasperatum, and horridum). However, the two subspecies of H. suspectum (H. s. suspectum and H. s. cinctum) were undefined. A supertree approach sus- tained these relationships. Overall, the Helodermatidae is reaffirmed as an ancient and conserved group. Its most recent common ancestor (MRCA) was Lower Eocene [35.4 million years ago (mya)], with a 25 my period of stasis before the MRCA of H. horridum diversified in Lower Miocene. Another 5 my passed before H. h. exasperatum and H. h. horridum diverged, followed by 1.5 my before H. h. alvarezi and H. h. charlesbogerti separated. Heloderma suspectum reflects an even longer period of stasis (30 my) before diversifying from its MRCA. Both H. suspectum (México) and H. h. alvarezi also revealed evidence of his- toric range expansion following a recent bottleneck. Our conservation phylogenetic approach emphasizes the origin and diversification of this group, yields information on the manner by which past environmen- tal variance may have impacted its populations and, in turn, allows us to disentangle historic from con- temporary impacts that might threaten its long-term persistence. The value of helodermatid conservation resides in natural services and medicinal products, particularly venom constituents, and these are only now being realized. Ó 2009 Elsevier Inc. All rights reserved. 1. Introduction Conservation genetics is the application of molecular methods to preserve species as dynamic entities capable of coping with environmental change (Frankham et al., 2003). Yet, to become the practical tool for biodiversity management many had envi- sioned (Vijenhoek et al., 1985), the discipline must move beyond a mere description of genetic diversity in single species (Milligan et al., 1994) and depict instead regional biodiversities in both space and time. The ‘space’ component can be readily grasped using phy- logeography as a model (Avise, 2000, 2009), whereas the temporal component is less intuitive for it invokes historical (or phyloge- netic) rather than contemporaneous time (Stockwell et al., 2003). A deep historical perspective is largely missing from molecular conservation genetics as generally practiced today. Instead, the field is often narrowly equated with relationships among extant populations mediated through measures of inbreeding depression, heterozygosity loss, and pedigree analysis (Avise, 1996; Hughes et al., 2008). The field must instead broaden and extend such that it no longer merely focuses on the numerous and diverse twigs in the tree of life, but also within its deeper and more substantive branches. The logic of prioritizing conservation based upon a phylogenetic perspective was first articulated by Wilson (1992), who noted that a successful conservation strategy should place greater emphasis on sustaining as much evolutionary diversity as possible, especially with regard to substantive branches in the tree of life (reviewed by Crozier, 1997; Crozier et al., 2006). Others have been similarly evocative. Nee and May (1997) argued for the importance of visu- alizing historic biodiversity processes (e.g., extinctions and diversi- fications) through a phylogenetic lens, with the resulting perspectives often dictating modern conservation priorities. Willis and Birks (2006) emphasized the value of an extended temporal perspective to disentangle historic from recent variation so as to provide guidance for conservation priorities. These (and other) 1055-7903/$ - see front matter Ó 2009 Elsevier Inc. All rights reserved. doi:10.1016/j.ympev.2009.12.009 * Corresponding author. Fax: +1 217 333 4949. E-mail address: [email protected] (M.E. Douglas). Molecular Phylogenetics and Evolution 55 (2010) 153–167 Contents lists available at ScienceDirect Molecular Phylogenetics and Evolution journal homepage: www.elsevier.com/locate/ympev
Transcript of Conservation phylogenetics of helodermatid lizards … · Conservation phylogenetics of...

Molecular Phylogenetics and Evolution 55 (2010) 153–167
Contents lists available at ScienceDirect
Molecular Phylogenetics and Evolution
journal homepage: www.elsevier .com/ locate /ympev
Conservation phylogenetics of helodermatid lizards using multiple molecularmarkers and a supertree approach
Michael E. Douglas a,*, Marlis R. Douglas a, Gordon W. Schuett b, Daniel D. Beck c, Brian K. Sullivan d
a Illinois Natural History Survey, Institute for Natural Resource Sustainability, University of Illinois, Champaign, IL 61820, USAb Department of Biology and Center for Behavioral Neuroscience, Georgia State University, Atlanta, GA 30303-3088, USAc Department of Biological Sciences, Central Washington University, Ellensburg, WA 98926, USAd Division of Mathematics & Natural Sciences, Arizona State University, Phoenix, AZ 85069, USA
a r t i c l e i n f o
Article history:Received 30 June 2009Revised 6 December 2009Accepted 7 December 2009Available online 16 December 2009
Keywords:AnguimorphaATPaseEnolaseIndelIntronMCICMTDNAOrnithine decarboxilaseVaranoidea
1055-7903/$ - see front matter � 2009 Elsevier Inc. Adoi:10.1016/j.ympev.2009.12.009
* Corresponding author. Fax: +1 217 333 4949.E-mail address: [email protected] (M.E. Douglas).
a b s t r a c t
We analyzed both mitochondrial (MT-) and nuclear (N) DNAs in a conservation phylogenetic framework toexamine deep and shallow histories of the Beaded Lizard (Heloderma horridum) and Gila Monster (H.suspectum) throughout their geographic ranges in North and Central America. Both MTDNA and intronmarkers clearly partitioned each species. One intron and MTDNA further subdivided H. horridum into itsfour recognized subspecies (H. n. alvarezi, charlesbogerti, exasperatum, and horridum). However, the twosubspecies of H. suspectum (H. s. suspectum and H. s. cinctum) were undefined. A supertree approach sus-tained these relationships. Overall, the Helodermatidae is reaffirmed as an ancient and conserved group.Its most recent common ancestor (MRCA) was Lower Eocene [35.4 million years ago (mya)], with a �25my period of stasis before the MRCA of H. horridum diversified in Lower Miocene. Another �5 my passedbefore H. h. exasperatum and H. h. horridum diverged, followed by �1.5 my before H. h. alvarezi and H. h.charlesbogerti separated. Heloderma suspectum reflects an even longer period of stasis (�30 my) beforediversifying from its MRCA. Both H. suspectum (México) and H. h. alvarezi also revealed evidence of his-toric range expansion following a recent bottleneck. Our conservation phylogenetic approach emphasizesthe origin and diversification of this group, yields information on the manner by which past environmen-tal variance may have impacted its populations and, in turn, allows us to disentangle historic from con-temporary impacts that might threaten its long-term persistence. The value of helodermatidconservation resides in natural services and medicinal products, particularly venom constituents, andthese are only now being realized.
� 2009 Elsevier Inc. All rights reserved.
1. Introduction
Conservation genetics is the application of molecular methodsto preserve species as dynamic entities capable of coping withenvironmental change (Frankham et al., 2003). Yet, to becomethe practical tool for biodiversity management many had envi-sioned (Vijenhoek et al., 1985), the discipline must move beyonda mere description of genetic diversity in single species (Milliganet al., 1994) and depict instead regional biodiversities in both spaceand time. The ‘space’ component can be readily grasped using phy-logeography as a model (Avise, 2000, 2009), whereas the temporalcomponent is less intuitive for it invokes historical (or phyloge-netic) rather than contemporaneous time (Stockwell et al., 2003).A deep historical perspective is largely missing from molecularconservation genetics as generally practiced today. Instead, thefield is often narrowly equated with relationships among extant
ll rights reserved.
populations mediated through measures of inbreeding depression,heterozygosity loss, and pedigree analysis (Avise, 1996; Hugheset al., 2008). The field must instead broaden and extend such thatit no longer merely focuses on the numerous and diverse twigs inthe tree of life, but also within its deeper and more substantivebranches.
The logic of prioritizing conservation based upon a phylogeneticperspective was first articulated by Wilson (1992), who noted thata successful conservation strategy should place greater emphasison sustaining as much evolutionary diversity as possible, especiallywith regard to substantive branches in the tree of life (reviewed byCrozier, 1997; Crozier et al., 2006). Others have been similarlyevocative. Nee and May (1997) argued for the importance of visu-alizing historic biodiversity processes (e.g., extinctions and diversi-fications) through a phylogenetic lens, with the resultingperspectives often dictating modern conservation priorities. Willisand Birks (2006) emphasized the value of an extended temporalperspective to disentangle historic from recent variation so as toprovide guidance for conservation priorities. These (and other)
154 M.E. Douglas et al. / Molecular Phylogenetics and Evolution 55 (2010) 153–167
viewpoints prompted Avise (2005) to suggest ‘conservation phy-logenetics’ as a research focus, with the ‘Tree of Life’ as a potentialmetric of standardization (Avise et al., 2008). In this sense, a phy-logenetic perspective for ‘biodiversity genetics’ (Avise, 2008),looms large as we move into a future clouded by global climatechange and habitat fragmentation.
1.1. Biodiversity genetics as a geocentric science
Here, regions and the species therein must represent the re-search focus, rather than species within regions. This distinction,while subtle, directs biodiversity research as geo- rather than tax-on-centric (Douglas et al., 2006, 2009). Our study spans the threedeserts of western North America and the tropical dry forests alongeastern and western versants of México/Guatemala, an areaencompassing the entire distribution of Heloderma. Much of theconservation research in this region has focused on species inhab-iting restricted drainages (Hedrick et al., 2001), isolated springs(Hurt, 2004), or elevated sky-islands (Masta, 2000; Knowles,2001; Holycross and Douglas, 2007).These studies were often pro-voked by immediate conservation concerns, and consequentlywere conducted under a strong sense of urgency. Their focal spe-cies and restricted habitats were clearly pertinent for specific con-servation purposes, yet did not offer the broad geographicperspective necessary for adaptive management at the regionallevel.
We suggest a regional perspective is an imperative to move bio-diversity conservation from reactive to proactive. If we cannotachieve this in a timely fashion, then (as an example) biotic asso-ciations and regional linkages within the warm deserts of westernNorth American will be damaged or lost due to mining, logging,and livestock activities coupled with groundwater pumping andland acquisition for urban growth. These anthropogenic impactswill force us yet again into post hoc crisis-mode if their impactscannot be deflected with pre-emptive regional management. Aclarification of faunal diversification within tropical dry forestsand regional deserts is a necessary first step in a broader landscapeperspective on the adaptive management of these fragile areas. Inthis sense, our evaluation of the Helodermatidae provides a robustand alternative perspective on the evolution of these regions (Rid-dle et al., 2000). Additionally, it contributes to a growing list ofstudies that address taxa within the region (Oakey et al., 2004; Jae-ger et al., 2005; Douglas et al., 2006; Schulte et al., 2006; Mulcahy,2008; Becerra et al., 2009), and may thus serve in tandem with theabove as a benchmark for long-term management of biotic com-munities therein.
Our perspectives employ phylogeny not as a metaphor but in-stead as a barometer with which to gauge not only origins and his-tories of regions and species (as above), but their collective fates aswell. Conservation phylogenetics is compelling in that it placesbiodiversity losses within an historical perspective, but servesmore importantly as a tool with which to manage the lineages thatsurvive (Davies et al., 2009). Yet, a broader application of this con-cept is seriously impeded by the lack of phylogenies for most lin-eages, much less a specific conservation perspective withinwhich to imbed them. This situation is unlikely to soon change(Crozier et al., 2006) unless greater efforts are marshaled to gener-ate phylogenies for rare and enigmatic taxa, and to place themwithin a conservation format (as herein).
1.2. Molecular markers and biodiversity studies
Molecular markers have made a profound and significant con-tribution to biodiversity studies in general and, in particular, tothe enhancement of regional conservation perspectives. However,their benefits are somewhat constrained by practical limitations.
Monsen and Blouin (2003) noted that 83% (29/35) of studies thatclassified vertebrate populations into management units in theprevious 8 years did so with but a single type of marker, and 76%of the latter (22/29) utilized MTDNA. Yet, this molecule hasshortcomings that can limit its potential in recovering historicsignal (reviewed by Douglas et al., 2002, 2006). Although MTDNAwill continue to provide an invaluable window into the phylogeog-raphy of populations, clarifying the evolutionary histories ofpopulations and grouping them into cohesive units for manage-ment purposes will be more precisely described and interpretedif both MTDNA and nuclear (N) DNAs are analyzed (Douglas et al.,2007).
Non-coding intron segments of nuclear eukaryotic genes repre-sent such an alternative genetic marker (Friesen, 2000), but theirfunction(s) within nuclear genomes remain uncertain (Johnson,2004). Here, we applied MT- and NDNA markers to identify molec-ular diversification in Helodermatidae, [i.e., the Beaded Lizard(Heloderma horridum) and the Gila Monster (H. suspectum)]. Weaccomplished this by evaluating these species across their distribu-tions, then imbedding this diversity within the Varanoidea, an an-cient and monophyletic clade composed of the venomous NewWorld helodermatids, the Old World Bornean Earless Monitor(Lanthanotus borneennsis), and the highly-diverse goannas or mon-itors (65 + Varanus species). We then discuss the Varanoidea as acomponent of the larger squamate clade Anguimorpha, which con-sists of Anguidae, Helodermatidae, Shinisauridae, Varanidae, Xeno-sauridae (Townsend et al., 2004, 2008; Vidal and Hedges, 2005,2009), and occasionally Serpentes (Lee, 2009). Given these per-spectives, we employed other major lizard and snake families inour analyses so as to gain a broader perspective and to establish,in a phylogenetic sense, the relative position of varanoid and angu-imorph taxa.
2. Materials and methods
2.1. Study organisms
Within Varanoidea, Heloderma is composed of two broad-rang-ing species: Beaded Lizard (H. horridum) and Gila Monster (H.suspectum) (Bogert and Martin del Campo, 1956). The Beaded Liz-ard occurs along the Pacific foothills from southern Sonora to Chi-apas (México), along Pacific drainages in southern Guatemala, andin two Atlantic drainages of Chiapas and eastern Guatemala(Campbell and Lamar 2004; Beck, 2005). Four subspecies are recog-nized: H. h. alvarezi (Rio Grijalva valley of central Chiapas to ex-treme western Guatemala), H. h. charlesbogerti (Rio MotaguaValley and adjacent foothills of eastern Guatemala), H. h. exaspera-tum (southern Sonora, northern Sinaloa), and H. h. horridum (wes-tern México) (Fig. 1).
The Gila Monster is distributed in the Mohave Desert of extremesouthern Nevada, southwestern Utah, extreme southeastern Cali-fornia and northwestern Arizona, and throughout the Sonoran Des-ert region in Arizona and Sonora, México (exclusive of BajaCalifornia), and into the Chihuahuan Desert of southeastern Ari-zona and southwestern New Mexico (Campbell and Lamar, 2004;Beck, 2005). Two subspecies are recognized: H. s. suspectum (Retic-ulate Gila Monster) and H. s. cinctum (Banded Gila Monster)(Fig. 1).
We collected 135 tissue samples to represent our ingroup, thetwo extant species of Helodermatidae, which consisted of 48 H. hor-ridum (13 H. h. alvarezi, 11 H. h. charlesbogerti, 15 H. h. exasperatum, 9H. h. horridum) and 87 H. suspectum (H. s cinctum and H. s. suspectum)sampled from populations throughout their range. Our ‘‘lizard” out-groups consisted of 8 species of Varanidae [Varanus beccari (n = 1), V.dumerilii (n = 1), V. exanthematicus (n = 1), V. griseus (n = 1), V. indicus(n = 1), V. komodoensis (n = 1), V. niloticus (n = 1), and V. tristis (n = 2)],
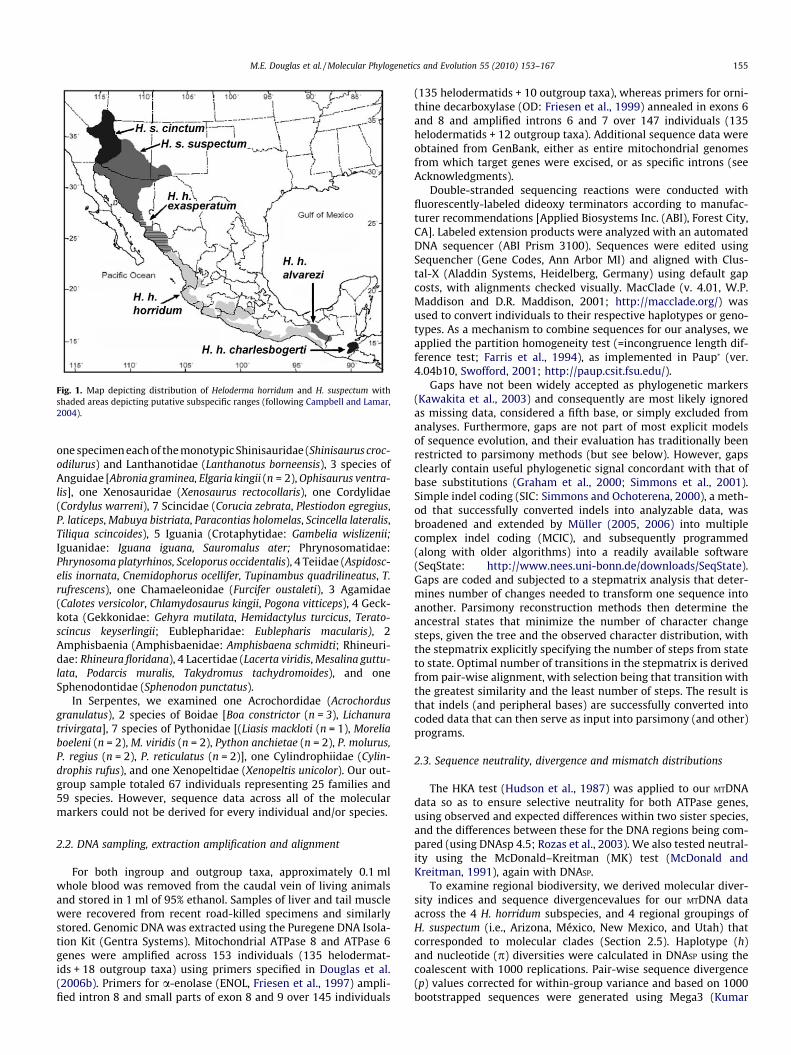
Fig. 1. Map depicting distribution of Heloderma horridum and H. suspectum withshaded areas depicting putative subspecific ranges (following Campbell and Lamar,2004).
M.E. Douglas et al. / Molecular Phylogenetics and Evolution 55 (2010) 153–167 155
one specimen each of the monotypic Shinisauridae (Shinisaurus croc-odilurus) and Lanthanotidae (Lanthanotus borneensis), 3 species ofAnguidae [Abronia graminea, Elgaria kingii (n = 2), Ophisaurus ventra-lis], one Xenosauridae (Xenosaurus rectocollaris), one Cordylidae(Cordylus warreni), 7 Scincidae (Corucia zebrata, Plestiodon egregius,P. laticeps, Mabuya bistriata, Paracontias holomelas, Scincella lateralis,Tiliqua scincoides), 5 Iguania (Crotaphytidae: Gambelia wislizenii;Iguanidae: Iguana iguana, Sauromalus ater; Phrynosomatidae:Phrynosoma platyrhinos, Sceloporus occidentalis), 4 Teiidae (Aspidosc-elis inornata, Cnemidophorus ocellifer, Tupinambus quadrilineatus, T.rufrescens), one Chamaeleonidae (Furcifer oustaleti), 3 Agamidae(Calotes versicolor, Chlamydosaurus kingii, Pogona vitticeps), 4 Geck-kota (Gekkonidae: Gehyra mutilata, Hemidactylus turcicus, Terato-scincus keyserlingii; Eublepharidae: Eublepharis macularis), 2Amphisbaenia (Amphisbaenidae: Amphisbaena schmidti; Rhineuri-dae: Rhineura floridana), 4 Lacertidae (Lacerta viridis, Mesalina guttu-lata, Podarcis muralis, Takydromus tachydromoides), and oneSphenodontidae (Sphenodon punctatus).
In Serpentes, we examined one Acrochordidae (Acrochordusgranulatus), 2 species of Boidae [Boa constrictor (n = 3), Lichanuratrivirgata], 7 species of Pythonidae [(Liasis mackloti (n = 1), Moreliaboeleni (n = 2), M. viridis (n = 2), Python anchietae (n = 2), P. molurus,P. regius (n = 2), P. reticulatus (n = 2)], one Cylindrophiidae (Cylin-drophis rufus), and one Xenopeltidae (Xenopeltis unicolor). Our out-group sample totaled 67 individuals representing 25 families and59 species. However, sequence data across all of the molecularmarkers could not be derived for every individual and/or species.
2.2. DNA sampling, extraction amplification and alignment
For both ingroup and outgroup taxa, approximately 0.1 mlwhole blood was removed from the caudal vein of living animalsand stored in 1 ml of 95% ethanol. Samples of liver and tail musclewere recovered from recent road-killed specimens and similarlystored. Genomic DNA was extracted using the Puregene DNA Isola-tion Kit (Gentra Systems). Mitochondrial ATPase 8 and ATPase 6genes were amplified across 153 individuals (135 helodermat-ids + 18 outgroup taxa) using primers specified in Douglas et al.(2006b). Primers for a-enolase (ENOL, Friesen et al., 1997) ampli-fied intron 8 and small parts of exon 8 and 9 over 145 individuals
(135 helodermatids + 10 outgroup taxa), whereas primers for orni-thine decarboxylase (OD: Friesen et al., 1999) annealed in exons 6and 8 and amplified introns 6 and 7 over 147 individuals (135helodermatids + 12 outgroup taxa). Additional sequence data wereobtained from GenBank, either as entire mitochondrial genomesfrom which target genes were excised, or as specific introns (seeAcknowledgments).
Double-stranded sequencing reactions were conducted withfluorescently-labeled dideoxy terminators according to manufac-turer recommendations [Applied Biosystems Inc. (ABI), Forest City,CA]. Labeled extension products were analyzed with an automatedDNA sequencer (ABI Prism 3100). Sequences were edited usingSequencher (Gene Codes, Ann Arbor MI) and aligned with Clus-tal-X (Aladdin Systems, Heidelberg, Germany) using default gapcosts, with alignments checked visually. MacClade (v. 4.01, W.P.Maddison and D.R. Maddison, 2001; http://macclade.org/) wasused to convert individuals to their respective haplotypes or geno-types. As a mechanism to combine sequences for our analyses, weapplied the partition homogeneity test (=incongruence length dif-ference test; Farris et al., 1994), as implemented in Paup* (ver.4.04b10, Swofford, 2001; http://paup.csit.fsu.edu/).
Gaps have not been widely accepted as phylogenetic markers(Kawakita et al., 2003) and consequently are most likely ignoredas missing data, considered a fifth base, or simply excluded fromanalyses. Furthermore, gaps are not part of most explicit modelsof sequence evolution, and their evaluation has traditionally beenrestricted to parsimony methods (but see below). However, gapsclearly contain useful phylogenetic signal concordant with that ofbase substitutions (Graham et al., 2000; Simmons et al., 2001).Simple indel coding (SIC: Simmons and Ochoterena, 2000), a meth-od that successfully converted indels into analyzable data, wasbroadened and extended by Müller (2005, 2006) into multiplecomplex indel coding (MCIC), and subsequently programmed(along with older algorithms) into a readily available software(SeqState: http://www.nees.uni-bonn.de/downloads/SeqState).Gaps are coded and subjected to a stepmatrix analysis that deter-mines number of changes needed to transform one sequence intoanother. Parsimony reconstruction methods then determine theancestral states that minimize the number of character changesteps, given the tree and the observed character distribution, withthe stepmatrix explicitly specifying the number of steps from stateto state. Optimal number of transitions in the stepmatrix is derivedfrom pair-wise alignment, with selection being that transition withthe greatest similarity and the least number of steps. The result isthat indels (and peripheral bases) are successfully converted intocoded data that can then serve as input into parsimony (and other)programs.
2.3. Sequence neutrality, divergence and mismatch distributions
The HKA test (Hudson et al., 1987) was applied to our MTDNAdata so as to ensure selective neutrality for both ATPase genes,using observed and expected differences within two sister species,and the differences between these for the DNA regions being com-pared (using DNAsp 4.5; Rozas et al., 2003). We also tested neutral-ity using the McDonald–Kreitman (MK) test (McDonald andKreitman, 1991), again with DNASP.
To examine regional biodiversity, we derived molecular diver-sity indices and sequence divergencevalues for our MTDNA dataacross the 4 H. horridum subspecies, and 4 regional groupings ofH. suspectum (i.e., Arizona, México, New Mexico, and Utah) thatcorresponded to molecular clades (Section 2.5). Haplotype (h)and nucleotide (p) diversities were calculated in DNASP using thecoalescent with 1000 replications. Pair-wise sequence divergence(p) values corrected for within-group variance and based on 1000bootstrapped sequences were generated using Mega3 (Kumar

156 M.E. Douglas et al. / Molecular Phylogenetics and Evolution 55 (2010) 153–167
et al., 2004). To ascertain clock-like behavior in our MTDNA se-quences, we applied Tajima’s (1993) test to compare representa-tive sequences from Helodermatidae vs outgroups.
We calculated Tajima’s D-statistic and, if neutrality was sus-tained, applied this statistic to infer demographic history (Tajima,1989; see Douglas et al., 2006, 2009 for interpretation). However,causation is difficult to ascertain when Tajima’s D deviates signifi-cantly from zero. To clarify, we tested for neutrality and computedFu’s Fs (Fu, 1997) which is particularly useful in detecting popula-tion expansion. We contrasted these with values for Fu and Li’s F*and D*, which provide additional information regarding expansionvs background selection when calculated in tandem with Fu’s Fs.We derived Tajima’s D, Fu’s Fs, and Fu and Li’s F* and D* in DNASP
using the coalescent with 1,000 replications.Mismatch distributions reflect the frequency of pair-wise differ-
ences among individuals, and can provide information regardingdemographic history (Rodgers and Harpending, 1992). Here, a re-cent bottleneck followed by rapid, population expansion yields aunimodal mismatch distribution that approximates a Poisson dis-tribution. We tested for this scenario using DNASP.
2.4. Phylogenetic analyses
We utilized MrBayes (ver. 3.1.2; Huelsenbeck and Rohnquist,2001) to partition our MTDNA and OD data into two sections each:sequence vs standard discrete data (i.e., MCIC-coded indels), witheach being analyzed under separate models. The General TimeReversible (nst = 6) model with gamma-shaped rate variation andwith a proportion of invariant sites (rates = invgamma) was usedfor our molecular data, whereas our coded indel data were evalu-ated using a model analogous to Jukes-Cantor but developed in-stead for discrete morphological data (Lewis, 2001). However, thelimited number of available character states in this model (n = 9)forced us to derive a phylogenetic tree for our ENOL data usingmaximum parsimony (MP), in that ambiguous regions within thesedata required 12 character states for representation.
Minimum length trees for our MP analyses were obtained usingPaup*. Shortest trees were sought using heuristic searches that em-ployed accelerated character transformation (ACCTRAN) optimiza-tion, tree bisection-reconnection (TBR) branch swapping, retentionof minimal trees (MULPARS), and collapse of zero-length branchesto yield polytomies. Five replications were performed and mostparsimonious trees derived using majority-rule (MR) consensus.We also compiled an MR consensus for trees generated usingBayesian analysis of MTDNA and OD data.
2.5. Supertree approaches
Analyses employing multiple data sets are becoming increas-ingly prevalent, not only as more and varied molecular markersare employed (as herein) but also as whole genomes become se-quenced. These data are most commonly analyzed using one oftwo approaches (Philippe et al., 2005): ‘supermatrix,’ where all rel-evant data are a priori combined before analysis (sometimes re-ferred to as ‘total evidence;’ Matthee et al., 2004), and‘supertree,’ in which each of several source topologies with par-tially overlapping taxa are compiled first into a data matrix, theninto a single comprehensive tree. We summarized our diverse treesin this study using the supertree approach.
Supertree methods do have limitations (Goloboff and Pol, 2002),to include ‘signal enhancement’ (Bininda-Emonds, 2004; Bininda-Emonds et al., 2007), a situation where clade-relationships in asupertree contradict those found in one (or several) source trees.Furthermore, the assessment of uncertainty and confidence insupertree relationships is also a difficulty (Moore et al., 2007), asis interpretation of supertrees as phylogenetic hypotheses which,
in turn, can provoke unjustified conclusions. Yet, the most seriousargument is that supertrees are open to interpretation, in that theyare derived from trees rather than directly from primary data.
Our sequences were amenable for a supertree approach in thatidentical numbers of ingroup but varying numbers of outgroupindividuals were amplified for each marker. Our resulting MR con-sensus trees served as input to program TNT (Goloboff, P., Farris, J.,Nixon, K. 1999. TNT: Tree Analysis Using New Technology;www.cladistics.org). There, we derived a matrix using MRP (matrixrepresentation using parsimony; Baum, 1992; Ragan, 1992), butwith compatibility (per Goloboff and Pol, 2002), rather than parsi-mony. We then employed tree fusing, sectorial searches, and treedrifting in TNT so as to produce 22 equal-length (L = 101) trees thatreduced to a single majority-rule consensus supertree.
We also analyzed our tree data using two additional ap-proaches: a semi-strict supertree in TNT (Goloboff and Pol, 2002),and a Majority-Rule (+) supertree (per Cotton and Wilkinson,2007; Dong and Fernández-Baca, 2009; Dong et al., 2009). Strictand semi-strict consensuses are a preferred means of summarizingresults, in that each consensus group has an unambiguous inter-pretation. It is present in all (or some) input trees but absent (orcontradicted) in none (Goloboff and Pol, 2002). Although, both failto provide any confidence and/or level of uncertainty in the overallsupertree relationships they derive, each can identify monophy-letic clades that, in turn, provide a coarse level of certitude.
2.6. Molecular estimation of divergence times
Divergence times estimated from DNA sequence data arebecoming increasingly common in evolutionary and systematicstudies (Douglas et al., 2006, 2009), and are being driven by anaccelerated development of optimal estimation procedures (Ren-ner, 2005; Welch and Bromham, 2005; Rutschmann, 2006). We in-ferred divergence times from our MTDNA data by applying a semi-parametric penalized likelihood (PL) approach using a truncatedNewton (TN) optimization algorithm as implemented in the soft-ware R8S (Sanderson, 2003) and described in Douglas et al. (2006,2009). Time estimates are derived using a parametric model havinga different substitution rate on every branch, coupled with a non-parametric ‘roughness’ penalty that costs the model if rates changetoo quickly from branch-to-branch. The contribution of each isdetermined by a smoothing parameter. When large, roughnessdominates and the model is reasonably clock-like, yet when small,roughness contributes little and considerable rate variation is al-lowed. Optimal smoothing is determined by a data-driven and iter-atively run cross-validation procedure. Each terminal branch isremoved in turn with model parameters re-estimated and the ex-pected number of substitutions predicted on that branch. Perfor-mance is evaluated as a normalized ‘chi-square-like’ score. Oncewe determined the lowest cross-validation smoothing value, wethen optimized the PL approach using this value and the gammashape parameter and executed 10 searches (with multiple re-startswithin searches).
One stipulation with estimating divergence times from DNA se-quence data is the need to fix or constrain (either minimally or max-imally) fossil calibrations for nodes. We used the following sevendates in our estimation procedure: Squamata (Sphenodon; Evans,2003) = 250 mya fixed constraint; Anguimorpha (Parviraptor estesi;Evans, 1994) = 166 mya maximum constraint; Teiidae (Ptilodtodon;Nydam and Cifelli, 2002) = 112 mya minimum constraint; Heloder-matidae (Primaderma nessovi; Nydam, 2000) = 106 mya minimumconstraint; Cordylidae (Konkasaurus; Krause et al., 2003) = 68 myaminimum constraint; Shinisauridae (Bahndiwivici; Conrad,2006) = 50 mya minimum constraint; and African Varanus (Smithet al., 2008) = 31 mya minimum constraint.

Fig. 2. Results of mismatch distribution analyses (MDA) conducted for (A)Heloderma horridum alvarezi and (B) H. suspectum (México) depicting pair-wisedifferences among individuals (dashed line) plotted against expected occurrence(solid line) under a model of population expansion.
M.E. Douglas et al. / Molecular Phylogenetics and Evolution 55 (2010) 153–167 157
3. Results
3.1. Sequence amplification and alignment of ambiguous indels
PCR amplifications and automated sequencing of ATPase 8 andATPase 6 resulted in 836 base pairs (bp) of sequence converted into46 haplotypes (30 ingroup + 16 outgroup), plus an additional 21outgroup haplotypes obtained from GenBank (n = 67 total). ForENOL, 216 bp were sequenced, resulting in 32 genotypes (2 in-group + 30 outgroup), plus an additional 8 outgroup genotypesfrom GenBank (n = 40 total). Lastly, OD yielded 647 bp, resultingin 31 genotypes (7 ingroup + 24 outgroup) (n = 31 total).
After our MTDNA data were aligned, SeqState converted 30ambiguous regions into new characters. For these data, 172 (20%)were constant, 47 (5%) non-informative, and 644 (75%) parsi-mony-informative. With regard to the indel-converted characters,one (3%) was constant, 16 (53%) uninformative, and 13 (44%) par-simony-informative.
For ENOL, 216 bases were sequenced and, following sequencealignment, 11 ambiguously aligned regions were delimited and re-coded. Within the aligned sequences, 91 bp (34%) were constant,32 (12%) non-informative, and 144 (55%) parsimony-informative.Of the 11 recoded indel regions, 4 (36%) non-informative, and 7(64%) parsimony-informative. Similarly, 44 ambiguous regionswere discovered once the 619 bp of OD sequence were aligned.For these data, 134 (22%) were constant, 107 (17%) non-informa-tive and 301 (49%) parsimony-informative, whereas for the indel-converted data, one (2%) was constant, 15 (34%) were non-infor-mative, while 28 (64%) were parsimony-informative. While parsi-mony-informative characters varied percentage-wise amongsequenced regions as well as among recoded indels, MTDNA re-flected highest percentage of parsimony-informative sequencecharacters but also lowest percentage of parsimony-informativerecoded characters. In sequence vs recoded indels, parsimony-informative characters were 75% vs 44% for ATPase 8/6, 55% vs64% for ENOL, and 44% vs 64% for OD.
3.2. Sequence neutrality, divergence and demographic histories
Combining MTDNA sequences was supported by a non-significantpartition homogeneity test (Paup*: P > 0.42). All sequences wereevolving neutrally [HKA: (0.90 < P < 0.99), MK: (0.83 < P < 0.99)]and in a rate-uniform manner (Tajima’s test, P > 0.20).
Percent MTDNA sequence divergence (sd) was calculated amongthe four subspecies of H. horridum, and ranged from a high of 9.8%(±0.1) between H. h. exasperatum vs H. h. charlesbogerti, to a low of1% (±0.3) between H. h. alvarezi vs H. h. charlesbogerti (Table 1).Heloderma h. horridum differed from the other subspecies at 5.4–7.1% (±0.6–0.8). The four regional groupings of H. suspectumshowed little divergence from one another, with the greatest value
Table 1Pair-wise sequence divergence between molecular clades as identified in Figs. 3B and 5.within-group variability) while those in upper triangle are standard errors. Clade abbrecharlesbogerti; HHE = H. h. exasperatum; HSUT = H. suspectum (Utah); HS = H. suspectumVAR = Varanus.
HHA HHH HHC HHE
HHA � 0.006 0.003 0.01HHH 0.054 � 0.006 0.008HHC 0.01 0.062 � 0.01HHE 0.093 0.071 0.098 �HSUT 0.203 0.191 0.209 0.208HS 0.195 0.184 0.201 0.199HSNM 0.203 0.191 0.209 0.208HSMX 0.193 0.183 0.199 0.197VAR 0.262 0.249 0.264 0.263
between México vs Utah/New Mexico [1.4% (±0.4) for each], whilethe least was 0.3% (±0.1) between Utah/New Mexico vs the remain-der of the range (Table 1).
In comparisons across species, the four H. horridum subspecieswere most similar to H. suspectum from México (range = 18.3–19.9% ± 1.4), and they differed from Varanus on average at 25.9%(Table 1). Both H. h. alvarezi and H. suspectum showed evidencefor historic range expansion by demonstrating significant valuesfor Fu’s Fs coupled with non-significant values for Fu and Li’s F*and D*. Both also reflected negative values for Tajima’s D (alsoindicative of expansion) but the latter were not significant. Mis-match distributions for H. h. alvarezi and H. suspectum (México)yielded a distinct curve consistent with the hypothesis that each
Values in lower triangle are percent sequence divergence (p-distances corrected forviations are: HHA = Heloderma horridum alvarezi; HHH = H. h. horridum; HHC = H. h.
(Arizona); HSNM = H. suspectum (New Mexico); HSMX = H. suspectum (Mexico);
HSUT HS HSNM HSMX VAR
0.014 0.014 0.014 0.014 0.0120.014 0.014 0.014 0.014 0.0110.014 0.014 0.014 0.014 0.0120.015 0.014 0.015 0.014 0.012� 0.001 0 0.004 0.0120.003 � 0.001 0.001 0.0120 0.003 � 0.004 0.0120.014 0.004 0.014 � 0.0120.257 0.254 0.257 0.258 �

Table 2Molecular diversity in subspecies of Heloderma horridum and in regional clades of H. suspectum. Subspecies are: H. h. alvarezi = HHA; H. h. charlesbogerti = HHC; H. h.exasperatum = HHE; H. h. horridum = HHH. Regional clades are: H. suspectum Utah = HSUT; H. suspectum = HS; H. suspectum = HS; H. suspectum New Mexico = HSNM; H. suspectumMexico = HSMX. Provided are N = sample size; H = number of haplotypes; h = haplotype diversity (standard deviation in parentheses); Pi = nucleotide diversity (standarddeviation in parentheses); T-D = Tajima‘s D; Fu‘s Fs = Fu-Fs; Fu and Li’s D = F-L-D; Fu and Li’s F = F-L-F (*significance at P < 0.05).
Region N H h Pi T-D Fu-Fs F-L-D F-L-F
HHA 16 10 0.892 (0.063) 0.002 (0.0003) �1.405 �6.724 (P < 0.0000) �1.49 �1.69HHC 11 2 0.182 (0.144) 0.0002 (0.0002) �1.129 �0.41 (P < 0.37) �1.29 �1.39HHE 16 7 0.742 (0.105) 0.002 (0.001) �1.879* �1.702 (P < 0.12) �2.41* �2.61*
HHH 9 4 0.694 (0.147) 0.0025 (0.0006) 0.497 0.45 (P < 0.57) 0.69 0.71HSUT 4 1 n/a n/a n/a n/a n/a n/aHS 52 15 0.778 (0.045) 0.008 (0.0003) 1.029 0.247 (P < 0.60) �0.27 �0.22HSNM 4 1 n/a n/a n/a n/a n/a n/aHSMX 10 8 0.933 (0.077) 0.0032 (0.0006) �1.356 �3.911 (P < 0.006) �1.60 �1.73
158 M.E. Douglas et al. / Molecular Phylogenetics and Evolution 55 (2010) 153–167
had undergone a recent bottleneck and subsequent expansion(Fig. 2 and Table 2).
3.3. Phylogenetic analyses of individual markers
For MTDNA data, Bayesian analyses ran for 400k generationswith a sampling frequency every 100 generations and a burn-inof 30k generations to yield 2922 trees. For OD, 300k generations(with parameters as above) yielded 400 trees. The number of gen-erations implemented for each marker was determined when thestandard deviation of split frequencies reached 0.01. For ENOL,MP analyses yielded 120 most parsimonious trees each withLength = 646. Majority-rule trees are depicted in Figs. 3–5, respec-tively, for each of these markers.
Fig. 3A. Majority-rule (MR) consensus tree (2922 trees) derived from a partitioned BayMTDNA across 153 individuals, coupled with 30 ambiguous sequence regions containingsupport are designated, while nodes = 100% are not.
Our MTDNA tree (Fig. 3A) is rooted at Sphenodon punctatus anddepicts a basal clade, containing Gekkonidae, Agamidae andChamaeleonidae, as sister taxon to the remaining lineages of thetree. Gekkonidae is identified as sister taxon to the other two.Moreover, the one chameleonid species (a Madagascan taxon, Fur-cifer oustaleti), is sister to Calotes versicolor, thus rendering Agami-dae as polyphletic. Next is a clade consisting of three lizardfamilies + Serpentes. Here, Lacertidae is identified, albeit withlow support, as sister taxon to Amphisbaenia (Amphisbaeni-dae + Rhineuridae) + Serpentes.
The next clade is Cordylidae + Scincidae, followed by a cladecomposed of Crotaphytidae + Phrynosomatidae as sister taxon toIguanidae. This clade is sister taxon to all remaining lineages,which represent Anguimorpha, here recovered as monophyletic
esian analysis of haplotypes spanning 836 base pair (bp) of ATPase 8 and ATPase 6insertions-deletions that were recoded using program SeqState. Nodes with <100%

M.E. Douglas et al. / Molecular Phylogenetics and Evolution 55 (2010) 153–167 159
group with moderate support. Anguimorpha, falls into two clades,one placing Helodermatidae (represented as H. suspectum) as sistertaxon to Shinisauridae + Anguidae, whereas the other places Lan-thanotidae as sister taxon to Varanidae.
Helodermatidae is expanded (Fig. 3B) to depict its constituent28 haplotypes (107 individuals), with H. horridum and H. suspectumas sister taxa. Within H. horridum, each of the 4 subspecies forms adistinct clade. One places Heloderma h. charlesbogerti as sister tax-on to a somewhat undifferentiated H. h. alvarezi, whereas the othershows H. h. exasperatum and H. h. horridum as clearly differentiatedsister taxa.
Within H. suspectum, we detected no molecular evidence for itstwo recognized subspecies, H. s. suspectum (Reticulate Gila mon-ster) and H. s. cinctum (Banded Gila monster). In fact, putative H.s. cinctum from Utah and Nevada [(UT) 1–5; (NV) 1] share a haplo-type with H. s. suspectum from New Mexico [(NM) 1–5].
The ENOL-tree (Fig. 4) depicts Gekkota (Eublepharidae + Gekk-onidae) as sister taxon to a clade containing all other lineages,although the latter is only weakly supported. Serpentes is recov-ered as monophyletic group and placed as sister taxon to theremainder of the tree. Here, a clade formed by Lacertidae (repre-sented by Mesalina guttulata) + Teiidae is shown as sister taxon toScincidae + Anguimorpha. Congruent with the mtDNA topology,Anguimorpha is recovered as a monophyletic group, although rela-tionships within differ. Helodermatidae (H. suspectum and H. horri-dum) is now depicted as sister taxon to the other Anguimorpha.These fall into two clades, one formed by Anguidae as sister taxonto Shinisauridae + Xenosauridae, and another representing Varani-dae. All H. suspectum and H. horridum revealed their respective spe-cies-specific genotypes without subspecific division.
The OD-tree (Fig. 5), rooted at Gekkonidae, depicts a polyphy-letic Scincidae, where one species (Tiliqua scincoides) is placed asthe basal taxon to a clade that contains another Scincidae (Coruciazebrata) as sister taxon to the remaining lineages. Serpentes andAnguimorpha each form a monophyletic group and are recovered
Fig. 3B. Continuation of the partitioned Bayesian analysis of haplotypes shown in Fig. 3A.displayed). Numbers following leaf names refer to individuals.
as sister taxa. Anguimorpha is split into two clades, one represent-ing Varanidae, whereas the other is composed of Anguidae as sistertaxon to Shinisauridae + Helodermatidae. Within Helodermatidae,H. suspectum and H. horridum are clearly identified as sister taxa,but subspecies of the latter form a polytomy (trichotomy), withone group corresponding to H. h. exasperatum and another to H.h. horridum, respectively, whereas a third consists of a clade con-taining H. h. charlesbogerti and H. h. alvarezi as sister taxa.
3.4. Phylogenetic analyses using supertree approaches
The supertree composite of our MR trees is depicted in Fig. 6,and rooted at Sphenodontidae. A basal clade consisting of Chama-eleonidae + Agamidae as sister taxon to Gekkonidae is followed bya composite clade that includes Amphisbaenia (Amphisbaeni-dae + Rhineuridae), Eublepharidae and Lacertidae, although nodesupport for these groups is low. The supertree topology recoversa well-defined Serpentes as sister taxon to the remaining lineages,with a composite clade combining Iguania + Teiidae as sister taxonto Scincidae + Anguimorpha, both well-supported as monophyleticgroups. Within Anguimorpha, Helodermatidae is placed basal to aclade containing two groups, one including Shinisauridae + Xeno-sauridae as sister taxon to Anguidae, while the other places Latha-notidae as sister taxon to Varanidae, Aberrant placement of somespecies (Gekkonidae: Gehyra mutilata; Lacertidae: Mesalina guttula-ta) and low node support for other groupings are likely a result ofhaving but a single marker (ENOL) representing these taxa.
In Helodermatidae, Heloderma suspectum is placed as sister tax-on to H. horridium, which exhibits a polytomy consisting of H. h.horridum, H. h. exasperatum and a clade with H. h. alvarezi + H. h.charlesbogerti, a topography that effectively recovers the 4 subspe-cies as distinct taxa. By employing compatibility (Estabrook, 2008)to analyze the matrix representing our three input trees (i.e., byfinding those trees determined by the largest clique of compatiblecharacters), we determined how frequently a group is recovered,
Heloderma now expanded into constituent haplotypes. All nodes at 100% (values not

Fig. 4. Maximum parsimony analysis of a-enolase (ENOL) genotypes from 216 bp of intron 8 and small parts of exon 8 and 9 over 145 individuals coupled with 11 ambiguoussequence regions containing insertions-deletions that were recoded using program SeqState. Nodes with <100% support are designated, while nodes = 100% are not.
160 M.E. Douglas et al. / Molecular Phylogenetics and Evolution 55 (2010) 153–167
and (by so doing) produced results more reasonable than thosefrom MRP (Goloboff and Pol, 2002). We also employed semi-strictand majority-rule (+) supertree approaches to analyze our MRPdata and each yielded a monophyletic Anguidae, Varanidae, andHelodermatidae (trees not shown).
3.5. Molecular estimation of divergence times
Five iterations of the TN method were required to establish anoptimal smoothing parameter of 3.27 (log 10 = 0.51455). Insertingthis and the gamma value into method TN yielded divergencetimes depicted in Table 3. The MRCA of Anguimorpha (maximallyconstrained at 166 mya) resulted instead in an estimated diver-gence time of 127 mya (=Early Cretaceous), while the MRCA nodefor Lanthanotidae was estimated to be Mid Cretaceous(108 mya). Shinisauridae (minimally constrained to 50 mya), wasestimated at 59.7 mya (=Early Paleocene) (Table 3). The MRCA forVaranidae was placed in Early Eocene while the MRCA for Serpen-tes was Mid Eocene (42.6 mya; Table 3).
The MRCA for Helodermatidae (minimally configured at106 mya) was estimated at 35.4 mya (Late Eocene, at the Eo-cene–Oligocene juncture). The MRCA of Heloderma horridum wasdated to 9.71 mya (Lower Miocene), with considerable stasis
(5+ mya) before it subsequently diversified again. The first was re-stricted to H. h. exasperatum and H. h. horridum (4.42 mya), and thesecond to H. h. alvarezi and H. h. charlesbogerti (3.02 mya). How-ever, H. suspectum appears not to have diversified until the Pleisto-cene (2 mya), suggesting a period of stasis that persisted for>7 mya since its divergence from H. horridum.
4. Discussion
Our study used a molecular approach to investigate both deeperand more recent histories of the Beaded Lizard (H. horridum) andGila Monster (H. suspectum) throughout their geographic rangesin North and Central America. We employed MT- and NDNAs toexamine the phylogenetic diversity of this group in the contextof the larger squamate clades Varanoidea and Anguimorpha, aswell as other major Squamate lineages, including Serpentes. Fur-thermore, we summarized our data using a supertree approach,as a means of providing consensus among disparate phylogeneticsignals. We discuss these results at several levels by: (a) dissectingthe deep historical relationships among these Squamate clades; (b)evaluating diversification within the Helodermatidae and its bio-geographic significance; (c) juxtaposing congruence among molec-ular divergence times and clade diversification; and (d)
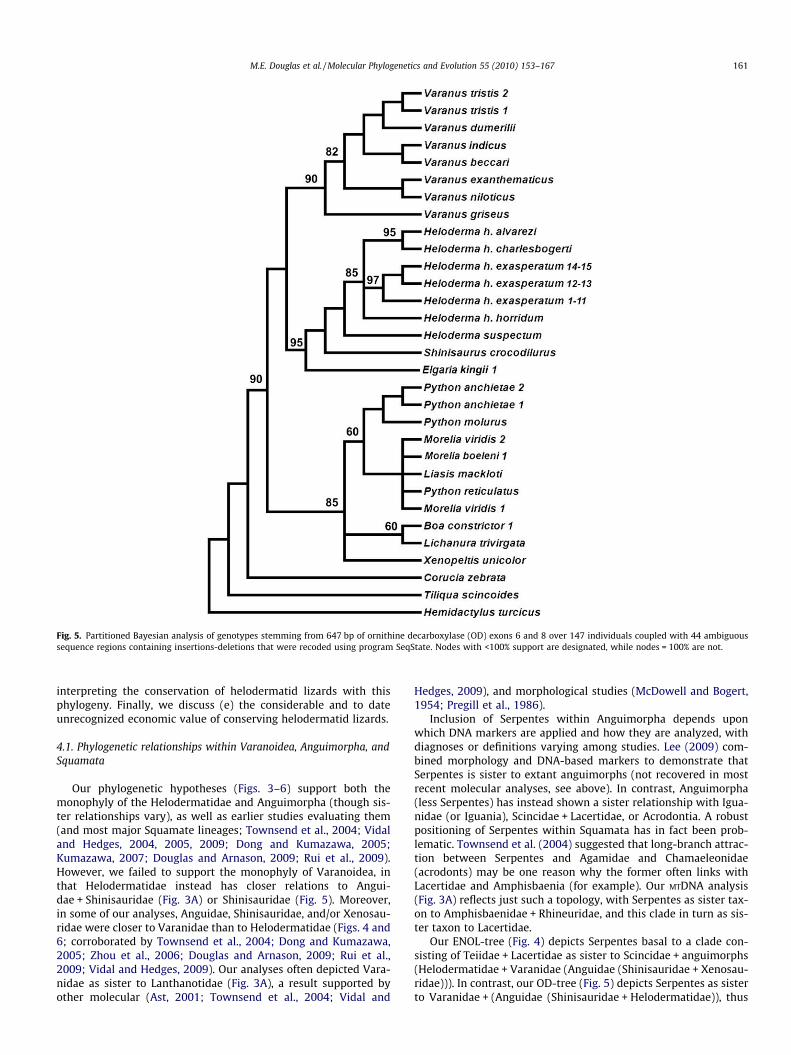
Fig. 5. Partitioned Bayesian analysis of genotypes stemming from 647 bp of ornithine decarboxylase (OD) exons 6 and 8 over 147 individuals coupled with 44 ambiguoussequence regions containing insertions-deletions that were recoded using program SeqState. Nodes with <100% support are designated, while nodes = 100% are not.
M.E. Douglas et al. / Molecular Phylogenetics and Evolution 55 (2010) 153–167 161
interpreting the conservation of helodermatid lizards with thisphylogeny. Finally, we discuss (e) the considerable and to dateunrecognized economic value of conserving helodermatid lizards.
4.1. Phylogenetic relationships within Varanoidea, Anguimorpha, andSquamata
Our phylogenetic hypotheses (Figs. 3–6) support both themonophyly of the Helodermatidae and Anguimorpha (though sis-ter relationships vary), as well as earlier studies evaluating them(and most major Squamate lineages; Townsend et al., 2004; Vidaland Hedges, 2004, 2005, 2009; Dong and Kumazawa, 2005;Kumazawa, 2007; Douglas and Arnason, 2009; Rui et al., 2009).However, we failed to support the monophyly of Varanoidea, inthat Helodermatidae instead has closer relations to Angui-dae + Shinisauridae (Fig. 3A) or Shinisauridae (Fig. 5). Moreover,in some of our analyses, Anguidae, Shinisauridae, and/or Xenosau-ridae were closer to Varanidae than to Helodermatidae (Figs. 4 and6; corroborated by Townsend et al., 2004; Dong and Kumazawa,2005; Zhou et al., 2006; Douglas and Arnason, 2009; Rui et al.,2009; Vidal and Hedges, 2009). Our analyses often depicted Vara-nidae as sister to Lanthanotidae (Fig. 3A), a result supported byother molecular (Ast, 2001; Townsend et al., 2004; Vidal and
Hedges, 2009), and morphological studies (McDowell and Bogert,1954; Pregill et al., 1986).
Inclusion of Serpentes within Anguimorpha depends uponwhich DNA markers are applied and how they are analyzed, withdiagnoses or definitions varying among studies. Lee (2009) com-bined morphology and DNA-based markers to demonstrate thatSerpentes is sister to extant anguimorphs (not recovered in mostrecent molecular analyses, see above). In contrast, Anguimorpha(less Serpentes) has instead shown a sister relationship with Igua-nidae (or Iguania), Scincidae + Lacertidae, or Acrodontia. A robustpositioning of Serpentes within Squamata has in fact been prob-lematic. Townsend et al. (2004) suggested that long-branch attrac-tion between Serpentes and Agamidae and Chamaeleonidae(acrodonts) may be one reason why the former often links withLacertidae and Amphisbaenia (for example). Our MTDNA analysis(Fig. 3A) reflects just such a topology, with Serpentes as sister tax-on to Amphisbaenidae + Rhineuridae, and this clade in turn as sis-ter taxon to Lacertidae.
Our ENOL-tree (Fig. 4) depicts Serpentes basal to a clade con-sisting of Teiidae + Lacertidae as sister to Scincidae + anguimorphs(Helodermatidae + Varanidae (Anguidae (Shinisauridae + Xenosau-ridae))). In contrast, our OD-tree (Fig. 5) depicts Serpentes as sisterto Varanidae + (Anguidae (Shinisauridae + Helodermatidae)), thus

Fig. 6. Supertree for all taxa produced by matrix representation a compatibility approach to matrix representation using parsimony (MRP). Input consisted of separateBayesian trees [MTDNA atpase 8 and ATPase 6 (Figs. 3A and B) and ornithine decarboxylase (OD) intron (Fig. 5)] as well as a maximum parsimony (MP) tree based on analysisof the a-enolase (ENOL) intron (Fig. 4). Trees were compiled using TnT (Tree technology using New Technology: Goloboff, 1999). Nodes with <80% support are designated,while nodes >80% are not.
162 M.E. Douglas et al. / Molecular Phylogenetics and Evolution 55 (2010) 153–167
rendering a monophyletic Anguimorpha (Lee, 2009). Finally, oursupertree topology places Serpentes as basal to a mixed clade con-taining Teiidae + Iguania (Crotaphytidae, Iguanidae, Phyrnosomat-idae) as sister taxon to Scincidae + Cordylidae and anguimorphs(Helodermatidae, Varanidae, Anguidae, Shinisauridae + Xenosauri-dae). Clearly, additional perspectives and analyses are neededbefore Serpentes can be confidently imbedded within the largerSquamata clade (Albert et al., 2009; Schulte and Cartwright,2009).
In our mtDNA majority-rule consensus tree (Fig. 3A), we showHeloderma (H. suspectum) as sister taxon to Anguidae + Shinisauri-dae. Similar relationships [i.e., (Helodermatidae (Anguidae + Xeno-sauridae)) and Helodermatidae + Anguidae] have been recoveredin other studies (Townsend et al., 2004; Vidal and Hedges, 2004,2005; Kumazawa, 2007; Douglas and Arnason, 2009). Likewise,our partitioned Bayesian analysis of OD recovered Heloderma assister taxon to Shinisauridae (Fig. 5). Finally, our MP analysis ofENOL has Heloderma as sister taxon to all other anguimorphs
(Fig. 4). None recovered Helodermatidae as sister taxon to Varani-dae, or to Varanidae + Lanthanotidae (McDowell and Bogert, 1954;Bogert and Martin del Campo, 1956; Pregill et al., 1986; Estes et al.,1988; Townsend et al., 2004).
We note some mixed post-outgroup configurations within oursupertree (Fig. 6). For example, Lacertidae, Teiidae, Cordylidae,and Scincidae fall within more derived clades. Yet, many otherrelationships (i.e., Serpentes and Anguimorpha) adequately recovermarker tree topologies, as well as phylogenetic perspectives over-all. We suggest the supertree may reflect a reasonable compilationof the diversity found within constituent trees simply becausecomposite OTUs (operational taxonomic units) are relatively simi-lar within each tree (MTDNA = 38; ENOL = 40; OD = 31). Albeit, thedifferent topologies place Helodermatidae in varying relationshipsto Anguidae and Varanidae, the supertree recovers distinct H.suspectum and H. horridum, as well as clear divergences withinthe latter that correspond to (and exceed) subspecific designations(per Douglas et al., 2007).

Table 3Divergence times for selected clades in Figs. 3A and B, determined using a semi-parametric penalized likelihood (PL) approach implemented in the software R8S.Node refers to taxonomic clades. Mean age of the node is presented in millions ofyears (mya), with numbers in parentheses representing confidence intervals (CIvalues, in mya). Configuration (of node) is: Max = maximum; Min = minimum;E = estimated. HHC/HHA = Heloderma h. charlesbogerti/H. h. alvarezi; HHE/HHH = H. h.exasperatum/H. h. horridum.
Node Mean age (CI values) Configuration
Iguanidae 146.1 (117.9–174.3) EAnguimorpha 127.1 (105.5–148.7) Max (166)Lanthanotidae 108.3 (83.3–133.2) EShinisauridae 59.7 (17.6–100.3) Min (50)Varanidae 48.7 (30.7–73.6) Min (31)Serpentes 42.6 (26.5–64.6) EAnguidae 40.5 (23.1–65.4) EHelodermatidae 35.4 (29.4–41.4) Min (106)H. horridum 9.71 (7.86–11.6) EHHE/HHH 4.42 (2.35–6.89) EHHC/HHA 3.02 (1.65–4.99) EH. suspectum 2.0 (1.2–2.9) E
M.E. Douglas et al. / Molecular Phylogenetics and Evolution 55 (2010) 153–167 163
4.2. Helodermatid evolution within the warm deserts of North America
Embedding the evolution of Heloderma within a larger phyloge-netic context allows us to derive a timeline for its diversification,and consequently, to place these events within a scenario oflong-term environmental change in the desert ecosystems in NorthAmerica (Douglas et al., 2006). The Sonoran Desert, in particular(MacMahon, 1997), was well established by Late Miocene (8–5 mya), thus making it one of the youngest biotic communities ofNorth America (Axelrod, 1979). As the climate in North Americabecame drier and more variable during Miocene, Helodermaevolved into a subtropical and desert specialist (Pregill et al.,1986), and by so doing, diverged in lifestyle from highly preda-ceous (Nydam, 2000) to increasingly sedentary (Beck, 2005). Ex-tant Heloderma now reflect low metabolic rates and activitylevels, ingest large meals, and have a considerable physiologicalcapacity for fat storage (Beck, 2005 and references therein). These(and other) traits reflect adaptations to harsh arid environments,and enable helodermatids to subsist for long periods withoutfeeding.
During much of the Quaternary, the typical environment ofsouthwestern North America was woodlands and forests (as evi-denced in Neotoma middens), with desert scrub found only atlow elevations (<300 m) along the Colorado River (Van Devenderand Spaulding, 1979). In early Holocene (ca. 8 kybp), a rapid andwidespread warming trend (Pielou, 1991) eliminated these wood-lands. Desert-adapted plants increased in abundance and dispersedinto new areas (Weng and Jackson, 1999), concomitant with dras-tic effects on regional faunas (Douglas et al., 2003; Hull and Gir-man, 2005).
Given the conservation concerns regarding H. suspectum (seebelow), its historical demography is thus of considerable interest.We were particularly interested in its overall genetic diversity,whether it is parceled into geographic regions, and how the latterare related one to another in an evolutionary context. Our conser-vation phylogenetic perspective was thus germane to these issues,yet we were surprised to discover very low levels of genetic diver-sity and a lack of geographic substructure in this species.
If low genetic diversity, like that reported for H. suspectum, wereuncovered in an endangered species, possible explanations wouldinclude small population sizes, demographic instability, inbreed-ing, bottleneck effects, and the loss of intervening gene flow dueto severe habitat reduction and fragmentation (per a molecularconservation genetics approach discussed above). Consequently,our approach (phylogenetic conservation using geographically
widespread species) suggests that biodiversity perspectives withinthe warm deserts of North America should be reconsidered.
Patterns of low genetic diversity, similar to that found in H.suspectum, were also uncovered in two rattlesnake species withranges restricted primarily to the Sonoran Desert (Crotalus ruberand C. tigris; Douglas et al., 2006). This offers an hypothesis thatnumerous (and diverse) species were similarly impacted in this re-gion by a biome-wide phenomenon. The fluctuating climatic re-gimes of the Pleistocene, driven by numerous glacial advancesand retreats, lend anecdotal support for this hypothesis, in thatthey have been implicated as drivers for low genetic variabilityin other (more diverse) organisms inhabiting the western NorthAmerican deserts (Hunter et al., 2001; Smith and Farrell,2005a,b; Douglas et al., 2006).
4.3. Clade diversification and its congruence with moleculardivergence times
The evolution of H. suspectum also reflects a long period of stasis(�30 mya) following an initial split from a common ancestor withH. horridum in the Early Eocene. Subsequent evolution did notseemingly occur until Mid and Late Pliocene, and Early Pleistocene(Table 3). Fossil data for helodermatids are fairly complete, and H.suspectum is well established in southwestern North America intoLate Pleistocene (Pianka and King, 2004; Beck, 2005; Bhullar andSmith, 2008). Van Devender (2002) suggested H. horridum and H.suspectum each evolved in isolation, based on obvious morpholog-ical differences and the fact that their distributions overlap insouthern Sonora, México. The Mid Miocene uplift of the SierraMadre Occidental separated the MRCA of H. horridum and the ex-tinct H. texana, with the latter evolving in the Chihuahuan Deserteast of the Continental Divide (Van Devender, 2002). It apparentlydispersed northward into Texas (Yatkola, 1976) and northwestacross the Continental Divide into a region termed Mohavia (Mor-afka, 1977). Continued uplift and colder conditions presumably ledto the extinction of eastern H. texana, whereas western populationssurvived and evolved as H. s. cinctum. Heloderma suspectum subse-quently dispersed south and came into contact with H. horridumafter both were independently derived species, with the MohaveDesert H. s. cinctum presently representing the sister subspeciesof H. s. suspectum (Van Devender 2002). However, newer perspec-tives conflict somewhat with this scenario. For example, the appli-cation of banded vs reticulate color patterns as traditionaldelimiters of geographic differentiation in H. suspectum has proveninvalid (Beck, 2005, Plates 15–17). Also, our molecular data lack aphylogeographic signal for this species and, in combination withthe above, serve to refute subspecific categories in H. suspectum.
The inherent difficulties with diagnosing component clades inthe Helodermatidae, coupled with the broader issue of recognizinga monophyletic Varanoidea, serve to underscore the validity of ourconservation phylogenetic approach. Previous morphological (andother molecular) methodologies have been unable to unravel theseconnections, due either to sample size issues, perspectives, or both.We discuss below the methods and protocols by which these datacan be used to potentially conserve and manage helodermatidlizards.
4.4. Phylogenetics and the conservation of helodermatid lizards
The most apparent threats to Heloderma occur at northern andsouthern boundaries of its distribution, particularly the latter(Fig. 1). For example, H. horridum occurs almost exclusively withinor adjacent to the Tropical Dry Forest (i.e., TDF) biome, the mostthreatened of the major forest types (Stoner and Sanchez-Azofeifa,2009). When Spaniards entered the New World, TDF ranged fromPanama northward to western México (�550,000 km2). Today only

164 M.E. Douglas et al. / Molecular Phylogenetics and Evolution 55 (2010) 153–167
0.09% of that region (480 km2) has official conservation status, andless than 2% of TDF is sufficiently intact to attract attention of con-servationists (Janzen, 1988). Although tropical rainforests containgreater total species diversity, dry forests are much more diverse(Sanchez-Azofeifa et al., 2005), particularly with regard to species‘activities’ (i.e., adaptations of organisms to seasonal drought,diversifications of growth forms in plants, strategies of insect par-asitoids, etc.; Janzen, 1988; Becerra et al., 2009). The importance ofthese aspects is amplified below with regard to speciation.
In western México, TDF is geographically and ecologically iso-lated from other such remnants (Ceballos, 1995), yet it harborsan elevated number of endemic vertebrates. For example, 173 rep-tile and amphibian species (43% of the Méxican fauna) are re-stricted to western TDF (García-Aguayo and Ceballos, 1994;Ceballos, 1995). Dry forest habitat is fast disappearing due to hu-man activities (Williams-Linera and Lorea, 2009). Although severalTDF sites were identified as candidates for protection by CONABIO(Comisión Nacional para el Conocimiento y Uso de la Biodiversi-dad), those containing the majority of locality records for both spe-cies of Heloderma were not included. This is unfortunate becausethe southern H. horridum populations contain the greatest levelsof genetic diversity. Furthermore, unlike H. suspectum, our analysesrobustly support the current subspecific designations within H.horridum. However, these particular lineages almost certainly cir-cumscribe more than a single species (Figs. 3A, 5, 6). Thus, one ben-efit of a conservation phylogenetic perspective is that it canproperly identify biodiversity to its correct (and thus manageable)taxonomic level. A phylogenetic evaluation of the Helodermatidae,using independent markers evolving at different rates, allowed usto track clade divergences at various temporal scales, which in turnunderscored the variability among the two Helodermatid specieswith regard to their evolutionary time lines. This, in turn, impactsour perspectives regarding their conservation status.
While this study can clearly visualize cryptic (as well as over-extended) biodiversity, can it also estimate the potential for phylo-genetic biodiversity loss as well? Indeed it can, particularly if othervertebrate groups are employed as a relevant benchmark. Davieset al. (2009) argued that mammalian species are more likely tobe ‘at risk’ when they have few close relatives, or are habitat spe-cialists with narrow tolerances and reduced geographic ranges.Other mitigating factors are species-distributions within temper-ate regions that juxtapose with those of other threatened species,and which manifest elevated human densities. These can be easilyreflected to the Helodermatidae. Heloderma horridum is a habitat-specialist with few close relatives in a reduced geographic regionof elevated conservation concern and with a burgeoning humanpopulation as well.
Similarly, phylogenetic analyses can also identify recentlydiversified clades and the regions within which they are found,with the premise that such clades or regions might represent en-gines of speciation. The fact that H. horridum (sensu lato) exhibitsthe most derived characters of the Helodermatidae (Fig. 3A, 5, 6)suggests that TDF habitat is indeed such an engine, and thus everyeffort should be made to allocate reserves and to designate na-tional parks within this region.
We can also apply the phylogenetic findings in this study as abaseline for conservation decisions regarding H. suspectum. UnlikeH. horridum, the lack of significant genetic variability in H. suspec-tum stands in contrast to its demonstrated antiquity. This provokesapprehension in that species of conservation concern (such as H.suspectum) are impacted first by genetic factors long before otheraspects drive them to extinction (Spielman et al., 2004). As withH. horridum, this clade has few close relatives yet is limited to a re-stricted geographic area that contains a burgeoning human popu-lation (Sullivan et al., 2004; Beck, 2005; Kwiatkowski et al.,2008). Most importantly, any conservation investment in H.
suspectum will likely be ineffective if economic and/or political fac-tors push in the opposite direction. Conservation perspectivesshould instead juxtapose the phylogenetic history of this specieswithin a socio-economic matrix (McNeely, 2006) so as to attractas broad a target audience as possible, including politicians andthe lay public (Avise et al., 2008).
4.5. The economic value of helodermatid conservation
Venom constituents are a cornucopia for pharmaceutical com-panies, and this aspect is a widely recognized attribute of Helo-derma (Beck, 2005). Helodermatid venom is unique amongreptiles in showing the highest number of bioactive peptides (Ber-tanccini, 1976). Most important in this regard is exendin-4, foundonly in H. suspectum, the sister to all remaining Helodermatidae.Exenatide (synthesized from exendin-4 as Byetta, Amylin/Eli Lilly,San Diego, CA) enhances insulin release in response to elevatedblood glucose and improves glycemic control by replicating thepharmacological attributes of mammalian glucagon-like peptide-1 (GLP-1) (Lam and See, 2006). As such, it is a new treatment foradult-onset type-II diabetes mellitus, a serious health issue that ac-counts for the majority (>90%) of the 18 million cases in the UnitedStates alone, and 150 million worldwide (Pollack, 2002; Lam andSee, 2006). This is an important aspect, and for a variety of reasons.Biomedical applications that flow from the practical application ofbiodiversity conservation (such as drug development from naturalproducts) have been sluggish in emerging (Timmerman et al.,1999; but see Li and Vederas, 2009). This, in turn, has tilted politi-cians and the pubic away from biodiversity conservation and to-wards immediate economic gains produced by altering naturalhabitats and ecosystem services (Palmer et al., 2004). Thus, thedevelopment by a large pharmaceutical company of a potentialremediation for type-II diabetes based upon bio-molecules froma non-charismatic and venomous lizard unequivocally illustratesthe economic benefits that biodiversity can provide. Conservationphylogenetics not only places saliva/venom constituents of Helo-dermatidae within the context of deep history, but simultaneouslyprovides a strong economic incentive for why this clade should beconserved.
5. Conclusion
Phylogenetic data can point to the origins of biodiversity. Theircareful assembly and scrutiny often yield information on the man-ner by which particular clades have responded to past environ-mental challenges and, in turn, how they may respond toongoing human-mediated alterations of the environment. In thissense, phylogenetic analyses can be profitably juxtaposed withthose detailing habitat fragmentation and global change, to notonly understand impacts of historic climatic shifts but to poten-tially disentangle them from contemporary effects (Douglas et al.,2003; Willis and Birks, 2006). This is imperative when species-lossmust be evaluated or predicted in a conservation context.
Acknowledgments
Numerous individuals provided field/lab support, samples, and/or critical advice. They are M. Andrade, D. Boyer, C. Baldera, J. Du-bach, J. Campbell, D. DeNardo, M. Hill, R. Ihle, T. Jones, H. Koenig, M.Kwiatkowski, D. Lawson, J. Malcom, S. Meyer, W. Montgomery, E.Nowak, L. Porras, W. Radke, A. Ramírez, A. Ramírez-Bautista, C.Ray, R. Repp, C. Guichard Romero, K. Sullivan, E. Taylor, B. Tomber-lin, M. Villa, and E. Wolbert. We graciously acknowledge T. Town-send for providing a DNA sample of Lanthanotus borneensis, and J.Lemos-Espinal for tissue samples of Xenosaurus rectocollaris. The

M.E. Douglas et al. / Molecular Phylogenetics and Evolution 55 (2010) 153–167 165
assistance of personnel managing live collections at: Centro Ecolo-gia de Sonora (México); San Diego Zoo (CA); Sedgwick County Zoo;Universidad Nacional Autónoma de México (DF, México), ZoológicoMiguél Álvarez del Toro (Chiapas, México), and Zoo Atlanta isgreatly appreciated. This research was funded, in part, by a Heri-tage Grant from the Arizona Game and Fish Department (B.K.S.and G.W.S.), a Research Incentive Award/Scholarly Research andCreative Activities Award, Arizona State University (G.W.S), ZooAtlanta, Georgia State University, and Illinois Natural HistorySurvey. Scientific collecting permits from México and the statesof Arizona, Nevada, New Mexico, and Utah are duly noted andappreciated. Complete MTDNA genomes were obtained fromGenBank for the following lepidosaurian taxa (GenBank numberin parentheses): Teratoscincus keyserlingii (AY753545); Calotesversicolor (AB183287); Furcifer oustaleti (AB185326); Pogona vitti-ceps (AB166795); Chlamydosaurus kingii (EF090421); Abroniagraminea (AB080273); Varanus komodoensis (AB080275); Iguanaiguana (AJ278511); Sceloporus occidentalis (AB079242); Plestiodonegregius (AB016606); Cordylus warreni (AB079613); Cylindrophisrufus (AB179619); Python regius (AB177878); Boa constrictor(AB177354); Acrochordus granulatus (AB177879); Amphisbaenaschmidti (AY605475); Rhineura floridana (AY605473); Podarcismuralis (FJ460597); Takydromus tachydromoides (AB080237);Lacerta viridis (AM176577); Sphenodon punctatus (AF534390). Wedownloaded a�enolase (ENOL) genotypes from GenBank for thefollowing taxa (GenBank number in parentheses): Paracontiasholomelas (AY391227); Plestiodon laticeps (AY218074); Mabuyabistriata (DQ239345); Scincella lateralis (AY218049); Cnemidopho-rus ocellifer (AY218077); Tupinambis quadrilineatus (AY218076);Mesalina guttulata (AY218056); Gehyra mutilata (AY218045).
References
Albert, E.M., San Mauro, D., García-París, M., Rüber, L., Zardoya, R., 2009. Effect oftaxon sampling on recovering the phylogeny of squamate reptiles based onmitochondrial genome and nuclear gene sequence data. Gene 441, 12–21.
Ast, J.C., 2001. Mitochondrial DNA evidence and evolution in Varanoidea(Squamata). Cladistics 17, 211–226.
Avise, J.C., 1996. The scope of conservation genetics. In: Avise, J.C., Hamrick, J.L.(Eds.), Conservation Genetics: Case Histories from Nature. Chapman and Hall,New York, NY, pp. 1–9.
Avise, J.C., 2000. Phylogeography, the History and Formation of Species. HarvardUniversity Press, Cambridge, Massachusetts.
Avise, J.C., 2005. Phylogenetic units and currencies above and below the specieslevel. In: Purvis, A., Gittleman, J.L., Brooks, T. (Eds.), Phylogeny andConservation. Cambridge University Press, Cambridge, U.K, pp. 76–119.
Avise, J.C., 2008. Three ambitious (and rather unorthodox) assignments for thefield of biodiversity genetics. Proc. Natl. Acad. Sci. USA 105 (Suppl.), 11564–11570.
Avise, J.C., 2009. Phylogeography: retrospect and prospect. J. Biogeogr. 36, 3–15.Avise, J.C., Hubbell, S.P., Ayala, F.J., 2008. In the light of evolution II: biodiversity and
extinction. Proc. Natl. Acad. Sci. USA 105 (Suppl.), 11453–11457.Axelrod, D.I., 1979. Age and origin of the Sonoran Desert vegetation. Occ. Pap. Ca.
Acad. Sci. 132, 1–74.Baum, B.R., 1992. Combining trees as a way of combining data sets for phylogenetic
inference, and the desirability of combining gene trees. Taxon 41, 3–10.Becerra, J.X., Noge, K., Venable, L.D., 2009. Macroevolutionary chemical escalation in
an ancient plant-herbivore arms race. Proc. Natl. Acad. Sci. USA 106, 18062–18066.
Beck, D.D., 2005. Biology of Gila Monsters and Beaded Lizards. University ofCalifornia Press, Berkeley, California.
Bertanccini, G., 1976. Active polypeptides of non-mammalian origin. Pharmacol.Rev. 28, 127–177.
Bhullar, B.-A., Smith, K.T., 2008. Helodermatid lizard from the Miocene of Florida,the evolution of the dentary in Helodermatidae, and comments on dentarymorphology in Varanoidea. J. Herpetol. 42, 286–302.
Bininda-Emonds, O.R.P., 2004. The evolution of supertrees. Trends Ecol. Evol. 19,315–322.
Bininda-Emonds, O.R.P., Cardillo, M., Jones, K.E., MacPhee, R.D.E., Beck, R.M.D.,Grenyer, R., Price, S.A., Vos, R.A., Gittleman, J.L., Purvis, A., 2007. The delayed riseof present-day mammals. Nature 446, 507–512.
Bogert, C.M., Martin del Campo, R., 1956. The Gila Monster and its allies: therelationships, habits, and behavior of the lizards of the family Helodermatidae.Bull. Amer. Mus. Nat. Hist. 109, 1–238.
Campbell, J.A., Lamar, W.L., 2004. The Venomous Reptiles of the WesternHemisphere, vol. 1. Cornell University Press, Ithaca, New York.
Ceballos, G., 1995. Vertebrate diversity, ecology, and conservation in neotropical dryforests. In: Bullock, S.H., Mooney, H.A., Medina, E. (Eds.), Seasonally Dry TropicalForests. Cambridge University Press, Cambridge, U.K, pp. 195–220.
Conrad, J.L., 2006. An Eocene shinisaurid (Reptilia, Squamata) from Wyoming, USA.J. Vert. Paleontol. 26, 113–126.
Cotton, J.A., Wilkinson, M., 2007. Majority-rule supertrees. Syst. Biol. 56, 445–452.Crozier, R.H., 1997. Preserving the information content of species: genetic diversity,
phylogeny and conservation worth. Ann. Rev. Ecol. Syst. 24, 243–268.Crozier, R.H., Dunnett, L.J., Agapow, P.-M., 2006. Phylogenetic biodiversity assessment
based on systematic nomenclature. Evol. Bioinform. Online 1, 11–36.Davies, T.J., Fritz, S.A., Grenyer, R., Orme, C.D.L., Bielby, J., Bininda-Emonds, O.R.P.,
Cardillo, M., Jones, K.E., Gittleman, J.L., Mace, G.M., Purvis, A., 2009. Phylogenetictrees and the future of mammalian biodiversity. Proc. Natl. Acad. Sci. USA 105(Suppl.), 11556–11563.
Dong, J., Fernández-Baca, D., 2009. Properties of majority-rule supertrees. Syst. Biol.58, 360–367.
Dong, S., Kumazawa, Y., 2005. Complete mitochondrial DNA sequences of sixsnakes: phylogenetic relationships and molecular evolution of genomicfeatures. J. Mol. Evol. 61, 12–22.
Dong, J., Fernández-Baca, D., McMorris, F.R., 2009. Constructing majority-rulesupertrees. In: Salzberg, S.L., Warnow, T. (Eds.), Lecture Notes in ComputerScience, vol. 5724. Springer, Berlin/Heidelberg, Germany, pp. 73–84.
Douglas, D.A., Arnason, U., 2009. Examining the utility of categorical models andalleviating artifacts in phylogenetic reconstruction of the Squamata (Reptilia).Mol. Phylogenet. Evol. 52, 784–796.
Douglas, M.E., Douglas, M.R., Schuett, G.W., Porras, L.W., Holycross, A.T., 2002.Phylogeography of the Western Rattlesnake (Crotalus viridis) complex withemphasis on the Colorado Plateau. In: Schuett, G.W., Höggren, M., Douglas, M.E.,Greene, H.W. (Eds.), Biology of the Vipers. Eagle Mountain Publishing, LC, EagleMountain, Utah, pp. 11–50.
Douglas, M.R., Brunner, P.C., Douglas, M.E., 2003. Drought in an evolutionarycontext: molecular variability in Flannelmouth Sucker (Catostomus latipinnis)from the Colorado River Basin of Western North America. Freshwater Biol. 48,1254–1273.
Douglas, M.E., Douglas, M.R., Schuett, G.W., Porras, L.W., 2006. Evolution ofrattlesnakes (Viperidae; Crotalus) in the warm deserts of western NorthAmerica shaped by Neogene vicariance and Quaternary climate change. Mol.Ecol. 15, 3353–3374.
Douglas, M.E., Douglas, M.R., Schuett, G.W., Porras, L.W., Thomason, B.L., 2007.Genealogical concordance between mitochondrial and nuclear DNAs supportsspecies recognition of the Panamint Rattlesnake (Crotalus mitchellii stephensi).Copeia 2007, 920–932.
Douglas, M.E., Douglas, M.R., Schuett, G.W., Porras, L.W., 2009. Climate change andevolution of the New World pitviper genus Agkistrodon (Viperidae). J. Biogeog.36, 1164–1180.
Estabrook, G., 2008. Fifty years of character compatibility concepts at work. J. Syst.Evol. 46, 109–129.
Estes, R., de Queiroz, K., Gauthier, J.A., 1988. Phylogenetic relationships withinSquamata. In: Estes, R., Pregill, G. (Eds.), Phylogenetic Relationships of the LizardFamilies. Stanford University Press, Stanford, California, pp. 119–281.
Evans, S.E., 1994. A new anguimorph lizard from the Jurassic and Lower Cretaceousof England. Palaeontology 37, 33–49.
Evans, S.E., 2003. At the feet of the dinosaurs: the early history and radiation oflizards. Biol. Rev. 78, 513–551.
Farris, J.S., Källersjö, M., Kluge, A.G., Bult, C., 1994. Testing significance ofcongruence. Cladistics 10, 315–319.
Frankham, R., Ballou, J.D., Briscoe, D.A., 2003. Introduction to Conservation Genetics.Cambridge University Press, U.K.
Friesen, V.L., 2000. Introns. In: Black, A.J. (Ed.), Molecular Methods in Ecology.Blackwell, Science, London, U.K, pp. 274–294.
Friesen, V.L., Congdon, B.C., Walsh, H.E., Birt, T.P., 1997. Intron variation in MarbledMurrelets detected using analyses of single-stranded conformationalpolymorphisms. Mol. Ecol. 6, 1047–1058.
Friesen, V.L., Congdon, B.C., Kidd, M.G., Birt, T.P., 1999. Polymerase chain reaction(PCR) primers for the amplification of five nuclear introns in vertebrates. Mol.Ecol. 8, 2147–2149.
Fu, Y.X., 1997. Statistical test of neutrality of mutations against population growth,hitchhiking and background selection. Genetics 147, 915–925.
García-Aguayo, A., Ceballos, G., 1994. Guìa de Campos de los Reptiles Y Anfibbios dela Costa de Jalisco. Fundación Ecológica de Cuixmala and Instituto de Biología.Universidad Nacional Autónoma de México, México D.F.
Goloboff, P., 1999. Analyzing large data sets in reasonable times: solutions forcomposite optima. Cladistics 15, 415–428.
Goloboff, P.A., Pol, D., 2002. Semi-strict supertrees. Cladistics 18, 514–525.Graham, S.W., Reeves, P.A., Burns, A.C.E., Olmstead, R.G., 2000. Microstructural
changes in noncoding chloroplast DNA: interpretation, evolution and utility ofindels and inversion in basal angiosperm phylogenetic inference. Int. J. Plant Sci.161, S3–S96.
Hedrick, P.W., Parker, K.M., Lee, R.N., 2001. Using microsatellite and MHC variationto identify species, ESUs, and MUs in the endangered Sonoran topminnow. Mol.Ecol. 10, 1399–1412.
Holycross, A.T., Douglas, M.E., 2007. Geographic isolation, genetic divergence, andecological non-exchangeability define ESUs in a threatened sky-islandrattlesnake. Biol. Conserv. 134, 142–154.
Hudson, R.R., Kreitman, M., Aguade, M., 1987. A test of neutral molecular evolutionbased on nucleotide data. Genetics 116, 153–159.

166 M.E. Douglas et al. / Molecular Phylogenetics and Evolution 55 (2010) 153–167
Huelsenbeck, J.P., Rohnquist, F., 2001. MrBayes: Bayesian inference of phylogeny.Bioinformatics 17, 754–755.
Hughes, A.R., Inouye, B.D., Johnson, M.T.J., Underwood, N., Vellend, M., 2008.Ecological consequences of genetic diversity. Ecol. Lett. 11, 609–623.
Hull, J.M., Girman, D.J., 2005. Effects of Holocene climate change on the historicaldemography of migrating sharp-shinned hawks (Accipiter striatus velox) inNorth America. Mol. Ecol. 14, 159–170.
Hunter, K.L., Betancourt, J.L., Riddle, B.R., Van Devender, T.R., Cole, K.L., Spaulding,W.G., 2001. Ploidy race distribution since the Last Glacial Maximum in theNorth American desert shrub, Larrea tridentata. Global Ecol. Biogeogr. 10, 521–533.
Hurt, C.S., 2004. Genetic divergence, population structure, and historicaldemography of endangered springsnails (Pyrgulopsis) in the Lower ColoradoRiver basin. Mol. Ecol. 13, 1173–1187.
Jaeger, J.J., Riddle, B.R., Bradford, D.F., 2005. Cryptic Neogene vicariance andQuanternary dispersal of the Red-Spotted Toad (Bufo punctatus): insights on theevolution of North American warm desert biotas. Mol. Ecol. 14, 3033–3048.
Janzen, D.H., 1988. Tropical dry forests; the most endangered major tropicalecosystem. In: Wilson, E.O. (Ed.), Biodiversity. National Academy Press,Washington, DC, pp. 130–137.
Johnson, K.P., 2004. Deletion bias in avian introns over evolutionary timescales.Mol. Biol. Evol. 21, 599–602.
Kawakita, A., Sota, T., Ascher, J., Ito, M., Tanaka, H., Kato, M., 2003. Evolution andphylogenetic utility of alignment gaps within intron sequences of three nucleargenes in Bumble Bees (Bombus). Mol. Biol. Evol. 20, 87–92.
Knowles, L.L., 2001. Did Pleistocene glaciations promote divergence? Tests ofexplicit refugial models in montane grasshoppers. Mol. Ecol. 10, 691–701.
Krause, D.W., Evans, S.E., Gao, K., 2003. First definitive record of Mesozoic lizardsfrom Madagascar. J. Vert. Paleontol. 23, 842–856.
Kumar, S., Tamura, K., Nei, M., 2004. mega3: Integrated software for molecularevolutionary genetics analysis and sequence alignment. Bioinformatics 5, 150–163.
Kumazawa, Y., 2007. Mitochondrial genomes from major lizard families suggesttheir phylogenetic relationships and ancient radiations. Gene 388, 19–26.
Kwiatkowski, M.A., Schuett, G.W., Repp, R.A., Nowak, E.M., Sullivan, B.K., 2008. Doesurbanization influence the spatial ecology of Gila Monsters in the SonoranDesert? J. Zool. 276, 350–357.
Lam, S., See, S., 2006. Exenatide—a novel incretin mimetic agent for treating type 2diabetes mellitus. Cardiol. Rev. 14, 205–211.
Lee, M.S.Y., 2009. Hidden support from unpromising data sets strongly unitessnakes with anguimorph ‘lizards’. Biochemistry 22, 1308–1316.
Lewis, P.O., 2001. A likelihood approach to estimating phylogeny from discretemorphological character data. Syst. Biol. 50, 913–925.
Li, J.W.-H., Vederas, J.C., 2009. Drug discovery and natural products: end of an era oran endless frontier. Science 325, 161–165.
MacMahon, J.A. 1997. Deserts: A National Audubon Society Nature Guide. Alfred A.Knopf, New York.
Masta, S.E., 2000. Phylogeography of the Jumping Spider Habronattus pugillis(Araneae: Salticidae): recent vicariance of sky-island populations. Evolution 54,1699–1711.
Matthee, C.A., van Vuuren, B.J., Bell, D., Robinson, T.J., 2004. A molecularsupermatrix or the rabbits and hares (Leporidae) allows for the identificationof five intercontinental exchanges during the Miocene. Syst. Biol. 53, 433–447.
McDonald, J.H., Kreitman, M., 1991. Adaptive protein evolution at the adh locus inDrosophila. Nature 352, 652–654.
McDowell, S.B., Bogert, C.M., 1954. The systematic position of Lanthanotus and theaffinities of the anguinomorphan lizards. Bull. Amer. Mus. Nat. Hist. 105, 1–142.
McNeely, J.A., 2006. Systems or species? Approaches to conservation for the 21stcentury. Integr. Zool. 2, 86–95.
Milligan, B.G., Leebens-Mack, J., Strand, A.E., 1994. Conservation genetics: beyondthe maintenance of marker diversity. Mol. Ecol. 3, 423–435.
Monsen, K.J., Blouin, M.S., 2003. Genetic structure in a montane ranid frog:restricted gene flow and nuclear-mitochondrial discordance. Mol. Ecol. 12,3275–3286.
Moore, B.R., Smith, S.A., Donoghue, M.J., 2007. Increasing data transparency andestimating phylogenetic uncertainty in supertrees: approaches usingnonparametric bootstrapping. Syst. Biol. 55, 662–676.
Morafka, D.J. 1977. A Biogeographical Analysis of the Chihuahuan Desert through itsHerpetofauna. Dr. W. Junk B.V., Publishers, The Hague, Netherlands.
Mulcahy, D.G., 2008. Phylogeography and species-boundaries of the western NorthAmerican Nightsnake (Hypsiglena torquata): revisiting the subspecies concept.Mol. Phyloget. Evol. 46, 1095–1115.
Müller, K., 2005. SeqState-primer design and sequence statistics for phylogeneticDNA data sets. Appl. Bioinform. 4, 65–69.
Müller, K., 2006. Incorporating information from length-mutational events intophylogenetic analysis. Mol. Phylogenet. Evol. 38, 667–676.
Nee, S., May, R.M., 1997. Extinction and the loss of evolutionary history. Science278, 692–694.
Nydam, R.L., 2000. A new taxon of helodermatid-like lizard from the Albian-Cenomanian of Utah. J. Vert. Paleontol. 20, 285–294.
Nydam, R.L., Cifelli, R.L., 2002. Lizards from the Lower Cretaceous (Aptian-Albian)Antlers and Cloverly formations. J. Vert. Paleontol. 23, 286–298.
Oakey, D.D., Douglas, M.E., Douglas, M.R., 2004. Small fish in a large landscape:diversification of Rhinichthys osculus (Cyprinidae) in western North America.Copeia 2004, 207–221.
Palmer, M.A., Bernhardt, E., Chornesky, E., Collins, S., Dobson, A., Duke, C., Gold, B.,Jacobson, R., Kingsland, S., Kranz, R., Mappin, M., Martinez, M.L., Micheli, F.,Morse, J., Pace, M., Pascual, M., Palumbi, S., Reichman, O.J., Simons, A.,Townsend, A., Turner, M., 2004. Ecology for a crowded planet. Science 304,1251–1252.
Philippe, H., Delsuc, F., Brinkmann, H., Lartillot, N., 2005. Phylogenomics. Ann. Rev.Ecol. Evol. Syst. 36, 541–562.
Pianka, E.R., King, D.R., 2004. Varanoid Lizards of the World. Indiana UniversityPress, Bloomington, Indiana.
Pielou, E.C., 1991. After the Ice Age. The Return of Life to Glaciated North America.University of Chicago Press, Chicago, IL.
Pollack, A., 2002. Eli Lilly in deal for the rights to a new drug for diabetes. New YorkTimes, 21 September 2002, Late Edition-Final, section C, p. 1, column 5.
Pregill, G.K., Gauthier, J.A., Greene, H.W., 1986. The evolution of helodermatidsquamates, with description of a new taxon and an overview of Varanoidea.Trans. San Diego Soc. Nat. Hist. 21, 167–202.
Ragan, M.A., 1992. Matrix representation in reconstructing phylogeneticrelationships among the eukaryotes. Biosystems 28, 47–55.
Renner, S.S., 2005. Relaxed molecular clocks for dating historic plant dispersalevents. Trends Plant Sci. 10, 550–558.
Riddle, B.R., Hafner, D.J., Alexander, L.F., Jaeger, J.R., 2000. Cryptic vicariance in thehistorical assembly of a Baja California Peninsular desert biota. Proc. Natl. Acad.Sci. USA 97, 14438–14443.
Rodgers, A.R., Harpending, H., 1992. Population growth makes waves in thedistribution of pairwise genetic differences. Mol. Biol. Evol. 9, 552–569.
Rozas, J., Sánchez-DelBarrio, J.C., Messegyer, X., Rozas, R., 2003. DNAsp, DNApolymorphism analyses by the coalescent and other methods. Bioinformatics19, 2496–2497.
Rui, J., Wang, Y., Nie, L., 2009. The complete mitochondrial DNA genome of Eremiasbrenchleyi (Reptilia: Lacertidae) and its phylogenetic position within squamatereptiles. Amphibia-Reptilia 30, 25–35.
Rutschmann, F., 2006. Molecular dating of phylogenetic trees: a brief review ofcurrent methods that estimate divergence times. Divers. Distrib. 12, 35–48.
Sanchez-Azofeifa, G.A., Quesada, M., Rodriguez, J.P., Nassar, J.M., Stoner, K.E.,Castillo, A., Garvin, T., Zent, E.L., Calvo-Alvarado, J.C., Kalacska, M.E.R., Fajardo, L.,Gamon, J.A., Cuevas-Reyes, P., 2005. Research priorities for neotropical dryforests. Biotropica 37, 477–485.
Sanderson, M.J., 2003. R8S: inferring absolute rates of molecular evolution anddivergence times in the absence of a molecular clock. Bioinformatics 19, 301–302.
Schulte II, J.A., Cartwright, E.M., 2009. Phylogenetic relationships among iguanianlizards using alternative partitioning methods and TSHZ1: a new phylogeneticmarker for reptiles. Mol. Phylogenet. Evol. 50, 391–396.
Schulte II, J.A., Macey, J.R., Papenfuss, T.J., 2006. A genetic perspective on thegeographic association among arid North American lizards of the Sceloporusmagister complex (Squamata: Iguanidae: Phyrnosomatinae). Mol. Phylogenet.Evol. 39, 873–880.
Simmons, M.P., Ochoterena, H., 2000. Gaps as characters in sequence-basedphylogenetic analyses. Syst. Biol. 49, 369–381.
Simmons, M.P., Ochoterena, H., Carr, T.G., 2001. Incorporation, relative homoplasy,and effect of gap characters in sequence-based phylogenetic analyses. Syst. Bot.50, 454–462.
Smith, C.I., Farrell, B.D., 2005a. Range expansions in the flightless longhorn cactusbeetles, Moneilema gigas and Moneilema armatum, in response to Pleistoceneclimate changes. Mol. Ecol. 14, 1025–1044.
Smith, C.I., Farrell, B.D., 2005b. Phylogeography of the longhorn cactus beetleMoneilema appressum LeConte (Coleoptera: Cerambycidae): was thedifferentiation of the Madrean sky islands driven by Pleistocene climatechanges? Mol. Ecol. 14, 3049–3065.
Smith, K.T., Bhullar, B.-A.S., Holroyd, P.A., 2008. Earliest African record of theVaranus stem-clade (Squamata: Varanidae) from the Early Oligocene of Egypt. J.Vert. Paleontol. 28, 909–913.
Spielman, D., Brooks, B.W., Frankham, R., 2004. Most species are not driven toextinction before genetic factors impact them. Proc. Natl. Acad. Sci. USA 101,15261–15264.
Stockwell, C.A., Hendry, A.P., Kinnison, M.T., 2003. Contemporary evolution meetsconservation biology. Trends Ecol. Evol. 18, 95–101.
Stoner, K.E., Sanchez-Azofeifa, G.A., 2009. Ecology and regeneration of tropical dryforests in the Americas: implications for management. Forest Ecol. Manag. 258,903–906.
Sullivan, B.K., Kwiatkowski, M.A., Schuett, G.W., 2004. Translocation of urban Gilamonsters: a problematic conservation tool. Biol. Conserv. 117, 235–242.
Swofford, D.L., 2001. PAUP*, Phylogenetic Analysis Using Parsimony (and othermethods), version 4.04b. Sinauer Publishers, Sunderland, Massachusetts.
Tajima, F., 1989. The effects of change in population size on DNA polymorphism.Genetics 123, 597–601.
Tajima, F., 1993. Simple methods for testing the molecular evolutionary clockhypothesis. Genetics 135, 599–607.
Timmerman, B.N., Wächter, G., Valcic, S., Hutchinson, B., Casler, C., Henzel, J., Ram,S., Currim, F., Manak, R., Franzblau, S., Maiese, W., Galinis, D., Suarez, E.,Fortunato, R., Saavedra, E., Bye, R., Mata, R., Montenegro, G., 1999. The LatinAmerican ICBG: The First Five Years. Pharm. Biol. 37, 35–54.
Townsend, T.M., Larson, A., Louis, E., Macey, R.J., 2004. Molecular phylogenetics ofSquamata: the position of snakes, Amphisbaenians, and Dibamids, and the rootof the Squamate tree. Syst. Biol. 53, 735–757.

M.E. Douglas et al. / Molecular Phylogenetics and Evolution 55 (2010) 153–167 167
Townsend, T.M., Alegre, E.R., Kelley, S.Y., Weins, J.J., Reeder, T.W., 2008. Rapiddevelopment of multiple nuclear loci for phylogenetic analysis using genomicresources: an example from squamate reptiles. Mol. Phylogenet. Evol. 47, 129–142.
Van Devender, T.R., 2002. Deep history of immigration in the Sonoran Desert region.In: Tellman, B. (Ed.), Invasive Exotic Species in the Sonoran Desert Region. TheUniversity of Arizona Press, Tucson, Arizona, pp. 5–24.
Van Devender, T.R., Spaulding, W.G., 1979. Development of vegetation and climatein the southwestern United States. Science 204, 701–710.
Vidal, N., Hedges, S.B., 2004. Molecular evidence for a terrestrial origin of snakes.Proc. R. Soc. Lond. B (Suppl. 27), S226–S229.
Vidal, N., Hedges, S.B., 2005. The phylogeny of squamate reptiles (lizards, snakes,and amphisbaenians) inferred from nine nuclear protein-coding genes. C. R.Biol. 328, 1000–1008.
Vidal, N., Hedges, S.B., 2009. The molecular evolutionary tree of lizards, snakes, andamphisbaenians. C. R. Biol. 332, 129–139.
Vijenhoek, R.C., Douglas, M.E., Meffe, G.K., 1985. Conservation genetics ofendangered fish populations in Arizona. Science 229, 400–402.
Welch, J.J., Bromham, L., 2005. Molecular dating when rates vary. Trends Ecol. Evol.20, 320–327.
Weng, C., Jackson, S.T., 1999. Late glacial and Holocene vegetation history andpalaeoclimate on the Kaibab Plateau, Arizona. Palaeog. Palaeoc. Palaeoe. 153,179–201.
Williams-Linera, G., Lorea, F., 2009. Tree species diversity driven by environmentaland anthropogenic factors in tropical dry forest fragments in central Veracruz,México. Biodivers. Conserv. 18, 3269–3293.
Willis, K.J., Birks, H.J.B., 2006. What is natural? The need for a long-term perspectivein biodiversity conservation. Science 314, 1261–1265.
Wilson, E.O., 1992. The Diversity of Life. Harvard University Press, Cambridge MA.Yatkola, D.A., 1976. Fossil Heloderma (Reptilia: Helodermatidae). Occ. Pap. Mus. Nat.
Hist. Univ. Kansas 51, 1–14.Zhou, K., Hongdan, L., Demin, H., Bayev, A.M., Feng, J., 2006. The complete
mitochondrial genome of Gekko gecko (Reptilia: Gekkonidae) and support forthe monophyly of Sauria including Amphisbaenia. Mol. Phylogenet. Evol. 40,887–892.