ConocoPhillips is an international, integrated ...
52
Growing Value 2011 SUMMARY ANNUAL REPORT
Transcript of ConocoPhillips is an international, integrated ...

Growing Value2011 Summary annual report
www.conocophillips.com
ConocoPhillips is an international, integrated
energy company with interests around the world.
Headquartered in Houston, the company had
operations in more than 35 countries, approximately
29,800 employees, $153 billion of assets and
$245 billion of revenues as of Dec. 31, 2011.
90414conD1R1.indd 1 2/28/12 11:05 PM
1 Letter to Shareholders
5 Financial and Operating Highlights
6 Repositioning
Our Commitments
8 Enhancing Financial Performance
10 Empowering Our People
12 Operating Responsibly
14 Advancing Technology
Operational Review
16 Exploration and Production
26 Refining and Marketing
32 Midstream and Chemicals
36 Financial Summary
46 Board of Directors
48 Company Officers
49 Shareholder Information
Certain disclosures in this Summary Annual Report may be considered “forward-looking” statements. These are made pursuant to “safe harbor” provisions of the Private Securities Litigation Reform Act of 1995. The “Cautionary Statement” in Management’s Discussion and Analysis in Appendix A of ConocoPhillips’ 2012 Proxy Statement should be read in conjunction with such statements.
“ConocoPhillips,” “the company,” “we,” “us” and “our” are used interchangeably in this report to refer to the businesses of ConocoPhillips and its consolidated subsidiaries.
Definition of resources: ConocoPhillips uses the term “resources” in this document. The company estimates its total resources based on a system developed by the Society of Petroleum Engineers that classifies recoverable hydrocarbons into six categories based on their status at the time of reporting. Three (proved, probable and possible reserves) are deemed commercial, and three others are deemed noncommercial or contingent. The company’s resource estimate encompasses volumes associated with all six categories.
Shareholder Information
Annual Meeting
ConocoPhillips’ annual meeting of stockholders will be held:
Wednesday, May 9, 2012 Omni Houston Hotel Westside 13210 Katy Freeway, Houston, Texas
Notice of the meeting and proxy materials are being sent to all shareholders.
Direct Stock Purchase and Dividend Reinvestment Plan
ConocoPhillips’ Investor Services Program is a direct stock purchase and dividend reinvestment plan that offers shareholders a convenient way to buy additional shares and reinvest their common stock dividends. Purchases of company stock through direct cash payment are commission-free. Please call the BNY Mellon Shareowner Services Material Fulfillment Center to request an enrollment package:
Toll-free number: 866-353-7849
You may also enroll online at www.bnymellon.com/shareowner/equityaccess. Registered shareholders can access important investor communications online and sign up to receive future shareholder materials electronically by going to www.bnymellon.com/shareowner/equityaccess and following the enrollment instructions.
Principal and Registered Offices
600 N. Dairy Ashford Houston, TX 77079
2711 Centerville Road Wilmington, DE 19808
Stock Transfer Agent and Registrar
Computershare 480 Washington Blvd. Jersey City, NJ 07310-1900 www.bnymellon.com/shareowner/
equityaccess
Information Requests
For information about dividends and certificates, or to request a change of address form, shareholders may contact:
Computershare P.O. Box 358015 Pittsburgh, PA 15252-8015 Toll-free number: 800-356-0066 Outside the U.S.: 201-680-6578 TDD for hearing impaired: 800-231-5469 TDD outside the U.S.: 201-680-6610 www.bnymellon.com/shareowner/
equityaccess
Personnel in the following offices also can answer investors’ questions about the company:
Institutional Investors:
ConocoPhillips Investor Relations 375 Park Avenue, Suite 3702 New York, NY 10152 212-207-1996 [email protected]
Individual Investors:
ConocoPhillips Shareholder Relations 600 N. Dairy Ashford, ML3074 Houston, TX 77079 281-293-6800 [email protected]
Compliance and Ethics
For guidance, or to express concerns or ask questions about compliance and ethics issues, call ConocoPhillips’ Ethics Helpline toll-free: 877-327-2272, available 24 hours a day, seven days a week. The ethics office also may be contacted via email at [email protected], the Internet at http://conocophillips.ethicspoint.com or by writing:
Attn: Corporate Ethics Office ConocoPhillips 600 N. Dairy Ashford, ML3170 Houston, TX 77079
Copies of Form 10-K, Proxy Statement and Summary Annual Report
Copies of the Annual Report on Form 10-K and the Proxy Statement, as filed with the U.S. Securities and Exchange Commission, are available free by making a request on the company’s website, calling 918-661-3700 or writing:
ConocoPhillips – 2011 Form 10-K B-41 Adams Building 411 South Keeler Ave. Bartlesville, OK 74004
Additional copies of this Summary Annual Report may be obtained by calling 918-661-3700 or writing:
ConocoPhillips 2011 Summary Annual Report B-41 Adams Building
411 South Keeler Ave. Bartlesville, OK 74004
Internet Website: www.conocophillips.com
The site includes resources of interest to investors, including news releases and presentations to securities analysts; copies of ConocoPhillips’ annual reports and proxy statements; reports to the U.S. Securities and Exchange Commission; and data on ConocoPhillips’ health, safety and environmental performance. Other websites with information on topics included in this summary annual report include: www.cpchem.com
www.dcpmidstream.com
49
90414conD1R1.indd 2 2/22/12 7:21 PM

ConocoPhillips is progressing
through a three-year strategic
plan to reposition the company.
We are focused on optimizing
our portfolio, enhancing returns,
strengthening our financial
flexibility and increasing
shareholder distributions.
These actions began in 2010 and will
extend through 2012. Consistent with this
plan, we are implementing a spinoff of
our downstream businesses into a new
company, Phillips 66, with ConocoPhillips
becoming an independent exploration and
production company. Both will be leaders
in their respective industries.
In 2011, we increased our quarterly
dividend rate by 20 percent, repurchased
$11.1 billion of our shares, reduced debt
by $1 billion and generated $4.8 billion
from divestments that included the
remainder of our LUKOIL holdings.
Our strategic initiatives were
accompanied by financial and operational
success during 2011. We operated well
and captured market opportunities,
resulting in a 38 percent increase in
adjusted earnings to $12.2 billion. This
improvement came despite the absence
of $1.3 billion of equity earnings from
LUKOIL, approximately $2 billion in
higher taxes and 8 percent lower
production volumes. Adjusted earnings
per share of $8.76 benefited from our
significant share repurchases and were
48 percent higher than in 2010.
Letter to Shareholders
James J. MulvaChairman, President and Chief Executive Officer
1
90414conD2R1.indd 1 2/22/12 7:28 PM

During 2011, we expanded our ongoing
asset divestiture program to target
sales of $15 billion to $20 billion from
2010 through 2012, including $5 billion to
$10 billion in sales planned in 2012. We
are well positioned to meet our three-year
divestment target.
Returns EnhancementWe continue to improve our capital
efficiency through focused investment
in the highest-returning opportunities in
our asset portfolio. These include higher-
margin North American upstream liquids
development projects as we shift our
investments away from conventional
natural gas while retaining the ability to
increase such investments when market
conditions improve.
Our E&P business continues performing
strongly in key areas, positioning the
company for ongoing success. We acquired
more than 500,000 acres in strategic,
liquids-rich North American shale trends,
and added to our positions in the deepwater
Gulf of Mexico and several frontier
exploration opportunities around the world.
Although production fell in 2011, due
largely to dispositions and temporarily
suspended operations in Libya, key
strategic assets delivered strong
production growth. Our production from
U.S. shale trends increased 67 percent,
while expansion projects in Canada
resulted in continued rampup of oil sands
production. Our global liquefied natural
gas (LNG) business also grew, with peak
plateau production achieved by Qatargas 3
and the Australia Pacific LNG project
sanctioned for development.
Quarterly Dividends (Cents per share)
2011
14
2009
7
2010
10
2631
20112009 2010
25
2011
66
2009
50
2010
551
2
3
0
10
20
30
40
50
60
70
80
0
5
10
15
20
25
30
35
40
0
5
10
15
20
2011
23
2009
17
2010
204
0
5
10
15
20
25
30
2011
2.2
2009
2.7
2010
2.7
8.763.28
20112009 2010
5.92
2011
13
2009
1
2010
5
6
7
0
3
6
9
12
15
2011
12.2
2009
4.9
2010
8.85
0
3
6
9
12
15
0
2
4
6
8
10
0.0
0.5
1.0
1.5
2.0
2.5
3.0
2011
84
2009
82
2010
838
0
20
40
60
80
100
2011
16
2009
8
2010
129
0
5
10
15
20
2011
XX
2009
248
2010
49810
0
200
400
600
800
1000
EPROCE
Letter to Shareholders
We delivered these results in a global
market still recovering from the recent
financial crisis. While liquids prices
increased during 2011, North American
natural gas prices remained impacted by
weak demand and rising supply. Surplus
global refining capacity continues to limit
refining margins. Given these constraints,
we continued investing in projects that
will create long-term shareholder value.
For example, we directed more than
70 percent of 2011 operating cash flow
into our capital program, an aggressive
reinvestment rate relative to our peers that
reflects our strategy of pursuing organic
growth. We are targeting high-return
upstream opportunities, spending
$12.7 billion, or 91 percent, of our 2011
capital program in our Exploration and
Production (E&P) business. This is an
increase of $3.4 billion over the prior year,
and spending is planned to grow to
$14 billion in 2012. We are limiting
investments in North American natural
gas production, which represented
26 percent of 2011 production.
Portfolio OptimizationWe are optimizing our portfolio through
disposition of nonstrategic assets. These
dispositions generated $10.7 billion in
proceeds over the last two years, with the
sale of our LUKOIL interests generating
an additional $9.5 billion.
In the past year, we have sold a
number of low-margin North American
conventional natural gas assets, disposed
of nonstrategic pipelines and, consistent
with plans to reduce refining capacity, sold
our Wilhelmshaven Refinery, and have
idled and intend to sell the Trainer Refinery.
“ ConocoPhillips is progressing through a three-year strategic plan to reposition the company. We are focused on optimizing our portfolio, enhancing returns, strengthening our financial flexibility and increasing shareholder distributions.”
Debt-to-Capital Ratio (Percent)
2011
14
2009
7
2010
10
2631
20112009 2010
25
2011
66
2009
50
2010
551
2
3
0
10
20
30
40
50
60
70
80
0
5
10
15
20
25
30
35
40
0
5
10
15
20
2011
23
2009
17
2010
204
0
5
10
15
20
25
30
2011
2.2
2009
2.7
2010
2.7
8.763.28
20112009 2010
5.92
2011
13
2009
1
2010
5
6
7
0
3
6
9
12
15
2011
12.2
2009
4.9
2010
8.85
0
3
6
9
12
15
0
2
4
6
8
10
0.0
0.5
1.0
1.5
2.0
2.5
3.0
2011
84
2009
82
2010
838
0
20
40
60
80
100
2011
16
2009
8
2010
129
0
5
10
15
20
2011
XX
2009
248
2010
49810
0
200
400
600
800
1000
EPROCE
2
90414conD2R1.indd 2 2/22/12 7:28 PM

E&P has replaced more than 130 percent
of production over the past three years
with organic proved reserve additions
at competitive finding and development
costs. Combined with our share
repurchase program and adjusting for
Libya, we grew reserves per share by
12 percent in 2011 and increased
production per share by 5 percent.
Following ConocoPhillips’ transition to an
independent exploration and production
company, we expect over the medium
term to achieve 3 to 4 percent average
annual organic production growth, as
well as further growth in reserves,
through development of legacy assets
and approved projects. Such growth
will further enhance our production and
reserves per share metrics.
In our Refining and Marketing (R&M)
business, we have rationalized low-margin
refining assets, reducing our processing
capacity by more than 400,000 barrels
per day since 2009, with further
reductions planned to strengthen future
returns.
In 2011, we met planned refinery
utilization rates and improved clean
product yields. The Wood River coker
and refinery expansion project was
completed, raising heavy crude oil
processing capacity while increasing
clean product yield by 5 percent at the
refinery.
Our chemicals and midstream joint ventures
delivered strong financial performance in
2011 in growing markets, with significant
future investments planned.
These initiatives, along with market
improvements, increased our return
on capital employed from 7 percent in
2009 to 14 percent during 2011. During
the same period, cash returns on capital
employed increased from 17 percent to
23 percent, while our greater focus on
higher-margin production contributed to a
49 percent increase in income per barrel
of oil equivalent (BOE) in 2011. We have
targeted growing our average margin by
approximately $5 per BOE over the next
five years.
Financial FlexibilityWe have used our significant cash flow
generation over the past two years to
retire $6 billion in debt, ending 2011 with
debt of $22.6 billion and a debt-to-capital
ratio of 26 percent. We also held
$5.8 billion in cash and $0.6 billion in
short-term investments at the end of
2011, providing us the flexibility to adapt
to market opportunities.
Shareholder Distribution GrowthIn 2011, we raised our quarterly dividend
rate by 20 percent, paying out $3.6 billion.
This represented the ninth consecutive
annual increase since the company’s
inception in 2002, yielding a compounded
annual dividend growth rate of 14 percent
over this period and 32 percent since the
beginning of 2010.
We also repurchased 155 million of our
shares for $11.1 billion during the year,
consistent with plans to improve
per-share performance. This brought total
repurchases to 15 percent of the shares
outstanding at the inception of the
$15 billion repurchase program in 2010,
which has been funded through proceeds
from our asset divestments and LUKOIL
disposition.
For 2012, we plan share repurchases of
up to an additional $10 billion, funded
primarily from asset divestments.
Additionally, the creation of Phillips 66
is expected to result in a 15 percent
increase in the overall dividend rate.
Corporate CitizenshipDuring 2011, we updated stakeholders
on progress toward meeting our nine
sustainable development commitments.
To ensure true sustainability, we have
committed to return value to shareholders
while supplying the energy that drives
the global economy, reducing our
environmental impact and contributing
to society’s well-being. During 2011,
we continued pursuing our safety and
environmental performance improvement
objectives through ongoing worker
and process safety programs, as well
as projects to reduce greenhouse gas
emissions, decrease water consumption
and increase recycling.
Return on Capital Employed (Percent)
Cash Return on Capital Employed (Percent)
2011
14
2009
7
2010
10
2631
20112009 2010
25
2011
66
2009
50
2010
551
2
3
0
10
20
30
40
50
60
70
80
0
5
10
15
20
25
30
35
40
0
5
10
15
20
2011
23
2009
17
2010
204
0
5
10
15
20
25
30
2011
2.2
2009
2.7
2010
2.7
8.763.28
20112009 2010
5.92
2011
13
2009
1
2010
5
6
7
0
3
6
9
12
15
2011
12.2
2009
4.9
2010
8.85
0
3
6
9
12
15
0
2
4
6
8
10
0.0
0.5
1.0
1.5
2.0
2.5
3.0
2011
84
2009
82
2010
838
0
20
40
60
80
100
2011
16
2009
8
2010
129
0
5
10
15
20
2011
XX
2009
248
2010
49810
0
200
400
600
800
1000
EPROCE
2011
14
2009
7
2010
10
2631
20112009 2010
25
2011
66
2009
50
2010
551
2
3
0
10
20
30
40
50
60
70
80
0
5
10
15
20
25
30
35
40
0
5
10
15
20
2011
23
2009
17
2010
204
0
5
10
15
20
25
30
2011
2.2
2009
2.7
2010
2.7
8.763.28
20112009 2010
5.92
2011
13
2009
1
2010
5
6
7
0
3
6
9
12
15
2011
12.2
2009
4.9
2010
8.85
0
3
6
9
12
15
0
2
4
6
8
10
0.0
0.5
1.0
1.5
2.0
2.5
3.0
2011
84
2009
82
2010
838
0
20
40
60
80
100
2011
16
2009
8
2010
129
0
5
10
15
20
2011
XX
2009
248
2010
49810
0
200
400
600
800
1000
EPROCE
We believe the industry’s rapid progress
in developing unconventional resources,
like shale gas, shale oil and the oil sands,
can substantially improve long-term
energy supply security. Consequently,
we are committed to ongoing research
and development to enhance their
recovery and use while reducing their
environmental footprint.
3
90414conD2R1.indd 3 2/22/12 7:28 PM

Considering the challenges faced by
our industry in meeting future energy
demand, ConocoPhillips continues urging
the United States and other countries to
ensure that regulation and taxation of our
industry are fair and efficient. Otherwise,
unwarranted regulatory obstacles may
delay or halt vital development projects
while punitive taxes could impede
our ability to continue making capital
investments on the scale needed.
We still call for U.S. enactment of a
comprehensive, balanced and sustainable
national energy policy that encourages
development of all energy sources,
including oil and natural gas. Further, we
urge governments to expand access to
energy resources that are currently held
off-limits to development.
To share our views, during the year
we launched a national initiative –
There’s Power in CooperationTM – that
promotes natural gas as a key long-term
energy resource that can create jobs
and economic growth while lowering
greenhouse gas emissions.
We also recognize that creating innovative
solutions for our industry’s challenges
requires a skilled workforce, and we
provide comprehensive educational and
training programs to our employees.
Further, we seek to strengthen the
communities in which we operate through
charitable contributions to organizations
that provide vital services. These include
research grants and other commitments
to universities and other educational
institutions.
RepositioningIn July, consistent with our strategic
plan, ConocoPhillips announced plans
to separate into two leading energy
companies. We have formed a new
company, Phillips 66, which will
comprise our downstream businesses
and be distributed to shareholders as an
independent, publicly traded company.
We expect to complete the repositioning
in the second quarter of 2012. The new
Phillips 66 will offer a unique approach
to downstream integration, comprising
segment-leading refining and marketing,
midstream and chemicals businesses.
ConocoPhillips will continue as the
industry’s largest and most diverse global
pure-play exploration and production
company.
The repositioning will help grow the value
of both companies for our shareholders
by unlocking the potential of their assets
and employees. We believe this is the
best way to succeed and ensure our
competitiveness over the long term.
We deeply appreciate the ongoing
commitment and support of our
shareholders and employees as we
embark on this new chapter in the long
and successful history of our company.
Letter to Shareholders
“ The repositioning will help grow the value of both companies for our shareholders by unlocking the potential of their assets and employees. We believe this is the best way to succeed and ensure our competitiveness over the long term.”
Adjusted Earnings ($ Billion)
2011
14
2009
7
2010
10
2631
20112009 2010
25
2011
66
2009
50
2010
551
2
3
0
10
20
30
40
50
60
70
80
0
5
10
15
20
25
30
35
40
0
5
10
15
20
2011
23
2009
17
2010
204
0
5
10
15
20
25
30
2011
2.2
2009
2.7
2010
2.7
8.763.28
20112009 2010
5.92
2011
13
2009
1
2010
5
6
7
0
3
6
9
12
15
2011
12.2
2009
4.9
2010
8.85
0
3
6
9
12
15
0
2
4
6
8
10
0.0
0.5
1.0
1.5
2.0
2.5
3.0
2011
84
2009
82
2010
838
0
20
40
60
80
100
2011
16
2009
8
2010
129
0
5
10
15
20
2011
XX
2009
248
2010
49810
0
200
400
600
800
1000
EPROCE
James J. MulvaChairman, President and Chief Executive Officer
Adjusted Earnings per Share ($)
2011
14
2009
7
2010
10
2631
20112009 2010
25
2011
66
2009
50
2010
551
2
3
0
10
20
30
40
50
60
70
80
0
5
10
15
20
25
30
35
40
0
5
10
15
20
2011
23
2009
17
2010
204
0
5
10
15
20
25
30
2011
2.2
2009
2.7
2010
2.7
8.763.28
20112009 2010
5.92
2011
13
2009
1
2010
5
6
7
0
3
6
9
12
15
2011
12.2
2009
4.9
2010
8.85
0
3
6
9
12
15
0
2
4
6
8
10
0.0
0.5
1.0
1.5
2.0
2.5
3.0
2011
84
2009
82
2010
838
0
20
40
60
80
100
2011
16
2009
8
2010
129
0
5
10
15
20
2011
XX
2009
248
2010
49810
0
200
400
600
800
1000
EPROCE
4
90414conD2R1.indd 4 2/22/12 7:28 PM
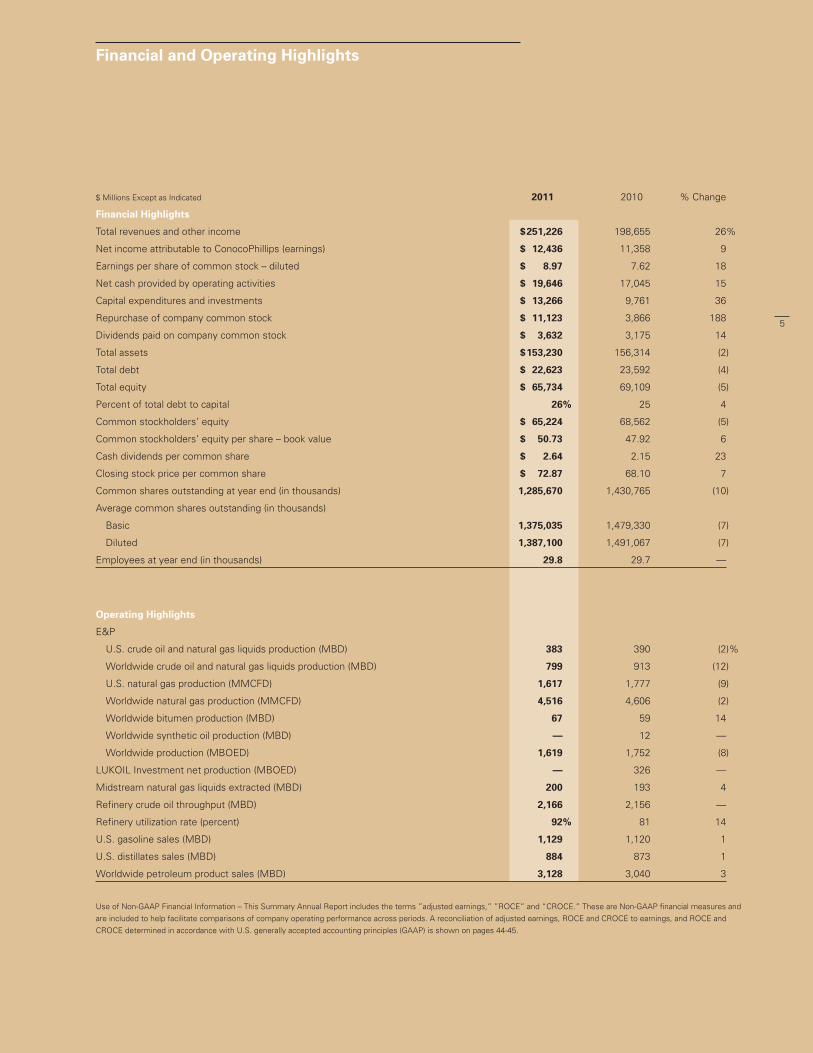
Financial and Operating Highlights
$ Millions Except as Indicated 2011 2010 % Change
Financial Highlights
Total revenues and other income $ 251,226 198,655 26%
Net income attributable to ConocoPhillips (earnings) $ 12,436 11,358 9
Earnings per share of common stock – diluted $ 8.97 7.62 18
Net cash provided by operating activities $ 19,646 17,045 15
Capital expenditures and investments $ 13,266 9,761 36
Repurchase of company common stock $ 11,123 3,866 188
Dividends paid on company common stock $ 3,632 3,175 14
Total assets $ 153,230 156,314 (2)
Total debt $ 22,623 23,592 (4)
Total equity $ 65,734 69,109 (5)
Percent of total debt to capital 26% 25 4
Common stockholders’ equity $ 65,224 68,562 (5)
Common stockholders’ equity per share – book value $ 50.73 47.92 6
Cash dividends per common share $ 2.64 2.15 23
Closing stock price per common share $ 72.87 68.10 7
Common shares outstanding at year end (in thousands) 1,285,670 1,430,765 (10)
Average common shares outstanding (in thousands)
Basic 1,375,035 1,479,330 (7)
Diluted 1,387,100 1,491,067 (7)
Employees at year end (in thousands) 29.8 29.7 —
Operating Highlights
E&P
U.S. crude oil and natural gas liquids production (MBD) 383 390 (2)%
Worldwide crude oil and natural gas liquids production (MBD) 799 913 (12)
U.S. natural gas production (MMCFD) 1,617 1,777 (9)
Worldwide natural gas production (MMCFD) 4,516 4,606 (2)
Worldwide bitumen production (MBD) 67 59 14
Worldwide synthetic oil production (MBD) — 12 —
Worldwide production (MBOED) 1,619 1,752 (8)
LUKOIL Investment net production (MBOED) — 326 —
Midstream natural gas liquids extracted (MBD) 200 193 4
Refinery crude oil throughput (MBD) 2,166 2,156 —
Refinery utilization rate (percent) 92% 81 14
U.S. gasoline sales (MBD) 1,129 1,120 1
U.S. distillates sales (MBD) 884 873 1
Worldwide petroleum product sales (MBD) 3,128 3,040 3
Use of Non-GAAP Financial Information – This Summary Annual Report includes the terms ”adjusted earnings,” ”ROCE” and “CROCE.” These are Non-GAAP financial measures and
are included to help facilitate comparisons of company operating performance across periods. A reconciliation of adjusted earnings, ROCE and CROCE to earnings, and ROCE and
CROCE determined in accordance with U.S. generally accepted accounting principles (GAAP) is shown on pages 44-45.
5
90414conD2R1.indd 5 2/22/12 7:28 PM
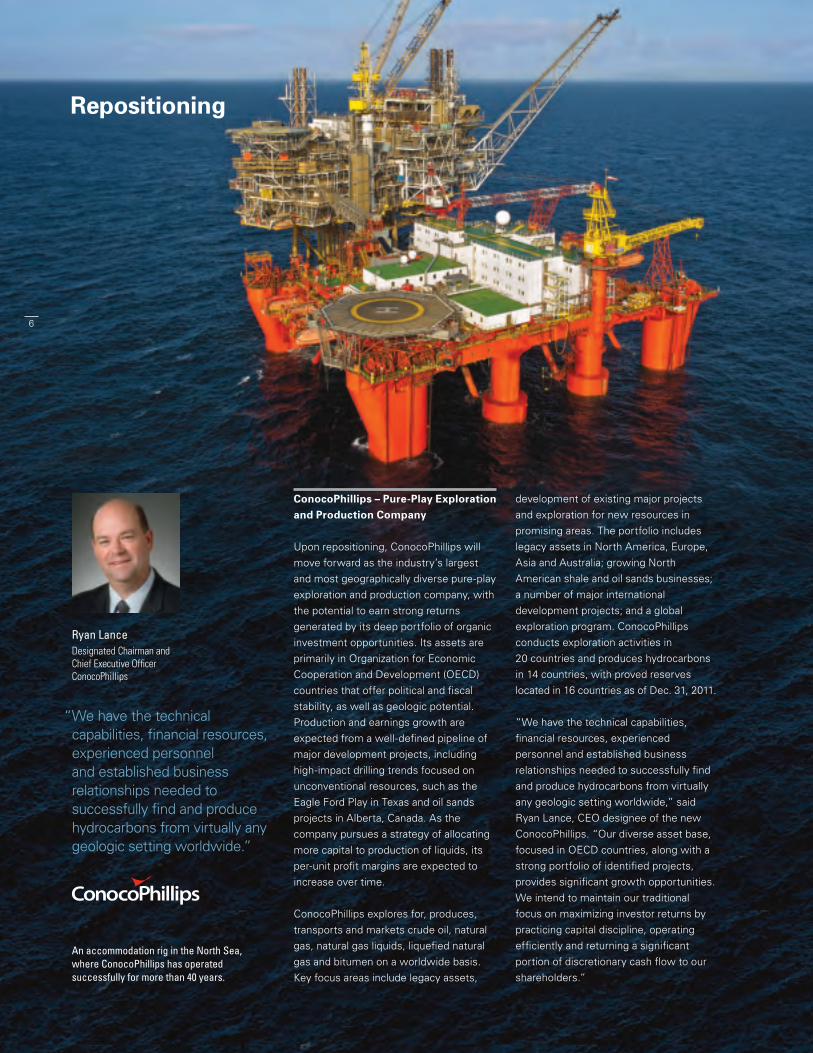
Repositioning
ConocoPhillips – Pure-Play Exploration and Production Company
Upon repositioning, ConocoPhillips will
move forward as the industry’s largest
and most geographically diverse pure-play
exploration and production company, with
the potential to earn strong returns
generated by its deep portfolio of organic
investment opportunities. Its assets are
primarily in Organization for Economic
Cooperation and Development (OECD)
countries that offer political and fiscal
stability, as well as geologic potential.
Production and earnings growth are
expected from a well-defined pipeline of
major development projects, including
high-impact drilling trends focused on
unconventional resources, such as the
Eagle Ford Play in Texas and oil sands
projects in Alberta, Canada. As the
company pursues a strategy of allocating
more capital to production of liquids, its
per-unit profit margins are expected to
increase over time.
ConocoPhillips explores for, produces,
transports and markets crude oil, natural
gas, natural gas liquids, liquefied natural
gas and bitumen on a worldwide basis.
Key focus areas include legacy assets,
development of existing major projects
and exploration for new resources in
promising areas. The portfolio includes
legacy assets in North America, Europe,
Asia and Australia; growing North
American shale and oil sands businesses;
a number of major international
development projects; and a global
exploration program. ConocoPhillips
conducts exploration activities in
20 countries and produces hydrocarbons
in 14 countries, with proved reserves
located in 16 countries as of Dec. 31, 2011.
“We have the technical capabilities,
financial resources, experienced
personnel and established business
relationships needed to successfully find
and produce hydrocarbons from virtually
any geologic setting worldwide,” said
Ryan Lance, CEO designee of the new
ConocoPhillips. “Our diverse asset base,
focused in OECD countries, along with a
strong portfolio of identified projects,
provides significant growth opportunities.
We intend to maintain our traditional
focus on maximizing investor returns by
practicing capital discipline, operating
efficiently and returning a significant
portion of discretionary cash flow to our
shareholders.”
Ryan LanceDesignated Chairman and Chief Executive Officer ConocoPhillips
“ We have the technical capabilities, financial resources, experienced personnel and established business relationships needed to successfully find and produce hydrocarbons from virtually any geologic setting worldwide.”
An accommodation rig in the North Sea, where ConocoPhillips has operated successfully for more than 40 years.
6
90414conD2R1.indd 6 2/22/12 7:28 PM

Phillips 66 – Integrated Downstream Company
Phillips 66 will enjoy a unique position as
an integrated downstream company with
segment-leading refining and marketing,
midstream and chemicals businesses.
Operations will encompass crude oil
refining, petroleum products marketing,
transportation, power generation, natural
gas gathering and processing, and
petrochemicals manufacturing and
marketing. Launched with the PSX stock
ticker symbol, Phillips 66 will be
financially flexible and is expected to
generate substantial cash flow that will be
used to fund growth opportunities as well
as shareholder distributions.
Phillips 66 will be one of the world’s leading
petroleum refiners, with crude oil
processing capacity of 1.8 million barrels
per day in the United States and 2.2 million
barrels per day globally. The company will
operate 11 domestic refineries and own or
hold interests in four international refineries.
Additionally, Phillips 66 will have a major
marketing network focused on wholesale
trade in the United States, and both retail
and wholesale operations internationally.
The company’s extensive transportation
system will provide the ability to move
and store products through a combination
of pipelines, terminals, marine vessels,
rail cars and trucks.
The new company’s midstream business
will be conducted primarily through an
investment in DCP Midstream, LLC, one of
the largest natural gas gatherers and
processors in the United States.
Manufacturing and marketing of chemicals
products will be conducted through an
investment in Chevron Phillips Chemical
Company LLC, one of the world’s top
producers of olefins and polyolefins, and a
leading supplier of aromatics, styrenics,
specialty chemicals and plastic piping.
“Phillips 66 is uniquely positioned through
the diversity of our businesses to leverage
opportunity throughout the downstream
energy value chain,” said Greg Garland,
CEO designee of Phillips 66. “We expect to
have the asset base, operating expertise,
financial capability and management focus
to deliver superior shareholder returns over
the years ahead.”
Greg GarlandDesignated Chairman and Chief Executive Officer Phillips 66
“ Phillips 66 is uniquely positioned through the diversity of our businesses to leverage opportunity throughout the downstream energy value chain.”
The repositioning of ConocoPhillips is subject to market conditions, customary regulatory approvals, the receipt of an affirmative ruling from the U.S. Internal Revenue Service and final board approval.
Opened in 1949, the Billings Refinery in Montana supplies fuels to a nine-state region in the western United States.
7
90414conD2R1.indd 7 2/29/12 4:13 PM
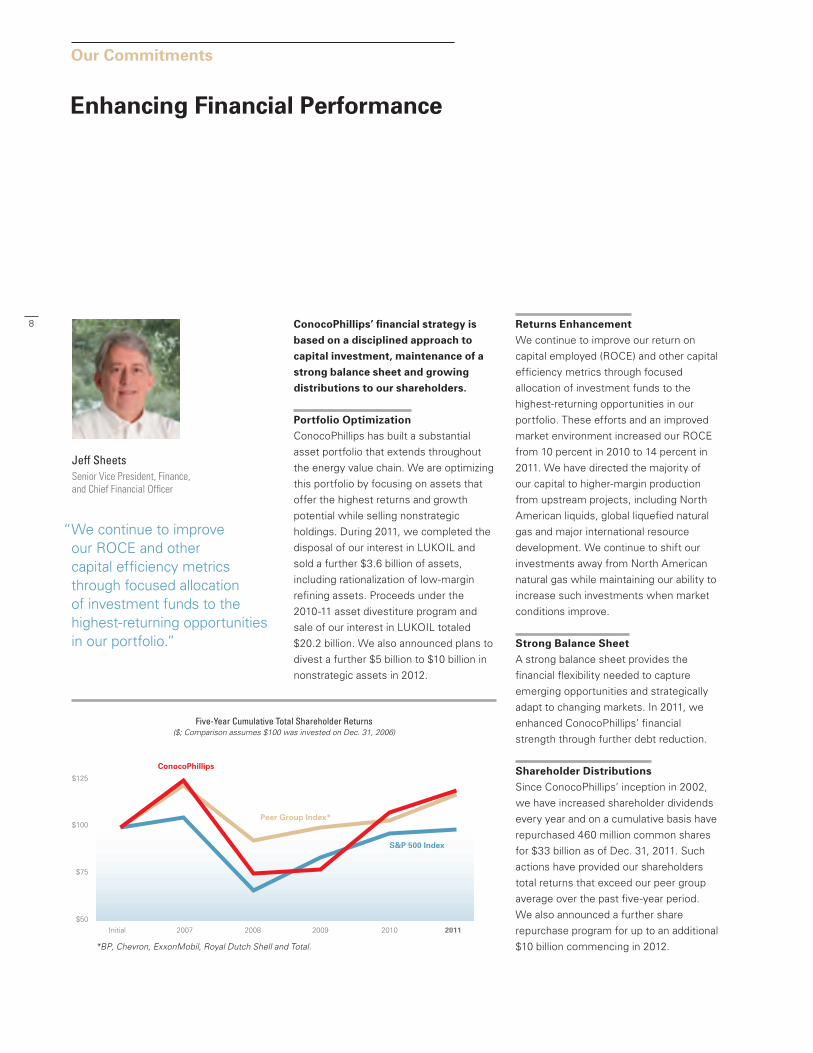
Enhancing Financial Performance
Our Commitments
ConocoPhillips’ financial strategy is based on a disciplined approach to capital investment, maintenance of a strong balance sheet and growing distributions to our shareholders.
Portfolio OptimizationConocoPhillips has built a substantial
asset portfolio that extends throughout
the energy value chain. We are optimizing
this portfolio by focusing on assets that
offer the highest returns and growth
potential while selling nonstrategic
holdings. During 2011, we completed the
disposal of our interest in LUKOIL and
sold a further $3.6 billion of assets,
including rationalization of low-margin
refining assets. Proceeds under the
2010-11 asset divestiture program and
sale of our interest in LUKOIL totaled
$20.2 billion. We also announced plans to
divest a further $5 billion to $10 billion in
nonstrategic assets in 2012.
Returns EnhancementWe continue to improve our return on
capital employed (ROCE) and other capital
efficiency metrics through focused
allocation of investment funds to the
highest-returning opportunities in our
portfolio. These efforts and an improved
market environment increased our ROCE
from 10 percent in 2010 to 14 percent in
2011. We have directed the majority of
our capital to higher-margin production
from upstream projects, including North
American liquids, global liquefied natural
gas and major international resource
development. We continue to shift our
investments away from North American
natural gas while maintaining our ability to
increase such investments when market
conditions improve.
Strong Balance SheetA strong balance sheet provides the
financial flexibility needed to capture
emerging opportunities and strategically
adapt to changing markets. In 2011, we
enhanced ConocoPhillips’ financial
strength through further debt reduction.
Shareholder DistributionsSince ConocoPhillips’ inception in 2002,
we have increased shareholder dividends
every year and on a cumulative basis have
repurchased 460 million common shares
for $33 billion as of Dec. 31, 2011. Such
actions have provided our shareholders
total returns that exceed our peer group
average over the past five-year period.
We also announced a further share
repurchase program for up to an additional
$10 billion commencing in 2012.
$50
$75
Initial 2007 2008 2009 2010 2011
$100
$125
ConocoPhillips
S&P 500 Index
Peer Group Index*
50
75
100
125
150
Five-Year Cumulative Total Shareholder Returns ($; Comparison assumes $100 was invested on Dec. 31, 2006)
Jeff SheetsSenior Vice President, Finance, and Chief Financial Officer
“ We continue to improve our ROCE and other capital efficiency metrics through focused allocation of investment funds to the highest-returning opportunities in our portfolio.”
*BP, Chevron, ExxonMobil, Royal Dutch Shell and Total.
8
90414conD2R1.indd 8 2/22/12 7:28 PM

A natural gas processing plant in the San Juan Basin, where ConocoPhillips is the leading acreage holder and producer.
9
90414conD2R1.indd 9 2/22/12 7:28 PM

A process technician working at the Ekofisk Field in the North Sea.
10
90414conD2R1.indd 10 2/22/12 7:28 PM

Empowering Our People
Our Commitments
Leadership and ManagementWe have highly experienced leaders
who have benefited from numerous
developmental roles in a variety of
businesses around the world. Our leaders
provide the vision and strategy for our
continuing business success. We have
comprehensive supervisory and
leadership programs that equip these
individuals with the capability to elevate
their organizations, recognizing their key
roles in building ConocoPhillips’ future.
Recruitment and TalentTo ensure we attract a world-class
workforce, we recruit from universities
worldwide and advertise job openings on
our website and more than 500 external
employment sites, as well as utilize
targeted searches to fill critical roles. This
leveraged recruiting model has enabled
us to broaden the talent pool from which
we recruit, reduce the time required to fill
open positions, and limit the use and cost
of recruitment agencies. Our performance
management process rewards top talent
through performance differentiation and
aligned compensation.
At ConocoPhillips, we attribute our success primarily to the dedication and capabilities of our people around the world. Our SPIRIT values, coupled with the talent and drive of our employees, offer ConocoPhillips a distinct competitive advantage. We strive to provide our employees with the best place to work and develop their careers.
Diversity and EngagementWe recognize that solving complex issues
and creating innovative solutions for our
industry’s challenges require diverse
perspectives and an ability to work in
multidisciplined teams. ConocoPhillips is
committed to maintaining a workforce
that encompasses a wide variety of
cultural experiences, backgrounds and
perspectives. We provide an environment
based on inclusion and engagement that
values the contributions and uniqueness
of every individual.
Learning and DevelopmentWe maintain a culture in which all our
employees learn and apply new skills
each year. Learning opportunities include
a broad range of training activities, work
experiences, networking and personal
feedback. A global learning management
system facilitates efficient delivery of
training and wide coverage of the
educational opportunities available.
Dedicated talent management teams
actively evaluate employees’ skills and
development needs to identify
assignments that leverage existing
strengths and develop new capabilities.
Gene BatchelderSenior Vice President and Chief Administrative Officer
“ We strive to provide our employees with the best place to work and develop their careers.”
11
90414conD2R1.indd 11 2/28/12 10:07 PM
Sustainable DevelopmentFor ConocoPhillips, sustainable
development involves conducting our
business to promote economic growth,
a healthy environment and vibrant
communities, now and into the future.
We believe this business approach
enables us to deliver long-term value to all
our stakeholders. We have detailed action
plans to address commitments covering
the economic, environmental and social
performance of our company. These
include particular focus on water,
biodiversity and climate change, as well
as social and stakeholder issues.
Our Goal Is ZeroAfter five years of annual improvement,
we maintained our safety performance in
2011, finishing with a combined employee
and contractor total recordable incident
rate of 0.31. ConocoPhillips experienced
10 hydrocarbon spills greater than
100 barrels and a process safety incident
rate of 0.06, both equaling our best-ever
performance in 2010. To work toward
attaining our goal of zero injuries, illnesses
or incidents, we provide strong leadership
to secure the involvement and support of
all employees.
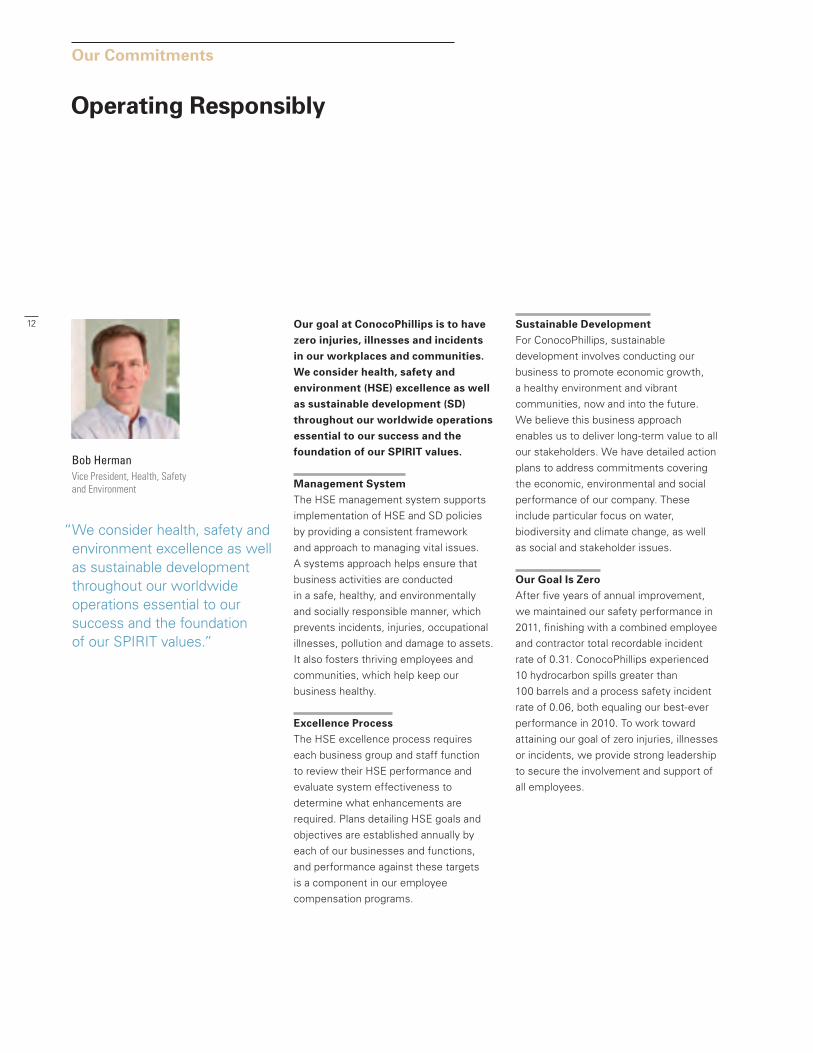
Our goal at ConocoPhillips is to have zero injuries, illnesses and incidents in our workplaces and communities. We consider health, safety and environment (HSE) excellence as well as sustainable development (SD) throughout our worldwide operations essential to our success and the foundation of our SPIRIT values.
Management SystemThe HSE management system supports
implementation of HSE and SD policies
by providing a consistent framework
and approach to managing vital issues.
A systems approach helps ensure that
business activities are conducted
in a safe, healthy, and environmentally
and socially responsible manner, which
prevents incidents, injuries, occupational
illnesses, pollution and damage to assets.
It also fosters thriving employees and
communities, which help keep our
business healthy.
Excellence ProcessThe HSE excellence process requires
each business group and staff function
to review their HSE performance and
evaluate system effectiveness to
determine what enhancements are
required. Plans detailing HSE goals and
objectives are established annually by
each of our businesses and functions,
and performance against these targets
is a component in our employee
compensation programs.
Operating Responsibly
Our Commitments
Bob HermanVice President, Health, Safety and Environment
“ We consider health, safety and environment excellence as well as sustainable development throughout our worldwide operations essential to our success and the foundation of our SPIRIT values.”
12
90414conD2R1.indd 12 2/28/12 10:07 PM

Practicing sound environmental stewardship is a key objective of all ConocoPhillips operations.
13
90414conD2R1.indd 13 2/28/12 10:12 PM

State-of-the-art seismic data acquisition and imaging techniques provide enhanced reservoir analysis.
14
90414conD2R1.indd 14 2/22/12 7:29 PM

Advancing Technology
Our Commitments
ConocoPhillips is a technology leader in the energy industry. We invest in technology in order to find more efficient, economical and environmentally sound ways to produce oil and natural gas and transform them into the energy required to power the modern world. With a deep portfolio of proprietary technologies and an exceptional collection of scientists and engineers, we are well positioned to rank among the energy industry leaders for decades to come.
Heavy OilTechnological advancements are vital to
development of ConocoPhillips’ vast oil
sands position in Canada. During 2011,
we continued developing and
implementing technologies to reduce our
environmental footprint, improve facility
uptime, drive down costs, increase
resource recovery and optimize refinery
yields. These technologies include
enhancements to the steam-assisted
gravity drainage (SAGD) recovery
process, alternatives to SAGD, more
efficient methods for generating steam
and improved artificial lift approaches.
Unconventional ReservoirsConocoPhillips’ rapid production growth
from unconventional reservoirs has been
underpinned by a strong and expanding
technology program. This program covers
the full spectrum of exploration and
production activities, from efforts focused
on identifying the best plays and sweet
spots within plays to improved drilling and
completion techniques, as well as
advanced production optimization
methods. State-of-the-art capabilities
include computed axial tomography (CAT)
scan core imaging techniques and
advanced petrophysical analysis
workflows. We are also developing
simulation tools that better predict the
performance of hydraulically fractured
reservoirs and installing fiber-optic
systems to capture crucial downhole data.
Improved RecoverySubsurface technology advances are
essential to generating value in the
exploration and production business.
ConocoPhillips continues to innovate with
consistent near real-time integration of
geological, 4-D seismic, engineering and
production data into reservoir modeling
and surveillance programs that improve
decision making throughout asset life.
We are also improving reservoir drainage
efficiency by applying high-impact
techniques, such as advanced chemical
flooding, microbial stimulation, carbon
dioxide injection, and controlled-salinity
injection of steam or water.
Sustainability TechnologiesConocoPhillips is committed to promoting
environmental stewardship throughout
our global operations. In 2011, research
and development in sustainability
technologies led to breakthroughs in the
environmental and alternative energy
areas, including carbon dioxide capture,
air emissions modeling, and cleanup of
organic and metal contaminants from
wastewater. Novel methods to produce
hydrogen with a lower carbon footprint
were studied, and new materials that
vastly improve the performance of solid
oxide fuel cells and organic photovoltaics
were developed.
Merl LindstromInterim Senior Vice President, Technology
“ With a deep portfolio of proprietary technologies and an exceptional collection of scientists and engineers, we are well positioned to rank among the energy industry leaders for decades to come.”
15
90414conD2R1.indd 15 2/22/12 7:29 PM

Exploration and Production
Operational Review
The Britannia Field, one of the largest natural gas and condensate fields in the North Sea.
16
90414conD2R1.indd 16 2/22/12 7:29 PM

E&P Highlights
• Adjusted earnings increase 38 percent to $9.3 billion
• Ongoing execution of portfolio optimization plans
• Margin enhancement through focused capital investment
• Growing production and acreage in liquids-rich North American shale plays
• Exploiting legacy positions and major developments in North America, Europe and Asia Pacific
• Sanctioned Australia Pacific LNG project
• Canadian oil sands production continues to ramp up
• Exploration activities discovering high-value resources worldwide
• Continuing improvements in safety
E&P Financial and Operating Results 2011 2010 2009Earnings ($MM) $ 8,242 9,198 3,604Adjusted earnings ($MM) $ 9,289 6,754 4,131Proved reserves (BBOE) 8.4 8.3 8.4Worldwide production (MBOED) 1,619 1,752 1,854Crude oil and NGL production (MBD) 799 913 968Natural gas production (MMCFD) 4,516 4,606 4,877Realized crude oil and NGL price ($/BBL) $ 97.22 72.77 55.63Realized natural gas price ($/MCF) $ 5.34 4.98 4.37Income per BOE ($/BOE) $ 15.72 10.56 6.16ROCE (percent) 16 % 12 8
17
90414conD2R1.indd 17 2/28/12 10:07 PM

2011 was another strong year for Exploration and Production (E&P), with continuing execution of ConocoPhillips’ strategic plan. We advanced several major projects that bring significant high-value growth to our business, while further exploiting our existing producing assets for maximum returns. Our exploration prospects expanded as we added new opportunities in both conventional and unconventional resources. We also made further progress on portfolio optimization with the divestment of nonstrategic assets as we position ConocoPhillips to be a leading pure-play exploration and production company in 2012.
The year’s accomplishments included
development sanctioning of the Australia
Pacific LNG (APLNG) project and
continued progress on multiple projects in
the North Sea, Asia Pacific, Canadian oil
sands and North American shale plays.
Exploration activities focused on adding
acreage in strategic shale regions and
frontier regions worldwide, and advancing
our current portfolio of liquids-rich
shale plays.
We also remain committed to operational
excellence and recorded a 20 percent
improvement in employee safety
performance in 2011.
“E&P delivered another year of strong
financial performance while making
significant progress on our strategic
objectives,” said Ryan Lance, senior vice
president, E&P – International. “We
benefited from focused capital
investment in the most profitable
opportunities; ongoing divestment of
nonstrategic assets; and our employees’
strong commitment to safe, reliable and
efficient operations. Major developments
in our key North American oil sands and
shale plays continue to grow, as do our
global liquefied natural gas (LNG)
operations and exploration footprint. We
are well positioned to continue delivering
differential value for our shareholders.”
Optimizing the PortfolioE&P continues to optimize its asset base
through disposition of nonstrategic assets
that can be sold at attractive prices to
other companies. In 2011, our divestiture
program focused primarily on selective
conventional natural gas fields in North
America, while work continues to market
and sell other nonstrategic assets in
2012. Our portfolio largely comprises
assets in politically stable countries, with
approximately 80 percent of our reserves
located in member nations of the
Organization for Economic Cooperation
and Development. This unique global
positioning among our peers provides
E&P with the long-term ability to capture
upside potential while we invest in
emerging opportunities around the world.
E&P worldwide production decreased
8 percent in 2011 to 1.62 million barrels of
oil equivalent per day (BOED), from
1.75 million BOED in 2010. The decrease
was mainly due to the impact of civil
unrest in Libya, where production was
suspended from March to late November;
natural decline, primarily in North
America, Europe and Russia; and asset
dispositions. Increased production from
the Qatargas 3 project, as well as a
rampup of production from oil sands
developments in Canada and shale plays
in the United States, partly offset this
decrease.
Enhancing MarginsCapital program funding during 2011 was
$12.7 billion, including $2.3 billion for
exploration activity. This is expected to
grow to $14 billion in 2012, including
$2.2 billion for worldwide exploration, as
an improving market environment yields
opportunities for organic growth.
Exploration and Production
Ryan LanceSenior Vice President, Exploration & Production – International
Return on Capital Employed (Percent)
2011
14
2009
7
2010
10
2631
20112009 2010
39
2011
66
2009
50
2010
551
2
3
0
10
20
30
40
50
60
70
80
0
10
20
30
40
50
0
5
10
15
20
2011
23
2009
17
2010
204
0
5
10
15
20
25
30
2011
2.2
2009
2.7
2010
2.7
8.763.28
20112009 2010
5.92
2011
16
2009
8
2010
12
6
7
0
3
6
9
12
15
2011
12.2
2009
4.9
2010
8.85
0
5
10
15
20
0
2
4
6
8
10
0.0
0.5
1.0
1.5
2.0
2.5
3.0
2011
84
2009
82
2010
838
0
20
40
60
80
100
2011
16
2009
8
2010
129
0
5
10
15
20
2011
XX
2009
248
2010
49810
0
200
400
600
800
1000
EPROC
“ We benefited from focused capital investment in the most profitable opportunities; ongoing divestment of nonstrategic assets; and our employees’ strong commitment to safe, reliable and efficient operations.”
18
90414conD2R1.indd 18 2/22/12 7:29 PM

“We continue to direct our capital
spending to those investments that
deliver the highest returns in the
prevailing market environment,” said Greg
Garland, senior vice president, E&P –
Americas. “These include our liquids-rich
shale plays in North America and
conventional oil and gas resources in our
international operations. Our long-term
goal remains to convert our 43 billion
barrels of oil equivalent (BOE) resource
base into reserves and production at low
finding and development costs while
delivering strong margins.”
As a consequence of these shifts in
E&P’s asset portfolio and improved
market conditions, income per BOE
improved from $10.56 in 2010 to
$15.72 in 2011 as higher-margin liquids
and LNG became a greater portion of the
company’s portfolio. This improvement
is expected to continue in 2012 and
beyond as production from new projects
comes on line.
Exploiting North American Legacy AssetsConocoPhillips’ extensive legacy assets
across North America continually benefit
from the application of new technology
and fresh geologic knowledge. This
provides opportunities to enhance existing
resource recovery and identify potential
new sources of hydrocarbons. Our legacy
assets typically provide profitable
production, generating strong cash flows.
In the Permian Basin in West Texas,
ConocoPhillips is optimizing production
from its 1.1 million net acre position,
with 2011 average net production of
approximately 48,000 BOED. There were
103 wells drilled in 2011, with plans to
increase drilling activity in 2012. With
undeveloped resources of approximately
950 million BOE, the basin is expected to
remain a profitable, liquids-rich producing
asset for years to come.
In the San Juan Basin, one of the largest
U.S. natural gas producing areas,
ConocoPhillips is the leading acreage
holder and largest producer, with 2011
average net production of 179,000 BOED.
The basin holds considerable remaining
potential with 1.7 billion BOE of
discovered resources.
In western Canada, investments are
focused on the Deep Basin and central
Alberta, where utilization of shale gas
production methods is opening
substantial opportunities in proven
trends, such as the light-oil Cardium
Field. During the year, ConocoPhillips
A well site in the San Juan Basin, New Mexico, with typical natural gas compressor and tank battery facilities.
U.S. (Lower 48)
26%
Europe 17%
Africa4%
Alaska14%
Canada16%
E&P Production
E&P Reserves
Russia2%
Asia Pacific/Middle East21%
Canada 22%
Alaska22%
Other Areas 1%
Africa5%
Asia Pacific/ Middle East17%
Europe10%
U.S. (Lower 48)
23%
U.S. (Lower 48)
26%
Europe 17%
Africa4%
Alaska14%
Canada16%
E&P Production
E&P Reserves
Russia2%
Asia Pacific/Middle East21%
Canada 22%
Alaska22%
Other Areas 1%
Africa5%
Asia Pacific/ Middle East17%
Europe10%
U.S. (Lower 48)
23%
2011 Year-end Reserves
2011 Production
19
90414conD2R1.indd 19 2/22/12 7:30 PM

drilled 119 operated wells in these areas,
with 131 wells scheduled for 2012. Net
production from western Canada averaged
approximately 193,000 BOED during 2011.
In Alaska, to enhance production from
existing North Slope fields, the company
is utilizing new 3-D and 4-D seismic
surveys to identify development drilling
opportunities. State-of-the-art coiled-
tubing drilling and multilateral-sidetrack
wells are being used to access oil volumes
that would otherwise not be developed.
2011 average net production from Alaska
was 225,000 BOED.
In 2011, our joint venture, Denali – The
Alaska Gas Pipeline, announced
discontinuation of work on the Alaska Gas
Pipeline project to transport North Slope
gas to North American markets.
ConocoPhillips remains committed to
searching for commercially viable
alternatives to monetize the North Slope’s
large existing gas resources. The
company also continues to develop
technology to exploit significant viscous
and heavy oil resources in the Kuparuk
and Prudhoe Bay fields.
Progressing Major International ProjectsSeveral major development projects in
progress around the world are expected
to contribute to future production growth
at favorable development costs while
maintaining or creating legacy asset
positions.
Exploration and Production
Development is well under way at the ConocoPhillips-operated Jasmine Field in the U.K. North Sea, with peak production expected in 2013.
20
90414conD2R1.indd 20 2/22/12 7:30 PM

In the U.K. North Sea, development of the
Jasmine Field is well under way, with
peak net production of 34,000 BOED
expected in 2013. 2011 also saw project
sanction of Clair Ridge, the second phase
of the Clair Field development, with first
oil anticipated in 2016. In Norway’s
Greater Ekofisk Area, two new major
projects, Ekofisk South and Eldfisk II, are
progressing toward startup in 2013 and
2014, respectively. Peak net production
from these two projects, anticipated in
2018, would add 54,000 BOED of
production to the Greater Ekofisk Area.
In Malaysia, we expect significant
production from projects currently under
development. The deepwater Gumusut
Field off the coast of Sabah is anticipated
to begin oil production in late 2012,
followed by startups of natural gas
production at the Kebabangan Field and
oil production at the Malikai and Siakap
North-Petai fields.
Development continues on the giant
Kashagan Field in the Caspian Sea. The
Phase I project is expected to begin
commercial production in 2013, and
additional expansion phases are under
evaluation. In China, development of the
Bohai Bay offshore project was delayed
due to suspension of operations in
September following two oil seeps that
occurred in June. Updated operating plans
have been developed and submitted to
the Chinese authorities, with our objective
being to protect the reservoir, ensure safe
and environmentally responsible operation
of the field, and prevent future
hydrocarbon releases.
Developing Canada’s World-Class Oil Sands ConocoPhillips has built one of the
industry’s leading acreage positions in the
world-class oil sands in Canada, which
are strategically located near the U.S.
Midwestern market.
“We have several projects under
development that will rapidly grow and
convert the enormous resources in our
portfolio into long-lived, high-return
production that generates significant cash
flow,” Garland said. “E&P is deploying
enhanced steam-assisted gravity drainage
technology and other advancements to
improve recovery of these resources. We
are achieving some of the best steam-to-
oil ratios in the industry, giving us operating
costs and an environmental footprint that
are competitive with those of our peers.”
Assets include the FCCL business
venture with Cenovus, as well as the
ConocoPhillips-operated Surmont project
and undeveloped lands in the Thornbury,
Clyden and Saleski areas. In 2011, total
net production of bitumen from these
assets was 67,000 BOED, up 14 percent
compared to the prior year, with new
production coming on line from Christina
Lake Phase C. Additional Foster Creek
and Christina Lake phases are expected
to start up in 2012 and 2014, and
subsequent planned phases would lead
to total net production exceeding
200,000 BOED within 10 years. At
Surmont, Phase II construction continues,
A field operator at the Surmont development, a rapidly growing ConocoPhillips-operated project in the Canadian oil sands.
Greg GarlandSenior Vice President, Exploration & Production – Americas
“ We have several projects under development that will rapidly grow and convert the enormous resources in our portfolio.”
21
90414conD2R1.indd 21 2/22/12 7:30 PM
with planned startup in 2015, resulting in
that area’s net production increasing to
approximately 50,000 BOED by 2016.
Building a Global LNG BusinessConocoPhillips is developing a long-life
global LNG business through major
projects located in strategic geographic
centers around the world.
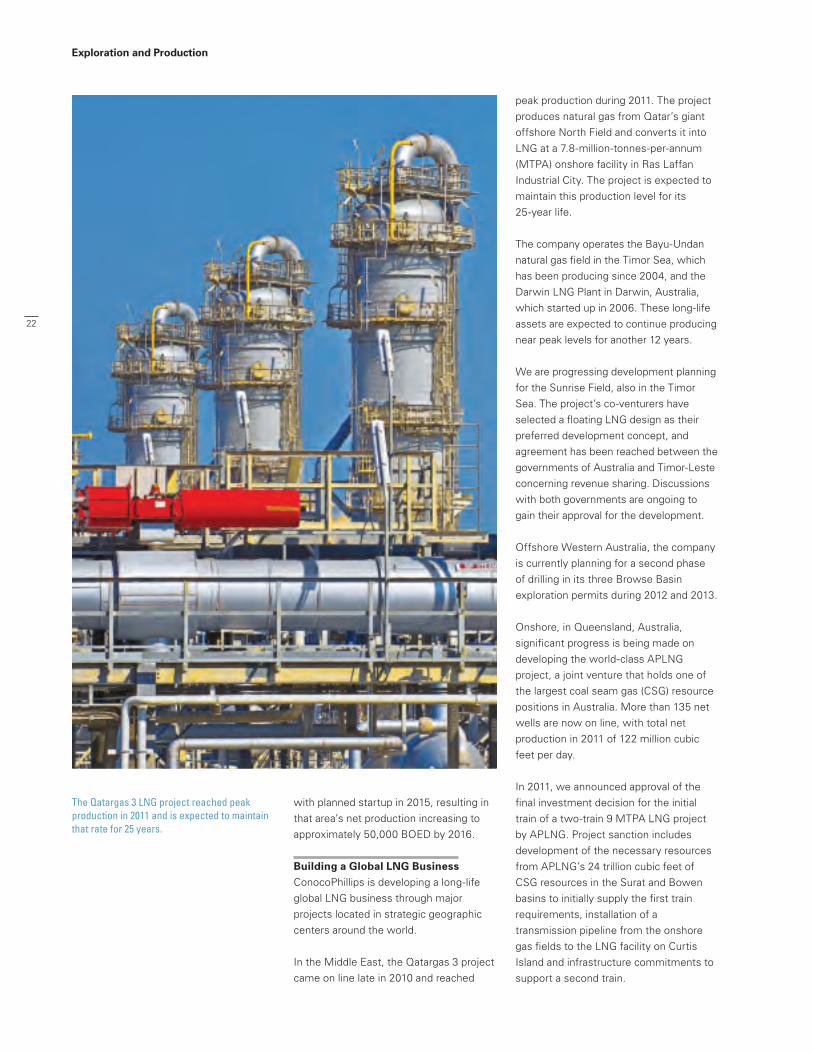
In the Middle East, the Qatargas 3 project
came on line late in 2010 and reached
peak production during 2011. The project
produces natural gas from Qatar’s giant
offshore North Field and converts it into
LNG at a 7.8-million-tonnes-per-annum
(MTPA) onshore facility in Ras Laffan
Industrial City. The project is expected to
maintain this production level for its
25-year life.
The company operates the Bayu-Undan
natural gas field in the Timor Sea, which
has been producing since 2004, and the
Darwin LNG Plant in Darwin, Australia,
which started up in 2006. These long-life
assets are expected to continue producing
near peak levels for another 12 years.
We are progressing development planning
for the Sunrise Field, also in the Timor
Sea. The project’s co-venturers have
selected a floating LNG design as their
preferred development concept, and
agreement has been reached between the
governments of Australia and Timor-Leste
concerning revenue sharing. Discussions
with both governments are ongoing to
gain their approval for the development.
Offshore Western Australia, the company
is currently planning for a second phase
of drilling in its three Browse Basin
exploration permits during 2012 and 2013.
Onshore, in Queensland, Australia,
significant progress is being made on
developing the world-class APLNG
project, a joint venture that holds one of
the largest coal seam gas (CSG) resource
positions in Australia. More than 135 net
wells are now on line, with total net
production in 2011 of 122 million cubic
feet per day.
In 2011, we announced approval of the
final investment decision for the initial
train of a two-train 9 MTPA LNG project
by APLNG. Project sanction includes
development of the necessary resources
from APLNG’s 24 trillion cubic feet of
CSG resources in the Surat and Bowen
basins to initially supply the first train
requirements, installation of a
transmission pipeline from the onshore
gas fields to the LNG facility on Curtis
Island and infrastructure commitments to
support a second train.
Exploration and Production
The Qatargas 3 LNG project reached peak production in 2011 and is expected to maintain that rate for 25 years.
22
90414conD2R1.indd 22 2/23/12 2:31 PM

to 2035. The joint venture partners also
agreed to terms for Sinopec to raise
its ownership interest in APLNG to
25 percent. An agreement was also
signed in November with Kansai Electric
Power Company for the supply of
approximately 1 MTPA of LNG
commencing with the startup of the
second train. These two agreements
complete the marketing of the second
train, with sanctioning of train construction
expected during the first half of 2012.
The estimated gross capital cost of the
two-train project is $20 billion. Following
startup of the second train, the project
has anticipated peak gross production of
270,000-280,000 BOED and an expected
life span of at least 30 years.
“All of our LNG projects are competitive,
offering long life spans and low decline
rates,” Lance said. “They are located in
fiscally stable regions that are becoming
the LNG supply capitals of the world, with
excellent access to the largest energy
markets across the globe.”
Growing Our North American Shale FootprintNorth American natural gas is now in
abundance as production from shale has
become technically and economically
viable. North America is believed to hold
nearly a century’s supply of natural gas,
and shale is also proving an increasingly
important source of oil and natural gas
liquids in many areas.
“Growing our North American shale
production is a key element of E&P’s
strategy,” Garland said. “Having entered
several of the most promising shale plays
“With project sanction, ConocoPhillips
builds on its position as the world’s
largest producer of CSG,” Lance said.
“The final investment decision reinforces
our commitment to deliver safe and
reliable energy globally, and this world-
class project is well placed to help meet
growing demand for LNG in Asia.”
LNG exports from the first train are
scheduled to start in 2015 under a binding
sales agreement for 4.3 MTPA with China
Petroleum & Chemical Corporation
(Sinopec). Sanction of the project also
satisfied the final condition for Sinopec’s
subscription to a 15 percent interest in the
APLNG joint venture, with ConocoPhillips’
and Origin Energy’s ownership reducing
to 42.5 percent each.
In January 2012, APLNG announced an
amendment to its existing LNG sales
agreement with Sinopec for the supply of
an additional 3.3 MTPA of LNG through
Gladstone in central Queensland, the neighboring town to APLNG’s LNG facility on Australia’s Pacific coast.
23
90414conD2R1.indd 23 2/22/12 7:30 PM

early, we succeeded in building large
acreage positions while lease access
costs were relatively low. In today’s
market environment of low North
American natural gas prices, we are
focusing our capital investments on the
more liquids-rich shale plays, since higher
liquids prices enable us to generate more
profitable returns.”
In 2011, we added approximately
500,000 net acres in rapidly developing
shale areas, including the Wolfcamp and
Avalon plays in Texas and New Mexico, the
Niobrara Play in Colorado, and the Duvernay
and Canol plays in Canada. These add to our
significant holdings in the proven Montney
and Muskwa plays in western Canada and
our major producing U.S. plays in Eagle
Ford, Permian, Bakken and North Barnett.
In the liquids-rich Eagle Ford Play in South
Texas, we have assembled an attractive
core leasehold of 223,000 net acres in the
trend’s fairway and accelerated our
delineation activities during 2011. At year
end, 16 drilling rigs were running, with net
production exceeding 50,000 BOED. Net
production is forecast at 69,000 BOED in
2012, with long-term net peak production
targeted at 140,000 BOED by 2017.
In the Bakken Play in North Dakota and
Montana, ConocoPhillips holds 558,000 net
acres, with 2011 average net production of
17,000 BOED and six drilling rigs running at
year end. Development plans for 2012
include an increase in the rig count to 10.
We also hold 68,000 net acres in the
North Barnett shale play in northeastern
Texas. 2011 average net production was
13,000 BOED, with 32 new wells added
during the year. In 2012, we anticipate
running two drilling rigs and adding
24 new wells.
Exploration and Production
One of 16 drilling rigs operated by ConocoPhillips during 2011 in the Eagle Ford shale play in South Texas.
24
90414conD2R1.indd 24 2/22/12 7:30 PM

The company also resumed exploration
drilling activities in the Gulf of Mexico
following the lifting of the moratorium
imposed after the Macondo oil spill in 2010.
“We are looking forward to an exciting
2012 as we continue upgrading our
conventional portfolio, drilling our top
opportunities, building on our shale
position in North America and
internationally, and appraising our
exploration successes in Australia and
the Gulf of Mexico,” Archibald said.
Positioned to Deliver Value“ConocoPhillips’ E&P business has a
geographically diverse portfolio of world-
class assets, outstanding employees,
leading-edge technologies, and successful
exploration and business development
strategies,” Lance said. “We look forward
to capturing the opportunities that our
unique portfolio and business approach
afford us as an independent exploration
and production company in 2012, which
we believe will enable us to generate
superior value for our shareholders.”
Exploring to WinExploration plays a key role in enabling
ConocoPhillips to enhance its asset
portfolio and achieve long-term organic
growth. Since 2008, we have placed
more emphasis on capturing and testing
high-impact exploration opportunities,
both conventional and unconventional,
that have the potential to deliver
significant resources and value to the
company. In support of this objective,
Exploration has taken a more focused and
disciplined approach to high-grading its
portfolio while selectively adding high-
quality opportunities.
In 2011, we added significant acreage in
shale plays around the world. In addition
to our North American activities, we
executed an agreement in Australia to
farm-in to 11 million acres with 75 percent
working interest in an exploration shale
play. We also increased exploration and
delineation drilling activity in existing
shale plays.
“Our exploration program added
significant resources through the drill bit
for the third consecutive year,” said Larry
Archibald, senior vice president,
Exploration and Business Development.
“This was largely due to continuing
rampup of activity in North American
shale plays. We also high-graded the
exploration portfolio through ongoing
acreage acquisitions in a number of high-
impact growth opportunities and existing
and emerging shale plays.”
ConocoPhillips continues to pursue
frontier exploration opportunities around
the world. In December, we signed a
production sharing contract (PSC) for
Angola deepwater blocks 36 and 37 in
an emerging subsalt play trend. We
acquired promising lease positions in
Arctic Greenland and the Norwegian
Barents Sea.
In Bangladesh, we secured a PSC for two
deepwater blocks in the Bay of Bengal.
ConocoPhillips also added to its position
in the deepwater Gulf of Mexico,
submitting winning bids on 75 blocks in
the Paleogene Play in December’s
western Gulf of Mexico lease sale.
Seismic exploration activity continues across numerous rapidly growing, liquids-rich shale plays in the United States and Canada.
Larry ArchibaldSenior Vice President, Exploration and Business Development
“ Our exploration program added significant resources through the drill bit for the third consecutive year.”
25
90414conD2R1.indd 25 2/22/12 7:30 PM

Refining and Marketing
Operational Review
The Wood River Refinery in Illinois, which now has the capability to process up to 220,000 barrels per day of heavy crude oil.
26
90414conD2R1.indd 26 2/22/12 7:30 PM
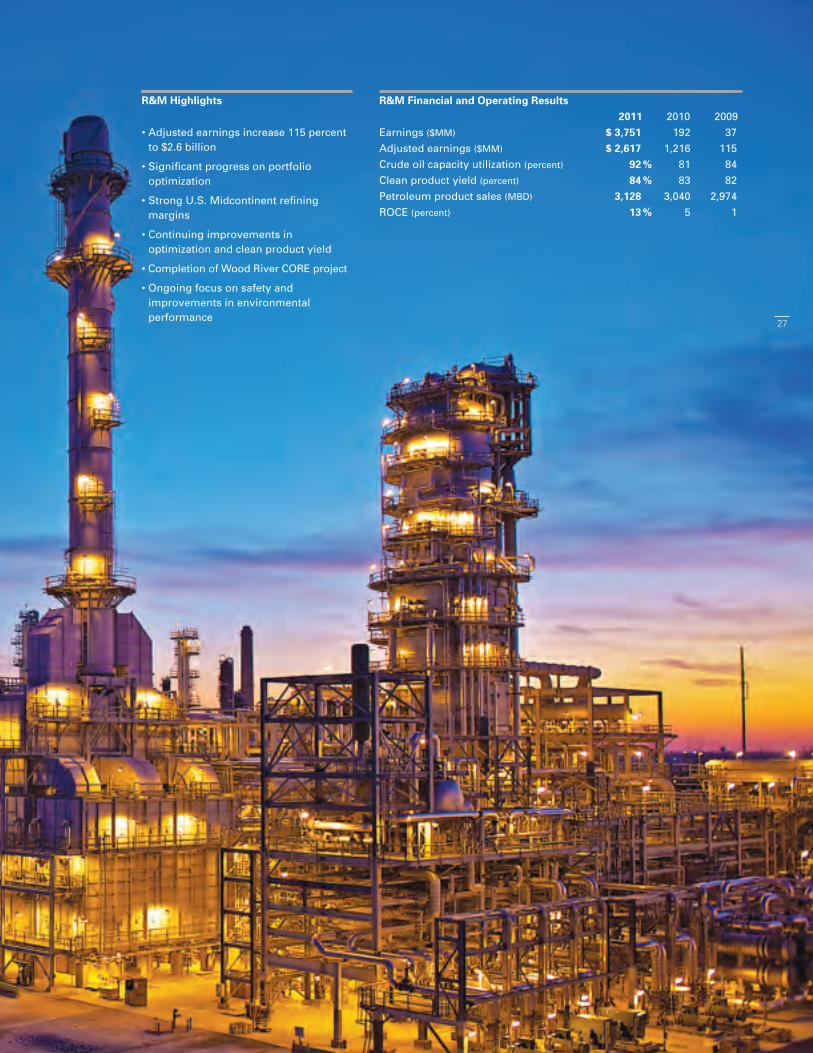
R&M Financial and Operating Results 2011 2010 2009Earnings ($MM) $ 3,751 192 37Adjusted earnings ($MM) $ 2,617 1,216 115Crude oil capacity utilization (percent) 92 % 81 84Clean product yield (percent) 84 % 83 82Petroleum product sales (MBD) 3,128 3,040 2,974ROCE (percent) 13 % 5 1
R&M Highlights
• Adjusted earnings increase 115 percent to $2.6 billion
• Significant progress on portfolio optimization
• Strong U.S. Midcontinent refining margins
• Continuing improvements in optimization and clean product yield
• Completion of Wood River CORE project
• Ongoing focus on safety and improvements in environmental performance
27
90414conD2R1.indd 27 2/22/12 7:31 PM

Focused operations, capital discipline, and improved refining and marketing margins enabled ConocoPhillips’ Refining and Marketing (R&M) organization to produce strong financial results during 2011.
“An improved market environment,
coupled with significant efforts by our
employees, enabled R&M to provide
increased returns to the company this
year,” said Willie Chiang, senior
vice president, Refining, Marketing,
Transportation & Commercial. “We
continued executing our strategy of
driving operational excellence through
safe, reliable operations. In addition, the
company moved forward with its
strategic plan to create differentiated
value for our shareholders via portfolio
optimization.”
Delivering Enhanced ReturnsR&M continued executing projects
designed to reduce feedstock costs and
increase clean product yield, enabling
the business to realize enhanced margins
and improved return on capital employed.
In 2011, the coker and refinery expansion
(CORE) project at the ConocoPhillips-
operated Wood River Refinery in Illinois
was completed. This gross capital
investment of $3.8 billion is expected to
increase heavy crude oil gross processing
capacity by 90,000-110,000 barrels per
day (BD) while delivering a 5 percent
improvement in clean product yield and
increasing gasoline and distillate gross
production capacity by 50,000 BD.
ConocoPhillips holds a 50 percent interest
in the refinery.
R&M benefited from improvements in
U.S. refining margins, particularly in the
Midcontinent Region. The geographical
diversity and efficiency of our operations,
combined with the adaptability of our
Commercial group, enabled the
organization to access and process
additional advantaged crudes. Our U.S.
refineries with the capability to process
additional West Texas Intermediate-priced
(WTI) crude oil benefited significantly
from this market environment.
“We continually evaluate and execute
projects designed to improve operating
efficiency and capabilities,” Chiang said.
“These projects, along with the
geographic diversity of our portfolio and
the expertise of our people, have enabled
R&M to deliver enhanced returns for our
shareholders.”
Optimizing the Asset BaseWe continue to optimize our asset base
to deliver value across all market cycles.
In 2011, we sold the Wilhelmshaven
Refinery in Germany and idled, and intend
to sell or permanently close in 2012, the
Trainer Refinery in Pennsylvania. These
actions are consistent with our strategy
of enhancing returns through divesting
low-returning assets and resulted in a
reduction of our global crude oil refining
capacity from 2.7 million BD as of Dec. 31,
2010, to 2.2 million BD as of Dec. 31, 2011.
In addition, we also made selective
dispositions of nonstrategic transportation
assets, including our interests in Seaway
Products Pipeline Company, Seaway
Crude Pipeline Company and Colonial
Pipeline Company.
Excelling at OperationsThroughout 2011, R&M employees
reinforced their ongoing commitment
to operational excellence through
increased focus on efficiency, reliability
and safe work practices. In 2011, R&M
delivered a sixth successive year of
improved clean product yield. In addition,
we delivered another strong year of
reliability and safety performance with a
92 percent worldwide refinery capacity
utilization rate and a total recordable
incident rate of 0.30.
Refining and Marketing
Willie ChiangSenior Vice President, Refining, Marketing, Transportation & Commercial
“ We continued executing our strategy of driving operational excellence through safe, reliable operations.”
Worldwide Clean Product Yield (Percent)
2011
14
2009
7
2010
10
2631
20112009 2010
25
2011
66
2009
50
2010
551
2
3
0
10
20
30
40
50
60
70
80
0
5
10
15
20
25
30
35
40
0
5
10
15
20
2011
23
2009
17
2010
204
0
5
10
15
20
25
30
2011
2.2
2009
2.7
2010
2.7
8.763.28
20112009 2010
5.92
2011
13
2009
1
2010
5
6
7
0
3
6
9
12
15
2011
12.2
2009
4.9
2010
8.85
0
3
6
9
12
15
0
2
4
6
8
10
0.0
0.5
1.0
1.5
2.0
2.5
3.0
2011
84
2009
82
2010
838
0
20
40
60
80
100
2011
16
2009
8
2010
129
0
5
10
15
20
2011
XX
2009
248
2010
49810
0
200
400
600
800
1000
EPROCE
28
90414conD2R1.indd 28 2/22/12 7:31 PM

New coker operations started up during 2011 at the Wood River Refinery as part of its CORE project.
29
90414conD2R1.indd 29 2/22/12 7:31 PM

Refining and Marketing
Year-end Worldwide Refining Capacity (MMBD)
2011
14
2009
7
2010
10
2631
20112009 2010
25
2011
66
2009
50
2010
551
2
3
0
10
20
30
40
50
60
70
80
0
5
10
15
20
25
30
35
40
0
5
10
15
20
2011
23
2009
17
2010
204
0
5
10
15
20
25
30
2011
2.2
2009
2.7
2010
2.7
8.763.28
20112009 2010
5.92
2011
13
2009
1
2010
5
6
7
0
3
6
9
12
15
2011
12.2
2009
4.9
2010
8.85
0
3
6
9
12
15
0
2
4
6
8
10
0.0
0.5
1.0
1.5
2.0
2.5
3.0
2011
84
2009
82
2010
838
0
20
40
60
80
100
2011
16
2009
8
2010
129
0
5
10
15
20
2011
XX
2009
248
2010
49810
0
200
400
600
800
1000
EPROCE
Return on Capital Employed (Percent)
2011
14
2009
7
2010
10
2631
20112009 2010
25
2011
66
2009
50
2010
551
2
3
0
10
20
30
40
50
60
70
80
0
5
10
15
20
25
30
35
40
0
5
10
15
20
2011
23
2009
17
2010
204
0
5
10
15
20
25
30
2011
2.2
2009
2.7
2010
2.7
8.763.28
20112009 2010
5.92
2011
13
2009
1
2010
5
6
7
0
3
6
9
12
15
2011
12.2
2009
4.9
2010
8.85
0
3
6
9
12
15
0
2
4
6
8
10
0.0
0.5
1.0
1.5
2.0
2.5
3.0
2011
84
2009
82
2010
838
0
20
40
60
80
100
2011
16
2009
8
2010
129
0
5
10
15
20
2011
XX
2009
248
2010
49810
0
200
400
600
800
1000
EPROCE
Several facilities earned external
recognition for superior safety
performance during the year. Our Refining
and Transportation organizations
celebrated attaining STAR status under
the U.S. Occupational Safety and Health
Administration’s (OSHA) Voluntary
Protection Program (VPP) at our Alliance
and Lake Charles refineries in Louisiana;
the Billings, Mont., refinery; and our
Glenpool, Okla., Renton, Wash., and
Portland, Ore., facilities. In addition, the
Santa Maria facility in California won a
National Petrochemicals and Refining
Association Distinguished Safety Award
Honorable Mention. Additionally, the
Transportation organization has safely
worked two years, or 5 million hours,
without a lost workday, and our Polar
Tankers fleet received ISO 18001
certification from the American Bureau of
Shipping.
“Our refineries operated well in 2011,”
said Larry Ziemba, president, Global
Refining. “Our employees’ commitment
to safe, reliable and efficient operations; a
zero-safety-incident tolerance; and
support of the communities in which we
operate are critical to our long-term
success.”
R&M’s involvement in the communities
around our facilities comes in many
forms. For example, at the Ferndale,
Wash., refinery, ConocoPhillips partnered
with the National Fish and Wildlife
Foundation and the Northwest Straits
Foundation to sponsor the removal of
abandoned fishing nets from the waters
of Puget Sound. The nets pose a hazard
An operator at the Rodeo Refinery in California. In recent years, the refinery has increased its ability to produce low-sulfur clean fuels.
30
90414conD2R1.indd 30 2/22/12 7:31 PM

to birds and marine animals and destroy
marine habitat if not removed. Northwest
Straits has removed more than 3,900
abandoned nets and 2,000 crab pots from
Puget Sound since 2002.
The R&M business continues to operate
in an increasingly challenging regulatory
environment. Renewable fuel mandates
and low-carbon standards present
ongoing challenges to meet government-
established long-term targets. We are
continuing our dialogue with federal, state
and local agencies to make certain we
meet regulatory requirements through
targeted investment and the use of cost-
effective technology. In addition, we are
leveraging our partnerships and advocacy
efforts to allow us to express our views
on vital issues to key audiences.
Leveraging Commercial CapabilitiesOur Commercial organization manages
the company’s worldwide commodity
portfolio. It partners with our Exploration
and Production, R&M and Midstream
businesses by providing expertise in
optimization, while also opportunistically
trading around our assets. In 2011, the
Commercial organization successfully
responded to the opportunities and
challenges posed by the wide spread that
developed between WTI and Brent oil
prices, the Libyan civil unrest, and several
asset dispositions. The organization also
enhanced its global commercial
capabilities and market presence in
several regions, including Canada, Europe,
Latin and South America, and in the global
liquefied natural gas (LNG) business.
In our licensing business, revenues
doubled, compared to 2010, from our
proprietary Optimized Cascade® LNG
technology; there are now eight trains in
various stages of construction that will
utilize this technology. In our E-Gas™
Technology licensing business, we
advanced the POSCO Substitute Natural
Gas project in Gwangyang, Korea.
Positioned to Deliver Value“R&M delivered a strong performance in
2011. We continue to execute our
strategic plan, optimizing our assets and
processes at every level to ensure we are
operating as efficiently and profitably as
possible,” Chiang said. “Our repositioning
in 2012 into an independent downstream
company comprising our R&M,
Midstream and Chemicals businesses
will create a powerful organization
committed to safely and reliably
transforming hydrocarbon resources into
energy while unlocking the full potential
of our downstream organization.”
The Alliance Refinery in Louisiana and Renton Terminal in Washington were two of several R&M facilities to achieve VPP STAR status in 2011 under the OSHA program.
Larry ZiembaPresident, Global Refining
“ Our employees’ commitment to safe, reliable and efficient operations; a zero-safety-incident tolerance; and support of the communities in which we operate are critical to our long-term success.”
31
90414conD2R1.indd 31 2/22/12 7:31 PM
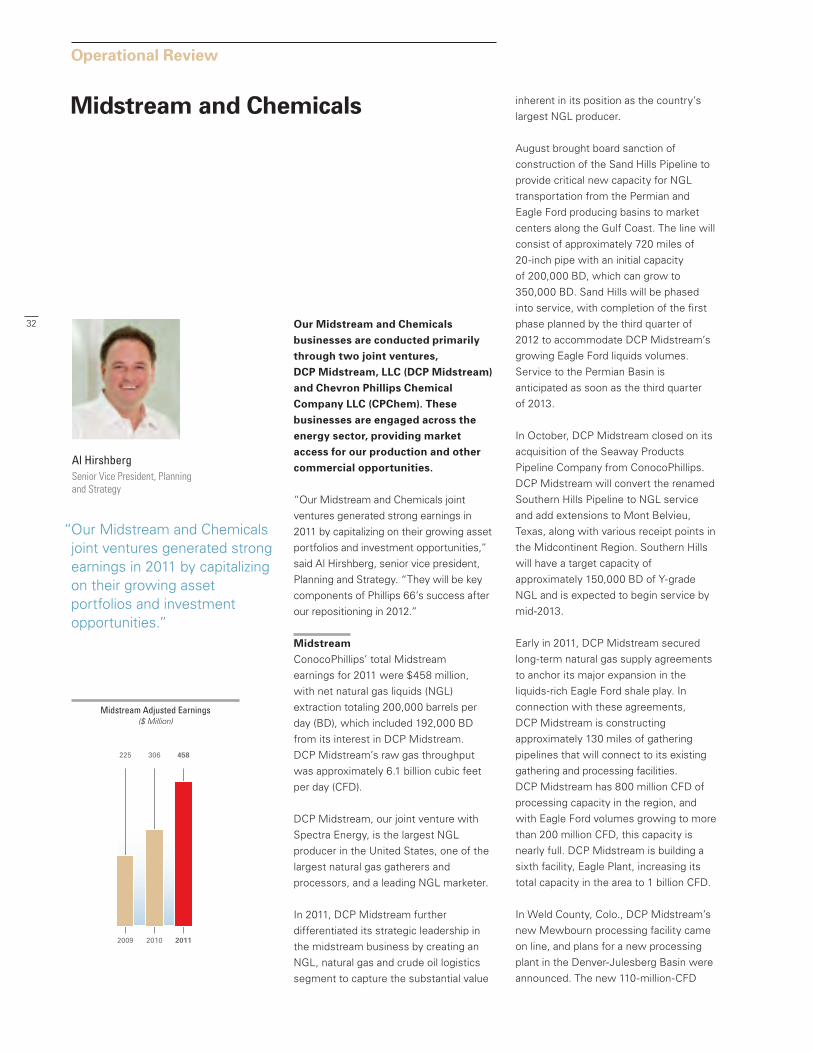
Our Midstream and Chemicals businesses are conducted primarily through two joint ventures, DCP Midstream, LLC (DCP Midstream) and Chevron Phillips Chemical Company LLC (CPChem). These businesses are engaged across the energy sector, providing market access for our production and other commercial opportunities.
“Our Midstream and Chemicals joint
ventures generated strong earnings in
2011 by capitalizing on their growing asset
portfolios and investment opportunities,”
said Al Hirshberg, senior vice president,
Planning and Strategy. “They will be key
components of Phillips 66’s success after
our repositioning in 2012.”
MidstreamConocoPhillips’ total Midstream
earnings for 2011 were $458 million,
with net natural gas liquids (NGL)
extraction totaling 200,000 barrels per
day (BD), which included 192,000 BD
from its interest in DCP Midstream.
DCP Midstream’s raw gas throughput
was approximately 6.1 billion cubic feet
per day (CFD).
DCP Midstream, our joint venture with
Spectra Energy, is the largest NGL
producer in the United States, one of the
largest natural gas gatherers and
processors, and a leading NGL marketer.
In 2011, DCP Midstream further
differentiated its strategic leadership in
the midstream business by creating an
NGL, natural gas and crude oil logistics
segment to capture the substantial value
inherent in its position as the country’s
largest NGL producer.
August brought board sanction of
construction of the Sand Hills Pipeline to
provide critical new capacity for NGL
transportation from the Permian and
Eagle Ford producing basins to market
centers along the Gulf Coast. The line will
consist of approximately 720 miles of
20-inch pipe with an initial capacity
of 200,000 BD, which can grow to
350,000 BD. Sand Hills will be phased
into service, with completion of the first
phase planned by the third quarter of
2012 to accommodate DCP Midstream’s
growing Eagle Ford liquids volumes.
Service to the Permian Basin is
anticipated as soon as the third quarter
of 2013.
In October, DCP Midstream closed on its
acquisition of the Seaway Products
Pipeline Company from ConocoPhillips.
DCP Midstream will convert the renamed
Southern Hills Pipeline to NGL service
and add extensions to Mont Belvieu,
Texas, along with various receipt points in
the Midcontinent Region. Southern Hills
will have a target capacity of
approximately 150,000 BD of Y-grade
NGL and is expected to begin service by
mid-2013.
Early in 2011, DCP Midstream secured
long-term natural gas supply agreements
to anchor its major expansion in the
liquids-rich Eagle Ford shale play. In
connection with these agreements,
DCP Midstream is constructing
approximately 130 miles of gathering
pipelines that will connect to its existing
gathering and processing facilities.
DCP Midstream has 800 million CFD of
processing capacity in the region, and
with Eagle Ford volumes growing to more
than 200 million CFD, this capacity is
nearly full. DCP Midstream is building a
sixth facility, Eagle Plant, increasing its
total capacity in the area to 1 billion CFD.
In Weld County, Colo., DCP Midstream’s
new Mewbourn processing facility came
on line, and plans for a new processing
plant in the Denver-Julesberg Basin were
announced. The new 110-million-CFD
Midstream and Chemicals
Operational Review
Al HirshbergSenior Vice President, Planning and Strategy
“ Our Midstream and Chemicals joint ventures generated strong earnings in 2011 by capitalizing on their growing asset portfolios and investment opportunities.”
Midstream Adjusted Earnings ($ Million)
2011
14
2009
7
2010
10
2631
20112009 2010
39
2011
66
2009
50
2010
551
2
3
0
10
20
30
40
50
60
70
80
0
10
20
30
40
50
0
5
10
15
20
2011
23
2009
17
2010
204
0
5
10
15
20
25
30
2011
2.2
2009
2.7
2010
2.7
8.763.28
20112009 2010
5.92
2011
13
2009
1
2010
5
6
7
0
3
6
9
12
15
2011
12.2
2009
4.9
2010
8.85
0
3
6
9
12
15
0
2
4
6
8
10
0.0
0.5
1.0
1.5
2.0
2.5
3.0
2011
84
2009
82
2010
838
0
20
40
60
80
100
2011
458
2009
225
2010
3069
0
100
200
300
400
500
2011
745
2009
248
2010
49810
0
200
400
600
800
1000
EPROCE
32
90414conD2R1.indd 32 2/22/12 7:31 PM

Through the addition of pipeline and processing capacity, DCP Midstream continued expanding its presence in growing natural gas-producing areas across the United States.
Midstream Financial and Operating Results 2011 2010 2009Earnings ($MM) $ 458 306 313Adjusted earnings ($MM) $ 458 306 225NGL extracted (MBD) 200 193 187DCP Midstream – raw gas throughput (BCFD) 6.1 6.1 6.1
Midstream Highlights
• Earnings increase 50 percent to $458 million
• Significant pipeline expansion plans under way
• Strategically positioning toward full value chain services
33
90414conD2R1.indd 33 2/28/12 10:11 PM

Midstream and Chemicals
Chemicals Financial and Operating Results 2011 2010 2009Earnings ($MM) $ 745 498 248CPChem – plant net capacity (MMLB/Y) 31,280 31,075 28,860
Chemicals Highlights
• Earnings increase 50 percent to $745 million
• Continued execution of U.S. and international growth projects
An S-Chem plant in Saudi Arabia, part of CPChem’s expanding international operations.
34
90414conD2R1.indd 34 2/22/12 7:32 PM

Chemicals Earnings ($ Million)
2011
14
2009
7
2010
10
2631
20112009 2010
39
2011
66
2009
50
2010
551
2
3
0
10
20
30
40
50
60
70
80
0
10
20
30
40
50
0
5
10
15
20
2011
23
2009
17
2010
204
0
5
10
15
20
25
30
2011
2.2
2009
2.7
2010
2.7
8.763.28
20112009 2010
5.92
2011
13
2009
1
2010
5
6
7
0
3
6
9
12
15
2011
12.2
2009
4.9
2010
8.85
0
3
6
9
12
15
0
2
4
6
8
10
0.0
0.5
1.0
1.5
2.0
2.5
3.0
2011
84
2009
82
2010
838
0
20
40
60
80
100
2011
458
2009
225
2010
3069
0
100
200
300
400
500
2011
745
2009
248
2010
49810
0
200
400
600
800
1000
EPROCE
LaSalle processing plant will augment
DCP Midstream’s prominent position in
the basin, in which it currently owns and
operates seven natural gas processing
plants with combined capacity of
400 million CFD.
“We are very proud of our 2011
accomplishments, both from an operating
front and how we are strategically
positioning the company to move toward
a full value chain midstream service
provider,” said Tom O’Connor, chairman,
president and chief executive officer of
DCP Midstream.
Now in its 12th year of operations,
DCP Midstream’s workforce includes
more than 3,000 people managing
approximately 62,000 miles of pipelines,
with interests in 61 processing plants and
12 fractionators.
ConocoPhillips’ Midstream segment also
includes an equity interest in Phoenix Park
Gas Processors Limited in Trinidad and
NGL fractionation plants in New Mexico,
Texas and Kansas.
ChemicalsCPChem, our joint venture with Chevron
Corporation, is one of the world’s
top producers of a wide range of
petrochemicals, with operations worldwide.
CPChem finished 2011 with its best
financial performance since its formation
in 2000, contributing $745 million in
earnings to ConocoPhillips. The company
garnered the top accolade of Company of
the Year in 2011 from ICIS Chemical
Business magazine.
In addition to its outstanding financial
performance, CPChem achieved steady
progress in meeting its long-term growth
objectives.
In December, CPChem announced
completion of several key elements of a
feasibility study announced earlier in 2011
to construct a world-scale ethane cracker
and ethylene derivatives facilities in the
U.S. Gulf Coast Region. The ethylene and
associated derivatives facilities would
leverage the industry’s development of
significant shale gas resources in the
United States. The ethylene unit would be
located at CPChem’s Cedar Bayou facility,
and the location for the other facilities will
be announced in 2012.
In November, CPChem completed the
acquisition of a polyalphaolefins (PAO)
plant located in Beringen, Belgium. The
transaction more than doubles CPChem’s
PAO production capability. PAOs are used
in many synthetic products, such as
lubricants, greases and fluids, and have
emerged as essential components in
numerous industries and applications.
In 2010, CPChem announced plans to
build a 1-hexene plant capable of
producing in excess of 200,000 metric
tons per year. 1-hexene is a critical
component used in the manufacture of
polyethylene, a plastic resin commonly
converted into film, plastic pipe, milk jugs,
detergent bottles, and food and beverage
containers. Project planning has begun,
with approval expected in 2012 and
startup anticipated in 2014.
Saudi Polymers Company (SPCo), a
35-percent-owned joint-venture company
of CPChem, is completing an integrated
petrochemicals complex at Jubail
Industrial City, Saudi Arabia. Construction
was completed in 2011, and the complex
is transitioning to commercial production
in 2012. SPCo will produce ethylene,
propylene, polyethylene, polypropylene,
polystyrene and 1-hexene.
Through its Petrochemical Conversion
Company, a 50/50 joint venture with
Saudi Industrial Investment Group,
CPChem is also building a nylon 6,6
(polyamide 6,6) and converted products
complex with an expected startup in the
fourth quarter of 2013. The complex will
have annual capacities of 50,000 tons of
nylon, 20,000 tons of compounded nylon,
and 90,000 tons of converted products.
“We are extremely proud of our financial
performance and steady growth in 2011,”
said Peter Cella, CPChem president and
chief executive officer. “In 2012, we will
continue exploring growth opportunities
in the United States, the Middle East and
other parts of the world. While we pursue
growth, we keep our focus on operational
excellence, because safe, reliable and
responsible operations are a cornerstone
of our culture, our success and our access
to global growth opportunities.”
Now in its 12th year of operations,
CPChem’s workforce includes
approximately 4,700 people at 38 global
manufacturing facilities in eight countries,
with four research and technical centers
that employ scientists, researchers and
engineers.35
90414conD2R1.indd 35 2/28/12 10:07 PM

Report of Independent Registered Public Accounting Firm on Condensed
Financial Statements
The Board of Directors and Stockholders
ConocoPhillips
We have audited, in accordance with the standards of the Public Company Accounting
Oversight Board (United States), the consolidated balance sheets of ConocoPhillips at
December 31, 2011 and 2010, and the related consolidated statements of income,
comprehensive income, changes in equity, and cash flows for each of the three years in
the period ended December 31, 2011 and in our report dated February 21, 2012 (not
presented separately herein), we expressed an unqualified opinion on those consolidated
financial statements. In our opinion, the information set forth in the accompanying
condensed consolidated financial statements (presented on pages 37 through 40) is fairly
stated in all material respects in relation to the consolidated financial statements from
which it has been derived.
We also have audited, in accordance with the standards of the Public Company
Accounting Oversight Board (United States), the effectiveness of ConocoPhillips’ internal
control over financial reporting as of December 31, 2011, based on criteria established in
Internal Control—Integrated Framework issued by the Committee of Sponsoring
Organizations of the Treadway Commission and our report dated February 21, 2012
(not presented separately herein) expressed an unqualified opinion thereon.
Houston, Texas
February 21, 2012
Financial Summary
37 Consolidated Income Statement
38 Consolidated Statement of Comprehensive Income
39 Consolidated Balance Sheet
40 Consolidated Statement of Cash Flows
41 Selected Financial Data
41 Segment Profile
42 5-Year Operating Review
43 Reserves Summary
44 Non-GAAP Reconciliations
36
90414conD2R1.indd 36 2/22/12 7:32 PM
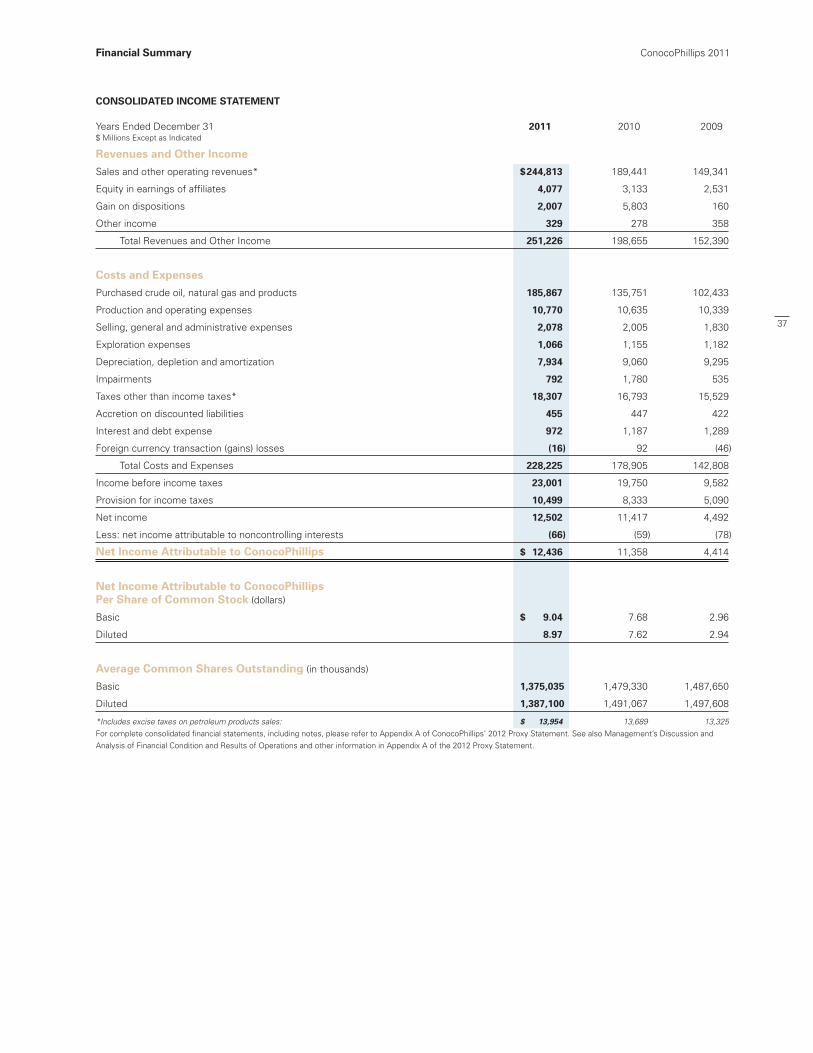
Consolidated inCoMe stateMent
Years Ended December 31 2011 2010 2009$ Millions Except as Indicated
Revenues and other income
Sales and other operating revenues* $ 244,813 189,441 149,341
Equity in earnings of affiliates 4,077 3,133 2,531
Gain on dispositions 2,007 5,803 160
Other income 329 278 358
Total Revenues and Other Income 251,226 198,655 152,390
Costs and expenses
Purchased crude oil, natural gas and products 185,867 135,751 102,433
Production and operating expenses 10,770 10,635 10,339
Selling, general and administrative expenses 2,078 2,005 1,830
Exploration expenses 1,066 1,155 1,182
Depreciation, depletion and amortization 7,934 9,060 9,295
Impairments 792 1,780 535
Taxes other than income taxes* 18,307 16,793 15,529
Accretion on discounted liabilities 455 447 422
Interest and debt expense 972 1,187 1,289
Foreign currency transaction (gains) losses (16) 92 (46)
Total Costs and Expenses 228,225 178,905 142,808
Income before income taxes 23,001 19,750 9,582
Provision for income taxes 10,499 8,333 5,090
Net income 12,502 11,417 4,492
Less: net income attributable to noncontrolling interests (66) (59) (78)
net income attributable to ConocoPhillips $ 12,436 11,358 4,414
net income attributable to ConocoPhillips Per share of Common stock (dollars)
Basic $ 9.04 7.68 2.96
Diluted 8.97 7.62 2.94
average Common shares outstanding (in thousands)
Basic 1,375,035 1,479,330 1,487,650
Diluted 1,387,100 1,491,067 1,497,608
*Includes excise taxes on petroleum products sales: $ 13,954 13,689 13,325 For complete consolidated financial statements, including notes, please refer to Appendix A of ConocoPhillips’ 2012 Proxy Statement. See also Management’s Discussion and
Analysis of Financial Condition and Results of Operations and other information in Appendix A of the 2012 Proxy Statement.
Financial summary ConocoPhillips 2011
37
90414conD2R1.indd 37 2/22/12 7:32 PM

Consolidated statement of Comprehensive inCome
Years Ended December 31 2011 2010 2009$ Millions
net income $ 12,502 11,417 4,492
Other comprehensive income (loss)
Defined benefit plans
Prior service cost (credit) arising during the period 19 (13) —
Reclassification adjustment for amortization of prior
service cost included in net income 2 15 21
Net change 21 2 21
Net actuarial loss arising during the period (1,185) (9) (388)
Reclassification adjustment for amortization of prior
net losses included in net income 226 215 206
Net change (959) 206 (182)
Nonsponsored plans* (50) 5 39
Income taxes on defined benefit plans 375 (67) 52
Defined benefit plans, net of tax (613) 146 (70)
Unrealized holding gain on securities** 8 631 —
Reclassification adjustment for gain included in net income (255) (384) —
Income taxes on unrealized holding gain on securities 89 (89) —
Unrealized gain on securities, net of tax (158) 158 —
Foreign currency translation adjustments (387) 1,417 5,092
Reclassification adjustment for gain included in net income (516) — —
Income taxes on foreign currency translation adjustments (14) (13) (85)
Foreign currency translation adjustments, net of tax (917) 1,404 5,007
Hedging activities 1 — (2)
Income taxes on hedging activities — — 5
Hedging activities, net of tax 1 — 3
other comprehensive income (loss), net of tax (1,687) 1,708 4,940
Comprehensive income 10,815 13,125 9,432
Less: comprehensive income attributable to noncontrolling interests (66) (59) (78)
Comprehensive income attributable to Conocophillips $ 10,749 13,066 9,354
*Plans for which ConocoPhillips is not the primary obligor—primarily those administered by equity affiliates.
**Available-for-sale securities of LUKOIL.
For complete consolidated financial statements, including notes, please refer to Appendix A of ConocoPhillips’ 2012 Proxy Statement. See also Management’s Discussion and
Analysis of Financial Condition and Results of Operations and other information in Appendix A of the 2012 Proxy Statement.
financial summary ConocoPhillips 2011
38
90414conD2R1.indd 38 2/22/12 7:32 PM
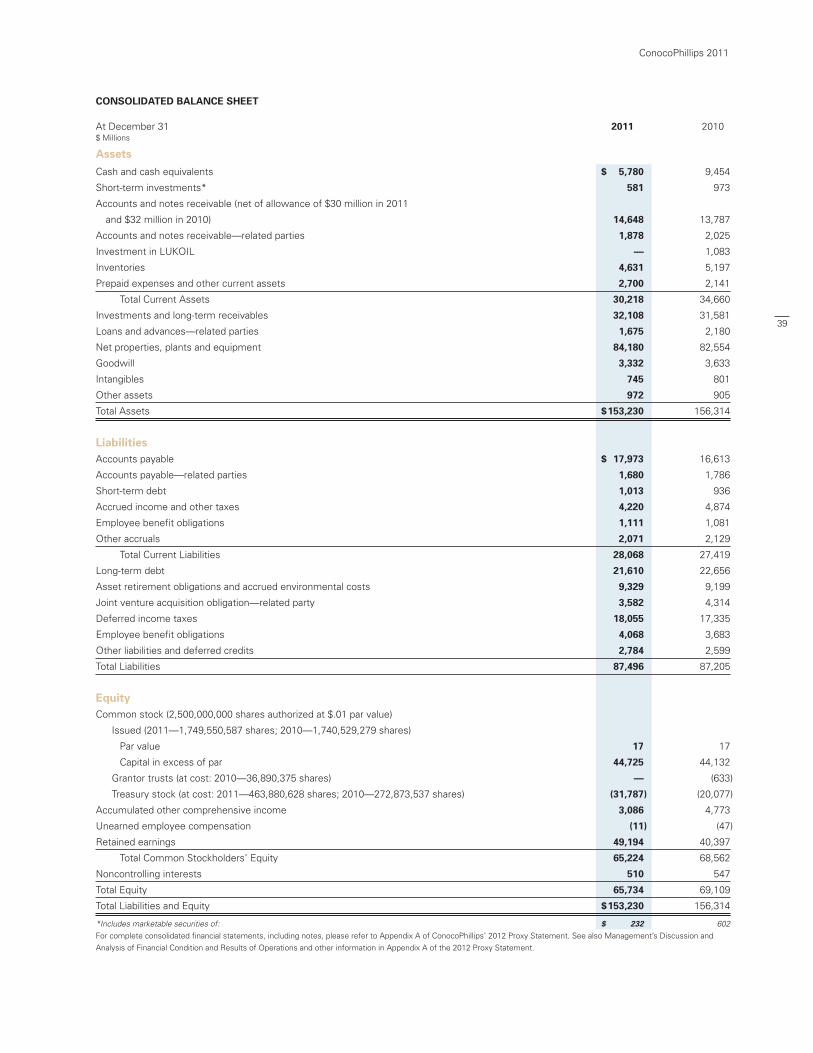
Consolidated balanCe sheet
At December 31 2011 2010$ Millions
assets
Cash and cash equivalents $ 5,780 9,454
Short-term investments* 581 973
Accounts and notes receivable (net of allowance of $30 million in 2011
and $32 million in 2010) 14,648 13,787
Accounts and notes receivable—related parties 1,878 2,025
Investment in LUKOIL — 1,083
Inventories 4,631 5,197
Prepaid expenses and other current assets 2,700 2,141
Total Current Assets 30,218 34,660
Investments and long-term receivables 32,108 31,581
Loans and advances—related parties 1,675 2,180
Net properties, plants and equipment 84,180 82,554
Goodwill 3,332 3,633
Intangibles 745 801
Other assets 972 905
Total Assets $ 153,230 156,314
liabilities
Accounts payable $ 17,973 16,613
Accounts payable—related parties 1,680 1,786
Short-term debt 1,013 936
Accrued income and other taxes 4,220 4,874
Employee benefit obligations 1,111 1,081
Other accruals 2,071 2,129
Total Current Liabilities 28,068 27,419
Long-term debt 21,610 22,656
Asset retirement obligations and accrued environmental costs 9,329 9,199
Joint venture acquisition obligation—related party 3,582 4,314
Deferred income taxes 18,055 17,335
Employee benefit obligations 4,068 3,683
Other liabilities and deferred credits 2,784 2,599
Total Liabilities 87,496 87,205
equity
Common stock (2,500,000,000 shares authorized at $.01 par value)
Issued (2011—1,749,550,587 shares; 2010—1,740,529,279 shares)
Par value 17 17
Capital in excess of par 44,725 44,132
Grantor trusts (at cost: 2010—36,890,375 shares) — (633)
Treasury stock (at cost: 2011—463,880,628 shares; 2010—272,873,537 shares) (31,787) (20,077)
Accumulated other comprehensive income 3,086 4,773
Unearned employee compensation (11) (47)
Retained earnings 49,194 40,397
Total Common Stockholders’ Equity 65,224 68,562
Noncontrolling interests 510 547
Total Equity 65,734 69,109
Total Liabilities and Equity $ 153,230 156,314
*Includes marketable securities of: $ 232 602
For complete consolidated financial statements, including notes, please refer to Appendix A of ConocoPhillips’ 2012 Proxy Statement. See also Management’s Discussion and
Analysis of Financial Condition and Results of Operations and other information in Appendix A of the 2012 Proxy Statement.
ConocoPhillips 2011
39
90414conD2R1.indd 39 2/22/12 7:32 PM
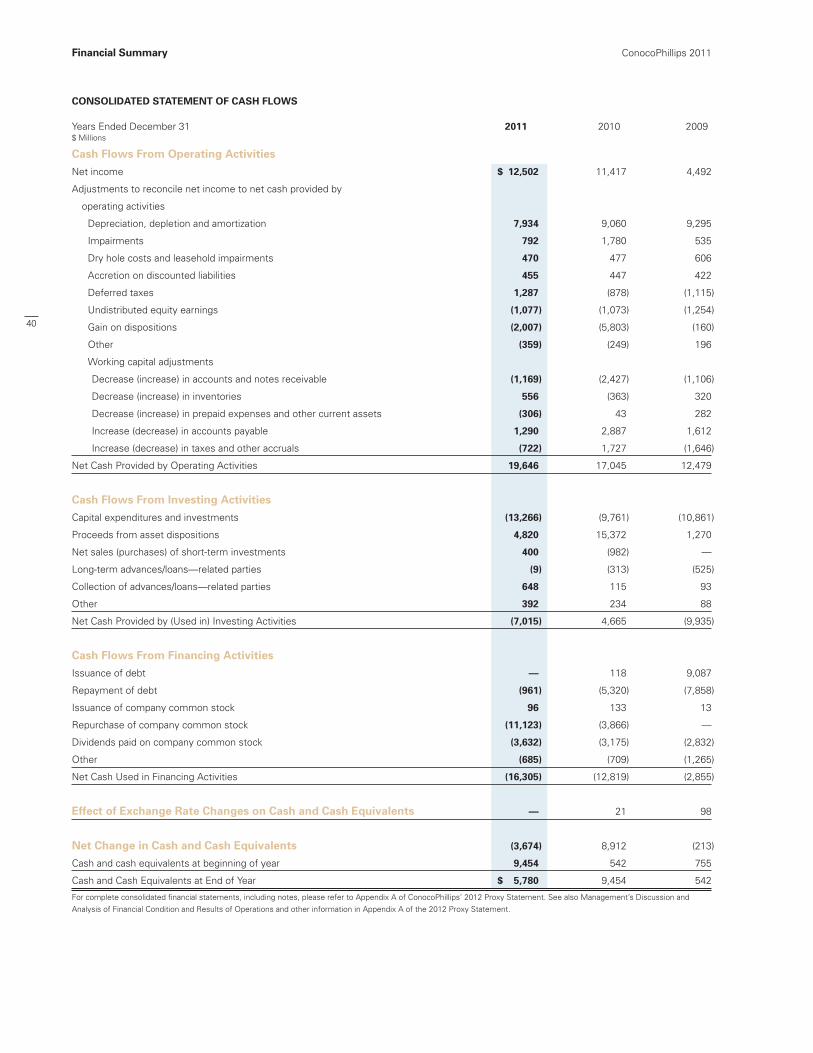
Consolidated statement of Cash flows
Years Ended December 31 2011 2010 2009$ Millions
Cash flows from operating activities
Net income $ 12,502 11,417 4,492
Adjustments to reconcile net income to net cash provided by
operating activities
Depreciation, depletion and amortization 7,934 9,060 9,295
Impairments 792 1,780 535
Dry hole costs and leasehold impairments 470 477 606
Accretion on discounted liabilities 455 447 422
Deferred taxes 1,287 (878) (1,115)
Undistributed equity earnings (1,077) (1,073) (1,254)
Gain on dispositions (2,007) (5,803) (160)
Other (359) (249) 196
Working capital adjustments
Decrease (increase) in accounts and notes receivable (1,169) (2,427) (1,106)
Decrease (increase) in inventories 556 (363) 320
Decrease (increase) in prepaid expenses and other current assets (306) 43 282
Increase (decrease) in accounts payable 1,290 2,887 1,612
Increase (decrease) in taxes and other accruals (722) 1,727 (1,646)
Net Cash Provided by Operating Activities 19,646 17,045 12,479
Cash flows from investing activities
Capital expenditures and investments (13,266) (9,761) (10,861)
Proceeds from asset dispositions 4,820 15,372 1,270
Net sales (purchases) of short-term investments 400 (982) —
Long-term advances/loans—related parties (9) (313) (525)
Collection of advances/loans—related parties 648 115 93
Other 392 234 88
Net Cash Provided by (Used in) Investing Activities (7,015) 4,665 (9,935)
Cash flows from financing activities
Issuance of debt — 118 9,087
Repayment of debt (961) (5,320) (7,858)
Issuance of company common stock 96 133 13
Repurchase of company common stock (11,123) (3,866) —
Dividends paid on company common stock (3,632) (3,175) (2,832)
Other (685) (709) (1,265)
Net Cash Used in Financing Activities (16,305) (12,819) (2,855)
effect of exchange Rate Changes on Cash and Cash equivalents — 21 98
net Change in Cash and Cash equivalents (3,674) 8,912 (213)
Cash and cash equivalents at beginning of year 9,454 542 755
Cash and Cash Equivalents at End of Year $ 5,780 9,454 542
For complete consolidated financial statements, including notes, please refer to Appendix A of ConocoPhillips’ 2012 Proxy Statement. See also Management’s Discussion and
Analysis of Financial Condition and Results of Operations and other information in Appendix A of the 2012 Proxy Statement.
financial summary ConocoPhillips 2011
40
90414conD2R1.indd 40 2/22/12 7:32 PM

segment profile
Net Income (Loss) Sales and Other Attributable to Capital Expenditures Operating Revenues ConocoPhillips and Investments
$ Millions 2011 2010 2009 2011 2010 2009 2011 2010 2009
E&P
United States $ 24,661 23,281 19,638 3,254 2,768 1,503 4,655 2,585 3,474
International 24,792 20,244 17,459 4,988 6,430 2,101 7,350 5,908 5,425
Total E&P 49,453 43,525 37,097 8,242 9,198 3,604 12,005 8,493 8,899
Midstream 8,729 7,307 4,892 458 306 313 17 3 5
R&M
United States 126,194 93,801 73,258 3,595 1,022 (192) 768 790 1,299
International 60,308 44,620 33,975 156 (830) 229 226 266 427
Total R&M 186,502 138,421 107,233 3,751 192 37 994 1,056 1,726
LUKOIL Investment — — — 239 2,503 1,219 — — —
Chemicals 11 11 11 745 498 248 — — —
Emerging Businesses 95 151 86 (26) (59) 3 30 27 97
Corporate and Other 23 26 22 (973) (1,280) (1,010) 220 182 134
Total $244,813 189,441 149,341 12,436 11,358 4,414 13,266 9,761 10,861
selected financial data
$ Millions Except as Indicated 2011 2010 2009 2008 2007
Sales and other operating revenues $244,813 189,441 149,341 240,842 187,437
Net income (loss) 12,502 11,417 4,492 (16,279) 11,545
Net income (loss) attributable to ConocoPhillips 12,436 11,358 4,414 (16,349) 11,458
Per common share (dollars)
Basic 9.04 7.68 2.96 (10.73) 7.06
Diluted 8.97 7.62 2.94 (10.73) 6.96
Total assets 153,230 156,314 152,138 142,865 177,094
Long-term debt 21,610 22,656 26,925 27,085 20,289
Joint venture acquisition obligation—long-term 3,582 4,314 5,009 5,669 6,294
Cash dividends declared per common share (dollars) 2.64 2.15 1.91 1.88 1.64
Market quotations for common stock (dollars)
High 81.80 68.58 57.44 95.96 90.84
Low 58.65 46.63 34.12 41.27 61.59
Year-end close 72.87 68.10 51.07 51.80 88.30
ConocoPhillips 2011
41
90414conD2R1.indd 41 2/22/12 7:32 PM

Financial Summary ConocoPhillips 2011
5-year operating review
e&p 2011 2010 2009 2008 2007Thousands of Barrels Daily (MBD)
Crude oil and natural gas Liquids production
United States 383 390 418 426 461
Canada 38 38 40 44 46
Europe 175 211 241 233 224
Asia Pacific/Middle East 111 140 132 107 106
Africa 40 79 78 80 78
Other areas — — 4 9 10
Total consolidated 747 858 913 899 925
Equity affiliates 52 55 55 24 57
Total E&P 799 913 968 923 982
Synthetic oil production
Consolidated—Canada — 12 23 22 23
Bitumen production
Consolidated—Canada 10 10 7 6 —
Equity affiliates 57 49 43 30 27
Total E&P 67 59 50 36 27
natural gas production*
Millions of Cubic Feet Daily (MMCFD)
United States 1,617 1,777 2,021 2,091 2,292
Canada 928 984 1,062 1,054 1,106
Europe 626 815 876 954 961
Asia Pacific/Middle East 695 712 713 609 579
Africa 158 149 121 114 125
Other areas — — — 14 19
Total consolidated 4,024 4,437 4,793 4,836 5,082
Equity affiliates 492 169 84 11 5
Total E&P 4,516 4,606 4,877 4,847 5,087
* Represents quantities available for sale. Excludes gas equivalent of natural gas liquids
included above.
average Sales prices$ Per Unit
Crude oil and natural gas liquids (per barrel)
Total consolidated $97.12 72.63 55.47 89.35 66.01
Equity affiliates 98.60 74.81 58.23 71.15 48.72
Total E&P 97.22 72.77 55.63 88.91 64.99
Natural gas (per MCF)
Total consolidated 5.64 5.07 4.40 8.20 6.14
Equity affiliates 2.89 2.79 2.35 2.04 .30
Total E&P 5.34 4.98 4.37 8.18 6.13
MidstreamThousands of Barrels Daily (MBD)
natural gas Liquids extracted* 200 193 187 188 211
*Includes our share of equity affiliates.
average Sales prices$ Per Barrel
U.S. natural gas liquids*
Consolidated $57.79 45.42 33.63 56.29 47.93
Equity affiliates 50.64 41.28 29.80 52.08 46.80
* Based on index prices from the Mont Belvieu and Conway market hubs that are weighted by natural gas liquids component and location mix.
42
90414conD2R1.indd 42 2/22/12 7:32 PM

R&M 2011 2010 2009 2008 2007Thousands of Barrels Daily (MBD)
Refinery Operations* United States
Crude oil capacity** 1,939 1,986 1,986 2,008 2,035
Crude oil processed 1,757 1,782 1,731 1,849 1,944
Refinery production 1,932 1,958 1,891 2,035 2,146
International
Crude oil capacity** 426 671 671 670 687
Crude oil processed 409 374 495 567 616
Refinery production 419 383 504 575 633
Petroleum Products Sales
United States
Gasoline 1,129 1,120 1,130 1,128 1,244
Distillates 884 873 858 893 872
Other products 401 400 367 374 432
2,414 2,393 2,355 2,395 2,548
International 714 647 619 645 697
Total company 3,128 3,040 2,974 3,040 3,245
* Includes our share of equity affiliates.
** Weighted-average crude oil capacity for the periods.
U.S. Average Wholesale Prices*$ Per Gallon
Gasoline $2.94 2.24 1.84 2.65 2.27
Distillates 3.12 2.30 1.76 3.06 2.29
*Excludes excise taxes.
LUKOIL Investment*Units Per Day
Crude oil production (MBD) — 284 388 389 400
Natural gas production (MMCFD) — 254 295 330 268
Refinery crude processed (MBD) — 189 240 226 211
*Represents our net share of our estimate of LUKOIL’s production and processing.
ReSeRveS SUMMARy
Millions of Barrels of Oil Equivalent (BOE) 2011 2010 2009 2008 2007
Net Proved ReservesAlaska 1,804 1,762 1,684 1,617 2,040
Lower 48 1,896 1,918 2,012 2,131 2,308
Total United States 3,700 3,680 3,696 3,748 4,348
Canada 1,873 1,764 1,845 1,329 1,282
Europe 870 779 836 936 1,073
Russia 28 78 2,055 1,946 1,894
Asia Pacific/Middle East 1,393 1,468 1,352 1,433 1,347
Africa 406 424 425 448 463
Other areas 117 117 117 135 153
Total company 8,387 8,310 10,326 9,975 10,560
Total consolidated operations 6,750 6,655 7,020 6,800 7,613
Total equity affiliates 1,637 1,655 3,306 3,175 2,947
Total company 8,387 8,310 10,326 9,975 10,560
Includes amounts related to LUKOIL investment: — — 1,967 1,893 1,838
E&P organic reserve replacement ratio (percent) 120 % 138 137 (4) 119
E&P organic reserve replacement ratio, 5-year average (percent) 102 % 5
Natural gas reserves are converted to BOE based on a 6:1 ratio – six thousand cubic feet of natural gas converts to one BOE.
Organic reserve replacement ratio excludes the impact of acquisitions and dispositions.
ConocoPhillips 2011
43
90414conD2R1.indd 43 2/22/12 7:32 PM
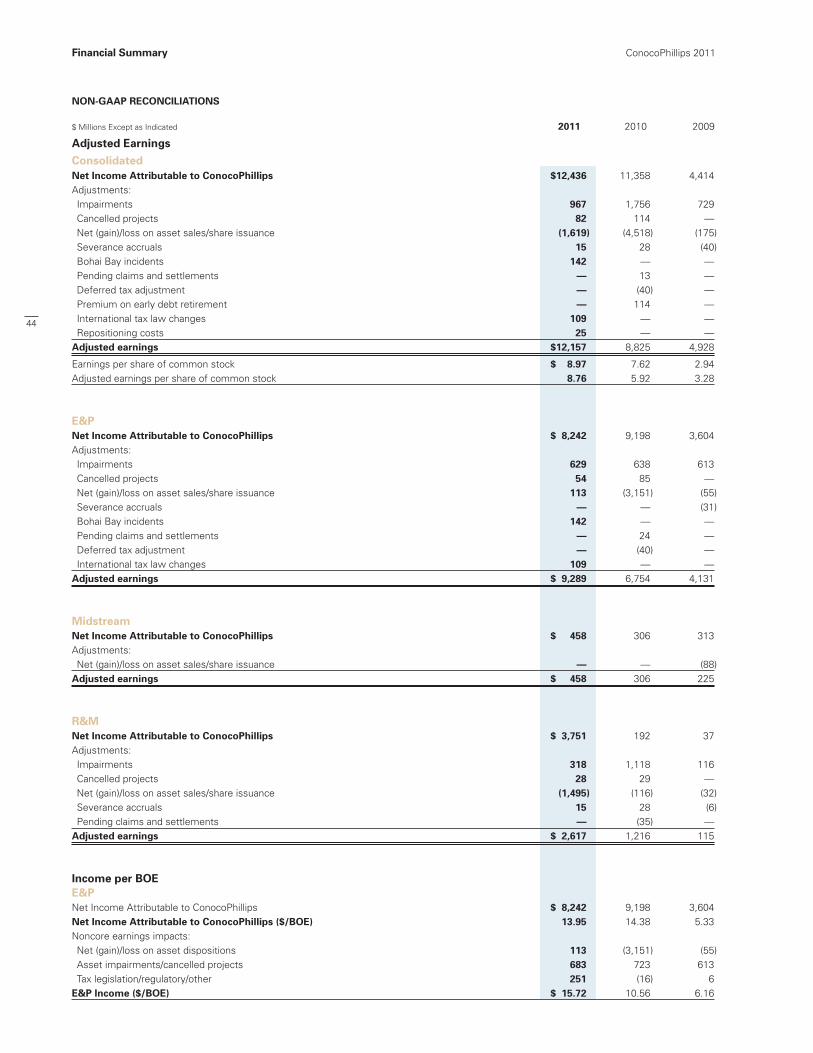
non-gaap REConCILIaTIons
$ Millions Except as Indicated 2011 2010 2009
adjusted Earnings
Consolidatednet Income attributable to Conocophillips $12,436 11,358 4,414Adjustments: Impairments 967 1,756 729 Cancelled projects 82 114 — Net (gain)/loss on asset sales/share issuance (1,619) (4,518) (175) Severance accruals 15 28 (40) Bohai Bay incidents 142 — — Pending claims and settlements — 13 — Deferred tax adjustment — (40) — Premium on early debt retirement — 114 — International tax law changes 109 — — Repositioning costs 25 — —adjusted earnings $12,157 8,825 4,928
Earnings per share of common stock $ 8.97 7.62 2.94Adjusted earnings per share of common stock 8.76 5.92 3.28
E&pnet Income attributable to Conocophillips $ 8,242 9,198 3,604Adjustments: Impairments 629 638 613 Cancelled projects 54 85 — Net (gain)/loss on asset sales/share issuance 113 (3,151) (55) Severance accruals — — (31) Bohai Bay incidents 142 — — Pending claims and settlements — 24 — Deferred tax adjustment — (40) — International tax law changes 109 — —adjusted earnings $ 9,289 6,754 4,131
Midstreamnet Income attributable to Conocophillips $ 458 306 313Adjustments: Net (gain)/loss on asset sales/share issuance — — (88)adjusted earnings $ 458 306 225
R&Mnet Income attributable to Conocophillips $ 3,751 192 37Adjustments: Impairments 318 1,118 116 Cancelled projects 28 29 — Net (gain)/loss on asset sales/share issuance (1,495) (116) (32) Severance accruals 15 28 (6) Pending claims and settlements — (35) —adjusted earnings $ 2,617 1,216 115
Income per BoEE&pNet Income Attributable to ConocoPhillips $ 8,242 9,198 3,604net Income attributable to Conocophillips ($/BoE) 13.95 14.38 5.33Noncore earnings impacts: Net (gain)/loss on asset dispositions 113 (3,151) (55) Asset impairments/cancelled projects 683 723 613 Tax legislation/regulatory/other 251 (16) 6E&p Income ($/BoE) $ 15.72 10.56 6.16
Financial summary ConocoPhillips 2011
44
90414conD2R1.indd 44 2/22/12 7:32 PM
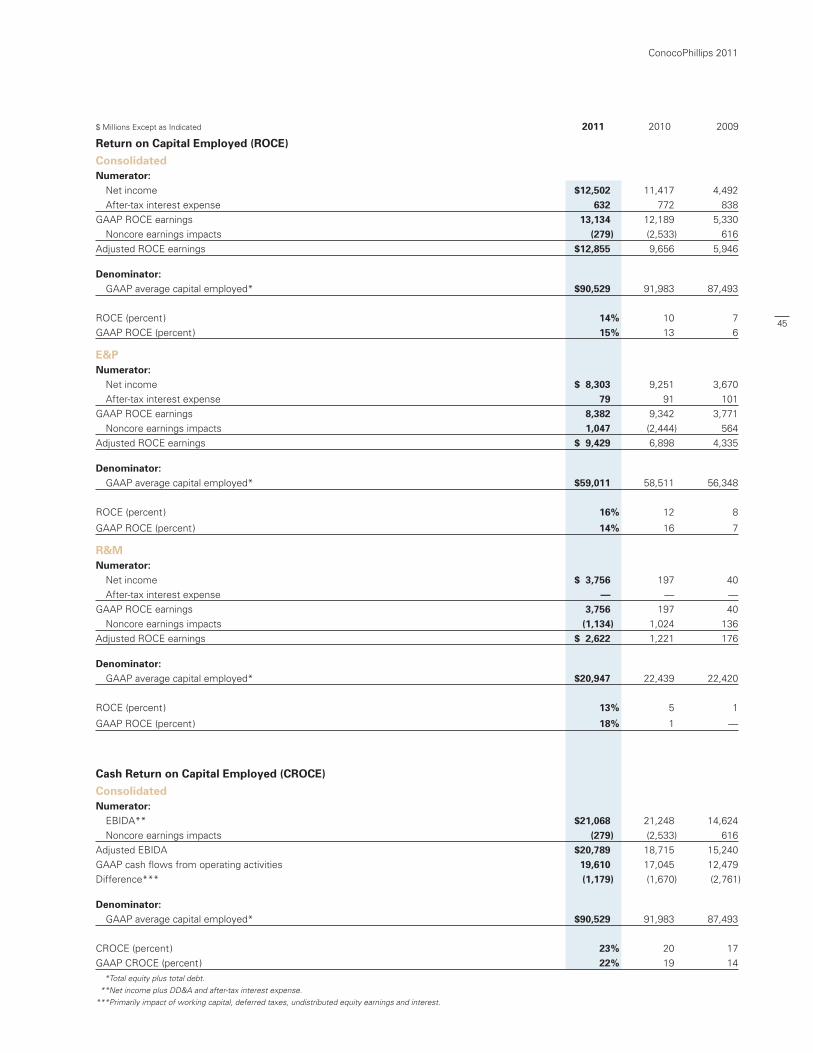
$ Millions Except as Indicated 2011 2010 2009
Return on Capital Employed (ROCE)
ConsolidatedNumerator: Net income $12,502 11,417 4,492
After-tax interest expense 632 772 838
GAAP ROCE earnings 13,134 12,189 5,330
Noncore earnings impacts (279) (2,533) 616
Adjusted ROCE earnings $12,855 9,656 5,946
Denominator: GAAP average capital employed* $90,529 91,983 87,493
ROCE (percent) 14% 10 7
GAAP ROCE (percent) 15% 13 6
E&PNumerator: Net income $ 8,303 9,251 3,670
After-tax interest expense 79 91 101
GAAP ROCE earnings 8,382 9,342 3,771
Noncore earnings impacts 1,047 (2,444) 564
Adjusted ROCE earnings $ 9,429 6,898 4,335
Denominator: GAAP average capital employed* $59,011 58,511 56,348
ROCE (percent) 16% 12 8
GAAP ROCE (percent) 14% 16 7
R&MNumerator: Net income $ 3,756 197 40
After-tax interest expense — — —
GAAP ROCE earnings 3,756 197 40
Noncore earnings impacts (1,134) 1,024 136
Adjusted ROCE earnings $ 2,622 1,221 176
Denominator: GAAP average capital employed* $20,947 22,439 22,420
ROCE (percent) 13% 5 1
GAAP ROCE (percent) 18% 1 —
Cash Return on Capital Employed (CROCE)
ConsolidatedNumerator: EBIDA** $21,068 21,248 14,624
Noncore earnings impacts (279) (2,533) 616
Adjusted EBIDA $20,789 18,715 15,240
GAAP cash flows from operating activities 19,610 17,045 12,479
Difference*** (1,179) (1,670) (2,761)
Denominator: GAAP average capital employed* $90,529 91,983 87,493
CROCE (percent) 23% 20 17
GAAP CROCE (percent) 22% 19 14
* Total equity plus total debt.
** Net income plus DD&A and after-tax interest expense.
***Primarily impact of working capital, deferred taxes, undistributed equity earnings and interest.
ConocoPhillips 2011
45
90414conD2R1.indd 45 2/22/12 7:32 PM
Board of Directors
Standing – Left to right: William E. Wade, Jr., Richard L. Armitage, James E. Copeland, Jr., Robert A. Niblock, Victoria J. Tschinkel, William K. Reilly, Richard H. Auchinleck, Kenneth M. Duberstein, James J. Mulva, Tan Sri Mohd Hassan Marican.Seated – Left to right: Harold W. McGraw III, Ruth R. Harkin, Harald J. Norvik, Kathryn C. Turner.
46
90414conD2R1.indd 46 2/22/12 7:32 PM

Richard L. Armitage, 66, president of
Armitage International LLC since 2005.
U.S. deputy secretary of state from
2001 to 2005. President of Armitage
Associates from 1993 to 2001. Assistant
secretary of defense for international
security affairs from 1983 to 1989.
Recipient of numerous U.S. and foreign
decorations and service awards. Also a
director of ManTech International
Corporation and Transcu, Ltd. Lives in
Vienna, Va. (4)
Richard H. Auchinleck, 60, president
and CEO of Gulf Canada Resources
Limited from 1998 to 2001. Chief
operating officer of Gulf Canada and CEO
for Gulf Indonesia Resources Limited
from 1997 to 1998. Also a director of
Enbridge Income Fund Holdings Inc. and
Telus Corporation. Lives in Victoria, B.C.,
Canada. (2, 4)
James E. Copeland, Jr., 67, CEO of
Deloitte & Touche USA and Deloitte
Touche Tohmatsu from 1999 to 2003.
Served as a senior fellow for corporate
governance with the U.S. Chamber of
Commerce and as a global scholar at the
Robinson School of Business at Georgia
State University. Also a director for Time
Warner Cable Inc. and Equifax. Lives in
Duluth, Ga. (1, 2)
Kenneth M. Duberstein, 67, chairman
and CEO of the Duberstein Group,
a strategic planning and consulting
company, since 1989. Served as White
House chief of staff to U.S. President
Ronald Reagan. Serves as a director of
The Boeing Company; The Travelers
Companies, Inc.; Dell Inc.; and Mack-Cali
Realty Corporation. Also a board member
of the Council on Foreign Relations, the
Brookings Institution and the Kennedy
Center for the Performing Arts. Lives in
Washington, D.C. (5)
Ruth R. Harkin, 67, senior vice president,
international affairs and government
relations for United Technologies
Corporation (UTC) and chair of United
Technologies International, UTC’s
international representation arm, from
1997 to 2005. President and CEO of
Overseas Private Investment Corporation
from 1993 to 1997. Serves on the
advisory board of the National Toll Road,
Dublin, Ireland; the board of regents of
the state of Iowa; and the boards of Tippie
College of Business at the University of
Iowa and Every Child Counts. Lives in
Alexandria, Va. (2, 5)
Tan Sri Mohd Hassan Marican, 59,
former president and CEO of the
Malaysian national oil company,
PETRONAS, from 1995 to 2010.
Previously senior vice president of finance
for PETRONAS from 1989 to 1995 and a
partner in the accounting firm of Hanafiah
Raslan and Mohamed (Touche Ross & Co.)
from 1981 to 1989. Serves as a director of
Sembcorp Industries, Sembcorp Marine
Limited, Lambert Energy Advisory,
Singapore Power and Sarawak Energy.
Lives in Selangor, Malaysia. (1)
Harold W. McGraw III, 63, chairman,
president and CEO of The McGraw-Hill
Companies since 2000. President and
CEO of The McGraw-Hill Companies from
1998 to 2000. Member of The McGraw-
Hill Companies board of directors since
1987. Also a director of United Technologies
Corporation. Lives in Darien, Conn. (3, 4)
James J. Mulva, 65, chairman, president
and CEO of ConocoPhillips. Chairman,
president and CEO of Phillips from 1999
to 2002. President and chief operating
officer of Phillips from 1994 to 1999.
Joined Phillips in 1973; elected to board
in 1994. Served as 2006 chairman of the
American Petroleum Institute. A director
of General Electric and M.D. Anderson
Cancer Center, member of The Business
Council and The Business Roundtable,
and trustee of the Boys and Girls Clubs of
America. Lives in Houston, Texas. (2)
Robert A. Niblock, 49, chairman,
president and CEO of Lowe’s Companies,
Inc. since 2011. Served as Lowe’s
chairman and CEO from 2005 to 2011,
president from 2003 to 2006, and joined
its board of directors when named
chairman and CEO-elect in 2004.
Secretary of the Retail Industry Leaders
Association (RILA) after having served as
chairman in 2008 and 2009. Board
member of the RILA since 2003 and
served as vice chairman in 2006 and
2007. Lives in Lewisville, N.C. (1)
Harald J. Norvik, 65, president and CEO
of Statoil from 1988 to 1999. Chairman of
the board of Telenor ASA and a director of
Petroleum Geo Services ASA. Lives in
Nesodden, Norway. (1)
William K. Reilly, 72, senior advisor to
TPG Capital, an international private
equity investment organization. Also a
director of E.I. du Pont de Nemours &
Company and Royal Caribbean Cruises
Ltd. Lives in San Francisco, Calif. (5)
Victoria J. Tschinkel, 64, director of the
Florida Nature Conservancy from 2003 to
2006. Senior environmental consultant
to law firm Landers & Parsons from 1987
to 2002. Former secretary of the Florida
Department of Environmental Regulation.
Lives in Tallahassee, Fla. (1)
Kathryn C. Turner, 64, founder,
chairperson and CEO of Standard
Technology, Inc., a management and
technology solutions firm with a focus
in the health care sector, since 1985.
Also a director of Carpenter Technology
Corporation and the National Association
of Corporate Directors Capital Area
Chapter. Advisory board member of the
Smithsonian Institute Library. Lives in
Bethesda, Md. (3, 4)
William E. Wade, Jr., 69, former
president of ARCO (Atlantic Richfield
Company). Executive vice president,
worldwide exploration and production,
ARCO, from 1993 to 1998. Also served
as president of ARCO Oil & Gas Company
and president of ARCO Alaska. Served
on the boards of ARCO, Burlington
Resources, Lyondell Chemical Company
and Vastar Resources. Lives in the Florida
Panhandle. (2, 3)
(1) Member of the Audit and Finance Committee.
(2) Member of the Executive Committee.
(3) Member of the Human Resources and Compensation Committee.
(4) Member of the Directors’ Affairs Committee.
(5) Member of the Public Policy Committee.
As of Feb. 21, 2012.
47
90414conD2R1.indd 47 2/22/12 7:32 PM

Company Officers
Management Committee
James J. Mulva, Chairman, President and Chief Executive Officer
Larry E. Archibald, Senior Vice President, Exploration and Business Development
Gene L. Batchelder, Senior Vice President and Chief Administrative Officer
Rand C. Berney, Senior Vice President, Corporate Shared Services
B.M. “Red” Cavaney, Senior Vice President, Government Affairs
Willie C.W. Chiang, Senior Vice President, Refining, Marketing, Transportation & Commercial
Greg C. Garland, Senior Vice President, Exploration & Production – Americas
Al J. Hirshberg, Senior Vice President, Planning and Strategy
Janet Langford Kelly, Senior Vice President, Legal, General Counsel and Corporate Secretary
Ryan M. Lance, Senior Vice President, Exploration & Production – International
Luc J.F. Messier, Senior Vice President, Project Development & Procurement
Jeff W. Sheets, Senior Vice President, Finance, and Chief Financial Officer
Merl R. Lindstrom, Interim Senior Vice President, Technology
Bob A. Herman, Vice President, Health, Safety and Environment
Carin S. Knickel, Vice President, Human Resources
Ann M. Oglesby, Vice President, Communications and Public Affairs
C. Clayton Reasor, Vice President, Corporate and Investor Relations
Larry M. Ziemba, President, Global Refining
Other Corporate Officers
Glenda M. Schwarz, Vice President and Controller
Frances M. Vallejo, Vice President and Treasurer
Ben J. Clayton, General Tax Officer
Keith A. Kliewer, Tax Administration Officer
Kevin J. Mitchell, General Auditor
Operational and Functional Organizations
Exploration and Production
Don G. Hrap, President, Americas
Erec S. Isaacson, President, Qatar
Trond-Erik Johansen, President, Alaska
Kerr A. Johnston, President, Russia and Caspian
Joe P. Marushack, President, Canada
Steinar Vaage, President, Norway
Don E. Wallette, President, Asia Pacific
Paul C. Warwick, President, United Kingdom and Africa
Refining and Marketing
Deborah G. Adams, President, Transportation
Rex W. Bennett, President, Strategy, Integration and Specialty Businesses
Bill L. Bullock, President, Global Gas and Power
Chris W. Conway, President, Global Trading
Andy E. Viens, President, Global Marketing
John W. Wright, President, Global Supply
As of Feb. 21, 2012.
48
90414conD2R1.indd 48 2/22/12 7:32 PM

1 Letter to Shareholders
5 Financial and Operating Highlights
6 Repositioning
Our Commitments
8 Enhancing Financial Performance
10 Empowering Our People
12 Operating Responsibly
14 Advancing Technology
Operational Review
16 Exploration and Production
26 Refining and Marketing
32 Midstream and Chemicals
36 Financial Summary
46 Board of Directors
48 Company Officers
49 Shareholder Information
Certain disclosures in this Summary Annual Report may be considered “forward-looking” statements. These are made pursuant to “safe harbor” provisions of the Private Securities Litigation Reform Act of 1995. The “Cautionary Statement” in Management’s Discussion and Analysis in Appendix A of ConocoPhillips’ 2012 Proxy Statement should be read in conjunction with such statements.
“ConocoPhillips,” “the company,” “we,” “us” and “our” are used interchangeably in this report to refer to the businesses of ConocoPhillips and its consolidated subsidiaries.
Definition of resources: ConocoPhillips uses the term “resources” in this document. The company estimates its total resources based on a system developed by the Society of Petroleum Engineers that classifies recoverable hydrocarbons into six categories based on their status at the time of reporting. Three (proved, probable and possible reserves) are deemed commercial, and three others are deemed noncommercial or contingent. The company’s resource estimate encompasses volumes associated with all six categories.
Shareholder Information
Annual Meeting
ConocoPhillips’ annual meeting of stockholders will be held:
Wednesday, May 9, 2012 Omni Houston Hotel Westside 13210 Katy Freeway, Houston, Texas
Notice of the meeting and proxy materials are being sent to all shareholders.
Direct Stock Purchase and Dividend Reinvestment Plan
ConocoPhillips’ Investor Services Program is a direct stock purchase and dividend reinvestment plan that offers shareholders a convenient way to buy additional shares and reinvest their common stock dividends. Purchases of company stock through direct cash payment are commission-free. Please call the BNY Mellon Shareowner Services Material Fulfillment Center to request an enrollment package:
Toll-free number: 866-353-7849
You may also enroll online at www.bnymellon.com/shareowner/equityaccess. Registered shareholders can access important investor communications online and sign up to receive future shareholder materials electronically by going to www.bnymellon.com/shareowner/equityaccess and following the enrollment instructions.
Principal and Registered Offices
600 N. Dairy Ashford Houston, TX 77079
2711 Centerville Road Wilmington, DE 19808
Stock Transfer Agent and Registrar
Computershare 480 Washington Blvd. Jersey City, NJ 07310-1900 www.bnymellon.com/shareowner/
equityaccess
Information Requests
For information about dividends and certificates, or to request a change of address form, shareholders may contact:
Computershare P.O. Box 358015 Pittsburgh, PA 15252-8015 Toll-free number: 800-356-0066 Outside the U.S.: 201-680-6578 TDD for hearing impaired: 800-231-5469 TDD outside the U.S.: 201-680-6610 www.bnymellon.com/shareowner/
equityaccess
Personnel in the following offices also can answer investors’ questions about the company:
Institutional Investors:
ConocoPhillips Investor Relations 375 Park Avenue, Suite 3702 New York, NY 10152 212-207-1996 [email protected]
Individual Investors:
ConocoPhillips Shareholder Relations 600 N. Dairy Ashford, ML3074 Houston, TX 77079 281-293-6800 [email protected]
Compliance and Ethics
For guidance, or to express concerns or ask questions about compliance and ethics issues, call ConocoPhillips’ Ethics Helpline toll-free: 877-327-2272, available 24 hours a day, seven days a week. The ethics office also may be contacted via email at [email protected], the Internet at http://conocophillips.ethicspoint.com or by writing:
Attn: Corporate Ethics Office ConocoPhillips 600 N. Dairy Ashford, ML3170 Houston, TX 77079
Copies of Form 10-K, Proxy Statement and Summary Annual Report
Copies of the Annual Report on Form 10-K and the Proxy Statement, as filed with the U.S. Securities and Exchange Commission, are available free by making a request on the company’s website, calling 918-661-3700 or writing:
ConocoPhillips – 2011 Form 10-K B-41 Adams Building 411 South Keeler Ave. Bartlesville, OK 74004
Additional copies of this Summary Annual Report may be obtained by calling 918-661-3700 or writing:
ConocoPhillips 2011 Summary Annual Report B-41 Adams Building
411 South Keeler Ave. Bartlesville, OK 74004
Internet Website: www.conocophillips.com
The site includes resources of interest to investors, including news releases and presentations to securities analysts; copies of ConocoPhillips’ annual reports and proxy statements; reports to the U.S. Securities and Exchange Commission; and data on ConocoPhillips’ health, safety and environmental performance. Other websites with information on topics included in this summary annual report include: www.cpchem.com
www.dcpmidstream.com
49
90414conD1R1.indd 2 2/22/12 7:21 PM

Growing Value2011 Summary annual report
www.conocophillips.com
ConocoPhillips is an international, integrated
energy company with interests around the world.
Headquartered in Houston, the company had
operations in more than 35 countries, approximately
29,800 employees, $153 billion of assets and
$245 billion of revenues as of Dec. 31, 2011.
90414conD1R1.indd 1 2/28/12 11:05 PM