Conn's Inc. - Lan Nguyen
12
Conns Inc. - CONN Consumer Discretionary | Specialty Retail Industry Date: February 24, 2015 Recommendation: BUY ↑ Current Price: $25.53 Target Price: $52 Source: MarketWatch Conns Inc. - CONNS Closing Price 25.82 Exchange NASDAQ Market Cap $927.39M Shares Outstanding 36.30M 52-Week Range $14.02 - $51.99 Price/Earnings 13.36 Price/Book 3.72 Price/Sales 1.82 Price/Cash Flow 8.33 Dividend Yield 0 Beta 2.00 Profitability Returns % Return on Equity 17.57 Return on Assets 8.43 Return on Capital 9.86 Return on Invested Capital 10.04 Margins % Gross Margin 50.24 EBITDA Margin 10.44 Operating Margin 13.74 Net Margin 7.83 Rambler Investment Fund Lan Nguyen – Analyst [email protected] EQUITY RESEARCH Source: Yahoo Finance & Google Finance Analyst view: Consumer Discretionary sector performs the best when the economy is strong. Recently, the U.S economy has been bullish, which has improved this sector. The Consumer Discretionary sector is currently finished with recovery from the past recession and is heading toward the expansion stage. Various economic news that have a high-impact on this particular sector are: - Initial Jobless Claims o Previous: 304.00K | Current: 283.00K - Consumer Credit Change o Previous: $13.47B | Current: $14.75B - MBA Mortgage Applications o Previous: -3.2% | Current: 1.3% - Construction Spending (MoM) o Previous: -0.2% | Current: 0.4% Key Points: - The oil price is at a low figure, currently standing at $49.29. In comparison, this is approximately equal to that of 2009. The supply of oil is presently quite elevated, making it one of the main catalysts that drives Consumer Discretionary sector. Due to the low oil price, it promotes excess cash for consumers to purchase other goods. Lower oil prices have also been a great assistance for lower-income households, which also lead to an increase in retail sales. However, a lag is expected. - The consumer optimism plunged in early February due to the concern over employment and wages, as well as concern regarding the U.S economy in general. Nevertheless, according to the statistical data from Reuters and Michigan on Consumer Sentiment Index, the current data still shows a recent higher consumer optimism measurement than any other data since January 2007. - Favorable forecast shows personal consumption expenditures will grow by 3.3% by 2015.
-
Upload
lan-nguyen -
Category
Documents
-
view
57 -
download
3
Transcript of Conn's Inc. - Lan Nguyen

1
Conns Inc. - CONN Consumer Discretionary | Specialty Retail Industry Date: February 24, 2015
Recommendation: BUY ↑ Current Price: $25.53 Target Price: $52
Source: MarketWatch
Conns Inc. - CONNS Closing Price 25.82 Exchange NASDAQ Market Cap $927.39M Shares Outstanding 36.30M 52-Week Range $14.02 - $51.99 Price/Earnings 13.36 Price/Book 3.72 Price/Sales 1.82 Price/Cash Flow 8.33 Dividend Yield 0 Beta 2.00
Profitability Returns % Return on Equity 17.57 Return on Assets 8.43 Return on Capital 9.86 Return on Invested Capital
10.04
Margins % Gross Margin 50.24 EBITDA Margin 10.44 Operating Margin 13.74 Net Margin 7.83
Rambler Investment Fund Lan Nguyen – Analyst [email protected]
EQ
UIT
Y R
ESEA
RC
H
Source: Yahoo Finance & Google Finance
Analyst view:
Consumer Discretionary sector performs the best when the economy is strong. Recently, the U.S economy has been bullish, which has improved this sector. The Consumer Discretionary sector is currently finished with recovery from the past recession and is heading toward the expansion stage. Various economic news that have a high-impact on this particular sector are:
- Initial Jobless Claims o Previous: 304.00K | Current: 283.00K
- Consumer Credit Change o Previous: $13.47B | Current: $14.75B
- MBA Mortgage Applications o Previous: -3.2% | Current: 1.3%
- Construction Spending (MoM) o Previous: -0.2% | Current: 0.4%
Key Points: - The oil price is at a low figure, currently standing at
$49.29. In comparison, this is approximately equal to that of 2009. The supply of oil is presently quite elevated, making it one of the main catalysts that drives Consumer Discretionary sector. Due to the low oil price, it promotes excess cash for consumers to purchase other goods. Lower oil prices have also been a great assistance for lower-income households, which also lead to an increase in retail sales. However, a lag is expected.
- The consumer optimism plunged in early February due to the concern over employment and wages, as well as concern regarding the U.S economy in general. Nevertheless, according to the statistical data from Reuters and Michigan on Consumer Sentiment Index, the current data still shows a recent higher consumer optimism measurement than any other data since January 2007.
- Favorable forecast shows personal consumption expenditures will grow by 3.3% by 2015.

2
- Because of the unusual winter storms transpiring across the Northeast and Midwest, there was a decline in consumers. However, this is expected to recover shortly.
- U.S. GDP has improved sharply since 2006, with an annual rate of 2.6% in the fourth quarter of 2014. Real personal consumption expenditures increased 4.3% in the fourth quarter, compared to an increase of 3.2% in the third.
- U.S. GDP growth slowing down in Q4 is reflected by a reduction in government spending. Nevertheless, there are increased imports, exports, personal consumption expenditures, etc. in this quarter.
- U.S. Initial Jobless Claims fell more than expected—at 317 in January 2015 comparing to 283 as the current rate.
- U.S. Unemployment Rate fell sharply, according to the data on April 2014 (6.7%), compared to 5.7% currently.
- Conn’s Inc. is currently under-performed in comparison to S&P 500, Consumer Staples Select Sector (XLP), Consumer Discretionary Select Sector (XLY) and its competitors. That being said, however, Conn’s Inc. is recovering after its drawdown, bringing the gross profit margin for Conn’s Inc. to stand at 52.43%.
- Specialty Retail Industry in Consumer Discretionary presently stands at +37.47% in one year, which has the highest growth percentage among other industries in the same sector.
- Stifel Financial Corporation upgraded CONN to “Hold → BUY”.

3
Revenue and Earnings Data
Revenue (Millions $)
1Q 2Q 3Q 4Q Total
2014 361,141 251,063 270,689 310,876 1,193(M)
2013 250,344 200,851 207,436 206,401 865,032
2012 226,261 191,982 187,026 186,623 792,302
Earnings Per Share ($)
2014 0.75 0.61 0.52 0.66 2.54
2013 0.51 0.35 0.35 0.35 1.56
2012 0.24 0.14 -0.1 -0.4 -0.12
Source: NASDAQ
CONN Historical Candlestick Chart
Business Description
Conn’s Inc. is a specialty retailer with approximately 3600 full-time employees and 90 retail locations in Arizona, Colorado, Louisiana, Mississippi, Nevada, New Mexico, North Carolina, Oklahoma, South Carolina, Tennessee and Texas. Conn’s Inc. businesses consists of selling furniture and related accessories for the living room, dining room and bedroom, as well as traditional and specialty mattresses; home appliances, including refrigerators, freezers, washers, dryers, dishwashers and ranges; some other variety of consumer electronics, including LCD, LED, 3-D, Ultra HD and plasma televisions, Blu-ray players, home theater and video game products, digital cameras and portable audio equipment; and home office products, including computers, tablets, printers and accessories. Conn’s Inc also offers a variety of products on a seasonal basis. Unlike other competitors, Conn’s Inc. provides flexible in-house credit options for their customers in addition to third-party financing programs and third-party rent-to-own payment plans.

4
Growth Ratio Revenue Net Income
2014 1.19B 93.45M 2013 865.03M 52.61M 2012 792.3M (3.72M) 2011 790.52M (1.01M)
Since 2011, Conn’s Inc. has grown dramatically. According to growth analysis model, a bullish trend in the growth ratio has developed and Conn’s Inc. is expected to grow approximately double its current size.
Revenue from 790.52M to 1.19B Net Income from (1.01M) to 93.45M
Annual Financials for Conn’s Inc
2011 2012 2013 2014
Income Statement
Revenue 790.52M 792.3M 865.03M 1.19B
Operating Income (339,000) (70,000) 153,000 (10,000)
Net Income (1.01M) (3.72M) 52.61M 93.45M
Earnings Per Share (0.04) (0.12) 1.56 2.54
Diluted Average Shares 24.06M 31.86M 33.77M 36.86M
Balance Sheet
Current Assets 493.87M 452.56M 528.24M 735.6M
Non-Current Assets 337.03M 311.42M 360M 544.25M
Total Assets 849.03M 783.3M 912.45M 1.3B
Current Liabilities 112.17M 94.67M 151.16M 142.61M
Total Liabilities 490.98M 429.93M 438M 714.22M
Stockholder’s Equity 358.05M 353.37M 474.45M 589.29M
Cash Flows
Cash From Operations 55.67M 93.77M 125.28M 219.75M
Capital Expenditures (3.03M) (4.39M) (32.35M) (52.13M)
Free Cash Flow 60.03M 60.13M (55.16M) (262.39M)
Increment Revenue Net Income
2013 → 2014 ↑153.97M ↑40.84M 2012 → 2013 ↑72.73M ↑45.17 2011 → 2012 ↑1.78M ↓2.71M
Financial Analysis
Growth Analysis
5
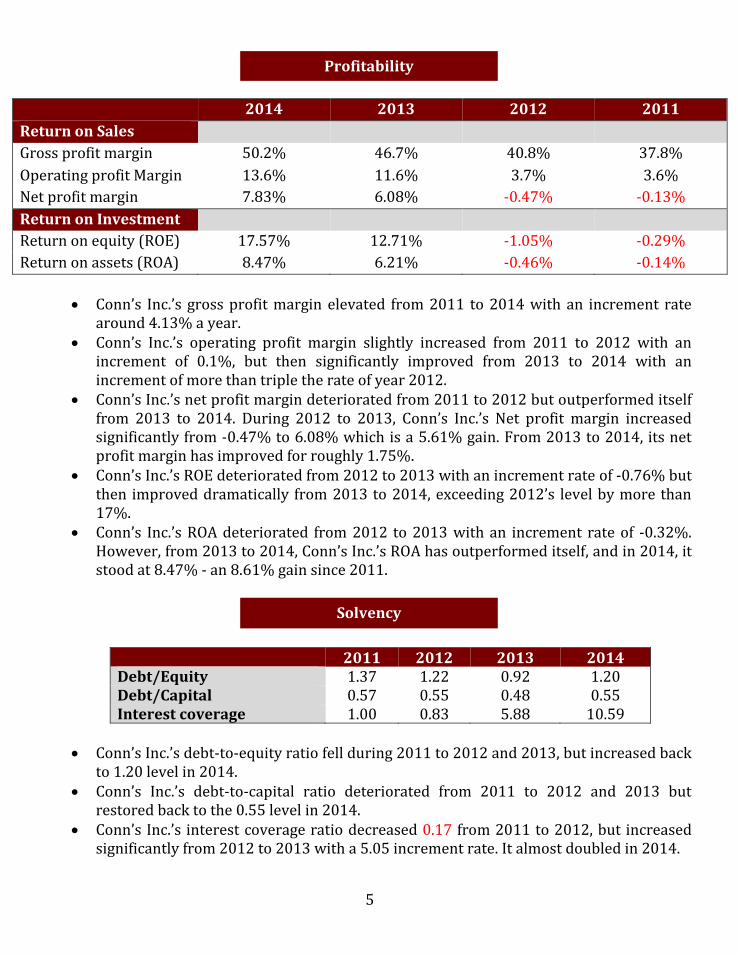
Conn’s Inc.’s gross profit margin elevated from 2011 to 2014 with an increment rate
around 4.13% a year. Conn’s Inc.’s operating profit margin slightly increased from 2011 to 2012 with an
increment of 0.1%, but then significantly improved from 2013 to 2014 with an increment of more than triple the rate of year 2012.
Conn’s Inc.’s net profit margin deteriorated from 2011 to 2012 but outperformed itself from 2013 to 2014. During 2012 to 2013, Conn’s Inc.’s Net profit margin increased significantly from -0.47% to 6.08% which is a 5.61% gain. From 2013 to 2014, its net profit margin has improved for roughly 1.75%.
Conn’s Inc.’s ROE deteriorated from 2012 to 2013 with an increment rate of -0.76% but then improved dramatically from 2013 to 2014, exceeding 2012’s level by more than 17%.
Conn’s Inc.’s ROA deteriorated from 2012 to 2013 with an increment rate of -0.32%. However, from 2013 to 2014, Conn’s Inc.’s ROA has outperformed itself, and in 2014, it stood at 8.47% - an 8.61% gain since 2011.
2011 2012 2013 2014 Debt/Equity 1.37 1.22 0.92 1.20 Debt/Capital 0.57 0.55 0.48 0.55 Interest coverage 1.00 0.83 5.88 10.59
Conn’s Inc.’s debt-to-equity ratio fell during 2011 to 2012 and 2013, but increased back
to 1.20 level in 2014. Conn’s Inc.’s debt-to-capital ratio deteriorated from 2011 to 2012 and 2013 but
restored back to the 0.55 level in 2014. Conn’s Inc.’s interest coverage ratio decreased 0.17 from 2011 to 2012, but increased
significantly from 2012 to 2013 with a 5.05 increment rate. It almost doubled in 2014.
2014 2013 2012 2011
Return on Sales
Gross profit margin 50.2% 46.7% 40.8% 37.8%
Operating profit Margin 13.6% 11.6% 3.7% 3.6%
Net profit margin 7.83% 6.08% -0.47% -0.13%
Return on Investment
Return on equity (ROE) 17.57% 12.71% -1.05% -0.29%
Return on assets (ROA) 8.47% 6.21% -0.46% -0.14%
Profitability
Solvency
6
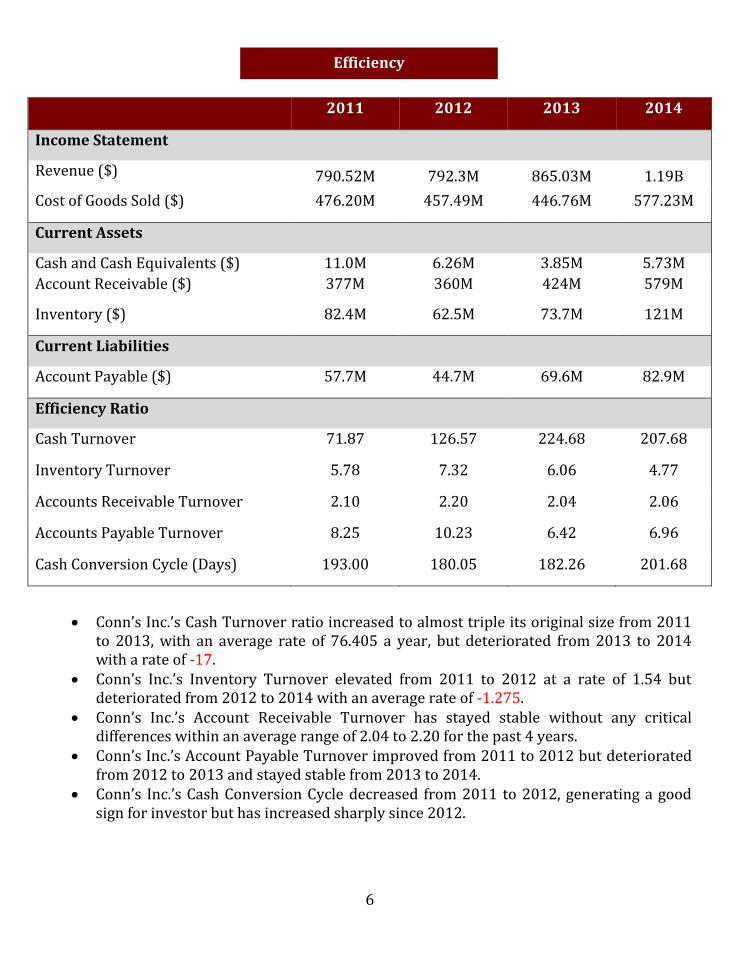
Conn’s Inc.’s Cash Turnover ratio increased to almost triple its original size from 2011
to 2013, with an average rate of 76.405 a year, but deteriorated from 2013 to 2014 with a rate of -17.
Conn’s Inc.’s Inventory Turnover elevated from 2011 to 2012 at a rate of 1.54 but deteriorated from 2012 to 2014 with an average rate of -1.275.
Conn’s Inc.’s Account Receivable Turnover has stayed stable without any critical differences within an average range of 2.04 to 2.20 for the past 4 years.
Conn’s Inc.’s Account Payable Turnover improved from 2011 to 2012 but deteriorated from 2012 to 2013 and stayed stable from 2013 to 2014.
Conn’s Inc.’s Cash Conversion Cycle decreased from 2011 to 2012, generating a good sign for investor but has increased sharply since 2012.
2011 2012 2013 2014
Income Statement
Revenue ($) 790.52M 792.3M 865.03M 1.19B
Cost of Goods Sold ($) 476.20M 457.49M 446.76M 577.23M
Current Assets
Cash and Cash Equivalents ($) 11.0M 6.26M 3.85M 5.73M
Account Receivable ($) 377M 360M 424M 579M
Inventory ($) 82.4M 62.5M 73.7M 121M
Current Liabilities
Account Payable ($) 57.7M 44.7M 69.6M 82.9M
Efficiency Ratio
Cash Turnover 71.87 126.57 224.68 207.68
Inventory Turnover 5.78 7.32 6.06 4.77
Accounts Receivable Turnover 2.10 2.20 2.04 2.06
Accounts Payable Turnover 8.25 10.23 6.42 6.96
Cash Conversion Cycle (Days) 193.00 180.05 182.26 201.68
Efficiency

7
(
According to the U.S. Department of Commerce, consumer electronics sales in 2013 increased approximately 4%, totaling more than $212 billion. During a five years period, consumer electronic sales has not experienced any critical downtrend, therefore, its bullish trend is considerably strong.
According to the U.S. Federal Reserve System, the consumer credit finance industry plays a large role in the U.S. economy. It has increased by 6.5% in 2013, which is approximately equivalent to $3.10 trillion. Since 2010, consumer finance industry has establish a very solid bullish trend.
According to the U.S. Department of Commerce, home appliances sales in 2013 closed at more than $45 billion, which is an approximate increase of 3.5% from its previous year.
Company and Industry Analysis
23%
22%
20%
8%
6%
17%
1%
3%
Sales
Consumer Electronics
Home Appliance
Furniture and Mattress
Home Office
Repair service agreementcommission
Finance charges and other
Service Revenues
Other

8
Strengths Conn’s Inc.’s in-house financing programs offer its customers a financing choice that
other institutions and retail stores may not be able to. When analyzing Conn’s Inc.’s store locations across the U.S., it is evidently proven that
they are using a strategy which acquires sales by providing a more affordable financing program to those located in regions known to be credit constrained.
Conn’s Inc. offers a selection of diversified retail stores in many different regions across the U.S., which stock varied retail products from a multitude of industries, such as consumer electronics, furniture, home office, financing programs, repair services, and others.
Low-prices and bargaining powers are guaranteed to their customers because of the company’s relationship with numerous manufacturing businesses. Since Conn’s Inc. has a large number of its suppliers in electronics and furniture manufacturing, they are not only able to assure they will get the best price available (In order to provide the best price to their customers, as well as to maximize their profits), but also will have a wide range of substitute suppliers, if necessary.
According to the U.S. Department of Commerce, over the past five years, the retail industry has outperformed and is increasing sharply along with the U.S. economy.
Conn’s Inc. has passed Growth, Profitability, Solvency and Efficiency analyses. Weaknesses
Conn’s Inc. is a mid-cap company in a very competitive pool among its peers (Best Buy, Wal-Mart and Sears).
The company failed to meet earnings expectations as well as its solvency ratio. Opportunities
Low oil prices provide an enormous advantage to the retail industry, especially Conn’s Inc.
Conn’s Inc.’s stock price is within a low-fluctuation in 52wk Range. Based on GPSE analysis, Conn’s Inc. has proved to be very profitable and is growing radically.
The U.S. economy is recovering from the economic crisis of 2008 which result in the stimulation for consumers to purchase products in retail stores.
Threats The threat of new company entering the retail businesses is moderate, but the threat of
an online retail store is much more prominent because there are already numerous competitive online retail store that provides an easier way for consumers to shop. Also, the e-commerce industry is growing sharply along with the rise of technology.
Consumer credit’s threat of entry for Conn’s Inc. is comparatively low, since some companies are unable to offer a sufficient fund of their own to provide an in-house financing program. Furthermore, Consumer Credit Company is required to have a reputable character.
According to the U.S Business cycle, the U.S. economy is currently in an expansion stage, and a new recession is coming soon.
SWOT Analysis

9
In comparing Conn’s Inc. to its competitive peers in the retail industry, Conn’s Inc. has
the smallest market cap, but its efficiency is higher than Best Buy and Sears. Conn’s Inc.’s P/E ratio is considered higher than Best Buy, despite the fact that its EPS is undervalued. Furthermore, Conn’s Inc.’s Beta ratio is considered above average among its peer, concluding that there is a great possibility of a higher rate of return.
Peer Comparison
Company Ticker Market Cap P/E P/B EPS EBITDA ROE ROA Beta
Conn’s CONN 994.17M 14.27 1.59 1.92 134.17M 18% 8% 2.32
Best Buy BBY 14.23B 11.60 2.87 3.49 2.15B 13% 4% 3.07 Wal-Mart WMT 264.54B 16.22 3.25 5.05 36.32B 21% 8% 0.29
Sears SHLD 4.07B N/A N/A -15.82 2.33M -61% -7% 2.77
Top 10 Conn’s Shareholders Name Shares
Held % Total Shares
Held Shares Change
% Change Date
1 Stephens Group LLC 4,305,343 11.92 0 0 04/14/2014 2 Luxor Capital Group,
LP 7,586,197 20.90 0 0 12/31/2014
3 Anchorage Advisors, LLC
3,620,657 9.98 3,620,657 New 03/05/2015
4 Greenlight Capital, Inc
3,563,000 9.82 0 0 12/31/2014
5 Morgan Stanley & Co Inc
2,705,081 7.45 -146,924 -5.15 12/31/2014
6 Citadel Advisors LLC 1,792,553 4.94 1,792,553 New 03/03/2015 7 Dimensional Fund
Advisors, Inc. 1,649,802 4.55 -13,288 -0.80 12/31/2014
8 Vanguard Group, Inc. 1,540,723 4.24 17,254 1.13 12/31/2014 9 Villere St Denis J & Co
LLC 1,325,257 3.65 -2,097,786 -61.28 12/31/2014
10 State Street Corp 1,253,184 3.45 649,461 107.58 12/31/2014
Source: Morningstar March 16, 2015
10
Price risk – Conn’s Inc. faces a high degree of risk when dealing with the issue of significant increases in online. In recent years, online retailers have become much more prevalent in society, as the more convenient approach to shopping, not to mention the low prices these retailers also advocate. These online low prices have negatively impacted “brick-and-mortar” retailers, as they are forced to compete with this new-age style of retail. In turn, this is negatively influencing Conn’s Inc., which is forced to decrease their prices, and therefore their margins.
Consumer credit risk – Conn’s Inc. in-house financing program is one of their strength. However, Conn’s Inc. is exposed into a higher risk of consumer credit. Furthermore, Conn’s Inc. revenue mostly comes from sales and financing and if their customers have trouble with their payments, the company’s cash flows will be in greater risk.
Inventory risk – Conn’s Inc. inventory turnover rate has decreased to 4.77 so it put the company into a greater risk as a consumer retail company. Moreover, a lower rate of inventory turnover means that Conn’s Inc. is experiencing difficulty in selling their product, thus the company will have to reduce the price in order to sell their overstock inventory.
Weather risk – Conn’s Inc. is mainly located in the South region of the U.S. which Southern U.S. region is more likely to experience natural disaster than other region of the U.S.
Regulatory risk – Conn’s Inc. is operating in America and it must obey both the local state law and federal regulations. Moreover, the law could hurt Conn’s Inc. because according to the federal consumer protection regulations, a consumer retail company cannot over-charged their customer based on their loans contract.
Foreign currency exchange risk – Conn’s Inc.’s suppliers are mostly international company outside of the U.S. which Conn’s Inc.’s payment to their supplier will be in different foreign currency than U.S Dollars. Currency exchange will negatively impact to the company’s balance sheet because of the process of exchange one currency to another.
Risk Analysis
11
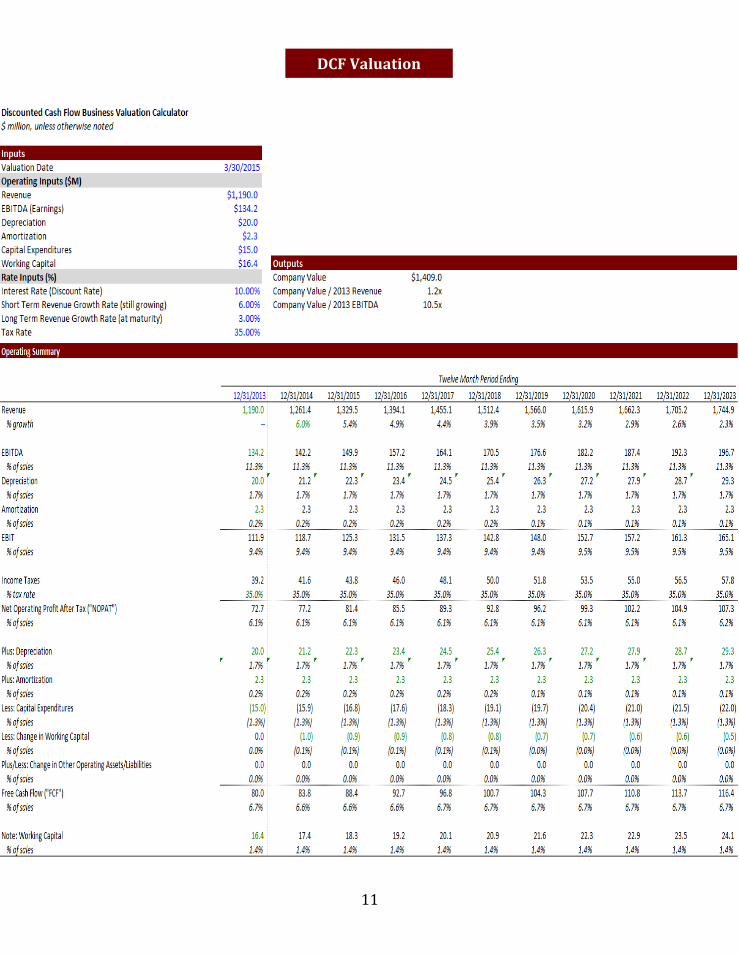
DCF Valuation

12